Targeting Efficiency: How well can we identify the poor? IFMR:CMF Seminar May 5, 2008 Jyoti Prasad Mukhopadhyay Abhijit Banerjee, Esther Duflo, Raghabendra Chattopadhyay and Jeremy Shapiro

Targeting Efficiency: How well can we identify the poor? IFMR:CMF Seminar May 5, 2008 Jyoti Prasad Mukhopadhyay Abhijit Banerjee, Esther Duflo, Raghabendra.
Jan 15, 2016
Welcome message from author
This document is posted to help you gain knowledge. Please leave a comment to let me know what you think about it! Share it to your friends and learn new things together.
Transcript

Targeting Efficiency: How well can we identify the
poor? IFMR:CMF Seminar
May 5, 2008
Jyoti Prasad MukhopadhyayAbhijit Banerjee, Esther Duflo, Raghabendra Chattopadhyay
and Jeremy Shapiro
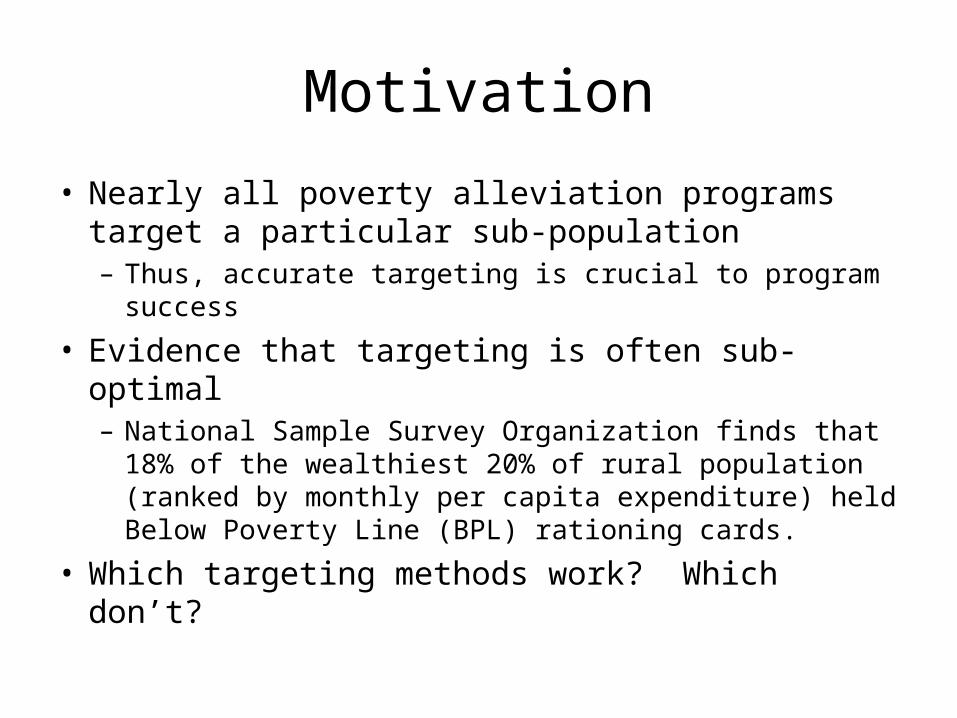
Motivation
• Nearly all poverty alleviation programs target a particular sub-population– Thus, accurate targeting is crucial to program success
• Evidence that targeting is often sub-optimal– National Sample Survey Organization finds that 18%
of the wealthiest 20% of rural population (ranked by monthly per capita expenditure) held Below Poverty Line (BPL) rationing cards.
• Which targeting methods work? Which don’t?
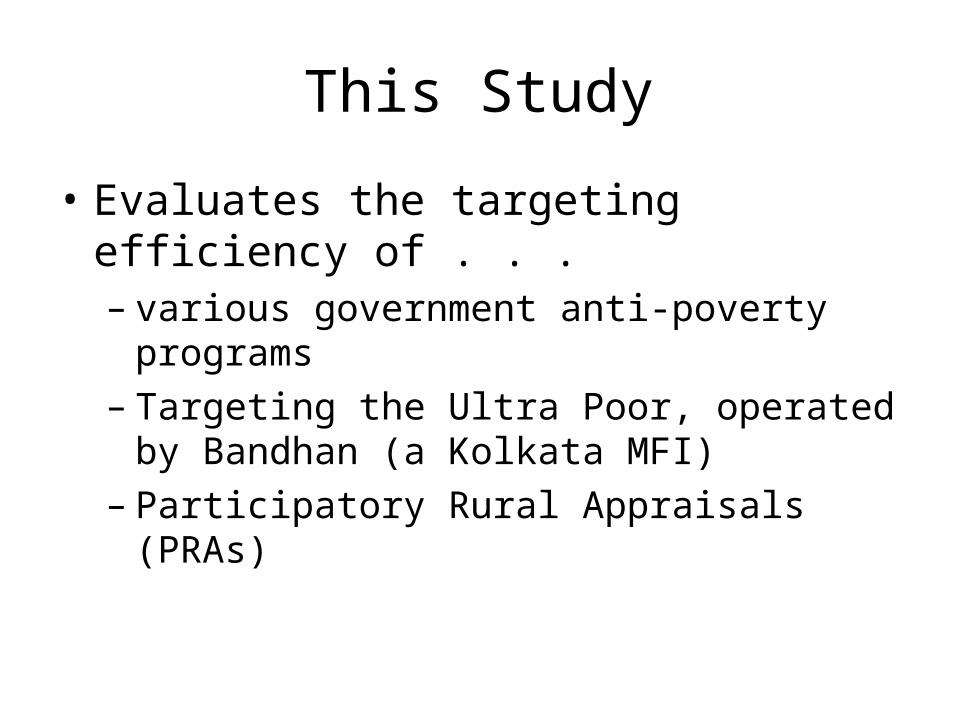
This Study
• Evaluates the targeting efficiency of . . . – various government anti-poverty programs– Targeting the Ultra Poor, operated by
Bandhan (a Kolkata MFI) – Participatory Rural Appraisals (PRAs)

Preview of Results
• Government targeting– Does not identify the poorest of the poor
• In our sample, eligible households appear no worse off than ineligible households
• Bandhan’s targeting– Identifies a group which is disadvantaged in some
respects• Own less land and fewer assets; lack credit access• Per capita expenditure does not appear lower
• PRA– Generates wealth ranking of participants which
accords with various measures of poverty

Overview of Bandhan’s Program
• Name of the program: Targeting Hard-core Poor (THP)• Background: Benefits of microfinance do not accrue to the poorest of the
poor (Morduch 1999, Rabbani et al 2006). Microfinance Institutions (MFIs) are in general reluctant to lend to the poor.
Reasons: ultra-poor households tend to use loan for meeting consumption needs Productive investment of loan is unlikely Ultra-poor households are extremely vulnerable to shocks and hence more
prone to default
Murdoch (1999) aptly commented, “poorer households should be served by other interventions than credit.”
• Objective of the program: To provide income generating assets: livestock, inventory etc. as grant to help ultra poor households secure a regular source of income. Also imparting training and other assistance required for starting a small scale enterprise so as to graduate them to potential microfinance clients.

• Area of intervention: Murshidabad district, West Bengal• Why Murshidabad district?This is one of the poorest districts of West Bengal.district level statistics:HDI Ranking (2004) -15 (out of 17 districts)• Targeted no. of beneficiaries: 300• To date, the identification process has occurred
in 60 villages, with an average of 15 households identified as Ultra Poor in each village and 300 beneficiaries have received assets so far.
Overview of Bandhan’s Program
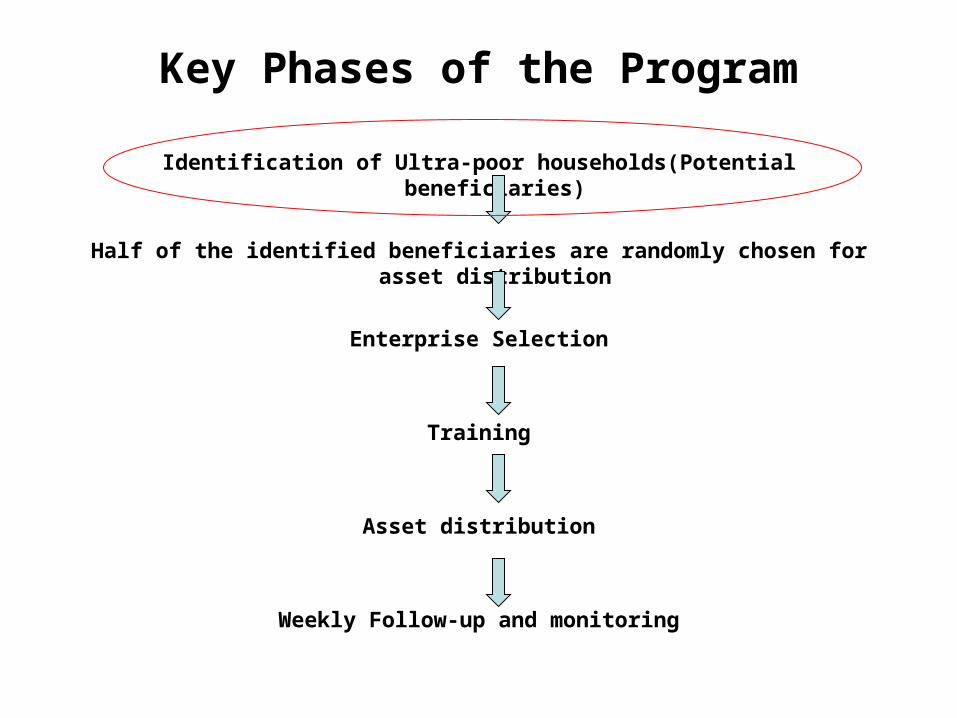
Identification of Ultra-poor households(Potential beneficiaries)
Half of the identified beneficiaries are randomly chosen for asset distribution
Enterprise Selection
Training
Asset distribution
Weekly Follow-up and monitoring
Key Phases of the Program

The Identification Process
Identifying the poorest villages and hamlets of the district
Conducting PRAs in the identified hamlets (Social mapping)
Identifying ultra-poor households through wealth-ranking during PRA
First verification of the identified ultra-poor households: household survey
Second verification: by the THP program coordinator
Final selection

What is Wealth Ranking?
Wealth ranking is done after the completion of social mapping in PRA. It is an effective way of classifying households into different categories based on household’s occupation, assets, land holdings and general economic well being. Each household is given a rank in a scale of 1-6 corresponding to each category where lower ranks corresponds to relatively better-off households. Lively discussion among villagers generate the most precise definition of (relative) poverty and facilitate accurate wealth ranking.

The Second and Final Verification• The second and final verification is done by THP program
coordinator. During verification, the program coordinator observes economic condition, educational attainment and nutritional status of the women and children of the households. Some mandatory requirements to be eligible for obtaining grants are as follows: The household must have at least one active woman capable of
undertaking some enterprise the household must not be associated with any MFI (in keeping
with the aim of targeting those who lack credit access) or receive sufficient support through a government aid program
primary source of income should be informal labor or begging land holdings below 20 decimals no ownership of productive assets other than land no able bodied male in the household and having school-aged
children working rather than attending school
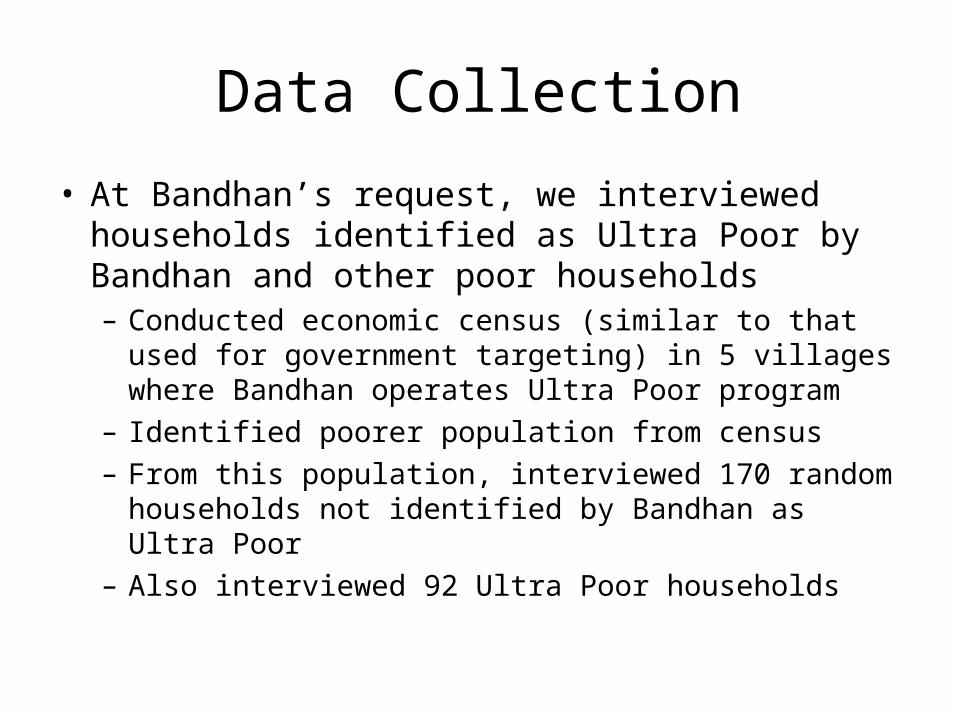
Data Collection
• At Bandhan’s request, we interviewed households identified as Ultra Poor by Bandhan and other poor households– Conducted economic census (similar to that used for
government targeting) in 5 villages where Bandhan operates Ultra Poor program
– Identified poorer population from census– From this population, interviewed 170 random
households not identified by Bandhan as Ultra Poor– Also interviewed 92 Ultra Poor households
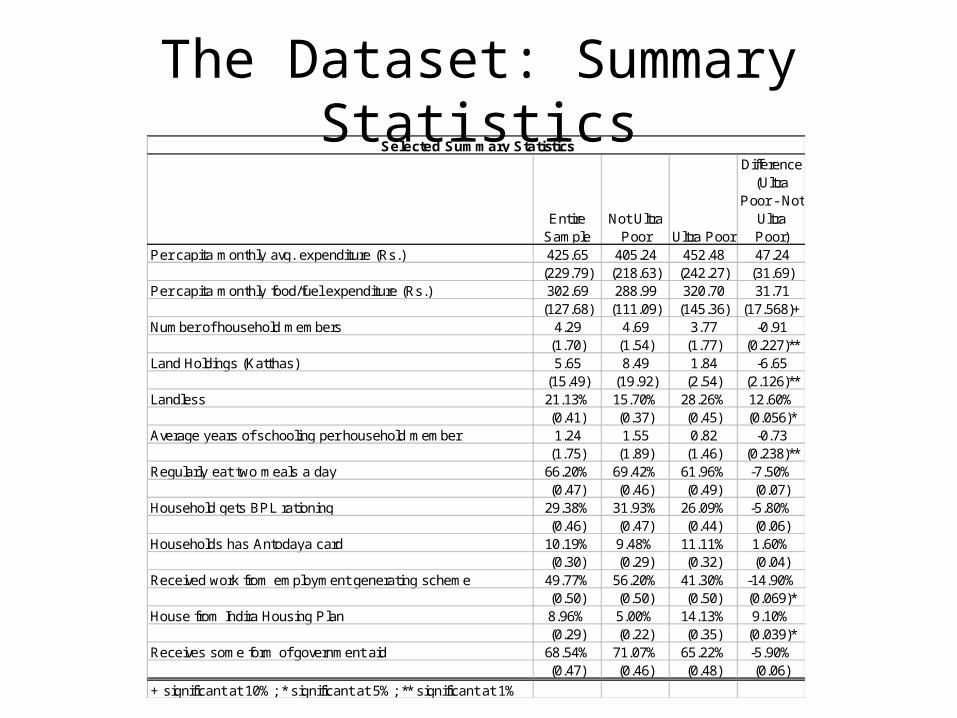
The Dataset: Summary Statistics
Entire Sample
Not Ultra Poor Ultra Poor
Difference (Ultra
Poor - Not Ultra Poor)
Per capita monthly avg. expenditure (Rs.) 425.65 405.24 452.48 47.24(229.79) (218.63) (242.27) (31.69)
Per capita monthly food/fuel expenditure (Rs.) 302.69 288.99 320.70 31.71(127.68) (111.09) (145.36) (17.568)+
Number of household members 4.29 4.69 3.77 -0.91(1.70) (1.54) (1.77) (0.227)**
Land Holdings (Katthas) 5.65 8.49 1.84 -6.65(15.49) (19.92) (2.54) (2.126)**
Landless 21.13% 15.70% 28.26% 12.60%(0.41) (0.37) (0.45) (0.056)*
Average years of schooling per household member 1.24 1.55 0.82 -0.73(1.75) (1.89) (1.46) (0.238)**
Regularly eat two meals a day 66.20% 69.42% 61.96% -7.50%(0.47) (0.46) (0.49) (0.07)
Household gets BPL rationing 29.38% 31.93% 26.09% -5.80%(0.46) (0.47) (0.44) (0.06)
Households has Antodaya card 10.19% 9.48% 11.11% 1.60%(0.30) (0.29) (0.32) (0.04)
Received work from employment generating scheme 49.77% 56.20% 41.30% -14.90%(0.50) (0.50) (0.50) (0.069)*
House from Indira Housing Plan 8.96% 5.00% 14.13% 9.10%(0.29) (0.22) (0.35) (0.039)*
Receives some form of government aid 68.54% 71.07% 65.22% -5.90%(0.47) (0.46) (0.48) (0.06)
+ significant at 10%; * significant at 5%; ** significant at 1%
Selected Summary Statistics

Targeting Efficiency of Government Programs
• Targeting for many government programs is based on BPL census– Concern that census incorrectly classifies households (Jalan
and Murgai, 2007)– Speculation that lists of BPL households are manipulated to
include non-poor households (Mukherjee, 2005)
• To assess these concerns, we compare recipient and non-recipient households– For various programs: BPL and Antodaya rationing, Indira
housing and employment generating schemes – Compare according to: expenditure measures, land holdings,
whether members eat two meals a day, access to credit and an index of asset holdings

Government Targeting Results
Per capita monthly avg. expenditure
Per capita monthly food/fuel expenditure
Land Holdings (Katthas)
Regularly eat two meals a day
Household has outstanding loan
Household has outstanding loan from formal source
Principal component analysis for durable goods and livestock
Household gets BPL rationing -4.433 10.389 -2.543 -0.038 -0.001 0.008 -0.12(35.44) (19.20) (2.35) (0.07) (0.08) (0.04) (0.17)
Observations 211 211 206 211 211 211 211R-squared 0.03 0.08 0.08 0.04 0.01 0.1 0.02
Households has Antodaya card -18.124 6.611 -1.837 0.166 -0.154 -0.022 0.147(50.52) (28.74) (3.59) (0.11) (0.12) (0.06) (0.26)
Observations 206 206 201 206 206 206 206R-squared 0.05 0.09 0.07 0.05 0.02 0.09 0.02
House from Indira Housing Plan -40.93 31.519 -0.786 0.113 0.188 0.071 -0.149(55.77) (30.18) (3.79) (0.11) (0.12) (0.06) (0.28)
Observations 212 212 207 212 212 212 212R-squared 0.04 0.09 0.08 0.04 0.02 0.09 0.02
Received work from emp. generating scheme -34.538 -28.531 -4.691 0 0.08 0.008 0.198(39.20) (21.19) (2.609)+ (0.08) (0.09) (0.05) (0.19)
Observations 213 213 208 213 213 213 213R-squared 0.04 0.09 0.09 0.04 0.01 0.09 0.03
Regressions include village dummiesStandard errors in parentheses+ significant at 10%; * significant at 5%; ** significant at 1%

Overview of Bandhan’s Targeting the Ultra Poor Program
• Identification– To identify the Ultra Poor, Bandhan . . .
• Conducts PRA’s• Conducts follow up survey among those ranked
most poor (rank 5 or 6) in the PRA• Identified households receive a final verification
visit from the Ultra Poor Project coordinator

PRA Process• Social Mapping
– Location of each household in hamlet demarcated on map– Name of household head recorded on index card
• Wealth Ranking– Residents define what constitutes poverty in their community– Index cards sorted into piles corresponding to socio-economic status
• Sorting of households into ranked piles (richest to poorest) based on participatory discussion by hamlet residents
• Concern that PRA may not generate accurate ranking– May not be sufficient participation (too few people present)– May be that influential hamlet members dominate process
• Could manipulate ranking in the expectation that highest (poorest) ranked households will receive aid
• Our study assesses reliability of ranking

Evaluation of the PRA Process
0.2
.4.6
.81
0 50 100 150 200Kattha
PRA Rank 5 or 6 PRA Rank 1 to 4
CDF: Land Holdings (Katthas)

Evaluation of the PRA Process cont’d
0.2
.4.6
.81
0 500 1000 1500 2000Rs
PRA Rank 5 or 6 PRA Rank 1 to 4
Veritical line indicates 2005 povertly line for rural West Bengal
CDF: Monthly avg. expenditure per capita
0.2
.4.6
.81
0 200 400 600 800 1000Rs
PRA Rank 5 or 6 PRA Rank 1 to 4
CDF: Monthly food and fuel expenditure per capita

Evaluation of the PRA Process cont’d
Per capita monthly avg. expenditure
Per capita monthly food/fuel
expenditure
Land Holdings (Katthas)
Regularly eat two meals a
day
Household has outstanding loan
Household has outstanding loan from formal source
Principal component analysis for durable goods and livestock
PRA Rank of Very Poor or Exceptionally Poor 29.019 9.724 -6.279 -0.171 0.083 -0.115 -0.428(33.44) (18.14) (2.187)** (0.068)* (0.07) (0.039)** (0.163)**
Observations 213 213 208 213 213 213 213R-squared 0.04 0.08 0.11 0.06 0.01 0.13 0.05
Regressions include village dummiesStandard errors in parentheses+ significant at 10%; * significant at 5%; ** significant at 1%

Determinates of PRA Rank • In addition to evaluating whether PRA wealth rankings accord with statistical
measures of poverty, we assess what determines whether households are considered poor by their peers
Per capita monthly avg. expenditure 0.000025 0.000068 0.000039 0.000056 0.000043 0.000063 0.000044 0.000035(0.000154) (0.000153) (0.000150) (0.000149) (0.000151) (0.000146) (0.000151) (0.000149)
Land Holdings (Katthas) -0.01 -0.01 -0.01 0.00 -0.01 -0.01 -0.01 -0.01(0.002211)* (0.002207)* (0.002195)* (0.002319)+ (0.002226)* (0.002133)** (0.002203)* (0.002167)**
Number of household members -0.04 -0.04 -0.05 -0.03 -0.04 -0.01 -0.04 -0.04(0.021828)+ (0.021383)+ (0.022048)* (0.02) (0.021618)+ (0.02) (0.021664)+ (0.021059)+
Adult(15+) female with disability(physical or mental) 0.37(0.142321)**
Able bodied female adult (15+) -0.10(0.17)
Able bodied male adult (15+) -0.30(0.078528)**
Receives some form of government aid 0.04(0.08)
Average years of schooling per household member -0.05(0.019539)*
There is a HH member 5-14 years old not in school 0.16(0.080472)*
Household suffered economic shock -0.06(0.07)
Suffered health shock requiring institutional care 0.05(0.08)
Observations 208 208 208 208 208 208 208 208R-squared 0.17 0.17 0.19 0.19 0.17 0.23 0.17 0.2
Regressions include village dummiesStandard errors in parentheses+ significant at 10%; * significant at 5%; ** significant at 1%
Dependent variable: PRA Rank of 5 or 6

Evaluation of Bandhan’s Verification Process
• Generally, PRA and Bandhan’s process identify similar sub-populations– Those ranked poor in PRA and those identified as
Ultra Poor by Bandhan have less land, fewer assets, less education and lack formal credit access
• What does Bandhan’s verification process add above and beyond the PRA ranking?– How does it further narrow the targeted population?

Evaluation of Bandhan’s Verification Process cont’d
Per capita monthly avg. expenditure
Per capita monthly food/fuel expenditure
Land Holdings (Katthas)
Regularly eat two meals a day
Household has outstanding loan
Household has outstanding loan from formal source
Principal component analysis for durable goods and livestock
Identified as Ultra Poor 59.604 16.721 -3.183 0.007 0.076 0.032 -0.141(54.86) (30.31) (1.176)** (0.12) (0.12) (0.04) (0.25)
Observations 110 110 107 110 110 110 110R-squared 0.08 0.09 0.1 0.07 0.03 0.05 0.05Regressions include village dummiesStandard errors in parentheses+ significant at 10%; * significant at 5%; ** significant at 1%
Sample restricted to households with PRA rank of 5 or 6
Evaluation of Bandhan’s Verification Process cont’d
Per capita monthly avg. expenditure
Per capita monthly food/fuel
expenditure
Land Holdings (Katthas)
Regularly eat two meals a
day
Household has outstanding loan
Household has outstanding loan from formal source
Principal component analysis for durable goods and livestock
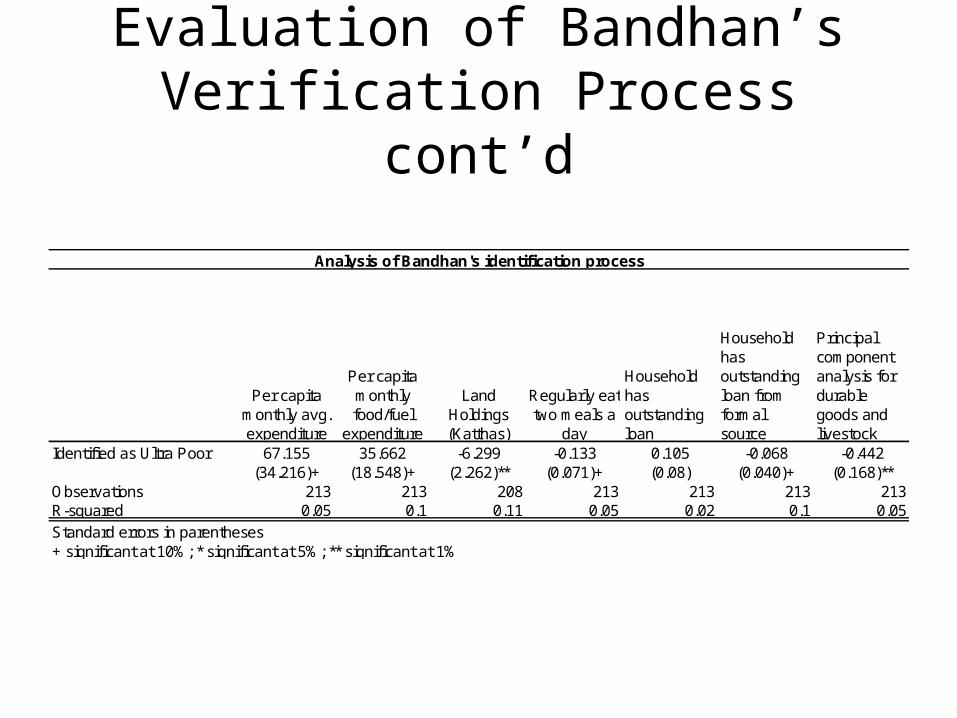
Identified as Ultra Poor 67.155 35.662 -6.299 -0.133 0.105 -0.068 -0.442(34.216)+ (18.548)+ (2.262)** (0.071)+ (0.08) (0.040)+ (0.168)**
Observations 213 213 208 213 213 213 213R-squared 0.05 0.1 0.11 0.05 0.02 0.1 0.05
Standard errors in parentheses+ significant at 10%; * significant at 5%; ** significant at 1%
Analysis of Bandhan's identification process

Expenditure Puzzle
Per capita monthly avg. expenditure
Per capita monthly food/fuel expenditure
Per capita monthly non-food expenditure
Per Capita monthly avg. expenditure minus institutional medical expenditure
Identified as Ultra Poor 79.334 37.638 41.696 56.075(33.092)* (19.565)+ (23.963)+ (31.456)+
Observations 192 192 192 192R-squared 0.06 0.08 0.02 0.05
Standard errors in parentheses+ significant at 10%; * significant at 5%; ** significant at 1%
Analysis of identification process: Sample restricted to those with less than 15 katthas of land

Expenditure Puzzle cont’d
Cerials Dairy Oil VegetablesFruit and Nuts
Egg, Fish, Meat
Other food (sipce, sugar, salt, beverage)
Pan, Tobacco, etc.
Fuel and Light
Identified as Ultra Poor 11.551 -2.167 5.643 2.06 1.294 4.16 6.587 1.187 5.068(8.76) (1.47) (4.25) (5.67) (1.07) (3.17) (3.314)* (3.87) (1.775)**
Observations 213 213 213 213 213 213 213 213 213R-squared 0.06 0.02 0.08 0.06 0.02 0.01 0.06 0.02 0.09
Standard errors in parentheses+ significant at 10%; * significant at 5%; ** significant at 1%
Differences in dissaggregated components of expenditurePer capita monthly expenditure on

Expenditure Puzzle cont’d
Per capita monthly avg. expenditure
Per capita monthly food/fuel expenditure
Land Holdings (Katthas)
Regularly eat two meals a day
Household has outstanding loan from formal source
Principal component analysis for durable goods and livestock
Identified as Ultra Poor 35.14 19.116 -5.632 -0.125 -0.053 -0.237(33.30) (18.14) (2.315)* (0.072)+ (0.04) (0.16)
Number of household members -43.799 -22.637 0.851 0.011 0.022 0.281(9.319)** (5.076)** -0.651 -0.02 (0.011)+ (0.044)**
Observations 213 213 208 213 213 213R-squared 0.14 0.18 0.11 0.05 0.12 0.21
Standard errors in parentheses+ significant at 10%; * significant at 5%; ** significant at 1%
Analysis of identification process conditional on household size

Conclusion
• Effective targeting of a particular sub-population depends crucially on the identification mechanism used– Censuses, similar to those used for targeting of
government aid, do not appear to identify the most disadvantaged population
– Peer wealth rankings gathered in PRAs can provide statistically reliable information about which households are most poor
– More detailed household interviews, as used by Bandhan, provide a way to further narrow the identified population and target more precisely
Related Documents


![Parthibo by Shirshendu Mukhopadhyay [Part.1]](https://static.cupdf.com/doc/110x72/547f48eeb4af9fbe158b5a51/parthibo-by-shirshendu-mukhopadhyay-part1.jpg)
