Compressed natural gas direct injection (spark plug fuel injector) 289 X Compressed natural gas direct injection (spark plug fuel injector) Taib Iskandar Mohamad Universiti Kebangsaan Malaysia (National University Malaysia) Malaysia 1. Introduction The increasing concerns over energy security and the emission of pollutant gases have triggered greater efforts towards developing alternatives to conventional fuels for road vehicles. In the presence of these concerns, automotive engine technology is challenged by the increasing divergence between higher power output, better fuel economy and lower pollutant emission requirements (Stan, 2002). Several alternatives to gasoline and diesel fuels have been studied on current internal combustion (IC) engines. These include natural gas (NG), which is predominantly methane, liquefied petroleum gas (LPG), hydrogen, as well as ethanol and methanol. They are used either as supplement or replacement to gasoline in spark ignition (SI) engines. For compression ignition (CI) engines, dual fuel operation with diesel fuel providing pilot ignition source has been successful for heavy-duty applications. CI engines have also benefited from the use of various alternative fuels of vegetable origins as diesel replacement. LPG is a promising alternative fuel mainly due to its relatively high energy density, high octane rating and low pollutant emissions. It can be stored as liquid at moderate pressure, which gives it major advantage over most other alternative fuels. Methanol on the other hand has a very high octane rating but low heating value and stoichiometric air fuel ratio (AFR). Thus it leads to higher volumetric fuel consumption when compared to gasoline. Hydrogen fuel for electrically driven fuel cell cars, seen as the future replacement to IC engine technology, is undergoing relatively slower research and development and is expected to be in large scale production at some distance of time. IC engines is therefore will remain the key power source in the 21 st century until fuel cell vehicles become widespread (Morita, 2003) Natural gas use has various advantages over conventional fuels mainly due to its potential for higher thermal efficiency (due to higher octane value that allows the use of higher compression ratios), and lower CO 2 emission (due to lower carbon-to-hydrogen ratio) (Shiga et. al. 2002). From the supply point of view, natural gas has the advantage of energy diversification and the total reserves have been estimated in the same order as petroleum but with only 60% of its production rate (Vuorenkoski, 2004). According to the statistics by the International Association for Natural Gas Vehicles (IANGV, 2009), there are approximately 11.2 million NGVs in operation worldwide with 13 www.intechopen.com

Welcome message from author
This document is posted to help you gain knowledge. Please leave a comment to let me know what you think about it! Share it to your friends and learn new things together.
Transcript

Compressed natural gas direct injection (spark plug fuel injector) 289
Compressed natural gas direct injection (spark plug fuel injector)
Taib Iskandar Mohamad
X
Compressed natural gas direct injection (spark plug fuel injector)
Taib Iskandar Mohamad
Universiti Kebangsaan Malaysia (National University Malaysia) Malaysia
1. Introduction
The increasing concerns over energy security and the emission of pollutant gases have triggered greater efforts towards developing alternatives to conventional fuels for road vehicles. In the presence of these concerns, automotive engine technology is challenged by the increasing divergence between higher power output, better fuel economy and lower pollutant emission requirements (Stan, 2002). Several alternatives to gasoline and diesel fuels have been studied on current internal combustion (IC) engines. These include natural gas (NG), which is predominantly methane, liquefied petroleum gas (LPG), hydrogen, as well as ethanol and methanol. They are used either as supplement or replacement to gasoline in spark ignition (SI) engines. For compression ignition (CI) engines, dual fuel operation with diesel fuel providing pilot ignition source has been successful for heavy-duty applications. CI engines have also benefited from the use of various alternative fuels of vegetable origins as diesel replacement. LPG is a promising alternative fuel mainly due to its relatively high energy density, high octane rating and low pollutant emissions. It can be stored as liquid at moderate pressure, which gives it major advantage over most other alternative fuels. Methanol on the other hand has a very high octane rating but low heating value and stoichiometric air fuel ratio (AFR). Thus it leads to higher volumetric fuel consumption when compared to gasoline. Hydrogen fuel for electrically driven fuel cell cars, seen as the future replacement to IC engine technology, is undergoing relatively slower research and development and is expected to be in large scale production at some distance of time. IC engines is therefore will remain the key power source in the 21st century until fuel cell vehicles become widespread (Morita, 2003) Natural gas use has various advantages over conventional fuels mainly due to its potential for higher thermal efficiency (due to higher octane value that allows the use of higher compression ratios), and lower CO2 emission (due to lower carbon-to-hydrogen ratio) (Shiga et. al. 2002). From the supply point of view, natural gas has the advantage of energy diversification and the total reserves have been estimated in the same order as petroleum but with only 60% of its production rate (Vuorenkoski, 2004). According to the statistics by the International Association for Natural Gas Vehicles (IANGV, 2009), there are approximately 11.2 million NGVs in operation worldwide with
13
www.intechopen.com

Natural Gas290
long establishment record in Europe, North America and South America. Pakistan, Argentina, Iran and Brazil record the highest numbers of NGV with 2.4, 1.8, 1.7 and 1.6 million respectively. The numbers are increasing with mounting interest from other countries like India (725,000 NGV) and Malaysia (42,617 NGV). Most NGV are fuel converted and dual fuel types. Natural gas is often stored compressed at ambient temperature as compressed natural gas (CNG) in these vehicles but it requires more storage space. NG can also be stored cryogenically at ambient pressure as liquefied natural gas (LNG) in heavy-duty vehicles. For the same energy content, the emission from NG combustion have significantly less harmful combustion products such as CO2 and NOx than gasoline and diesel engines (Bradley, 1996). NGV can be categorized into three types, (1) fuel converted, (2) dual fuel operation and (3) dedicatedly developed engine. Most NGV are of type (1) and (2) while type (3) available mainly for heavy duty vehicles. It is well known that when a port injection gasoline engine is converted to NG, with the fuel injected in the intake manifold, power is reduced and upper speed is limited. These are due to reduction of volumetric efficiency and the relatively lower turbulent flame speed of NG-air combustion (Ishii, 1994). The problems can be mitigated by direct injection which increases volumetric efficiency and improves mixing as a result of turbulence induced by high pressure injection. However, to achieve direct fuel injection, a complicated and costly engine modification is required. The cylinder head needs to be redesigned or retrofitted to accommodate the direct fuel injector.
2. Direct injection concepts
Two main characteristics of direct injection are internal mixture formation and closed valve injection. Mixture formation is vital in direct injection because the available time for air-fuel mixing is relatively short compared to indirect port injection or carburetion.
2.1 Internal mixture formations in direct injection spark ignition engines In spark ignition engines, air and fuel mixing takes place in the cylinder but a premixing process occurs to a certain degrees depending on type of fuel delivery. In a carburetor system, fuel vaporizes and mixes in the air stream prior to entering the combustion chamber. In a port injection system, fuel is injected and the velocity of fuel jet determines atomization and evaporation of fuel in air. In the direct injection method, fuel is directly injected into the combustion chamber as intake valve closes. The turbulence induced by the gas jet and the jet penetration determine the degree of mixing. In general, the mixing process in the direct injection method is restricted to a much shorter time. Furthermore, unlike the carburetion and port injection where mixing starts before air and fuel enter the combustion chamber, the mixing in direct injection mode can only happen in confined cylinder geometry. The concepts of homogenous and stratified mixture formation are very important when discussing the direct injection in spark ignition engines because they form the basis of a better control of fuel mixture than the one experienced with port fuel injection. In addition, charge stratification can increase thermal efficiency and have the potential of reducing pollutant emissions. However, with direct injection operation, the degree of mixing and mixture uniformity is vital for reliable combustion. A combination of direct injection, high squish, high swirl and optimized piston crown shape can produced fast mixing and a high
degree of mixture uniformity, thus turbulent intensity, molecular diffusion and chemical kinetics, which are the main contributors to the establishment and propagation of a turbulent flame (Risi, 1997). Mixture formation in direct injection engines can be classified into homogeneous and stratified charge based on the injection strategies. The concepts of these mixture formations are determined by the engine operation and fuel economy requirements.
2.1.1 Early injection, homogeneous-charge operation The homogeneous mixture operating mode in the direct injection engine is designed to meet the requirement of medium-to-high engine loads. Depending on the overall air-fuel ratio, the mixture can be homogeneous-stoichiometric or homogeneous lean. Early injection makes it possible to achieve a volumetric efficiency that is higher than port fuel injection, and slightly increased compression ratio operation which contributes to better fuel economy. It also benefits from better emission during cold start and transient operation (Zhao, 1999 & 2002).
2.1.2 Late injection, stratified-charge operation This operation is mainly to achieve lean burn and unthrottled operations by injecting fuel late during compression stroke. Fuel stratification is achieved by injection strategy such that the air-fuel ratio around the spark gaps yield stable ignition and flame propagation, whereas areas farther from the point of ignition is leaner or devoid of fuel. The advantage of charge stratification includes significant reduction in pumping work associated with throttling, reduced heat loss, reduced chemical dissociation from lower cycle temperatures and increases specific heat ratio for the cycle, which provide incremental gains in thermal efficiency (Zhao, 2002).
2.2 Potential for direct fuel injection in spark ignition engine Direct injection in spark ignition engines could achieve a number of desirable effects. When direct injection method is applied to gaseous fuel, more achievement in terms of specific power output can be realized due to significant improvement in volumetric efficiency. The advantages of direct injection methods can be summarized as follows (Stan, 2002)
2.2.1 Increased thermal efficiency and lower specific fuel consumption At part load, avoiding fresh charge throttling results in charge stratification and burned gas in distinct zones. This ideal structure consists of stoichiometric mixture cloud with spark contact, enveloped by fresh air and burned gas that form a barrier against chemical reactions near chamber wall thus avoiding intense heat transfer to the wall during combustion. Thermal efficiency is bettered by increasing compression ratio, as well as turbo charging and supercharging. Knock can be avoided in such cases by different effects: mixture formation just before or during ignition; mixture concentration in central zone of combustion chamber; out of crevice; of mixture cooling by fuel vaporization during injection.
www.intechopen.com
Compressed natural gas direct injection (spark plug fuel injector) 291
long establishment record in Europe, North America and South America. Pakistan, Argentina, Iran and Brazil record the highest numbers of NGV with 2.4, 1.8, 1.7 and 1.6 million respectively. The numbers are increasing with mounting interest from other countries like India (725,000 NGV) and Malaysia (42,617 NGV). Most NGV are fuel converted and dual fuel types. Natural gas is often stored compressed at ambient temperature as compressed natural gas (CNG) in these vehicles but it requires more storage space. NG can also be stored cryogenically at ambient pressure as liquefied natural gas (LNG) in heavy-duty vehicles. For the same energy content, the emission from NG combustion have significantly less harmful combustion products such as CO2 and NOx than gasoline and diesel engines (Bradley, 1996). NGV can be categorized into three types, (1) fuel converted, (2) dual fuel operation and (3) dedicatedly developed engine. Most NGV are of type (1) and (2) while type (3) available mainly for heavy duty vehicles. It is well known that when a port injection gasoline engine is converted to NG, with the fuel injected in the intake manifold, power is reduced and upper speed is limited. These are due to reduction of volumetric efficiency and the relatively lower turbulent flame speed of NG-air combustion (Ishii, 1994). The problems can be mitigated by direct injection which increases volumetric efficiency and improves mixing as a result of turbulence induced by high pressure injection. However, to achieve direct fuel injection, a complicated and costly engine modification is required. The cylinder head needs to be redesigned or retrofitted to accommodate the direct fuel injector.
2. Direct injection concepts
Two main characteristics of direct injection are internal mixture formation and closed valve injection. Mixture formation is vital in direct injection because the available time for air-fuel mixing is relatively short compared to indirect port injection or carburetion.
2.1 Internal mixture formations in direct injection spark ignition engines In spark ignition engines, air and fuel mixing takes place in the cylinder but a premixing process occurs to a certain degrees depending on type of fuel delivery. In a carburetor system, fuel vaporizes and mixes in the air stream prior to entering the combustion chamber. In a port injection system, fuel is injected and the velocity of fuel jet determines atomization and evaporation of fuel in air. In the direct injection method, fuel is directly injected into the combustion chamber as intake valve closes. The turbulence induced by the gas jet and the jet penetration determine the degree of mixing. In general, the mixing process in the direct injection method is restricted to a much shorter time. Furthermore, unlike the carburetion and port injection where mixing starts before air and fuel enter the combustion chamber, the mixing in direct injection mode can only happen in confined cylinder geometry. The concepts of homogenous and stratified mixture formation are very important when discussing the direct injection in spark ignition engines because they form the basis of a better control of fuel mixture than the one experienced with port fuel injection. In addition, charge stratification can increase thermal efficiency and have the potential of reducing pollutant emissions. However, with direct injection operation, the degree of mixing and mixture uniformity is vital for reliable combustion. A combination of direct injection, high squish, high swirl and optimized piston crown shape can produced fast mixing and a high
degree of mixture uniformity, thus turbulent intensity, molecular diffusion and chemical kinetics, which are the main contributors to the establishment and propagation of a turbulent flame (Risi, 1997). Mixture formation in direct injection engines can be classified into homogeneous and stratified charge based on the injection strategies. The concepts of these mixture formations are determined by the engine operation and fuel economy requirements.
2.1.1 Early injection, homogeneous-charge operation The homogeneous mixture operating mode in the direct injection engine is designed to meet the requirement of medium-to-high engine loads. Depending on the overall air-fuel ratio, the mixture can be homogeneous-stoichiometric or homogeneous lean. Early injection makes it possible to achieve a volumetric efficiency that is higher than port fuel injection, and slightly increased compression ratio operation which contributes to better fuel economy. It also benefits from better emission during cold start and transient operation (Zhao, 1999 & 2002).
2.1.2 Late injection, stratified-charge operation This operation is mainly to achieve lean burn and unthrottled operations by injecting fuel late during compression stroke. Fuel stratification is achieved by injection strategy such that the air-fuel ratio around the spark gaps yield stable ignition and flame propagation, whereas areas farther from the point of ignition is leaner or devoid of fuel. The advantage of charge stratification includes significant reduction in pumping work associated with throttling, reduced heat loss, reduced chemical dissociation from lower cycle temperatures and increases specific heat ratio for the cycle, which provide incremental gains in thermal efficiency (Zhao, 2002).
2.2 Potential for direct fuel injection in spark ignition engine Direct injection in spark ignition engines could achieve a number of desirable effects. When direct injection method is applied to gaseous fuel, more achievement in terms of specific power output can be realized due to significant improvement in volumetric efficiency. The advantages of direct injection methods can be summarized as follows (Stan, 2002)
2.2.1 Increased thermal efficiency and lower specific fuel consumption At part load, avoiding fresh charge throttling results in charge stratification and burned gas in distinct zones. This ideal structure consists of stoichiometric mixture cloud with spark contact, enveloped by fresh air and burned gas that form a barrier against chemical reactions near chamber wall thus avoiding intense heat transfer to the wall during combustion. Thermal efficiency is bettered by increasing compression ratio, as well as turbo charging and supercharging. Knock can be avoided in such cases by different effects: mixture formation just before or during ignition; mixture concentration in central zone of combustion chamber; out of crevice; of mixture cooling by fuel vaporization during injection.
www.intechopen.com
Natural Gas292
2.2.2 Higher torque due to increase in absolute heating value of mixture This is achieved by higher scavenging intensity. The more fresh air is captured, the more fuel can be injected. One the other hand, more captured air generally leads to greater scavenging losses. However, fresh air losses without fuel inclusion have no disadvantages in terms of pollutant emissions, leading to only a slight disturbance of thermal efficiency. Such enforced cylinder filling with air forms the basis for efficient downsizing, which involves supercharging of turbo-charging, inter-cooling, and also adapted valve control. 2.2.3 Decreased pollutant emission Pollutant emission reduction is achieved mainly by the lean burn strategy, which is usually coupled with unthrottled operation. The lean mixture formation however needs a careful calibration of injection timing with respect to ignition timing, as well as proper shape of fuel spray and injection duration.
2.2.4 Improved acceleration behavior Intensive scavenging and unthrottled operation results in a high charge of fresh air at every load. Thus, inertial effects of the air flow during acceleration can be partially avoided. On the other hand, the possible real-time adaptation of the fuel injection rate to the air flow behavior allows an adaptable correlation of mixture formation and combustion. Such dynamic response on torque demand is well known from advanced car diesel engines with direct injection. The success of a direct injection method depends mainly on the effectiveness of mixture formation and control. This is achieved with precise fuel injection strategies, appropriate cylinder geometry with flow guide and advanced engine management system. A simple technique to improve engine performance when converting port injection gasoline engines to NG operation using direct fuel injection can be realized using spark plug fuel injector (SPFI). The next section will explore briefly on the development of SPFI and its design specifications.
3. Spark Plug Fuel Injector (SPFI)
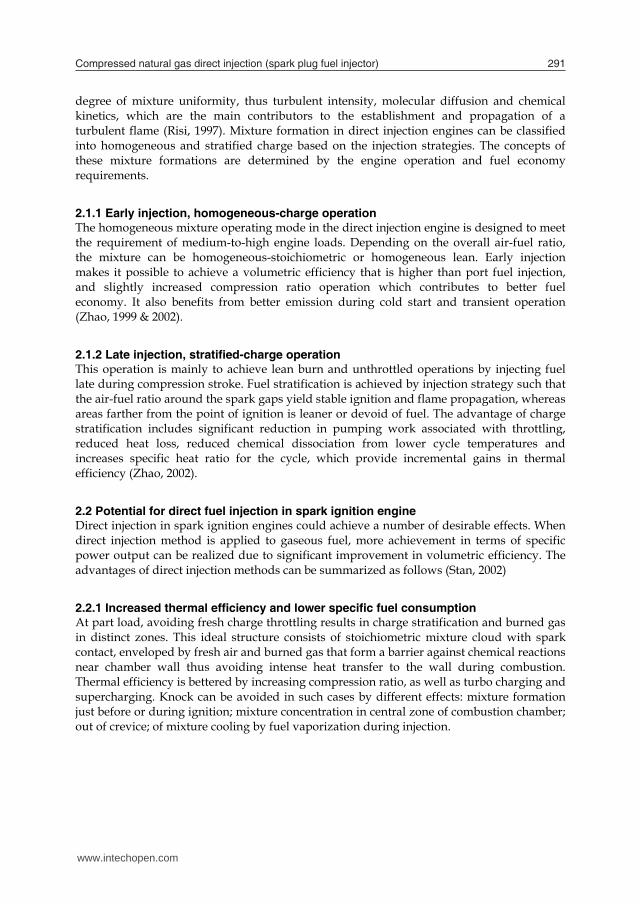
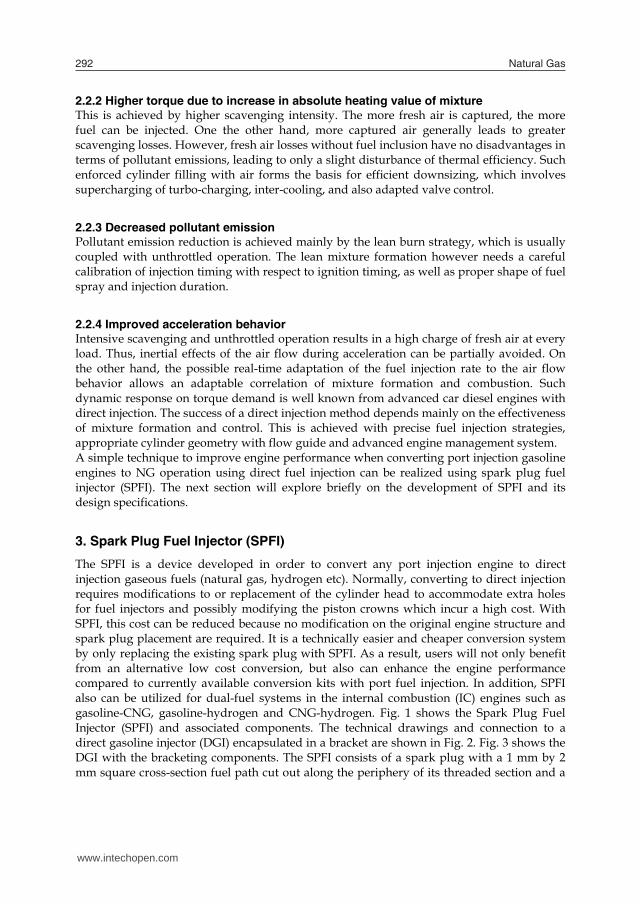
The SPFI is a device developed in order to convert any port injection engine to direct injection gaseous fuels (natural gas, hydrogen etc). Normally, converting to direct injection requires modifications to or replacement of the cylinder head to accommodate extra holes for fuel injectors and possibly modifying the piston crowns which incur a high cost. With SPFI, this cost can be reduced because no modification on the original engine structure and spark plug placement are required. It is a technically easier and cheaper conversion system by only replacing the existing spark plug with SPFI. As a result, users will not only benefit from an alternative low cost conversion, but also can enhance the engine performance compared to currently available conversion kits with port fuel injection. In addition, SPFI also can be utilized for dual-fuel systems in the internal combustion (IC) engines such as gasoline-CNG, gasoline-hydrogen and CNG-hydrogen. Fig. 1 shows the Spark Plug Fuel Injector (SPFI) and associated components. The technical drawings and connection to a direct gasoline injector (DGI) encapsulated in a bracket are shown in Fig. 2. Fig. 3 shows the DGI with the bracketing components. The SPFI consists of a spark plug with a 1 mm by 2 mm square cross-section fuel path cut out along the periphery of its threaded section and a
steel tube soldered to the end of the cut section. A DGI is connected to it using a specially developed bracket to the end of the fuel path. The distance from the DGI injection nozzle to the SPFI nozzle is 11 cm. The DGI injector is connected to a 230 bar methane bottle through a pressure regulator where methane pressure is reduced to the desired pressure. A specially developed injection control was used to regulate fuel injection by referencing crank angle signals from a camshaft encoder. The length of injection pulse determines fuel mass delivered, therefore air/fuel ratio to the cylinder. The most immediate effect of installation of SPFI on the Ricardo E6 engine is the reduction of motorized engine cylinder peak pressure due to decrease in compression ratio (Mohamad, 2006).
Fig. 1. Spark plug fuel injector
Fig. 2. (Left) Technical drawing of SPFI (units in mm) and (Right) SPFI connected to injector housing
Fig. 3. DGI injector and enclosure component (left), DGI injector in the enclosure (center) and SPFI mounted on an engine (left)
3.1 Injection process Among the initial SPFI development works is the study on injection process (Mohamad, 2010). It is important to understand the effects of the SPFI fuel path on the injection process which will significantly affect the air-fuel mixing in the combustion chamber. Fig. 4 shows the experimental setup of the injection measurement. The experimental setup can be categorised into four groups; (1.) a laser-optical lens system, (2.) an imaging system, (3.) a fuel supply
www.intechopen.com
Compressed natural gas direct injection (spark plug fuel injector) 293
2.2.2 Higher torque due to increase in absolute heating value of mixture This is achieved by higher scavenging intensity. The more fresh air is captured, the more fuel can be injected. One the other hand, more captured air generally leads to greater scavenging losses. However, fresh air losses without fuel inclusion have no disadvantages in terms of pollutant emissions, leading to only a slight disturbance of thermal efficiency. Such enforced cylinder filling with air forms the basis for efficient downsizing, which involves supercharging of turbo-charging, inter-cooling, and also adapted valve control. 2.2.3 Decreased pollutant emission Pollutant emission reduction is achieved mainly by the lean burn strategy, which is usually coupled with unthrottled operation. The lean mixture formation however needs a careful calibration of injection timing with respect to ignition timing, as well as proper shape of fuel spray and injection duration.
2.2.4 Improved acceleration behavior Intensive scavenging and unthrottled operation results in a high charge of fresh air at every load. Thus, inertial effects of the air flow during acceleration can be partially avoided. On the other hand, the possible real-time adaptation of the fuel injection rate to the air flow behavior allows an adaptable correlation of mixture formation and combustion. Such dynamic response on torque demand is well known from advanced car diesel engines with direct injection. The success of a direct injection method depends mainly on the effectiveness of mixture formation and control. This is achieved with precise fuel injection strategies, appropriate cylinder geometry with flow guide and advanced engine management system. A simple technique to improve engine performance when converting port injection gasoline engines to NG operation using direct fuel injection can be realized using spark plug fuel injector (SPFI). The next section will explore briefly on the development of SPFI and its design specifications.
3. Spark Plug Fuel Injector (SPFI)
The SPFI is a device developed in order to convert any port injection engine to direct injection gaseous fuels (natural gas, hydrogen etc). Normally, converting to direct injection requires modifications to or replacement of the cylinder head to accommodate extra holes for fuel injectors and possibly modifying the piston crowns which incur a high cost. With SPFI, this cost can be reduced because no modification on the original engine structure and spark plug placement are required. It is a technically easier and cheaper conversion system by only replacing the existing spark plug with SPFI. As a result, users will not only benefit from an alternative low cost conversion, but also can enhance the engine performance compared to currently available conversion kits with port fuel injection. In addition, SPFI also can be utilized for dual-fuel systems in the internal combustion (IC) engines such as gasoline-CNG, gasoline-hydrogen and CNG-hydrogen. Fig. 1 shows the Spark Plug Fuel Injector (SPFI) and associated components. The technical drawings and connection to a direct gasoline injector (DGI) encapsulated in a bracket are shown in Fig. 2. Fig. 3 shows the DGI with the bracketing components. The SPFI consists of a spark plug with a 1 mm by 2 mm square cross-section fuel path cut out along the periphery of its threaded section and a
steel tube soldered to the end of the cut section. A DGI is connected to it using a specially developed bracket to the end of the fuel path. The distance from the DGI injection nozzle to the SPFI nozzle is 11 cm. The DGI injector is connected to a 230 bar methane bottle through a pressure regulator where methane pressure is reduced to the desired pressure. A specially developed injection control was used to regulate fuel injection by referencing crank angle signals from a camshaft encoder. The length of injection pulse determines fuel mass delivered, therefore air/fuel ratio to the cylinder. The most immediate effect of installation of SPFI on the Ricardo E6 engine is the reduction of motorized engine cylinder peak pressure due to decrease in compression ratio (Mohamad, 2006).
Fig. 1. Spark plug fuel injector
Fig. 2. (Left) Technical drawing of SPFI (units in mm) and (Right) SPFI connected to injector housing
Fig. 3. DGI injector and enclosure component (left), DGI injector in the enclosure (center) and SPFI mounted on an engine (left)
3.1 Injection process Among the initial SPFI development works is the study on injection process (Mohamad, 2010). It is important to understand the effects of the SPFI fuel path on the injection process which will significantly affect the air-fuel mixing in the combustion chamber. Fig. 4 shows the experimental setup of the injection measurement. The experimental setup can be categorised into four groups; (1.) a laser-optical lens system, (2.) an imaging system, (3.) a fuel supply
www.intechopen.com

Natural Gas294
system and, (4) a fuel chamber equipped with windows in which the fuel substitute is injected (termed the “bomb”). The fuel injection driver circuit was synchronized with the camera and laser systems. A MOSFET transistor, acting as a gate/bridge between a power supply unit and the SPFI, is excited by the output of a pulse generator which functioned as the main driver to the experiment. At the same time, the pulse generator output was connected to another pulse/delay generator where its signal was sent to the laser source. The laser source simultaneously sent a signal to the camera so that the laser pulse was synchronised with the opening of the shutter. An oscilloscope was connected to both pulse/delay generator to measure the delay between initiation of fuel injection and image capture. For every 0.5-1.0 ms interval (delay with respect to injection signal), 20 images were captured, therefore the sequence of jet development images was independent of the laser frequency. The plume of fuel emerging from the injector nozzle was imaged. The plume was illuminated with a 100 mm high, 0.5mm thick light sheet from a XeCl excimer laser (308nm) with 100-200mJ/pulse and was imaged with a camera with image intensifier and lens. Laser Induced Fluorescence (LIF) images were taken of fluorescence emitted by the acetone mixed with nitrogen. The LIF is emitted by both droplets and vapour and the signal is proportional to the local mass concentration. Images were taken at several different times after the start of the injector current pulse. At each time, 20 images were taken from successive cycles. The camera settings were f/8, intensifier gate 200ns, intensifier gain x60, camera gain x95. The images were corrected for background intensity and light sheet intensity.
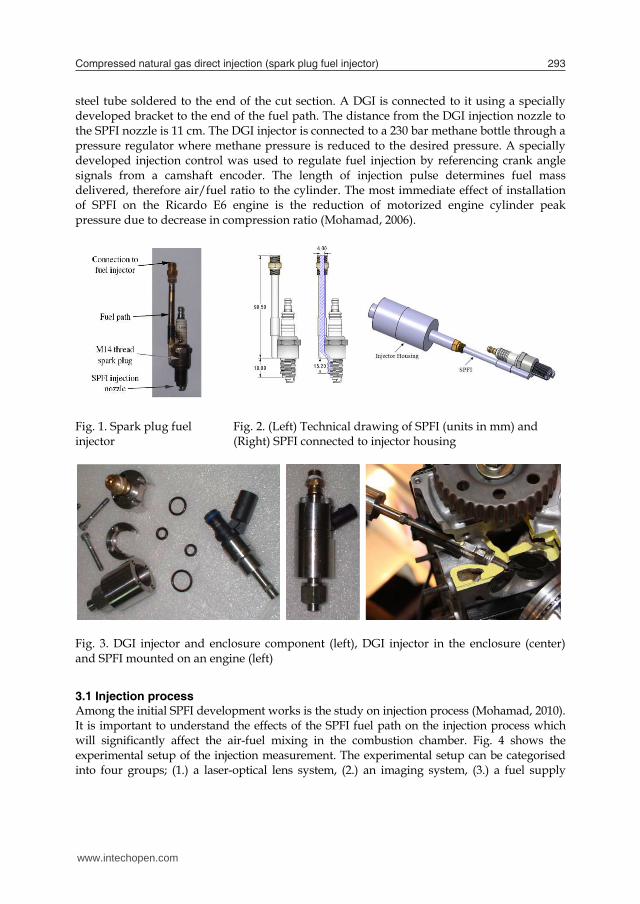
Fig. 4. Schematic of the PLIF imaging of SPFI injection The nitrogen acetone doping mechanism (Drechsel bottle) is shown in Fig. 5. The nitrogen is bubbled through the acetone and trapped in the upper part of the threshold bottle. The trapped gas increases its pressure and as it reaches the desired injection pressures, the supply valve is closed. An outlet gas pipe is attached to the bottle, positioned above the surface of acetone, thus only acetone-saturated gas is delivered to the SPFI. The amount of seeded acetone is determined based on the saturated vapor pressure of acetone at the room conditions which equals the partial pressure of acetone in the seeded gas. Acetone concentration was kept constant by adjusting the injection frequency to give sufficient time for building up acetone concentration for the next injection. The supply gas and bomb were maintained at room temperature using a water bath. The evaporative cooling in the acetone bottle was kept to a minimum during all pulse durations. The pressure gauge on the gas pipe near SPFI was used to determine the injection pressures.
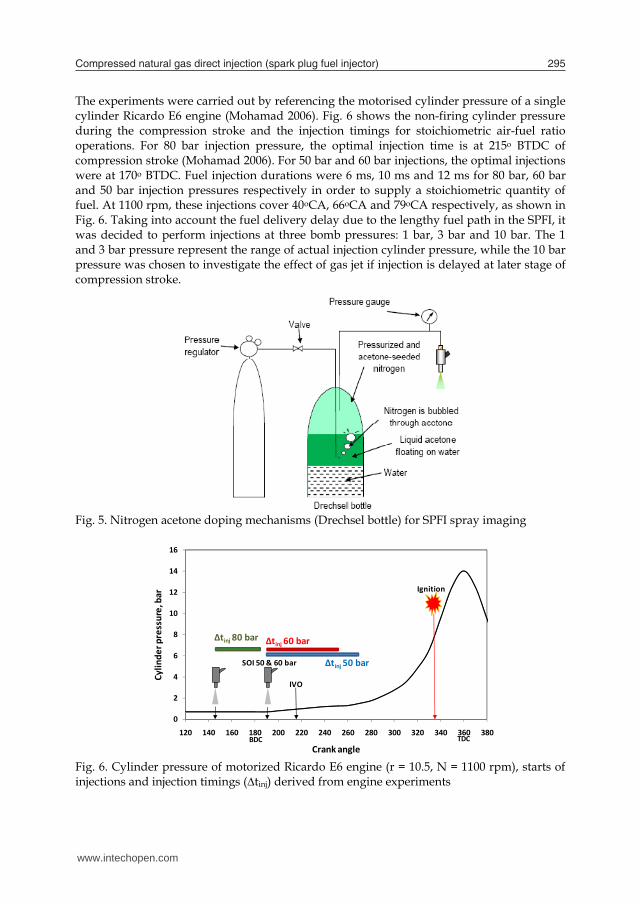
The experiments were carried out by referencing the motorised cylinder pressure of a single cylinder Ricardo E6 engine (Mohamad 2006). Fig. 6 shows the non-firing cylinder pressure during the compression stroke and the injection timings for stoichiometric air-fuel ratio operations. For 80 bar injection pressure, the optimal injection time is at 215o BTDC of compression stroke (Mohamad 2006). For 50 bar and 60 bar injections, the optimal injections were at 170o BTDC. Fuel injection durations were 6 ms, 10 ms and 12 ms for 80 bar, 60 bar and 50 bar injection pressures respectively in order to supply a stoichiometric quantity of fuel. At 1100 rpm, these injections cover 40oCA, 66oCA and 79oCA respectively, as shown in Fig. 6. Taking into account the fuel delivery delay due to the lengthy fuel path in the SPFI, it was decided to perform injections at three bomb pressures: 1 bar, 3 bar and 10 bar. The 1 and 3 bar pressure represent the range of actual injection cylinder pressure, while the 10 bar pressure was chosen to investigate the effect of gas jet if injection is delayed at later stage of compression stroke.
Fig. 5. Nitrogen acetone doping mechanisms (Drechsel bottle) for SPFI spray imaging
Fig. 6. Cylinder pressure of motorized Ricardo E6 engine (r = 10.5, N = 1100 rpm), starts of injections and injection timings (∆tinj) derived from engine experiments
0
2
4
6
8
10
12
14
16
120 140 160 180 200 220 240 260 280 300 320 340 360 380
Cylin
der p
ressure, bar
Crank angle
Δtinj 80 bar
TDCBDC
Δtinj 50 bar
IVO
Ignition
Δtinj 60 bar
SOI 50 & 60 bar
www.intechopen.com
Compressed natural gas direct injection (spark plug fuel injector) 295
system and, (4) a fuel chamber equipped with windows in which the fuel substitute is injected (termed the “bomb”). The fuel injection driver circuit was synchronized with the camera and laser systems. A MOSFET transistor, acting as a gate/bridge between a power supply unit and the SPFI, is excited by the output of a pulse generator which functioned as the main driver to the experiment. At the same time, the pulse generator output was connected to another pulse/delay generator where its signal was sent to the laser source. The laser source simultaneously sent a signal to the camera so that the laser pulse was synchronised with the opening of the shutter. An oscilloscope was connected to both pulse/delay generator to measure the delay between initiation of fuel injection and image capture. For every 0.5-1.0 ms interval (delay with respect to injection signal), 20 images were captured, therefore the sequence of jet development images was independent of the laser frequency. The plume of fuel emerging from the injector nozzle was imaged. The plume was illuminated with a 100 mm high, 0.5mm thick light sheet from a XeCl excimer laser (308nm) with 100-200mJ/pulse and was imaged with a camera with image intensifier and lens. Laser Induced Fluorescence (LIF) images were taken of fluorescence emitted by the acetone mixed with nitrogen. The LIF is emitted by both droplets and vapour and the signal is proportional to the local mass concentration. Images were taken at several different times after the start of the injector current pulse. At each time, 20 images were taken from successive cycles. The camera settings were f/8, intensifier gate 200ns, intensifier gain x60, camera gain x95. The images were corrected for background intensity and light sheet intensity.
Fig. 4. Schematic of the PLIF imaging of SPFI injection The nitrogen acetone doping mechanism (Drechsel bottle) is shown in Fig. 5. The nitrogen is bubbled through the acetone and trapped in the upper part of the threshold bottle. The trapped gas increases its pressure and as it reaches the desired injection pressures, the supply valve is closed. An outlet gas pipe is attached to the bottle, positioned above the surface of acetone, thus only acetone-saturated gas is delivered to the SPFI. The amount of seeded acetone is determined based on the saturated vapor pressure of acetone at the room conditions which equals the partial pressure of acetone in the seeded gas. Acetone concentration was kept constant by adjusting the injection frequency to give sufficient time for building up acetone concentration for the next injection. The supply gas and bomb were maintained at room temperature using a water bath. The evaporative cooling in the acetone bottle was kept to a minimum during all pulse durations. The pressure gauge on the gas pipe near SPFI was used to determine the injection pressures.
The experiments were carried out by referencing the motorised cylinder pressure of a single cylinder Ricardo E6 engine (Mohamad 2006). Fig. 6 shows the non-firing cylinder pressure during the compression stroke and the injection timings for stoichiometric air-fuel ratio operations. For 80 bar injection pressure, the optimal injection time is at 215o BTDC of compression stroke (Mohamad 2006). For 50 bar and 60 bar injections, the optimal injections were at 170o BTDC. Fuel injection durations were 6 ms, 10 ms and 12 ms for 80 bar, 60 bar and 50 bar injection pressures respectively in order to supply a stoichiometric quantity of fuel. At 1100 rpm, these injections cover 40oCA, 66oCA and 79oCA respectively, as shown in Fig. 6. Taking into account the fuel delivery delay due to the lengthy fuel path in the SPFI, it was decided to perform injections at three bomb pressures: 1 bar, 3 bar and 10 bar. The 1 and 3 bar pressure represent the range of actual injection cylinder pressure, while the 10 bar pressure was chosen to investigate the effect of gas jet if injection is delayed at later stage of compression stroke.
Fig. 5. Nitrogen acetone doping mechanisms (Drechsel bottle) for SPFI spray imaging
Fig. 6. Cylinder pressure of motorized Ricardo E6 engine (r = 10.5, N = 1100 rpm), starts of injections and injection timings (∆tinj) derived from engine experiments
0
2
4
6
8
10
12
14
16
120 140 160 180 200 220 240 260 280 300 320 340 360 380
Cylin
der p
ressure, bar
Crank angle
Δtinj 80 bar
TDCBDC
Δtinj 50 bar
IVO
Ignition
Δtinj 60 bar
SOI 50 & 60 bar
www.intechopen.com
Natural Gas296
3.1It iiminjeobjimbritheimandthisys
Figinj 3.1Imimbriintimdusomdoagrvocha
Fig
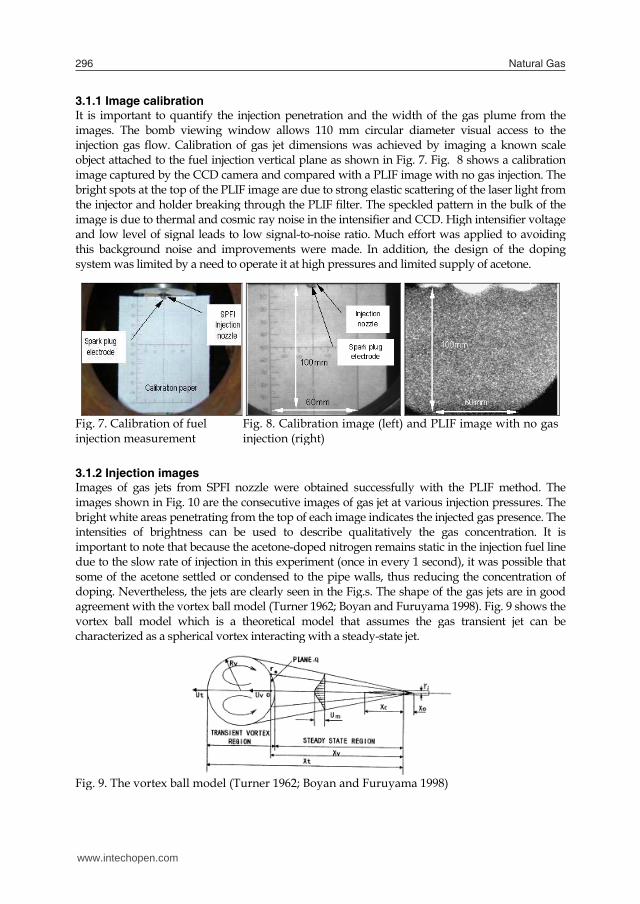
1.1 Image calibrais important to qu
mages. The bomb ection gas flow. Cject attached to th
mage captured by tight spots at the toe injector and hold
mage is due to thermd low level of sigis background nostem was limited b
g. 7. Calibration oection measurem
1.2 Injection imamages of gas jets fmages shown in Fig
ight white areas petensities of brigh
mportant to note thue to the slow rateme of the acetone
oping. Neverthelesreement with the rtex ball model aracterized as a sp
g. 9. The vortex b
ation uantify the injecti viewing windowCalibration of gashe fuel injection vethe CCD camera aop of the PLIF imader breaking throumal and cosmic ra
gnal leads to low oise and improvemby a need to opera
of fuel
ment Fig. injec
ages from SPFI nozzleg. 10 are the conseenetrating from th
htness can be usehat because the acee of injection in thie settled or condess, the jets are cleavortex ball modelwhich is a theor
pherical vortex inte
all model (Turner
ion penetration anw allows 110 mms jet dimensions wertical plane as sh
and compared witage are due to strough the PLIF filteay noise in the intesignal-to-noise raments were madate it at high press
8. Calibration imction (right)
e were obtained ecutive images of he top of each imaed to describe qetone-doped nitrogis experiment (onnsed to the pipe arly seen in the Fil (Turner 1962; Boyretical model thaeracting with a ste
r 1962; Boyan and
nd the width of tm circular diametwas achieved by hown in Fig. 7. Figth a PLIF image wong elastic scatteriner. The speckled pensifier and CCD.
atio. Much effort we. In addition, thures and limited s
mage (left) and PL
successfully with gas jet at various
age indicates the inqualitatively the ggen remains static
nce in every 1 secowalls, thus reducig.s. The shape ofyan and Furuyamat assumes the geady-state jet.
d Furuyama 1998
the gas plume froter visual access imaging a known
g. 8 shows a calibwith no gas injectiong of the laser ligh
pattern in the bulk High intensifier v
was applied to avhe design of the dsupply of acetone.
LIF image with no
h the PLIF metho injection pressure
njected gas presencgas concentrationc in the injection fuond), it was possibing the concentra
f the gas jets are inma 1998). Fig. 9 shogas transient jet c
8)
om the to the
n scale bration on. The ht from k of the voltage voiding doping
o gas
od. The es. The ce. The
n. It is uel line ble that ation of n good
ows the can be
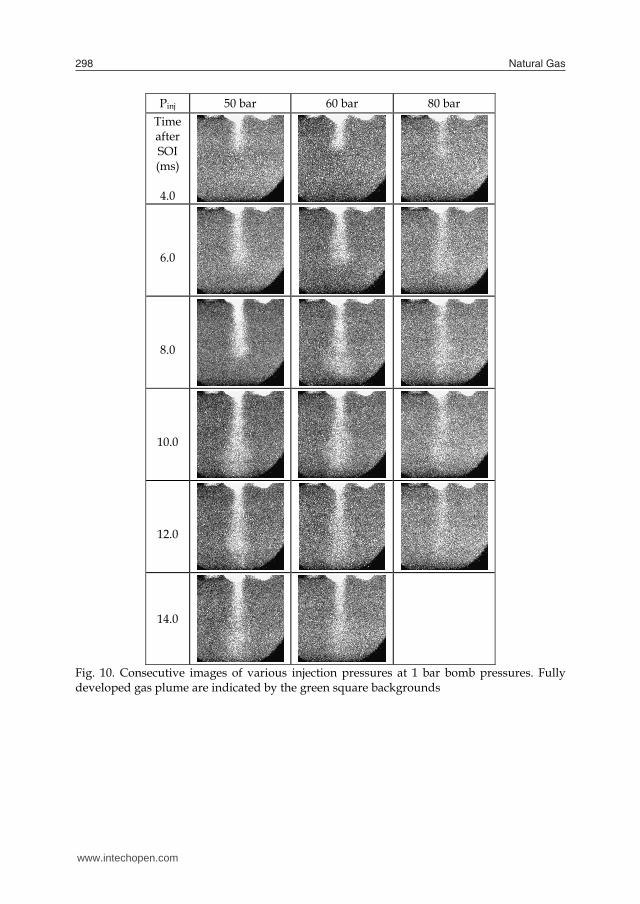
The injection durations for 50, 60 and 80 bar fuel pressures on the Ricardo E6 engine were 12 ms, 10 ms and 6 ms respectively. These values correspond to the stoichiometric fraction of methane for the engine tests. A fully developed gas jet refers to the gas plume with longest jet tip penetration before detachment from the SPFI nozzle. In general, it can be seen that the fully developed gas jets from the SPFI injection were relatively narrow, with about 23o cone angle and 25 mm of maximum width in a fully developed gas jet. The cone angle is specified by measuring the angle generated by a triangle connecting the center of SPFI nozzle and the widest horizontal span of the gas jet as shown in Fig. 10. The jet tip penetration length and jet width were defined based on the lowest acetone concentration detectable. Fig. 11 shows the visual definition of the tip penetration length and jet width. The penetration length of the fully developed gas jet is between 90 and 100 mm at 8 to 14 milliseconds after the starts of injections. The results show that at all injection pressures, the first appearance of gas jet can be seen at 2.5 ms after SOI which coincides with the first interval of imaging. However the images at this interval were not shown in Fig. 9. It is believed that if the interval is decreased, the first appearance of gas jet can be well defined with respect to different injection pressures. The fully developed jets appear at different times. Higher injection pressure results in faster development of a fully-developed jet which is defined by the furthest distance of jet tip penetration while the plumes were still attached to the injection nozzle. In addition, increasing injection pressure reduces the effective fuel delivery time which is measured from the SOI signal to the time of gas plume detachment from the injection nozzle. Bomb pressure affects the magnitude of tip penetration and effective fuel delivery time. Increasing bomb pressure leads to shorter jet penetration and slower effective delivery time. The penetrations of gas jet based on the PLIF imaging experiments are shown in Fig. 12. Fig. 13 shows the effect of injection and bomb pressure on tip penetration. Jet penetration is proportional to square root of injection time, except in the early phase. As the bomb pressure increases, jet penetration reduces. However, for the same bomb pressure, the variation in penetration lengths with changing fuel pressure is relatively small due to SPFI injection nozzle exit flow were at sonic conditions for all injection pressures. Therefore gas velocity remains constant except when flow temperature increases. However, the mass flow rate at the sonic conditions not only depends on flow temperature but also depends on the density of the injected gas which is proportional to supply pressure. Therefore mass flow rate determines the length of injection duration and in certain degree affected the length of jet penetration. The penetration lengths are highest at 80 bar and lowest at 60 bar injection. The jet from 60 bar injection is slightly wider but shorter than the one from 50 bar injection. Measurement of jet tip penetration was performed from 15 images of each injection condition. Error analysis was done with respect to the measured data. The average error was ±0.30mm and the highest error was found to be at ±0.48mm or 3.9% of the measured data. These errors were sourced from a number of factors. Variation of acetone temperature affects the concentration of acetone in the compressed nitrogen. Assuming laser power and camera sensitivity remain constant, the variation of acetone concentration means variation in location of threshold of fluorescent signal. Visual error while measuring the jet parameters from the images was another source. However, the error was proven to be relatively low.
www.intechopen.com

Compressed natural gas direct injection (spark plug fuel injector) 297
3.1It iiminjeobjimbritheimandthisys
Figinj 3.1Imimbriintimdusomdoagrvocha
Fig
1.1 Image calibrais important to qu
mages. The bomb ection gas flow. Cject attached to th
mage captured by tight spots at the toe injector and hold
mage is due to thermd low level of sigis background nostem was limited b
g. 7. Calibration oection measurem
1.2 Injection imamages of gas jets fmages shown in Fig
ight white areas petensities of brigh
mportant to note thue to the slow rateme of the acetone
oping. Neverthelesreement with the rtex ball model aracterized as a sp
g. 9. The vortex b
ation uantify the injecti viewing windowCalibration of gashe fuel injection vethe CCD camera aop of the PLIF imader breaking throumal and cosmic ra
gnal leads to low oise and improvemby a need to opera
of fuel
ment Fig. injec
ages from SPFI nozzleg. 10 are the conseenetrating from th
htness can be usehat because the acee of injection in thie settled or condess, the jets are cleavortex ball modelwhich is a theor
pherical vortex inte
all model (Turner
ion penetration anw allows 110 mms jet dimensions wertical plane as sh
and compared witage are due to strough the PLIF filteay noise in the intesignal-to-noise raments were madate it at high press
8. Calibration imction (right)
e were obtained ecutive images of he top of each imaed to describe qetone-doped nitrogis experiment (onnsed to the pipe arly seen in the Fil (Turner 1962; Boyretical model thaeracting with a ste
r 1962; Boyan and
nd the width of tm circular diametwas achieved by hown in Fig. 7. Figth a PLIF image wong elastic scatteriner. The speckled pensifier and CCD.
atio. Much effort we. In addition, thures and limited s
mage (left) and PL
successfully with gas jet at various
age indicates the inqualitatively the ggen remains static
nce in every 1 secowalls, thus reducig.s. The shape ofyan and Furuyamat assumes the geady-state jet.
d Furuyama 1998
the gas plume froter visual access imaging a known
g. 8 shows a calibwith no gas injectiong of the laser ligh
pattern in the bulk High intensifier v
was applied to avhe design of the dsupply of acetone.
LIF image with no
h the PLIF metho injection pressure
njected gas presencgas concentrationc in the injection fuond), it was possibing the concentra
f the gas jets are inma 1998). Fig. 9 shogas transient jet c
8)
om the to the
n scale bration on. The ht from k of the voltage voiding doping
o gas
od. The es. The ce. The
n. It is uel line ble that ation of n good
ows the can be
The injection durations for 50, 60 and 80 bar fuel pressures on the Ricardo E6 engine were 12 ms, 10 ms and 6 ms respectively. These values correspond to the stoichiometric fraction of methane for the engine tests. A fully developed gas jet refers to the gas plume with longest jet tip penetration before detachment from the SPFI nozzle. In general, it can be seen that the fully developed gas jets from the SPFI injection were relatively narrow, with about 23o cone angle and 25 mm of maximum width in a fully developed gas jet. The cone angle is specified by measuring the angle generated by a triangle connecting the center of SPFI nozzle and the widest horizontal span of the gas jet as shown in Fig. 10. The jet tip penetration length and jet width were defined based on the lowest acetone concentration detectable. Fig. 11 shows the visual definition of the tip penetration length and jet width. The penetration length of the fully developed gas jet is between 90 and 100 mm at 8 to 14 milliseconds after the starts of injections. The results show that at all injection pressures, the first appearance of gas jet can be seen at 2.5 ms after SOI which coincides with the first interval of imaging. However the images at this interval were not shown in Fig. 9. It is believed that if the interval is decreased, the first appearance of gas jet can be well defined with respect to different injection pressures. The fully developed jets appear at different times. Higher injection pressure results in faster development of a fully-developed jet which is defined by the furthest distance of jet tip penetration while the plumes were still attached to the injection nozzle. In addition, increasing injection pressure reduces the effective fuel delivery time which is measured from the SOI signal to the time of gas plume detachment from the injection nozzle. Bomb pressure affects the magnitude of tip penetration and effective fuel delivery time. Increasing bomb pressure leads to shorter jet penetration and slower effective delivery time. The penetrations of gas jet based on the PLIF imaging experiments are shown in Fig. 12. Fig. 13 shows the effect of injection and bomb pressure on tip penetration. Jet penetration is proportional to square root of injection time, except in the early phase. As the bomb pressure increases, jet penetration reduces. However, for the same bomb pressure, the variation in penetration lengths with changing fuel pressure is relatively small due to SPFI injection nozzle exit flow were at sonic conditions for all injection pressures. Therefore gas velocity remains constant except when flow temperature increases. However, the mass flow rate at the sonic conditions not only depends on flow temperature but also depends on the density of the injected gas which is proportional to supply pressure. Therefore mass flow rate determines the length of injection duration and in certain degree affected the length of jet penetration. The penetration lengths are highest at 80 bar and lowest at 60 bar injection. The jet from 60 bar injection is slightly wider but shorter than the one from 50 bar injection. Measurement of jet tip penetration was performed from 15 images of each injection condition. Error analysis was done with respect to the measured data. The average error was ±0.30mm and the highest error was found to be at ±0.48mm or 3.9% of the measured data. These errors were sourced from a number of factors. Variation of acetone temperature affects the concentration of acetone in the compressed nitrogen. Assuming laser power and camera sensitivity remain constant, the variation of acetone concentration means variation in location of threshold of fluorescent signal. Visual error while measuring the jet parameters from the images was another source. However, the error was proven to be relatively low.
www.intechopen.com
Natural Gas298
Pinj 50 bar 60 bar 80 bar Time after SOI (ms)
4.0
6.0
8.0
10.0
12.0
14.0
Fig. 10. Consecutive images of various injection pressures at 1 bar bomb pressures. Fully developed gas plume are indicated by the green square backgrounds
Fig. 11. Fully developed gas jet from SPFI at 60 bar injection and 3 bar bomb pressure Based on the investigation, SPFI design yields sufficient jet penetration length especially during the later part of compression stroke. However, the width of the jet and the direction of injection away from the point of ignition could be detrimental to the engine performance. SPFI utilizes a fuel injector which is optimised for direct injection and stratified charge operations. However, the optimization of nozzle design and orientation to give best effect on stratified charge direct injection has not been taken advantage of of the SPFI system yet. As a result, the effective fuel injection behaviour is determined mainly by the injection nozzle as well as the fuel path. This work has given a qualitative understanding of the injection and mixing behaviour which is useful for design optimization process of SPFI.
Fig. 12. Effects of injection pressure on the SPFI jet tip penetration
Fig. 13. Effect of bomb pressure on the SPFI jet tip penetration
3.2 Experimental investigation The SPFI methane direct injection system was designed and tested on a Ricardo E6 engine with gasoline head. The engine is connected and mounted on a common test bed with a direct current electric dynamometer, which functions as motor or brake. Lubricant circulation is driven by an electric motor and water coolant is circulated by separately
0
10
20
30
40
50
60
70
80
90
100
0 2 4 6 8 10 12 14 16
Tip pe
netration, x
t[m
m]
Time after SOI [ms]
50 bar inj/1 bar bomb
60 bar inj/1 bar bomb
80 bar inj/1 bar bomb0
10
20
30
40
50
60
70
80
90
100
0 2 4 6 8 10 12 14 16
Tip pe
netration, x
t[m
m]
Time after SOI [ms]
80 bar inj/1 bar bomb
80 bar inj/3 bar bomb
80 bar inj/10 bar bomb
Jet tip penetration
Jet width
SPFI nozzle
www.intechopen.com

Compressed natural gas direct injection (spark plug fuel injector) 299
Pinj 50 bar 60 bar 80 bar Time after SOI (ms)
4.0
6.0
8.0
10.0
12.0
14.0
Fig. 10. Consecutive images of various injection pressures at 1 bar bomb pressures. Fully developed gas plume are indicated by the green square backgrounds
Fig. 11. Fully developed gas jet from SPFI at 60 bar injection and 3 bar bomb pressure Based on the investigation, SPFI design yields sufficient jet penetration length especially during the later part of compression stroke. However, the width of the jet and the direction of injection away from the point of ignition could be detrimental to the engine performance. SPFI utilizes a fuel injector which is optimised for direct injection and stratified charge operations. However, the optimization of nozzle design and orientation to give best effect on stratified charge direct injection has not been taken advantage of of the SPFI system yet. As a result, the effective fuel injection behaviour is determined mainly by the injection nozzle as well as the fuel path. This work has given a qualitative understanding of the injection and mixing behaviour which is useful for design optimization process of SPFI.
Fig. 12. Effects of injection pressure on the SPFI jet tip penetration
Fig. 13. Effect of bomb pressure on the SPFI jet tip penetration
3.2 Experimental investigation The SPFI methane direct injection system was designed and tested on a Ricardo E6 engine with gasoline head. The engine is connected and mounted on a common test bed with a direct current electric dynamometer, which functions as motor or brake. Lubricant circulation is driven by an electric motor and water coolant is circulated by separately
0
10
20
30
40
50
60
70
80
90
100
0 2 4 6 8 10 12 14 16
Tip pe
netration, x
t[m
m]
Time after SOI [ms]
50 bar inj/1 bar bomb
60 bar inj/1 bar bomb
80 bar inj/1 bar bomb0
10
20
30
40
50
60
70
80
90
100
0 2 4 6 8 10 12 14 16
Tip pe
netration, x
t[m
m]
Time after SOI [ms]
80 bar inj/1 bar bomb
80 bar inj/3 bar bomb
80 bar inj/10 bar bomb
Jet tip penetration
Jet width
SPFI nozzle
www.intechopen.com
Natural Gas300
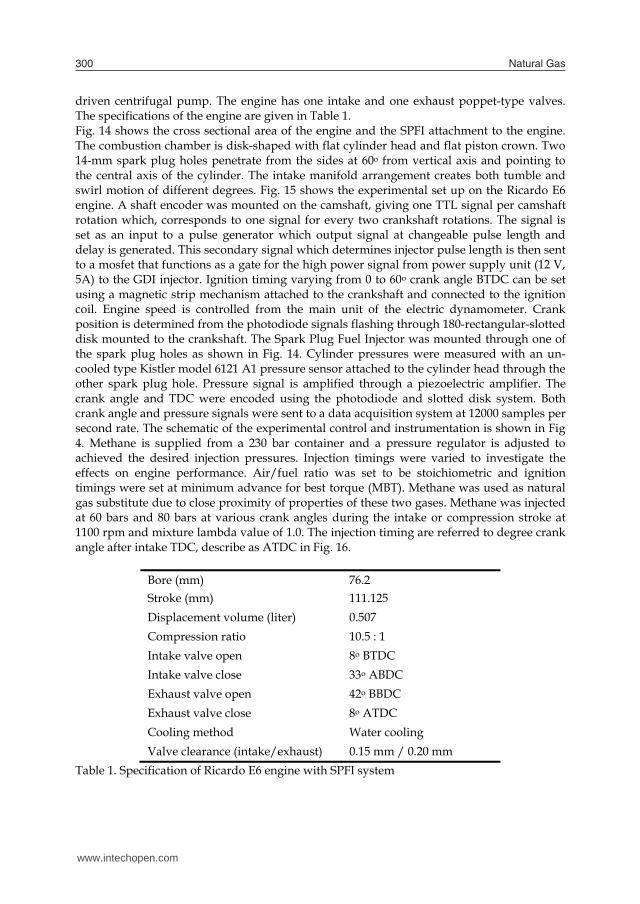
driven centrifugal pump. The engine has one intake and one exhaust poppet-type valves. The specifications of the engine are given in Table 1. Fig. 14 shows the cross sectional area of the engine and the SPFI attachment to the engine. The combustion chamber is disk-shaped with flat cylinder head and flat piston crown. Two 14-mm spark plug holes penetrate from the sides at 60o from vertical axis and pointing to the central axis of the cylinder. The intake manifold arrangement creates both tumble and swirl motion of different degrees. Fig. 15 shows the experimental set up on the Ricardo E6 engine. A shaft encoder was mounted on the camshaft, giving one TTL signal per camshaft rotation which, corresponds to one signal for every two crankshaft rotations. The signal is set as an input to a pulse generator which output signal at changeable pulse length and delay is generated. This secondary signal which determines injector pulse length is then sent to a mosfet that functions as a gate for the high power signal from power supply unit (12 V, 5A) to the GDI injector. Ignition timing varying from 0 to 60o crank angle BTDC can be set using a magnetic strip mechanism attached to the crankshaft and connected to the ignition coil. Engine speed is controlled from the main unit of the electric dynamometer. Crank position is determined from the photodiode signals flashing through 180-rectangular-slotted disk mounted to the crankshaft. The Spark Plug Fuel Injector was mounted through one of the spark plug holes as shown in Fig. 14. Cylinder pressures were measured with an un-cooled type Kistler model 6121 A1 pressure sensor attached to the cylinder head through the other spark plug hole. Pressure signal is amplified through a piezoelectric amplifier. The crank angle and TDC were encoded using the photodiode and slotted disk system. Both crank angle and pressure signals were sent to a data acquisition system at 12000 samples per second rate. The schematic of the experimental control and instrumentation is shown in Fig 4. Methane is supplied from a 230 bar container and a pressure regulator is adjusted to achieved the desired injection pressures. Injection timings were varied to investigate the effects on engine performance. Air/fuel ratio was set to be stoichiometric and ignition timings were set at minimum advance for best torque (MBT). Methane was used as natural gas substitute due to close proximity of properties of these two gases. Methane was injected at 60 bars and 80 bars at various crank angles during the intake or compression stroke at 1100 rpm and mixture lambda value of 1.0. The injection timing are referred to degree crank angle after intake TDC, describe as ATDC in Fig. 16.
Bore (mm) 76.2 Stroke (mm) 111.125 Displacement volume (liter) 0.507 Compression ratio 10.5 : 1 Intake valve open 8o BTDC Intake valve close 33o ABDC Exhaust valve open 42o BBDC Exhaust valve close 8o ATDC Cooling method Water cooling Valve clearance (intake/exhaust) 0.15 mm / 0.20 mm
Table 1. Specification of Ricardo E6 engine with SPFI system
Fig. 14. Cross-sectional view of the combustion chamber (left) and SPFI on the engine cylinder (right).
Fig. 15. Experimental set up on a Ricardo E6 engine and an electric dynamometer,
www.intechopen.com

Compressed natural gas direct injection (spark plug fuel injector) 301
driven centrifugal pump. The engine has one intake and one exhaust poppet-type valves. The specifications of the engine are given in Table 1. Fig. 14 shows the cross sectional area of the engine and the SPFI attachment to the engine. The combustion chamber is disk-shaped with flat cylinder head and flat piston crown. Two 14-mm spark plug holes penetrate from the sides at 60o from vertical axis and pointing to the central axis of the cylinder. The intake manifold arrangement creates both tumble and swirl motion of different degrees. Fig. 15 shows the experimental set up on the Ricardo E6 engine. A shaft encoder was mounted on the camshaft, giving one TTL signal per camshaft rotation which, corresponds to one signal for every two crankshaft rotations. The signal is set as an input to a pulse generator which output signal at changeable pulse length and delay is generated. This secondary signal which determines injector pulse length is then sent to a mosfet that functions as a gate for the high power signal from power supply unit (12 V, 5A) to the GDI injector. Ignition timing varying from 0 to 60o crank angle BTDC can be set using a magnetic strip mechanism attached to the crankshaft and connected to the ignition coil. Engine speed is controlled from the main unit of the electric dynamometer. Crank position is determined from the photodiode signals flashing through 180-rectangular-slotted disk mounted to the crankshaft. The Spark Plug Fuel Injector was mounted through one of the spark plug holes as shown in Fig. 14. Cylinder pressures were measured with an un-cooled type Kistler model 6121 A1 pressure sensor attached to the cylinder head through the other spark plug hole. Pressure signal is amplified through a piezoelectric amplifier. The crank angle and TDC were encoded using the photodiode and slotted disk system. Both crank angle and pressure signals were sent to a data acquisition system at 12000 samples per second rate. The schematic of the experimental control and instrumentation is shown in Fig 4. Methane is supplied from a 230 bar container and a pressure regulator is adjusted to achieved the desired injection pressures. Injection timings were varied to investigate the effects on engine performance. Air/fuel ratio was set to be stoichiometric and ignition timings were set at minimum advance for best torque (MBT). Methane was used as natural gas substitute due to close proximity of properties of these two gases. Methane was injected at 60 bars and 80 bars at various crank angles during the intake or compression stroke at 1100 rpm and mixture lambda value of 1.0. The injection timing are referred to degree crank angle after intake TDC, describe as ATDC in Fig. 16.
Bore (mm) 76.2 Stroke (mm) 111.125 Displacement volume (liter) 0.507 Compression ratio 10.5 : 1 Intake valve open 8o BTDC Intake valve close 33o ABDC Exhaust valve open 42o BBDC Exhaust valve close 8o ATDC Cooling method Water cooling Valve clearance (intake/exhaust) 0.15 mm / 0.20 mm
Table 1. Specification of Ricardo E6 engine with SPFI system
Fig. 14. Cross-sectional view of the combustion chamber (left) and SPFI on the engine cylinder (right).
Fig. 15. Experimental set up on a Ricardo E6 engine and an electric dynamometer,
www.intechopen.com

Natural Gas302
Fig. 16. Injection timings and durations
3.2.1 Engine performance The outcomes of experimental investigation are shown in Fig. 17 through Fig. 20. In Fig. 17 and Fig. 18, indicated power and indicated mean effective pressure are plotted against injection timings at 1100 rpm engine speed. The graphs show variation in performance at different start of injection timings. When SOI is earlier than 180oBTDC, both power and MEP are the lowest. The best performance was achieved at SOI of 190oBTDC.
Fig. 17. Indicated power at various injection timings
Fig. 18. Indicated Mean Effective Pressure at various injection timings
Fig. 19. Volumetric efficiency at various injection timings
Fig. 20. Fuel conversion efficiency at various injection timings
0
2
4
6
8
10
12
14
16
0 60 120 180 240 300 360 420 480 540 600 660 720
Cylin
der p
ressure, bar
Crank angle
Non‐fired cylinder pressure
160 ATDC inj
170 ATDC inj
180 ATDC inj
190 ATDC inj
200 ATDC inj
IVC
1.5
2
2.5
3
3.5
150 160 170 180 190 200 210 220
Indicated po
wer [kW]
Start of injection, [oCA ATDC]
2
3
4
5
6
7
8
150 160 170 180 190 200 210 220
IMEP
[bar]
Start of injection, oCA ATDC
7576777879808182838485
150 160 170 180 190 200 210 220
Volumetric efficien
cy [%
]
Start of injection, oCA ATDC
14
16
18
20
22
24
26
150 160 170 180 190 200 210 220
Fuel con
version efficien
cy [%
]
Start of injection, [oCA ATDC]
Fig. 19 shows the volumetric efficiencies are in the excess of 80%, which is significantly high compared to port injection operations. This proved that direct fuel injection using SPFI increases engine ability to inhale more air and as a result, increases the heating value of cylinder charge per engine cycle. Again, the highest volumetric efficiency was achieved at 190oBTDC SOI timing. In terms of fuel conversion efficiency, as shown in Fig. 20, the same pattern as in power and MEP results is shown with the most efficient outcome was achieved at 190oBTDC. SPFI direct injection operation is very sensitive towards injection timing and for any particular engine speed, a proper calibration of SOI timing must be done to get the optimal performance. Ths results are consistent with the findings by Huang et al. (2003) and Zeng et al. (2006). Table 2 list the comparison of engine performance for the same engine running with different fuel delivery techniques when fuelled with natural gas. In terms of performance (MEP), port injection shows highest results but SPFI betters in terms of volumetric efficiency. Gas mixer (carburetor) operation yielded lowest output in most sectors. The reason for lower performance was due to the fact that SPFI direct injection is not operating at its best engine parameter which should include higher compression ratio and a flow-guided piston crown cavity. Also the air-fuel mixing in the SPFI direct injection operation is subjected to spatial and durational limitation.
Operation
Gas mixer
(Simms, 1994)
Port injection SPFI Direct Injection
MEP, bar 5.52b 6.63i 6.20i ηv, % 82.5 72.35 83.43 ηf, indicated, % 21.3 26.94 21.84 SFC, g/kWh 340b 267.28i 329.67i
Table 2. Engine performance of natural gas operations (subscript i and b are indicated and brake data respectively)
3.2.2 Combustion characteristics Combustion characteristics in terms of cylinder pressure profile, pressure-volume relations and burning rate were studied. Results, as shown in Fig. 21 through Fig. 23 show the comparison between port injection and SPFI direct injection. In Fig. 21, the pressures versus cylinder volume were plotted. The performance of engine is measured by the area enclosed by the curves, the SPDI operation results in higher peak pressure but smaller area enclosed depicting inferior performance. The importance of peak pressure is most in its location with respect to top dead center (TDC). In Fig. 22, it shows that SPFI operation yields earlier and higher peak pressure as compared to port injection. However, as the combustion proceeds 30oCA ATDC (i.e. 390o ATDC), the cylinder pressure falls below the one of port injection which actually results in slightly lower performance. This was believed due to the weakness in air0-fuel mixing. The major advantage of SPFI direct injection operation is its burning rate characteristics as shown in Fig. 23. Combustion duration in SPFI direct injection operation is shorter than the one of port injection. However, combustion in SPFI direct injection is slower at the earlier
www.intechopen.com

Compressed natural gas direct injection (spark plug fuel injector) 303
Fig. 16. Injection timings and durations
3.2.1 Engine performance The outcomes of experimental investigation are shown in Fig. 17 through Fig. 20. In Fig. 17 and Fig. 18, indicated power and indicated mean effective pressure are plotted against injection timings at 1100 rpm engine speed. The graphs show variation in performance at different start of injection timings. When SOI is earlier than 180oBTDC, both power and MEP are the lowest. The best performance was achieved at SOI of 190oBTDC.
Fig. 17. Indicated power at various injection timings
Fig. 18. Indicated Mean Effective Pressure at various injection timings
Fig. 19. Volumetric efficiency at various injection timings
Fig. 20. Fuel conversion efficiency at various injection timings
0
2
4
6
8
10
12
14
16
0 60 120 180 240 300 360 420 480 540 600 660 720
Cylin
der p
ressure, bar
Crank angle
Non‐fired cylinder pressure
160 ATDC inj
170 ATDC inj
180 ATDC inj
190 ATDC inj
200 ATDC inj
IVC
1.5
2
2.5
3
3.5
150 160 170 180 190 200 210 220
Indicated po
wer [kW]
Start of injection, [oCA ATDC]
2
3
4
5
6
7
8
150 160 170 180 190 200 210 220
IMEP
[bar]
Start of injection, oCA ATDC
7576777879808182838485
150 160 170 180 190 200 210 220
Volumetric efficien
cy [%
]
Start of injection, oCA ATDC
14
16
18
20
22
24
26
150 160 170 180 190 200 210 220
Fuel con
version efficien
cy [%
]
Start of injection, [oCA ATDC]
Fig. 19 shows the volumetric efficiencies are in the excess of 80%, which is significantly high compared to port injection operations. This proved that direct fuel injection using SPFI increases engine ability to inhale more air and as a result, increases the heating value of cylinder charge per engine cycle. Again, the highest volumetric efficiency was achieved at 190oBTDC SOI timing. In terms of fuel conversion efficiency, as shown in Fig. 20, the same pattern as in power and MEP results is shown with the most efficient outcome was achieved at 190oBTDC. SPFI direct injection operation is very sensitive towards injection timing and for any particular engine speed, a proper calibration of SOI timing must be done to get the optimal performance. Ths results are consistent with the findings by Huang et al. (2003) and Zeng et al. (2006). Table 2 list the comparison of engine performance for the same engine running with different fuel delivery techniques when fuelled with natural gas. In terms of performance (MEP), port injection shows highest results but SPFI betters in terms of volumetric efficiency. Gas mixer (carburetor) operation yielded lowest output in most sectors. The reason for lower performance was due to the fact that SPFI direct injection is not operating at its best engine parameter which should include higher compression ratio and a flow-guided piston crown cavity. Also the air-fuel mixing in the SPFI direct injection operation is subjected to spatial and durational limitation.
Operation
Gas mixer
(Simms, 1994)
Port injection SPFI Direct Injection
MEP, bar 5.52b 6.63i 6.20i ηv, % 82.5 72.35 83.43 ηf, indicated, % 21.3 26.94 21.84 SFC, g/kWh 340b 267.28i 329.67i
Table 2. Engine performance of natural gas operations (subscript i and b are indicated and brake data respectively)
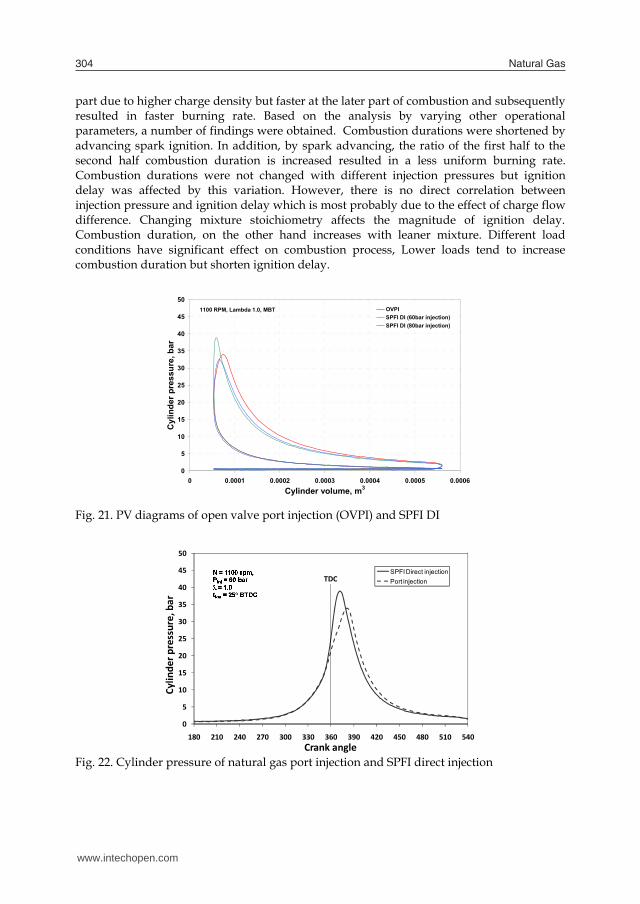
3.2.2 Combustion characteristics Combustion characteristics in terms of cylinder pressure profile, pressure-volume relations and burning rate were studied. Results, as shown in Fig. 21 through Fig. 23 show the comparison between port injection and SPFI direct injection. In Fig. 21, the pressures versus cylinder volume were plotted. The performance of engine is measured by the area enclosed by the curves, the SPDI operation results in higher peak pressure but smaller area enclosed depicting inferior performance. The importance of peak pressure is most in its location with respect to top dead center (TDC). In Fig. 22, it shows that SPFI operation yields earlier and higher peak pressure as compared to port injection. However, as the combustion proceeds 30oCA ATDC (i.e. 390o ATDC), the cylinder pressure falls below the one of port injection which actually results in slightly lower performance. This was believed due to the weakness in air0-fuel mixing. The major advantage of SPFI direct injection operation is its burning rate characteristics as shown in Fig. 23. Combustion duration in SPFI direct injection operation is shorter than the one of port injection. However, combustion in SPFI direct injection is slower at the earlier
www.intechopen.com
Natural Gas304
part due to higher charge density but faster at the later part of combustion and subsequently resulted in faster burning rate. Based on the analysis by varying other operational parameters, a number of findings were obtained. Combustion durations were shortened by advancing spark ignition. In addition, by spark advancing, the ratio of the first half to the second half combustion duration is increased resulted in a less uniform burning rate. Combustion durations were not changed with different injection pressures but ignition delay was affected by this variation. However, there is no direct correlation between injection pressure and ignition delay which is most probably due to the effect of charge flow difference. Changing mixture stoichiometry affects the magnitude of ignition delay. Combustion duration, on the other hand increases with leaner mixture. Different load conditions have significant effect on combustion process, Lower loads tend to increase combustion duration but shorten ignition delay.
Fig. 21. PV diagrams of open valve port injection (OVPI) and SPFI DI
Fig. 22. Cylinder pressure of natural gas port injection and SPFI direct injection
1100 RPM, Lambda 1.0, MBT
0
5
10
15
20
25
30
35
40
45
50
0 0.0001 0.0002 0.0003 0.0004 0.0005 0.0006Cylinder volume, m3
Cyl
inde
r pre
ssur
e, b
ar
OVPISPFI DI (60bar injection)SPFI DI (80bar injection)
0
5
10
15
20
25
30
35
40
45
50
180 210 240 270 300 330 360 390 420 450 480 510 540
Cylin
der p
ressure, bar
Crank angle
SPFI Direct injectionPort injectionTDC
Fig. 23. Normalized mass burnt fraction of natural gas port injection and SPFI direct injection
4. Conclusion
Compressed natural gas direct injection can offer many advantages over port fuel injection but to achieve it requires costly and technically difficult modification to engine structure especially due to the need for extra hole for fuel injector. SPFI offer a simple solution for this. Investigations on injection process and experimental engine performance were carried out on a single cylinder engine. The most immediate effect of installation of SPFI on the Ricardo E6 engine is the reduction of motorized engine cylinder peak pressure due to decrease in compression ratio. Engine experiments were carried out to measure the indicated performance of SPFI direct injection. The engine was run at 1100 rpm and various other operating parameters were varied. The results were compared to the ones from optimally calibrated port injection. At the specified speed, results show that SPFI direct injection performance is slightly lower than those of port injection even though volumetric efficiency is significantly increased. This was mainly because of spatial and temporal limitations in direct injection operation which lead to weak air-fuel mixing as a result of the absence of mixing enhancing geometry within the disk-shaped cylinder. Furthermore, because natural gas is injected away from spark plug electrode, at the time of ignition, the stoichiometry of cylinder charge at the vicinity of spark plug and other areas may not be at optimal conditions. Combustion of methane direct injection has been shown to be faster than of port injection. However, the initial part of combustion is relatively slower in direct injection. This implies the presence of charge stratification. The combustion behavior and indicated performance show that combustion of SPFI direct injection is easily controlled and in good agreement with the data from available literature. Images from PLIF flow visualization from SPFI injection nozzle show narrow gas jets with 9o cone angle and a depth of penetration of 90-100 mm. SPFI methane direct injection is practical, viable and easy way for natural gas conversion but further improvement on its design is required particularly to improve fuel spray to achieve better air-fuel mixing.
0
0.1
0.2
0.3
0.4
0.5
0.6
0.7
0.8
0.9
1
330 335 340 345 350 355 360 365 370 375 380 385 390
Mass bu
rnt fraction, x
b
Crank angle
SPFI Direct injection
Port injection
TDC
www.intechopen.com

Compressed natural gas direct injection (spark plug fuel injector) 305
part due to higher charge density but faster at the later part of combustion and subsequently resulted in faster burning rate. Based on the analysis by varying other operational parameters, a number of findings were obtained. Combustion durations were shortened by advancing spark ignition. In addition, by spark advancing, the ratio of the first half to the second half combustion duration is increased resulted in a less uniform burning rate. Combustion durations were not changed with different injection pressures but ignition delay was affected by this variation. However, there is no direct correlation between injection pressure and ignition delay which is most probably due to the effect of charge flow difference. Changing mixture stoichiometry affects the magnitude of ignition delay. Combustion duration, on the other hand increases with leaner mixture. Different load conditions have significant effect on combustion process, Lower loads tend to increase combustion duration but shorten ignition delay.
Fig. 21. PV diagrams of open valve port injection (OVPI) and SPFI DI
Fig. 22. Cylinder pressure of natural gas port injection and SPFI direct injection
1100 RPM, Lambda 1.0, MBT
0
5
10
15
20
25
30
35
40
45
50
0 0.0001 0.0002 0.0003 0.0004 0.0005 0.0006Cylinder volume, m3
Cyl
inde
r pre
ssur
e, b
ar
OVPISPFI DI (60bar injection)SPFI DI (80bar injection)
0
5
10
15
20
25
30
35
40
45
50
180 210 240 270 300 330 360 390 420 450 480 510 540
Cylin
der p
ressure, bar
Crank angle
SPFI Direct injectionPort injectionTDC
Fig. 23. Normalized mass burnt fraction of natural gas port injection and SPFI direct injection
4. Conclusion
Compressed natural gas direct injection can offer many advantages over port fuel injection but to achieve it requires costly and technically difficult modification to engine structure especially due to the need for extra hole for fuel injector. SPFI offer a simple solution for this. Investigations on injection process and experimental engine performance were carried out on a single cylinder engine. The most immediate effect of installation of SPFI on the Ricardo E6 engine is the reduction of motorized engine cylinder peak pressure due to decrease in compression ratio. Engine experiments were carried out to measure the indicated performance of SPFI direct injection. The engine was run at 1100 rpm and various other operating parameters were varied. The results were compared to the ones from optimally calibrated port injection. At the specified speed, results show that SPFI direct injection performance is slightly lower than those of port injection even though volumetric efficiency is significantly increased. This was mainly because of spatial and temporal limitations in direct injection operation which lead to weak air-fuel mixing as a result of the absence of mixing enhancing geometry within the disk-shaped cylinder. Furthermore, because natural gas is injected away from spark plug electrode, at the time of ignition, the stoichiometry of cylinder charge at the vicinity of spark plug and other areas may not be at optimal conditions. Combustion of methane direct injection has been shown to be faster than of port injection. However, the initial part of combustion is relatively slower in direct injection. This implies the presence of charge stratification. The combustion behavior and indicated performance show that combustion of SPFI direct injection is easily controlled and in good agreement with the data from available literature. Images from PLIF flow visualization from SPFI injection nozzle show narrow gas jets with 9o cone angle and a depth of penetration of 90-100 mm. SPFI methane direct injection is practical, viable and easy way for natural gas conversion but further improvement on its design is required particularly to improve fuel spray to achieve better air-fuel mixing.
0
0.1
0.2
0.3
0.4
0.5
0.6
0.7
0.8
0.9
1
330 335 340 345 350 355 360 365 370 375 380 385 390
Mass bu
rnt fraction, x
b
Crank angle
SPFI Direct injection
Port injection
TDC
www.intechopen.com
Natural Gas306
5. References
Boyan, X. & Furuyama, M. (1998). Jet Characteristics of CNG Injector with MPI system. JSAE Review, Vol. 19, 229-234.
Bradley, D.; Gaskell, P.H. & Gu, X.J. (1996). Burning Velocities, Markstein Lengths, and Flame Quenching for Spherical Methane-Air Flames: A Computational Study. Combustion and Flame, Vol. 104, 176-198.
Huang, Z.; Shiga, S.; Ueda, T.; Nakamura, H.; Ishima, T.; Obokata, T.; Tsue, M. & Kono, M. (2003). Combustion Characteristics of Natural-gas Direct-injection Combustion under Various Fuel Injection timings. Proceeding Institute of Mechanical Engineers (Part D): Journal of Automobile Engineering, Vol. 21, 393 – 401.
Mohamad, T I; Harrison, M.; Jermy, M. & How, H.G. (2010). The Structure of High Pressure Gas Jet from Spark Plug Fuel Injector for Direct Fuel Injection in Spark Ignition Engine. Journal of Visualization , Vol. 13, No. 2, 121-131.
Mohamad, T.I.; Harrison, M.; Jermy, M.; Theodoridis, E. & Dolinar, A. (2005). Preliminary Investigation of the Combustion and Performance of Methane Direct Injection in a Single-Cylinder Engine Using Spark Plug Fuel Injector (SPFI) for Low Cost Conversion, in the Proceedings of the ATCi 2005, Conference on Automotive Technology, Dec 6-8, Putrajaya, Malaysia.
Morita, K. (2003). Automotive power source in 21st century. JSAE Review, Vol. 24, 3-7. Risi, A.D.; Gajdeczko, B.F. & Bracco, F.V. (1997). A study of H2, CH4, C2H6 mixing and
combustion in a Direct-injection Stratified-Charge engine. SAE Paper 971710. Stan, C. (2002). Direct Injection Systems: The Next Decade in Engine Technology, SAE
International, Warrendale, PA. Vourenkoski, A.K. (2004). Development of a Liquid-phase LPG MPI Conversion System, PhD
Thesis, Cranfield University, Cranfield. Zeng, K.; Huang, Z.; Liu, B.; Liu, L.; Jiang, D.; Ren, Y. & Wang, J. (2006). Combustion
Characteristics of a Direct Injection Natural Gas Engine under various Fuel Injection Timings. Applied Thermal Engineering, Vol. 26, 806-813.
Zhao, F. et al. (1999). Automotive spark-ignited direct injection gasoline engines. Progress in Energy and Combustion Science, Vol. 25, 437-562.
Zhao, F.; Harrington, D.L. & Lai, M.C. (2002). Automotive Gasoline Direct-Injection Engines, SAE International, Warrendale, PA.
www.intechopen.com
Natural GasEdited by Primož PotoÄÂnik
ISBN 978-953-307-112-1Hard cover, 606 pagesPublisher SciyoPublished online 18, August, 2010Published in print edition August, 2010
InTech EuropeUniversity Campus STeP Ri Slavka Krautzeka 83/A 51000 Rijeka, Croatia Phone: +385 (51) 770 447 Fax: +385 (51) 686 166www.intechopen.com
InTech ChinaUnit 405, Office Block, Hotel Equatorial Shanghai No.65, Yan An Road (West), Shanghai, 200040, China Phone: +86-21-62489820 Fax: +86-21-62489821
The contributions in this book present an overview of cutting edge research on natural gas which is a vitalcomponent of world's supply of energy. Natural gas is a combustible mixture of hydrocarbon gases, primarilymethane but also heavier gaseous hydrocarbons such as ethane, propane and butane. Unlike other fossilfuels, natural gas is clean burning and emits lower levels of potentially harmful by-products into the air.Therefore, it is considered as one of the cleanest, safest, and most useful of all energy sources applied invariety of residential, commercial and industrial fields. The book is organized in 25 chapters that cover variousaspects of natural gas research: technology, applications, forecasting, numerical simulations, transport andrisk assessment.
How to referenceIn order to correctly reference this scholarly work, feel free to copy and paste the following:
Taib Iskandar Mohamad (2010). Compressed Natural Gas Direct Injection (Spark Plug Fuel Injector), NaturalGas, Primož PotoÄÂnik (Ed.), ISBN: 978-953-307-112-1, InTech, Available from:http://www.intechopen.com/books/natural-gas/compressed-natural-gas-direct-injection-spark-plug-fuel-injector-

© 2010 The Author(s). Licensee IntechOpen. This chapter is distributedunder the terms of the Creative Commons Attribution-NonCommercial-ShareAlike-3.0 License, which permits use, distribution and reproduction fornon-commercial purposes, provided the original is properly cited andderivative works building on this content are distributed under the samelicense.
Related Documents