ANNEX Table 1 Background characteristics of rickshaw pullers Table 2 Distribution of rickshaw pullers by home district Table 3 Previous residence and current living arrangements of rickshaw pullers Table 4 Housing condition of rickshaw pullers Table 5 Basic amenities and selected items possessed by the households Table 6 Occupational background of rickshaw pullers Table 7 Demographic background of rickshaw pullers Table 8 Characteristics of living children Table 9 Proportion of school-age children (5- 15) currently attending school Table10 School attendance and employment rate among children aged 5-15 Table 11 Employment status and occupation of children Table 12 Information relating to deceased children Table 13 Cause of child death by age at death Table 14 Characteristics of rickshaw pulling Table 15 Characteristics of rickshaw pulling by duration of occupation controlling for the age of rickshaw puller Table 16 Reason(s) for accepting rickshaw pulling work, and for working greater or fewer hours or days Table 17 Reason(s) for former rickshaw puller abandoning rickshaw pulling Table 18 Main or major problem of rickshaw pulling Table 19 Monthly household income of current rickshaw pullers by income source and duration of rickshaw pulling Table 20 Monthly household income of current and former rickshaw pullers, by income source and age group Table 21 Household income and expenditure of former rickshaw pullers, by duration of rickshaw pulling Table 22 Relative income of former rickshaw pullers from first occupation after abandoning rickshaw pulling Table 23 Poverty levels among current rickshaw pullers, by duration of rickshaw pulling Table 24 Poverty levels among former rickshaw pullers, by duration of rickshaw pulling Table 25 Poverty levels among current and former rickshaw pullers, by age group Table 26 Current occupation of former rickshaw pullers, by age group Table 27 Reasons for abandoning rickshaw pulling by former rickshaw puller, by age group Table 28 Monthly expenses of rickshaw pullers’ households Table 29 How rickshaw pullers spend leisure time Table 30 Indicators of well-being of rickshaw pullers Table 31 Average value of savings and assets of rickshaw pullers Table 32 Type of assets acquired by rickshaw pullers Table 33 Information on credit access and outstanding loans of rickshaw pullers Table 34 Crises faced by sample rickshaw pullers during the last five years Table 35 Health status of rickshaw pullers, by age group Table 36 Patterns of illnesses of rickshaw pullers Table 37 Prevalence of chronic/long-term ill- health among rickshaw pullers Table 38 Treatment of illness Table 39 Reason(s) for not receiving treatment, or receiving inadequate treatment, for acute illness Table 40 Cost of illness, financing of the cost and impact of major ailments Table 41 Distribution of rickshaw pullers who have suffered ill-health, by health care cost

Welcome message from author
This document is posted to help you gain knowledge. Please leave a comment to let me know what you think about it! Share it to your friends and learn new things together.
Transcript

ANNEX Table 1 Background characteristics of rickshaw pullers
Table 2 Distribution of rickshaw pullers by home district
Table 3 Previous residence and current living arrangements of rickshaw pullers
Table 4 Housing condition of rickshaw pullers
Table 5 Basic amenities and selected items possessed by the households
Table 6 Occupational background of rickshaw pullers
Table 7 Demographic background of rickshaw pullers
Table 8 Characteristics of living children
Table 9 Proportion of school-age children (5-15) currently attending school
Table10 School attendance and employment rate among children aged 5-15
Table 11 Employment status and occupation of children
Table 12 Information relating to deceased children
Table 13 Cause of child death by age at death
Table 14 Characteristics of rickshaw pulling
Table 15 Characteristics of rickshaw pulling by duration of occupation controlling for the age of rickshaw puller
Table 16 Reason(s) for accepting rickshaw pulling work, and for working greater or fewer hours or days
Table 17 Reason(s) for former rickshaw puller abandoning rickshaw pulling
Table 18 Main or major problem of rickshaw pulling
Table 19 Monthly household income of current rickshaw pullers by income source and duration of rickshaw pulling
Table 20 Monthly household income of current and former rickshaw pullers, by income source and age group
Table 21 Household income and expenditure of former rickshaw pullers, by duration of rickshaw pulling
Table 22 Relative income of former rickshaw pullers from first occupation after abandoning rickshaw pulling
Table 23 Poverty levels among current rickshaw pullers, by duration of rickshaw pulling
Table 24 Poverty levels among former rickshaw pullers, by duration of rickshaw pulling
Table 25 Poverty levels among current and former rickshaw pullers, by age group
Table 26 Current occupation of former rickshaw pullers, by age group
Table 27 Reasons for abandoning rickshaw pulling by former rickshaw puller, by age group
Table 28 Monthly expenses of rickshaw pullers’ households
Table 29 How rickshaw pullers spend leisure time
Table 30 Indicators of well-being of rickshaw pullers
Table 31 Average value of savings and assets of rickshaw pullers
Table 32 Type of assets acquired by rickshaw pullers
Table 33 Information on credit access and outstanding loans of rickshaw pullers
Table 34 Crises faced by sample rickshaw pullers during the last five years
Table 35 Health status of rickshaw pullers, by age group
Table 36 Patterns of illnesses of rickshaw pullers
Table 37 Prevalence of chronic/long-term ill-health among rickshaw pullers
Table 38 Treatment of illness
Table 39 Reason(s) for not receiving treatment, or receiving inadequate treatment, for acute illness
Table 40 Cost of illness, financing of the cost and impact of major ailments
Table 41 Distribution of rickshaw pullers who have suffered ill-health, by health care cost

Unsustainable Livelihoods (Begum and Sen) ANNEX
27
Table 1: Background characteristics of rickshaw pullers (% unless otherwise specified)
Duration of rickshaw pulling (in years) Characteristics
<5 5-14 15+ Total Average Age (years) 31.3 36.5 48.3 37.9 Marital Status
Unmarried 23.7 10.0 - 10.9 Married 76.3 89.1 94.4 87.3 Widowed/Divorced - 0.9 5.6 1.7
Education Uneducated 43.8 59.6 67.0 57.7 Primary incomplete 22.2 16.9 15.9 17.4 Primary complete 9.0 9.3 8.0 9.0 Secondary and above 23.6 12.0 6.8 13.4 SSC and above 3.4 2.2 2.3 2.5
Ownership of cultivable land None 43.8 63.6 75.0 61.7 1-49 decimals 19.1 24.0 19.0 21.9 50-99 decimals 16.9 8.4 3.4 9.2 100+ decimals 20.2 4.0 2.3 7.2
Ownership of house in village Yes 100.0 83.6 65.9 83.3 No - 16.4 34.1 16.7
Ownership of house in Dhaka Yes - 1.3 - 0.7 No 100.0 98.7 100.0 99.3
Wife’s work status (restricted to married rickshaw pullers only) Does not work 95.5 78.1 74.7 80.6 Works as domestic 1.5 4.5 14.5 6.0 Garment worker - 13.9 9.6 10.5 Other 3.0 3.5 1.2 2.9
Table 2: Distribution of rickshaw pullers by home district (%)
District Proportion of rickshaw pullers from district
Mymensingh 21.4 Rangpur 15.3 Barisal 15.0 Faridpur 7.8 Bagura 7.2 Dhaka 6.1 Dinajpur 5.3 Comilla 5.3 Rajshahi 3.9
District Proportion of rickshaw pullers from district
Khulna 3.6 Jessore 2.5 Noakhali 2.2 Tangail 1.4 Kushtia 0.6 Sylhet 0.6
N = 360

Unsustainable Livelihoods (Begum and Sen) ANNEX
28
Table 3: Previous residence and current living arrangements of rickshaw pullers (% unless otherwise specified)
Duration of rickshaw pulling (years)
<5 5-14 15+ Total Previous place of residence
Village 100.0 89.1 84.2 90.5 Upazila - 0.7 2.2 2.0 District - 3.2 7.9 3.5 Metropolitan city/other - 5.0 5.6 4.0
Duration of living in Dhaka (years) <5 86.5 5.3 - 22.1 5-9 11.2 64.9 9.0 40.8 10-19 2.2 22.2 30.3 19.4 20+ - 7.6 60.7 17.6 Mean duration 3.3 9.3 22.9 10.9
Living arrangement (restricted to married rickshaw pullers only) Live with family 43.8 58.2 85.2 60.9 Live with others 56.2 41.8 14.8 39.1
Ownership of current residence Rented house 61.3 81.4 92.1 79.1 Other non-paying arrangement 38.7 18.6 7.9 20.9
Table 4: Housing condition of rickshaw pullers (% unless otherwise specified)
Duration of rickshaw pulling (years) <5 5-14 15+ Total
Number of living room(s) in the house (for those living with family) 1 97.4 93.9 89.3 93.1 2+ 2.6 6.1 10.6 6.9
Density (people per living room) Live with family 3.8 4.2 4.8 4.3 Live with others 17.8 14.8 17.1 16.0 All 11.6 8.7 6.6 8.9
Material of roof (of those living with family) Brick 2.6 4.6 2.7 3.7 Tin 97.4 93.1 96.0 94.7 Bamboo/polythene etc. - 2.3 1.3 1.6
Material of walls Brick 69.2 32.8 36.0 39.6 Tin 25.6 29.8 14.7 24.5 Bamboo/polythene etc. 5.1 37.4 49.3 35.9
Unsustainable Livelihoods (Begum and Sen) ANNEX
29
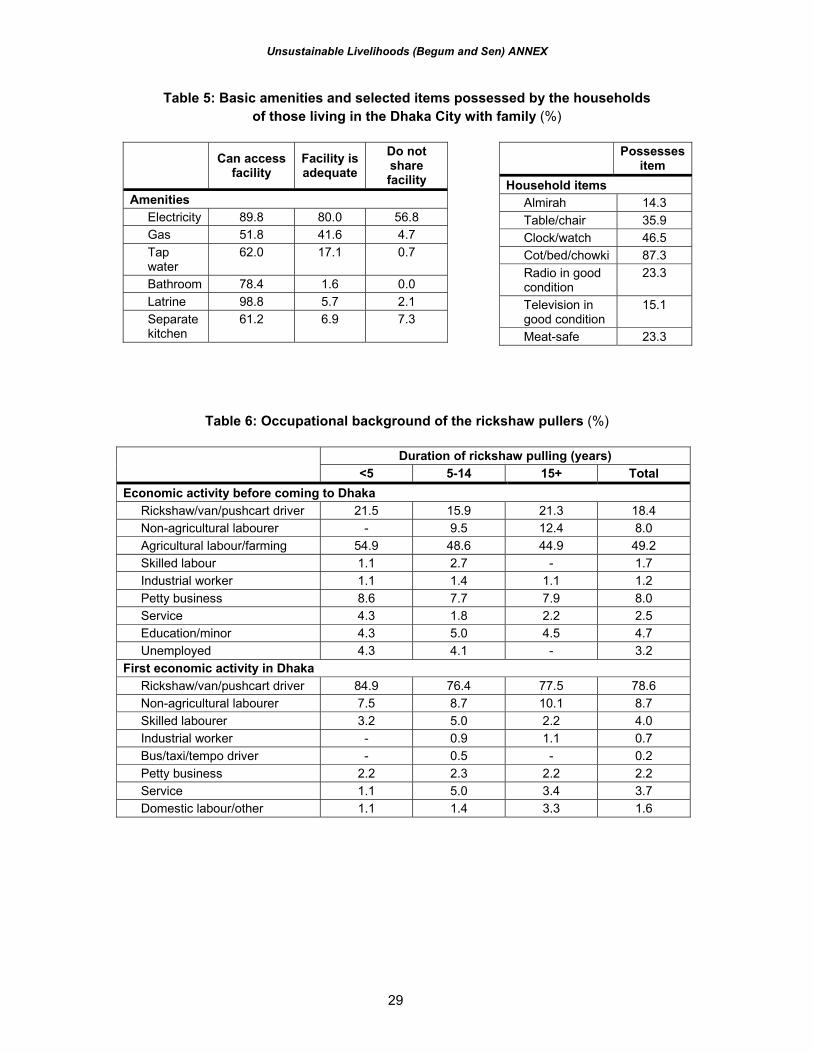
Table 5: Basic amenities and selected items possessed by the households of those living in the Dhaka City with family (%)
Can access facility
Facility is adequate
Do not share facility
Amenities Electricity 89.8 80.0 56.8 Gas 51.8 41.6 4.7 Tap water
62.0 17.1 0.7
Bathroom 78.4 1.6 0.0 Latrine 98.8 5.7 2.1 Separate kitchen
61.2 6.9 7.3
Possesses item
Household items Almirah 14.3 Table/chair 35.9 Clock/watch 46.5 Cot/bed/chowki 87.3 Radio in good condition
23.3
Television in good condition
15.1
Meat-safe 23.3
Table 6: Occupational background of the rickshaw pullers (%)
Duration of rickshaw pulling (years) <5 5-14 15+ Total
Economic activity before coming to Dhaka Rickshaw/van/pushcart driver 21.5 15.9 21.3 18.4 Non-agricultural labourer - 9.5 12.4 8.0 Agricultural labour/farming 54.9 48.6 44.9 49.2 Skilled labour 1.1 2.7 - 1.7 Industrial worker 1.1 1.4 1.1 1.2 Petty business 8.6 7.7 7.9 8.0 Service 4.3 1.8 2.2 2.5 Education/minor 4.3 5.0 4.5 4.7 Unemployed 4.3 4.1 - 3.2
First economic activity in Dhaka Rickshaw/van/pushcart driver 84.9 76.4 77.5 78.6 Non-agricultural labourer 7.5 8.7 10.1 8.7 Skilled labourer 3.2 5.0 2.2 4.0 Industrial worker - 0.9 1.1 0.7 Bus/taxi/tempo driver - 0.5 - 0.2 Petty business 2.2 2.3 2.2 2.2 Service 1.1 5.0 3.4 3.7 Domestic labour/other 1.1 1.4 3.3 1.6

Unsustainable Livelihoods (Begum and Sen) ANNEX
30
Table 7: Demographic background of the rickshaw pullers (eve-married rickshaw pullers only) (% unless otherwise specified)
Duration of rickshaw pulling (years)
<5 5-14 15+ Total Proportion became father 78.9 95.5 98.9 93.0 Number of living children
0 22.4 4.5 - 6.8 1 20.9 19.4 6.0 16.5 2 25.4 22.9 9.6 20.2 3 17.9 19.9 19.3 19.4 4 4.5 13.4 19.3 13.1 5+ 9.0 19.9 45.8 23.9
Children born alive (mean #) 2.18 2.97 4.51 3.20 Children surviving 1.93 2.51 3.73 2.70 Children dead 0.25 0.47 0.78 0.50
Proportion of children died 11 16 17 16 Proportion experienced child death
16 29 43 31
Household size (for those living with family in Dhaka)
3.89 4.25 5.24 4.50
Average number supported by rickshaw puller
4.44 4.80 5.44 4.94
Table 8: Characteristics of living children (%)
Age 0-4 19.9 5-9 27.9 10-14 22.3 15-19 14.7 20-34 13.8 35+ 1.3
Sex Boy 47.5 Girl 52.5
Education (# years, for those 5+ years old ) 0 33.4 (55.1) 1-4 42.6 (15.7) 5 13.2 (15.0) 6-10 9.8 (11.5) SSC and above 1.0 (2.7)
Marital status Unmarried 84.6 Married 15.3 Widowed/divorced 0.1
Note: Figures in parentheses refer to children aged 20+.

Unsustainable Livelihoods (Begum and Sen) ANNEX
31
Table 9: Proportion of school-age children (5-15) currently attending school
Rickshaw pullers’ work characteristics
Family lives in Dhaka
Family lives in village
Children of all
rickshaw pullers
Daily attendance Full day 64.2 71.9 67.1 Half day 45.5 80.8 52.2
Year-round attendance Whole year 57.7 70.6 61.9 Seasonal/ occasional
77.8 94.7 89.0
Weekly attendance <6 days 48.9 92.3 58.3 6 days 64.5 66.7 65.4 7 days 58.1 74.1 63.2
Rickshaw pullers’ work characteristics
Family lives in Dhaka
Family lives in village
Children of all
rickshaw pullers
Hours spent in a day in rickshaw pulling < 8 41.1 76.9 47.6 8-9 58.8 74.3 62.8 10+ 64.4 72.6 67.8
Age of rickshaw puller < 30 50.0 57.1 54.5* 30-44 64.4 76.5 68.7 45+ 48.5 67.4 53.4
All 58.2 73.3 63.4
* In total, only 11 children are in this group.
Table10: School attendance and employment rate among children aged 5-15 (%)
Proportion employed Proportion attending school Regularly Irregularly
Living arrangements Live in Dhaka City 58.9 8.2 2.3 Live elsewhere 72.6 2.8 0.6
Duration of rickshaw pulling (years) < 5 88.9 - - 5-14 63.5 6.4 1.0 15+ 52.5 9.9 3.7
All 63.4 6.7 1.7
Unsustainable Livelihoods (Begum and Sen) ANNEX
32
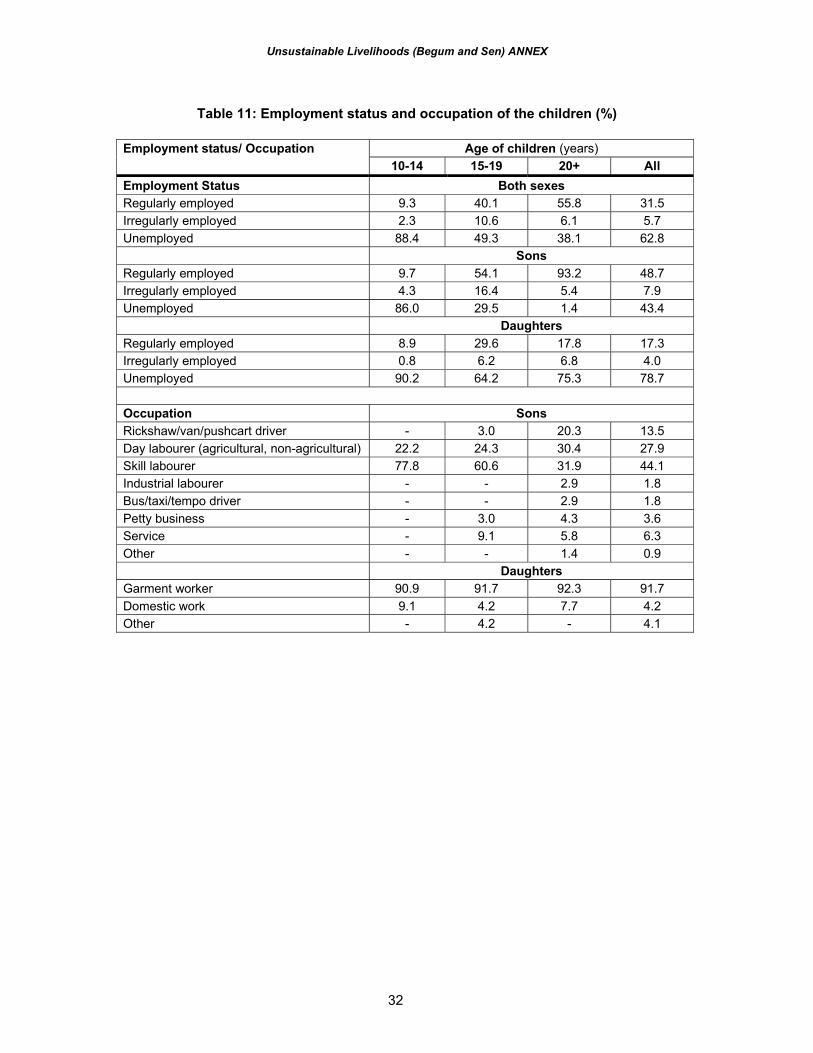
Table 11: Employment status and occupation of the children (%)
Age of children (years) Employment status/ Occupation
10-14 15-19 20+ All Employment Status Both sexes Regularly employed 9.3 40.1 55.8 31.5 Irregularly employed 2.3 10.6 6.1 5.7 Unemployed 88.4 49.3 38.1 62.8 Sons Regularly employed 9.7 54.1 93.2 48.7 Irregularly employed 4.3 16.4 5.4 7.9 Unemployed 86.0 29.5 1.4 43.4 Daughters Regularly employed 8.9 29.6 17.8 17.3 Irregularly employed 0.8 6.2 6.8 4.0 Unemployed 90.2 64.2 75.3 78.7
Occupation Sons Rickshaw/van/pushcart driver - 3.0 20.3 13.5 Day labourer (agricultural, non-agricultural) 22.2 24.3 30.4 27.9 Skill labourer 77.8 60.6 31.9 44.1 Industrial labourer - - 2.9 1.8 Bus/taxi/tempo driver - - 2.9 1.8 Petty business - 3.0 4.3 3.6 Service - 9.1 5.8 6.3 Other - - 1.4 0.9 Daughters Garment worker 90.9 91.7 92.3 91.7 Domestic work 9.1 4.2 7.7 4.2 Other - 4.2 - 4.1

Unsustainable Livelihoods (Begum and Sen) ANNEX
33
Table 12: Information relating to deceased children (%)
Age at death (years) < 1 year 42.9 1-4 34.5 5-14 14.3 15+ 8.4
Sex of the dead child Boy 64.7 Girl 35.3
If treated at the time of death Yes 59.7 No 40.3
Type of treatment received Medical college/other hospitals/institutions
15.5
Private clinic 1.4 Private doctors 29.6 Homeopath 2.8 Hekimi/kabiraji 38.0 Totka/spiritual etc. 12.7
Reason for not treating child at the time of death
Did not think necessary 4.2 Had financial problem 6.2 Child died suddenly 87.5 Other 2.1
Table 13: Cause of child death by age at death
Age at death (years) < 1 1-4 5+ All
Don’t know 31.4 19.5 11.1 22.7 Accident/unfortunate event 2.0 24.4 14.8 12.6 Cold/fever/pneumonia etc. 11.8 19.5 18.5 16.0 Jaundice 2.0 9.8 - 4.2 Diarrhoeal diseases including dysentery 5.9 7.3 25.9 10.9 Tetanus 5.9 2.4 - 3.4 Diphtheria - 4.9 - 1.7 Died soon after birth 11.8 - - 5.0 Supernatural causes 23.5 9.8 25.9 19.3 Other 5.9 2.4 3.7 3.4
N 51 41 27 119

Unsustainable Livelihoods (Begum and Sen) ANNEX
34
Table 14: Characteristics of rickshaw pulling (% unless otherwise specified)
Duration of rickshaw pulling (years)
<5 5-14 15+ Total Average duration of rickshaw pulling (years) 2.5 8.0 23.5 10.1 Ownership of rickshaw
Self 5.4 14.1 18.0 12.9 Mahajan 94.6 85.9 82.0 87.1
Proportion who received training 88.2 23.1 22.7 37.6 Amount of training (days, for those who received training) 1.7 4.7 4.4 3.0 Person provided training
Rickshaw puller’s friend 84.8 88.5 75.0 84.7 Rickshaw owner’s agent 1.3 3.8 10.0 3.3 Other 13.9 7.6 15.0 12.0
Nature of engagement Whole year 77.4 95.0 100.0 92.0 Seasonal 17.2 4.5 - 6.5 Occasional 5.4 0.5 - 1.5
Weekly engagement <= 5 days 11.9 8.6 9.0 9.5 6 days 40.9 23.2 27.0 28.1 7 days 47.3 68.2 64.0 62.4
Daily schedule Whole day (morning until night) 13.5 7.6 12.5 10.0 Full time (morning until evening) 74.2 60.9 48.9 61.2 Half time 12.4 31.6 38.8 28.9
Hours in a day <8 hours 7.5 22.3 23.6 19.2 8-9 hours 4.3 25.5 33.7 22.4 10+ hours 88.2 52.3 42.7 58.7 Average number of hours 9.9 9.3 8.7 9.3
If engaged in other activity Yes 5.4 5.0 6.7 5.5 No 94.6 95.0 93.3 94.5
N 89 225 88 402
Unsustainable Livelihoods (Begum and Sen) ANNEX
35
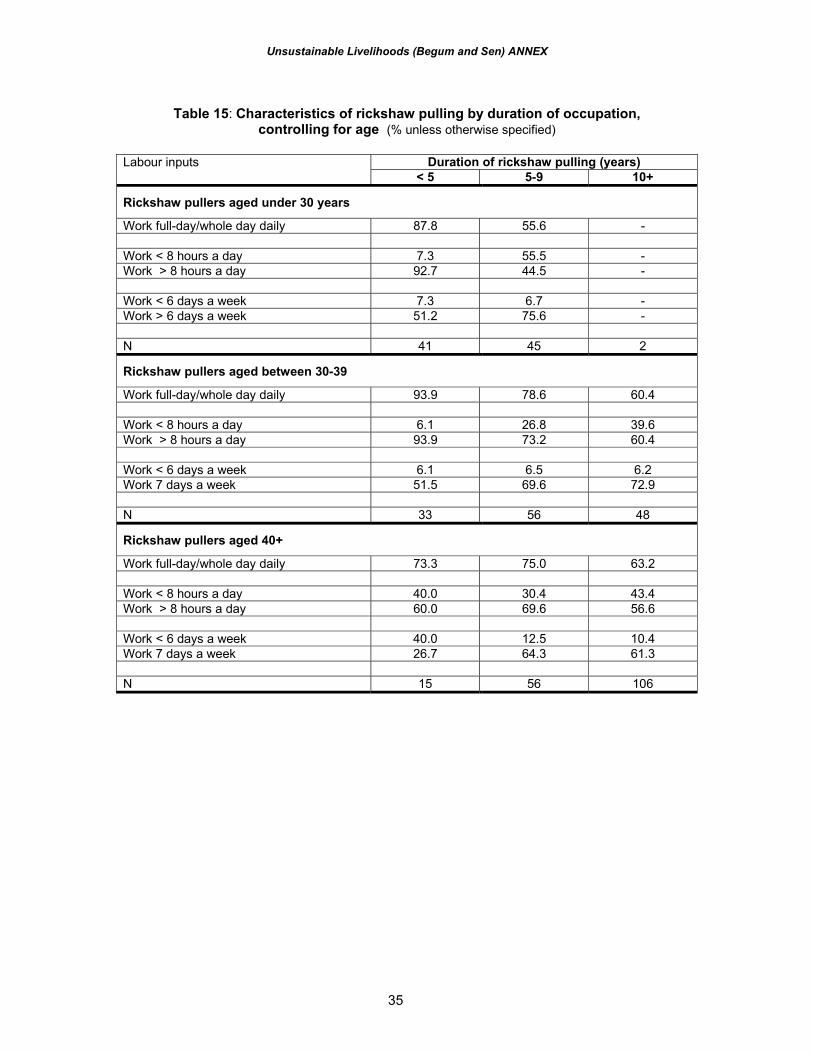
Table 15: Characteristics of rickshaw pulling by duration of occupation,
controlling for age (% unless otherwise specified) Duration of rickshaw pulling (years) Labour inputs
< 5 5-9 10+
Rickshaw pullers aged under 30 years
Work full-day/whole day daily 87.8 55.6 - Work < 8 hours a day 7.3 55.5 - Work > 8 hours a day 92.7 44.5 - Work < 6 days a week 7.3 6.7 - Work > 6 days a week 51.2 75.6 - N 41 45 2
Rickshaw pullers aged between 30-39
Work full-day/whole day daily 93.9 78.6 60.4 Work < 8 hours a day 6.1 26.8 39.6 Work > 8 hours a day 93.9 73.2 60.4 Work < 6 days a week 6.1 6.5 6.2 Work 7 days a week 51.5 69.6 72.9 N 33 56 48
Rickshaw pullers aged 40+
Work full-day/whole day daily 73.3 75.0 63.2 Work < 8 hours a day 40.0 30.4 43.4 Work > 8 hours a day 60.0 69.6 56.6 Work < 6 days a week 40.0 12.5 10.4 Work 7 days a week 26.7 64.3 61.3 N 15 56 106

Unsustainable Livelihoods (Begum and Sen) ANNEX
36
Table 16: Reason(s) of accepting rickshaw pulling work, and for working more or fewer hours/days (%)
Duration of rickshaw pulling (years) Reason for …
<5 5-14 15+ Total Accepting rickshaw pulling work
To earn more money 94.4 41.8 47.7 54.7 For regular income 61.8 70.2 82.9 71.1 Easily available/does not require capital, skill, etc.
25.8 96.9 100.0 82.6
Lost previous job/previous job not satisfactory
24.7 16.4 9.1 16.7
Influence of friend/relatives 38.2 16.0 12.5 20.1 Non-availability of any other job 34.8 25.3 23.5 27.1
Pulling rickshaw every day To meet daily expenses 100.0 100.0 100.0 100.0 To earn more income 59.5 64.7 49.1 60.4 For children’s education 7.1 19.0 30.9 19.6 To save for other work 2.4 4.6 3.6 4.0 For sister’s/daughter’s marriage - 3.9 20.0 6.8 For meeting health expenses of a family member
4.8 0.7 1.8 1.6
Pulling rickshaw only half day No rickshaw available for full day 18.2 12.7 14.7 13.8 Difficult physically 90.9 76.1 88.2 81.0 Other work - 15.5 - 9.5
Pulling rickshaw for fewer than 6 days a week Physical incapacity 90.9 88.9 100.0 94.4 No rickshaw available - 5.6 - 2.8 Other work 9.1 11.1 14.3 11.1
Table 17: Reason(s) of abandoning rickshaw pulling job by former rickshaw pullers (%)
Duration of rickshaw pulling (years)
< 5 5-14 15+ Total Age - 1.7 8.3 2.0 Illness 10.3 8.8 16.7 10.2 Accident 3.4 5.3 8.3 5.1 Physically unsustainable/weakness etc. 72.4 87.7 91.7 83.7 To earn higher income 24.1 15.8 - 16.3 Shortage of rickshaw 3.5 - - 4.1 Other (problems with police/court, road restrictions, etc.)
- 19.3 - 12.2
N 29 57 12 98

Unsustainable Livelihoods (Begum and Sen) ANNEX
37
Table 18: Main or major problem in rickshaw pulling (%)
Duration of rickshaw pulling (years) <5 5-14 15+ Total
Current rickshaw pullers Excessively tiring/strenuous 100.0 65.3 70.5 74.4 Fear of accident 28.1 50.2 37.5 42.5 Theft of rickshaw 22.5 32.4 26.1 28.8 Police etc. 2.2 7.6 12.5 7.5
Duration of rickshaw pulling (years) <5 5-9 10+ Total
Former rickshaw pullers Excessively tiring/strenuous 86.2 97.4 88.9 91.6 Fear of accident 51.7 38.5 40.7 43.2 Theft of rickshaw 55.2 46.2 22.2 42.1 Other 6.9 7.7 18.5 10.5
Table 19: Monthly household income of current rickshaw pullers by income source and duration of rickshaw pulling (%; ever-married, living in Dhaka with family)
Income in taka/duration of rickshaw pulling (years)
< 5 5-14 15+ Total Income from rickshaw pulling 4068 3800 3680 3807 Wife’s income - 396 325 310 Children’s income 53 308 597 358 Land/other asset 39 83 180 107 Income from other family member - 17 - 9
Total 4174 4711 4822 4591 Income per household member 1073 1109 920 1020 Percentage distribution
Income from rickshaw pulling 97.8 80.7 76.3 81.7 Wife’s income - 8.4 6.7 6.7 Children’s income 1.3 6.5 12.4 7.7 Land/other asset 0.9 1.8 3.7 2.3 Income from other family member - 0.4 - 0.2
Total 100.0 100.0 100.0 100.0 Note: Information relates to month prior to data collection.

Unsustainable Livelihoods (Begum and Sen) ANNEX
38
Table 20: Monthly household income of current and former rickshaw pullers, by income source and age group (%; ever-married, living in Dhaka with family)
Income in taka/age group (years)
< 30 30-44 45+ Total Current rickshaw puller Income from rickshaw pulling 3778 3928 3599 3807 Wife’s income 270 340 270 310 Children’s income - 192 764 358 Land/other asset 65 92 148 107 Income from other family member 87 - - 9 Total 4200 4551 4748 4591 Income per household member 1325 1063 894 1020 Former rickshaw puller Own income 2967 4002 2273 3361 Wife’s income 250 393 420 389 Children’s income - 37 791 274 Land/other asset - 134 273 167 Help - - 32 10 Total 3217 4566 3789 4201 Income per household member 919 1069 750 944
Table 21: Household income and expenditure of the former rickshaw pullers, by
duration of rickshaw pulling (%; ever-married, living in Dhaka with family)
Duration of rickshaw pulling (years) before stopping < 5 5-9 10+ 15+ Total
Income Own income 3230 3858 2608 2598 3361 Wife’s income 342 518 221 422 389 Children’s income 38 127 592 556 274 Land/other asset - - 479 - 167 Help - - 29 56 10 Total income 3610 4503 3929 3623 4201 Income per household member 809 1093 800 725 944
Expenditure Food etc. 2200 2397 2635 2389 2475 Housing 661 836 656 444 754 Clothing 108 83 48 22 77 Children’s education 38 61 114 39 76 Travel 35 64 13 - 42 Sent to others 38 49 52 133 54 Loan repayment 17 20 17 44 19 Own treatment 50 32 95 128 57 Treatment of family members 130 35 30 20 52 Other - - 30 - 10 Total expenses 3277 3577 3690 3219 3616 Per capita expenses 735 868 752 645 804 Note: In total, 8 former rickshaw pullers reported no, or no regular, economic activity. Of these, one left rickshaw pulling within under 5 years, 2 left between 5 and 9 years, and 5 after 10 years.

Unsustainable Livelihoods (Begum and Sen) ANNEX
39
Table 22: Relative income of former rickshaw pullers from first occupation after
abandoning rickshaw pulling (%)
Duration of rickshaw pulling (years) < 5 5-9 10+ 15+ Total
More than rickshaw pulling 34.5 47.5 20.8 11.1 36.6 Same as rickshaw pulling 31.0 30.0 41.7 33.3 33.3 Less than rickshaw pulling 34.5 22.5 37.5 55.6 30.3
Table 23: Poverty levels among current rickshaw pullers, by duration of rickshaw pulling (%; ever-married and living in Dhaka with family)
Duration of rickshaw pulling (years)
< 5 5-14 15+ Total Extremely poor* - 2.4 5.3 2.9 Poor 10.5 12.8 21.3 15.1 Non-poor 89.5 84.8 73.3 81.9 * 60% of poverty line
Table 24: Poverty levels among former rickshaw pullers, by duration of rickshaw pulling by them (%; ever-married and living in Dhaka with family)
Duration of rickshaw pulling (years)
< 5 5-9 10+ 15+ Total Extremely poor* 23.1 9.1 8.7 - 11.6 Poor 7.7 9.1 26.1 40.0 14.5 Non-poor 69.2 81.8 65.2 60.0 73.9 * 60% of poverty line
Table 25: Poverty levels among current and former rickshaw pullers, by age group (%; those live in Dhaka with family)
Age group (years) <30 30-44 45+ All
Current rickshaw pullers Extremely poor* 4.3 1.4 5.2 2.9 Poor 8.7 13.0 20.8 15.1 Non-poor 87.0 85.5 74.0 81.9
Former rickshaw pullers Extremely poor* 16.7 9.8 13.6 11.6 Poor 16.7 7.3 27.3 14.5 Non-poor 66.7 82.9 59.1 73.9
* 60% of poverty line

Unsustainable Livelihoods (Begum and Sen) ANNEX
40
Table 26: Current occupation of former rickshaw pullers, by age group (%)
Age group (years) <30 30-44 45+ All
Van driver - 2.0 3.8 2.0 Non-agricultural labourer 36.4 20.0 7.7 20.4 Skilled labourer 18.2 18.0 7.7 15.3 Industrial labour 4.5 - - 1.0 Bus/taxi/tempo Driver 4.5 4.0 - 3.1 Garage owner - 10.0 7.7 7.1 Business/shop 31.8 38.0 34.6 35.7 Service 4.5 4.0 7.7 5.1 Unemployed - 2.0 19.2 5.1 Other/undefined work - 2.0 11.5 5.1
N 22 50 26 98
Table 27: Reasons of abandoning rickshaw pulling by former rickshaw puller by age group (%)
Age of former rickshaw puller (years) < 30 30-44 45+ All
Age - - 7.7 1.0 Illness - 6.0 26.9 10.2 Accident - 4.0 11.5 5.1 Physical unsustainability/exhaustion/weakness etc. 77.3 88.0 80.8 83.7 Higher income 18.2 18.2 11.5 16.3 Shortage of rickshaw etc. 4.5 6.0 - 4.1 Other (problems with police/court, road restrictions, etc.) 26.9 20.0 27.7 19.4
N 22 50 26 98

Unsustainable Livelihoods (Begum and Sen) ANNEX
41
Table 28: Monthly expenses of rickshaw pullers’ households (%; ever-married, living in Dhaka with family)
Expenses in taka/duration of rickshaw pulling (years) < 5 5-14 15+ All
Food etc. 2257 2403 2602 2443 Housing 903 800 1009 883 Clothing 89 135 133 127 Children’s education 103 141 116 127 Travel 53 64 40 55 Entertainment/recreation 3 1 - 1 Sent to family members/relatives 166 139 121 138 Repay loan 13 51 155 78 Rickshaw related (repair etc.) - 21 61 31 Asset acquisition - - 40 13 Addiction - 6 40 16 Own treatment 107 76 102 89 Family members’ treatment 3 90 102 80 Total 3697 3927 4521 4081 Expenses per household member 948 924 863 907 % of total expenses Food etc. 61.0 61.2 57.6 59.9 Housing 24.4 20.4 22.3 21.6 Clothing 2.4 3.4 2.9 3.1 Children’s education 2.8 3.6 2.6 3.1 Travel 1.4 1.6 0.9 1.3 Entertainment/recreation - - - - Sent to family members/relatives 4.5 3.5 2.7 3.4 Repay loan 0.4 1.3 3.4 1.9 Rickshaw related (repair etc.) - 0.5 1.3 0.8 Asset acquisition - - 0.9 0.3 Addiction - 0.2 0.9 0.4 Own treatment 2.9 1.9 2.3 2.2 Family members’ treatment - 2.3 2.3 2.0 Total 100.0 100.0 100.0 100.0
Note: Information relates to month prior to data collection.
Table 29: How rickshaw pullers spend leisure time (%) Duration of rickshaw pulling (years)
< 5 5-14 15+ Total Nothing/sleep/take rest etc. 14.6 56.0 59.1 46.0 Family work 36.0 11.6 13.6 17.4 Gossip/wander about 100.0 61.8 51.1 67.7 Listen to radio 5.6 0.4 - 1.5 Watch TV 2.2 1.8 2.3 2.0 Spend time with children - 6.7 2.3 4.2 Go to cinema - 5.8 1.1 3.5 Do religious work 3.4 6.2 15.9 7.7 Addiction - 0.4 - 0.2
Unsustainable Livelihoods (Begum and Sen) ANNEX
42
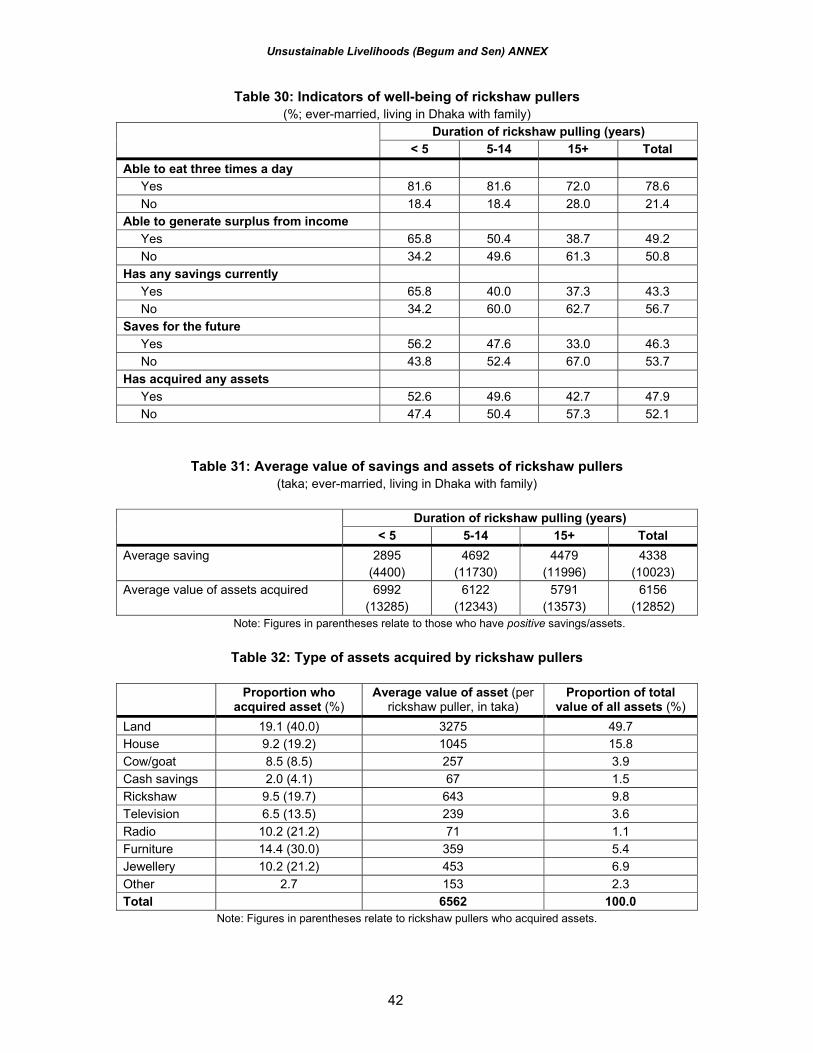
Table 30: Indicators of well-being of rickshaw pullers (%; ever-married, living in Dhaka with family)
Duration of rickshaw pulling (years) < 5 5-14 15+ Total
Able to eat three times a day Yes 81.6 81.6 72.0 78.6 No 18.4 18.4 28.0 21.4
Able to generate surplus from income Yes 65.8 50.4 38.7 49.2 No 34.2 49.6 61.3 50.8
Has any savings currently Yes 65.8 40.0 37.3 43.3 No 34.2 60.0 62.7 56.7
Saves for the future Yes 56.2 47.6 33.0 46.3 No 43.8 52.4 67.0 53.7
Has acquired any assets Yes 52.6 49.6 42.7 47.9 No 47.4 50.4 57.3 52.1
Table 31: Average value of savings and assets of rickshaw pullers (taka; ever-married, living in Dhaka with family)
Duration of rickshaw pulling (years)
< 5 5-14 15+ Total Average saving 2895
(4400) 4692
(11730) 4479
(11996) 4338
(10023) Average value of assets acquired 6992
(13285) 6122
(12343) 5791
(13573) 6156
(12852) Note: Figures in parentheses relate to those who have positive savings/assets.
Table 32: Type of assets acquired by rickshaw pullers
Proportion who
acquired asset (%) Average value of asset (per
rickshaw puller, in taka) Proportion of total
value of all assets (%) Land 19.1 (40.0) 3275 49.7 House 9.2 (19.2) 1045 15.8 Cow/goat 8.5 (8.5) 257 3.9 Cash savings 2.0 (4.1) 67 1.5 Rickshaw 9.5 (19.7) 643 9.8 Television 6.5 (13.5) 239 3.6 Radio 10.2 (21.2) 71 1.1 Furniture 14.4 (30.0) 359 5.4 Jewellery 10.2 (21.2) 453 6.9 Other 2.7 153 2.3 Total 6562 100.0
Note: Figures in parentheses relate to rickshaw pullers who acquired assets.

Unsustainable Livelihoods (Begum and Sen) ANNEX
43
Table 33: Information on credit access and outstanding loans of rickshaw pullers (ever-married rickshaw pullers, living in Dhaka with family)(% unless otherwise specified)
Duration of rickshaw pulling (years) < 5 5-14 15+ Total
Availability of urgent loan Yes 64.0 60.0 58.0 60.4 Sometimes 36.0 33.4 35.2 34.3 No - 6.7 6.9 5.2
Proportion with outstanding loan 47.2 44.4 47.7 45.8 Average amount of outstanding loan in Tk.(figures in parentheses relate to rickshaw pullers with debt)
2566 (5437)
1890 (4252)
3544 (7426)
2368 (5535)
Debt:savings ratio 1.30 0.45 0.89 0.66 Amount of loan (taka; of those with outstanding loans)
< 1000 7.1 13.0 9.5 10.9 1000-1999 14.3 17.0 14.3 15.8 2000-4999 35.7 38.0 28.6 35.3 5000-9999 23.8 20.0 19.0 20.7 10000-24999 16.7 12.0 23.8 15.8 25000+ 2.4 - 4.8 1.6
Type of interest No interest 26.2 41.0 25.6 34.1 Weekly interest 33.3 7.0 4.7 12.9 Monthly interest 40.5 44.0 55.8 45.9 Annual interest - 8.0 11.6 7.0
Source of loan Bank 11.9 3.0 2.3 4.9 NGO 31.0 16.0 20.9 20.5 Samity/cooperatives 7.1 6.0 14.0 8.1 Friends/relatives/neighbour/rickshaw owner 50.0 74.0 60.5 65.4 Mortgage of asset/land/house - 1.0 2.3 1.1
Reason for taking loan To meet living expenses 17.1 23.0 9.3 18.5 To acquire asset 36.5 26.0 32.6 29.3 Rickshaw repair/compensation for rickshaw loss/police case etc.
- 5.0 - 2.7
Social cause (marriage of daughter, sister) 4.9 6.0 14.0 7.6 Children’s education 2.4 1.0 4.6 2.2 Treatment for self 17.1 14.0 23.3 16.8 Treatment for family members 22.0 24.0 11.6 20.6 Other (gambling, going abroad, land problem, etc.) - 2.0 4.6 2.2

Unsustainable Livelihoods (Begum and Sen) ANNEX
44
Table 34: Crises faced by sample rickshaw pullers during the last five years Duration of rickshaw pulling (years)
< 5 5-14 15+ Total Proportion that experienced one or more crises 64.0 74.7 85.2 74.6 Average number of crises encountered (among all rickshaw pullers)
2.1 1.7 1.9 1.8
Proportion that experienced specific crisis Heath-related 73.0 61.8 76.1 67.4 Social 9.0 16.9 22.7 16.4 Misfortunes - 9.3 15.9 8.7 Natural 3.4 3.1 2.3 3.0 Personal insecurity 53.9 48.4 59.1 52.0 Distribution of crises Heath-related 52.4 44.3 43.2 45.7 Social 6.5 12.1 12.9 11.1 Misfortunes - 6.7 9.0 5.9 Natural 2.4 2.2 1.3 2.0 Personal insecurity 38.7 34.7 33.5 35.2 Cost per crisis (taka) Heath-related 4147 6785 5513 5838 Social 13875 9739 18245 12818 Misfortunes - 2731 3169 2906 Natural 9000 5214 27500 9875 Personal insecurity 2950 4625 6821 4787 All types 4429 6087 7667 6153 Distribution of costs associated with crises Heath-related 49.1 49.3 31.1 43.3 Social 20.2 19.4 30.7 23.2 Misfortunes - 3.0 3.7 2.8 Natural 4.9 1.9 4.6 3.2 Personal insecurity 25.8 26.4 29.8 27.4 All types 100.0
(549,160) 100.0
(1,911,290) 100.0
(1,188,320) 100.0
(3,648,770) Note: figures in parentheses represent total Taka spent.
Table 35: Health status of rickshaw pullers by age group Age group (in years)
< 30 30-44 45+ Total Perceived health status
Good 81.8 63.5 28.2 58.5 Not so good 9.1 19.4 33.0 20.6 Bad 9.1 17.1 38.8 20.9
Perceived reason for poor health Health problem 37.5 48.6 48.8 38.1 Weakness 75.0 60.0 97.6 79.8
Morbidity rate Acute illness (on day of interview) 2.2 11.1 21.6 11.4 Acute illness (during past month) 43.8 35.6 42.0 38.8 Repeat/chronic illness 37.1 27.1 51.1 39.6 Major illness (during last five years) 33.7 22.7 34.0 27.6

Unsustainable Livelihoods (Begum and Sen) ANNEX
45
Table 36: Patterns of illnesses of rickshaw pullers (% of total illness)
Duration of rickshaw puling < 5 5-14 15+ Total Acute illness Accident - 1.2 7.5 2.4 Diarrhoea/dysentery 7.1 3.6 5.0 4.8 Fever/cold 38.1 34.5 20.0 31.9 Asthma 2.4 - - 0.6 TB - - 5.0 1.2 Jaundice 14.3 1.2 7.5 6.0 Gastroenteric problems (ulcers, acidity) 2.4 15.5 15.0 12.0 Chest/body etc. pain including rheumatic pain - 15.5 17.5 13.8 Skin disease/STD 0.5 3.6 2.5 3.0 Physical weakness 21.4 16.7 10.0 16.3 Non-communicable disease - 2.4 5.0 2.4 Other 4.8 6.0 5.0 5.4
Total (N) 100.0 (42) 100.0 (84) 100.0(40) 100.0(166) Long term/Chronic illness Diarrhoea/dysentery 4.8 6.1 1.9 4.4 Fever/cold - 1.5 - 0.6 Asthma 7.1 1.5 1.9 3.1 TB - 1.5 1.9 1.2 Jaundice - - 5.8 1.9 Gastroenteric problems (ulcers, acidity) 26.2 27.3 21.2 25.0 Chest/body etc. pain including rheumatic pain 11.9 19.7 34.6 22.4 Skin disease/STD 9.5 4.5 - 4.4 Physical weakness 23.8 28.8 7.7 20.6 Non-communicable disease 7.1 3.0 11.5 6.2 Other 9.5 3.0 11.5 7.5
Total (N) 100.0 (42) 100.0 (66) 100.0 (52) 100.0 (160) Major illness Accident - 68.6 59.1 55.2 Diarrhoea/dysentery 10.0 - 4.5 3.0 Asthma 10.0 - - 1.5 Malaria 10.0 - - 1.5 Typhoid - 5.7 - 3.0 Jaundice - 8.6 4.5 6.0 Gastroenteric problems (ulcers, acidity) 30.0 11.4 4.5 11.9 Chest/body etc. pain including rheumatic pain - - 4.5 1.5 Skin disease/STD 10.0 - - 1.5 Non-communicable disease 30.0 5.2 22.6 15.0
Total (N) 100.0 (10) 100.0 (35) 100.0 (22) 100.0 (67)

Unsustainable Livelihoods (Begum and Sen) ANNEX
46
Table 37: Prevalence of chronic/long-term ill-health among rickshaw pullers (%)
Duration of rickshaw pulling (years) < 5 5-14 15+ Total
Diarrhoea/dysentery 2.2 1.8 1.1 1.7 Fever/cold - 0.4 - 0.2 Asthma 3.4 0.4 1.1 1.2 TB - 0.4 1.1 0.5 Gastroenteric problems (ulcers, acidity) 12.4 8.0 12.5 10.0 Jaundice - - 3.4 0.7 Chest/body etc. pain including rheumatic pain 4.5 5.8 20.5 8.9 Skin disease/STD 4.5 1.3 - 1.7 Physical weakness 11.2 8.4 4.5 8.2 Non-communicable disease 4.5 - 3.4 2.0
Table 38: Treatment of illness (%)
Duration of rickshaw pulling (years) < 5 5-14 15+ Total
Acute illness Proportion of illnesses that received treatment 100.0 81.0 90.0 88.0 Proportion of illnesses that received adequate treatment
95.2 71.4 69.4 77.3
Source of treatment Medical college/other hospitals 4.0 5.5 10.2 6.2 Private clinics/other institutional facilities - 2.7 7.7 3.1 Private qualified allopathic practitioners 46.0 37.0 30.8 38.3 Pharmacy 36.0 46.6 25.6 38.3 NGO - 2.7 2.6 1.9 Homeopathy - 2.7 5.1 2.5 Hekimi/Kabiraji 12.0 1.4 12.8 7.4 Totka/spiritualist 2.0 1.4 5.1 2.5
Major illness Proportion of illnesses that received treatment 90.0 100.0 100.0 98.5 Source of treatment
Medical college/other hospitals 27.3 50.0 52.2 47.1 Private clinics/other institutional facilities - 8.3 11.5 7.1 Private qualified allopathic practitioners 54.5 27.8 26.1 31.4 Pharmacy 9.1 2.8 4.3 4.3 NGO - - - - Homeopathy - 5.6 - 2.9 Hekimi/Kabiraji 9.1 - 8.7 4.3 Totka/spiritualist - 5.6 - 2.9

Unsustainable Livelihoods (Begum and Sen) ANNEX
47
Table 39: Reason(s) for not receiving treatment, or receiving inadequate treatment, for acute illness (%)
Duration of rickshaw pulling (years)
< 5 5-14 15+ Total Reasons for not receiving treatment
Illness perceived not serious - 31.6 50.0 34.8 Lack of money - 57.9 25.0 52.2 Other - 10.5 25.0 13.0
Reasons for inadequate treatment Monetary* 100.0 91.7 91.0 91.9 Other - 8.3 9.0 8.1
* Includes lack of money, pressure to earn money, no free treatment available etc.
Table 40: Cost of illness, financing of the cost and impact of major ailments (% unless otherwise specified)
Duration of rickshaw pulling (years)
< 5 5-14 15+ Total Acute illness Days suffered during last episode 5.5 9.6 11.9 9.2 Proportion who could not work 76.2 56.0 80.0 66.0 Days could not work fully (all rickshaw pullers) 3.7 6.0 9.1 4.2 Days could only work partly (all rickshaw pullers) 0.2 0.2 0.1 0.2 Treatment cost per episode (taka; figures in parentheses refer to treated illness only)
292 194 (226)
371 (413)
263 (289)
Source of financing treatment cost Own income 100.0 94.3 83.3 93.2 Own savings - 5.8 13.9 6.1 Informal loan - 4.3 16.7 6.1 Sale of assets - - 2.8 0.7 Other - 4.3 0.7 2.8
Major illness Proportion hospitalised 10.0 57.1 45.5 46.3 Proportion who could not work 50.0 94.0 100.0 89.0 Days could not work 12 36 57 44.2 Treatment cost per episode (taka) 6050 4738 6318 5453 Source of financing treatment cost
Own income 90.0 62.9 45.5 61.2 Savings 30.0 31.4 27.3 29.9 Sale of assets 10.0 17.1 18.2 16.4 Loan from institutions/individuals 20.0 20.0 40.9 26.9 Help from friends/relatives - 17.1 9.1 11.9 NGO 10.0 2.9 4.5 4.5
Impact on self None 10.0 40.0 22.7 29.9 Loss of organ 10.0 14.3 13.7 13.4 Reduced capacity to work 80.0 45.7 63.7 57.7
Impact on others None 60.0 28.7 - 23.9 Children’s education hampered - 5.7 9.1 6.0 Family suffered lack of basic needs 40.0 68.6 95.5 74.6

Unsustainable Livelihoods (Begum and Sen) ANNEX
48
Table 41: Distribution of rickshaw pullers who suffered ill-health, by health care cost (%)
Cost in taka Proportion of rickshaw pullers
Acute illness No cost 11.0 < 50 9.0 50-99 18.1 100-199 16.1 200-299 18.7 300-499 12.3 500-999 7.1 1000+ 7.7
Cost in taka Proportion of rickshaw pullers Major illness
< 1000 15.0 1000-1999 16.7 2000-3999 23.4 4000-4999 5.0 5000-9999 16.7 10000-14999 11.7 15000-24999 6.7 25000+ 5.0
Related Documents