+1 (202) 466-6790 +1 (202) 466-6797 00 K Street NW Suite 450 SHINGTON DC 20006 ited States of America +64 (4) 913 2800 +64 (4) 913 2808 vel 2, 88 The Terrace Box 10-225 LLINGTON w Zealand +33 (1) 45 27 24 55 +33 (1) 45 20 17 69 Rue Claude Chahu RIS 75116 ance ----------- www.castalia.fr Copyright Castalia Limited. All rights reserved. Castalia is not liable for any loss caused by reliance on this document. Castalia is a part of the worldwide Castalia Advisory Group. The Kyoto Protocol 19 July 2006 The Economic Reality for New Zealand

T +1 (202) 466-6790 F +1 (202) 466-6797 1700 K Street NW Suite 450 WASHINGTON DC 20006 United States of America T: +64 (4) 913 2800 F: +64 (4) 913 2808.
Dec 30, 2015
Welcome message from author
This document is posted to help you gain knowledge. Please leave a comment to let me know what you think about it! Share it to your friends and learn new things together.
Transcript
T +1 (202) 466-6790
F +1 (202) 466-6797
1700 K Street NW Suite 450
WASHINGTON DC 20006
United States of America
T: +64 (4) 913 2800
F: +64 (4) 913 2808
Level 2, 88 The Terrace
PO Box 10-225
WELLINGTON
New Zealand
T +33 (1) 45 27 24 55
F +33 (1) 45 20 17 69
7 Rue Claude Chahu
PARIS 75116
France
------------- www.castalia.fr
Copyright Castalia Limited. All rights reserved. Castalia is not liable for any loss caused by reliance on this document. Castalia is a part of the worldwide Castalia Advisory Group.
The Kyoto Protocol
19 July 2006
The Economic Reality for New Zealand
2
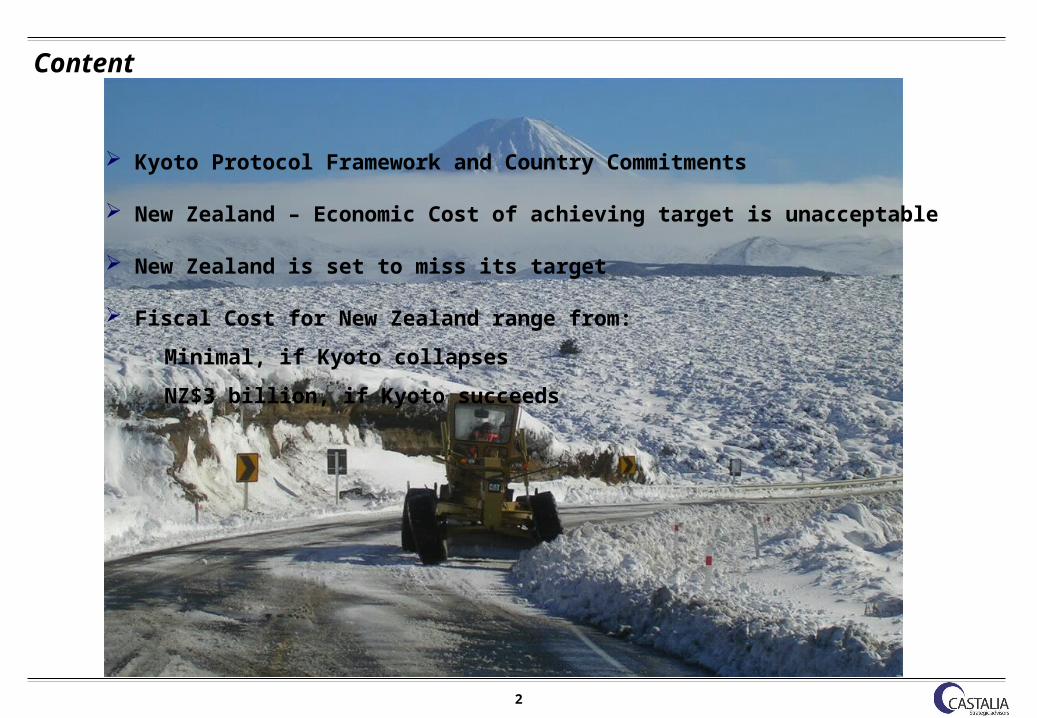
Content
Kyoto Protocol Framework and Country Commitments
New Zealand – Economic Cost of achieving target is unacceptable
New Zealand is set to miss its target
Fiscal Cost for New Zealand range from:
Minimal, if Kyoto collapses
NZ$3 billion, if Kyoto succeeds
3
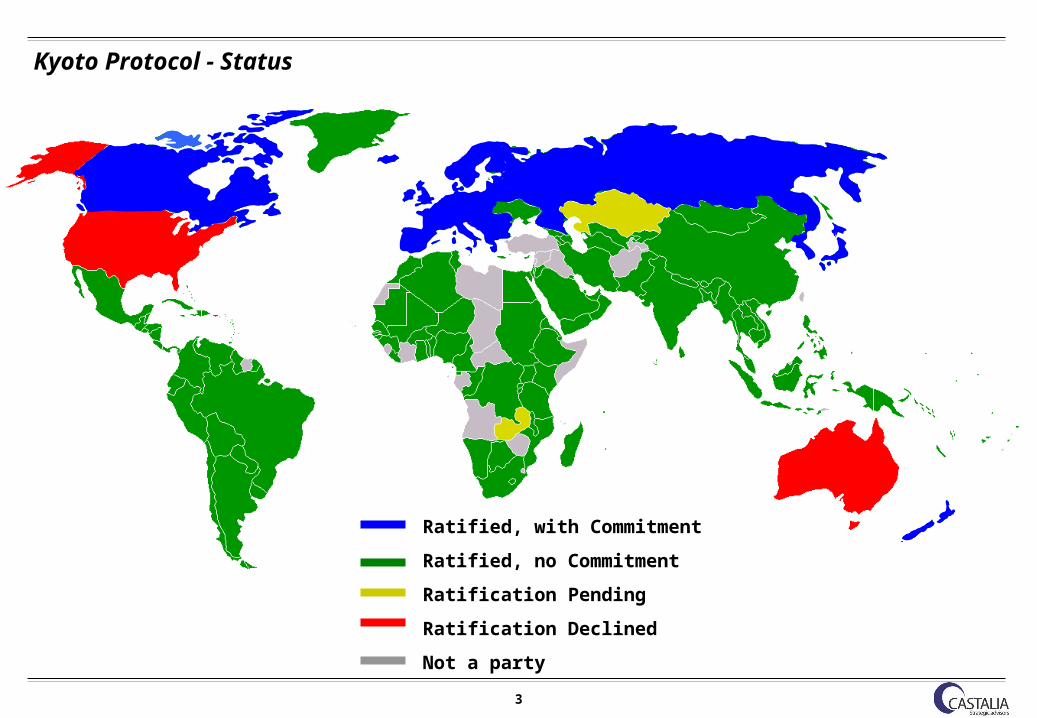
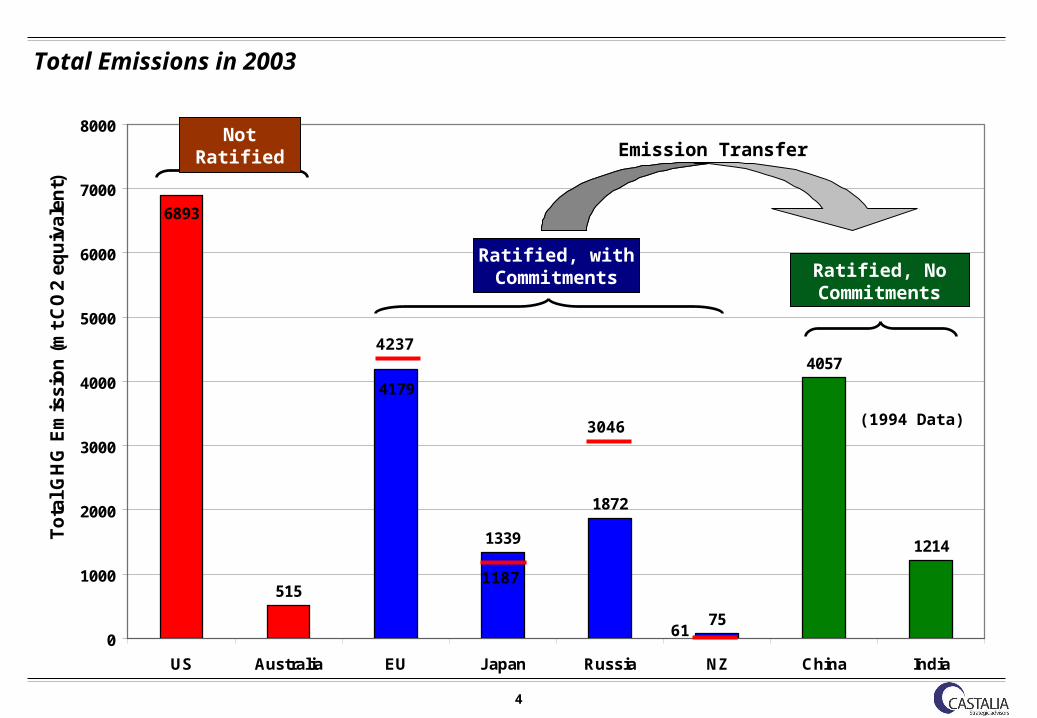
Kyoto Protocol - Status
Ratified, with Commitment
Ratified, no Commitment
Ratification Pending
Ratification Declined
Not a party
4
515
1339
1872
75
4057
1214
6893
4179
0
1000
2000
3000
4000
5000
6000
7000
8000
US Australia EU Japan Russia NZ China India
To
tal
GH
G E
mis
sio
n (
mt
CO
2 eq
uiv
ale
nt)
Total Emissions in 2003
Not Ratified
Ratified, with Commitments Ratified, No
Commitments
Emission Transfer
4237
1187
3046
61
(1994 Data)

5
Kyoto Target for a Typical Country with a Commitment
CO2 Emissions
(in tonnes)
20001990 2008 2012 2018
???
1st Commitment Period
2nd Commitment
Period
Target5%
•buy units
•or earn units
•or carry forward with 30% Penalty
Actual
Forecast

6
0
10
20
30
40
50
60
70
80
90
100
110
120
130
140
150
GH
G E
mis
sio
ns (
mt
CO
2 e
qu
ivale
nt)
-
10
20
30
40
50
60
70
80
90
100
110
120
130
140
GD
P (
NZ
$b
illi
on
)
New Zealand’s Emissions
1st Commitment
Period
2nd Commitment
Period
Actual GDP
Forecast GDP
Actual Net Emissions
Forecast Emissions
Target
Requires:
• Change in economic structure
• Increase in energy efficiency
7
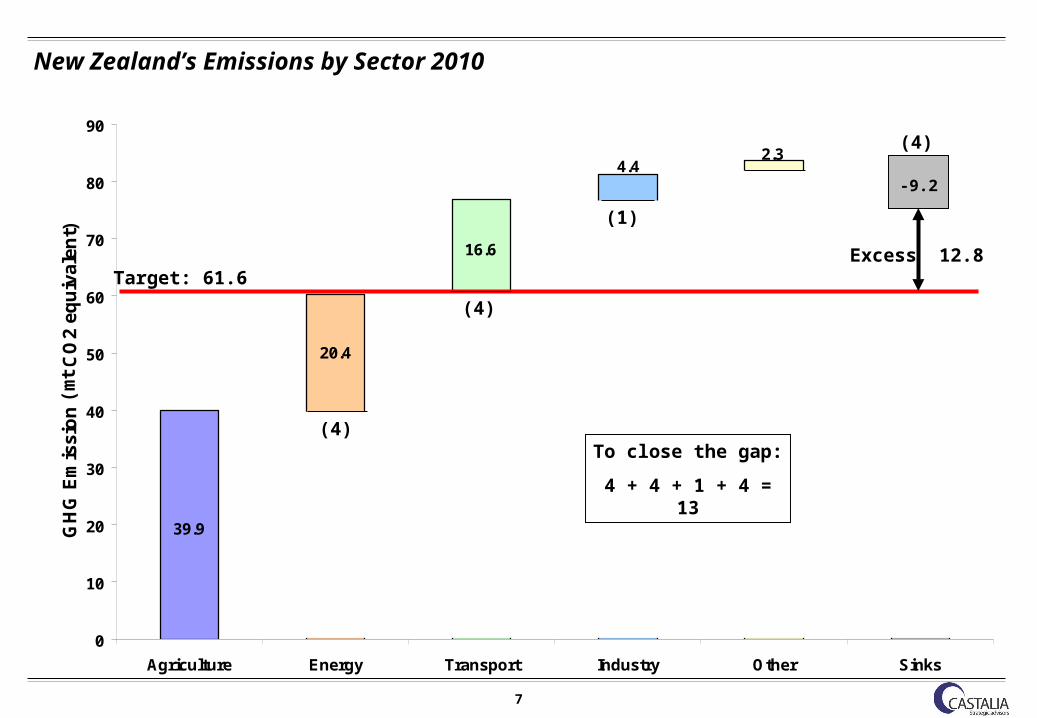
39.9
16.6
20.4
4.42.3
-9.2
0
10
20
30
40
50
60
70
80
90
Agriculture Energy Transport Industry Other Sinks
GH
G E
mis
sio
n (
Tg
CO
2 e
qu
ival
ent)
New Zealand’s Emissions by Sector 2010
-9.2
Target: 61.6Excess 12.8
(4)
(4)
(1)
(4)
To close the gap:
4 + 4 + 1 + 4 = 13
(mt
8
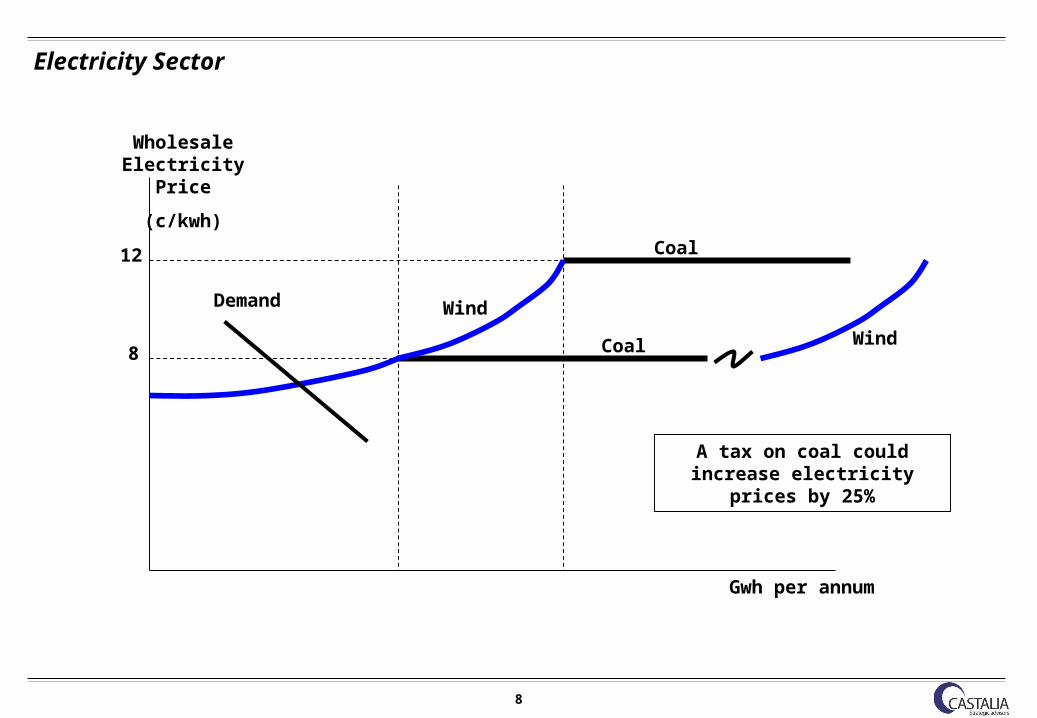
Electricity Sector
Wholesale Electricity
Price
(c/kwh)
Gwh per annum
12
8 Coal
Coal
Wind
WindDemand
A tax on coal could increase electricity prices by 25%
9
0
5,000
10,000
15,000
20,000
25,000
30,000
35,000
40,000
45,000
50,000
1990
1991
1992
1993
1994
1995
1996
1997
1998
1999
2000
2001
2002
2003
2004
2005
2006
2007
2008
2009
2010
2011
2012
2013
2014
2015
2016
2017
2018
Kil
om
eter
s (m
illi
on
)
0.0
1.0
2.0
3.0
4.0
5.0
6.0
7.0
8.0
9.0
10.0
Em
iss
ion
fro
m C
ars
(mt)
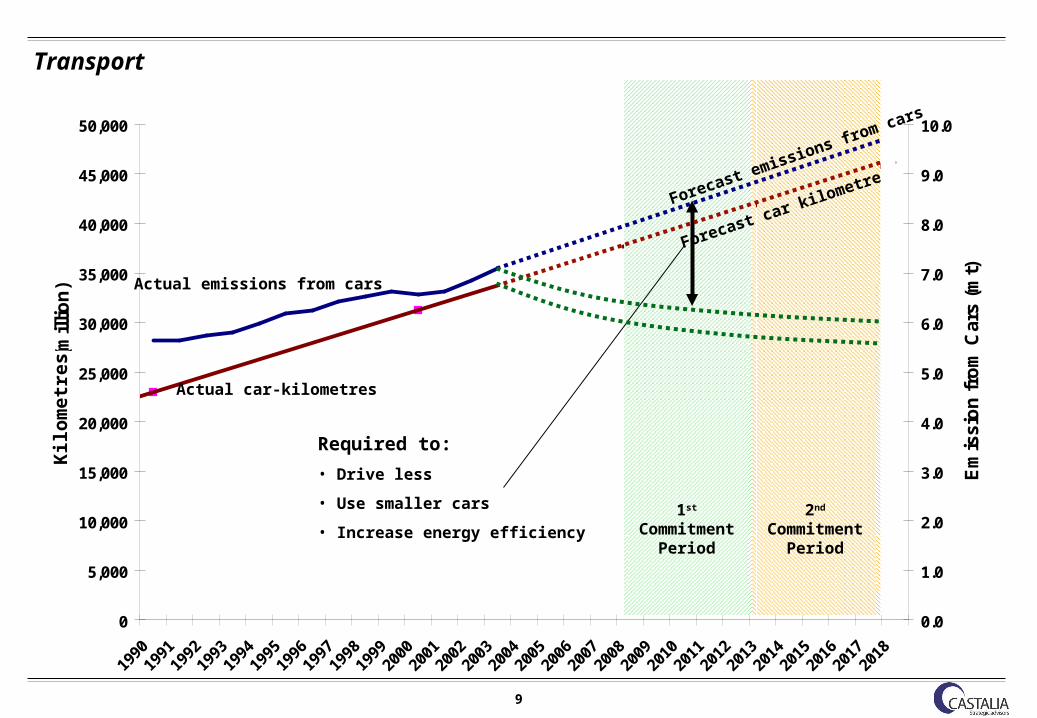
Transport
1st Commitment
Period
2nd Commitment
Period
Actual emissions from cars
Actual car-kilometres
Forecast emissions from cars
Forecast car kilometres
Required to:
• Drive less
• Use smaller cars
• Increase energy efficiency
Kil
om
etre
s
10
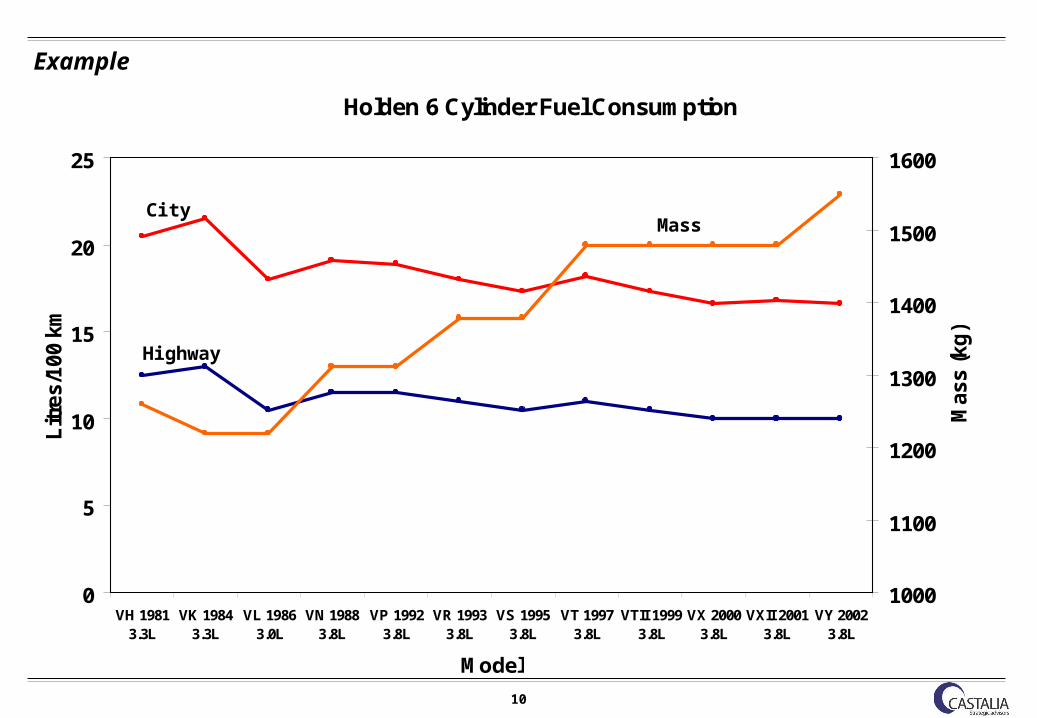
Example
Holden 6 Cylinder Fuel Consumption
0
5
10
15
20
25
VH 19813.3L
VK 19843.3L
VL 19863.0L
VN 19883.8L
VP 19923.8L
VR 19933.8L
VS 19953.8L
VT 19973.8L
VTII 19993.8L
VX 20003.8L
VXII 20013.8L
VY 20023.8L
Model
Litre
s/1
00 k
m
1000
1100
1200
1300
1400
1500
1600
Mass (kg
)
MassCity
Highway

11
Forestry
Planting Year
Are
a P
lan
ted
(000
ha)
Kyoto Protocol Signed 1998
4 mt CO2 requires reduction in deforestation
of 5,000 ha

12
Likely Outcome
Political recognition that the cost of complying is extremely high
Electricity prices, reduced travel, reduced conversions from forestry
New Zealand likely to miss target
Government’s latest figure 64 million tonnes CO2

13
Net Excess Emissions During the First Commitment Period (M tonnes CO2)
2010
First commitment period
2008 - 2012
Gross emissions 83.6 418
Sinks (9.2) (46)
Net emissions 74.4 372
Assigned amount 61.6 308
Excess emissions 12.8 64

14
Price of Emission Units
Emission Trading Schemes
Settlement Price depends on expectations for CP II
Low, if low expectations for CP II
High, if high expectations for CP II - $US30 per tonne
Flexibility mechanisms
US $ 6 per tonne CO2 last year

15
Fiscal Cost of Buying Compliance
Excess Emissions Quantity x Price of Unit = Fiscal Cost
64 million units
x
USD/Unit
$0
$6
$30
NZD/Unit
$0
$10
$50
=
NZD
$0 million
$640 million
$3 billion
If Kyoto fails
If Kyoto succeeds

16
How Did This Happen?
Belief that energy use was inefficient
Belief that new economy would see us right
Belief that we could avoid leakage and reduce emissions
Belief that we would have credits from forests
17
Conclusion
The growing economy and population have generated a rapid growth in emissions over the last 25 years
As long as economic growth continues, the same pattern is likely to continue in the future
There is no realistic set of policies which would BOTH:
Reduce the total level of emissions back to 1990 levels, AND
Be consistent with continued economic growth
The costs of meeting the target are likely to be unacceptable to New Zealanders
That leaves us with a fiscal cost:
minimal, if the Kyoto Protocol collapses
as high as $3 billion, if the Kyoto Protocol were to succeed
Related Documents