METHODOLOGY ARTICLE Open Access Systems mapping: how to improve the genetic mapping of complex traits through design principles of biological systems Rongling Wu 1*† , Jiguo Cao 2† , Zhongwen Huang 3 , Zhong Wang 4 , Junyi Gai 5* and Eduardo Vallejos 6 Abstract Background: Every phenotypic trait can be viewed as a “system” in which a group of interconnected components function synergistically to yield a unified whole. Once a system’s components and their interactions have been delineated according to biological principles, we can manipulate and engineer functionally relevant components to produce a desirable system phenotype. Results: We describe a conceptual framework for mapping quantitative trait loci (QTLs) that control complex traits by treating trait formation as a dynamic system. This framework, called systems mapping, incorporates a system of differential equations that quantifies how alterations of different components lead to the global change of trait development and function through genes, and provides a quantitative and testable platform for assessing the interplay between gene action and development. We applied systems mapping to analyze biomass growth data in a mapping population of soybeans and identified specific loci that are responsible for the dynamics of biomass partitioning to leaves, stem, and roots. Conclusions: We show that systems mapping implemented by design principles of biological systems is quite versatile for deciphering the genetic machineries for size-shape, structural-functional, sink-source and pleiotropic relationships underlying plant physiology and development. Systems mapping should enable geneticists to shed light on the genetic complexity of any biological system in plants and other organisms and predict its physiological and pathological states. Background Predicting the phenotype from the genotype of complex organisms is one of the most important and challenging questions we face in modern biology and medicine [1]. Genetic mapping, dissecting a phenotypic trait to its underlying quantitative trait loci (QTLs) through the use of molecular markers, has proven powerful for establishing genotype-phenotype relationships and pre- dicting phenotypes of individual organisms based on their QTL genotypes responsible for the trait [2]. The success of this prediction depends on how well we can map the underlying QTLs and characterize complex interactions of these QTLs with each other and with environmental factors. Powerful statistical models have been developed in the past two decades to detect QTLs and study their biological function in a diverse array of phenotypic traits [3-9]. Worldwide, a substantial effort has been made resulting in the collection of a large amount of data aimed at the identification of QTLs [10-15]. Unfortunately, despite hundreds of thousands of QTLs detected in a diversity of organisms, only a few of them have been isolated by positional cloning (see [16-18]), leaving it unsolved how to construct a geno- type-phenotype relationship map using genetic mapping. The most likely reason for this result may arise from a possibility that the QTLs detected by stringent statistical tests are not biologically relevant. Existing strategies for QTL mapping were built on testing for a direct * Correspondence: [email protected]; [email protected] † Contributed equally 1 Center for Computational Biology, National Engineering Laboratory for Tree Breeding, Key Laboratory of Genetics and Breeding in Forest Trees and Ornamental Plants, Beijing Forestry University, Beijing 100083, China 5 National Center for Soybean Improvement, National Key Laboratory for Crop Genetics and Germplasm Enhancement, Soybean Research Institute, Nanjing Agricultural University, Nanjing 210095, China Full list of author information is available at the end of the article Wu et al. BMC Systems Biology 2011, 5:84 http://www.biomedcentral.com/1752-0509/5/84 © 2011 Wu et al; licensee BioMed Central Ltd. This is an Open Access article distributed under the terms of the Creative Commons Attribution License (http://creativecommons.org/licenses/by/2.0), which permits unrestricted use, distribution, and reproduction in any medium, provided the original work is properly cited.

Welcome message from author
This document is posted to help you gain knowledge. Please leave a comment to let me know what you think about it! Share it to your friends and learn new things together.
Transcript
METHODOLOGY ARTICLE Open Access
Systems mapping: how to improve the geneticmapping of complex traits through designprinciples of biological systemsRongling Wu1*†, Jiguo Cao2†, Zhongwen Huang3, Zhong Wang4, Junyi Gai5* and Eduardo Vallejos6
Abstract
Background: Every phenotypic trait can be viewed as a “system” in which a group of interconnected componentsfunction synergistically to yield a unified whole. Once a system’s components and their interactions have beendelineated according to biological principles, we can manipulate and engineer functionally relevant components toproduce a desirable system phenotype.
Results: We describe a conceptual framework for mapping quantitative trait loci (QTLs) that control complex traitsby treating trait formation as a dynamic system. This framework, called systems mapping, incorporates a system ofdifferential equations that quantifies how alterations of different components lead to the global change of traitdevelopment and function through genes, and provides a quantitative and testable platform for assessing theinterplay between gene action and development. We applied systems mapping to analyze biomass growth data ina mapping population of soybeans and identified specific loci that are responsible for the dynamics of biomasspartitioning to leaves, stem, and roots.
Conclusions: We show that systems mapping implemented by design principles of biological systems is quiteversatile for deciphering the genetic machineries for size-shape, structural-functional, sink-source and pleiotropicrelationships underlying plant physiology and development. Systems mapping should enable geneticists to shedlight on the genetic complexity of any biological system in plants and other organisms and predict itsphysiological and pathological states.
BackgroundPredicting the phenotype from the genotype of complexorganisms is one of the most important and challengingquestions we face in modern biology and medicine [1].Genetic mapping, dissecting a phenotypic trait to itsunderlying quantitative trait loci (QTLs) through theuse of molecular markers, has proven powerful forestablishing genotype-phenotype relationships and pre-dicting phenotypes of individual organisms based ontheir QTL genotypes responsible for the trait [2]. The
success of this prediction depends on how well we canmap the underlying QTLs and characterize complexinteractions of these QTLs with each other and withenvironmental factors. Powerful statistical models havebeen developed in the past two decades to detect QTLsand study their biological function in a diverse array ofphenotypic traits [3-9]. Worldwide, a substantial efforthas been made resulting in the collection of a largeamount of data aimed at the identification of QTLs[10-15]. Unfortunately, despite hundreds of thousands ofQTLs detected in a diversity of organisms, only a few ofthem have been isolated by positional cloning (see[16-18]), leaving it unsolved how to construct a geno-type-phenotype relationship map using genetic mapping.The most likely reason for this result may arise from a
possibility that the QTLs detected by stringent statisticaltests are not biologically relevant. Existing strategies forQTL mapping were built on testing for a direct
* Correspondence: [email protected]; [email protected]† Contributed equally1Center for Computational Biology, National Engineering Laboratory for TreeBreeding, Key Laboratory of Genetics and Breeding in Forest Trees andOrnamental Plants, Beijing Forestry University, Beijing 100083, China5National Center for Soybean Improvement, National Key Laboratory forCrop Genetics and Germplasm Enhancement, Soybean Research Institute,Nanjing Agricultural University, Nanjing 210095, ChinaFull list of author information is available at the end of the article
Wu et al. BMC Systems Biology 2011, 5:84http://www.biomedcentral.com/1752-0509/5/84
© 2011 Wu et al; licensee BioMed Central Ltd. This is an Open Access article distributed under the terms of the Creative CommonsAttribution License (http://creativecommons.org/licenses/by/2.0), which permits unrestricted use, distribution, and reproduction inany medium, provided the original work is properly cited.
association between genotype and end-point phenotype.Although such strategies are simple and have beenwidely accepted, they neglect the biological processesinvolved in trait development [14]. To attempt to fillthis gap, a statistical model, called functional mapping[19-21], has been developed to study the interplaybetween genetics and the developmental process of aphenotypic trait by integrating mathematical models andcomputational algorithms. If a trait is understood as a“system” that is composed of many underlying biologicalcomponents [22-24], we should be in a better positionto comprehend the process and behavior of trait forma-tion based on interactive relationships among differentcomponents. Through mapping and using those QTLsthat govern design principles of a biological system, anew trait that is able to maximize resource-use effi-ciency can be generated and engineered.As one important strategy for plants to respond to
variation in the availability of resources in their environ-ment, biomass allocation has been extensively used tostudy the relationship between structure and function inmodern ecology [25-28]. The concept of biomass alloca-tion has now been increasingly integrated with plantmanagement and breeding, aimed to direct a maximumamount of biomass to the target of harvest (leaves, stem,roots, or fruits) [29-31]. If the whole-plant biomass isconsidered as a target trait, we need to understand howdifferent organs of a plant coordinate and interact tooptimize the capture of nutrients, light, water, and car-bon dioxide in a manner that maximizes plant growthrate through a specific developmental program becauseplant biomass growth is not simply the addition of bio-mass to various organs. Many theories and models havebeen proposed to predict the pattern of biomass parti-tioning in a response to changing environment. Chenand Reynolds [27] used coordination theory to modelthe dynamic allocation of carbon to different organsduring growth in relation to carbon and water/nitrogensupply by a group of differential equations. Comparedto the conventional optimization model in the contextof maximizing the relative growth rate of a plant, thecoordination model does not require an unrealisticcapacity the plant possesses for knowing beforehand theenvironmental conditions it will experience during thegrowth period. Here, we integrate the coordination andoptimization model to study the pattern of biomass par-titioning by incorporating the allometric scaling theoryinto a system of differential equations.In a series of allometric studies by West et al. [32-34],
a power relationship that universally exists betweenparts and the whole can be explained by two fundamen-tal design principles in biophysics and biochemistry; i.e.,all organisms tend to maximize their metabolic capacityby increasing surface areas for energy and material
production as well as internal efficiency through redu-cing distances and the time to transport water, nutri-ents, and carbon. The integration of this optimizationtheory expressed in terms of allometric scaling with thecoordination theory leads to a tripled group of ordinarydifferential equations (ODEs) to specify the coordinationof the leaf, stem, and root biomass for a plant:
dML
dt= αLWβL − γLML
dMS
dt= αSWβS
dMR
dt= αRWβR − γRMR
(1)
where ML, MS, and MRare the biomasses of the leaves(L), the stem (S), and the roots (R), respectively, withwhole-plant biomass W = ML+ MS+ MR; a and b arethe constant and exponent power of an organ biomassscaling as whole-plant biomass [32,33]; and g is the rateof eliminating ageing leaves and roots. The complexinteractions between different parts of a plant thatunderlie design principles of plant biomass growth canbe modeled and studied by estimating and testing theODE parameters (aL, bL, lL, aS, bS, aR, bR, lR). Forexample, plants are equipped with a capacity to optimizetheir fitness under low nutrient availability by shiftingthe partitioning of carbohydrates to processes associatedwith nutrient uptake at a cost of carbon acquisition[29]. These parameters can be used to quantify and pre-dict such regulation between different plant parts inresponse to environmental and developmental changes.In this article, we put forward a conceptual framework
to incorporate the design principles of trait formationand development into a statistical framework for QTLmapping. Complementary to our previous functionalmapping [19-21], we name this new mapping framework“systems mapping” in light of its systems dissection andmodeling of phenotypic formation. A group of ODEslike (1) or other types of differential equations is used toquantify the phenotypic system. Much work in solvingODEs has focused on the simulation and analysis of thebehavior of state variables for a dynamic system, but theestimation of ODE parameters that define the systembased on the measurement of state variables at multipletime points is relatively a new area. Yet, in the recentyears, many statisticians have made great attempts todevelop statistical approaches for estimating ODE para-meters by modeling the structure of measurement errors[35-42]. We implemented Ramsay et al.’s [41] penalizedspline method for estimating constant dynamic para-meters in our genetic mapping. The problem for sys-tems mapping with ODE models is different from thoseconsidered in current literature. First, systems mapping
Wu et al. BMC Systems Biology 2011, 5:84http://www.biomedcentral.com/1752-0509/5/84
Page 2 of 11
is constructed within a mixture-based frameworkbecause QTL genotypes that define the DE models aremissing. Second, systems mapping incorporates genoty-pic data which are categorical or binary. These twocharacteristics determine the high complexity of our sta-tistical model and computational algorithm used for sys-tems mapping.
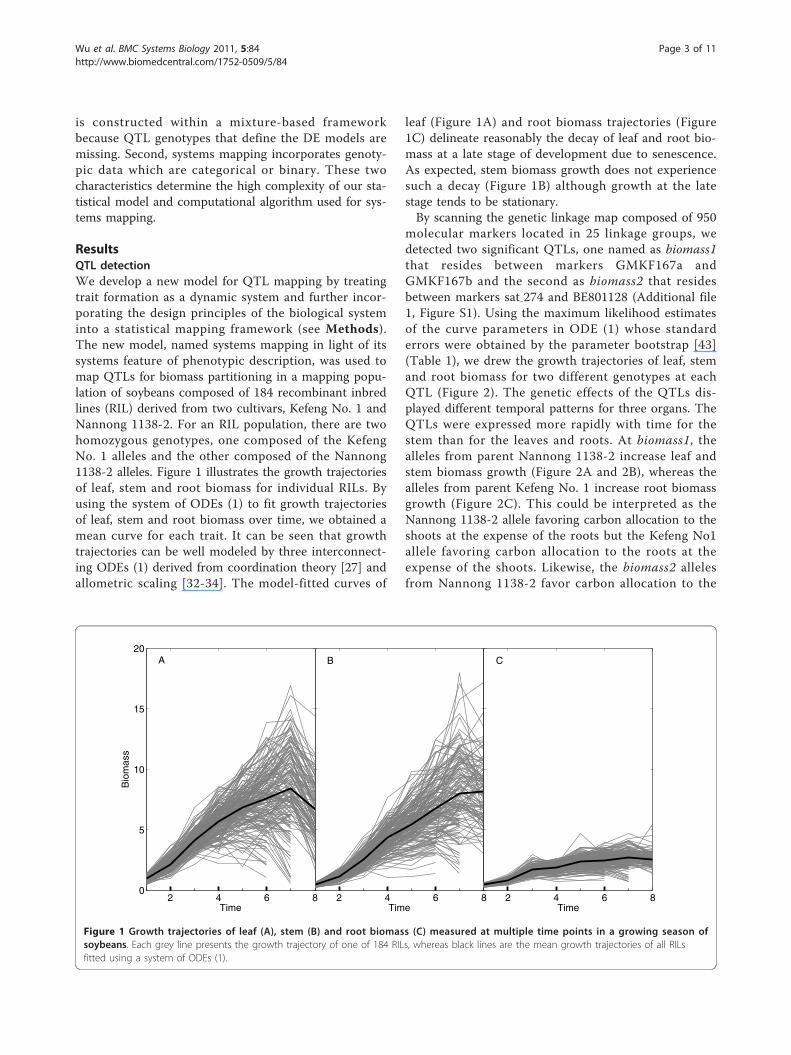
ResultsQTL detectionWe develop a new model for QTL mapping by treatingtrait formation as a dynamic system and further incor-porating the design principles of the biological systeminto a statistical mapping framework (see Methods).The new model, named systems mapping in light of itssystems feature of phenotypic description, was used tomap QTLs for biomass partitioning in a mapping popu-lation of soybeans composed of 184 recombinant inbredlines (RIL) derived from two cultivars, Kefeng No. 1 andNannong 1138-2. For an RIL population, there are twohomozygous genotypes, one composed of the KefengNo. 1 alleles and the other composed of the Nannong1138-2 alleles. Figure 1 illustrates the growth trajectoriesof leaf, stem and root biomass for individual RILs. Byusing the system of ODEs (1) to fit growth trajectoriesof leaf, stem and root biomass over time, we obtained amean curve for each trait. It can be seen that growthtrajectories can be well modeled by three interconnect-ing ODEs (1) derived from coordination theory [27] andallometric scaling [32-34]. The model-fitted curves of
leaf (Figure 1A) and root biomass trajectories (Figure1C) delineate reasonably the decay of leaf and root bio-mass at a late stage of development due to senescence.As expected, stem biomass growth does not experiencesuch a decay (Figure 1B) although growth at the latestage tends to be stationary.By scanning the genetic linkage map composed of 950
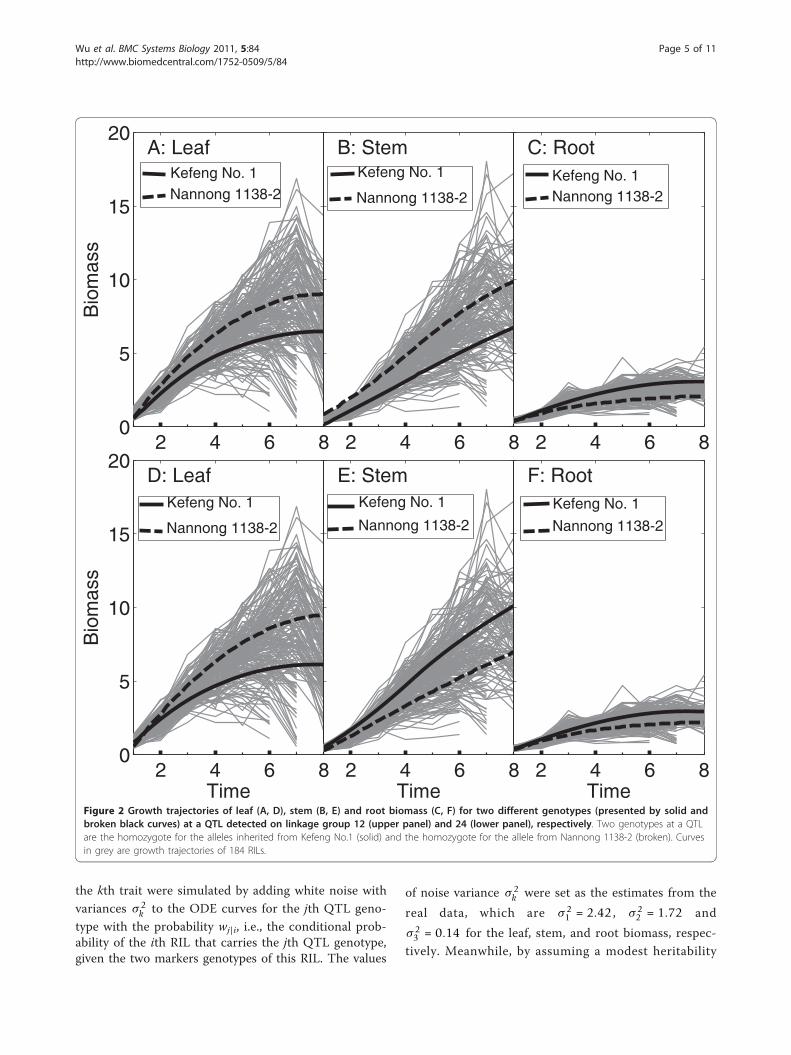
molecular markers located in 25 linkage groups, wedetected two significant QTLs, one named as biomass1that resides between markers GMKF167a andGMKF167b and the second as biomass2 that residesbetween markers sat-274 and BE801128 (Additional file1, Figure S1). Using the maximum likelihood estimatesof the curve parameters in ODE (1) whose standarderrors were obtained by the parameter bootstrap [43](Table 1), we drew the growth trajectories of leaf, stemand root biomass for two different genotypes at eachQTL (Figure 2). The genetic effects of the QTLs dis-played different temporal patterns for three organs. TheQTLs were expressed more rapidly with time for thestem than for the leaves and roots. At biomass1, thealleles from parent Nannong 1138-2 increase leaf andstem biomass growth (Figure 2A and 2B), whereas thealleles from parent Kefeng No. 1 increase root biomassgrowth (Figure 2C). This could be interpreted as theNannong 1138-2 allele favoring carbon allocation to theshoots at the expense of the roots but the Kefeng No1allele favoring carbon allocation to the roots at theexpense of the shoots. Likewise, the biomass2 allelesfrom Nannong 1138-2 favor carbon allocation to the
2 4 6 80
5
10
15
20
Bio
mas
s
Time
A
2 4 6 8Time
B
2 4 6 8Time
C
Figure 1 Growth trajectories of leaf (A), stem (B) and root biomass (C) measured at multiple time points in a growing season ofsoybeans. Each grey line presents the growth trajectory of one of 184 RILs, whereas black lines are the mean growth trajectories of all RILsfitted using a system of ODEs (1).
Wu et al. BMC Systems Biology 2011, 5:84http://www.biomedcentral.com/1752-0509/5/84
Page 3 of 11
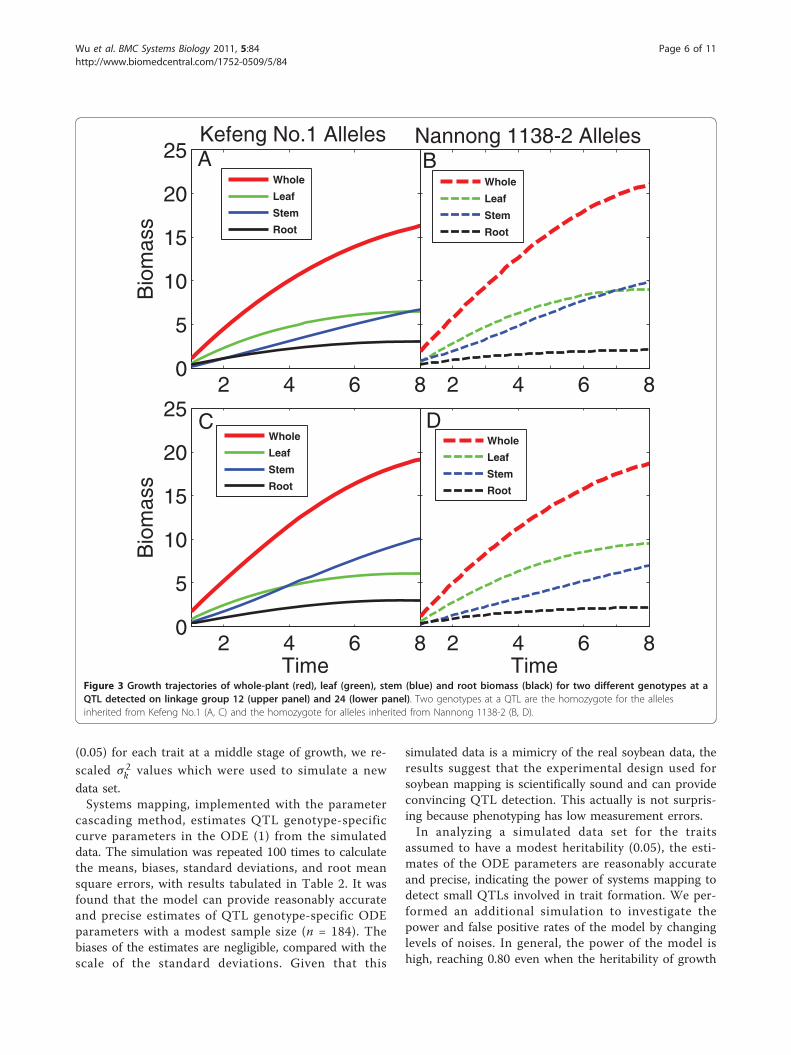
leaves (Figure 2D) and those from Kefeng No. 1 favorcarbon allocation to the roots, but the alleles at thisQTL inherited from parent Kefeng No. 1 favor carbonallocation to the stem, which is different from the beha-vior of QTL biomass1. Note that leaf and root biomassgrowth tend to decay at the late stage for almost allRILs. But the genotypes at the QTLs detected do notreflect this trend (Figure 2), although they display muchreduced rates of growth at the late stage. We explainedthis to be due to some other QTLs that have not beendetected with the current linkage map.The functional relationships among leaf, stem and rootbiomass were determined by the QTLs detected (Fig-ure 3). For biomass1, two genotypes are not only dif-ferent in whole-plant biomass trajectory, but alsodisplay pronounced discrepancies in biomass growthtrajectories of individual organs (Figure 3A and 3B).This means that this QTL affects the dynamics of bothplant size and biomass partitioning. The genotypecomposed of the Kefeng No. 1 alleles has a smallerslope of biomass growth, leading to smaller whole-plant biomass at late stages of development, than thatcomposed of the Nannong 1138-2 alleles, but the for-mer has larger root biomass over the entire period ofgrowth at the expense of the shoots than the latter.For biomass2, two genotypes are similar in total plantsize during growth, but they have a marked distinctionin biomass partitioning (Figure 3C and 3D). It appearsthat this QTL affects plant growth trajectories throughaltering biomass partitioning rather than total amountof biomass. At this QTL, the genotype with the KefengNo. 1 alleles has a dominant main stem and heavyroots, whereas the genotype with the Nannong 1138-2alleles carries dense leaves.
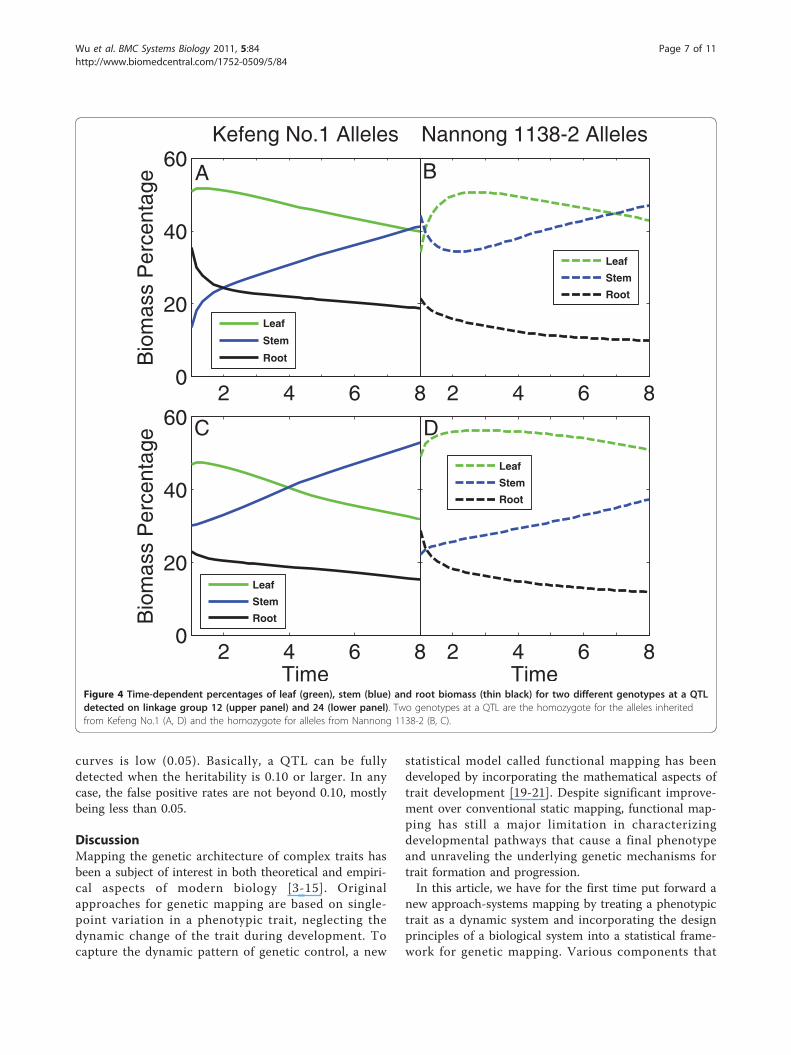
Figure 4 shows the dynamic pattern of biomass parti-tioning to different organs. In general, the stem receivesincreasing allocation with time, whereas the partitioningto the leaves and roots decreases with time. Both QTLsdetected, biomass1 and biomass2, control the degree ofsuch time-dependent increase or decrease. For example,at biomass1, the Kefeng No. 1 genotype always exhibitsa larger degree of increasing biomass partitioning to thestem but a larger degree of decreasing biomass parti-tioning to the leaves and roots than the Nannong 1138-2 genotype (Figure 4A vs. 4B). QTL biomass2 has asimilar pattern of biomass partitioning for the stem andleaves, although it displays a stronger effect than doesQTL biomass1. At QTL biomass2, there is a largerdegree of decreasing biomass partitioning to the rootsfor the Nannong 1138-2 genotype than the KefengNo. 1 genotype (Figure 4C vs. 4D).
SimulationBy analyzing a real data set for soybean mapping, sys-tems mapping produces the identification of two signifi-cant QTLs that control the dynamic formation ofwhole-plant biomass through developmental regulationof different organs, stem, leaves, and roots. To validatethe new model, we performed simulation studies bymimicking the effects of QTL biomass2 detected fromthe example of QTL mapping in soybeans. The simu-lated mapping population contains the same genotypedata for 184 RILs. The phenotypic values of three traits,the stem, leaf and root biomass, assumed to obey thesystem of ODE (1), were simulated at six different timepoints by summing time-dependent genotypic values atbiomass2 calculated with curve parameters in Table 1and residual errors. Specifically, the phenotypic values of
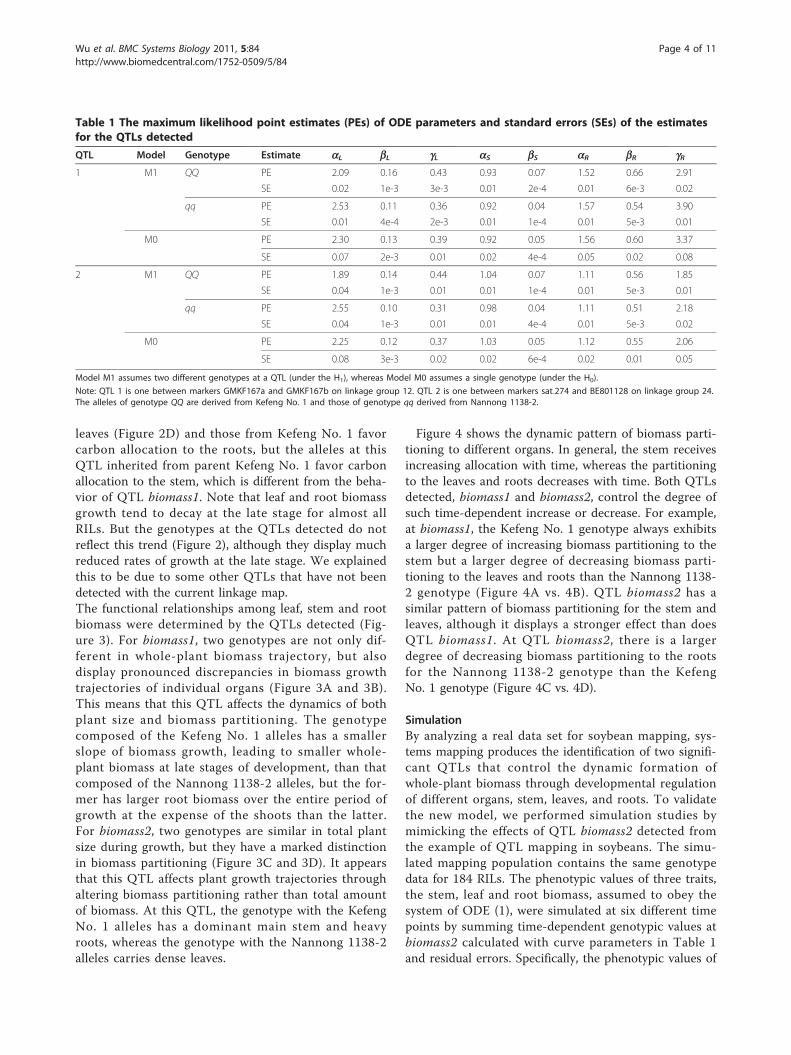
Table 1 The maximum likelihood point estimates (PEs) of ODE parameters and standard errors (SEs) of the estimatesfor the QTLs detected
QTL Model Genotype Estimate aL bL gL aS bS aR bR gR1 M1 QQ PE 2.09 0.16 0.43 0.93 0.07 1.52 0.66 2.91
SE 0.02 1e-3 3e-3 0.01 2e-4 0.01 6e-3 0.02
qq PE 2.53 0.11 0.36 0.92 0.04 1.57 0.54 3.90
SE 0.01 4e-4 2e-3 0.01 1e-4 0.01 5e-3 0.01
M0 PE 2.30 0.13 0.39 0.92 0.05 1.56 0.60 3.37
SE 0.07 2e-3 0.01 0.02 4e-4 0.05 0.02 0.08
2 M1 QQ PE 1.89 0.14 0.44 1.04 0.07 1.11 0.56 1.85
SE 0.04 1e-3 0.01 0.01 1e-4 0.01 5e-3 0.01
qq PE 2.55 0.10 0.31 0.98 0.04 1.11 0.51 2.18
SE 0.04 1e-3 0.01 0.01 4e-4 0.01 5e-3 0.02
M0 PE 2.25 0.12 0.37 1.03 0.05 1.12 0.55 2.06
SE 0.08 3e-3 0.02 0.02 6e-4 0.02 0.01 0.05
Model M1 assumes two different genotypes at a QTL (under the H1), whereas Model M0 assumes a single genotype (under the H0).
Note: QTL 1 is one between markers GMKF167a and GMKF167b on linkage group 12. QTL 2 is one between markers sat-274 and BE801128 on linkage group 24.The alleles of genotype QQ are derived from Kefeng No. 1 and those of genotype qq derived from Nannong 1138-2.
Wu et al. BMC Systems Biology 2011, 5:84http://www.biomedcentral.com/1752-0509/5/84
Page 4 of 11
the kth trait were simulated by adding white noise withvariances σ 2
k to the ODE curves for the jth QTL geno-type with the probability wj|i, i.e., the conditional prob-ability of the ith RIL that carries the jth QTL genotype,given the two markers genotypes of this RIL. The values
of noise variance σ 2k were set as the estimates from the
real data, which are σ 21 = 2.42 , σ 2
2 = 1.72 and
σ 23 = 0.14 for the leaf, stem, and root biomass, respec-
tively. Meanwhile, by assuming a modest heritability
2 4 6 80
5
10
15
20
Bio
mas
s
A: Leaf
2 4 6 8
B: Stem
2 4 6 8
C: Root
2 4 6 80
5
10
15
20
Bio
mas
s
Time
D: Leaf
2 4 6 8Time
E: Stem
2 4 6 8Time
F: Root
Nannong 1138-2 Nannong 1138-2
Kefeng No. 1
Nannong 1138-2
Kefeng No. 1
Nannong 1138-2 Nannong 1138-2
Nannong 1138-2Kefeng No. 1
Kefeng No. 1
Kefeng No. 1Kefeng No. 1
Figure 2 Growth trajectories of leaf (A, D), stem (B, E) and root biomass (C, F) for two different genotypes (presented by solid andbroken black curves) at a QTL detected on linkage group 12 (upper panel) and 24 (lower panel), respectively. Two genotypes at a QTLare the homozygote for the alleles inherited from Kefeng No.1 (solid) and the homozygote for the allele from Nannong 1138-2 (broken). Curvesin grey are growth trajectories of 184 RILs.
Wu et al. BMC Systems Biology 2011, 5:84http://www.biomedcentral.com/1752-0509/5/84
Page 5 of 11
(0.05) for each trait at a middle stage of growth, we re-scaled σ 2
k values which were used to simulate a newdata set.Systems mapping, implemented with the parameter
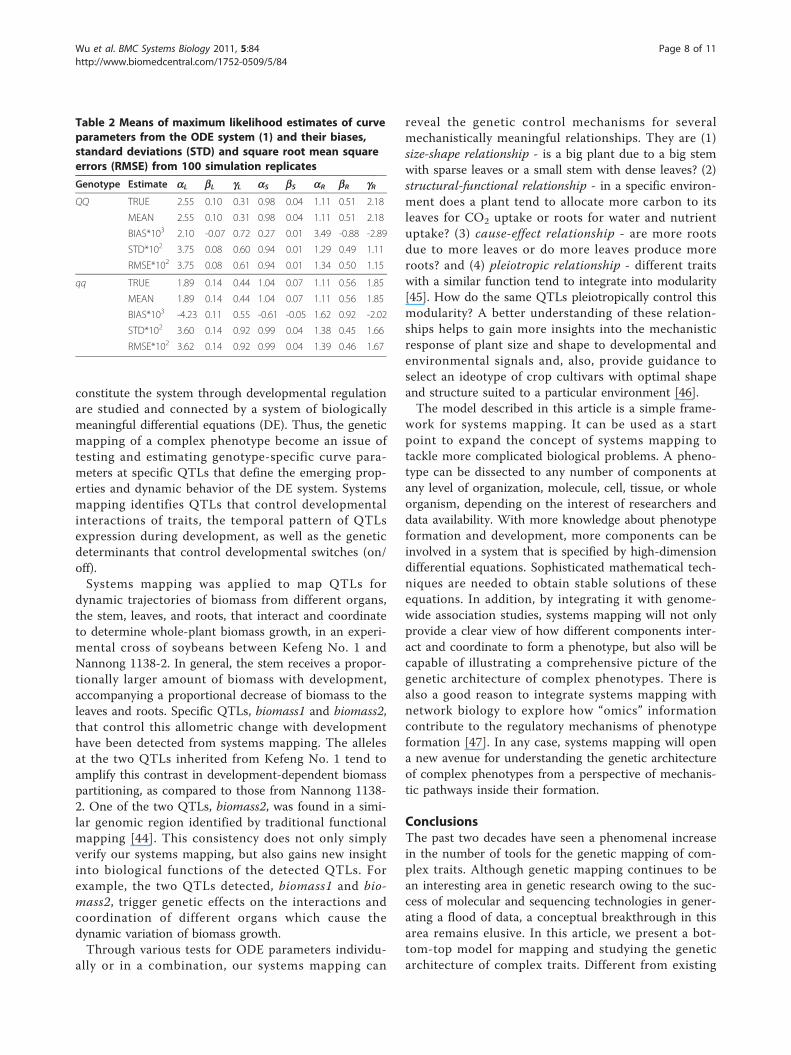
cascading method, estimates QTL genotype-specificcurve parameters in the ODE (1) from the simulateddata. The simulation was repeated 100 times to calculatethe means, biases, standard deviations, and root meansquare errors, with results tabulated in Table 2. It wasfound that the model can provide reasonably accurateand precise estimates of QTL genotype-specific ODEparameters with a modest sample size (n = 184). Thebiases of the estimates are negligible, compared with thescale of the standard deviations. Given that this
simulated data is a mimicry of the real soybean data, theresults suggest that the experimental design used forsoybean mapping is scientifically sound and can provideconvincing QTL detection. This actually is not surpris-ing because phenotyping has low measurement errors.In analyzing a simulated data set for the traits
assumed to have a modest heritability (0.05), the esti-mates of the ODE parameters are reasonably accurateand precise, indicating the power of systems mapping todetect small QTLs involved in trait formation. We per-formed an additional simulation to investigate thepower and false positive rates of the model by changinglevels of noises. In general, the power of the model ishigh, reaching 0.80 even when the heritability of growth
2 4 6 80
5
10
15
20
25B
iom
ass
AKefeng No.1 Alleles
2 4 6 8
BNannong 1138-2 Alleles
Whole
Leaf
Stem
Root
Whole
Leaf
Stem
Root
2 4 6 80
5
10
15
20
25
Bio
mas
s
Time
C
2 4 6 8Time
D
Whole
Leaf
Stem
Root
Whole
Leaf
Stem
Root
Figure 3 Growth trajectories of whole-plant (red), leaf (green), stem (blue) and root biomass (black) for two different genotypes at aQTL detected on linkage group 12 (upper panel) and 24 (lower panel). Two genotypes at a QTL are the homozygote for the allelesinherited from Kefeng No.1 (A, C) and the homozygote for alleles inherited from Nannong 1138-2 (B, D).
Wu et al. BMC Systems Biology 2011, 5:84http://www.biomedcentral.com/1752-0509/5/84
Page 6 of 11
curves is low (0.05). Basically, a QTL can be fullydetected when the heritability is 0.10 or larger. In anycase, the false positive rates are not beyond 0.10, mostlybeing less than 0.05.
DiscussionMapping the genetic architecture of complex traits hasbeen a subject of interest in both theoretical and empiri-cal aspects of modern biology [3-15]. Originalapproaches for genetic mapping are based on single-point variation in a phenotypic trait, neglecting thedynamic change of the trait during development. Tocapture the dynamic pattern of genetic control, a new
statistical model called functional mapping has beendeveloped by incorporating the mathematical aspects oftrait development [19-21]. Despite significant improve-ment over conventional static mapping, functional map-ping has still a major limitation in characterizingdevelopmental pathways that cause a final phenotypeand unraveling the underlying genetic mechanisms fortrait formation and progression.In this article, we have for the first time put forward a
new approach-systems mapping by treating a phenotypictrait as a dynamic system and incorporating the designprinciples of a biological system into a statistical frame-work for genetic mapping. Various components that
2 4 6 80
20
40
60B
iom
ass
Per
cent
age A
Kefeng No.1 Alleles
2 4 6 8
B
Nannong 1138-2 Alleles
2 4 6 80
20
40
60
Bio
mas
s P
erce
ntag
e
Time
C
2 4 6 8Time
D
Leaf
Stem
Root
Leaf
Stem
Root
Leaf
Stem
Root
Leaf
Stem
Root
Figure 4 Time-dependent percentages of leaf (green), stem (blue) and root biomass (thin black) for two different genotypes at a QTLdetected on linkage group 12 (upper panel) and 24 (lower panel). Two genotypes at a QTL are the homozygote for the alleles inheritedfrom Kefeng No.1 (A, D) and the homozygote for alleles from Nannong 1138-2 (B, C).
Wu et al. BMC Systems Biology 2011, 5:84http://www.biomedcentral.com/1752-0509/5/84
Page 7 of 11
constitute the system through developmental regulationare studied and connected by a system of biologicallymeaningful differential equations (DE). Thus, the geneticmapping of a complex phenotype become an issue oftesting and estimating genotype-specific curve para-meters at specific QTLs that define the emerging prop-erties and dynamic behavior of the DE system. Systemsmapping identifies QTLs that control developmentalinteractions of traits, the temporal pattern of QTLsexpression during development, as well as the geneticdeterminants that control developmental switches (on/off).Systems mapping was applied to map QTLs for
dynamic trajectories of biomass from different organs,the stem, leaves, and roots, that interact and coordinateto determine whole-plant biomass growth, in an experi-mental cross of soybeans between Kefeng No. 1 andNannong 1138-2. In general, the stem receives a propor-tionally larger amount of biomass with development,accompanying a proportional decrease of biomass to theleaves and roots. Specific QTLs, biomass1 and biomass2,that control this allometric change with developmenthave been detected from systems mapping. The allelesat the two QTLs inherited from Kefeng No. 1 tend toamplify this contrast in development-dependent biomasspartitioning, as compared to those from Nannong 1138-2. One of the two QTLs, biomass2, was found in a simi-lar genomic region identified by traditional functionalmapping [44]. This consistency does not only simplyverify our systems mapping, but also gains new insightinto biological functions of the detected QTLs. Forexample, the two QTLs detected, biomass1 and bio-mass2, trigger genetic effects on the interactions andcoordination of different organs which cause thedynamic variation of biomass growth.Through various tests for ODE parameters individu-
ally or in a combination, our systems mapping can
reveal the genetic control mechanisms for severalmechanistically meaningful relationships. They are (1)size-shape relationship - is a big plant due to a big stemwith sparse leaves or a small stem with dense leaves? (2)structural-functional relationship - in a specific environ-ment does a plant tend to allocate more carbon to itsleaves for CO2 uptake or roots for water and nutrientuptake? (3) cause-effect relationship - are more rootsdue to more leaves or do more leaves produce moreroots? and (4) pleiotropic relationship - different traitswith a similar function tend to integrate into modularity[45]. How do the same QTLs pleiotropically control thismodularity? A better understanding of these relation-ships helps to gain more insights into the mechanisticresponse of plant size and shape to developmental andenvironmental signals and, also, provide guidance toselect an ideotype of crop cultivars with optimal shapeand structure suited to a particular environment [46].The model described in this article is a simple frame-
work for systems mapping. It can be used as a startpoint to expand the concept of systems mapping totackle more complicated biological problems. A pheno-type can be dissected to any number of components atany level of organization, molecule, cell, tissue, or wholeorganism, depending on the interest of researchers anddata availability. With more knowledge about phenotypeformation and development, more components can beinvolved in a system that is specified by high-dimensiondifferential equations. Sophisticated mathematical tech-niques are needed to obtain stable solutions of theseequations. In addition, by integrating it with genome-wide association studies, systems mapping will not onlyprovide a clear view of how different components inter-act and coordinate to form a phenotype, but also will becapable of illustrating a comprehensive picture of thegenetic architecture of complex phenotypes. There isalso a good reason to integrate systems mapping withnetwork biology to explore how “omics” informationcontribute to the regulatory mechanisms of phenotypeformation [47]. In any case, systems mapping will opena new avenue for understanding the genetic architectureof complex phenotypes from a perspective of mechanis-tic pathways inside their formation.
ConclusionsThe past two decades have seen a phenomenal increasein the number of tools for the genetic mapping of com-plex traits. Although genetic mapping continues to bean interesting area in genetic research owing to the suc-cess of molecular and sequencing technologies in gener-ating a flood of data, a conceptual breakthrough in thisarea remains elusive. In this article, we present a bot-tom-top model for mapping and studying the geneticarchitecture of complex traits. Different from existing
Table 2 Means of maximum likelihood estimates of curveparameters from the ODE system (1) and their biases,standard deviations (STD) and square root mean squareerrors (RMSE) from 100 simulation replicates
Genotype Estimate aL bL gL aS bS aR bR gRQQ TRUE 2.55 0.10 0.31 0.98 0.04 1.11 0.51 2.18
MEAN 2.55 0.10 0.31 0.98 0.04 1.11 0.51 2.18
BIAS*103 2.10 -0.07 0.72 0.27 0.01 3.49 -0.88 -2.89
STD*102 3.75 0.08 0.60 0.94 0.01 1.29 0.49 1.11
RMSE*102 3.75 0.08 0.61 0.94 0.01 1.34 0.50 1.15
qq TRUE 1.89 0.14 0.44 1.04 0.07 1.11 0.56 1.85
MEAN 1.89 0.14 0.44 1.04 0.07 1.11 0.56 1.85
BIAS*103 -4.23 0.11 0.55 -0.61 -0.05 1.62 0.92 -2.02
STD*102 3.60 0.14 0.92 0.99 0.04 1.38 0.45 1.66
RMSE*102 3.62 0.14 0.92 0.99 0.04 1.39 0.46 1.67
Wu et al. BMC Systems Biology 2011, 5:84http://www.biomedcentral.com/1752-0509/5/84
Page 8 of 11
mapping models, we use a systems approach to identifyspecific genes or quantitative trait loci that govern thedevelopmental interactions of various components com-prising the phenotype. The map of developmental inter-actions among different components is constructed by asystem of differential equations. Thus, by estimating andtesting mathematical parameters that specify the system,we are able to predict or alter the physiological status ofa phenotype based on the underlying genetic controlmechanisms. We have tested and validated our modelby analyzing a real data set for genetic mapping of bio-mass growth in soybeans. The detection of QTLs by thenew model provides biologically meaningful interpreta-tions of QTL effects on trait formation and dynamics.The new model can be readily used to study the geneticbasis of phenotypes in any other organism.
MethodsMapping PopulationOur model derivation is based on a mapping populationcomprising of n recombinant inbred lines (RILs),initiated with two inbred lines. By continuous selfing orinbreeding, RILs after the F7 generation are consideredhomozygous because the fixation at any locus is givenby f = 1 - 0.57-1 ≈ 1. In practical terms, all plants from asingle RIL are genetically identical, and can be used forreplicated experiments under different environments. Inaddition, each RIL represents a unique combination ofalleles from the parental genotypes where there are twohomozygous genotypes at each marker locus, each cor-responding to a parental allele. The mapping populationis genotyped at molecular markers to construct a linkagemap covering the entire genome. The recombinationfraction between two markers is converted to thegenetic distance in centiMorgan (cM) through a mapfunction, such as the Haldane or Kosambi map function.The map constructed is used to locate QTLs that con-trol a quantitative trait of interest.We obtained a sample of 184 RILs derived from two
cultivars, Kefeng No. 1 and Nannong 1138-2, for map-ping agronomic traits. These RILs were genotyped for950 molecular markers locating in 25 linkage groups[48,49]. The plants were grown in a simple lattice designwith two replicates in a plot at Jiangpu Soybean Experi-ment Station, Nanjing Agricultural University, China.Ten plants in the second row of a plot were randomlyselected for measuring leaf, stem and root biomass ateach time in the whole growing season. After 20 days ofseedling emergence, dry weights separately for theleaves, stem and roots were measured once every 5 to10 days until most plants stopped growth. A total of 6to 8 measurements were taken for each of the RILs stu-died. Great efforts were made to control measurement
errors for such a large-scale field trial. Phenotyping pre-cision was estimated to be above 95%.Unlike a traditional mapping project, our goal is to
map QTLs that control the dynamic process of how dif-ferent organs, the stem, leaves, and roots, interact andcoordinate to determine whole-plant biomass. The inter-actions and coordination of different organs for a plantare understood using design principles described by theODE system (1).
Likelihood
Let yki =(yki (ti1) , · · · , yki
(timi
))T denote the vector of
phenotypic values for trait k (k = 1 for leaf biomass (L),2 for stem biomass (S), and 3 for root biomass (R)) mea-
sured on progeny i at time points(ti1, · · · , timi
)T . Note
that the number of time points measured may be pro-geny-specific, expressed as mifor progeny i. Assumingthat multiple QTLs (segregating with J genotypes), eachbracketed by two flanking markers M, affects thesethree traits, we construct a mixture model-based likeli-hood as
L(z, M) =n∑
i=1
J∑j=1
[ωj|ifj(zi; �j, �)] (2)
where y = (y1, y2, y3) is a joint vector of phenotypicvalues for the three traits, with zi= (y1i, y2i, y3i) present-ing the z-vector for progeny i; ωj|i is the conditionalprobability of QTL genotype j (j = 1,..., J) given the mar-ker genotype of progeny i, which can be expressed as afunction of the recombination fractions between theQTL and markers [50], and fj(zi; Θj, Ψ) is an MVN ofleaf, stem and root biomass for progeny i which carriesQTL genotype j, with mean vectors
μj = (μ1j, μ2j, μ3j), j = 1, . . . , J
specified by Θj, and covariance matrix specified by Ψ.If a system of differential equations (1) is used to jointlymodel QTL genotype-specific means vectors for thethree traits, then we have Θj= (aLj, bLj, l jL, aSj, bSj, aRj,bRj, l Rj) for genotype j.
EstimationUnlike a traditional mixture model for QTL mapping,we will model the genotypic values of each QTL geno-type in likelihood (2) characterized by a group of non-linear ODEs. While an analytical solution is notavailable, we will implement numerical approaches tosolve these ODEs. Let μkj(t) denote the genotypic valueof the kth trait at time t for a QTL genotype j. Thus,the dynamic system of the traits and their interactions,regulated by QTL genotypes, can be modeled by a
Wu et al. BMC Systems Biology 2011, 5:84http://www.biomedcentral.com/1752-0509/5/84
Page 9 of 11
system of ODE (1),
dμkj(t)
dt= gk(μj(t), �j), k = 1, · · · , 3, (3)
where μj(t) = (μ1j(t), ..., μ3j(t))T, and Θj is a vector of
ODE parameters associated with QTL genotype j. For Jpossible genotypes in the mapping population, we have
� =(�T
1, ... , �TJ
)T . The question now is how to Θ esti-
mate from noisy measurements. The functional meanμkj(t) may be represented as a linear combination ofbasis functions:
μkj(t) =R∑
r=1
ckjrφkjr(t) = cTkjφkj(t) (4)
where jkj(t) = (jkj1(t), ..., jkjR(t))Tis a vector of basis
functions with R orders and ckj= (ckj1, ..., ckjR)T is a vec-
tor of basis coefficients. Define c =({
ckj}3;J
k=1;j=1
)as a
length (R × 3 × J) vector of basis coefficients. The cubicB-splines are often chosen as basis functions, since anyB-spline basis function is only positive over a short sub-interval and zero elsewhere. This is called the compactsupport property, and is essential for efficient computa-tion. The flexibility of the B-spline basis functionsdepend on the number and location of knots we choose.It is an infinite-dimension optimization problem tochoose the optimal number of knots and their locations.A popular approach to avoid this dilemma is choosing asaturated number of knots and using a roughness pen-alty to control the smoothness of the fitted curve andavoid over-fitting [40].We estimate the basis coefficient c and ODE para-
meter Θ based on a two-nested level of optimization. Inthe inner level of optimization, c is estimated by opti-mizing a criterion U(c|Θ), given any value of Θ. There-fore, the estimate c may be viewed as a function of Θ,which is denoted as c (�) . Since no analytic formula
for c is available, c (�) is an implicit function. In theouter level of optimization, Θ is estimated by optimizinga criterion H
(�, c (�)
). The parameter c is removed in
the parameter space in the outer level by treating it asan implicit function of Θ. Although c (�) does nothave an analytic formula, the outer level of optimizationonly requires to calculate the derivative dc/d� , whichcan be obtained by using the implicit function theorem.The above optimization procedure is called the para-meter cascading method. Note that when the two cri-teria U(c|Θ) and H
(�, c (�)
)are the same, the
parameter cascading method is equivalent to the profil-ing method.
Additional material
Additional file 1: Figure S1. The profiles of the log-likelihood ratios (LR)between the full model (there is a QTL) and reduced model (there is noQTL) for soybean height growth trajectories throughout the soybeangenome composed of 25 linkage groups.
AcknowledgementsThis work is supported by the Changjiang Scholars Award, “One-thousandPerson” Award, NSF/IOS-0923975, a discovery grant of the Natural Sciencesand Engineering Research Council of Canada (NSERC) (J. Cao), the NationalKey Basic Research Program of China (2009CB1184,2010CB1259,2011CB1093), The National High Technology R&D Program of China(2009AA1011), and the MOE 111 Project (B08025). Part of this work wascarried when RW and JC were invited Research Fellows at the Statistical andApplied Mathematical Sciences Institute (SAMSI), sponsored by DukeUniversity, University of North Carolina at Chapel Hill, and North CarolinaState University. Thanks are due to Prof. Shouyi Chen and Prof. Deyue Yu forkind permission to use the jointly developed NJRIKY genetic linkage map.
Author details1Center for Computational Biology, National Engineering Laboratory for TreeBreeding, Key Laboratory of Genetics and Breeding in Forest Trees andOrnamental Plants, Beijing Forestry University, Beijing 100083, China.2Department of Statistics & Actuarial Science, Simon Fraser University,Burnaby, B.C. Canada V5A 1S6. 3Department of Agronomy, Henan Institute ofScience and Technology, Xinxiang 453003, China. 4Center for StatisticalGenetics, Pennsylvania State University, Hershey, PA 17033, USA. 5NationalCenter for Soybean Improvement, National Key Laboratory for Crop Geneticsand Germplasm Enhancement, Soybean Research Institute, NanjingAgricultural University, Nanjing 210095, China. 6Department of HorticulturalSciences, University of Florida, Gainesville, FL 32611, USA.
Authors’ contributionsRW conceived of the idea of systems mapping, coordinated the wholestudy, and wrote the manuscript. JC derived the model, computed the realdata, run simulation studies, and participated in the writing of the Methodssection. ZH conducted the soybean experiment and collected phenotypicdata. ZW packed the model into a computer package SysMap. JG directedthe experimental design and data collection of soybeans. EV oversaw theproject and highlighted the biological relevance a computational modelmust possess. All authors read and approved the final manuscript.
Received: 7 February 2011 Accepted: 27 May 2011Published: 27 May 2011
References1. Lee SH, van der Werf JHJ, Hayes BJ, Goddard ME, Visscher PM: Predicting
unobserved phenotypes for complex traits from whole-genome SNPdata. PLoS Genet 2008, 4(10):e1000231..
2. Lynch M, Walsh B: Genetics and Analysis of Quantitative Traits SinauerAssociates, Sunderland, MA; 1998.
3. Lander ES, Botstein D: Mapping Mendelian factors underlyingquantitative traits using RFLP linkage maps. Genetics 1989, 121:185-199.
4. Zeng ZB: Precision mapping of quantitative trait loci. Genetics 1994,136:1457-1468.
5. Xu S, Atchley WR: A random model approach to interval mapping ofquantitative genes. Genetics 1995, 141:1189-1197.
6. Wu RL, Ma CX, Casella G: Joint linkage and linkage disequilibriummapping of quantitative trait loci in natural populations. Genetics 2002,160:779-792.
7. Yi N, Xu S: Bayesian lasso for quantitative trait loci mapping. Genetics2008, 179:1045-1055.
8. Zou F, Nie L, Wright FA, Sen PK: A robust QTL mapping procedure. J StatPlann Infer 2009, 139:978-989.
9. Ehrenreich IM, Torabi N, Jia Y, Kent J, Martis S, Shapiro JA, Gresham D,Caudy AA, Kruglyak L: Dissection of genetically complex traits withextremely large pools of yeast segregants. Nature 2010, 464:1039-1042.
Wu et al. BMC Systems Biology 2011, 5:84http://www.biomedcentral.com/1752-0509/5/84
Page 10 of 11
10. Steinmetz LM, Sinha H, Richards DR, Spiegelman JI, Oefner PJ, McCusker JH,Davis RW: Dissecting the complex architecture of a quantitative traitlocus in yeast. Nature 2002, 416:326-330.
11. Singer JB, Hill AE, Burrage LC, Olszens KR, Song J, Justice M, O’Brien WE,Conti DV, Witte JS, Lander ES, Nadeau JH: Genetic dissection of complextraits with chromosome substitution strains of mice. Science 2004,304:445-448.
12. Altshuler D, Daly MJ, Lander ES: Genetic mapping in human disease.Science 2008, 322:881-888.
13. Shao H, Burrage LC, Sinasac DS, Hill AE, Ernest SR, O’Brien W, Courtland HW,Jepsen KJ, Kirby A, Kulbokas EJ, Daly MJ, Broman KW, Lander ES, Nadeau JH:Genetic architecture of complex traits: Large phenotypic effects andpervasive epistasis. Proc Natl Acad Sci USA 2008, 105:19910-19914.
14. Mackay TFC, Stone EA, Ayroles JF: The genetics of quantitative traits:challenges and prospects. Nat Rev Genet 2009, 10:565-577.
15. Balasubramanian S, Schwartz C, Singh A, Warthmann N, Kim MC, Maloof JN,Loudet O, Trainer GT, Dabi T, Borevitz JO, Chory J, Weigel D: QTL mappingin new Arabidopsis thaliana advanced intercross-recombinant inbredlines. PLoS ONE 2009, 4(2):e4318.
16. Frary A, Nesbitt TC, Grandillo S, Knaap E, Cong B, Liu J, Meller J, Elber R,Alpert KB, Tanksley SD: fw2. 2: a quantitative trait locus key to theevolution of tomato fruit size. Science 2000, 289:85-88.
17. Li C, Zhou A, Sang T: Rice domestication by reducing shattering. Science2006, 311:1936-1939.
18. Huang X, Qian Q, Liu Z, Sun H, He S, Luo D, Xia G, Chu C, Li J, Fu X:Natural variation at the DEP1 locus enhances grain yield in rice. NatGenet 2009, 41:494-497.
19. Ma CX, Casella G, Wu RL: Functional mapping of quantitative trait lociunderlying the character process: a theoretical framework. Genetics 2002,161:1751-1762.
20. Wu RL, Lin M: Functional mapping - how to map and study the geneticarchitecture of dynamic complex traits. Nat Rev Genet 2006, 7:229-237.
21. Li Y, Wu RL: Functional mapping of growth and development. Biol Rev2010, 85:207-216.
22. Kitano H: Systems biology: a brief overview. Science 2002, 295:1662-1664.23. Jansen RC: Studying complex biological systems using multifactorial
perturbation. Nat Rev Genet 2003, 4:145-151.24. Csete ME, Doyle JC: Reverse engineering of biological complexity. Science
2002, 295:1664-1669.25. Cannell MGR, Dewar RC: Carbon allocation in trees: a review of concepts
for modelling. Ad Ecol Res 1994, 25:59-104.26. Luo Y, Field CB, Mooney HA: Predicting responses of photosynthesis and
root fraction to elevated CO2: Interactions among carbon, nitrogen, andgrowth. Plant Cell Environ 1994, 17:1195-1204.
27. Chen J, Reynolds J: A coordination model of carbon allocation in relationto water supply. Ann Bot 1997, 80:45-55.
28. Weiner J: Allocation, plasticity and allometry in plants. Perspect Plant EcolEvol Syst 2004, 6:207-215.
29. Hermans C, Hammond JP, White PJ, Verbruggen N: How do plantsrespond to nutrient shortage by biomass allocation? Trends Plant Sci2006, 11:610-617.
30. Marcelis LFM, Heuvelink E: Concepts of modelling carbon allocationamong plant organs. In Functional-Structural Plant Modelling in CropProduction. Edited by: Vos J, Marcelis LFM, de Visser PHB, Struik PC andEvers JB. Springer. Printed in the Netherlands; 2007:103-111.
31. Genard M, Dauzat J, Franck N, Lescourret F, Moitrier N, Vaast P,Vercambre G: Carbon allocation in fruit trees: From theory to modelling.Trees - Structure and Function 2008, 22:269-282.
32. West GB, Brown JH, Enquist BJ: A general model for the origin ofallometric scaling laws in biology. Science 1997, 276:122-126.
33. West GB, Brown JH, Enquist BJ: The fourth dimension of life: Fractalgeometry and allometric scaling of organisms. Science 1999,284:1677-1679.
34. West GB, Brown JH, Enquist BJ: A general model for ontogenetic growth.Nature 2001, 413:628-631.
35. Putter H, Heisterkamp SH, Lange JMA, De Wolf F: A Bayesian approach toparameter estimation in HIV dynamical models. Stat Med 2002,21:2199-2214.
36. Huang Y, Wu H: A Bayesian approach for estimating antiviral efficacy inHIV dynamic models. J Appl Stat 2006, 33:155-174.
37. Huang JZ, Liu N, Pourahmadi M, Liu L: Covariance selection andestimation via penalized normal likelihood. Biometrika 2006, 93:85-98.
38. Li L, Brown MB, Lee KH, Gupta S: Estimation and inference for a spline-enhanced population pharmacokinetic model. Biometrics 2002,58:601-611.
39. Ramsay JO: Principal differential analysis: Data reduction by differentialoperators. J Roy Stat Soc Ser B 1996, 58:495-508.
40. Ramsay JO, Silverman BW: Functional Data Analysis. 2 edition. Springer, NewYork; 2005.
41. Ramsay JO, Hooker G, Campbell D, Cao JG: Parameter estimation fordifferential equations: a generalized smoothing approach (withdiscussion). J Roy Stat Soc Ser B 2007, 69:741-796.
42. Liang H, Wu HL: Parameter estimation for differential equation modelsusing a frame-work of measurement error in regression model. J AmStat Assoc 2008, 103:1570-1583.
43. Efron B, Tibshirani RJ: An Introduction to the Bootstrap Chapman & Hall;1993.
44. Li Q, Huang Z, Xu M, Wang C, Gai J, Huang Y, Pang X, Wu RL: Functionalmapping of genotype-environment interactions for soybean growth bya semiparametric approach. Plant Methods 2010, 6:13.
45. McCarthy MC, Enquist BJ: Consistency between an allometric approachand optimal partitioning theory in global patterns of plant biomassallocation. Funct Ecol 2007, 21:713-720.
46. Jiao Y, Wang Y, Xue D, Wang J, Yan M, Liu G, Dong G, Zeng D, Lu Z, Zhu X,Qian Q, Li J: Regulation of OsSPL14 by OsmiR156 defines ideal plantarchitecture in rice. Nat Genet 2010, 42:541-544.
47. Wu S, Yap JS, Li Y, Li Q, Fu GF, Li JH, Das K, Berg A, Zeng YR, Wu RL:Network models for dissecting plant development by functionalmapping. Curr Bioinform 2009, 4:183-187.
48. Li H, Huang Z, Gai J, Wu S, Zeng Y, Wu RL: A conceptual framework formapping quantitative trait loci regulating ontogenetic allometry. PLoSONE 2007, 2(11):e1245.
49. Zhang W-K, Wang Y-J, Luo G-Z, Zhang J-S, He C-Y, Wu XL, Gai JY, Chen SY:QTL mapping of ten agronomic traits on the soybean (Glycine max L.Merr.) genetic map and their association with EST markers. Theor ApplGenet 2004, 108:1131-1139.
50. Wu RL, Ma CX, Casella G: Statistical Genetics of Quantitative Traits: Linkage,Maps, and QTL Springer-Verlag, New York; 2007.
doi:10.1186/1752-0509-5-84Cite this article as: Wu et al.: Systems mapping: how to improve thegenetic mapping of complex traits through design principles ofbiological systems. BMC Systems Biology 2011 5:84.
Submit your next manuscript to BioMed Centraland take full advantage of:
• Convenient online submission
• Thorough peer review
• No space constraints or color figure charges
• Immediate publication on acceptance
• Inclusion in PubMed, CAS, Scopus and Google Scholar
• Research which is freely available for redistribution
Submit your manuscript at www.biomedcentral.com/submit
Wu et al. BMC Systems Biology 2011, 5:84http://www.biomedcentral.com/1752-0509/5/84
Page 11 of 11
Related Documents