Patil et al., Sci. Immunol. 3, eaan8664 (2018) 19 January 2018 SCIENCE IMMUNOLOGY | RESEARCH ARTICLE 1 of 13 SYSTEMS IMMUNOLOGY Precursors of human CD4 + cytotoxic T lymphocytes identified by single-cell transcriptome analysis Veena S. Patil, 1 Ariel Madrigal, 1 Benjamin J. Schmiedel, 1 James Clarke, 1,2 Patrick O’Rourke, 1 Aruna D. de Silva, 1,3 * Eva Harris, 4 Bjoern Peters, 1,5 Gregory Seumois, 1 Daniela Weiskopf, 1 Alessandro Sette, 1,5 Pandurangan Vijayanand 1,5,6† CD4 + cytotoxic T lymphocytes (CD4-CTLs) have been reported to play a protective role in several viral infections. However, little is known in humans about the biology of CD4-CTL generation, their functional properties, and het- erogeneity, especially in relation to other well-described CD4 + memory T cell subsets. We performed single-cell RNA sequencing in more than 9000 cells to unravel CD4-CTL heterogeneity, transcriptional profile, and clonality in humans. Single-cell differential gene expression analysis revealed a spectrum of known transcripts, including several linked to cytotoxic and costimulatory function that are expressed at higher levels in the T EMRA (effector memory T cells express- ing CD45RA) subset, which is highly enriched for CD4-CTLs, compared with CD4 + T cells in the central memory (T CM ) and effector memory (T EM ) subsets. Simultaneous T cell antigen receptor (TCR) analysis in single cells and bulk subsets revealed that CD4-T EMRA cells show marked clonal expansion compared with T CM and T EM cells and that most of CD4-T EMRA were dengue virus (DENV)–specific in donors with previous DENV infection. The profile of CD4-T EMRA was highly heterogeneous across donors, with four distinct clusters identified by the single-cell analysis. We identified distinct clusters of CD4-CTL effector and precursor cells in the T EMRA subset; the precursor cells shared TCR clonotypes with CD4-CTL effectors and were distinguished by high expression of the interleukin-7 receptor. Our identification of a CD4-CTL precursor population may allow further investigation of how CD4-CTLs arise in humans and, thus, could provide insights into the mechanisms that may be used to generate durable and effective CD4-CTL immunity. INTRODUCTION After exposure to pathogens, naive CD4 + T helper (T H ) lymphocytes differentiate into memory and effector T H cell subsets: tissue-resident memory cells, which are mainly retained in the tissues, and central memory (T CM ) and effector memory (T EM ) cells, which recirculate be- tween the blood and lymphoid organs or tissues, respectively (1, 2). In addition, T H cell subsets have been classified on the basis of their cytokine profile and functional properties into T H 1, T H 2, T H 17, T H * (T H 1/T H 17), regulatory T cell, and follicular helper (T FH ) T cell sub- sets (3, 4). Although T lymphocytes with cytotoxic function (CTLs) are predominantly restricted to conventional major histocompatibility complex (MHC) class I–restricted CD8 + T lymphocytes, the existence of MHC class II–restricted T H cells with cytotoxic potential (CD4-CTLs) in humans, nonhuman primates, and mice has been reported for many decades (5, 6). However, compared with the other T H subsets, the molecular and epigenetic mechanisms that drive the differentia- tion, maintenance, and function of human CD4-CTLs are poorly understood, mainly because of the lack of precise definition of the nature of this subset in humans. CD4-CTLs were initially reported in humans with chronic viral infections such as human cytomegalovirus (hCMV), HIV, dengue virus (DENV), and hepatitis C virus (5, 7–15). CD4-CTLs have also been detected in mouse lungs as early as 1 week after acute influenza viral infection (16, 17). The magnitude of the CD4-CTL response has been associated with better clinical outcomes in both acute and chronic viral infections, implying that CD4-CTLs are an important component of the protective immune responses to viral infections (6). Furthermore, ex- pansion of CD4-CTLs has been observed in donors carrying human leukocyte antigen (HLA) alleles associated with protection from severe dengue disease (7). Thus, eliciting a strong CD4-CTL response is considered an important goal of vaccination against certain viral infections (16, 18–20). The highly effective yellow fever vaccine has been shown to elicit a strong CD4-CTL response, which is required for protection against fatal infection in mouse models (18). CD4-CTLs have also been linked to protective antitumor immune responses, espe- cially in virally induced tumors (18). Given the importance of CD4-CTLs in acquired cellular immunity, we present here the single-cell transcriptomic and T cell antigen re- ceptor (TCR) analysis of circulating human CD4-CTLs. CD4-CTLs were highly enriched in the effector memory T cells expressing CD45RA (CD4-T EMRA ) subset and displayed notable intra- and interdonor heterogeneity. We show that the magnitude of CD4-T EMRA response is linked to the degree of clonal expansion and cytotoxicity profile of CD4-CTLs. Besides a comprehensive definition of the transcriptional program of conventional CD4-CTL effectors, we identified precursor cells sharing TCR clonotypes with CD4-CTL effectors that were dis- tinguished by higher expression of the interleukin-7 receptor (IL-7R). RESULTS Cytotoxicity-related genes are enriched in the CD4-T EMRA subset Human CD4-CTLs are enriched in the CD4-T EMRA subset (defined as CD3 + CD4 + CD45RA + CCR7 − cells) (Fig. 1A), most notably in donors 1 Division of Vaccine Discovery, La Jolla Institute for Allergy and Immunology, La Jolla, CA 92037, USA. 2 Cancer Sciences Unit, Faculty of Medicine, University of Southampton, Southampton, UK. 3 Genetech Research Institute, Colombo, Sri Lanka. 4 Division of Infectious Diseases and Vaccinology, School of Public Health, University of California, Berkeley, Berkeley, CA 94720, USA. 5 Department of Medicine, University of California San Diego, 9500 Gilman Drive #0656, La Jolla, CA 92093, USA. 6 Clinical and Experimental Sciences, Sir Henry Wellcome Laboratories, Faculty of Medicine University of Southampton, Southampton, UK. *Present address: Department of Paraclinical Sciences, Faculty of Medicine, Kotelawala Defense University, Ratmalana, Sri Lanka. †Corresponding author. Email: [email protected] Copyright © 2018 The Authors, some rights reserved; exclusive licensee American Association for the Advancement of Science. No claim to original U.S. Government Works by guest on August 12, 2019 http://immunology.sciencemag.org/ Downloaded from

Welcome message from author
This document is posted to help you gain knowledge. Please leave a comment to let me know what you think about it! Share it to your friends and learn new things together.
Transcript

Patil et al., Sci. Immunol. 3, eaan8664 (2018) 19 January 2018
S C I E N C E I M M U N O L O G Y | R E S E A R C H A R T I C L E
1 of 13
S Y S T E M S I M M U N O L O G Y
Precursors of human CD4+ cytotoxic T lymphocytes identified by single-cell transcriptome analysisVeena S. Patil,1 Ariel Madrigal,1 Benjamin J. Schmiedel,1 James Clarke,1,2 Patrick O’Rourke,1 Aruna D. de Silva,1,3* Eva Harris,4 Bjoern Peters,1,5 Gregory Seumois,1 Daniela Weiskopf,1 Alessandro Sette,1,5 Pandurangan Vijayanand1,5,6†
CD4+ cytotoxic T lymphocytes (CD4-CTLs) have been reported to play a protective role in several viral infections. However, little is known in humans about the biology of CD4-CTL generation, their functional properties, and het-erogeneity, especially in relation to other well-described CD4+ memory T cell subsets. We performed single-cell RNA sequencing in more than 9000 cells to unravel CD4-CTL heterogeneity, transcriptional profile, and clonality in humans. Single-cell differential gene expression analysis revealed a spectrum of known transcripts, including several linked to cytotoxic and costimulatory function that are expressed at higher levels in the TEMRA (effector memory T cells express-ing CD45RA) subset, which is highly enriched for CD4-CTLs, compared with CD4+ T cells in the central memory (TCM) and effector memory (TEM) subsets. Simultaneous T cell antigen receptor (TCR) analysis in single cells and bulk subsets revealed that CD4-TEMRA cells show marked clonal expansion compared with TCM and TEM cells and that most of CD4-TEMRA were dengue virus (DENV)–specific in donors with previous DENV infection. The profile of CD4-TEMRA was highly heterogeneous across donors, with four distinct clusters identified by the single-cell analysis. We identified distinct clusters of CD4-CTL effector and precursor cells in the TEMRA subset; the precursor cells shared TCR clonotypes with CD4-CTL effectors and were distinguished by high expression of the interleukin-7 receptor. Our identification of a CD4-CTL precursor population may allow further investigation of how CD4-CTLs arise in humans and, thus, could provide insights into the mechanisms that may be used to generate durable and effective CD4-CTL immunity.
INTRODUCTIONAfter exposure to pathogens, naive CD4+ T helper (TH) lymphocytes differentiate into memory and effector TH cell subsets: tissue-resident memory cells, which are mainly retained in the tissues, and central memory (TCM) and effector memory (TEM) cells, which recirculate be-tween the blood and lymphoid organs or tissues, respectively (1, 2). In addition, TH cell subsets have been classified on the basis of their cytokine profile and functional properties into TH1, TH2, TH17, TH* (TH1/TH17), regulatory T cell, and follicular helper (TFH) T cell sub-sets (3, 4). Although T lymphocytes with cytotoxic function (CTLs) are predominantly restricted to conventional major histocompatibility complex (MHC) class I–restricted CD8+ T lymphocytes, the existence of MHC class II–restricted TH cells with cytotoxic potential (CD4-CTLs) in humans, nonhuman primates, and mice has been reported for many decades (5, 6). However, compared with the other TH subsets, the molecular and epigenetic mechanisms that drive the differentia-tion, maintenance, and function of human CD4-CTLs are poorly understood, mainly because of the lack of precise definition of the nature of this subset in humans.
CD4-CTLs were initially reported in humans with chronic viral infections such as human cytomegalovirus (hCMV), HIV, dengue virus (DENV), and hepatitis C virus (5, 7–15). CD4-CTLs have also been
detected in mouse lungs as early as 1 week after acute influenza viral infection (16, 17). The magnitude of the CD4-CTL response has been associated with better clinical outcomes in both acute and chronic viral infections, implying that CD4-CTLs are an important component of the protective immune responses to viral infections (6). Furthermore, ex-pansion of CD4-CTLs has been observed in donors carrying human leukocyte antigen (HLA) alleles associated with protection from severe dengue disease (7). Thus, eliciting a strong CD4-CTL response is considered an important goal of vaccination against certain viral infections (16, 18–20). The highly effective yellow fever vaccine has been shown to elicit a strong CD4-CTL response, which is required for protection against fatal infection in mouse models (18). CD4-CTLs have also been linked to protective antitumor immune responses, espe-cially in virally induced tumors (18).
Given the importance of CD4-CTLs in acquired cellular immunity, we present here the single-cell transcriptomic and T cell antigen re-ceptor (TCR) analysis of circulating human CD4-CTLs. CD4-CTLs were highly enriched in the effector memory T cells expressing CD45RA (CD4-TEMRA) subset and displayed notable intra- and interdonor heterogeneity. We show that the magnitude of CD4-TEMRA response is linked to the degree of clonal expansion and cytotoxicity profile of CD4-CTLs. Besides a comprehensive definition of the transcriptional program of conventional CD4-CTL effectors, we identified precursor cells sharing TCR clonotypes with CD4-CTL effectors that were dis-tinguished by higher expression of the interleukin-7 receptor (IL-7R).
RESULTSCytotoxicity-related genes are enriched in the CD4-TEMRA subsetHuman CD4-CTLs are enriched in the CD4-TEMRA subset (defined as CD3+CD4+CD45RA+CCR7− cells) (Fig. 1A), most notably in donors
1Division of Vaccine Discovery, La Jolla Institute for Allergy and Immunology, La Jolla, CA 92037, USA. 2Cancer Sciences Unit, Faculty of Medicine, University of Southampton, Southampton, UK. 3Genetech Research Institute, Colombo, Sri Lanka. 4Division of Infectious Diseases and Vaccinology, School of Public Health, University of California, Berkeley, Berkeley, CA 94720, USA. 5Department of Medicine, University of California San Diego, 9500 Gilman Drive #0656, La Jolla, CA 92093, USA. 6Clinical and Experimental Sciences, Sir Henry Wellcome Laboratories, Faculty of Medicine University of Southampton, Southampton, UK.*Present address: Department of Paraclinical Sciences, Faculty of Medicine, Kotelawala Defense University, Ratmalana, Sri Lanka.†Corresponding author. Email: [email protected]
Copyright © 2018 The Authors, some rights reserved; exclusive licensee American Association for the Advancement of Science. No claim to original U.S. Government Works
by guest on August 12, 2019
http://imm
unology.sciencemag.org/
Dow
nloaded from

Patil et al., Sci. Immunol. 3, eaan8664 (2018) 19 January 2018
S C I E N C E I M M U N O L O G Y | R E S E A R C H A R T I C L E
2 of 13
with previous DENV and CMV infection (5, 7–10). To capture the extent of cellular heterogeneity among human CD4-CTLs, we per-formed single-cell RNA sequencing (RNA-seq) in more than 9000 cells isolated ex vivo from the TEMRA subset and, as a control, in TH subsets that contain relatively fewer CD4-CTLs, such as TEM (CD3+CD4+CD45RA−CCR7− cells) and TCM (CD3+CD4+CD45RA−CCR7+
cells) subsets (Fig. 1A and table S1) (21). Using complementary methods of single-cell differential gene expression analysis [SCDE and MAST analysis, see Supplementary Materials and Methods and in (22, 23)], we compared the full-length transcriptome of CD4+ T lymphocytes present in TEMRA, TEM, and TCM subsets from three donors with pre-vious DENV infection, carrying the HLA allele (DRB1*0401) previously
CD45RA + – +–
CCR7 – –+ +
TN TEMRATEMTCM
CD4+ T cell memory subsetsA E
C
2 4 6 8 10 120
Mean expression
Log 2
(TP
M +
1) e
xpre
ssio
n
0
1020 GZMH PRF1
0
1020
GNLY
0
1020
0
10
20 CTSW
0
10
20 CCL4
0
1020 GZMB
SPON2
0
1020
FCRL6
0
1020
CD244/NKR2B4
0
10
20S1PR5
0
1020
010
20 EOMES
01020 CX3CR1
NKG7/TIA1
0
1020
0
10
20 TBX21
0
1020 ZNF683
Transcription factors
Cytotoxicity-related genes
G
F
0
1
2
3
4
5
6
0
20
40
60
80
100
–Log (P
value)
Per
cent
age
Color key and histogram
0 0.2 0.4 0.601
3
5
Correlation value
Cou
nts
(×10
0)
NKG7
GZMB
FGFBP2
GZMH
GNLY
CX3CR1
GPR56
PFN1
CTSW
EFHD2
SAMD3
S1PR5
PRF1
SPON2
CST7
ITGAL
CCL5
GPR114
PFN1P1
GAB3
APMAP
KIF23
ITGB7
TGFBR3
VCL
FCRL6
ENC1
MYO6
PRSS23
DIP2A
TRGC2
SLAMF7
ZEB2
LAG3
SYNE1
ZNF683
PLEK
Overlap with data set
No overlap with data set
–Log (P value)
TEMRA7.3
TN57.4
TEM12.4C
D45
RA
CCR7
TCM22.9
B
111
1890
GZMB
PRF1
GZMH
GNLY
CCL4
CCL5
CTSW
EOMES
TBX21
ZNF683
FCRL6
SPON2
CX3CR1
S1PR5
NKG7
CD244
z score
–2 0 2
TEMRA(143 cells)
TEM(139 cells)
TCM(141 cells)
TEMRA
TEM
D
CX3CR1 GPR56 CD244
GZMBKLRG1
TEMRA
TEM
TEMRA
TEM
TEMRA
TEM
TEMRA
TEM
TEMRA
TEM
CD
45R
A
3.6 51.3
27.217.9
4.4 51.3
24.619.8
8.5 2.2
0.988.3
PRF1
TEMRA
TEM
7.0 50.3
23.319.5
5.0 7.1
24.663.2
4.4 25.3
27.842.5
GZMBCX3CR1
20406080
100
0
GPR56
20406080
100
0
CD244
20406080
100
0
CD314
20406080
100
0
KLRG1
20406080
100
020406080
100
0
Cel
ls (%
) *** *** *** ** **** **
20
40
60
80
0
PRF1**
CD
3+C
D4+
CC
R7–
subs
et
CD314
TEM
49.1 5.1
0.545.2
TEMRA
CD3+CD4+ subset
CD8 effector signature (up genes)
NES = 2.03FDR < 0.0001
–10
0
10
Met
ric
0
0.2
0.4
–0.2
RE
S
CD8 effector signature (down genes)
NES = –1.65FDR = 0.001
–100
10
–0.2–0.4
0.20
–0.6
NK cell signature (up genes)
NES = 1.97FDR < 0.0001
–100
10
00.20.4
–0.2
0.6
5 10 15 20 25 5 10 15 20 25 5 10 15 20 25
Variable index (×1000)
Fig. 1. Cytotoxicity-related transcripts are enriched in the CD4-TEMRA sub-set. (A) Schematic representation of the CD4+ T cell subsets and their surface markers used for the study. (B) Single-cell RNA-seq analysis showing row-wise z scores of normalized TPM (transcripts per million) counts of cells in each subset (indicated at the top) for each differentially expressed transcript (rows) obtained by pairwise comparison of TEMRA versus TEM, TEMRA versus TCM, and TEM versus TCM [single- cell differential expression (SCDE) and model-based analysis of single-cell tran-scriptomics (MAST) analysis, Benjamini- Hochberg adjusted P < 0.05 and ≥2-fold change). (C) Violin plots show the single- cell expression pattern of the indicated TEMRA-enriched transcripts (c yto toxicity-related and TFs) in the indicated subsets. The shapes represent the distribution of cells based on their log2(TPM + 1) ex-pres sion values (y axis). The color scale repre sents the mean expression. (D) The contour plots show the surface expres-sion of CD45RA, CX3CR1, GPR56, CD244, CD314, and KLRG1 and intracellular expres- sion of GZMB and PRF1 in singlet- gated CD3+CD4+CCR7− cells. The numbers de-note the percentage of cells in each quad-rant. Bar graphs beneath show the average percentages. Error bars are mean ± SEM from 9 (GZMB), 10 (CX3CR1), and 11 (other indicated proteins) donors. **P < 0.001, ***P < 0.0005, and ****P < 0.0001 from Student’s paired two- tailed t test. (E) GSEA enrichment plots for the indicated gene sets in the transcriptome of TEMRA versus TEM and TCM (see Supplementary Materi-als and Methods). The top portion of the plot shows the running enrichment score (RES) for the gene set as the analysis walks down the ranked list of genes and reflects the degree to which the gene set is over-represented at the top or bottom of the ranked list of genes. The middle portion of the plot shows where the members of the gene set (indicated as blue lines) ap-pear in the ranked list of genes. The bot-tom portion of the plot shows the value of the ranking metric. NES, normalized enrichment score; FDR, false discovery rate. (F) IPA of canonical pathways en-riched in the TEMRA subset; P values calculated by Fisher exact test (see Supplementary Materials and Methods). (G) Spearman correlation plot showing the coexpression of the 111 TEMRA-enriched transcripts. Dashed black box shows a cluster of transcripts showing high correlation; the list of these transcripts is shown in the text box on the right, and stars highlight the genes not previously reported to have cytotoxic function.
by guest on August 12, 2019
http://imm
unology.sciencemag.org/
Dow
nloaded from
Patil et al., Sci. Immunol. 3, eaan8664 (2018) 19 January 2018
S C I E N C E I M M U N O L O G Y | R E S E A R C H A R T I C L E
3 of 13
reported to be protective against severe dengue disease (Fig. 1B and table S1) (7, 24).
We found 111 “TEMRA-enriched” transcripts with significantly higher mean expression in single cells from the TEMRA subset compared with the TEM and TCM subsets (see Supplementary Materials and Methods, Fig. 1B, and table S2). These included several transcripts linked to the cytotoxic function of CD8+ T lymphocytes and natural killer (NK) cells such as GZMB, PRF1, GZMH, GNLY, CCL4, CTSW, FCRL6, SPON2, CX3CR1, S1PR5, NKG7, and CD244 (Fig. 1, B and C) (6, 25); we confirmed the expression of some of these transcripts (CX3CR1, GPR56, CD244, CD314, KLRG1, GZMB, and PRF1) at the protein level (Fig. 1D). Gene set enrichment analysis (GSEA) (26) and ingenuity pathway analysis (IPA) of TEMRA-enriched transcripts also revealed significant overrepresentation of cytotoxicity signature genes in the TEMRA subset (Fig. 1, E and F). Transcripts encoding tran-scription factors (TFs) related to CTL function such as ZNF683 (Hobit), and Eomes and T-bet (encoded by TBX21) were also expressed at higher levels in single cells from the TEMRA subset (Fig. 1, B and C). ZNF683 has recently been shown to identify human CD4-CTLs (24), and Eomes and T-bet appear to be important in the development of CD4-CTLs (27, 28). These results confirm that human CD4-CTLs are highly enriched in the TEMRA subset. Coexpression analysis of TEMRA- enriched transcripts also revealed a number of genes (PFN1, PFN1P1, EFHD2, VCL, DIP2A, SYNE1, and PLEK) (29–32) whose expression was highly correlated with cytotoxicity signature genes, suggesting that the products of these genes may also play important roles in the de-velopment or function of CD4-CTLs (Fig. 1G).
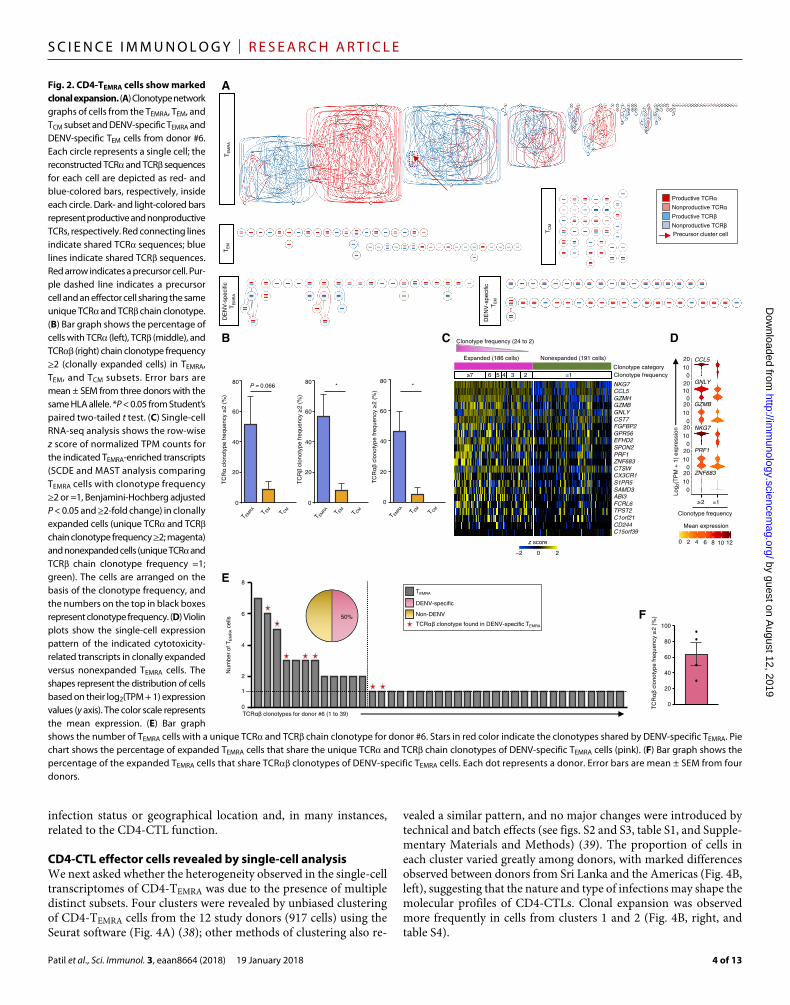
CD4-CTLs show marked clonal expansionGiven that memory CD4-CTLs are mainly generated after exposure to certain viruses such as DENV or CMV (5, 7–10), we expected to see a more restricted TCR repertoire, that is, greater clonal expansion in the CD4-TEMRA subset compared with CD4+ T lymphocytes in the TEM or TCM subsets, which harbor a more common memory pool. We performed parallel analysis of the TCR repertoire in single cells by decoding the full-length transcriptome profiles generated by the Smart-seq2 assay (33, 34). Using the TraCeR software (35), we re-constructed the TCR chains in 41 to 89% of single cells, the TCR chain in 31 to 81%, and both chains in 22 to 70% of cells across all memory subsets (table S3). As expected, a greater clonal expansion was observed in the TEMRA subset compared with other subsets, as shown by highly interconnected clonotype network graphs for single cells from donor #6 (Fig. 2A). Furthermore, the analysis of single cells that shared TCR or TCR chain clonotypes showed that more than 50% of cells in the TEMRA subset were clonally expanded (Fig. 2B, left and middle). To address the rare possibility of independent cells sharing one of the TCR chains, we also analyzed single cells that shared both TCR and TCR chain clonotypes and found that ~46% of cells in the TEMRA subset (CD4-CTL–enriched) were clonally ex-panded compared with only ~5% and none of the cells in TEM and TCM subsets, respectively (Fig. 2B, right, and table S4). Together, these results suggested a highly restricted TCR repertoire in the TEMRA sub-set (Fig. 2, A and B). The clonally expanded cells had a higher mean expression of cytotoxic signature genes (TEMRA-enriched gene set) (Fig. 2, C and D), suggestive of greater effector potential (6, 25, 36).
To probe the pathogen specificity of clonally expanded CD4-TEMRA cells (CD4-CTL–enriched), we first determined the TCR clonotype of single cells in the CD4-TEMRA subset that responded ex vivo to a pool of DENV-specific peptides (7, 37) from four donors with previ-
ous DENV infection (Fig. 2, E and F, fig. S1, and table S4). Next, we asked what fraction of these DENV-specific TCR clonotypes was present in the general pool of cells present in the TEMRA subset from the same donor. On an average, 64% (n = 4) of the clonally expanded cells in the general TEMRA population carried the DENV-specific TCR clonotypes, and in all donors, one or both of the top two clonally expanded clonotypes in the TEMRA population were always DENV- specific (Fig. 2, E and F, fig. S1, and table S4), which suggested that most of the clonally expanded cells in the TEMRA population in these individuals were specific for DENV.
CD4-CTLs (CD4-TEMRA cells) are heterogeneous across donorsWe next asked whether the clonality and transcriptome of CD4-CTLs differed between donors with and without previous DENV infection or among donors across different geographical locations [Sri Lanka (Asia) and the Americas (Nicaragua and San Diego, California)]. We observed a wide range in the proportion (0 to 88%; median, 44%) of clonally expanded cells across the 12 donors with no major differences in their proportion when classifying donors based on previous DENV infection status or geographical location [Sri Lanka (Asia) versus the Americas; table S1]. When we compared the percentage of clonally expanded cells between donors with higher versus lower proportion of CD4+ T lymphocytes in the TEMRA subset (classified as TEMRA
high or TEMRA
low donors), we observed greater clonal expansion in TEMRAhigh
donors (Fig. 3A). Consistent with this finding, there was a positive correlation between the proportion of CD4+ T lymphocytes in the TEMRA subset and the percentage of clonally expanded cells, suggesting that donors with a larger TEMRA pool have a greater degree of clonal expansion (Fig. 3B).
In most donors, we observed sharing of a single unique TCR and TCR chain clonotype in a large fraction of CD4-TEMRA cells, as exampled in donor #4 [58% (11 of 19)], donor #1 [50% (21 of 42)], donor #2 [41% (24 of 58)], donor #5 [37% (11 of 30)], donor #8 [22% (6 of 27)], donor #3 [16% (4 of 25)], and donor #6 [10% (7 of 67)] of cells (Fig. 3C). Considering some of these donors were previ-ously infected with DENV (DENV+ donors) raised the hypothesis that selection and expansion of such TCR clonotypes may be linked to the DENV infection. Even in donors without previous DENV in-fection (DENV− donors), we observed very high levels of clonal ex-pansion (Fig. 3C), suggesting that other infections—perhaps CMV, which is common in the general population—may also contribute to the preferential expansion of some CD4-CTL clones.
Besides the heterogeneity in clonality, we also observed marked vari-ability in the expression of TEMRA-enriched transcripts in CD4-TEMRA cells across the study donors (Fig. 3, D and E). For several cytotoxicity- related transcripts, the expression pattern was highly variable across the 12 donors (Fig. 3, D and E). CD4-TEMRA cells from donors with a larger preexisting TEMRA pool and greater clonal expansion displayed more cytotoxic features (Fig. 3D). In other words, cytotoxicity-related transcripts were expressed in a greater fraction of single cells or at higher mean levels; other TEMRA-enriched transcripts such as ZNF683, PRSS23, FCRL6, and IFIT2 also showed a similar pattern (Fig. 3, D and E). We confirmed at the protein level that greater proportion of CD4-TEMRA cells expressed cytotoxicity-related molecules CD244, GPR56, GZMB, and PRF1 in donors with larger preexisting TEMRA pool (Fig. 3F). Therefore, our combined transcriptomic, protein, and TCR analysis suggests that the CD4-TEMRA subset exhibits quantitative and qualita-tive differences across different donors irrespective of their DENV
by guest on August 12, 2019
http://imm
unology.sciencemag.org/
Dow
nloaded from
Patil et al., Sci. Immunol. 3, eaan8664 (2018) 19 January 2018
S C I E N C E I M M U N O L O G Y | R E S E A R C H A R T I C L E
4 of 13
infection status or geographical location and, in many instances, related to the CD4-CTL function.
CD4-CTL effector cells revealed by single-cell analysisWe next asked whether the heterogeneity observed in the single-cell transcriptomes of CD4-TEMRA was due to the presence of multiple distinct subsets. Four clusters were revealed by unbiased clustering of CD4-TEMRA cells from the 12 study donors (917 cells) using the Seurat software (Fig. 4A) (38); other methods of clustering also re-
vealed a similar pattern, and no major changes were introduced by technical and batch effects (see figs. S2 and S3, table S1, and Supple-mentary Materials and Methods) (39). The proportion of cells in each cluster varied greatly among donors, with marked differences observed between donors from Sri Lanka and the Americas (Fig. 4B, left), suggesting that the nature and type of infections may shape the molecular profiles of CD4-CTLs. Clonal expansion was observed more frequently in cells from clusters 1 and 2 (Fig. 4B, right, and table S4).
TCR clonotypes for donor #6 (1 to 39)
1
2
4
6
8
0
TE
MR
A
TC
M
TE
M
A
B
E
Productive TCR
Nonproductive TCR
Nonproductive TCR
Productive TCR
Precursor cluster cell
DE
NV
-spe
cific
T
EM
RA
DE
NV
-spe
cific
T
EM
F
Num
ber
of T
EM
RA
cells
Non-DENV
DENV-specific
TEMRA
TCR clonotype found in DENV-specific TEMRA
TC
R c
lono
type
freq
uenc
y 2
(%)
0
20
40
60
80
100
*
TC
R c
lono
type
freq
uenc
y 2
(%)
20
40
60
80
0
TC
R c
lono
type
freq
uenc
y 2
(%)
TC
R c
lono
type
freq
uenc
y 2
(%)
*P = 0.066
20
40
60
80
0
20
40
60
80
0
50%
C
Nonexpanded (191 cells)
D
CCL5
GNLY
GZMB
NKG7
PRF1
ZNF683
2 =1
010
200
10
200
10
200
10
20
010
20
01020
Log 2
(TP
M +
1)
expr
essi
on
Clonotype frequency
NKG7CCL5GZMHGZMBGNLYCST7FGFBP2GPR56EFHD2SPON2PRF1ZNF683CTSWCX3CR1S1PR5SAMD3ABI3FCRL6TPST2C1orf21CD244C15orf39
Clonotype frequency (24 to 2)
Clonotype frequency Clonotype category
Expanded (186 cells)
2 4 6 8 10 120
Mean expression
234567 =1
z score
−2 0 2
Fig. 2. CD4-TEMRA cells show marked clonal expansion. (A) Clonotype network graphs of cells from the TEMRA, TEM, and TCM subset and DENV-specific TEMRA and DENV-specific TEM cells from donor #6. Each circle represents a single cell; the reconstructed TCR and TCR sequences for each cell are depicted as red- and blue-colored bars, respectively, inside each circle. Dark- and light-colored bars represent productive and nonproductive TCRs, respectively. Red connecting lines indicate shared TCR sequences; blue lines indicate shared TCR sequences. Red arrow indicates a precursor cell. Pur-ple dashed line indicates a precursor cell and an effector cell sharing the same unique TCR and TCR chain clonotype. (B) Bar graph shows the percentage of cells with TCR (left), TCR (middle), and TCR (right) chain clonotype frequency ≥2 (clonally expanded cells) in TEMRA, TEM, and TCM subsets. Error bars are mean ± SEM from three donors with the same HLA allele. *P < 0.05 from Student’s paired two-tailed t test. (C) Single- cell RNA-seq analysis shows the row-wise z score of normalized TPM counts for the indicated TEMRA-enriched transcripts (SCDE and MAST analysis comparing TEMRA cells with clonotype frequency ≥2 or =1, Benjamini-Hochberg adjusted P < 0.05 and ≥2-fold change) in clonally expanded cells (unique TCR and TCR chain clonotype frequency ≥2; magenta) and nonexpanded cells (unique TCR and TCR chain clonotype frequency =1; green). The cells are arranged on the basis of the clonotype frequency, and the numbers on the top in black boxes represent clonotype frequency. (D) Violin plots show the single-cell expression pattern of the indicated cytotoxicity- related transcripts in clonally expanded versus nonexpanded TEMRA cells. The shapes represent the distribution of cells based on their log2(TPM + 1) expression values (y axis). The color scale represents the mean expression. (E) Bar graph shows the number of TEMRA cells with a unique TCR and TCR chain clonotype for donor #6. Stars in red color indicate the clonotypes shared by DENV-specific TEMRA. Pie chart shows the percentage of expanded TEMRA cells that share the unique TCR and TCR chain clonotypes of DENV-specific TEMRA cells (pink). (F) Bar graph shows the percentage of the expanded TEMRA cells that share TCR clonotypes of DENV-specific TEMRA cells. Each dot represents a donor. Error bars are mean ± SEM from four donors.
by guest on August 12, 2019
http://imm
unology.sciencemag.org/
Dow
nloaded from

Patil et al., Sci. Immunol. 3, eaan8664 (2018) 19 January 2018
S C I E N C E I M M U N O L O G Y | R E S E A R C H A R T I C L E
5 of 13
Single-cell differential gene expression analysis among the four clusters revealed notable differences in their molecular profiles (Fig. 4C, fig. S4, A to D, and table S5). IPA and differential expression analysis of the transcripts enriched in clusters 1 and 2 compared with clusters 3 and 4 showed significant overrepresentation of genes encoding products related to cytotoxicity, such as GZMB, GZMH, PRF1, GNLY, NKG7, ZNF683, and FGFBP2 (figs. S4, C and D, and S5 and table S5). Among these two clusters (1, 2), cluster 2 shows further enrichment for the cytotoxicity-related genes (figs. S4A and S5A), which suggested that cells in cluster 2 had a higher cytotoxic potential. Pairwise comparison of the clusters (fig. S4D and table S5) showed differences in the en-
richment of cytotoxicity-related genes among clusters 1 and 2; although several of them were expressed by both the clusters (GZMB, GZMH, GNLY, NKG7, FASLG, and CASP10), many were expressed in a cluster-specific manner (Fig. 4, D and E, fig. S4D, and table S5). On the basis of the differential expression pattern of cytotoxicity-related tran-scripts in cluster 1 (FADD, IFNG, TNF, IFIT2, LMNA, CD69, FOS, JUN, DUSP1, and DUSP2) and cluster 2 (FGFBP2, SPON2, CX3CR1, GPR56, and PRF1), we hypothesize that their cytotoxic function is preferentially mediated by the FAS/death receptor and perforin path-ways, respectively, which requires further functional verification (Fig. 4, D and E, fig. S4, A and D, and table S5).
PRF1
GZMH
IFIT2
GPR56
CSTW
NKG7
Donors (1 to 12)
0
10
20
0
10
20
0
10
20
0
10
20
0
10
20
Log 2
(TP
M +
1)
expr
essi
on
A
D
NKG7GNLYFGFBP2GZMBS1PR5CST7CTSWPRSS23PRF1GZMHFCRL6CD244GPR56
z score
−2 0 2
Donor #
Cell type
ns ***ns
CT
CR
clon
otyp
e fr
eque
ncy
2 (%
)
Donors (1 to 12)
E
CD4-TEMRA frequency (% )
r = 0.8792P = 0.0004
B
Clone 1
Clone 2
All others
Unique clones
Donor #1
Donor #7
Donor #2 Donor #4
Donor #10Donor #9
DE
NV
−do
nors
Donor #6Donor #5
Donor #8 Donor #12
Donor #3
Donor #11
DE
NV
+do
nors
TC
R c
lono
type
freq
uenc
y 2
(%)
20
40
60
80
100
0
20
40
60
80
100
0
20
40
60
80
100
0
20
40
60
80
100
0
50
100
00.5 1 2 321684
TEMRA TEM TCM
1 2 3 4 5 6 7 8 9 10 11 12 3 6 12 3 6 12
CD4-TEMRA frequency
F
CD
244+
TE
MR
A c
ells
(%
)
TE
MR
Ain
CD
4+T
cel
ls (
%)
GP
R56
+T
EM
RA
cel
ls (
%)
TE
MR
Ain
CD
4+ T
cel
ls (
%)
**** ***
GZ
MB
+T
EM
RA
cel
ls (
%)
TE
MR
Ain
CD
4+T
cel
ls (
%)
***
TE
MR
Ain
CD
4+T
cel
ls(%
)
5
10
15
20
0
5
10
15
20
0
5
10
15
20
0
5
10
15
20
0
PR
F1+
TE
MR
A c
ells
(%
)
20
40
60
100
0
80
20
40
60
100
0
80
20
40
60
100
0
80
20
40
60
100
0
80
**
0
10
20
2 4 6 8 10 120
Mean expression
50%
16%
41%58%
37%
22%
7%
10%
36%27%
Fig. 3. CD4-TEMRA cells are heteroge-neous across donors. (A) Bar graph shows the percentage of clonally ex-panded TEMRA cells (cells having a unique TCR and TCR chain clonotype with frequency ≥2) across 12 donors (left) and between donors classified on the basis of their status of previous DENV infection (DENV+ and DENV−), geograph-ical location [Sri Lanka, Nicaragua, and San Diego (the Americas)], and CD4-TEMRA proportion (TEMRA
high, donors #1 to #6; TEMRA
low, donors #7 to #12). Each dot represents data from a single donor. Error bars are mean ± SEM. ***P = 0.001 from Student’s unpaired two-tailed t test; ns, not significant. (B) Correlation be-tween the proportions of the CD4-TEMRA subset in CD4+ T cells and clonally ex-panded TEMRA cells (cells having a unique TCR and TCR chain clonotype with fre-quency ≥2). r, Spearman correlation co-efficient; P, by Student’s two-tailed paired t test. (C) Pie charts show the percentage of TEMRA cells with the first (clone 1) and second (clone 2) most frequent unique TCR and TCT chain clonotype, as well as other clonally expanded cells (all others) and the rest of the TCR and TCR chain clonotypes present in only one cell (unique clones). (D) Single-cell RNA-seq analysis of TEMRA (blue), TEM (yellow), and TCM (brown) cells shows the row-wise normalized mean TPM counts of 111 TEMRA-enriched tran-scripts [from Fig. 1 (B and C)] (rows) for each donor (column). The panel above the heat map identifies the cell type and donor number (#1 to #12, ordered on the basis of the frequency of the CD4- TEMRA subset). (E) Violin plots show the single-cell expression pattern of the indicated transcripts in the TEMRA sub-set across the 12 donors. The shapes represent the distribution of cells based on their log2(TPM + 1) expression val-ues (y axis). The color scale represents the mean expression. (F) Matched data from the same donors showing the proportion of TEMRA cells in the CD4+ T cell subset (blue) and the proportion of CD244+ (red), GPR56+ (green), GZMB+ (pink), and PRF1+ (dark blue) TEMRA cells from 9 to 11 donors. Each dot represents a donor. **P < 0.001, ***P < 0.0005, and ****P < 0.0001 from Student’s paired two-tailed t test.
by guest on August 12, 2019
http://imm
unology.sciencemag.org/
Dow
nloaded from

Patil et al., Sci. Immunol. 3, eaan8664 (2018) 19 January 2018
S C I E N C E I M M U N O L O G Y | R E S E A R C H A R T I C L E
6 of 13
Cells in clusters 1 and 2 expressed higher levels of KLRG1 (40–42) and CX3CR1 (7, 43) transcripts, which are linked to effector status of memory cells, and lower levels of CD27 and CD28 transcripts, which encode costimulation molecules (Figs. 4E and 5, A and B) (44, 45). These results indicate that cells in clusters 1 and 2 have a terminal effector state and hence are CD4-CTL effectors with high cytotoxic potential. Genes linked to cell survival and CD4-CTL function such as PRSS23, SPON2, TCF7 (encodes for TCF1), CRTAM, and ZNF683 (encodes for Hobit) (24, 46–51) were also highly expressed in single cells from clusters 1 and 2 (Fig. 4E). The role of ZNF683 (Hobit) (24, 46, 49)
and other transcripts (PRSS23, SPON2, and TCF7) (47, 48) in the survival and long-term persistence of these high cytotoxic terminal effector cells deserves further investigation (45).
The TEMRA subset includes CD4-CTL precursor cellsWe next examined the transcriptional profiles of cells in clusters 3 and 4 to evaluate their clonal origin and functional relationship to the other cell populations. Compared with cells in clusters 1 and 2 (referred as CD4-CTL effectors), those in clusters 3 and 4 expressed lower levels of KLRG1 transcripts and higher levels of transcripts encoding IL-7R
A D
B
Cel
ls in
eac
h cl
uste
r (%
)
TCR
αβcl
onot
ype
frequ
ency
≥2
(%)
C
GZMB
Cluster 1Cluster 2Cluster 3Cluster 4
IFNG
FGFBP2
CCL4
ZNF683
[Expression]Log2(TPM + 1)
5 100
E
Log 2
(TPM
+ 1
) exp
ress
ion
IFIT2
CCL4
IFNG
IFIT3
ZEB2
CRTAM
CASP8
NKG7
PRF1
GPR56
GZMH
FCRL6
CX3CR1
FGFBP2
SPON2
ZNF683
GZMB
CST7
CDKNA
ZFP36
ZNF331
FOS
GPR13
CD44
TOM1
GATA3
IFNGR1
AQP3
TCF7
IL7R
LEF1
LTB
CD28
CDKN2
PTEN
GZMK
20
40
60
80
100
0
20
40
60
80
100
0
z score
–2 0 2
0
10
20
0
10
20
0
10
20
0
10
20
0
10
20
0
10
20
0
10
20
0
10
20
0
10
20
0
10
20
0
10
20
0
10
20
0
10
20
0
10
20
0
10
20
0
10
20
GZMB
GZMH
ZNF683
PRSS23
IFIT2
CCL4
IFNG
GNLY
GPR56
CTSW
CST7
PRF1
NKG7
PLEK
CX3CR1
FGFBP2
Cluster 2 (223 cells)
Cluster 1 (384 cells)
Cluster 3 (217 cells)
Cluster 4 (93 cells)20
0
–20
200–20
tSNE1
tSN
E2
Donor number The Americas Sri Lanka
2 1 3 5 8 12 4 7 6 11 9 10
2 4 6 8 10 120
Mean expression
GNLY
B2M
PRF1Fig. 4. Four distinct subsets of CD4- CTLs revealed by single-cell RNA-seq analysis. (A) t-Distributed stochas tic neighbor embedding (tSNE) two- dimensional (2D) plot of single-cell RNA- seq data (n = 917 cells, based on 1000 most variable transcripts) shows four distinct clusters of cells in the TEMRA sub-set. (B) Bar graph shows the distribution of cells across four clusters in each in-dicated donor (donor numbers match those in table S1) classified on the basis of geographical location (the Americas and Sri Lanka, left) and the per centage of clonally expanded cells (cells having a unique TCR and TCR chain clonotype with frequency ≥2) in each clus ter (right). (C) Single-cell RNA-seq anal ysis shows row-wise z scores of mean- normalized TPM counts of cells in each cluster for each differentially expressed transcripts (rows) obtained by pairwise comparison of each cluster versus the rest of the clus-ters (Seurat analysis, Benjamini- Hochberg adjusted P < 0.05) for the four clusters. (D) tSNE 2D plots of single-cell RNA-seq data show the expression of the indi-cated differentially expressed transcripts (SCDE and MAST analysis, Benjamini- Hochberg adjusted P < 0.05 and ≥2-fold change). B2M is shown as a control house-keeping gene. (E) Violin plots show the single-cell expression pattern of the indicated differentially expressed tran-scripts across four TEMRA clusters along with TCM. The shapes represent the distribution of cells based on their log2(TPM + 1) expression values (y axis). The color scale represents the mean expression.
by guest on August 12, 2019
http://imm
unology.sciencemag.org/
Dow
nloaded from

Patil et al., Sci. Immunol. 3, eaan8664 (2018) 19 January 2018
S C I E N C E I M M U N O L O G Y | R E S E A R C H A R T I C L E
7 of 13
(IL7R or CD127), which is known to play an important role in me-diating the long-term homeostatic survival of naive and memory T lymphocytes (Fig. 5A) (52–55). The mean expression of IL7R transcripts in cluster 4 cells was even higher than that in TCM cells (Fig. 5, A and B). The opposing expression pattern of KLRG1 and IL7R transcripts in clusters 3 and 4 is similar to that observed in mem-
ory precursor effector cells (IL-7Rhigh and KLRG1−) described in murine models of resolving acute infections (52, 56). Transcripts encoding CD27 and CD28 costimulation molecules, lymphotoxin (LTB), and JUNB TF were also expressed at higher levels in clusters 3 and 4, similar to the pattern observed in TCM cells (Fig. 5, B and C). However, cells in both clusters 3 and 4 were still markedly different from TCM
A
CD28
LTB
IL7RKLRG1
CD27
JUNB
B
Log 2
(TP
M +
1) e
xpre
ssio
n
0
10
20
0
10
20
0
10
20
0
10
20
0
10
20
0
10
20 KLRG1
JUNB
LTB
IL7R
CD27
CD28
CTCM-enriched
(TCM vs. TEMRA)Precursor-enriched (Precursor clustersvs. effector clusters)
34584
829
CD28
CD27
AQP3
LTB
IL7R
JUNB
S1PR1
CCR4
LGALS3
CCR6
TEMRA -enriched(TEMRA vs. TCM)
Precursor-enriched(Precursor clusters
vs. TCM)KLRG1
TBX21
S1PR5
FGFBP2
CCL4
PRF1
GZMH
NKG7
GNLY
ZEB2
GPR56
169232
981
[Expression] Log2(TPM + 1)
5 100
CD
4+T E
MR
Apr
opor
tion
(%)
Samples (1 to 104)
1248
16
0.50.25
0.1250.0625
TEMRATN
TCMTEM
CCR7
CD
45R
A
5.6 40.5
29.624.3
TEMRA
TCM
CD127
CD127highCD127–
32.8 48.0
E
Fns
T EM
RA
prop
ortio
n in
C
D3+
CD
4+ce
lls (%
)
1
0
2
3
4ns
CD
127h
igh
T EM
RA
pro
porti
on
in C
D3+
CD
4+ce
lls (%
)
1
10
0.1
Donor #16, V1 Donor #16, V2GTEMRA TN
TCMTEM
CCR7
TEMRA TN
TCMTEM
0.43 25.9
52.720.9
3.6 23.1
47.326
CD
45R
A
CD127highCD127–
3.38 69.8
CD127highCD127–
58.1 10.1
CD127
PRF1
GZMB
GPR56
CD244
S1PR5
CX3CR1
KLRD1
FGFBP2
IL7R
LTB
JUNB
TCF7
AQP3
CCR6
CD28
SubjectCell type
Visit
z score–2 0 2
H
I
CD
244
GP
R56
CD28
D
TCM
IL-7Rhigh TEMRA (CTL precursors)
IL-7R– TEMRA (CTL effectors)
TCM V1
V2
Visit Cell type
ns
CD
127–
cells
in C
D+
T EM
RA
pop
ulat
ion
(%)
1
10
100
0.1
2 4 6 8 10 120
Mean expression IL-7Rhigh TEMRA (CTL precursors)
IL-7R– TEMRA (CTL effectors)
Fig. 5. CD4-CTL precursor cells in the TEMRA subset. (A) tSNE 2D plots of single- cell RNA-seq data show the expression of the indicated differentially expressed transcripts between the four clusters (SCDE and MAST analysis, adjusted P < 0.05 and ≥2-fold change). (B) Violin plots show the single-cell expression pattern of the indicated differentially expressed transcripts across four TEMRA clusters along with TCM. Color scale shows the log2(TPM + 1) expression values (A) and mean expression values (B). The shapes represent the distribution of cells based on their log2(TPM + 1) expression values (y axis) (B). (C) Venn diagram comparing the transcripts enriched in precursor clusters (clusters 3 and 4) versus effector clusters (clusters 1 and 2) and transcripts enriched in TCM versus TEMRA (left); tran-scripts enriched in precursor clusters (clusters 3 and 4) versus TCM and tran-scripts enriched in TEMRA versus TCM (right) (gene list obtained from SCDE and MAST analysis, Benjamini-Hochberg ad-justed P < 0.05 and ≥2-fold change). Examples of overlapping genes are shown to the right. (D) Percentage of the CD4-TEMRA subset in the CD4+ T cell population across 104 samples from 89 individuals. (E) Contour plots show the surface expression of CD45RA and CCR7 (left) or CD127 (IL-7R) (right) in live and singlet-gated CD3+CD4+ T cells obtained from PBMCs (left). Con-tour plots show coexpression of CD45RA and CD127 in TEMRA and TCM subsets (right). The gating strategy shows CD127− and CD127high proportion. (F) Proportion of total CD4-TEMRA (left), CD127− CD4- TEMRA (middle), and CD127high CD4-TEMRA cells (right) in CD4+ T cells from 15 do-nors with two longitudinal samples (V1 and V2). Donor #16, marked in red color, shows marked increase in the propor-tion of CD4-TEMRA and CD127− CD4-TEMRA (effectors) cells from V1 to V2. (G) Con-tour plots show the surface expression of CD45RA and CCR7 (top) or CD127 (bottom) in live and singlet-gated CD3+CD4+ cells obtained from PBMCs of donor #16 at two time points (168 days apart) [V1 (left) and V2 (right)]. Bottom panels show the expression of CD127 in the CD4-TEMRA subset for the same donor. ns, not significant; from Student’s two-tailed paired t test. Numbers inside the contour plots show the proportion of the indicated cell type. (H) Bulk RNA-seq analysis of the IL-7Rhigh TEMRA subset (CD4-CTL precursors), IL-7R− TEMRA (CD4-CTL effectors), and TCM cells shows the row-wise normalized TPM counts of top 200 (100 up-regulated and down-regulated, based on fold change) differentially expressed transcripts obtained by pairwise comparison of IL-7R− TEMRA (CD4-CTL effectors) versus TCM from the five donors (DESeq2 analysis, Benjamini-Hochberg adjusted P < 0.05 and ≥2-fold change). The panel above the heat map identifies the cell type, donor, and visit. (I) Contour plots show the coexpression of CD244 or GPR56 with CD28 in TCM (red), IL-7Rhigh TEMRA (CD4-CTL precursors) (magenta), and IL-7R− TEMRA (CD4-CTL effectors) (blue) in singlet-gated CD3+CD4+ T lymphocytes.
by guest on August 12, 2019
http://imm
unology.sciencemag.org/
Dow
nloaded from

Patil et al., Sci. Immunol. 3, eaan8664 (2018) 19 January 2018
S C I E N C E I M M U N O L O G Y | R E S E A R C H A R T I C L E
8 of 13
cells in that they expressed several transcripts that are specifically enriched in TEMRA cells (KLRG1, TBX21, S1PR5, FGFBP2, CCL4, PRF1, GZMH, GNLY, NKG7, ZEB2, and GPR56), albeit at lower levels compared with CD4-CTL effectors (cells in clusters 1 and 2) (Figs. 4E and 5C). On the basis of these results, we hypothesize that cells in clusters 3 and 4 likely represent memory precursor cells for the cells present in cluster 1 and 2 that have a terminal CD4-CTL effector phenotype.
Given that surface expression of IL-7R (CD127) can be readily determined by flow cytometry, we looked for the presence of potential CD4-CTL precursors within the CD4-TEMRA subset from an inde-pendent cohort of healthy donors. For these studies, we capitalized on the La Jolla Institute cohort of 89 healthy donors, of which 15 donors had longitudinal samples (two time points) (104 samples in total). As expected, there was a large variation (0.12 to 15.2%) in the proportion of the CD4-TEMRA subset across the study donors (Fig. 5D). On the basis of the surface expression pattern of IL-7R, cells in the CD4-TEMRA subset were classified into IL-7Rhigh and IL-7R− (Fig. 5E). The expression level of IL-7R on IL-7Rhigh TEMRA cells was similar to that observed in TCM and TN (naive T cell) CD4+ T lym-phocytes (Fig. 5E and fig. S5B). These cells (IL-7Rhigh TEMRA cells) may represent the CD4-CTL precursors defined by our single-cell transcrip-tome analysis. In longitudinal samples obtained at 3- to 6-month inter-vals, the proportion of cells in the CD4-TEMRA subset was quite stable (Fig. 5F); however, in one donor, we noted a marked (>8-fold) expan-sion of the CD4-TEMRA subset; this expansion was mainly confined to the IL-7R− TEMRA cells (CD4-CTL effectors), and not the IL-7Rhigh TEMRA (CD4-CTL precursors), perhaps reflecting an expansion of effec-tors in response to an infection that occurred during the interval period (Fig. 5, F and G).
To further confirm that the IL-7Rhigh TEMRA subset (CD4-CTL precursors) shared the molecular profile of both TCM (long-term memory cells) and cytotoxic cells, we isolated IL-7Rhigh TEMRA and IL-7R− TEMRA (CD4-CTL effectors) along with TCM and TEM subsets and performed RNA-seq in two longitudinal samples from five do-nors (Fig. 5H). Consistent with our single-cell cluster analysis (Fig. 5C), the IL-7Rhigh TEMRA subset shared molecular features of both TCM (memory precursor cells) and cytotoxic cells (IL-7R− TEMRA, CD4-CTL effectors) that were stable over two longitudinal visits (Fig. 5H and table S6). The IL-7Rhigh TEMRA subset (CD4-CTL precursors) expressed both cytotoxicity-related molecules (GPR56 and CD244) and a co-stimulatory molecule (CD28, TCM-enriched) at the protein level (Fig. 5I). Together, these results show that cells in the IL-7Rhigh TEMRA subset have properties of memory precursor cells and cytotoxic cells.
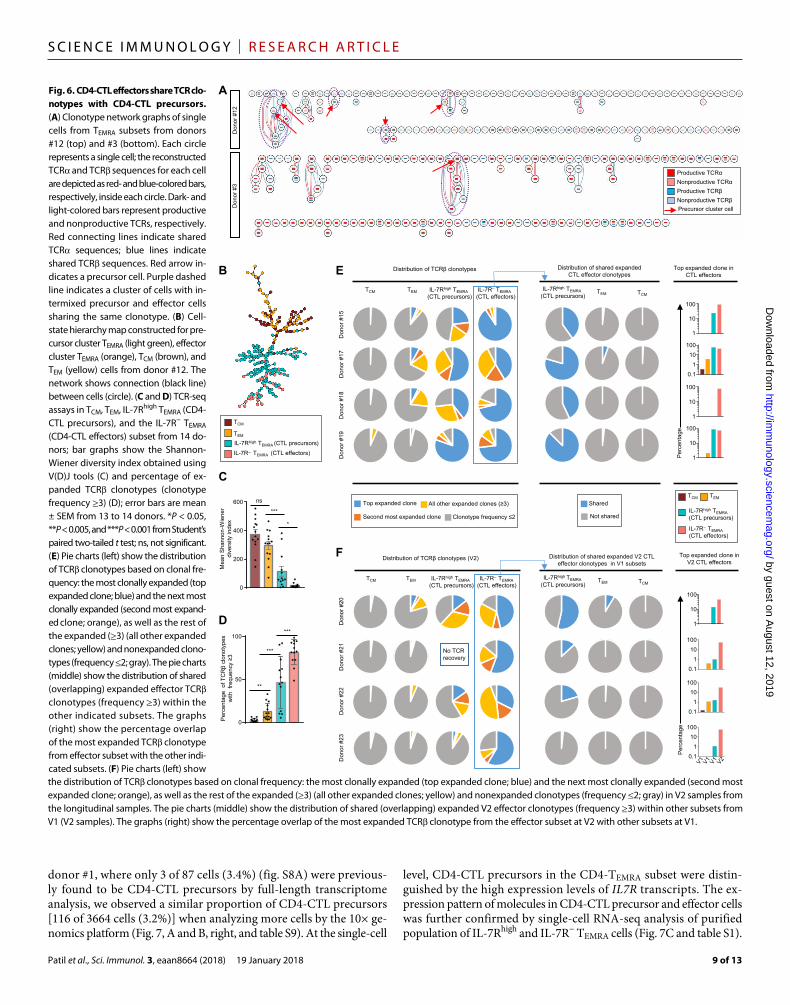
CD4-CTL precursors share TCRs with CD4-CTL effectorsTo verify our hypothesis, we analyzed the overlap in the TCR clono-types of CD4-CTL effectors (clusters 1 and 2) with those from CD4-CTL precursors (clusters 3 and 4). In a total of 5 of 12 donors, TCR clonotypes were shared between CD4-CTL precursors and effectors (Figs. 2A and 6A, fig. S6A, and table S4). As examples, in donor #1, 23 of 80 TEMRA cells had the same TCR chain clonotype (fig. S6A) as a single cell from precursor cluster (cluster 3); in donor #12, four TCR chain clonotypes were shared between CD4-CTL precursors and effectors (Fig. 6A, clones highlighted in dashed lines with the precursor cells indicated with red arrows). A similar pattern was ob-served in donors #3, #5, and #6 (Figs. 2A and 6A and table S4). To further support our inference, we constructed cell-state hierarchy maps using the Sincell software (39) for cells in the TCM, TEM, and
TEMRA subsets and observed that CD4-CTL effectors clustered closest to the CD4-CTL precursors (Fig. 6B and fig. S6B). Together, these data lend support to the hypothesis that CD4-CTL effectors were mainly generated in vivo from distinct CD4-CTL precursor cells, although the possibility of arising from memory TEM or TCM cells cannot be excluded.
To support our hypothesis that CD4-CTL effectors are mainly derived from the precursor population, we performed a unique mo-lecular identifier (UMI)–based TCR sequencing (TCR-seq) assays (57) in TCM, TEM, IL-7Rhigh TEMRA (CD4-CTL precursors), and IL-7R− TEMRA (CD4-CTL effectors) subsets from 14 donors (table S7). Consistent with single-cell TCR analysis (Fig. 2, A and B), the CD4-CTL precursor and effector cells in the TEMRA subset had highly re-stricted TCR repertoire, compared with cells in the TCM and TEM subsets, as shown by lower Shannon-Wiener diversity index (Fig. 6C) (58), and contained higher percentage of expanded clonotypes (Fig. 6, D, E and F, left, and fig. S7, left). A larger fraction of the clonotypes in the CD4-CTL precursor cells relative to TEM and TCM was composed of the expanded clonotypes (frequency, ≥3) present in the CD4-CTL effector cells (Fig. 6E, middle, and fig. S7, middle). Further, the most expanded clonotype in the CD4-CTL effector cells was observed more often and at higher frequency in CD4-CTL precursor cells rel-ative to TEM and TCM (Fig. 6E, right graphs, and fig. S7, right graphs).
We also performed TCR-seq in CD4+ T cell memory subsets from five donors who provided longitudinal samples obtained at 3- to 6-month intervals to assess the kinetics of precursor-effector relation. To better assess the relationship between effectors and putative precursors for each donor, we determined the proportion of expanded CD4-CTL ef-fectors clono types from second visit (V2) that were present in the different CD4+ T cell memory subsets at the first visit (V1) (table S8). In four of the five donors analyzed, a greater fraction of the TCR clonotypes detected in CD4-CTL effectors at V2 was shared with cells in the precursor population (IL-7Rhigh TEMRA subset) relative to the TEM or TCM subset at V1 (Fig. 6F, middle, fig. S7, and table S8). A total of 12 of the CD4-CTL effector clonotypes from V2 were only found in CD4-CTL precursors at V1 but not in the TEM, TCM, or CD4-CTL effectors (table S8). Together, the kinetic data from the longitudinal samples provided stronger evidence to support the precursor-effector relationship and suggested that the IL-7Rhigh TEMRA subset is the pre-dominant precursor/progenitor for the CD4-CTL effector cells.
Variable number of CD4-CTL precursors across donorsThe proportion of CD4-CTL precursors varied greatly among do-nors, ranging from 3 to 92% of cells in the TEMRA subset (fig. S8A). To determine whether additional CD4-CTL subsets exist and to defini-tively assess the presence of CD4-CTL precursors, we analyzed single- cell transcriptomes of 10 times as many cells (>6000 cells) from two donors using the high-throughput 10× genomics platform. The sen-sitivity of the 10× genomics platform, which uses beads to capture tran-scripts and also sequences only their 3′ ends (59), is twofold lower than the Smart-seq2 protocol used to study full-length transcriptomes of the same donors (fig. S8, B and C). In donor #2, where 24 of 87 cells (28%) (fig. S8A) were previously assessed as CD4-CTL precursors, unbiased clustering of more than 3000 single-cell transcriptomes revealed two dominant clusters of ~2000 and ~1000 cells each, implying that sequenc-ing more cells does not necessarily reveal additional clusters (Fig. 7A, left). These two clusters differentially expressed transcripts character-istic of CD4-CTL effectors (GZMB and NKG7) and precursors (IL7R, JUNB, and LTB), respectively (Fig. 7B, left, and table S9). Even in
by guest on August 12, 2019
http://imm
unology.sciencemag.org/
Dow
nloaded from
Patil et al., Sci. Immunol. 3, eaan8664 (2018) 19 January 2018
S C I E N C E I M M U N O L O G Y | R E S E A R C H A R T I C L E
9 of 13
donor #1, where only 3 of 87 cells (3.4%) (fig. S8A) were previous-ly found to be CD4-CTL precursors by full-length transcriptome analysis, we observed a similar proportion of CD4-CTL precursors [116 of 3664 cells (3.2%)] when analyzing more cells by the 10× ge-nomics platform (Fig. 7, A and B, right, and table S9). At the single-cell
level, CD4-CTL precursors in the CD4-TEMRA subset were distin-guished by the high expression levels of IL7R transcripts. The ex-pression pattern of molecules in CD4-CTL precursor and effector cells was further confirmed by single-cell RNA-seq analysis of purified population of IL-7Rhigh and IL-7R− TEMRA cells (Fig. 7C and table S1).
Don
or #
12
B
IL-7Rhigh TEMRA (CTL precursors)
IL-7R– TEMRA (CTL effectors)
TCM
TEM
A
C
D
Per
cent
age
of T
CR
βcl
onot
ypes
with
fre
quen
cy ≥
3M
ean
Sha
nnon
-Wie
ner
dive
rsity
inde
x
50
100
0
***
***
**
Distribution of TCRβ clonotypes
TEMTCM
Don
or #
15
Don
or #
17
Don
or #
18
Don
or #
19
E
200
400
600
0
ns
*
***
F
Don
or #
20
No TCR recovery
Don
or #
21
Don
or #
23D
onor
#22
IL-7R– TEMRA (CTL effectors)
IL-7Rhigh TEMRA (CTL precursors)
Distribution of shared expanded CTL effector clonotypes
TEM TCMIL-7Rhigh TEMRA
(CTL precursors)
1
10
100
1
10
100
0.11
10010
1
10
100
Distribution of TCRβ clonotypes (V2) Distribution of shared expanded V2 CTL effector clonotypes in V1 subsets
1
10
100
0.11
10010
0.11
10010
0.11
10010
All other expanded clones (≥3)
Clonotype frequency ≤2
Top expanded clone
Second most expanded clone Not shared
SharedIL-7Rhigh TEMRA (CTL precursors)
IL-7R– TEMRA(CTL effectors)
TCM TEM
Top expanded clone in CTL effectors
Top expanded clone in V2 CTL effectors
TEMTCM IL-7R– TEMRA (CTL effectors)
IL-7Rhigh TEMRA (CTL precursors)
TEM TCMIL-7Rhigh TEMRA
(CTL precursors)
Per
cent
age
Per
cent
age
Don
or #
3
Productive TCRβNonproductive TCRα
Nonproductive TCRβ
Productive TCRα
Precursor cluster cell
Fig. 6. CD4-CTL effectors share TCR clo-notypes with CD4-CTL precursors. (A) Clonotype network graphs of single cells from TEMRA subsets from donors #12 (top) and #3 (bottom). Each circle represents a single cell; the reconstructed TCR and TCR sequences for each cell are depicted as red- and blue-colored bars, respectively, inside each circle. Dark- and light-colored bars represent productive and nonproductive TCRs, respectively. Red connecting lines indicate shared TCR sequences; blue lines indicate shared TCR sequences. Red arrow in-dicates a precursor cell. Purple dashed line indicates a cluster of cells with in-termixed precursor and effector cells sharing the same clonotype. (B) Cell-state hierarchy map constructed for pre-cursor cluster TEMRA (light green), effector cluster TEMRA (orange), TCM (brown), and TEM (yellow) cells from donor #12. The network shows connection (black line) between cells (circle). (C and D) TCR-seq assays in TCM, TEM, IL-7Rhigh TEMRA (CD4-CTL precursors), and the IL-7R− TEMRA (CD4-CTL effectors) subset from 14 do-nors; bar graphs show the Shannon- Wiener diversity index obtained using V(D)J tools (C) and percentage of ex-panded TCR clonotypes (clonotype frequency ≥3) (D); error bars are mean ± SEM from 13 to 14 donors. *P < 0.05, **P < 0.005, and ***P < 0.001 from Student’s paired two-tailed t test; ns, not significant. (E) Pie charts (left) show the distribution of TCR clonotypes based on clonal fre-quency: the most clonally expanded (top expanded clone; blue) and the next most clonally expanded (second most expand-ed clone; orange), as well as the rest of the expanded (≥3) (all other expanded clones; yellow) and nonexpanded clono-types (frequency ≤2; gray). The pie charts (middle) show the distribution of shared (overlapping) expanded effector TCR clonotypes (frequency ≥3) within the other indicated subsets. The graphs (right) show the percentage overlap of the most expanded TCR clonotype from effector subset with the other indi-cated subsets. (F) Pie charts (left) show the distribution of TCR clonotypes based on clonal frequency: the most clonally expanded (top expanded clone; blue) and the next most clonally expanded (second most expanded clone; orange), as well as the rest of the expanded (≥3) (all other expanded clones; yellow) and nonexpanded clonotypes (frequency ≤2; gray) in V2 samples from the longitudinal samples. The pie charts (middle) show the distribution of shared (overlapping) expanded V2 effector clonotypes (frequency ≥3) within other subsets from V1 (V2 samples). The graphs (right) show the percentage overlap of the most expanded TCR clonotype from the effector subset at V2 with other subsets at V1.
by guest on August 12, 2019
http://imm
unology.sciencemag.org/
Dow
nloaded from

Patil et al., Sci. Immunol. 3, eaan8664 (2018) 19 January 2018
S C I E N C E I M M U N O L O G Y | R E S E A R C H A R T I C L E
10 of 13
DISCUSSIONCD4-CTLs have long been considered to be terminal effector cells derived from TEM cells after persistent or repeated (long-term) anti-gen stimulation in the context of certain viral infections, particularly CMV and DENV (7, 8, 14). Consistent with the notion, our single-
cell transcriptome studies of the TEMRA subset did identify cells that have features of terminal CD4-CTL effector cells (KLRG1high and IL-7Rlow; clusters 1 and 2). However, we observed another popula-tion of cells in the TEMRA subset that displayed a molecular program (KLRG1low and IL-7Rhigh; clusters 3 and 4) indicative of memory
A
IL7R
LTB
NKG7
GZMB
JUNB
NKG7
IL7R
LTB
20
0
–20
200–20
Donor #2
tSNE1
Effector cluster (2144 cells)
Precursor cluster (1060 cells) 20
0
–20
200–20
Donor #1
Effector cluster(3664 cells) Precursor cluster
(116 cells)
–5
5
15
–5
5
15
–5
5
15
–5
5
15
–5
5
15
GZMB
5
15
–5
5
15
5
15
–5
5
15
–5
5
15
–5
–5
JUNB
tSN
E2
[Expression] Log2(UPM + 1)
5 100 ClustersLog 2
(UP
M +
1)
expr
essi
on
Violin plotstSNE plots
Donor #1Donor #2B
tSNE1
C
Log 2
(TP
M+1
) exp
ress
ion
–5
5
15
–5
5
15
–5
5
15
–5
5
15
–5
5
15
–5
5
15
–5
5
15
–5
5
15
–5
5
15
–5
5
15
–5
5
15
–5
5
15
–5
5
15
–5
5
15GNLY
GZMH
NKG7
PRF1
CST7
GPR56
CX3CR1
FGFBP2
CD27
CD28
LTB
JUNB
IL7R
GZMB
2 4 6 8 10 120
Mean expression
2 4 6 8 10 120
Mean expression
IL-7R
–
IL-7R
Fig. 7. Variable number of CD4-CTL precursors across donors. (A) tSNE 2D plot of single-cell RNA-seq data obtained using the Seurat software package for do-nors #2 (left) and #1 (right) from the 3′ tran-scriptome of single cells (RNA-seq carried out using the 10× genomics platform) for the most variable transcripts (1799, donor #2; 1569, donor #1). (B) tSNE 2D plots (left) and violin plots (right) of single-cell RNA-seq data show the expression [log2(UPM + 1) expression; UPM, UMI per million] of the indicated differentially expressed tran-scripts (SCDE and MAST analysis, Benjamini- Hochberg adjusted P < 0.05 and ≥2-fold change) for the indicated donors. Precursor cluster is marked with a black dashed line. The shapes in violin plots represent the dis-tribution of cells based on their log2(UPM + 1) expression values (y axis). The color scale represents the expression of log2(UPM + 1) (tSNE 2D plots) and mean expression (violin plots). (C) Violin plots show the single-cell expression pattern of the indicated differ-entially expressed transcripts between IL-7Rhigh TEMRA (CD4-CTL precursors) and IL-7R− TEMRA (CD4-CTL effectors) subsets. The shapes represent the distribution of cells based on their log2(TPM + 1) expression values (y axis). Color scale shows the mean expression values.
by guest on August 12, 2019
http://imm
unology.sciencemag.org/
Dow
nloaded from

Patil et al., Sci. Immunol. 3, eaan8664 (2018) 19 January 2018
S C I E N C E I M M U N O L O G Y | R E S E A R C H A R T I C L E
11 of 13
precursor cells, intermixed with several features of CD4-CTLs (KLRG1, TBX21, S1PR5, FGFBP2, CCL4, PRF1, GZMH, GNLY, NKG7, ZEB2, and GPR56), albeit less prominently expressed than in the CD4-CTL effectors. Bulk and single-cell transcriptome analysis of the purified IL-7Rhigh and IL-7R− TEMRA subset further confirmed our observation from single-cell transcriptome analysis of total TEMRA subset. In several donors, we found cells in the CD4-CTL effector subset that shared their TCR clonotypes with cells in the precursor subset. TCR-seq analysis in longitudinal samples further confirmed this finding and provided more evidence for the relation between CD4- CTL precursors and effectors. Although the kinetic studies support the development of effectors from precursor cells, the nature of our studies in humans limits the definitive assessment of directionality; hence, we cannot completely exclude the possibility that the progeni-tor cell generated immediately after infection is the cytotoxic effector cell that eventually reverts. By defining the single-cell transcriptional program of CD4-CTL precursor cells, we have identified a number of previously unknown molecules potentially important for their dif-ferentiation and function and represent attractive targets for further validation studies.
We showed that surface expression of the IL-7R (CD127) in TEMRA cells defines a subset of cells with the expression of IL-7R as high as that observed in the TCM subset. Given the established role of the IL-7R signaling pathway in homeostatic T cell proliferation and survival, such IL-7Rhigh TEMRA cells are likely to represent the precursors of CD4-TEMRA. The isolation of a CD4-CTL precursor subset based on the surface expression of IL-7R would enable detailed epigenetic studies to define the nature and extent of CD4-CTL reprogramming in such precursor cells. These future studies are likely to provide insights into the molecular mechanisms that govern the early development, differ-entiation, and function of CD4-CTLs in humans as they transit from naive to memory precursor and effector cells.
The CD4-CTL effector cells displayed a number of known cyto-toxicity molecules and previously unknown players (PFN1, PFN1P1, EFHD2, VCL, DIP2A, PLEK, and SYNE1) whose single-cell coexpression pattern suggests an important biological role for these molecules in CD4-CTL function. Further, their transcriptional program suggests that CD4-CTL effectors are terminally differentiated and likely short-lived because they express low levels of the costimulatory molecules CD27 and CD28 and high levels of KLRG1 transcripts (41, 52, 60–62). However, we observed marked clonal expansion of CD4-CTL effectors in several donors, suggesting that, compared with other con-ventional TH effector cells, different molecular mechanisms may operate in CD4-CTL effectors to promote their long-term survival. IL-7R− TEMRA CD4-CTL effectors highly expressed several molecules that are linked to cell survival such as CRTAM, ZNF683 (Hobit), PRSS23, SPON2, and TCF7 (encodes TCF1) (24, 46–51). Therefore, we hypothesize that these candidate molecules are likely to confer long-term survival properties to CD4-CTL effectors, which warrants further functional investigation in model organisms.
Overall, our single-cell transcriptomic studies in the human CD4- TEMRA population have uncovered an unprecedented level of hetero-geneity, presumably created by the diverse nature of infections and the timing of exposures coupled with genetic diversity among our study donors. We identified a TEMRA subset of precursor CD4-CTLs, whose isolation and further characterization may open avenues for investigating the mechanisms that govern the generation of CD4- CTLs in humans. The stem-like virus-specific long-lived human mem-ory T cell subset originating from TN cells has been described for
CD8 compartment, where these cells share the molecular profiles of TN and TCM subsets (63). Considering the expansion of TEMRA in response to viral infections such as DENV and CMV, it is possible that IL-7Rhigh TEMRA subset (CD4-CTL precursors) may develop from such compartment. Understanding the origins and biology of poten-tially long-lived CD4-CTL precursors may pave the way for developing strategies to boost durable CD4-CTL immune responses after vaccina-tion against viral infections and cancer. A comprehensive assessment of heterogeneity in pathogen- or vaccine epitope–specific CD4-CTLs by single-cell approaches is likely to yield insights into the nature of protective CD4-CTL response generated against specific pathogens or vaccines.
MATERIALS AND METHODSStudy designThe goal of this study was to use single-cell RNA-seq assay to capture the transcriptome of individual cells in CD4+ T cell memory subsets in human peripheral blood mononuclear cells (PBMCs). Details on the sample collection and processing are described in Supplementa-ry Materials and Methods.
Flow cytometryHuman PBMCs were isolated and stained as described in Supple-mentary Materials and Methods.
Single-cell RNA-seqSingle-cell RNA-seq was performed as described previously (33, 34), with some modifications that are described in Supplementary Mate-rials and Methods.
Single-cell RNA-seq and statistical analysisData processing and analysis were performed using R, Qlucore Omics, and GraphPad Prism, as described in Supplementary Materials and Methods.
TCR-seq and analysisTCR-seq was performed and analyzed as described previously (57, 58). Details are described in Supplementary Materials and Methods.
SUPPLEMENTARY MATERIALSimmunology.sciencemag.org/cgi/content/full/3/19/eaan8664/DC1Materials and MethodsFig. S1. Most of the expanded TCR clonotypes are DENV-specific.Fig. S2. TEMRA cells cluster into four distinct clusters.Fig. S3. Batch analysis of TEMRA cells.Fig. S4. TEMRA clusters express distinct set of transcripts.Fig. S5. Clusters 1 and 2 are enriched for transcripts involved in cytotoxicity-related pathways.Fig. S6. Precursor cells in TEMRA subset.Fig. S7. CD4-CTL precursors share clonotypes with CD4-CTL effectors.Fig. S8. Smart-seq2 is more sensitive compared with droplet-based approach (10× genomics).Table S1. Summary of study donors.Table S2. List of differentially expressed genes between memory subsets [for data in Fig. 1 (B and C)].Table S3. Summary of TCR and TCR chains recovered from full-length single-cell transcriptomes of all single cells in the 15 donors.Table S4. TCR and TCR chain reconstruction from full-length single-cell transcriptome of every single cell sequenced from the 15 donors.Table S5. List of differentially expressed genes between clusters (for data in Fig. 4C and fig. S4).Table S6. List of differentially expressed genes between TCM and CD4-CTL effectors (for data in Fig. 5H).Table S7. TCR and TCR chain sequences derived from TCR-seq analysis of 14 donors [for data in Fig. 6 (E and F) and fig. S7].
by guest on August 12, 2019
http://imm
unology.sciencemag.org/
Dow
nloaded from

Patil et al., Sci. Immunol. 3, eaan8664 (2018) 19 January 2018
S C I E N C E I M M U N O L O G Y | R E S E A R C H A R T I C L E
12 of 13
Table S8. TCR and TCR chain clonotype sharing derived from TCR-seq analysis of longitudinally collected samples from five donors (for data in Fig. 6F and fig. S7).Table S9. List of differentially expressed genes between the two clusters in donors #1 and #2 [for data in Fig. 7 (A and B)].Table S10. List of antibodies used in the study.Table S11. Primers used for TCR-seq.Table S12. List of gene sets used for GSEA (for data in Fig. 1E).References (64–73)
REFERENCES AND NOTES 1. M. D. Rosenblum, S. S. Way, A. K. Abbas, Regulatory T cell memory. Nat. Rev. Immunol.
16, 90–101 (2016). 2. S. L. Swain, K. K. McKinstry, T. M. Strutt, Expanding roles for CD4+ T cells in immunity to
viruses. Nat. Rev. Immunol. 12, 136–148 (2012). 3. J. J. O’Shea, W. E. Paul, Mechanisms underlying lineage commitment and plasticity of
helper CD4+ T cells. Science 327, 1098–1102 (2010). 4. C. L. Arlehamn, G. Seumois, A. Gerasimova, C. Huang, Z. Fu, X. Yue, A. Sette, P. Vijayanand,
B. Peters, Transcriptional profile of tuberculosis antigen–specific T cells reveals novel multifunctional features. J. Immunol. 193, 2931–2940 (2014).
5. H. Cheroutre, M. M. Husain, CD4 CTL: Living up to the challenge. Semin. Immunol. 25, 273–281 (2013).
6. J. A. Juno, D. van Bockel, S. J. Kent, A. D. Kelleher, J. J. Zaunders, C. M. L. Munier, Cytotoxic CD4 T cells—Friend or foe during viral infection? Front. Immunol. 8, 19 (2017).
7. D. Weiskopf, D. J. Bangs, J. Sidney, R. V. Kolla, A. D. De Silva, A. M. de Silva, S. Crotty, B. Peters, A. Sette, Dengue virus infection elicits highly polarized CX3CR1+ cytotoxic CD4+ T cells associated with protective immunity. Proc. Natl. Acad. Sci. U.S.A. 112, E4256–E4263 (2015).
8. E. Derhovanessian, A. B. Maier, K. Hähnel, R. Beck, A. J. M. de Craen, E. P. Slagboom, R. G. J. Westendorp, G. Pawelec, Infection with cytomegalovirus but not herpes simplex virus induces the accumulation of late-differentiated CD4+ and CD8+ T-cells in humans. J. Gen. Virol. 92, 2746–2756 (2011).
9. A. M. Intlekofer, N. Takemoto, E. J. Wherry, S. A. Longworth, J. T. Northrup, V. R. Palanivel, A. C. Mullen, C. R. Gasink, S. M. Kaech, J. D. Miller, L. Gapin, K. Ryan, A. P. Russ, T. Lindsten, J. S. Orange, A. W. Goldrath, R. Ahmed, S. L. Reiner, Effector and memory CD8+ T cell fate coupled by T-bet and eomesodermin. Nat. Immunol. 6, 1236–1244 (2005).
10. N. Takemoto, A. M. Intlekofer, J. T. Northrup, E. J. Wherry, S. L. Reiner, Cutting edge: IL-12 inversely regulates T-bet and eomesodermin expression during pathogen-induced CD8+ T cell differentiation. J. Immunol. 177, 7515–7519 (2006).
11. V. Appay, J. J. Zaunders, L. Papagno, J. Sutton, A. Jaramillo, A. Waters, P. Easterbrook, P. Grey, D. Smith, A. J. McMichael, D. A. Cooper, S. L. Rowland-Jones, A. D. Kelleher, Characterization of CD4+ CTLs ex vivo. J. Immunol. 168, 5954–5958 (2002).
12. J. J. Zaunders, W. B. Dyer, B. Wang, M. L. Munier, M. Miranda-Saksena, R. Newton, J. Moore, C. R. Mackay, D. A. Cooper, N. K. Saksena, A. D. Kelleher, Identification of circulating antigen-specific CD4+ T lymphocytes with a CCR5+, cytotoxic phenotype in an HIV-1 long-term nonprogressor and in CMV infection. Blood 103, 2238–2247 (2004).
13. P. J. Norris, H. F. Moffett, O. O. Yang, D. E. Kaufmann, M. J. Clark, M. M. Addo, E. S. Rosenberg, Beyond help: Direct effector functions of human immunodeficiency virus type 1-specific CD4+ T cells. J. Virol. 78, 8844–8851 (2004).
14. E. M. M. van Leeuwen, E. B. M. Remmerswaal, M. T. M. Vossen, A. T. Rowshani, P. M. E. Wertheim-van Dillen, R. A. W. van Lier, I. J. M. ten Berge, Emergence of a CD4+CD28- granzyme B+, cytomegalovirus-specific T cell subset after recovery of primary cytomegalovirus infection. J. Immunol. 173, 1834–1841 (2004).
15. N. Aslan, C. Yurdaydin, J. Wiegand, T. Greten, A. Ciner, M. F. Meyer, H. Heiken, B. Kuhlmann, T. Kaiser, H. Bozkaya, H. L. Tillmann, A. M. Bozdayi, M. P. Manns, H. Wedemeyer, Cytotoxic CD4+ T cells in viral hepatitis. J. Viral Hepat. 13, 505–514 (2006).
16. D. M. Brown, S. Lee, M. de la Luz Garcia-Hernandez, S. L. Swain, Multifunctional CD4 cells expressing gamma interferon and perforin mediate protection against lethal influenza virus infection. J. Virol. 86, 6792–6803 (2012).
17. K. K. McKinstry, T. M. Strutt, Y. Kuang, D. M. Brown, S. Sell, R. W. Dutton, S. L. Swain, Memory CD4+ T cells protect against influenza through multiple synergizing mechanisms. J. Clin. Invest. 122, 2847–2856 (2012).
18. A. M. Watson, L. K. Lam, W. B. Klimstra, K. D. Ryman, The 17D-204 vaccine strain-induced protection against virulent yellow fever virus is mediated by humoral immunity and CD4+ but not CD8+ T cells. PLOS Pathog. 12, e1005786 (2016).
19. A. J. Vogel, D. M. Brown, Single-dose CpG immunization protects against a heterosubtypic challenge and generates antigen-specific memory T cells. Front. Immunol. 6, 327 (2015).
20. K. Terahara, H. Ishii, T. Nomura, N. Takahashi, A. Takeda, T. Shiino, Y. Tsunetsugu-Yokota, T. Matano, Vaccine-induced CD107a+ CD4+ T cells are resistant to depletion following AIDS virus infection. J. Virol. 88, 14232–14240 (2014).
21. Y. D. Mahnke, T. M. Brodie, F. Sallusto, M. Roederer, E. Lugli, The who’s who of T-cell differentiation: Human memory T-cell subsets. Eur. J. Immunol. 43, 2797–2809 (2013).
22. G. Finak, A. McDavid, M. Yajima, J. Deng, V. Gersuk, A. K. Shalek, C. K. Slichter, H. W. Miller, M. J. McElrath, M. Prlic, P. S. Linsley, R. Gottardo, MAST: A flexible statistical framework for assessing transcriptional changes and characterizing heterogeneity in single-cell RNA sequencing data. Genome Biol. 16, 278 (2015).
23. P. V. Kharchenko, L. Silberstein, D. T. Scadden, Bayesian approach to single-cell differential expression analysis. Nat. Methods 11, 740–742 (2014).
24. A. E. Oja, F. A. Vieira Braga, E. B. M. Remmerswaal, N. A. M. Kragten, K. M. L. Hertoghs, J. Zuo, P. A. Moss, R. A. W. van Lier, K. P. J. M. van Gisbergen, P. Hombrink, The transcription factor hobit identifies human cytotoxic CD4+ T cells. Front. Immunol. 8, 325 (2017).
25. L. G. Hidalgo, G. Einecke, K. Allanach, P. F. Halloran, The transcriptome of human cytotoxic T cells: Similarities and disparities among allostimulated CD4+ CTL, CD8+ CTL and NK cells. Am. J. Transplant. 8, 627–636 (2008).
26. A. Subramanian, P. Tamayo, V. K. Mootha, S. Mukherjee, B. L. Ebert, M. A. Gillette, A. Paulovich, S. L. Pomeroy, T. R. Golub, E. S. Lander, J. P. Mesirov, Gene set enrichment analysis: A knowledge-based approach for interpreting genome-wide expression profiles. Proc. Natl. Acad. Sci. U.S.A. 102, 15545–15550 (2005).
27. E. L. Pearce, A. C. Mullen, G. A. Martins, C. M. Krawczyk, A. S. Hutchins, V. P. Zediak, M. Banica, C. B. DiCioccio, D. A. Gross, C.-a. Mao, H. Shen, N. Cereb, S. Y. Yang, T. Lindsten, J. Rossant, C. A. Hunter, S. L. Reiner, Control of effector CD8+ T cell function by the transcription factor eomesodermin. Science 302, 1041–1043 (2003).
28. K. Eshima, S. Chiba, H. Suzuki, K. Kokubo, H. Kobayashi, M. Iizuka, K. Iwabuchi, N. Shinohara, Ectopic expression of a T-box transcription factor, eomesodermin, renders CD4+ Th cells cytotoxic by activating both perforin- and FasL-pathways. Immunol. Lett. 144, 7–15 (2012).
29. W. Witke, The role of profilin complexes in cell motility and other cellular processes. Trends Cell Biol. 14, 461–469 (2004).
30. H. Chen, D. M. Choudhury, S. W. Craig, Coincidence of actin filaments and talin is required to activate vinculin. J. Biol. Chem. 281, 40389–40398 (2006).
31. D. M. Cohen, B. Kutscher, H. Chen, D. B. Murphy, S. W. Craig, A conformational switch in vinculin drives formation and dynamics of a talin-vinculin complex at focal adhesions. J. Biol. Chem. 281, 16006–16015 (2006).
32. N. Hoppmann, C. Graetz, M. Paterka, L. Poisa-Beiro, C. Larochelle, M. Hasan, C. M. Lill, F. Zipp, V. Siffrin, New candidates for CD4 T cell pathogenicity in experimental neuroinflammation and multiple sclerosis. Brain 138, 902–917 (2015).
33. S. Picelli, O. R. Faridani, Å. K. Björklund, G. Winberg, S. Sagasser, R. Sandberg, Full-length RNA-seq from single cells using Smart-seq2. Nat. Protoc. 9, 171–181 (2014).
34. I. Engel, G. Seumois, L. Chavez, D. Samaniego-Castruita, B. White, A. Chawla, D. Mock, P. Vijayanand, M. Kronenberg, Innate-like functions of natural killer T cell subsets result from highly divergent gene programs. Nat. Immunol. 17, 728–739 (2016).
35. M. J. T. Stubbington, T. Lönnberg, V. Proserpio, S. Clare, A. O. Speak, G. Dougan, S. A. Teichmann, T cell fate and clonality inference from single-cell transcriptomes. Nat. Methods 13, 329–332 (2016).
36. A. Takeuchi, M. E. S. G. Badr, K. Miyauchi, C. Ishihara, R. Onishi, Z. Guo, Y. Sasaki, H. Ike, A. Takumi, N. M. Tsuji, Y. Murakami, T. Katakai, M. Kubo, T. Saito, CRTAM determines the CD4+ cytotoxic T lymphocyte lineage. J. Exp. Med. 213, 123–138 (2016).
37. D. Weiskopf, M. A. Angelo, A. Grifoni, P. H. O’Rourke, J. Sidney, S. Paul, A. D. De Silva, E. Phillips, S. Mallal, S. Premawansa, G. Premawansa, A. Wijewickrama, B. Peters, A. Sette, HLA-DRB1 alleles are associated with different magnitudes of dengue virus–specific CD4+ T-cell responses. J. Infect. Dis. 214, 1117–1124 (2016).
38. R. Satija, J. A. Farrell, D. Gennert, A. F. Schier, A. Regev, Spatial reconstruction of single-cell gene expression data. Nat. Biotechnol. 33, 495–502 (2015).
39. M. Juliá, A. Telenti, A. Rausell, Sincell: An R/Bioconductor package for statistical assessment of cell-state hierarchies from single-cell RNA-seq. Bioinformatics 31, 3380–3382 (2015).
40. T. Hanke, L. Corral, R. E. Vance, D. H. Raulet, 2F1 antigen, the mouse homolog of the rat “mast cell function-associated antigen”, is a lectin-like type II transmembrane receptor expressed by natural killer cells. Eur. J. Immunol. 28, 4409–4417 (1998).
41. D. Voehringer, M. Koschella, H. Pircher, Lack of proliferative capacity of human effector and memory T cells expressing killer cell lectinlike receptor G1 (KLRG1). Blood 100, 3698–3702 (2002).
42. C. Blaser, M. Kaufmann, H. Pircher, Virus-activated CD8 T cells and lymphokine-activated NK cells express the mast cell function-associated antigen, an inhibitory C-type lectin. J. Immunol. 161, 6451–6454 (1998).
43. J. P. Böttcher, M. Beyer, F. Meissner, Z. Abdullah, J. Sander, B. Höchst, S. Eickhoff, J. C. Rieckmann, C. Russo, T. Bauer, T. Flecken, D. Giesen, D. Engel, S. Jung, D. H. Busch, U. Protzer, R. Thimme, M. Mann, C. Kurts, J. L. Schultze, W. Kastenmüller, P. A. Knolle, Functional classification of memory CD8+ T cells by CX3CR1 expression. Nat. Commun. 6, 8306 (2015).
by guest on August 12, 2019
http://imm
unology.sciencemag.org/
Dow
nloaded from
Patil et al., Sci. Immunol. 3, eaan8664 (2018) 19 January 2018
S C I E N C E I M M U N O L O G Y | R E S E A R C H A R T I C L E
13 of 13
44. V. Appay, P. R. Dunbar, M. Callan, P. Klenerman, G. M. A. Gillespie, L. Papagno, G. S. Ogg, A. King, F. Lechner, C. A. Spina, S. Little, D. V. Havlir, D. D. Richman, N. Gruener, G. Pape, A. Waters, P. Easterbrook, M. Salio, V. Cerundolo, A. J. McMichael, S. L. Rowland-Jones, Memory CD8+ T cells vary in differentiation phenotype in different persistent virus infections. Nat. Med. 8, 379–385 (2002).
45. V. Appay, S. L. Rowland-Jones, Lessons from the study of T-cell differentiation in persistent human virus infection. Semin. Immunol. 16, 205–212 (2004).
46. J. Braun, M. Frentsch, A. Thiel, Hobit and human effector T-cell differentiation: The beginning of a long journey. Eur. J. Immunol. 45, 2762–2765 (2015).
47. H.-S. Chan, S.-J. Chang, T.-Y. Wang, H.-J. Ko, Y.-C. Lin, K.-T. Lin, K.-M. Chang, Y.-J. Chuang, Serine protease PRSS23 is upregulated by estrogen receptor alpha and associated with proliferation of breast cancer cells. PLOS ONE 7, e30397 (2012).
48. F. Schmid, Q. Wang, M. R. Huska, M. A. Andrade-Navarro, M. Lemm, I. Fichtner, M. Dahlmann, D. Kobelt, W. Walther, J. Smith, P. M. Schlag, U. Stein, SPON2, a newly identified target gene of MACC1, drives colorectal cancer metastasis in mice and is prognostic for colorectal cancer patient survival. Oncogene 35, 5942–5952 (2016).
49. F. A. Vieira Braga, K. M. L. Hertoghs, N. A. M. Kragten, G. M. Doody, N. A. Barnes, E. B. M. Remmerswaal, C.-C. Hsiao, P. D. Moerland, D. Wouters, I. A. M. Derks, A. van Stijn, M. Demkes, J. Hamann, E. Eldering, M. A. Nolte, R. M. Tooze, I. J. M. ten Berge, K. P. J. M. van Gisbergen, R. A. W. van Lier, Blimp-1 homolog Hobit identifies effector-type lymphocytes in humans. Eur. J. Immunol. 45, 2945–2958 (2015).
50. G. Jeannet, C. Boudousquié, N. Gardiol, J. Kang, J. Huelsken, W. Held, Essential role of the Wnt pathway effector Tcf-1 for the establishment of functional CD8 T cell memory. Proc. Natl. Acad. Sci. U.S.A. 107, 9777–9782 (2010).
51. X. Zhou, S. Yu, D.-M. Zhao, J. T. Harty, V. P. Badovinac, H.-H. Xue, Differentiation and persistence of memory CD8+ T cells depend on T cell factor 1. Immunity 33, 229–240 (2010).
52. S. M. Kaech, J. T. Tan, E. J. Wherry, B. T. Konieczny, C. D. Surh, R. Ahmed, Selective expression of the interleukin 7 receptor identifies effector CD8 T cells that give rise to long-lived memory cells. Nat. Immunol. 4, 1191–1198 (2003).
53. C. C. Ibegbu, Y.-X. Xu, W. Harris, D. Maggio, J. D. Miller, A. P. Kourtis, Expression of killer cell lectin-like receptor G1 on antigen-specific human CD8+ T lymphocytes during active, latent, and resolved infection and its relation with CD57. J. Immunol. 174, 6088–6094 (2005).
54. B. Bengsch, H. C. Spangenberg, N. Kersting, C. Neumann-Haefelin, E. Panther, F. von Weizsäcker, H. E. Blum, H. Pircher, R. Thimme, Analysis of CD127 and KLRG1 expression on hepatitis C virus-specific CD8+ T cells reveals the existence of different memory T-cell subsets in the peripheral blood and liver. J. Virol. 81, 945–953 (2007).
55. S. H. Robbins, S. C. Terrizzi, B. C. Sydora, T. Mikayama, L. Brossay, Differential regulation of killer cell lectin-like receptor G1 expression on T cells. J. Immunol. 170, 5876–5885 (2003).
56. S. M. Kaech, W. Cui, Transcriptional control of effector and memory CD8+ T cell differentiation. Nat. Rev. Immunol. 12, 749–761 (2012).
57. M. Shugay, O. V. Britanova, E. M. Merzlyak, M. A. Turchaninova, I. Z. Mamedov, T. R. Tuganbaev, D. A. Bolotin, D. B. Staroverov, E. V. Putintseva, K. Plevova, C. Linnemann, D. Shagin, S. Pospisilova, S. Lukyanov, T. N. Schumacher, D. M. Chudakov, Towards error-free profiling of immune repertoires. Nat. Methods 11, 653–655 (2014).
58. M. Shugay, D. V. Bagaev, M. A. Turchaninova, D. A. Bolotin, O. V. Britanova, E. V. Putintseva, M. V. Pogorelyy, V. I. Nazarov, I. V. Zvyagin, V. I. Kirgizova, K. I. Kirgizov, E. V. Skorobogatova, D. M. Chudakov, VDJtools: Unifying post-analysis of T Cell receptor repertoires. PLOS Comput. Biol. 11, e1004503 (2015).
59. G. X. Y. Zheng, J. M. Terry, P. Belgrader, P. Ryvkin, Z. W. Bent, R. Wilson, S. B. Ziraldo, T. D. Wheeler, G. P. McDermott, J. Zhu, M. T. Gregory, J. Shuga, L. Montesclaros, J. G. Underwood, D. A. Masquelier, S. Y. Nishimura, M. Schnall-Levin, P. W. Wyatt, C. M. Hindson, R. Bharadwaj, A. Wong, K. D. Ness, L. W. Beppu, H. J. Deeg, C. McFarland, K. R. Loeb, W. J. Valente, N. G. Ericson, E. A. Stevens, J. P. Radich, T. S. Mikkelsen, B. J. Hindson, J. H. Bielas, Massively parallel digital transcriptional profiling of single cells. Nat. Commun. 8, 14049 (2017).
60. T. Boettler, E. Panther, B. Bengsch, N. Nazarova, H. C. Spangenberg, H. E. Blum, R. Thimme, Expression of the interleukin-7 receptor alpha chain (CD127) on virus-specific CD8+ T cells identifies functionally and phenotypically defined memory T cells during acute resolving hepatitis B virus infection. J. Virol. 80, 3532–3540 (2006).
61. M. J. Fuller, D. A. Hildeman, S. Sabbaj, D. E. Gaddis, A. E. Tebo, L. Shang, P. A. Goepfert, A. J. Zajac, Cutting edge: Emergence of CD127high functionally competent memory T cells is compromised by high viral loads and inadequate T cell help. J. Immunol. 174, 5926–5930 (2005).
62. K. S. Lang, M. Recher, A. A. Navarini, N. L. Harris, M. Löhning, T. Junt, H. C. Probst, H. Hengartner, R. M. Zinkernagel, Inverse correlation between IL-7 receptor expression and CD8 T cell exhaustion during persistent antigen stimulation. Eur. J. Immunol. 35, 738–745 (2005).
63. L. Gattinoni, E. Lugli, Y. Ji, Z. Pos, C. M. Paulos, M. F. Quigley, J. R. Almeida, E. Gostick, Z. Yu, C. Carpenito, E. Wang, D. C. Douek, D. A. Price, C. H. June, F. M. Marincola, M. Roederer, N. P. Restifo, A human memory T cell subset with stem cell-like properties. Nat. Med. 17, 1290–1297 (2011).
64. D. Weiskopf, M. A. Angelo, E. L. de Azeredo, J. Sidney, J. A. Greenbaum, A. N. Fernando, A. Broadwater, R. V. Kolla, A. D. De Silva, A. M. de Silva, K. A. Mattia, B. J. Doranz, H. M. Grey, S. Shresta, B. Peters, A. Sette, Comprehensive analysis of dengue virus-specific responses supports an HLA-linked protective role for CD8+ T cells. Proc. Natl. Acad. Sci. U.S.A. 110, E2046–E2053 (2013).
65. N. Kanakaratne, W. M. P. B. Wahala, W. B. Messer, H. A. Tissera, A. Shahani, N. Abeysinghe, A. M. de Silva, M. Gunasekera, Severe dengue epidemics in Sri Lanka, 2003–2006. Emerg. Infect. Dis. 15, 192–199 (2009).
66. R. J. Fernandez, S. Vazquez, Serological diagnosis of dengue by an ELISA inhibition method (EIM). Mem. Inst. Oswaldo Cruz 85, 347–351 (1990).
67. A. A. Kraus, W. Messer, L. B. Haymore, A. M. de Silva, Comparison of plaque- and flow cytometry-based methods for measuring dengue virus neutralization. J. Clin. Microbiol. 45, 3777–3780 (2007).
68. J. A. Swanstrom, J. A. Plante, K. S. Plante, E. F. Young, E. McGowan, E. N. Gallichotte, D. G. Widman, M. T. Heise, A. M. de Silva, R. S. Baric, Dengue virus envelope dimer epitope monoclonal antibodies isolated from dengue patients are protective against Zika virus. mBio 7, e01123–e16 (2016).
69. J. T. Gaublomme, N. Yosef, Y. Lee, R. S. Gertner, L. V. Yang, C. Wu, P. P. Pandolfi, T. Mak, R. Satija, A. K. Shalek, V. K. Kuchroo, H. Park, A. Regev, Single-cell genomics unveils critical regulators of Th17 cell pathogenicity. Cell 163, 1400–1412 (2015).
70. C. Zheng, L. Zheng, J.-K. Yoo, H. Guo, Y. Zhang, X. Guo, B. Kang, R. Hu, J. Y. Huang, Q. Zhang, Z. Liu, M. Dong, X. Hu, W. Ouyang, J. Peng, Z. Zhang, Landscape of infiltrating T cells in liver cancer revealed by single-cell sequencing. Cell 169, 1342–1356 (2017).
71. G. Seumois, J. Zapardiel-Gonzalo, B. White, D. Singh, V. Schulten, M. Dillon, D. Hinz, D. H. Broide, A. Sette, B. Peters, P. Vijayanand, Transcriptional profiling of Th2 cells identifies pathogenic features associated with asthma. J. Immunol. 197, 655–664 (2016).
72. A.-P. Ganesan, J. Clarke, O. Wood, E. M. Garrido-Martin, S. J. Chee, T. Mellows, D. Samaniego-Castruita, D. Singh, G. Seumois, A. Alzetani, E. Woo, P. S. Friedmann, E. V. King, G. J. Thomas, T. Sanchez-Elsner, P. Vijayanand, C. H. Ottensmeier, Tissue-resident memory features are linked to the magnitude of cytotoxic T cell responses in human lung cancer. Nat. Immunol. 18, 940–950 (2017).
73. M. I. Love, W. Huber, S. Anders, Moderated estimation of fold change and dispersion for RNA-seq data with DESeq2. Genome Biol. 15, 550 (2014).
Acknowledgments: We thank the members of the Vijayanand laboratory for the critical reading of the manuscript and discussions and the Human Immune Profiling Consortium team at the La Jolla Institute (LJI) for the valuable discussions. We thank S. Rosales, S. Liang, and D. Singh from Vijayanand’s group for the help with sequencing runs. We thank C. Kim, L. Boggeman, D. Hinz, and R. Simmons at the LJI Flow Cytometry Core for assisting with cell sorting. We thank C. Cerpas and A. Balmaseda for the preparation of PBMCs in Nicaragua. We thank D. M. Chudakov for sharing the detailed protocol for TCR-seq. Funding: This work was supported by NIH grants [U19AI118626 and U19AI118610 (to P.V. and A.S.); R01HL114093 and R24AI108564 (to P.V.)], the William K. Bowes Jr. Foundation (to P.V.), and NIH contract nos. HHSN272200900042C and HHSN27220140045C (to A.S.). Author contributions: V.S.P., G.S., A.S., B.P., and P.V. conceived the work. V.S.P. and P.V. designed the study and wrote the manuscript. V.S.P. designed and performed the experiments and analyzed the data under the supervision of P.V. A.M. assisted V.S.P. in the RNA-seq analysis and performed all R-based programming. J.C. assisted V.S.P. in the single-cell RNA-seq experiments. P.O. assisted V.S.P. and D.W. in the DENV peptide stimulation experiments. B.J.S. performed the IL-7R fluorescence-activated cell sorting experiments shown in Fig. 5 (D to G). E.H. and A.D.d.S. collected the blood samples in Nicaragua and Sri Lanka and determined the DENV serostatus, respectively. Competing interests: All authors declare that they have no competing interests. Data and materials availability: The sequence data sets reported in this paper have been deposited in the Gene Expression Omnibus with accession no. GSE106544.
Submitted 30 May 2017Resubmitted 27 September 2017Accepted 30 November 2017Published 19 January 201810.1126/sciimmunol.aan8664
Citation: V. S. Patil, A. Madrigal, B. J. Schmiedel, J. Clarke, P. O’Rourke, A. D. de Silva, E. Harris, B. Peters, G. Seumois, D. Weiskopf, A. Sette, P. Vijayanand, Precursors of human CD4+ cytotoxic T lymphocytes identified by single-cell transcriptome analysis. Sci. Immunol. 3, eaan8664 (2018).
by guest on August 12, 2019
http://imm
unology.sciencemag.org/
Dow
nloaded from

analysis cytotoxic T lymphocytes identified by single-cell transcriptome+Precursors of human CD4
Peters, Gregory Seumois, Daniela Weiskopf, Alessandro Sette and Pandurangan VijayanandVeena S. Patil, Ariel Madrigal, Benjamin J. Schmiedel, James Clarke, Patrick O'Rourke, Aruna D. de Silva, Eva Harris, Bjoern
DOI: 10.1126/sciimmunol.aan8664, eaan8664.3Sci. Immunol.
design in the context of chronic viral infections.vaccinedefining the gene expression signature of CD4-CTLs and their precursors, their studies should facilitate improved
clonal expansion and that CD4-CTL precursor cells are characterized by high expression of interleukin-7 receptor. Bycells from human blood to identify precursors that give rise to CD4-CTLs. They report that CD4-CTLs undergo significant
T+. have carried out single RNA-seq and sequenced the T cell receptors (TCRs) of CD4et alDENV infection. Here, Patil including dengue virus (DENV) infection, and these cells have been associated with protection in the context of severe
cytotoxic T lymphocytes (CD4-CTLs) were initially identified in patients with chronic viral infections,+CD4Committing to cytotoxicity
ARTICLE TOOLS http://immunology.sciencemag.org/content/3/19/eaan8664
MATERIALSSUPPLEMENTARY http://immunology.sciencemag.org/content/suppl/2018/01/16/3.19.eaan8664.DC1
REFERENCES
http://immunology.sciencemag.org/content/3/19/eaan8664#BIBLThis article cites 73 articles, 26 of which you can access for free
Terms of ServiceUse of this article is subject to the
a registered trademark of AAAS. isScience ImmunologyAssociation for the Advancement of Science. No claim to original U.S. Government Works. The title
New York Avenue NW, Washington, DC 20005. 2017 © The Authors, some rights reserved; exclusive licensee American (ISSN 2470-9468) is published by the American Association for the Advancement of Science, 1200Science Immunology
by guest on August 12, 2019
http://imm
unology.sciencemag.org/
Dow
nloaded from
Related Documents