SYSTEMATIC REVIEW OF THE LINK BETWEEN TOBACCO AND POVERTY

Welcome message from author
This document is posted to help you gain knowledge. Please leave a comment to let me know what you think about it! Share it to your friends and learn new things together.
Transcript
SYSTEMATIC REVIEW OF THE LINK BETWEEN TOBACCO AND POVERTY
2
WHO Library Cataloguing-in-Publication Data
Systematic review of the link between tobacco and poverty – 2014 update.
1.Tobacco. 2.Tobacco Use Disorder. 3.Poverty. 4.Smoking - epidemiology. 5.Review. 6.Meta-Analysis. I.Ciapponi, Agustín. II.World Health Organization.
ISBN 978 92 4 150782 0 (NLM classification: WM 290)
© World Health Organization 2014
All rights reserved. Publications of the World Health Organization are available on the WHO website (www.who.int) or can be purchased from WHO Press, World Health Organization, 20 Avenue Appia, 1211 Geneva 27, Switzerland (tel.: +41 22 791 3264; fax: +41 22 791 4857;
e-mail: [email protected]).
Requests for permission to reproduce or translate WHO publications –whether for sale or for non-commercial distribution– should be addressed to WHO Press through the WHO website (www.who.int/about/licensing/copyright_form/en/index.html).
The designations employed and the presentation of the material in this publication do not imply the expression of any opinion whatsoever on the part of the World Health Organization concerning the legal status of any country, territory, city or area or of its authorities, or concerning the delimitation of its frontiers or boundaries. Dotted and dashed lines on maps represent approximate border lines for which there may not yet be full agreement.
The mention of specific companies or of certain manufacturers’ products does not imply that they are endorsed or recommended by the World Health Organization in preference to others of a similar nature that are not mentioned. Errors and omissions excepted, the names of proprietary products are distinguished by initial capital letters.
All reasonable precautions have been taken by the World Health Organization to verify the information contained in this publication. However, the published material is being distributed without warranty of any kind, either expressed or implied. The responsibility for the interpretation and use of the material lies with the reader. In no event shall the World Health Organization be liable for damages arising from its use.
The named authors alone are responsible for the views expressed in this publication.
3
Work conducted for WHO by the Institute for Clinical Effectiveness and Health Policy (Instituto de Efectividad Clínica y Sanitaria – IECS) Argentine Cochrane Centre IECS Iberoamerican Cochrane Network Buenos Aires, Argentina
Project Leader: Agustín Ciapponi
Review team:
Personnel Name
Researchers
Dr. Agustín Ciapponi* Dr. Ariel Bardach* Dr. Demián Glujovsky* Dr. Natalie Soto Dr. César Arellano Dr. Paul Anthony Camacho Lic. Kelly Lee Dr. Rocio Victoria Hermoza Moquillaza
Librarian Lic. Daniel Comandé* Statistician Lic. Luz Gibbons* Experts Advisors Dr. Brunilda Casetta&
Dr. AlejanDr.o J. Videla# Dr. Paola Morello°
Health Economics Expert Advisor Lic. Joaquin E. Caporale*
*IECS-Institute for Clinical Effectiveness and Health Policy
& Ministerio de Salud, Dirección de Promoción de la Salud y Control de Enfermedades No Transmisibles.
#Universidad Austral. Argentina.
°Ministerio de Salud. Programa Nacional de Control de Tabaco.
March 2014
4
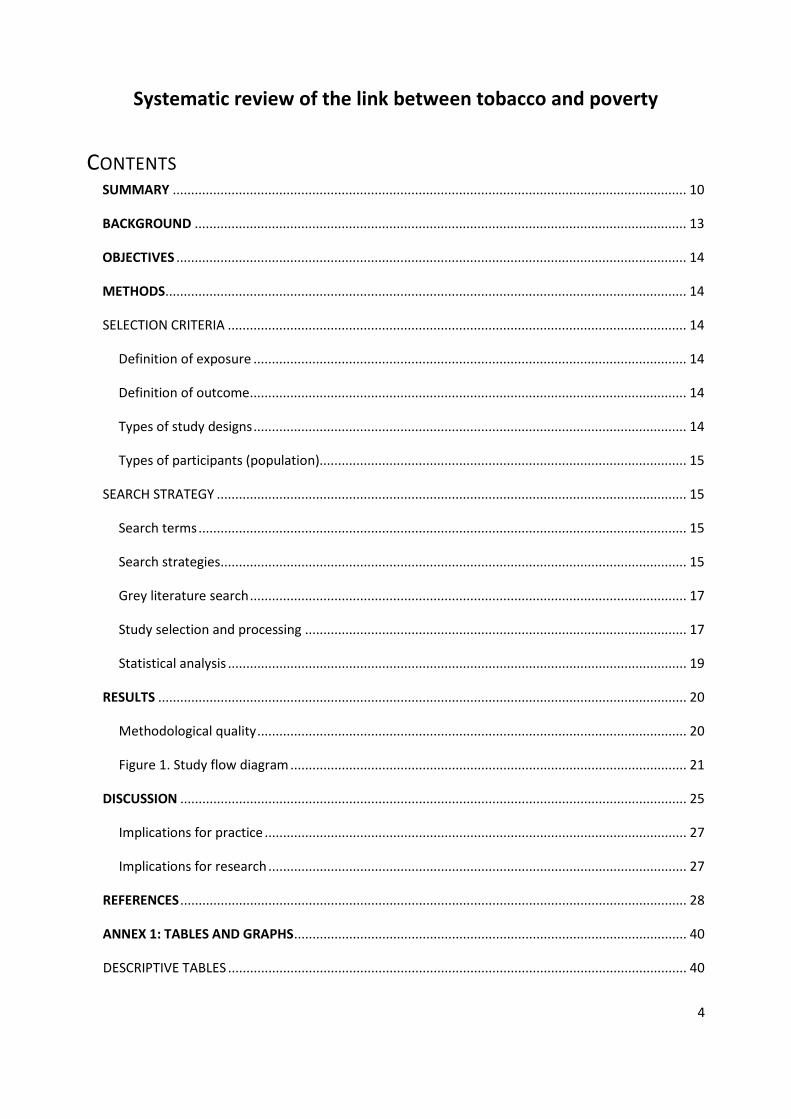
Systematic review of the link between tobacco and poverty
CONTENTS SUMMARY ............................................................................................................................................ 10
BACKGROUND ...................................................................................................................................... 13
OBJECTIVES ........................................................................................................................................... 14
METHODS .............................................................................................................................................. 14
SELECTION CRITERIA ............................................................................................................................. 14
Definition of exposure ...................................................................................................................... 14
Definition of outcome ....................................................................................................................... 14
Types of study designs ...................................................................................................................... 14
Types of participants (population).................................................................................................... 15
SEARCH STRATEGY ................................................................................................................................ 15
Search terms ..................................................................................................................................... 15
Search strategies ............................................................................................................................... 15
Grey literature search ....................................................................................................................... 17
Study selection and processing ........................................................................................................ 17
Statistical analysis ............................................................................................................................. 19
RESULTS ................................................................................................................................................ 20
Methodological quality ..................................................................................................................... 20
Figure 1. Study flow diagram ............................................................................................................ 21
DISCUSSION .......................................................................................................................................... 25
Implications for practice ................................................................................................................... 27
Implications for research .................................................................................................................. 27
REFERENCES .......................................................................................................................................... 28
ANNEX 1: TABLES AND GRAPHS ........................................................................................................... 40
DESCRIPTIVE TABLES ............................................................................................................................. 40
5
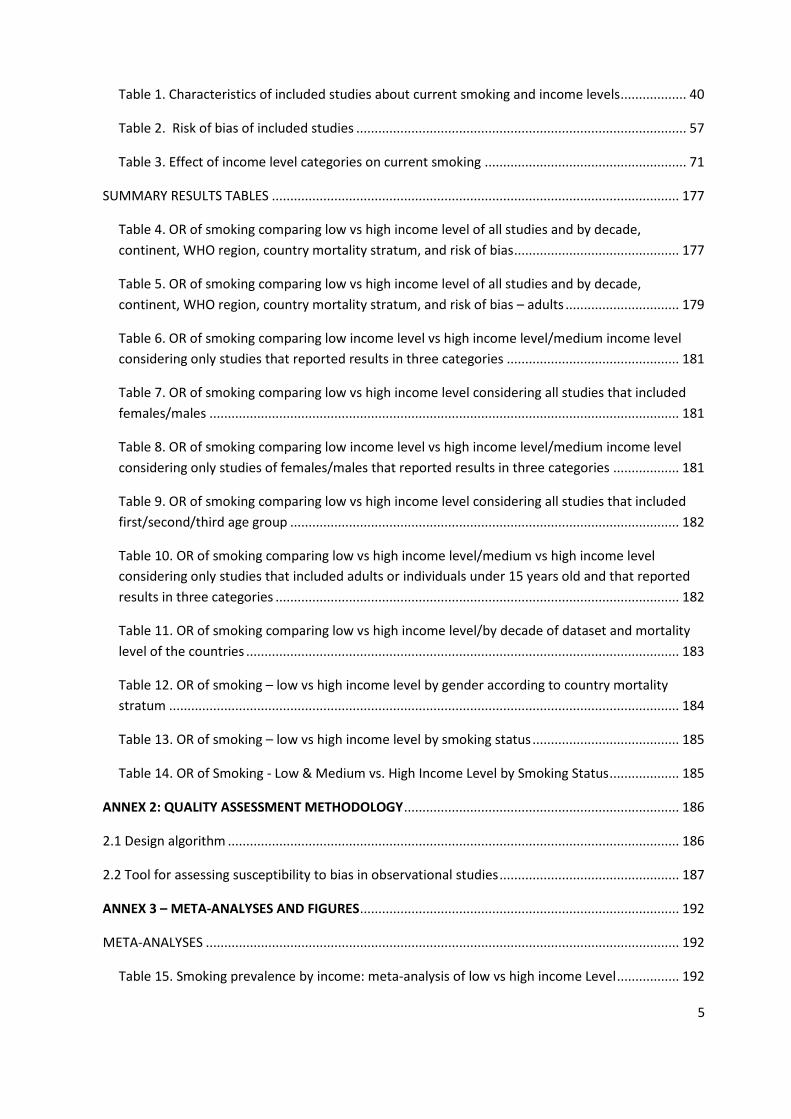
Table 1. Characteristics of included studies about current smoking and income levels .................. 40
Table 2. Risk of bias of included studies .......................................................................................... 57
Table 3. Effect of income level categories on current smoking ....................................................... 71
SUMMARY RESULTS TABLES ............................................................................................................... 177
Table 4. OR of smoking comparing low vs high income level of all studies and by decade, continent, WHO region, country mortality stratum, and risk of bias ............................................. 177
Table 5. OR of smoking comparing low vs high income level of all studies and by decade, continent, WHO region, country mortality stratum, and risk of bias – adults ............................... 179
Table 6. OR of smoking comparing low income level vs high income level/medium income level considering only studies that reported results in three categories ............................................... 181
Table 7. OR of smoking comparing low vs high income level considering all studies that included females/males ................................................................................................................................ 181
Table 8. OR of smoking comparing low income level vs high income level/medium income level considering only studies of females/males that reported results in three categories .................. 181
Table 9. OR of smoking comparing low vs high income level considering all studies that included first/second/third age group .......................................................................................................... 182
Table 10. OR of smoking comparing low vs high income level/medium vs high income level considering only studies that included adults or individuals under 15 years old and that reported results in three categories .............................................................................................................. 182
Table 11. OR of smoking comparing low vs high income level/by decade of dataset and mortality level of the countries ...................................................................................................................... 183
Table 12. OR of smoking – low vs high income level by gender according to country mortality stratum ........................................................................................................................................... 184
Table 13. OR of smoking – low vs high income level by smoking status ........................................ 185
Table 14. OR of Smoking - Low & Medium vs. High Income Level by Smoking Status ................... 185
ANNEX 2: QUALITY ASSESSMENT METHODOLOGY ........................................................................... 186
2.1 Design algorithm ........................................................................................................................... 186
2.2 Tool for assessing susceptibility to bias in observational studies ................................................. 187
ANNEX 3 – META-ANALYSES AND FIGURES ....................................................................................... 192
META-ANALYSES ................................................................................................................................. 192
Table 15. Smoking prevalence by income: meta-analysis of low vs high income Level ................. 192
6
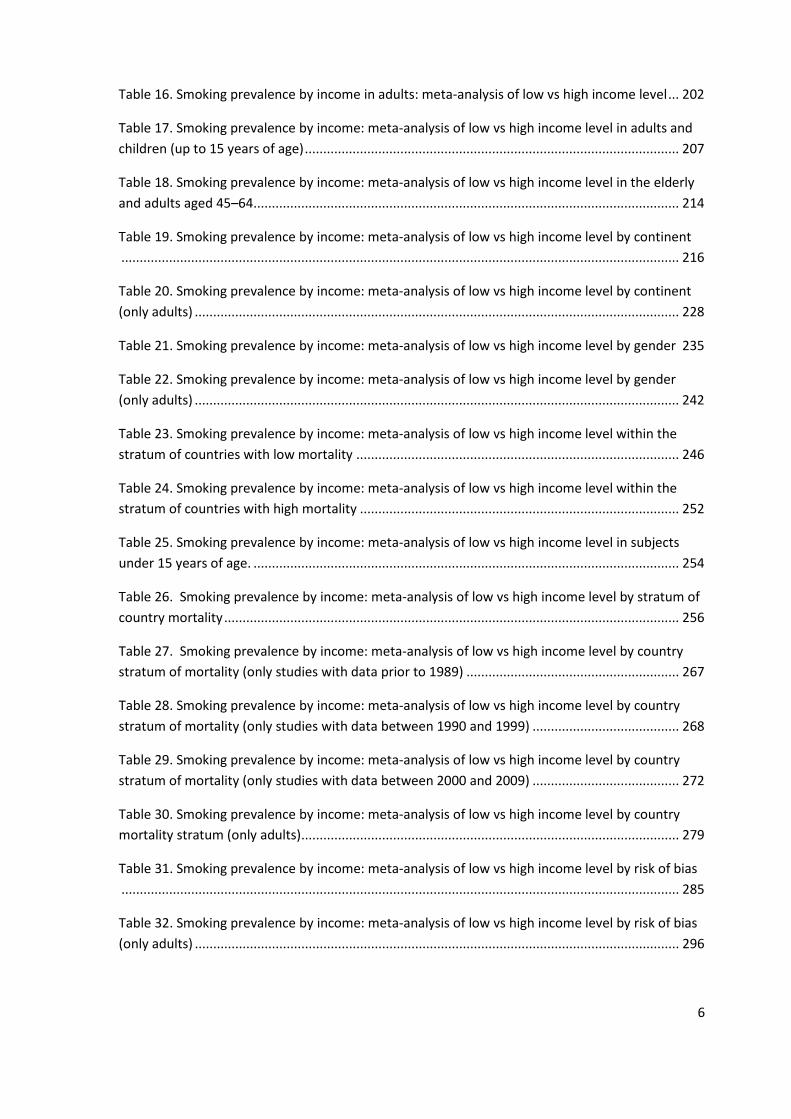
Table 16. Smoking prevalence by income in adults: meta-analysis of low vs high income level ... 202
Table 17. Smoking prevalence by income: meta-analysis of low vs high income level in adults and children (up to 15 years of age) ...................................................................................................... 207
Table 18. Smoking prevalence by income: meta-analysis of low vs high income level in the elderly and adults aged 45–64 .................................................................................................................... 214
Table 19. Smoking prevalence by income: meta-analysis of low vs high income level by continent ........................................................................................................................................................ 216
Table 20. Smoking prevalence by income: meta-analysis of low vs high income level by continent (only adults) .................................................................................................................................... 228
Table 21. Smoking prevalence by income: meta-analysis of low vs high income level by gender 235
Table 22. Smoking prevalence by income: meta-analysis of low vs high income level by gender (only adults) .................................................................................................................................... 242
Table 23. Smoking prevalence by income: meta-analysis of low vs high income level within the stratum of countries with low mortality ........................................................................................ 246
Table 24. Smoking prevalence by income: meta-analysis of low vs high income level within the stratum of countries with high mortality ....................................................................................... 252
Table 25. Smoking prevalence by income: meta-analysis of low vs high income level in subjects under 15 years of age. .................................................................................................................... 254
Table 26. Smoking prevalence by income: meta-analysis of low vs high income level by stratum of country mortality ............................................................................................................................ 256
Table 27. Smoking prevalence by income: meta-analysis of low vs high income level by country stratum of mortality (only studies with data prior to 1989) .......................................................... 267
Table 28. Smoking prevalence by income: meta-analysis of low vs high income level by country stratum of mortality (only studies with data between 1990 and 1999) ........................................ 268
Table 29. Smoking prevalence by income: meta-analysis of low vs high income level by country stratum of mortality (only studies with data between 2000 and 2009) ........................................ 272
Table 30. Smoking prevalence by income: meta-analysis of low vs high income level by country mortality stratum (only adults) ....................................................................................................... 279
Table 31. Smoking prevalence by income: meta-analysis of low vs high income level by risk of bias ........................................................................................................................................................ 285
Table 32. Smoking prevalence by income: meta-analysis of low vs high income level by risk of bias (only adults) .................................................................................................................................... 296
7
Table 33. Smoking prevalence by income: meta-analysis of low vs high income level by WHO region .............................................................................................................................................. 303
Table 34. Smoking prevalence by income: meta-analysis of low vs high income level by WHO region (only adults) ......................................................................................................................... 315
Table 35. Smoking prevalence by income: meta-analysis of low vs high income level by decade 322
Table 36. Smoking prevalence by income: meta-analysis of low vs high income level by decade (only adults) .................................................................................................................................... 333
Table 37. Smoking prevalence by income: meta-analysis of medium vs high income Level (all studies) ........................................................................................................................................... 339
Table 38. Smoking prevalence by income: meta-analysis of medium vs high income level (only adults) ............................................................................................................................................. 348
Table 39. Smoking prevalence by income: meta-analysis of medium vs high income Level (only females) .......................................................................................................................................... 354
Table 40. Smoking prevalence by income: meta-analysis of medium vs high income level (only males) ............................................................................................................................................. 358
Table 41. Smoking prevalence by income: meta-analysis of medium vs high income level (only subjects under 15 years of age) ...................................................................................................... 361
Table 42. Subgroup analysis by smoking status: low vs high ........................................................ 364
Table 43. Subgroup analysis by smoking status: current smokers low and medium vs high ....... 371
Table 44. Subgroup analysis by smoking status: daily smokers low and medium vs high ........... 378
Table 45. Subgroup analysis by smoking status: household smokers low and medium vs high .. 379
Table 46. Subgroup analysis by smoking status: not reported smoking status smokers low and medium vs high ............................................................................................................................... 381
FIGURES ............................................................................................................................................... 383
Figure 2. Smoking prevalence by income: meta-analysis of low vs high income level .................. 383
Figure 3. Smoking prevalence by income: funnel plot of low vs high income level ....................... 384
Figure 4. Smoking prevalence by income in adults: meta-analysis of low vs high income level .... 385
Figure 5. Smoking prevalence by income: meta-analysis of low vs high income level in adults and children (up to 15 years of age) ...................................................................................................... 386
Figure 6. Smoking prevalence by income: meta-analysis of low vs high income level in the elderly and adults aged 45–64 .................................................................................................................... 387
8
Figure 7. Smoking prevalence by income: meta-analysis of low vs high income by continent ..... 388
Figure 8. Smoking prevalence by income: meta-analysis of low vs high income level by continent (only adults) .................................................................................................................................... 389
Figure 9. Smoking prevalence by income: meta-analysis of low vs high income level by gender . 390
Figure 10. Smoking prevalence by income: meta-analysis of low vs high income level by gender (only adults) .................................................................................................................................... 391
Figure 11. Smoking prevalence by income: meta-analysis of low vs high income level within the stratum of countries with low mortality. ....................................................................................... 392
Figure 12. Smoking prevalence by income: meta-analysis of low vs high income level within the stratum of countries with high mortality. ...................................................................................... 393
Figure 13. Smoking prevalence by income: meta-analysis of low vs high income level in subjects under 15 years of age. .................................................................................................................... 394
Figure 14. Smoking prevalence by income: meta-analysis of low vs high income level by stratum of country mortality ............................................................................................................................ 395
Figure 15. Smoking prevalence by income: meta-analysis of low vs high income level by country stratum of mortality (only studies with data prior to 1989) .......................................................... 396
Figure 16. Smoking prevalence by income: meta-analysis of low vs high income level by country stratum of mortality (only studies with data between 1990 and 1999) ........................................ 397
Figure 17. Smoking prevalence by income: meta-analysis of low vs high income level by country stratum of mortality (only studies with data between 2000 and 2009) ........................................ 398
Figure 18. Smoking prevalence by income: meta-analysis of low vs high income level by country mortality stratum (only adults) ....................................................................................................... 399
Figure 19. Smoking prevalence by income: meta-analysis of low vs high income level by risk of bias ........................................................................................................................................................ 400
Figure 20. Smoking prevalence by income: meta-analysis of low vs high income level by risk of bias (only adults) .................................................................................................................................... 401
Figure 21. Smoking prevalence by income: meta-analysis of low vs high income level by WHO region .............................................................................................................................................. 402
Figure 22. Smoking prevalence by income: meta-analysis of low vs high income level by WHO region (only adults) ......................................................................................................................... 403
Figure 23. Smoking prevalence by income: meta-analysis of low vs high income level by decade 404
Figure 24. Smoking prevalence by income: meta-analysis of low vs high income level by decade (only adults) .................................................................................................................................... 405
9
Figure 25. Smoking prevalence by income: meta-analysis of medium vs high income level (all studies) ........................................................................................................................................... 406
Figure 26. Smoking prevalence by income: meta-analysis of medium vs high income level (only adults) ............................................................................................................................................. 407
Figure 27. Smoking prevalence by income: meta-analysis of medium vs high income level (only females) .......................................................................................................................................... 408
Figure 28. Smoking prevalence by income: meta-analysis of medium vs high income level (only males) ............................................................................................................................................. 409
Figure 29. Smoking prevalence by income: meta-analysis of medium vs high income level (only subjects under 15 years of age) ...................................................................................................... 410
Figure 30. Subgroup analysis by smoking status: low vs high (reference) ..................................... 411
Figure 31. Subgroup analysis by smoking status: current smokers low and medium vs high........ 412
Figure 32. Subgroup analysis by smoking status: daily smokers low and medium vs high ............ 413
Figure 33. Subgroup analysis by smoking status: household smokers low and medium vs high .. 414
Figure 34. Subgroup analysis by smoking status: not reported smokers low and medium vs high414
10
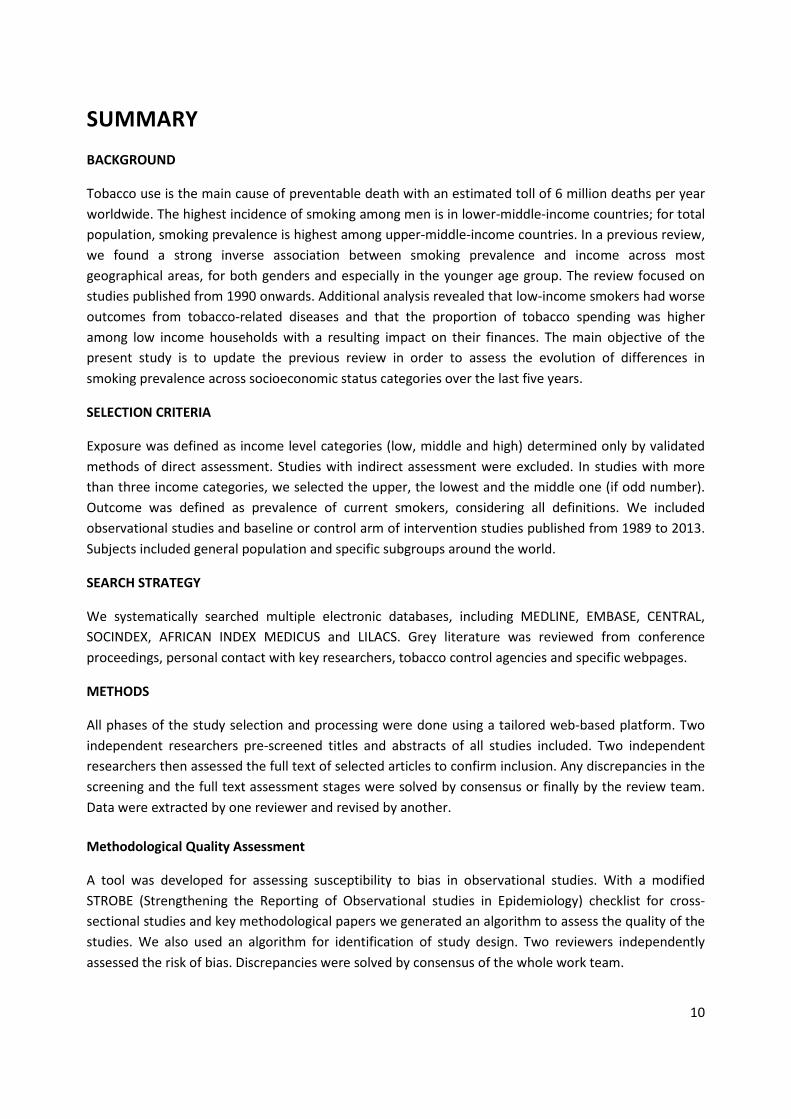
SUMMARY
BACKGROUND
Tobacco use is the main cause of preventable death with an estimated toll of 6 million deaths per year worldwide. The highest incidence of smoking among men is in lower-middle-income countries; for total population, smoking prevalence is highest among upper-middle-income countries. In a previous review, we found a strong inverse association between smoking prevalence and income across most geographical areas, for both genders and especially in the younger age group. The review focused on studies published from 1990 onwards. Additional analysis revealed that low-income smokers had worse outcomes from tobacco-related diseases and that the proportion of tobacco spending was higher among low income households with a resulting impact on their finances. The main objective of the present study is to update the previous review in order to assess the evolution of differences in smoking prevalence across socioeconomic status categories over the last five years.
SELECTION CRITERIA
Exposure was defined as income level categories (low, middle and high) determined only by validated methods of direct assessment. Studies with indirect assessment were excluded. In studies with more than three income categories, we selected the upper, the lowest and the middle one (if odd number). Outcome was defined as prevalence of current smokers, considering all definitions. We included observational studies and baseline or control arm of intervention studies published from 1989 to 2013. Subjects included general population and specific subgroups around the world.
SEARCH STRATEGY
We systematically searched multiple electronic databases, including MEDLINE, EMBASE, CENTRAL, SOCINDEX, AFRICAN INDEX MEDICUS and LILACS. Grey literature was reviewed from conference proceedings, personal contact with key researchers, tobacco control agencies and specific webpages.
METHODS
All phases of the study selection and processing were done using a tailored web-based platform. Two independent researchers pre-screened titles and abstracts of all studies included. Two independent researchers then assessed the full text of selected articles to confirm inclusion. Any discrepancies in the screening and the full text assessment stages were solved by consensus or finally by the review team. Data were extracted by one reviewer and revised by another.
Methodological Quality Assessment
A tool was developed for assessing susceptibility to bias in observational studies. With a modified STROBE (Strengthening the Reporting of Observational studies in Epidemiology) checklist for cross-sectional studies and key methodological papers we generated an algorithm to assess the quality of the studies. We also used an algorithm for identification of study design. Two reviewers independently assessed the risk of bias. Discrepancies were solved by consensus of the whole work team.
11
Analysis
We used Stata 11.0 (StataCorp, Texas) to perform meta-analyses of adjusted odds ratios (OR) and confidence intervals, yielding summary OR. We used a random effect model to accommodate the expected heterogeneity arising from the diversity of included studies. Statistical heterogeneity was evaluated using the I-squared (I2) test. We performed planned subgroup analysis by decade of dataset, WHO region, continent, mortality rate stratum, risk of bias, gender and age group. We present summary and descriptive statistics for unadjusted smoking prevalence.
RESULTS
We performed two searches retrieving 13 583 references. After eliminating duplicates and screening by title and abstract, 1226 studies were selected for detailed evaluation. Finally, 201 (n= 33 834 218) of the articles met inclusion criteria; 173 of the included studies were cross-sectional (85%), 14 were surveillance reports (6.9%), six (2.9%) were prospective studies, three were retrospective cohorts (1.4%), three (1.4%) were case-control studies, one community-based randomized controlled trial and one qualitative focus group report. There was no evidence of publication bias.
Median proportion of males was 44%. Median current smoker rate was 25% (range 6.3–73.7%). One hundred sixty-four studies/sub-studies were incorporated in the meta-analysis of current smoking by income level. In the analyzed population, lower income was significantly associated with higher prevalence of current smoking (OR 1.45 95% CI 1.35–1.56). This association persisted in most geographical areas. It was stronger for data retrieved in the 1990s (OR 1.42 95% CI 1.24–1.62), the 2000s (OR 1.48 95% CI 1.33–1.64), low mortality countries (OR 1.48 95% CI 1.37–1.60) and women (OR 1.59 95% CI 1.30–1.93). A gradient of smoking prevalence across income strata showed a dose-response relationship, with the highest prevalence of tobacco use in the lowest income levels (OR 1.69 95% CI 1.49–1.92), and less marked increase prevalence in the middle income level (OR 1.31 95% CI 1.20–1.43) as compared to high income level populations. The association was observed for both genders and for adult populations while studies of populations younger than age 15 did not show a clear association (OR 0.99 95% CI 0.73–1.35). Studies with lower risk of bias also showed stronger global association (OR 1.60 95% CI 1.42–1.80).
DISCUSSION
The main finding of this update was a robust association between higher prevalence of current smoking and lower income levels. This phenomenon was consistent for most geographical regions, in adults and both males and females, although the association was stronger among women. A gradient of smoking prevalence across income strata was also identified, especially evident for adults and in countries with low global mortality. Studies performed from the 1990s onward show an increasing strength of the association, allowing us to be confident in its direction. The effect was strong for most areas of the world, excepting Eastern Mediterranean Regional Office (EMRO) and African Regional Office (AFRO) regions where data were scarce. Datasets from adolescents did not yield a clear association. Results from women signaled them as an especially vulnerable group, particularly in low mortality countries.
CONCLUSIONS
This is an exhaustive and methodological rigorous systematic review, providing updated data on the magnitude of the impact of income level on the distribution of smoking. This complex issue deals with a
12
great heterogeneity of exposure and outcome variables, as well as populations and settings. Nevertheless, we presented solid bases to support an inverse relationship between income level and tobacco use prevalence. Greater efforts to reduce tobacco use among poor people are needed. This research may be useful for policy-makers as well to improve strategies in tobacco control and public health equality.
13
BACKGROUND
Tobacco use is the main cause of preventable death. Almost six million people die from tobacco use each year worldwide, both from direct tobacco use and second-hand smoke. Smoking is estimated to cause about 71% of the world’s lung cancer, 42% of chronic respiratory disease and nearly 10% of cardiovascular disease. The highest incidence of smoking among men is in lower-middle-income countries; for total population, smoking prevalence is highest among upper-middle-income countries.1,2 The current six million deaths per year is expected to increase to eight million deaths in 2030, if nothing is done to curb the epidemic.3
The widely quoted four-stages model of the smoking epidemic, developed in 1994, distinguishes a sequence of stages by gender smoking prevalence and tobacco-related burden of disease throughout the countries.4 In early stages, tobacco use and tobacco-related diseases predominate in males with limited dissemination among females. Subsequently, male prevalence declines with a delayed reduction of disease incidence in males while women follow a similar progression of lesser proportions. According to this evolution, higher-income societies are involved earlier as they are more open to innovation and concerned with health. However, this model cannot be applied to all countries.4,5 The model was reviewed in 2012 to see if it is still applicable now, and it was concluded that it still provided a useful description for many developing countries, but would better describe the epidemic in developing countries if it was done separately for men and for women.6
During the last decades a considerable body of evidence has described an inverse association between social status and smoking.7–11 In these studies, poverty and tobacco consumption were measured using diverse means; however, income level was frequently signaled as a factor clearly and strongly associated with poverty.
In a previous review, we found a strong inverse association between smoking prevalence and lower income across most geographical areas, for both genders and different age group. The review looked at studies published from 1990 onwards. Additional analysis revealed that low income smokers had worse outcomes from tobacco-related diseases and that the proportion of tobacco spending was higher among low income households, with consequent impact on their finances.12
The main objective of the present study is to update the previous review in order to assess the evolution of smoking prevalence across socioeconomic status categories over the last five years.
14
OBJECTIVES
Overall objective:
To assess the association between cigarette smoking consumption and income level.
Specific objectives:
To compare cigarette smoking prevalence in high-income groups versus lower-income groups. Subgroup analyses were planned to assess the strength of the association according to decade of the dataset, WHO region, continent, country mortality strata, gender, age group and risk of bias.
METHODS
SELECTION CRITERIA
Studies published from 1989 to 2013, regardless of time of dataset collection, and meeting the following criteria:
DEFINITION OF EXPOSURE
We included papers defining socioeconomic status by direct measures of income as total household income, personal income, minimum salary line of poverty, neighborhood-level measures and indexes including any direct income measures. We excluded indirect assessment of SES (socioeconomic status) – i.e. proxies as education level, employment, kind of labor – due to the great heterogeneity between settings. We decided not to include econometric studies because the linear regressions used to obtain theses results were not comparable with the other designs.
When the study presented more than two income categories, one was chosen as a middle category for comparison with the highest and lowest categories.
DEFINITION OF OUTCOME
We accepted any definition of current smoking used by the authors. We divided this outcome according to several groups: 1- At least 1 cigarette per day. 2- At least 100 cigarettes in their entire life and now smoke either every day or some days. 3- Adolescent current smoker. 4- Author’s variable definition of current smoker 5- Pregant current smoker. 6- Current household tobacco use (all types of tobacco products). 7- Smoking in the last month. 8- Not reported.
TYPES OF STUDY DESIGNS
Observational studies: cohort, case-control, cross sectional, interrupted time series, case series and econometric studies.
15
Baseline and control arm of intervention studies (intervention assigned by researchers) were also accepted but assessed by observational component: clinical trials, before-after and interrupted time series studies.
TYPES OF PARTICIPANTS (POPULATION)
We classified each study by referring to general population as well as specific groups (ethnic, geographic groups of interest, labor, etc.)
SEARCH STRATEGY
As the purpose of this document is to update the search for the previous systematic review that was done from July 2008 to January 2009, we performed a new search finished April 2013.
Electronic Search (indexed articles): We systematically searched multiple electronic databases, including MEDLINE, EMBASE, CENTRAL, SOCINDEX, AFRICAN INDEX MEDICUS and LILACS.
The reference list of all the full texts retrieved was then examined in order to obtain additional references.
Because the wide spectrum of study designs accepted for this review, a highly sensitive search strategy was performed. The search terms, adapted to each database, and search strategies are detailed below:
SEARCH TERMS
(Poverty[Mesh] OR poverty[tiab] OR Income[ti] OR poor people*[tiab] OR poors[tiab] OR pauper*[tiab] OR Social risk*[tiab] OR Socioeconomic status[tiab] OR Socio economic status[tiab] OR Indigenc*[tiab] OR indigent*[tiab]) AND (Tobacco Smoke Pollution[Mesh] OR Tobacco Use Disorder[Mesh] OR tobacco*[tiab] OR cigar*[tiab] OR Smoking[Mesh:NoExp] OR smoking[tiab] OR smoker*[tiab] OR nicotin*[tiab])
SEARCH STRATEGIES
MEDLINE: #1 Search (Tobacco Use Disorder[MeSH Terms] OR smoking[Mesh Terms] OR tobacco[Ti]) AND (socioeconomic factors[Mesh Terms]) Limits: Entrez Date from 1988, Humans #2 Search tobacco[Title/Abstract] #3 Search (Tobacco Use Disorder[MeSH Terms] OR smoking[Mesh Terms] OR tobacco[Tiab]) AND (socioeconomic factors[Mesh Terms]) Limits: Entrez Date from 1988, Humans #4 Search ("tobacco use disorder"[MeSH Terms] OR "smoking"[MeSH Terms] OR tobacco[Tiab]) AND "socioeconomic factors"[MeSH Terms] #5 Search ("tobacco use disorder"[MeSH Terms] OR "smoking"[MeSH Terms] OR tobacco[Tiab]) AND "socioeconomic factors"[MeSH Terms] Limits: Entrez Date from 1988, Humans #6 Search ("tobacco use disorder"[MeSH Terms] OR "smoking"[MeSH Terms] OR tobacco[Tiab]) AND "socioeconomic factors"[MeSH Terms] AND socioeconomic factors[MeSH Terms] #7 Search socioeconomic factors[MeSH Terms] #8 Search poverty[MeSH Terms] OR socioeconomic factor*[Tiab] OR socio economic factor*[Tiab]
EMBASE: 1 exp POVERTY/ 2 poverty.mp. 3 exp lowest income group/ 4 income$.mp.
16
5 poor people$.mp. 6 pauper$.mp. 7 psychosocial$.mp. 8 indigenc$.mp. 9 indigent$.mp. 10 exp social class/ 11 exp socioeconomics/ 12 impover$.mp. 13 socioeconomic$.mp. 14 socio economic$.mp. 15 (rent$ or expen$ or salar$ or wage$).mp. 16 or/1-15 17 (tobacc$ or cigar$ or smoking or nicotin$).ti,ab. 18 (dependen$ or addict$ or consume$ or smoker$).ti,ab. 19 17 and 18 20 exp Cigarette Smoke/ 21 exp Tobacco Dependence/ 22 or/19-21 23 16 and 22 24 23 not exp tobacco smokeless/
CENTRAL: #1 (household* OR famil* OR domestic* OR home* OR house*):ti,ab,kw and (expenditure* OR disbursement* OR spending* OR payment* OR expen*):ti,ab,kw #2 MeSH descriptor Income explode all trees #3 MeSH descriptor Salaries and Fringe Benefits explode all trees #4 MeSH descriptor Poverty explode all trees #5 MeSH descriptor Social Class explode all trees #6 (income* OR wage* OR salar* OR pover* OR Indigenc* OR Poor* OR indigent* OR impover* OR pauper* OR disadvant* OR rent*):ti,ab,kw #7 (#1 OR #2 OR #3 OR #4 OR #5 OR #6) #8 MeSH descriptor Tobacco Use Disorder explode all trees #9 MeSH descriptor Smoking, this term only #10 (tobacco OR smoking OR smoker* OR cigar*):ti,ab,kw #11 (#8 OR #9 OR #10) #12 (#7 AND #11) #13 MeSH descriptor Tobacco, Smokeless explode all trees #14 (#12 AND NOT #13)
LILACS: (MH Renta OR Renda$ OR Rent$ OR Ingreso$ OR Ingresso$ OR Fringe$ OR Wage$ OR Jornales OR salari$ OR Ordenados OR MH Salarios y Beneficios OR gasto$ OR payment$ OR hogar$ OR MH Pobreza OR pover$ OR pobre$ OR Indigenci$ OR indigent$ OR poor$ OR impover$ OR pauper$ OR MH Clase Social OR Clase Social OR Classe Social OR social class OR Desventa$ OR disadvant$) AND (MH Trastorno por Uso de Tabaco OR Tobacc$ OR Tabaco$ OR smoking OR MH Tabaquismo OR Tabagis$ OR Tabaquis$ OR fuma$ OR cigar$)
SOCINDEX: (DE "POVERTY" OR DE "SOCIAL classes" or DE "SOCIAL conditioning" OR AB income* OR TI income OR AB socioeconomic* OR TI socioeconomic* OR AB "socio economic*" OR TI "socio economic*" OR AB indigent* OR TI indigent* OR TI indigenc* OR AB indigenc*) AND (DE "Tobacco use" OR DE "Nicotine addiction" OR AB tobacco OR TI tobacco OR AB cigar* OR TI cigar* OR AB smoking OR TI smoking OR AB Smoker* OR TI Smoker*)
AFRICAN INDEX MEDICUS: tobacc$ or cigar$or smoking [Key Word] or tobacco use disorder [Descriptor] or smoking [Descriptor]
17
GREY LITERATURE SEARCH
We reviewed the International tobacco or Health Conference Paper Index from 2006.
We personally contacted key referents in tobacco control to obtain unpublished information and referrals to other key researchers.
We consulted numerous tobacco control agencies web-pages:
World Health Organization www.who.int Pan-American Health Organization www.paho.org Center for Tobacco Control Research and Education (UCSF) tobacco.ucsf.edu Campaign for Tobacco-Free Kids www.tobaccofreekids.org Americans for Nonsmokers’ Rights www.no-smoke.org
We contacted known Tobacco Control international networks: CLACCTA; VIVIR SIN TABACO, and GLOBALink asking for grey literature and key researchers contacts.
We reviewed the following webpages, particularly addressed to capture grey literature from low and middle income countries:
Indmed (Indian pub med): http://indmed.nic.in/ Koreamed (Korean pub med): http://www.koreamed.org/SearchBasic.php South East Asia: www.hellis.org Latin America and Caribbean: http://bases.bireme.br/cgi-bin/wxislind.exe/iah/online/?IsisScript=iah/iah.xis&base=BDENF&lang=i&form=F. Africa: http://indexmedicus.afro.who.int/ Australia: http://www.quit.org.au/resources/default.aspx We explored the Living Standards Measurement Study (or LSMS, available from http://www.worldbank.org/lsms) for tobacco use but the statistical data processing was beyond the possibilities of this review.
STUDY SELECTION AND PROCESSING
All phases of the study selection and processing were done using EROS® (Early Review Organizing Software, IECS, Buenos Aires) a web-based platform designed for the process of systematic review.
Two independent researchers per citation pre-screened all search strategy results (titles and abstracts) to identify studies that could be included or that could be useful as background. They categorized the articles in five different categories: high probability of inclusion (HPI), low or moderate probability of inclusion (LMPI) and excluded (E), Reviews (REV) and related references (REF).
Disagreements were solved by consensus and the review team made the final decision in case of continued discrepancies.
We obtained the full text of all articles included.
18
Two independent researchers assessed the full text of selected articles to confirm the classification and to evaluate whether they met the inclusion criteria or not. Any discrepancies were solved by consensus, and the review team made the final decision in case of continued discrepancies. If data of the included studies was unclear or insufficient, we tried to contact the author. In the query was not solved, the study was excluded.
Studies identified as HPI that finally met inclusion criteria are detailed in Tables 1 to 6 in Annex 1.
Data Collection
To collect the information detailed above we used a web-based spreadsheet. One reviewer extracted data from included studies, and a second one checked it. We included the following information:
ID Continent/Country Year of publication Citation Gender (% males) Type of outcome definition: tobacco use Author e-mail Total population (% of smokers) Population by income level strata (% of smokers) Dataset start and end date (mm/yyyy) OR Current smoker (95% CI) OR Current smoker converting the high income strata as the reference (OR=1) β Coefficient and standard error Definition of tobacco use Monetary unit/annual family income/household income Number of cigarettes per day (mean ± SD) Adjusting variables Age category (< 15 years old, adults, 15–44 years-old, 45–64 years-old, more than 65) Age (limits by protocol, median, mean, range) Study design Setting (rural, urban) Special population (pregnant, workers) Sampling (probabilistic or not) Education (high>50% ≥high school, medium 30–50%, low <20%) Ethnic and religions
Study design and quality of study (See Annex 2.1 Algorithm):
Observational studies* Prospective comparative cohort studies
19
Retrospective comparative cohort studies Prospective case-control studies Retrospective case-control studies Before-after studies Interrupted time series Case series studies – studies presenting series of patients without a control group Cross-sectional studies
*Baseline and control arm-of-intervention studies (intervention assigned by researchers) were also accepted but assessed its observational component.
Randomized trial Quasi-randomized trial – a trial applying a pseudo random allocation mechanism, like day of birth Historically controlled trials – pre-planned studies where data on controls are retrieved from archives Trials with concurrent controls – pre-planned studies where data on controls are sampled concurrently, (for example, in-patients who refuse to be randomized or in-patients from another department) Controlled before-after studies (quasi-experimental)
Methodological quality assessment
Methodological quality was evaluated using the checklist from the STROBE (Strengthening the Reporting of Observational Studies in Epidemiology) statement.13 We also considered the Cochrane Handbook for Systematic Reviews of Intervention,14 the Cochrane Effective Practice and Organization of Care Review Group data collection checklist quality criteria, and two methodological papers (Sanderson et al.15 and Fowkes and Fulton16).
We elaborated an algorithm to estimate a summary risk of bias for observational studies considering four criteria (methods for selecting study participants, methods for measuring exposure and outcome variables, methods to control confounding, and comparability among groups) and two minor criteria (statistical methods excluding confounding and conflict of interest). Pairs of independent reviewers assessed the methodological quality. Discrepancies were solved by consensus of the whole team. Additional information on the tool used and a detailed methodological assessment for each article included can be found in the Annex 2.2.
STATISTICAL ANALYSIS
We performed two analyses. Studies reporting only prevalence data were only described. For studies yielding a Peto’s Odds Ratio (OR) as a summary measure, a random effects meta-analysis was performed to obtain summary OR based on adjusted OR and confidence intervals, or equivalent data as coefficients (β) and standard errors (SE), as presented. Only studies reporting ORs adjusted at least by age and sex were eligible for inclusion. We used Stata 11.0® (StataCorpLP, College Station, Texas).
20
We used the DerSimonian-Laird random effect model considering important differences in design, exposure, comparison groups, participants, and outcome measurement as possible sources of heterogeneity.17 Statistical heterogeneity was evaluated using the I2 statistic and we performed subgroup analysis to evaluate potential heterogeneity.
As statistical heterogeneity was expected to be higher than 50%, the following potential groups were prespecified for subgroup analysis:18
• Decade of dataset: < 1989, from 1990 to 1999, and 2000 to 2009. • WHO region: African Region (AFRO), Region of the Americas (PAHO) , Eastern Mediterranean
Region (EMRO), European Region (EURO) , South-East Asia Region (SEARO) , and Western Pacific Region (WPRO).
• Continent: Europe, Asia, South America, North America, Oceania, and Africa. • Mortality stratum: A=very low child mortality and very low adult mortality; B=low child
mortality and low adult mortality; C=low child mortality and high adult mortality; D=high child mortality and high adult mortality; E=high child mortality and very high adult mortality.19
• Risk of bias: low, medium, and high. • Gender: male and female. • Age group: younger than 15 years old, adults, and adult subgroups between 45 and 64 years,
and higher than 65 years.
The random effect model was chosen in advance to report the outcomes due to heterogeneity of studies (time, designs, participants, countries, settings, cultures, etc). Considering the wider interval confidence obtained with this method, it is the most conservative approach to deal with heterogeneity – predicted and found.
RESULTS
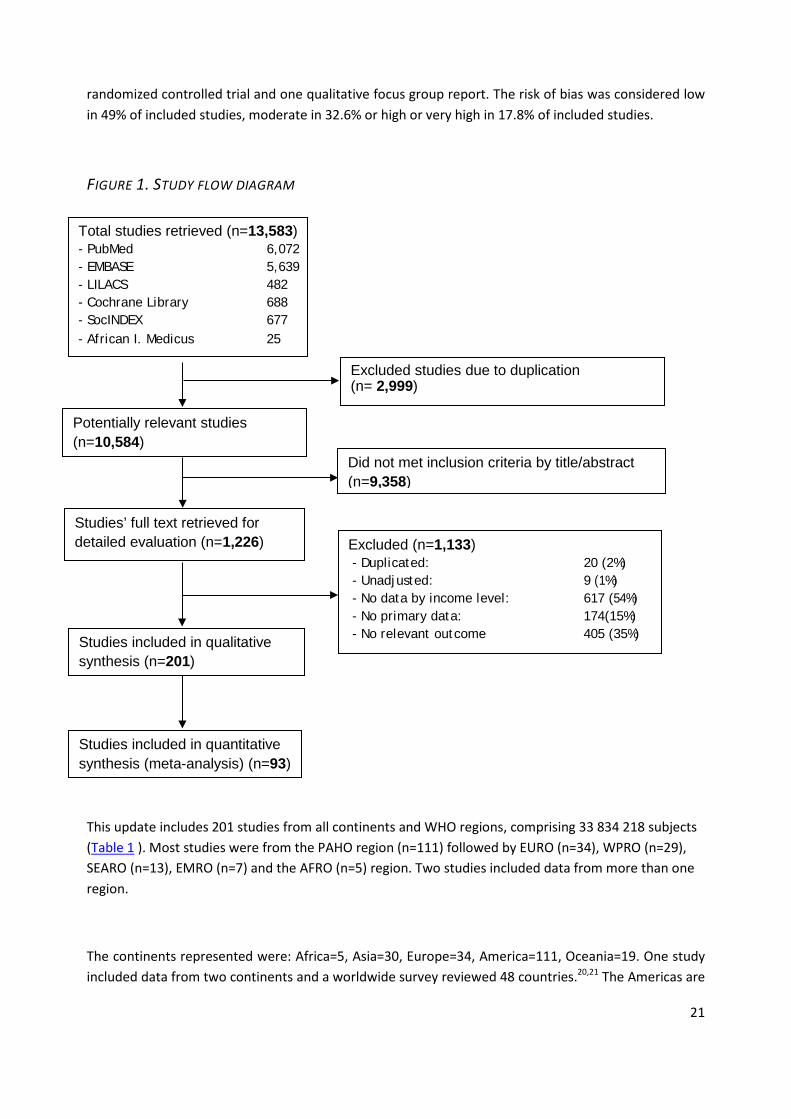
Two searches takeoff studies published from July 2008 to April 2013 retrieved 13 583 references. Figure 1 describes the study flow diagram. After eliminating duplicates and screening, the full texts of 1226 studies were retrieved for detailed evaluation. From the selected articles assessed by full text we finally included 201 that met the inclusion criteria (Table 1).
METHODOLOGICAL QUALITY
Quality assessment of included studies was done using a summary and individual component risk of bias: selection study participants, measurement of exposure and outcomes, control confounding, design-specific sources of bias, and statistical methods (excluding control of confounding). (Table 2 Risk of bias of included studies)
Out of 201 studies, 173 were cross-sectional (85%), 14 surveillance reports (6.9%), 6 prospective studies (2.9%), three retrospective cohorts (1.4%), three case-control studies (1.4%), one community-based
21
randomized controlled trial and one qualitative focus group report. The risk of bias was considered low in 49% of included studies, moderate in 32.6% or high or very high in 17.8% of included studies.
FIGURE 1. STUDY FLOW DIAGRAM
This update includes 201 studies from all continents and WHO regions, comprising 33 834 218 subjects (Table 1 ). Most studies were from the PAHO region (n=111) followed by EURO (n=34), WPRO (n=29), SEARO (n=13), EMRO (n=7) and the AFRO (n=5) region. Two studies included data from more than one region.
The continents represented were: Africa=5, Asia=30, Europe=34, America=111, Oceania=19. One study included data from two continents and a worldwide survey reviewed 48 countries.20,21 The Americas are
Potentially relevant studies (n=10,584)
Did not met inclusion criteria by title/abstract (n=9,358)
Studies’ full text retrieved for detailed evaluation (n=1,226)
Excluded (n=1,133) - Duplicated: 20 (2%) - Unadjusted: 9 (1%) - No data by income level: 617 (54%) - No primary data: 174(15%) - No relevant outcome 405 (35%)
Studies included in qualitative synthesis (n=201)
Excluded studies due to duplication (n= 2,999)
Studies included in quantitative synthesis (meta-analysis) (n=93)
Total studies retrieved (n=13,583) - PubMed 6,072 - EMBASE 5,639 - LILACS 482 - Cochrane Library 688 - SocINDEX 677 - African I. Medicus 25
22
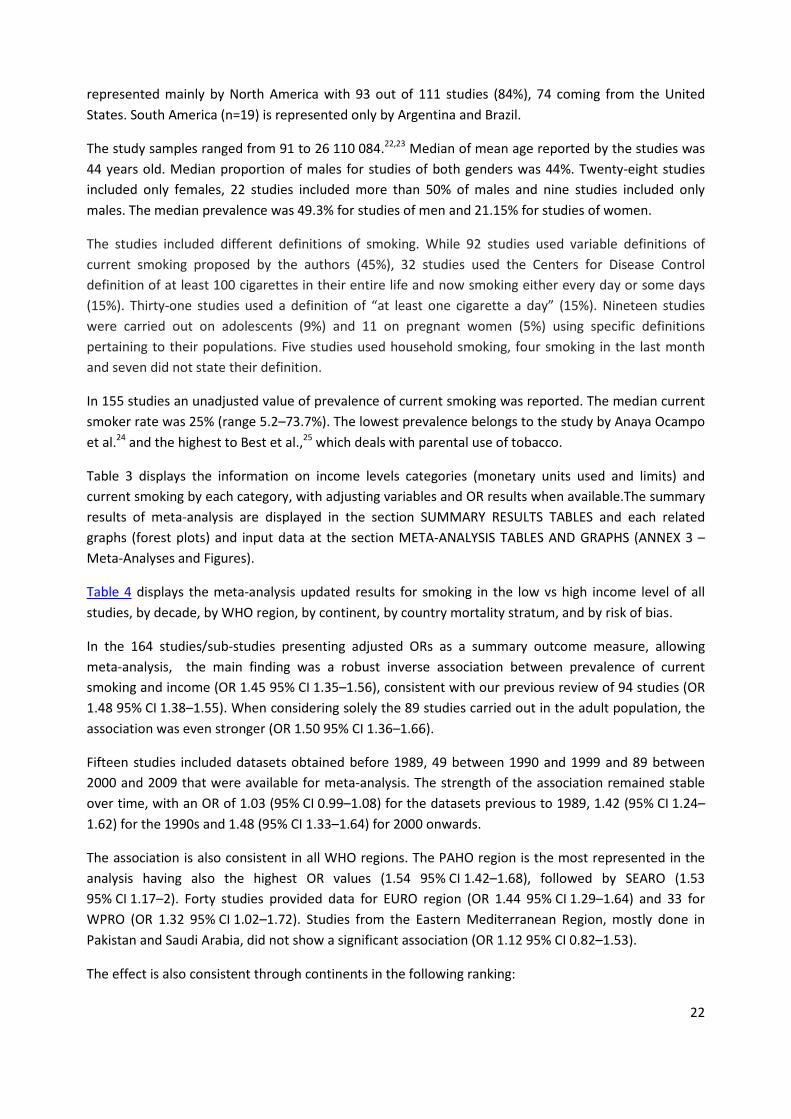
represented mainly by North America with 93 out of 111 studies (84%), 74 coming from the United States. South America (n=19) is represented only by Argentina and Brazil.
The study samples ranged from 91 to 26 110 084.22,23 Median of mean age reported by the studies was 44 years old. Median proportion of males for studies of both genders was 44%. Twenty-eight studies included only females, 22 studies included more than 50% of males and nine studies included only males. The median prevalence was 49.3% for studies of men and 21.15% for studies of women.
The studies included different definitions of smoking. While 92 studies used variable definitions of current smoking proposed by the authors (45%), 32 studies used the Centers for Disease Control definition of at least 100 cigarettes in their entire life and now smoking either every day or some days (15%). Thirty-one studies used a definition of “at least one cigarette a day” (15%). Nineteen studies were carried out on adolescents (9%) and 11 on pregnant women (5%) using specific definitions pertaining to their populations. Five studies used household smoking, four smoking in the last month and seven did not state their definition.
In 155 studies an unadjusted value of prevalence of current smoking was reported. The median current smoker rate was 25% (range 5.2–73.7%). The lowest prevalence belongs to the study by Anaya Ocampo et al.24 and the highest to Best et al.,25 which deals with parental use of tobacco.
Table 3 displays the information on income levels categories (monetary units used and limits) and current smoking by each category, with adjusting variables and OR results when available.The summary results of meta-analysis are displayed in the section SUMMARY RESULTS TABLES and each related graphs (forest plots) and input data at the section META-ANALYSIS TABLES AND GRAPHS (ANNEX 3 – Meta-Analyses and Figures).
Table 4 displays the meta-analysis updated results for smoking in the low vs high income level of all studies, by decade, by WHO region, by continent, by country mortality stratum, and by risk of bias.
In the 164 studies/sub-studies presenting adjusted ORs as a summary outcome measure, allowing meta-analysis, the main finding was a robust inverse association between prevalence of current smoking and income (OR 1.45 95% CI 1.35–1.56), consistent with our previous review of 94 studies (OR 1.48 95% CI 1.38–1.55). When considering solely the 89 studies carried out in the adult population, the association was even stronger (OR 1.50 95% CI 1.36–1.66).
Fifteen studies included datasets obtained before 1989, 49 between 1990 and 1999 and 89 between 2000 and 2009 that were available for meta-analysis. The strength of the association remained stable over time, with an OR of 1.03 (95% CI 0.99–1.08) for the datasets previous to 1989, 1.42 (95% CI 1.24–1.62) for the 1990s and 1.48 (95% CI 1.33–1.64) for 2000 onwards.
The association is also consistent in all WHO regions. The PAHO region is the most represented in the analysis having also the highest OR values (1.54 95% CI 1.42–1.68), followed by SEARO (1.53 95% CI 1.17–2). Forty studies provided data for EURO region (OR 1.44 95% CI 1.29–1.64) and 33 for WPRO (OR 1.32 95% CI 1.02–1.72). Studies from the Eastern Mediterranean Region, mostly done in Pakistan and Saudi Arabia, did not show a significant association (OR 1.12 95% CI 0.82–1.53).
The effect is also consistent through continents in the following ranking:
23
1. South America 1.63 (95% CI 1.37–1.94)
2. North America 1.53 (95% CI 1.39–1.69)
3. Europe 1.45 (95% CI 1.29–1.63)
4. Asia 1.39 (95% CI 1.20–1.62)
5. Oceania 1.28 (95% CI 0.93–1.75)
6. Africa 1.28 (95% CI 1–1.64)
For the analysis of the association by country mortaliy, countries belonging to the Strata A and B were considered the low mortality group and those in Strata C, D and E were the high mortality group. In the low mortality countries the low income strata had a higher risk of smoking – compared with the high income level group (OR 1.48 95% CI 1.37–1.60). In the high mortality countries, the low income level also had a higher risk of smoking although the association was not as strong (OR 1.28 95% CI 1.09–1.50).
We performed an analysis of the association dividing the studies according to the risk of bias obtained from the critical evaluation. Studies considered most reliable yielded the strongest values (n=71, OR 1.64 95% CI 1.42–1.80).
All the associations yielded stronger ORs when considering the subset of studies in adults (Table 5).
Sixty-seven studies presented data that allowed comparisons for at least three income categories (Table 8). In this case, we found a clear gradient of smoking prevalence between the low, medium and high strata (low vs high OR 1.69 95% CI 1.49–1.92, medium vs high OR 1.31 95% CI 1.20–1.43).
Fifty-five studies included evaluable datasets for females, and 44 for males (Table 9). Our results show a consistent higher prevalence in poorest smokers for both genders, with a stronger association for women (OR 1.59 95% CI 1.30–1.93) than for men (OR 1.38 95% CI 1.27–1.49).
Datasets of women that included an intermediate income category showed a strong association of smoking prevalence and low SES (OR 1.82 95% CI 1.39–2.38), compared with the highest income category (
Table 10). This evidence highlights women as the most susceptible population for the effects of poverty on smoking. We found a clear gradient of prevalence for datasets of men within three or more income categories (low vs. high OR 1.56 95% CI 1.42–1.71, medium vs. high OR 1.22 95% CI 1.14–1.31).
Several studies allowed for comparisons among age categories (Table 11). As previously mentioned, the association between SES and smoking was strongest in the studies carried out in adults (OR 1.50 95% CI 1.36–1.66). The studies that included an intermediate income category (n=38) suggest the existence of a gradient (OR low vs high category 1.73 95% CI 1.45–2.05, OR middle vs high category 1.32 95% CI 1.37–1.49) (Table 12).
Age subgroups analysis showed a strong association for studies including subjects from 45 to 65 years old (OR 1.73 95% CI 1.58–1.59). The effect was even more marked for the small subset of
24
studies/substudies (n=4) of elderly subjects (OR 1.90 95% C2I 1.2–2.96), although the wide confidence intervals limit the accuracy of the estimation. Twelve studies included population younger than 15 years exclusively: in this subgroup no clear association was found, albeit the wide confidence intervals leave some uncertainty (OR 0.99 95% CI 0.73–1.35).
Table 15 shows the OR of smoking comparing low vs high income level by decade of dataset and mortality level of the countries. For low mortality countries the association is clear both for studies performed in the 1990s (OR 1.49 95% CI 1.30–1.72) and for more recent ones (OR 1.49 95% CI 1.33–1.67). For high mortality countries the effect becomes clearer over time (OR 1.04 95% CI 0.79–1.35 for 1990s, OR 1.43 95% CI 1.17–1.74 for 2000–2009).
Data from low mortality countries showed a stronger association between smoking and poverty for women than for males (OR 1.66 95% CI 1.34–2.06 and 1.39 95% CI 1.27–1.51, respectively). Forty seven datasets were available for this analysis that suggests a specific subgroup inequality. Less information was available for high mortality countries, without a clear-cut difference between genders (Table 11).
To explore the smoking status definition as a source of heterogeneity we performed subgroup analysis by smoking status: low vs high (Table 13) and low and medium vs high (Table 14).
25
DISCUSSION
This study updates a previous review and summarizes a body of literature on the association between tobacco consumption and income level. Our main finding was a robust association between higher prevalence of current smoking and lower income levels. The low-income level group had an odds ratio of smoking of 1.45 (95% CI 1.35–1.55) compared to the high-income level group. This finding was consistent for most geographical regions, in adults and both males and females, although the association was stronger among women. A gradient of smoking prevalence across income strata was also identified, and was especially evident for adults and in countries with low global mortality according to the WHO classification.19
This analysis includes studies spanning three decades and shows a stable trend in the link between tobacco and poverty, allowing us to be confident in the direction of the association. Most of the datasets included in this review came from low mortality countries, which were the first studied and had the strongest association. As more data were published for high mortality countries the association also became evident for them. These findings suggest that inequality within societies might play a stronger role than material deprivation by itself.9 Poorer groups in unequal societies may feel more deprived and overwhelmed by social demands than their counterparts in more egalitarian societies.
The effect was strong for most of areas of the world. Most of the studies included in the review came from the Americas (OR 1.54 95% IC 1.42–68) and EURO region (OR 1.45 95% CI 1.29–1.63). South America presents the highest association (OR 1.63 95% CI 1.97–1.94). Even though the summary of studies for Oceania did not show a significant association, when we aggregated all the studies from the Western Pacific Region, the OR was 1.32 (95% CI 1.02–1.94). In the EMRO region the association was not statistically significant (OR 1.12 95% CI 0.82–1.53), but data were limited to a few studies from Pakistan and Saudi Arabia. However, more research is needed, considering that countries from this region have high poverty rates, intermediate to high male smoking prevalence and tobacco related illnesses.26 Lack of data also prevents any solid conclusions about the AFRO region.
Explanations behind the association between tobacco and poverty are complex and require a comprehensive analysis. Our results are in line with the four-stage model that states that high income countries were the first to incorporate tobacco use and also the first to decrease prevalence as they incorporated innovation and became aware of health risks.11 These societies are also more demanding in the standards of quality of life and general health. Conversely, individuals in deprived societies may be more concerned with basic needs instead.
High-income countries have achieved greater declines in smoking prevalence than low- and middle-income countries (LMIC), probably due to their ability to implement tobacco control policies. In developed countries, high prices are often used as a financial disincentive to smoke, whereas in poorer countries tobacco still remains widely accessible.27 This strategy has been shown to reduce tobacco consumption and improve the health of the whole population.28 However, its impact could differ across income level strata.
Smoking was initially glamorized by tobacco marketing as an activity for the rich and successful. However, disadvantaged groups may be more susceptible to this strategy. As advertisement restrictions became more common in developed countries, tobacco companies have turned their attention to less
26
developed regions of the world.29 The WHO Framework Convention on Tobacco Control provides important and effective recommendations for tobacco control such as taxes and price regulation, packaging and labeling, advertising, promotion and sponsorship and illicit trade of tobacco products among others. (http://www.who.int/fctc/en/). Higher tobacco consumption in low SES groups may be explained by several related issues, such as that they may be less likely to delay smoking initiation, have less resources to quit available, and face more difficulties to quit successfully.30,31
Studies of adults and elderly subjects showed a clear association, while studies of adolescents did not. Previous reports suggest that adolescents from families with lower SES, including those living in single-parent homes, are at increased risk of smoking initiation. However, the association between poverty and tobacco among adolescents, estimated with information from 12 datasets included, did not reveal values comparable to adults (OR 0.99 95% CI 0.73–1.35).32 The behavior of adolescents and adults varies widely with regard to their methods for obtaining cigarettes, stages of addiction, and differential access according to income.
Our findings signal women as an especially vulnerable group with regard to the effect of poverty on smoking. This effect was found in the analysis of multiple strata and in low mortality countries. According to the four-stages model, compared to men, women take up tobacco consumption later and do not reach as high a prevalence.11,33 Decreases in the smoking prevalence of women from high income countries could be driven by the high SES group.26,12 Tobacco companies have been using marketing strategies aimed at low SES females for several decades, incuding price discounts at the point of sale that target cheaper brands and promote luxury images.34 Other factors such as low-income jobs, single parent status, low levels of education, lack of social support, responsibilities at work and family, violence, and increased household smoking exposure could promote smoking among the poorest women in inegalitarian societies.33,35
Several features of our work reinforce its validity. The results of this updated meta-analysis are consistent with our previous review, and new data added confirm the magnitude of the association. In line with our findings, a recent study by Hosseinpoor and colleagues, which included a large population from 48 low and middle income countries in the World Health Survey, showed that smoking distribution differed by countries and socioeconomic groups in a fashion similar to our meta-analysis.21 A potential bias of our study could be that most studies came from developed, low mortality areas. However, the subgroup analysis of datasets from developing countries reinforces the validity of our results.
Additional strengths of our study include a comprehensive literature search using multiple databases and the use of strict criteria for quality assessment of the papers. To explore the possibility that studies reporting lower ORs are under-published (publication bias) we presented a funnel plot (Figure 3) that showed no evidence of asymmetries, virtually excluding the possibility of publication bias. Moreover, results for the subset of studies with the lowest risk of bias yielded the strongest values of association (OR 1.32 95% CI 1.25–1.40). We performed our analysis following a preplanned strategy, including subgroup analysis and the use of random-effects model anticipating high levels of heterogeneity that finally appeared.24
Regarding outcomes, studies included different definitions of current smoking, most of them compatible with daily smoking. Smoking prevalence may vary according to the definitions used and
27
different populations.36 Widely accepted definitions of current smoking include “having smoked at least 100 cigarettes in their lifetime and smoking some or all days” and “smoking during the last month,” which is associated with higher prevalence but underestimates daily smokers, especially in young adults. Reviewed papers also included some other definitions, which overlap and give good approximations for daily smoking. However, for specific comparisons between strata, these considerations are secondary as the authors used the same criterion for all groups. To explore the smoking status definition as a source of heterogeneity we performed subgroup analysis by smoking status (Table 13, Table 14, Figure 30, Figure 31, Figure 32, Figure 33, Figure 34).
For the exposure variable, we used direct income measures as indicators of living standards. This variable was measured by level categories (low, middle and high or at least low and high) from different income-related variables (i.e. total household income, minimum salary, more complex index that included income in their measurements, among others). Definitions varied between authors, so the strata of income levels must be interpreted more as an income gradient than precise delimited categories. We also considered "line of poverty" as a direct measure of poverty as it reflects the income needed to buy a basket with goods and services considered essential to live. Income may behave as a limited indicator because of measurement challenges and fluctuation over time that do not correlate with living standards.37 However, consumption data may be more susceptible to measurement error, while asset and housing data are not.38 Montgomery and colleagues 39 found little evidence that the use of asset indices to proxy for consumption results in biased coefficient estimates on other variables of interest.
In conclusion, we present the results of an exhaustive and methodologically rigorous systematic review that includes data from varied sources to minimize publication bias. The results confirmed and quantified an inverse relationship between income level and smoking prevalence in a wide variety of populations and settings. The analysis presents a solid basis to support an inverse relationship between income level and tobacco use prevalence and its related consequences. These results reinforce the evidence that tobacco inflicts a greater harm among disadvantaged groups. Policies and interventions focusing on smoking prevention and cessation among the poor are an important component of national and international efforts to improve the health and well-being of less affluent populations.
IMPLICATIONS FOR PRACTICE
Greater efforts to reduce tobacco use among the poor are clearly needed. Tobacco consumption may vary due to inequality more than poverty itself, and should be proactively controlled. The presence of vulnerable and disadvantaged groups poses a challenge for policy-makers and healthcare workers. Our findings may be useful to establish priorities in policies to control the tobacco use. Efforts to help low SES groups to quit will have a long-term effect on quality of life and life expectancy and an immediate effect on their household expenditures – thereby improving their availability of resources.
IMPLICATIONS FOR RESEARCH
Migration of the smoking epidemic is expected to continue in the future and the association between tobacco and poverty should be repeatedly assessed, as effects of the policies suggested by the WHO FCTC are likely to modify the situation. Future studies that indirectly assess SES (i.e. proxies as education level, employment), which represent a great amount of evidence, could help to better understand the problem. Standardization of designs and criteria for definitions should be agreed upon
28
in order to diminish heterogeneity of studies. Fields open to further research include areas of the globe with scarce data and the effect of poverty on tobacco consumption among certain understudied subgroups, such as women, adolescents and pregnant women.
Potential conflict of interests
None.
REFERENCES 1. WHO Global report on mortality attributable to tobacco. Geneva: World Health Organization; 2012
(http://www.who.int/tobacco/publications/surveillance/rep_mortality_attributable/en, accessed 27 July 2014). 2. Global health risks: mortality and burden of disease attributable to selected major risks. Geneva: World Health
Organization; 2009 (http://www.who.int/healthinfo/global_burden_disease/GlobalHealthRisks_report_full.pdf?ua=1, accessed 27 July 2014).
3. Mathers CD, Loncar D. Projections of global mortality and burden of disease from 2002 to 2030. PLoS Med. 2006;3(11):e442 (http://www.plosmedicine.org/article/info%3Adoi%2F10.1371%2Fjournal.pmed.0030442, accessed 27 July 2014).
4. Lopez AD, Collishaw NE, Piha T. A descriptive model of the cigarette epidemic in developed countries. Tob Control. 1994;3(3):242–7 (http://tobaccocontrol.bmj.com/content/3/3/242.citation, accessed 27 July 2014).
5. Shafey O, Dolwick S, Guindon GE,editors. Tobacco control country profiles, 2nd edition. Atlanta (GA): American Cancer Society; 2003 (http://www.who.int/tobacco/global_data/country_profiles/en/Introduction.pdf, accessed 3 July 2014).
6. Thun M, Peto R, Boreham J, Lopez AD. Stages of the cigarette epidemic on entering its second century. Tob Control. 2012;21(2):96–101 (http://tobaccocontrol.bmj.com/content/21/2/96.full.pdf+html, accessed 31 July 2014).
7. Pampel FC. National income, inequality and global patterns of cigarette use. Social Forces. 2007;86(2):445–66 (http://www.ncbi.nlm.nih.gov/pmc/articles/PMC3161404/, accessed 31 July 2014).
8. Pampel FC, Rogers RG. Socioeconomic status, smoking, and health: a test of competing theories of cumulative advantage. J Health Soc Behav. 2004;45(3):306–21.
9. Pampel FC. Inequality, diffusion, and the status gradient in smoking. Social Problems. 2002;49(1):35–57 (http://www.jstor.org/discover/10.1525/sp.2002.49.1.35?uid=3738016&uid=2129&uid=2&uid=70&uid=4&sid=21104515393057, accessed 13 August 2014 [subscription required]).
10. Blakely T, Hales S, Kieft C, Wilson N, Woodward A. The global distribution of risk factors by poverty level. Bull World Health Organ. 2005;83(2):118–26 (http://www.who.int/bulletin/volumes/83/2/118.pdf, accessed 31 July 2014).
11. Lopez AD, Collishaw NE, Piha T. A descriptive model of the cigarette epidemic in developed countries. Tob Control. 1994;3:242–7 (http://tobaccocontrol.bmj.com/content/3/3/242.full.pdf+html, accessed 31 July 2014).
12. Ciapponi A, project leader. Systematic review of the link between tobacco and poverty. Geneva: World Health Organization; 2011 (http://whqlibdoc.who.int/publications/2011/9789241500548_eng.pdf, accessed 31 July 2014).
13. Stroup DF, Berlin JA, Morton SC, Olkin I, Williamson GD, Rennie D et al. Meta-analysis of observational studies in epidemiology: a proposal for reporting. Meta-analysis Of Observational Studies in Epidemiology (MOOSE) group. JAMA. 2000;283(15):2008–12 (http://jama.jamanetwork.com/article.aspx?articleid=192614, accessed 13 August 2014 [subscription required]).
14. Higgins JPT, Green S, editors. Cochrane handbook for systematic reviews of interventions version 5.1.0 The Cochrane Collaboration; 2011 (http://handbook.cochrane.org/, accessed 31 July 2014).
15. Sanderson S, Tatt IP, Higgins JPT. Tools for assessing quality and susceptibility to bias in observational studies in epidemiology: a systematic review and annotated bibliography. Int J Epidemiol. 2007;36(3):666–76 (http://ije.oxfordjournals.org/content/36/3/666.full, accessed 31 July 2014).
16. Fowkes FGR, Fulton PM. Critical appraisal of published research: introductory guidelines. BMJ. 1991;302:1136–40 (http://www.epicentro.iss.it/biblio/pdf/critical.pdf, accessed 31 July 2014).
17. DerSimonian R, Laird N. Meta-analysis in clinical trials. Control Clin Trials. 1986;7(3):177–88 (http://psych.colorado.edu/~willcutt/pdfs/DerSimonian_1986.pdf, accessed 31 July 2014).
18. Higgins JPT, Thompson SG, Deeks JJ, Altman DG. Measuring inconsistency in meta-analysis. BMJ. 2003;327:557–60 (http://www.bmj.com/content/327/7414/557.full.pdf+html, accessed 31 July 2014).
19. The world health report 2003: shaping the future. Geneva: World Health Organization; 2003 (http://www.who.int/whr/2003/en/, accessed 31 July 2014).
29
20. Martire KA, Mattick RP, Doran CM, Hall WD. Cigarette tax and public health: what are the implications of financially stressed smokers for the effects of price increases on smoking prevalence? Addiction. 2011;106(3):622–30 (http://onlinelibrary.wiley.com/doi/10.1111/j.1360-0443.2010.03174.x/full, accessed 13 August 2014 [subscription required]).
21. Hosseinpoor AR, Parker LA, Tursan d'Espaignet E, Chatterji S. Social determinants of smoking in low- and middle-income countries: results from the World Health Survey. PLoS One. 2011;6(5):e20331 (http://www.plosone.org/article/info%3Adoi%2F10.1371%2Fjournal.pone.0020331, accessed 1 August 2014).
22. Sandin GR, Dacoregio T, Sakae TM. Estudo comparativo entre tabagistas e não tabagistas em município no Sul de Santa Catarina. Rev Bras Clin Med. Sao Paulo. 2010;8(5):382–5 (in Portuguese) (http://files.bvs.br/upload/S/1679-1010/2010/v8n5/003.pdf, accessed 1 August 2014).
23. Vázquez-Segovia LA, Sesma-Vázquez S, Hernández-Avila M. El consumo de tabaco en los hogares en México: resultados de la Encuesta de Ingresos y Gastos de los Hogares, 1984-2000. Salud publica Mex. 2002;44 Suppl 1:s76–81 (in Spanish) (http://www.scielosp.org/scielo.php?pid=S0036-36342002000700012&script=sci_arttext, accessed 1 August 2014).
24. Anaya-Ocampo R, Arillo-Santillán E, Sanchez-Zamorano LM, Lazcano-Ponce E. Bajo desempeño escolar relacionado con la persistencia del tabaquismo en una cohorte de estudiantes en México. Salud Publica Mex. 2006;48(supl.1):s17–29 (in Spanish) (http://www.medigraphic.com/pdfs/salpubmex/sal-2006/sals061d.pdf, accessed 1 August 2014).
25. Best CM, Sun K, de Pee S, Sari M, Bloem MW, Semba RD. Paternal smoking and increased risk of child malnutrition among families in rural Indonesia. Tob Control. 2008;17(1):38–45 (http://tobaccocontrol.bmj.com/content/17/1/38.long, accessed 13 August 2014 [subscription required]).
26. Mackay JL, Eriksen MP, Ross H. The tobacco atlas. 4th edition. Atlanta (GA): World Lung Foundation; 2012 (http://www.tobaccoatlas.org/uploads/Images/PDFs/Tobacco_Atlas_2ndPrint.pdf, accessed 1 August 2014).
27. Shafey O, Eriksen M, Ross H, Mackay J. The tobacco atlas. 3rd edition. Atlanta (GA): American Cancer Society; 2009 ISBN: 978-1-604-43013-4
28. Fayter D, Main C, Misso K, Ogilvie D, Pettigrew M, Sowden A et al. Population tobacco control interventions and their effects on social inequalities in smoking. York: University of York; 2008. (http://www.york.ac.uk/inst/crd/CRD_Reports/crdreport39.pdf, accessed 2 August 2014).
29. Doku D. The tobacco industry tactics–a challenge for tobacco control in low and middle income countries. Afr Health Sci. 2010;10(2):201–3 (http://www.ncbi.nlm.nih.gov/pmc/articles/PMC2956281/, accessed 1 August 2014).
30. Rodgers A, Corbett T, Bramley D, Riddell T, Wills M, Lin RB et al. Do u smoke after txt? Results of a randomised trial of smoking cessation using mobile phone text messaging. Tob Control. 2005;14(4):255–61 (http://tobaccocontrol.bmj.com/content/14/4/255.long, accessed 1 August 2014).
31. Volpp KG, Gurmankin Levy A, Asch DA, Berlin JA, Murphy JJ, Gomez A et al. A randomized controlled trial of financial incentives for smoking cessation. Cancer Epidemiol Biomarkers Prev. 2006;15(1):12–8 (http://cebp.aacrjournals.org/content/15/1/12.long, accessed 13 August 2014).
32. U.S. Department of Health and Human Services. Preventing tobacco use among young people: a report of the Surgeon General. Atlanta (GA): Public Health Service, Centers for Disease Control and Prevention, National Center for Chronic Disease Prevention and Health Promotion, Office on Smoking and Health;1994 (https://ia601704.us.archive.org/26/items/preventingtobacc00offi/preventingtobacc00offi.pdf, accessed 1 August 2014).
33. Greaves L, Barr VJ. Filtered policy: women and tobacco in Canada. Vancouver (BC): Centre of Excellence for Women's Health; 2000 (http://www.cwhn.ca/node/41557, accessed August 2014).
34. Brown-Johnson CG, England LJ, Glantz SA, Ling PM. Tobacco industry marketing to low socioeconomic status women in the USA. Tob Control. January 21, 2014 (http://tobaccocontrol.bmj.com/content/early/2014/01/21/tobaccocontrol-2013-051224.full.pdf+html?sid=89660282-11ea-48df-a24b-1b33d5792781, accessed 13 August 2014 [subscription required]).
35. Tehranifar P, Liao Y, Ferris J, Terry M. Life course socioeconomic conditions, passive tobacco exposures and cigarette smoking in a multiethnic birth cohort of U.S. women. Cancer Causes Control. 2009;20(6):867–76 (http://www.ncbi.nlm.nih.gov/pmc/articles/PMC3704144/, accessed 13 August 2014).
36. Ryan H, Trosclair A, Gfroerer J. Adult current smoking: differences in definitions and prevalence estimates–NHIS and NSDUH, 2008. J Environ Public Health. 2012;2012:article ID 918368 (http://www.hindawi.com/journals/jeph/2012/918368/, accessed 1 August 2014).
37. O'Donnell O, van Doorslaer E, Wagstaff A, Lindelow M. Analyzing health equity using household survey data: a guide to techniques and their implementation. Washington (DC): The World Bank; 2007 (WBI Learning Resource Series; http://go.worldbank.org/LVSSZJX9O0, accessed 1 August 2014).
38. Onwujekwe O, Hanson K, Fox-Rushby J. Some indicators of socio-economic status may not be reliable and use of indices with these data could worsen equity. J Health Econ. 2006;15(6):639–44 (http://onlinelibrary.wiley.com/doi/10.1002/hec.1071/abstract, accessed 13 August 2014).
39. Montgomery MR, Gragnolati M, Burke K, Paredes E. Measuring living standards with proxy variables. Demography. 2000;37(2):155–74 (http://link.springer.com/article/10.2307%2F2648118#page-1, accessed 1 August 2014).
30
40. Tachfouti N, Berraho M, Elfakir S, Serhier Z, Elrhazi K, Slama K et al. Socioeconomic status and tobacco expenditures among Moroccans: results of the “Maroc Tabagisme” survey. Am J Health Promot. 2010;24(5):334–9 (http://ajhpcontents.org/doi/abs/10.4278/ajhp.080603-QUAN-82, accessed 13 August 2014).
41. Obot IS. The use of tobacco products among Nigerian adults: a general population survey. Drug Alcohol Depend. 1990;26(2):203–8 (http://www.sciencedirect.com/science/article/pii/0376871690901307, accessed 13 August 2014).
42. Mfenyana K, Griffin M, Yogeswaran P, Modell B, Modell M, Chandia J et al. Socio-economic inequalities as a predictor of health in South Africa – the Yenza cross-sectional study. S Afr Med J. 2006;96(4):323–30 (http://blues.sabinet.co.za/WebZ/Authorize?sessionid=0:autho=pubmed:password=pubmed2004&/AdvancedQuery?&format=F&next=images/ejour/m_samj/m_samj_v96_n4_a21.pdf, accessed 13 August 2014).
43. van Walbeek C. Recent trends in smoking prevalence in South Africa – some evidence from AMPS data. S Afr Med J. 2002;92(6):468–72 (http://archive.samj.org.za/2002%20VOL%2092%20Jan-Dec/Articles/06June/1.18%20RECENT%20TRENDS%20IN%20SMOKING%20PREVALENCE%20IN%20SOUTH%20AFRICA%20-%20SOME%20EVIDENCE%20FROM%20AMPS%20DATA.%20Corne%20Va.pdf, accessed 13 August 2014).
44. Vorster HH, Kruger A, Venter CS, Margetts BM, Macintyre UE. Cardiovascular disease risk factors and socio-economic position of Africans in transition: the THUSA study. Cardiovasc J Afr. 2007;18(5):282–9 (http://www.ncbi.nlm.nih.gov/pmc/articles/PMC3975539/, accessed 1 August 2014).
45. Al-Windi A, Majeed BN. Prevalence and predictors of smoking among a healthy working population: epidemiological study among healthy workers in Kurdistan, Iraq (ESHWKI). Journal of Chinese Clinical Medicine. 2010;5(10):585–90 (http://connection.ebscohost.com/c/articles/65048470/prevalence-predictors-smoking-among-healthy-working-population-epidemiological-study-among-healthy-workers-kurdistan-iraq-eshwki, accessed 13 August 2014 [subscription required]).
46. Afifi RA, Nakkash RT, Khawaja M. Social capital, women's autonomy and smoking among married women in low-income urban neighborhoods of Beirut, Lebanon. Womens Health Issues. 2010;20(2):156–67 (http://linkinghub.elsevier.com/retrieve/pii/S1049-3867%2809%2900191-1?showall=true, accessed 13 August 2014 [subscription required]).
47. Alam AY, Iqbal A, Mohamud KB, Laporte RE, Ahmed A, Nishtar S. Investigating socio-economic-demographic determinants of tobacco use in Rawalpindi, Pakistan. BMC Public Health. 2008;8:50 (http://www.biomedcentral.com/content/pdf/1471-2458-8-50.pdf, accessed 2 August 2014).
48. Khuwaja AK, Kadir MM. Smoking among adult males in an urban community of Karachi, Pakistan. Southeast Asian J Trop Med Public Health. 2004;35(4):999–1004. pmid:15916105.
49. Nisar N, Qadri MH, Fatima K, Perveen S. A community based study about knowledge and practices regarding tobacco consumption and passive smoking in Gadap Town, Karachi. J Pak Med Assoc. 2007;57(4):186–8. pmid:17489526.
50. Al-Turki KA, Al-Baghli NA, Al-Ghamdi AJ, El-Zubaier AG, Al-Ghamdi R, Alameer MM. Prevalence of current smoking in Eastern province, Saudi Arabia. East Mediterr Health J. 2010;16(6):671–6. pmid:20799597.
51. Merdad LA, Al-Zahrani MS, Farsi JMA. Smoking habits among Saudi female university students: prevalence, influencing factors and risk awareness. Ann Saudi Med 2007;27(5):366–9 (http://www.annsaudimed.net/index.php/vol27/vol27iss5/387.html?view=abstract, accessed 2 August 2014).
52. Piontek D, Kraus L, Muller S, Pabst A. To what extent do age, period, and cohort patterns account for time trends and social inequalities in smoking? Sucht. 2010;56(5):361–71 (http://www.researchgate.net/publication/229513577_To_What_Extent_Do_Age_Period_and_Cohort_Patterns_Account_for_Time_Trends_and_Social_Inequalities_in_Smoking, accessed 2 August 2014).
53. Shapo L, Gilmore ABC, Coker R, McKee M, Shapo E. Prevalence and determinants of smoking in Tirana city, Albania: a population-based survey. Public Health. 2003;117(4):228–36 (http://opus.bath.ac.uk/6706/, accessed 13 August 2014 [subscription required]).
54. Pomerleau J, Gilmore A, McKee M, Rose R, Haerpfer CW. Determinants of smoking in eight countries of the former Soviet Union: results from the living conditions, lifestyles and health study. Addiction. 2004;99(12):1577–85 (http://onlinelibrary.wiley.com/doi/10.1111/j.1360-0443.2004.00885.x/abstract, accessed 13 August 2014 [subscription required]).
55. Gilmore AB, McKee M, Rose R. Prevalence and determinants of smoking in Belarus: a national household survey, 2000. Eur J Epidemiol. 2001;17(3):245–53. pmid:11680543.
56. Parna K, Rahu K, Rahu M. Patterns of smoking in Estonia. Addiction. 2002;97(7):871–6 (http://onlinelibrary.wiley.com/doi/10.1046/j.1360-0443.2002.00192.x/abstract, accessed 13 August 2014 [subscription required]).
57. Pudule I, Grinberga D, Kadziauskiene K, Abaravicius A, Vaask S, Robertson A et al. Patterns of smoking in the Baltic Republics. J Epidemiol Community Health. 1999;53(5):277–82 (http://jech.bmj.com/content/53/5/277.full.pdf, accessed 4 August 2014).
58. Schaap MM, van Agt HM, Kunst AE. Identification of socioeconomic groups at increased risk for smoking in European countries: looking beyond educational level. Nicotine Tob Res. 2008;10(2):359–69 (http://ntr.oxfordjournals.org/content/10/2/359.long , accessed 4 August 2014 [subscription required]).
59. Halonen JI, Kivimaki M, Pentti J, Kawachi I, Virtanen M, Martikainen P et al. Quantifying neighbourhood socioeconomic effects in clustering of behaviour-related risk factors: a multilevel analysis. PLoS One. 2012;7(3):e32937 (http://discovery.ucl.ac.uk/1354158/1/1354158.pdf, accessed 4 August 2014).
31
60. Laaksonen M, Pattala R, Helasoja V, Uutela A, Lahelma E. Income and health behaviours. Evidence from monitoring surveys among Finnish adults. J Epidemiol Community Health. 2003;57(9):711–7 (http://www.ncbi.nlm.nih.gov/pmc/articles/PMC1732587/pdf/v057p00711.pdf, accessed 4 August 2014).
61. Laaksonen M, Rahkonen O, Karvonen S, Lahelma E. Socioeconomic status and smoking: analysing inequalities with multiple indicators. Eur J Public Health. 2005;15(3):262–9 (http://eurpub.oxfordjournals.org/content/15/3/262.full.pdf+html, accessed 4 August 2014).
62. Paavola M, Vartiainen E, Haukkala A. Smoking from adolescence to adulthood: the effects of parental and own socioeconomic status. Eur J Public Health. 2004;14(4):417–21 (http://eurpub.oxfordjournals.org/content/14/4/417.long, accessed 4 August 2014).
63. Rahkonen O, Laaksonen M, Karvonen S. The contribution of lone parenthood and economic difficulties to smoking. Soc Sci Med. 2005;61(1):211–6 (http://linkinghub.elsevier.com/retrieve/pii/S0277-9536%2804%2900603-3, accessed 13 August 2014 [subscription required]).
64. Virtanen M, Kivimaki M, Kouvonen A, Elovainio M, Linna A, Oksanen A et al. Average household income, crime, and smoking behaviour in a local area: the Finnish 10-Town study. Soc Sci Med. 2007;64(9):1904–13 (http://linkinghub.elsevier.com/retrieve/pii/S0277953607000214, accessed 18 August 2014 [subscription required]).
65. Wikstrom K, Lindstrom J, Tuomilehto J, Saaristo TE, Korpi-Hyovalti E, Oksa H et al. Socio-economic differences in dysglycemia and lifestyle-related risk factors in the Finnish middle-aged population. Eur J Public Health. 2011;21(6):768–74 (http://eurpub.oxfordjournals.org/content/21/6/768.full.pdf+html, accessed 4 August 2014).
66. La Rosa E, Consoli SM, Le Clesiau H, Soufi K, Lagrue G. Souffrance psychosociale et antécédents biographiques traumatiques chez des fumeurs. Enquête auprès de consultants d'un Centre de prévention sanitaire et sociale [Psychosocial distress and stressful life antecedents associated with smoking. A survey of subjects consulting a preventive health center]. in French. Presse Med. 2004;33(14 Pt 1):919–26.
67. Peretti-Watel P, Seror V, Constance J, Beck F. Poverty as a smoking trap. Int J Drug Policy. 2009;20(3):230–6 (http://www.ijdp.org/article/S0955-3959%2808%2900202-8/abstract, accessed 13 August 2014).
68. Stringhini S, Dugravot A, Shipley M, Goldberg M, Zins M, Kivimaki M et al. Health behaviours, socioeconomic status, and mortality: further analyses of the British Whitehall II and the French GAZEL Prospective Cohorts. PLoS Med. 2011;8(2):e1000419 (http://www.plosmedicine.org/article/info%3Adoi%2F10.1371%2Fjournal.pmed.1000419, accessed 4 August 2014).
69. Muller-Riemenschneider F, Nocon M, Willich SN. Prevalence of modifiable cardiovascular risk factors in German adolescents. Eur J Cardiovasc Prev Rehabil. 2010;17(2):204–10 (http://cpr.sagepub.com/content/17/2/204.long, accessed 13 August 2014 [subscription required]).
70. Rathmann W, Haastert B, Giani G, Koenig W, Imhof A, Herdr C et al. Is inflammation a causal chain between low socioeconomic status and type 2 diabetes? Results from the KORA Survey 2000. Eur J Epidemiol. 2006;21(1):55–60 (http://link.springer.com/article/10.1007%2Fs10654-005-5085-6#close, accessed 4 August 2014).
71. Schumann B, Kluttig A, Tiller D, Werdan K, Haerting J, Greiser K. Association of childhood and adult socioeconomic indicators with cardiovascular risk factors and its modification by age: the CARLA Study 2002–2006. BMC Public Health. 2011;11(1):289 (http://www.biomedcentral.com/1471-2458/11/289, accessed 4 August 2014).
72. Leinsalu M, Kaposvari C, Kunst AE. Is income or employment a stronger predictor of smoking than education in economically less developed countries? A cross-sectional study in Hungary. BMC Public Health. 2011;11(1):97 (http://www.biomedcentral.com/1471-2458/11/97, accessed 4 August 2014).
73. Nagelhout GE, de Korte-de Boer D, Kunst AE, van der Meer R, de Vries H, van Gelder BM et al. Trends in socioeconomic inequalities in smoking prevalence, consumption, initiation, and cessation between 2001 and 2008 in the Netherlands. Findings from a national population survey. BMC Public Health. 2012;12(1):303 (http://www.biomedcentral.com/1471-2458/12/303, accessed 4 August 2014).
74. Reijneveld SA. Neighbourhood socioeconomic context and self reported health and smoking: a secondary analysis of data on seven cities. J Epidemiol Community Health. 2002;56(12):935–42 (http://www.ncbi.nlm.nih.gov/pmc/articles/PMC1757003/pdf/v056p00935.pdf, accessed 6 August 2014).
75. Kaleta D, Jegier A. Predictors of inactivity in the working-age population. Int J Occup Med Environ Health. 2007;20(2):175–82 (http://www.degruyter.com/view/j/ijmh.2007.20.issue-2/v10001-007-0019-z/v10001-007-0019-z.xml, accessed 6 August 2014).
76. Woitas-Slubowska D, Hurnik E, Skarpanska-Stejnborn A. Correlates of smoking with socioeconomic status, leisure time physical activity and alcohol consumption among Polish adults from randomly selected regions. Cent Eur J Public Health. 2010;18(4):179–85. pmid:21361098.
77. de Onis M, Villar J. [Tobacco use in Spanish women]. World Health Stat Q. 1991;44(2):80–8. (in French). pmid:9511014.
78. Silvestre García A, Colomer Revuelta C, Nolasco Bonmati A, Gonzalez Saez L, Alvarez-Dardet Díaz C. [The income level and life styles: towards a law of inverse prevention?]. Gac Sanit. 1990;4(20):189–92. (in Spanish). pmid:2286499.
79. Hellqvist L, Rolandsson M, Birkhed D, Hugoson A. Tobacco use in relation to socioeconomic factors and dental care habits among Swedish individuals 15–70 years of age, 1983–2003. Int J Dent Hyg. 2009;7(1):62–70 (http://onlinelibrary.wiley.com/doi/10.1111/j.1601-5037.2008.00339.x/abstract, accessed 13 August 2014 [subscription required]).
32
80. Pudaric S, Sundquist J, Johansson SE. Major risk factors for cardiovascular disease in elderly migrants in Sweden. Ethn Health. 2000;5(2):137–50 (http://www.tandfonline.com/doi/abs/10.1080/713667448?url_ver=Z39.88-2003&rfr_id=ori:rid:crossref.org&rfr_dat=cr_pub%3dpubmed&#.U-JiHaORn9U, accessed 6 August 2014).
81. Fenercioglu AK, Yildirim G, Karatekin G, Goker N. The relationship of gestational smoking with pregnancy complications and sociodemographic characteristics of mothers. J Turk Ger Gynecol Assoc. 2009;10(3):148–51 (http://www.ncbi.nlm.nih.gov/pmc/articles/PMC3939118/, accessed 8 August 2014).
82. Keles I, Onat A, Toprak S, Avci GS, Sansoy V. Family income a strong predictor of coronary heart disease events but not of overall deaths among Turkish adults: a 12-year prospective study. Prev Med. 2003;37(2):171–6 (http://www.sciencedirect.com/science/article/pii/S0091743503001129, accessed 13 August 2014 [subscription required]).
83. Amuzu A, Carson C, Watt HC, Lawlor DA, Ebrahim S. Influence of area and individual lifecourse deprivation on health behaviours: findings from the British Women's Heart and Health Study. Eur J Cardiovasc Prev Rehabil. 2009;16(2):169–73 (http://cpr.sagepub.com/content/16/2/169.long, accessed 13 August 2014 [subscription required]).
84. Diller GP, Inuzuka R, Kempny A, Alonso-Gonzalez R, Liodakis E, Borgia F et al. Detrimental impact of socioeconomic status on exercise capacity in adults with congenital heart disease. Int J Cardiol. 2013;165(1):80–6. doi:10.1016/j.ijcard.2011.07.097.
85. Hiscock R, Bauld L, Amos A, Platt S. Smoking and socioeconomic status in England: the rise of the never smoker and the disadvantaged smoker. J Public Health (Oxf). 2012;34(3):390–6 (http://www.ncbi.nlm.nih.gov/pmc/articles/PMC3425348/, accessed 8 August 2014).
86. Al-Sahab B, Saqib M, Hauser G, Tamim H. Prevalence of smoking during pregnancy and associated risk factors among Canadian women: a national survey. BMC Pregnancy Childbirth. 2010;10(1):24 (http://www.biomedcentral.com/1471-2393/10/24, accessed 8 August 2014).
87. Canadians' smoking behaviour. Results from the National Population Health Survey. Centre for Chronic Disease Prevention and Control. Can Fam Physician. 2000;46:1837–8, 1844–5 (http://www.ncbi.nlm.nih.gov/pmc/articles/PMC2145018/pdf/canfamphys00031-0139.pdf, accessed 8 August 2014).
88. Birch S, Jerrett M, Eyles J. Heterogeneity in the determinants of health and illness: the example of socioeconomic status and smoking. Soc Sci Med. 2000;51(2):307–17 (http://linkinghub.elsevier.com/retrieve/pii/S0277953699004554, accessed 13 August 2014 [subscription required]).
89. Choiniere R, Lafontaine P, Edwards AC. Distribution of cardiovascular disease risk factors by socioeconomic status among Canadian adults. Can Med Assoc J. 2000;162(9):S13–24 (http://www.ncbi.nlm.nih.gov/pmc/articles/PMC1232440/pdf/cmaj_162_9_s13.pdf, accessed 8 August 2014).
90. Joseph KS, Fahey J, Denduriki N, Allen VM, O'Campo P, Dodds L et al. Recent changes in maternal characteristics by socioeconomic status. J Obstet Gynaecol Can. 2009;31(5):422–33 (http://jogc.com/abstracts/full/200905_Obstetrics_2.pdf, accessed 13 August 2014).
91. Lee DS, Chiu M, Manuel DG, Tu K, Wang X, Austin PC et al. Trends in risk factors for cardiovascular disease in Canada: temporal, socio-demographic and geographic factors. Can Med Assoc J. 2009;181(3–4):E55–66 (http://www.ncbi.nlm.nih.gov/pmc/articles/PMC2717674/, accessed 8 August 2014).
92. Lemstra M, Mackenbach J, Neudorf C, Nannapaneni U, Kunst A. Daily smoking in Saskatoon: the independent effect of income and cultural status. Can J Public Health. 2009;100(1):51–4. pmid:19263984.
93. Mao Y, Hu J, Ugnat AM, Semenciw R, Fincham S. Socioeconomic status and lung cancer risk in Canada. Int J Epidemiol. 2001;30(4):809–17 (http://ije.oxfordjournals.org/content/30/4/809.full.pdf+html, accessed 8 August 2014).
94. Millar WJ, Hill G. Pregnancy and smoking. Health Rep. 2004;15(4):53–6 (http://www.statcan.gc.ca/pub/82-003-x/2003004/article/6981-eng.pdf, accessed 8 August 2014).
95. Millar WJ, Locker D. Smoking and oral health status. J Can Dent Assoc. 2007;73(2):155 (http://www.cda-adc.ca/jcda/vol-73/issue-2/155.pdf, accessed 8 August 2014).
96. Pomerleau J, Pederson LL, Ostbye T, Speechley M, Speechley KN. Health behaviours and socio-economic status in Ontario, Canada. Eur J Epidemiol. 1997;13(6):613–22. pmid:9324206.
97. Séguin L, Xu Q, Potvin L, Zunzunegui MV, Frohlich KL. Effects of low income on infant health. Can Med Assoc J. 2003;168(12):1533–8 (http://www.ncbi.nlm.nih.gov/pmc/articles/PMC156683/, accessed 8 August 2014).
98. Wister AV. The effects of socioeconomic status on exercise and smoking: age-related differences. J Aging Health. 1996;8(4):467–88 (http://jah.sagepub.com/content/8/4/467.long, accessed 13 August 2014 [subscription required]).
99. Bird Y, Moraros J, Olsen LK, Forster-Cox S, Staines-Orozco H, Buckingham RW. Smoking practices, risk perception of smoking, and environmental tobacco smoke exposure among 6th-grade students in Ciudad Juárez, Mexico. Nicotine Tob Res. 2007;9(2):195–203 (http://ntr.oxfordjournals.org/content/9/2/195.long, accessed 13 August 2014 [subscription required]).
100. Ritterman ML, Fernald LC, Ozer EJ, Adler NE, Gutierrez JP, Syme SL. Objective and subjective social class gradients for substance use among Mexican adolescents. Soc Sci Med. 2009;68(10):1843–51 (http://linkinghub.elsevier.com/retrieve/pii/S0277-9536%2809%2900144-0, accessed 13 August 2014 [subscription required]).
33
101. Smith KV, Goldman N. Socioeconomic differences in health among older adults in Mexico. Soc Sci Med. 2007;65(7):1372–85 (http://linkinghub.elsevier.com/retrieve/pii/S0277-9536%2807%2900285-7, accessed 13 August 2014 [subscription required]).
102. Mishra SI, Osann K, Luce PH. Prevalence and predictors of smoking behavior among Samoans in three geographical regions. Ethn Dis. 2005;15(2):305–15. pmid:15825978.
103. Abeyta IM, Tuitt NR, Byers TE, Sauaia A. Effect of community affluence on the association between individual socioeconomic status and cardiovascular disease risk factors, Colorado, 2007–2008. Prev Chronic Dis. 2012;9:110305 (http://www.cdc.gov/pcd/issues/2012/11_0305.htm, accessed 9 August 2014).
104. Abma JC, Mott FL. Substance use and prenatal care during pregnancy among young women. Fam Plann Perspect. 1991;23(3):117–22, 128. pmid:1860477.
105. Acevedo-Garcia D, Pan J, Jun HJ, Osypuk TL, Emmons KM. The effect of immigrant generation on smoking. Soc Sci Med. 2005;61(6):1223–42 (http://www.sciencedirect.com/science/article/pii/S0277953605000511, accessed 9 August 2014 [subscription required]).
106. Ahrens D, Bandi P, Ullsvik J, Moberg DP. Who smokes? A demographic analysis of Wisconsin smokers. Wis Med J. 2005;104(4):18–22 (https://www.wisconsinmedicalsociety.org/_WMS/publications/wmj/pdf/104/4/18.pdf, accessed 9 August 2014).
107. Bombard J, Dietz P, Galavotti C, England L, Tong V, Hayes D et al. Chronic diseases and related risk factors among low-income mothers. Matern Child Health J. 2012;16(1):60–71 (http://link.springer.com/article/10.1007%2Fs10995-010-0717-1, accessed 9 August 2014 [subscription required]).
108. Centers for Disease Control and Prevention. Vital Signs: current cigarette smoking among adults aged >or=18 years – United States, 2009. MMWR Morb Mortal Wkly Rep. 2010;59(35):1135–40 (http://www.cdc.gov/mmwr/preview/mmwrhtml/mm5935a3.htm, accessed 9 August 2014).
109. Chahine T, Subramanian SV, Levy JI. Sociodemographic and geographic variability in smoking in the U.S.: a multilevel analysis of the 2006–2007 Current Population Survey, Tobacco Use Supplement. Soc Sci Med. 2011;73(5):752–8 (http://linkinghub.elsevier.com/retrieve/pii/S0277-9536%2811%2900397-2, accessed 9 August 2014 [subscription required]).
110. Clarkin PF, Tisch LA, Glicksman AS. Socioeconomic correlates of current and regular smoking among college students in Rhode Island. J Am Coll Health. 2008;57(2):183–90 (http://www.tandfonline.com/doi/abs/10.3200/JACH.57.2.183-190?url_ver=Z39.88-2003&rfr_id=ori:rid:crossref.org&rfr_dat=cr_pub%3dpubmed&#.U-X5EaORn9U, accessed 9 August 2014).
111. Cohen SS, Sonderman JS, Mumma MT, Signorello LB, Blot WJ. Individual and neighborhood-level socioeconomic characteristics in relation to smoking prevalence among black and white adults in the Southeastern United States: a cross-sectional study. BMC Public Health. 2011;11(1):877 (http://www.biomedcentral.com/1471-2458/11/877, accessed 9 August 2014).
112. Conwell LS, O'Callaghan MJ, Andersen MJ, Bor W, Najman JM, Williams GM. Early adolescent smoking and a web of personal and social disadvantage. J Paediatr Child Health. 2003;39(8):580–5 (http://onlinelibrary.wiley.com/doi/10.1046/j.1440-1754.2003.00240.x/pdf, accessed 9 August 2014 [subscription required]).
113. Coreil J, Ray LA, Markides KS. Predictors of smoking among Mexican-Americans: findings from the Hispanic HANES. Prev Med. 1991;20(4):508–17. pmid:1871079.
114. Delva J, Tellez M, Finlayson TL, Gretebeck KA, Siefert K, Williams DR et al. Cigarette smoking among low-income African Americans: a serious public health problem. Am J Prev Med. 2005;29(3):218–20 (http://www.ncbi.nlm.nih.gov/pmc/articles/PMC1817892/, accessed 9 August 2014).
115. Diez-Roux AV, Northridge ME, Morabia A, Bassett MT, Shea S. Prevalence and social correlates of cardiovascular disease risk factors in Harlem. Am J Public Health. 1999;89(3):302–7 (http://www.ncbi.nlm.nih.gov/pmc/articles/PMC1508584/, accessed 9 August 2014).
116. Fagan P, Augustson E, Backinger CL, O'Connell ME, Vollinger RE Jr, Kaufman A et al. Quit attempts and intention to quit cigarette smoking among young adults in the United States. Am J Public Health. 2007;97(8):1412–20 (http://www.ncbi.nlm.nih.gov/pmc/articles/PMC1931471/pdf/0971412.pdf, accessed 9 August 2014).
117. Fagan P, Shavers V, Lawrence D, Gibson JT, Ponder P. Cigarette smoking and quitting behaviors among unemployed adults in the United States. Nicotine Tob Res. 2007;9(2):241–8 (http://ntr.oxfordjournals.org/content/9/2/241.long, accessed 9 August 2014 [subscription required]).
118. Fan ZJ, Anderson NJ, Foley M, Rauser E, Silverstein BA. The persistent gap in health-care coverage between low- and high-income workers in Washington State: BRFSS, 2003–2007. Public Health Rep. 2011 126(5):690–9 (http://www.ncbi.nlm.nih.gov/pmc/articles/PMC3151186/, accessed 9 August 2014).
119. Filion KB, Steffen LM, Duval S, Jacobs DR Jr, Blackburn H, Luepker RV. Trends in smoking among adults from 1980 to 2009: the Minnesota heart survey. Am J Public Health. 2012;102(4):705–13 (http://www.ncbi.nlm.nih.gov/pmc/articles/PMC3489364/, accessed 9 August 2014).
120. Friis RH, Forouzesh M, Chhim HS, Monga S, Sze D. Sociocultural determinants of tobacco use among Cambodian Americans. Health Educ Res. 2006;21(3):355–65 (http://her.oxfordjournals.org/content/21/3/355.long, accessed 9 August 2014).
34
121. Fryar CD, Merino MC, Hirsch R, Porter KS. Smoking, alcohol use, and illicit drug use reported by adolescents aged 12–17 years: United States, 1999–2004. Natl Health Stat Report. 2009 May 20(15):1–23 (http://www.cdc.gov/nchs/data/nhsr/nhsr015.pdf, accessed 9 August 2014).
122. Gilpin EA, Pierce JP. Cigar smoking in California: 1990–1996. Am J Prev Med. 1999;16(3):195–201 (http://www.ajpmonline.org/article/S0749-3797%2898%2900092-0/pdf, accessed 9 August 2014).
123. Goodwin RD, Keyes KM, Hasin DS. Changes in cigarette use and nicotine dependence in the United States: evidence from the 2001–2002 wave of the national epidemiologic survey of alcoholism and related conditions. Am J Public Health. 2009;99(8):1471–7 (http://www.ncbi.nlm.nih.gov/pmc/articles/PMC2707489/pdf/1471.pdf, accessed 9 August 2014).
124. Green MP, McCausland KL, Xiao H, Duke JC, Vallone DM, Healton CG. A closer look at smoking among young adults: where tobacco control should focus its attention. Am J Public Health. 2007;97(8):1427–33 (http://www.ncbi.nlm.nih.gov/pmc/articles/PMC1931459/pdf/0971427.pdf, accessed 9 August 2014).
125. Groffen DAI, Koster A, Bosma H, van den Akker M, Kempen GIJM, van Eijk JTM et al. Unhealthy lifestyles do not mediate the relationship between socioeconomic status and incident depressive symptoms: the health ABC study. Am J GeriatrPsychiatry. 2013;21(7):664–74 (http://www.ncbi.nlm.nih.gov/pmc/articles/PMC3402597/pdf/nihms358342.pdf, accessed 9 August 2014).
126. Hajat A, Kaufman JS, Rose KM, Siddiqi A, Thomas JC. Do the wealthy have a health advantage? Cardiovascular disease risk factors and wealth. Soc Sci Med. 2010;71(11):1935–42 (http://linkinghub.elsevier.com/retrieve/pii/S0277-9536%2810%2900691-X, accessed 9 August 2014 [subscription required]).
127. Huang Y, Hannon PA, Williams B, Harris JR. Workers’ health risk behaviors by state, demographic characteristics, and health insurance status. Prev Chronic Dis. 2011;8(1):A12 (http://www.cdc.gov/pcd/issues/2011/jan/pdf/10_0017.pdf, accessed 9 August 2014).
128. Hughes MC, Hannon PA, Harris JR, Patrick DL. Health behaviors of employed and insured adults in the United States, 2004–2005. Am J Health Prom. 2010;24(5):315–23 (http://ajhpcontents.org/doi/abs/10.4278/ajhp.080603-QUAN-77, accessed 9 August 2014).
129. Johnson EO, Novak SP. Onset and persistence of daily smoking: the interplay of socioeconomic status, gender, and psychiatric disorders. Drug Alcohol Depend. 2009;104 Suppl 1:S50–7 (http://www.ncbi.nlm.nih.gov/pmc/articles/PMC2744488/, accessed 9 August 2014).
130. Kahn RS, Certain L, Whitaker RC. A reexamination of smoking before, during, and after pregnancy. Am J Public Health. 2002;92(11):1801–8 (http://www.ncbi.nlm.nih.gov/pmc/articles/PMC1447332/, accessed 10 August 2014).
131. Kahn RS, Wilson K, Wise PH. Intergenerational health disparities: socioeconomic status, women's health conditions, and child behavior problems. Public Health Rep. 2005;120(4):399–408 (http://www.ncbi.nlm.nih.gov/pmc/articles/PMC1497739/pdf/16025720.pdf, accessed 10 August 2014).
132. Kanjilal S, Gregg EW, Cheng YJ, Zhang P, Nelson DE, Mensah G et al. Socioeconomic status and trends in disparities in 4 major risk factors for cardiovascular disease among US adults, 1971–2002. Arch Intern Med. 2006;166(21):2348–55 (http://archinte.jamanetwork.com/article.aspx?articleid=411309, accessed 10 August 2014).
133. Kesteloot H. Social class, all-cause, cardiovascular and cancer mortality: the importance of cigarette smoking. Acta Cardiol. 2003;58(4):285–7. pmid:12948032.
134. Kiefe CI, Williams OD, Greenlund KJ, Ulene V, Gardin JM, Raczynski JM. Health care access and seven-year change in cigarette smoking: the CARDIA Study. Am J Prev Med. 1998;15(2):146–54 (http://www.ajpmonline.org/article/S0749-3797%2898%2900044-0/abstract, accessed 10 August 2014 [subscription required]).
135. Kiefe CI, Williams OD, Lewis CE, Allison JJ, Sekar P, Wagenknecht LE. Ten-year changes in smoking among young adults: are racial differences explained by socioeconomic factors in the CARDIA study? Am J Public Health. 2001;91(2):213–8 (http://www.ncbi.nlm.nih.gov/pmc/articles/PMC1446547/pdf/11211629.pdf, accessed 10 August 2014).
136. Kim H, Clark PI. Cigarette smoking transition in females of low socioeconomic status: impact of state, school, and individual factors. J Epidemiol Community Health. 2006;60 Suppl 2):13–9 (http://www.ncbi.nlm.nih.gov/pmc/articles/PMC2491890/, accessed 10 August 2014).
137. King G, Polednak AP, Bendel R, Hovey D. Cigarette smoking among native and foreign-born African Americans. Ann Epidemiol. 1999;9(4):236–44 (http://www.annalsofepidemiology.org/article/S1047-2797%2898%2900052-0/abstract, accessed 10 August 2014 [subscription required]).
138. Lantz PM, House JS, Lepkowski JM, Williams DR, Mero RP, Chen J. Socioeconomic factors, health behaviors, and mortality: results from a nationally representative prospective study of US adults. JAMA. 1998;279(21):1703–8 (http://jama.jamanetwork.com/article.aspx?articleid=187597, accessed 10 August 2014 [subscription required]).
139. Lawrence D, Fagan P, Backinger CL, Gibson JT, Hartman A. Cigarette smoking patterns among young adults aged 18–24 years in the United States. Nicotine Tob Res. 2007;9(6):687–97 (http://ntr.oxfordjournals.org/content/9/6/687.long, accessed 10 August 2014 [subscription required]).
140. Li S, Delva J. Social capital and smoking among Asian American men: an exploratory study. Am J Public Health. 2012;102(Suppl 2):S212–21 (http://www.ncbi.nlm.nih.gov/pmc/articles/PMC3359821/, accessed 10 August 2014).
35
141. Lowry R, Kann L, Collins JL, Kolbe LJ. The effect of socioeconomic status on chronic disease risk behaviors among US adolescents. JAMA. 1996;276(10):792–7 (http://jama.jamanetwork.com/article.aspx?articleid=407668, accessed 14 August 2014).
142. Luepker RV, Rosamond WD, Murphy R, Sprafka JM, Folsom AR, McGovern PG et al. Socioeconomic status and coronary heart disease risk factor trends: the Minnesota heart survey. Circulation. 1993;88(5 pt1):2172–9 (http://circ.ahajournals.org/content/88/5/2172.long, accessed 10 August 2014).
143. Malmstadt JR, Nordstrom DL, Carty DC, Christiansen AL, Chudy NE, Rumm PD et al. Cigarette smoking in Wisconsin: the influence of race, ethnicity, and socioeconomics. Wis Med J. 2001;100(3):29–3,48. pmid:11491027.
144. Marrie R, Horwitz R, Cutter G, Tyry T, Campagnolo D, Vollmer T. High frequency of adverse health behaviors in multiple sclerosis. Mult Scler. 2009;15(1):105–13 (http://www.ncbi.nlm.nih.gov/pubmed/18845651, accessed 10 August 2014 [subscription required].
145. McWhorter WP, Boyd GM, Mattson ME. Predictors of quitting smoking: the NHANES I followup experience. J Clin Epidemiol. 1990;43(12):1399–1405. pmid:2254778.
146. Mendy V, Short V, Smith L, Gamble A. Disparities in multiple risk factors for heart disease and stroke in the Mississippi Delta. Am J Epidemiol. Oct 23- 31, 2012 2012;176 Suppl1:S105.
147. Mistry R, McCarthy WJ, de Vogli R, Crespi CM, Wu Q, Patel M. Adolescent smoking risk increases with wider income gaps between rich and poor. Health Place. 2011;17(1):222–9 (http://www.ncbi.nlm.nih.gov/pmc/articles/PMC3053420/, accessed 10 August 2014).
148. Mitra M, Lu E, Diop H. Smoking among pregnant women with disabilities. Womens Health Issues. 2012;22(2):e233–9 (http://www.whijournal.com/article/S1049-3867%2811%2900253-2/abstract, accessed 10 August 2014 [subscription required]).
149. Centers for Disease Control and Prevention (CDC). Response to increases in cigarette prices by race/ethnicity, income, and age groups–United States, 1976–1993. MMWR Morb Mortal Wkly Rep. 1998;47(29):605–9 (http://www.cdc.gov/mmwr/preview/mmwrhtml/00054047.htm, accessed 10 August 2014).
150. Mody RR, Smith MJ. Smoking status and health-related quality of life: as findings from the 2001 Behavioral Risk Factor Surveillance System data. Am J Health Promot. 2006;20(4):251–8. pmid:16555798;
151. Mostashari F, Kerker BD, Hajat A, Miller N, Frieden TR. Smoking practices in New York City: the use of a population-based survey to guide policy-making and programming. J Urban Health. 2005;82(1):58–70 (http://www.ncbi.nlm.nih.gov/pmc/articles/PMC3456623/pdf/11524_2006_Article_346.pdf, accessed 10 August 2014).
152. Novotny TE, Warner KE, Kendrick JS, Remington PL. Smoking by blacks and whites: socioeconomic and demographic differences. Am J Public Health. 1988;78(9):1187–9 (http://www.ncbi.nlm.nih.gov/pmc/articles/PMC1349391/pdf/amjph00248-0053.pdf, accessed 10 August 2014).
153. Page RL, Padilla YC, Hamilton ER. Psychosocial factors associated with patterns of smoking surrounding pregnancy in fragile families. Matern Child Health J. 2012;16(1):249–57 (http://www.ncbi.nlm.nih.gov/pmc/articles/PMC3252496/, accessed 10 August 2014).
154. Patrick ME, Wightman P, Schoeni RF, Schulenberg JE. Socioeconomic status and substance use among young adults: a comparison across constructs and drugs. J Stud Alcohol Drugs. 2012;73(5):772–82 (http://www.ncbi.nlm.nih.gov/pmc/articles/PMC3410945/, accessed 10 August 2014).
155. Pleis JR, Lucas JW. Summary health statistics for U.S. adults: National Health Interview Survey, 2007. Vital Health Stat 2009;(240) (http://www.cdc.gov/nchs/data/series/sr_10/sr10_240.pdf, accessed 10 August 2014).
156. Pleis JR, Ward BW, Lucas JW. Summary health statistics for U.S. adults: National Health Interview Survey, 2009. Vital Health Stat. 2010;10(249) (http://www.cdc.gov/nchs/data/series/sr_10/sr10_249.pdf, accessed 10 August 2014).
157. Rahman MM, Luong NT, Divan HA, Jesser C, Golz SD, Thirumala K et al. Prevalence and predictors of smoking behavior among Vietnamese men living in California. Nicotine Tob Res. 2005;7(1):103–9 (http://ntr.oxfordjournals.org/content/7/1/103.long, accessed 10 August 2014 [subscription required]).
158. Resnicow K, Wang T, Dudley WN, Jackson A, Ahluwalia JS, Baranowski T et al. Risk factor distribution among sociodemographically diverse African American adults. J Urban Health. 2001;78(1):125–40 (http://libres.uncg.edu/ir/uncg/f/W_Dudley_Risk_2001.pdf, accessed 10 August 2014).
159. Rogers RG, Nam CB, Hummer RA. Demographic and socioeconomic links to cigarette smoking. Soc Biol. 1995;42(1–2):1–21. pmid:7481913.
160. Ross CE. Walking, exercising, and smoking: does neighborhood matter? Soc Sci Med. 2000;51(2):265–74 (http://linkinghub.elsevier.com/retrieve/pii/S0277953699004517, accessed 10 August 2014).
161. Samet JM, Howard CA, Coultas DB, Skipper BJ. Acculturation, education, and income as determinants of cigarette smoking in New Mexico Hispanics. Cancer Epidemiol Biomarkers Prev. 1992;1(3):235–40 (http://cebp.aacrjournals.org/content/1/3/235.long, accessed 10 August 2014).
162. Scarinci IC, Robinson LA, Alfano CM, Zbikowski SM, Klesges RC. The relationship between socioeconomic status, ethnicity, and cigarette smoking in urban adolescents. Prev Med. 2002;34(2):171–8 (http://www.sciencedirect.com/science/article/pii/S0091743501909673, accessed 10 August 2014 [subscription required]).
36
163. Schiller JS, Lucas JW, Ward BW, Peregoy JA. Summary health statistics for U.S. adults: National Health Interview Survey, 2010. Vital Health Stat. 10 2012;(252):1–207 (http://www.cdc.gov/nchs/data/series/sr_10/sr10_252.pdf, accessed 10 August 2014).
164. Scholes D, Daling JR, Stergachis AS. Current cigarette smoking and risk of acute pelvic inflammatory disease. Am J Public Health. 1992;82(10):1352–5 (http://www.ncbi.nlm.nih.gov/pmc/articles/PMC1695871/pdf/amjph00547-0042.pdf, accessed 10 August 2014).
165. Shavers VL, Lawrence D, Fagan P, Gibson JT. Racial/ethnic variation in cigarette smoking among the civilian US population by occupation and industry, TUS-CPS 1998–1999. Prev Med. 2005;41(2):597–606 (http://www.sciencedirect.com/science/article/pii/S0091743505000332, accessed 10 August 2014).
166. Shelley D, Fahs MC, Yerneni R, Qu J, Burton D. Correlates of household smoking bans among Chinese Americans. Nicotine Tob Res. 2006;8(1):103–12 (http://www.ncbi.nlm.nih.gov/pmc/articles/PMC1533992/, accessed 10 August 2014).
167. Siegel D, Faigeles B. Smoking and socioeconomic status in a population-based inner city sample of African-Americans, Latinos and whites. J Cardiovasc Risk. 1996;3(3):295–300 (http://cpr.sagepub.com/content/3/3/295.long, accessed 10 August 2014 [subscription required]).
168. Tomar SL, Asma S. Smoking-attributable periodontitis in the United States: findings from NHANES III. National Health and Nutrition Examination Survey. J Periodontol. 2000;71(5):743–51 (http://www.joponline.org/doi/pdf/10.1902/jop.2000.71.5.743, accessed 10 August 2014 [subscription required]).
169. Unger JB, Sun P, Johnson CA. Socioeconomic correlates of smoking among an ethnically diverse sample of 8th grade adolescents in Southern California. Prev Med. 2007;44(4):323–7 (http://www.ncbi.nlm.nih.gov/pmc/articles/PMC1904430/, accessed 10 August 2014).
170. Wallace JM Jr, Vaughn MG, Bachman JG, O’Malley PM, Johnston LD, Schulenberg JE. Race/ethnicity, socioeconomic factors, and smoking among early adolescent girls in the United States. Drug Alcohol Depend. 2009;104 Suppl 1:S42–9 (http://www.ncbi.nlm.nih.gov/pmc/articles/PMC2732752/, accessed 10 August 2014).
171. Watson JM, Scarinci IC, Klesges RC, Murray DM, van der Wee M, De Bon M et al. Relationships among smoking status, ethnicity, socioeconomic indicators, and lifestyle variables in a biracial sample of women. Prev Med. 2003;37(2):138–47 (http://www.sciencedirect.com/science/article/pii/S0091743503000963, accessed 10 August 2014).
172. Webb MS, Carey MP. Tobacco smoking among low-income black women: demographic and psychosocial correlates in a community sample. Nicotine Tob Res. 2008;10(1):219–29 (http://ntr.oxfordjournals.org/content/10/1/219.long, accessed 10 August 2014 [subscription required]).
173. Wee CC, Rigotti NA, Davis RB, Phillips RS. Relationship between smoking and weight control efforts among adults in the United States. Arch Intern Med. 2001;161(4):546–50 (http://archinte.jamanetwork.com/article.aspx?articleid=647453, accessed 10 August 2014 [subscription required]).
174. Winkleby MA, Jatulis DE, Frank E, Fortmann SP. Socioeconomic status and health: how education, income, and occupation contribute to risk factors for cardiovascular disease. Am J Public Health. 1992;82(6):816 –20 (http://www.ncbi.nlm.nih.gov/pmc/articles/PMC1694190/pdf/amjph00543-0042.pdf, accessed 10 August 2014).
175. Ferrante D, Virgolini M. Encuesta Nacional de Factores de Riesgo 2005: resultados principales. Prevalencia de factores de riesgo de enfermedades cardiovasculares en la Argentina. Rev Argent Cardiol. 2007;75(1):20–9 (in Spanish) (http://www.scielo.org.ar/pdf/rac/v75n1/en_v75n1a05.pdf [English version], accessed 11 August 2014).
176. Ferrante D, Linetzky B, King A, Virgolini M, Laspiur S. 2009 national Risk Factors Survey: evolution of the epidemic of chronic non communicable diseases in Argentina. Cross sectional study. Rev Argent Salud Publica. 2011;2(6):34–41 (http://www.msal.gov.ar/images/stories/ministerio/presec-2012/Encuesta_Nacional_De_Factores_De_Riesgo_2009_RevArgent_Salud_Publica.pdf, accessed 11 August 2014).
177. Barros AJD, Cascaes AM, Wehrmeister FC, Martínez-Mesa J, Menezes AMB. Tabagismo no Brasil: desigualdades regionais e prevalência segundo características ocupacionais. Cien Saude Colet. 2011;16:3707–16 (in Portuguese) (http://www.scielo.br/pdf/csc/v16n9/a08v16n9.pdf, accessed 11 August 2014).
178. Bortoluzzi MC, Kehrig RT, Loguercio AD, Traebert JL. Prevalência e perfil dos usuários de tabaco de população adulta em cidade do Sul do Brasil (Joaçaba, SC). Cien Saude Colet. 2011;16(3):1953–59 (in Portuguese) (http://www.scielo.br/pdf/csc/v16n3/29.pdf, accessed 11 August 2014).
179. Dall'Agnol MM, Fassa AG, Facchini LA. Child and adolescent labor and smoking: a cross-sectional study in southern Brazil. Cad Saude Publica. 2011;27(1):46–56 (http://www.scielosp.org/pdf/csp/v27n1/05.pdf, accessed 11 August 2014).
180. De Lima Garcias G, Schuler-Faccini L. Community diagnosis of maternal exposure to risk factors for congenital defects. Community Genet. 2003;6(2):96–103 (http://www.karger.com/Article/FullText/73005, accessed 11 August 2014 [subscription required]).
181. Dias-Dame JL, Cesar JA, Silva SM. Tendência temporal de tabagismo em população urbana: um estudo de base populacional no Sul do Brasil. Cad Saude Publica. 2011;27(11):2166–74 (in Portugese) (http://www.scielosp.org/scielo.php?pid=S0102-311X2011001100010&script=sci_arttext, acessed 11 August 2014).
182. Farias Junior JC, Nahas MV, Barros MVG, Loch MR, Oliveira ESA, DeBem MFL et al. Comportamentos de risco à saúde em adolescentes no Sul do Brasil: prevalência e fatores associados. Rev Panam Salud Publica. 2009;25:344–52. (in Portugese)
37
183. Gonçalves-Silva RMV, Valente JG, Lemos-Santos MGF, Sichieri R. Tabagismo no domicílio e baixa estatura em menores de cinco anos. Cad Saude Publica. 2005;21(5):1540–9 (in Portugese) (http://www.scielo.br/scielo.php?script=sci_arttext&pid=S0102-311X2005000500027, accessed 11 August 2014).
184. Kuhnen M, Boing AF, Oliveira MCd, Longo GZ, Njaine K. Tabagismo e fatores associados em adultos: um estudo de base populacional. Rev Bras Epidemiol. 2009;12:615–26. (in Portugese).
185. Marinho V, Blay SL, Andreoli SB, Gastal F. A prevalence study of current tobacco smoking in later life community and its association with sociodemographic factors, physical health and mental health status. Soc Psychiatry Psychiatr Epidemiol. 2008;43(6):490–7 (http://link.springer.com/article/10.1007%2Fs00127-008-0338-9, accessed 11 August 2014 [subscription required]).
186. Menezes AMB, Minten GC, Hallal PC, Victoria CG, Horta BL, Gigante DP et al. Tabagismo na coorte de nascimentos de 1982: da adolescência à vida adulta, Pelotas, RS. Rev. Saúde Pública. 2008;42 Suppl 2:78–85 (in Portugese) (http://www.scielo.br/pdf/rsp/v42s2/en_7009.pdf [in English], accessed 11 August 2014).
187. Momino W, Minussi L, Woffchuck D, Palmero EI, Sanseverino MT, Guimarães et al. Reproductive risk factors related to socioeconomic status in pregnant women in Southern Brazil. Community Genet. 2003;6(2):77–83 (http://www.karger.com/Article/FullText/73002, accessed 11 August 2014 [subscription required]).
188. Monteiro CA, Cavalcante TM, Moura EC, Claro RM, Szwarcwald CL. Population-based evidence of a strong decline in the prevalence of smokers in Brazil (1989–2003). Bull World Health Organ. 2007;85(7):527–34 (http://www.ncbi.nlm.nih.gov/pmc/articles/PMC2636372/, accessed 11 August 2014).
189. Moreira LB, Fuchs FD, Moraes RS, Bredemeir M, Cardozo S. Prevalência de tabagismo e fatores associados em área metropolitana da região Sul do Brasil. Rev Saude Publica. 1995;29(1):46–51(in Portugese) (http://www.scielo.br/pdf/rsp/v29n1/08.pdf, accessed 11 August 2014).
190. Santos IS, Barros AJD, Matijasevich A, Tomasi E, Medeiros RS, Domingues MR et al. Mothers and their pregnancies: a comparison of three population-based cohorts in Southern Brazil. Cad Saude Publica. 2008;24 Suppl 4:s381–9 (http://www.readcube.com/articles/10.1590/S0102-311X2008001500003, accessed 11 August 2014).
191. Senger AEV, Ely LS, Gandolfi T, Schneider RH, Gomes I, De Carli GA. Alcoolismo e tabagismo em idosos: relação com ingestão alimentar e aspectos socioeconômicos. Rev Bras Geriatr Gerontol. 2011;14(4):713–9 (in Prtugese) (http://www.scielo.br/pdf/rbgg/v14n4/a10v14n4.pdf, accessed 11 August 2014).
192. Zaitune MPD, Barros MBD, Lima MG, Guimaraes M, Cesar CLG, Caradina L et al. Fatores associados ao tabagismo em idosos: Inquérito de Saúde no Estado de São Paulo (ISA-SP). Cad Saude Publica. 2012;28(3):583–96 (in Portugese) (http://www.scielosp.org/scielo.php?script=sci_arttext&pid=S0102-311X2012000300018&lng=pt, accessed 11 August 2014).
193. Best CM, Sun K, de Pee S, Bloem MW, Stallkamp G, Semba RD. Parental tobacco use is associated with increased risk of child malnutrition in Bangladesh. Nutrition. 2007;23(10):731–8 (http://www.nutritionjrnl.com/article/S0899-9007%2807%2900219-5/abstract, accessed 11 August 2014 [subscription required]).
194. Khan MMH, Khan A, Kraemer A, Mori M. Prevalence and correlates of smoking among urban adult men in Bangladesh: slum versus non-slum comparison. BMC Public Health. 2009;9:149 (http://www.biomedcentral.com/content/pdf/1471-2458-9-149.pdf, accessed 11 August 2014).
195. Kumar NP, Shankaregowda HS, Revathy R. An assessment of preventable risk factors for chronic non-communicable diseases in an adult population. Asian J Epidemiol. 2011;4(1):9–16 (http://scialert.net/qredirect.php?doi=aje.2011.9.16&linkid=pdf, accessed 11 August 2014).
196. Ramachandran A, Snehalatha C, Vijay V, King H. Impact of the poverty on the prevalence of diabetes and its complications in urban southern India. Diabet Med. 2002;19(2):130–5 (http://onlinelibrary.wiley.com/doi/10.1046/j.1464-5491.2002.00656.x/pdf, accessed 11 August 2014 [subscription required]).
197. Chandra Shekar BR, Reddy CVK, Manjunath BC, Suma S. Dental health awareness, attitude, oral health-related habits, and behaviors in relation to socio-economic factors among the municipal employees of Mysore city. Ann Trop Med Public Health 2011;4:99–106 (http://www.atmph.org/article.asp?issn=1755-6783;year=2011;volume=4;issue=2;spage=99;epage=106;aulast=Chandra, accessed 11 August 2014 [subscription required]).
198. Singh RB, Sharma JP, Rastogi V, Niaz MA, Ghosh S, Beegom R et al. Social class and coronary disease in rural population of north India. The Indian Social Class and Heart Survey. Eur Heart J. 1997;18(4):588–95 (http://eurheartj.oxfordjournals.org/content/18/4/588.long, accessed 11 August 2014).
199. Dewi FST, Stenlund H, Ohman A, Hakimim M, Weinehall L. Mobilising a disadvantaged community for a cardiovascular intervention: designing PRORIVA in Yogyakarta, Indonesia. Glob Health Action. 2010;3:4661 (http://www.ncbi.nlm.nih.gov/pmc/articles/PMC2904588/pdf/GHA-3-4661.pdf, accessed 11 August 2014).
200. Cho HJ, Song YM, Smith GD, Ebrahim S. Trends in socio-economic differentials in cigarette smoking behaviour between 1990 and 1998: A large prospective study in Korean men. Public Health. 2004;118(8):553–8 (http://www.publichealthjrnl.com/article/S0033-3506%2804%2900112-X/abstract, accessed 11 August 2014 [subscription required]).
201. Kim CS, Yun SC, Kim HR, Khang YH. [A multilevel study on the relationship between the residential distribution of high class (power elites) and smoking in Seoul]. J Prev Med Pub Health. 2006;39(1):30–8. [(in Korean) pmid:16613069.
38
202. Aekplakorn W, Hogan MC, Tiptaradol S, Wibulpolprasert S, Punyaratabandhu P, Lim SS. Tobacco and hazardous or harmful alcohol use in Thailand: joint prevalence and associations with socioeconomic factors. Addic Behav. 2008;33(4):503–14 (http://www.sciencedirect.com/science/article/pii/S0306460307002985, accessed 11 August 2014 [subscription required]).
203. Jitnarin N, Kosulwat V, Rojroongwasinkul N, Boonpraderm A, Haddock CK, Poston WSC. Socioeconomic status and smoking among Thai adults: results of the National Thai Food Consumption Survey. Asia Pac J Public Health. 2011;23(5):672–81 (http://aph.sagepub.com/content/23/5/672.long, accessed 11 August 2014 [subscription required]).
204. Mekrungrongwong S, Nakamura K, Kizuki M, Morita A, Somkotra T, Seino K et al. Great inclination to smoke among younger adults coming from low-socioeconomic class in Thailand. Int Arch Med. 2011;4(1):29 (http://www.intarchmed.com/content/4/1/29, accessed 11 August 2014).
205. Chen X, Li X, Stanton B, Fang X, Lin D, Cole M et al. Cigarette smoking among rural-to-urban migrants in Beijing, China. Prev Med. 2004;39(4):666–73 (http://www.researchgate.net/publication/8361398_Cigarette_smoking_among_rural-to-urban_migrants_in_Beijing_China, accessed 11 August 2014).
206. Gong YL, Koplan JP, Feng W, Chen CHC, Zheng P, Harris JR. Cigarette smoking in China: prevalence, characteristics, and attitudes in Minhang District. JAMA. 1995;274(15):1232–4 (www.ncbi.nlm.nih.gov/pubmed/7563514, accessed 11 August 2014 [subscription required]).
207. Hesketh T, Lu L, Jun YX, Mei WH. Smoking, cessation and expenditure in low income Chinese: cross sectional survey. BMC Public Health. 2007;7:29 (http://www.biomedcentral.com/content/pdf/1471-2458-7-29.pdf, accessed 11 August 2014).
208. Sun P, Unger JB, Palmer P, Ma H, Xie B, Sussman S et al. Relative income inequality and selected health outcomes in urban Chinese youth. Soc Sci Med. 2012;74(1):84–91 (http://linkinghub.elsevier.com/retrieve/pii/S0277-9536%2811%2900651-4, accessed 11 August 2014).
209. Yin P, Zhang M, Li Y, Jiang Y, Zhao W. Prevalence of COPD and its association with socioeconomic status in China: findings from China Chronic Disease Risk Factor Surveillance 2007. BMC Public Health. 2011;11:586 (http://www.biomedcentral.com/content/pdf/1471-2458-11-586.pdf, accessed 11 August 2014).
210. Fukuda Y, Nakamura K, Takano T. Socioeconomic pattern of smoking in Japan: Income inequality and gender and age differences. Ann Epidemiol. 2005;15(5):365–72 (http://www.annalsofepidemiology.org/article/S1047-2797%2804%2900276-5/abstract, accessed 11 August 2014 [subscription required]).
211. Fukuda Y, Nakao H, Imai H. Different income information as an indicator for health inequality among Japanese adults. J Epidemiol. 2007;17(3):93–9 (https://www.jstage.jst.go.jp/article/jea/17/3/17_3_93/_pdf, accessed 11 March 2014).
212. Khang YH, Lynch JW, Jung-Choi K, Cho HJ. Explaining age-specific inequalities in mortality from all causes, cardiovascular disease and ischaemic heart disease among South Korean male public servants: relative and absolute perspectives. Heart. 2008;94(1):75–82 (http://heart.bmj.com/content/94/1/75.long, accessed 11 March 2014 [subscription required]).
213. Park EJ, Kim H, Kawachi I, Kim IH, Cho SI. Area deprivation, individual socioeconomic position and smoking among women in South Korea. Tob Control. 2010;19(5):383–90 (http://tobaccocontrol.bmj.com/content/19/5/383.long, accessed 11 August 2014 [subscription required]).
214. Van Kinh H, Ross H, Levy D, Minh NT, Ngoc VTB. The effect of imposing a higher, uniform tobacco tax in Vietnam. Health Res Policy Syst. 2006;4:6 (http://www.health-policy-systems.com/content/pdf/1478-4505-4-6.pdf, accessed 11 August 2014).
215. Brennan SL, Henry MJ, Nicholson GC, Kotowicz MA, Pasco JA. Socioeconomic status and risk factors for obesity and metabolic disorders in a population-based sample of adult females. Prev Med. 2009;49(2–3):165–71 (http://www.sciencedirect.com/science/article/pii/S0091743509003247, accessed 11 August 2014 [subscription required]).
216. Brennan SL, Henry MJ, Wluka AE, Nicholson GC, Kotowicz MA, Williams JW et al. BMD in population-based adult women Is associated with socioeconomic status. J Bone Miner Res. 2009;24(5):809–15 (http://onlinelibrary.wiley.com/doi/10.1359/jbmr.081243/pdf, accessed 11 August 2014).
217. Lawlor DA, O'Callaghan MJ, Mamun AA, Williams GM, Bor W, Najman JM. Socioeconomic position, cognitive function, and clustering of cardiovascular risk factors in adolescence: findings from the Mater University Study of Pregnancy and its outcomes. Psychosom Med. 2005;67(6):862–8 (http://www.ncbi.nlm.nih.gov/pubmed/16314590, accessed 11 August 2014 [subscription required]).
218. Mohsin M, Bauman AE, Forero R. Socioeconomic correlates and trends in smoking in pregnancy in New South Wales, Australia. J Epidemiol Community Health. 2011;65(8):727-–32 (http://jech.bmj.com/content/65/8/727.long, accessed 11 August 2014 [subscription required]).
219. Najman JM, Lanyon A, Andersen M, Williams G, Bor W, O'Callaghan M. Socioeconomic status and maternal cigarette smoking before, during and after a pregnancy. Aust N Z J Public Health. 1998;22(1):60–6 (http://onlinelibrary.wiley.com/doi/10.1111/j.1467-842X.1998.tb01146.x/pdf, accessed 11 August 2014 [subscription required]).
39
220. Najman JM, Toloo G, Siskind V. Socioeconomic disadvantage and changes in health risk behaviours in Australia: 1989-90 to 2001. Bull World Health Organ. 2006;84(12):976–84 (http://www.ncbi.nlm.nih.gov/pmc/articles/PMC2627564/pdf/17242834.pdf, accessed 11 August 2014).
221. Siahpush M, Borland R. Socio-demographic variations in smoking status among Australians aged > or = 18: multivariate results from the 1995 National Health Survey. Aust N Z J Public Health. 2001;25(5):438–42 (http://onlinelibrary.wiley.com/doi/10.1111/j.1467-842X.2001.tb00289.x/pdf, accessed 11 August 2014 [subscription required]).
222. Siahpush M, Borland R, Scollo M. Smoking and financial stress. Tob Control. 2003;12(1):60–6 (http://www.ncbi.nlm.nih.gov/pmc/articles/PMC1759081/pdf/v012p00060.pdf, accessed 11 August 2014).
223. Siahpush M, Borland R, Taylor J, Singh GK, Ansari Z, Serraglio A. The association of smoking with perception of income inequality, relative material well-being, and social capital. Soc Sci Med. 2006;63(11):2801–12 (http://linkinghub.elsevier.com/retrieve/pii/S0277-9536%2806%2900378-9, accessed 11 August 2014 [subscription required]).
224. Thomas DP, Briggs V, Anderson IPS, Cunningham J. The social determinants of being an indigenous non-smoker. Aust N Z J Public Health. 2008;32(2):110–6. pmid:18412679.
225. Turrell G, Battistutta D, McGuffog I. Social determinants of smoking among parents with infants. Aus N Z J Public Health. 2002;26(1):30–7 (http://onlinelibrary.wiley.com/doi/10.1111/j.1467-842X.2002.tb00267.x/abstract, accessed 11 August 2014 [subscription required]).
226. White VM, Hayman J, Hill DJ. Can population-based tobacco-control policies change smoking behaviors of adolescents from all socio-economic groups? Findings from Australia: 1987–2005. Cancer Causes Control. 2008;19(6):631–40 (http://link.springer.com/article/10.1007%2Fs10552-008-9127-8, accessed 11 August 2014 [subscription required]).
227. Heeley EL, Wei JW, Carter K, Islam MS, Thrist AG, Hankey GJ et al. Socioeconomic disparities in stroke rates and outcome: pooled analysis of stroke incidence studies in Australia and New Zealand. Med J Aust. 2011;195(1):10–4 (https://www.mja.com.au/journal/2011/195/1/socioeconomic-disparities-stroke-rates-and-outcome-pooled-analysis-stroke, accessed 11 August 2014).
228. Butler S, Williams M, Paterson J, Tukuitonga C. Smoking among mothers of a Pacific Island birth cohort in New Zealand: associated factors. N Z Med J. 2004;117(1206):U1171 (http://journal.nzma.org.nz/journal/117-1206/1171/, accessed 11 August 2014).
229. Erick-Peleti S, Paterson J, Williams M. Pacific Islands Families Study: maternal factors associated with cigarette smoking amongst a cohort of Pacific mothers with infants. N Z Med J. 2007;120(1256):U2588 (http://journal.nzma.org.nz/journal/120-1256/2588/, accessed 11 August 2014).
230. Metcalf P, Scragg R, Davis P. Relationship of different measures of socioeconomic status with cardiovascular disease risk factors and lifestyle in a New Zealand workforce survey. N Z Med J. 2007;120(1248):U2392 (http://journal.nzma.org.nz/journal/120-1248/2392/, accessed 11 August 2014).
231. Metcalf PA, Scagg RRK, Schaaf D, Dyall L, Black PN, Jackson RT. Comparison of different markers of socioeconomic status with cardiovascular disease and diabetes risk factor in the diabetes, heart and health survey. N Z Med J. 2008;121(1269):45–56 (http://journal.nzma.org.nz/journal/120-1248/2392/content.pdf, accessed 11 August 2014).
232. Stewart RA, North FM, Sharples KJ, Simes RJ, Tonkin AM, White HD. Differences in cardiovascular mortality between Australia and New Zealand according to socioeconomic status: findings from the Long-Term Intervention with Pravastatin in Ischaemic Disease (LIPID) Study. N Z Med J. 2008;121(1269):11–23 http://journal.nzma.org.nz/journal/121-1269/2931/, accessed 11 August 2014).
233. Whitlock G, MacMahon S, Vander Hoorn S, Davis P, Jackson R, Norton R. Socioeconomic distribution of smoking in a population of 10,529 New Zealanders. N Z Med J. 1997;110(1051):327–30. pmid:9323370.
234. Oleson O. Types of study design. The Cochrane Non-Randomised Studies Methods Group (NRSMG). 1999.
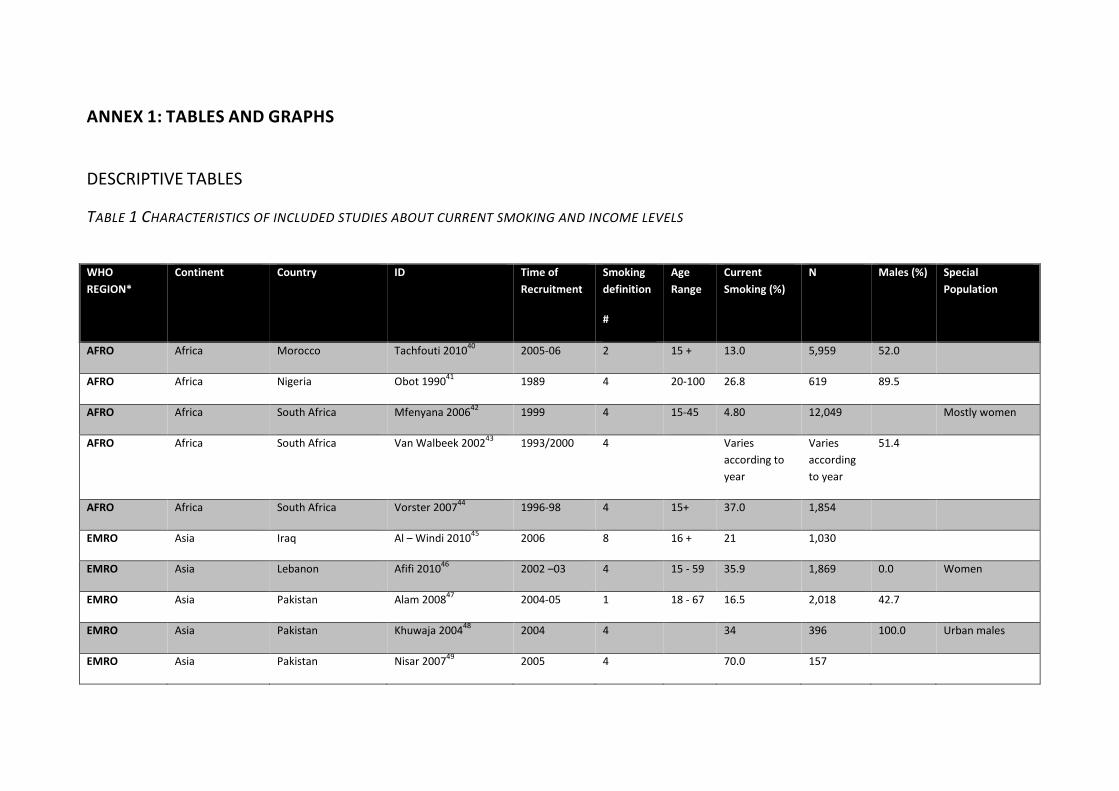
ANNEX 1: TABLES AND GRAPHS
DESCRIPTIVE TABLES
TABLE 1 CHARACTERISTICS OF INCLUDED STUDIES ABOUT CURRENT SMOKING AND INCOME LEVELS
WHO REGION*
Continent Country ID Time of Recruitment
Smoking definition
#
Age Range
Current Smoking (%)
N Males (%) Special Population
AFRO Africa Morocco Tachfouti 201040 2005-06 2 15 + 13.0 5,959 52.0
AFRO Africa Nigeria Obot 199041 1989 4 20-100 26.8 619 89.5
AFRO Africa South Africa Mfenyana 200642 1999 4 15-45 4.80 12,049 Mostly women
AFRO Africa South Africa Van Walbeek 200243 1993/2000 4 Varies according to year
Varies according to year
51.4
AFRO Africa South Africa Vorster 200744 1996-98 4 15+ 37.0 1,854
EMRO Asia Iraq Al – Windi 201045 2006 8 16 + 21 1,030
EMRO Asia Lebanon Afifi 201046 2002 –03 4 15 - 59 35.9 1,869 0.0 Women
EMRO Asia Pakistan Alam 200847 2004-05 1 18 - 67 16.5 2,018 42.7
EMRO Asia Pakistan Khuwaja 200448 2004 4 34 396 100.0 Urban males
EMRO Asia Pakistan Nisar 200749 2005 4 70.0 157
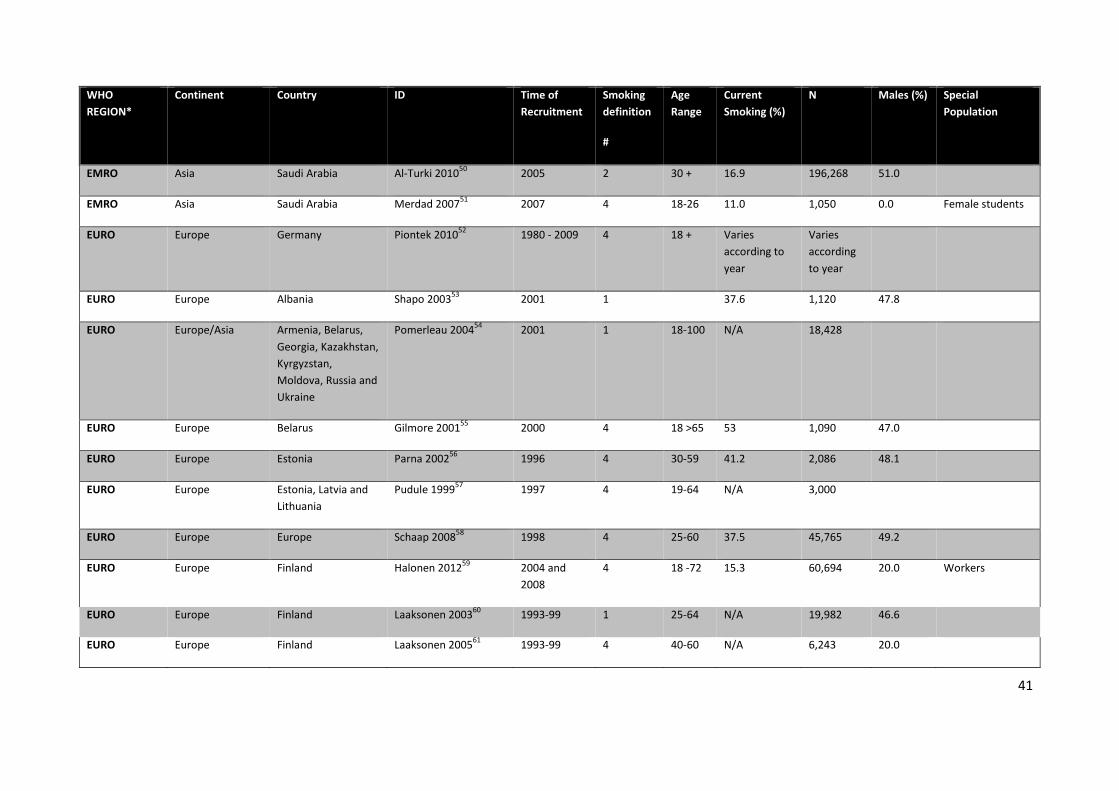
41
WHO REGION*
Continent Country ID Time of Recruitment
Smoking definition
#
Age Range
Current Smoking (%)
N Males (%) Special Population
EMRO Asia Saudi Arabia Al-Turki 201050 2005 2 30 + 16.9 196,268 51.0
EMRO Asia Saudi Arabia Merdad 200751 2007 4 18-26 11.0 1,050 0.0 Female students
EURO Europe Germany Piontek 201052 1980 - 2009 4 18 + Varies according to year
Varies according to year
EURO Europe Albania Shapo 200353 2001 1 37.6 1,120 47.8
EURO Europe/Asia Armenia, Belarus, Georgia, Kazakhstan, Kyrgyzstan, Moldova, Russia and Ukraine
Pomerleau 200454 2001 1 18-100 N/A 18,428
EURO Europe Belarus Gilmore 200155 2000 4 18 >65 53 1,090 47.0
EURO Europe Estonia Parna 200256 1996 4 30-59 41.2 2,086 48.1
EURO Europe Estonia, Latvia and Lithuania
Pudule 199957 1997 4 19-64 N/A 3,000
EURO Europe Europe Schaap 200858 1998 4 25-60 37.5 45,765 49.2
EURO Europe Finland Halonen 201259 2004 and 2008
4 18 -72 15.3 60,694 20.0 Workers
EURO Europe Finland Laaksonen 200360 1993-99 1 25-64 N/A 19,982 46.6
EURO Europe Finland Laaksonen 200561 1993-99 4 40-60 N/A 6,243 20.0
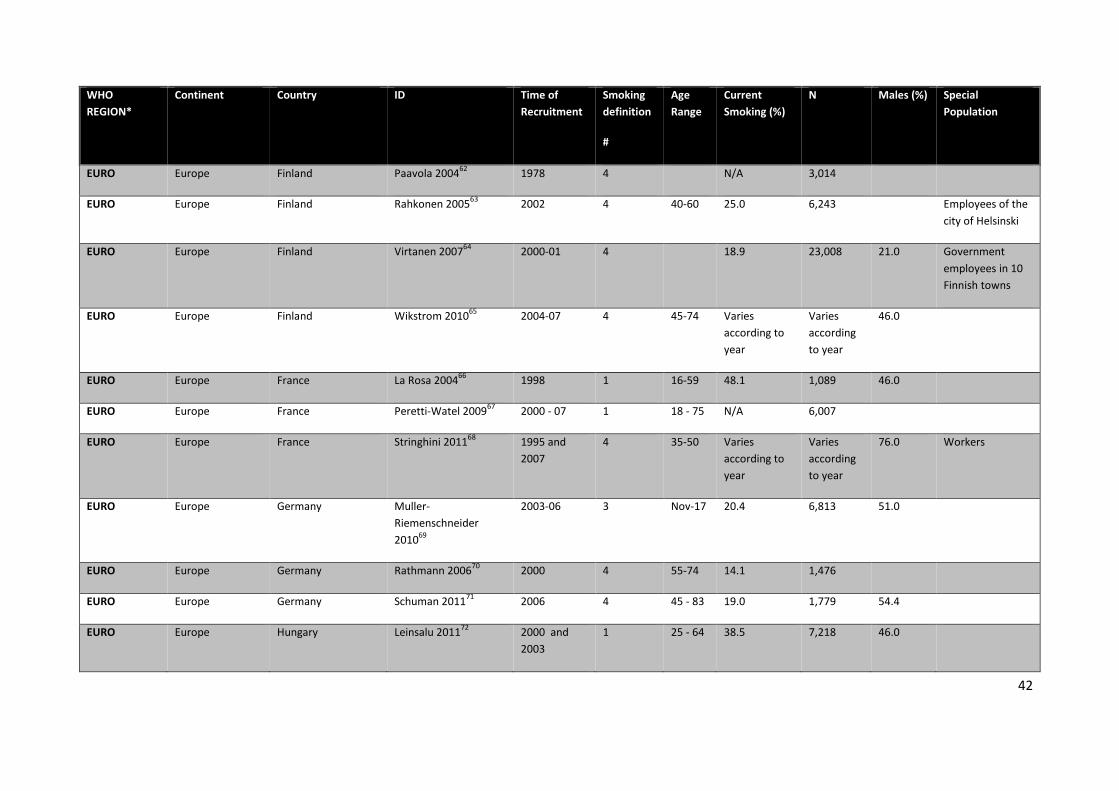
42
WHO REGION*
Continent Country ID Time of Recruitment
Smoking definition
#
Age Range
Current Smoking (%)
N Males (%) Special Population
EURO Europe Finland Paavola 200462 1978 4 N/A 3,014
EURO Europe Finland Rahkonen 200563 2002 4 40-60 25.0 6,243 Employees of the city of Helsinski
EURO Europe Finland Virtanen 200764 2000-01 4 18.9 23,008 21.0 Government employees in 10 Finnish towns
EURO Europe Finland Wikstrom 201065 2004-07 4 45-74 Varies according to year
Varies according to year
46.0
EURO Europe France La Rosa 200466 1998 1 16-59 48.1 1,089 46.0
EURO Europe France Peretti-Watel 200967 2000 - 07 1 18 - 75 N/A 6,007
EURO Europe France Stringhini 201168 1995 and 2007
4 35-50 Varies according to year
Varies according to year
76.0 Workers
EURO Europe Germany Muller-Riemenschneider 201069
2003-06 3 Nov-17 20.4 6,813 51.0
EURO Europe Germany Rathmann 200670 2000 4 55-74 14.1 1,476
EURO Europe Germany Schuman 201171 2006 4 45 - 83 19.0 1,779 54.4
EURO Europe Hungary Leinsalu 201172 2000 and 2003
1 25 - 64 38.5 7,218 46.0
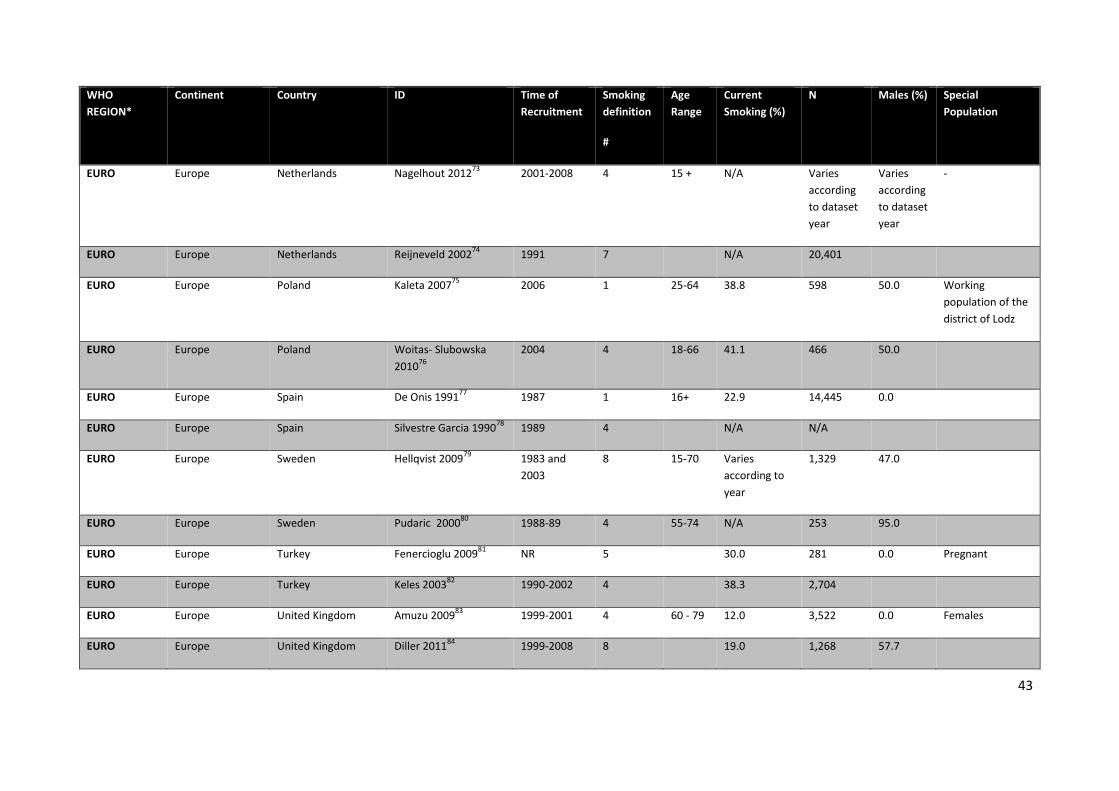
43
WHO REGION*
Continent Country ID Time of Recruitment
Smoking definition
#
Age Range
Current Smoking (%)
N Males (%) Special Population
EURO Europe Netherlands Nagelhout 201273 2001-2008 4 15 + N/A Varies according to dataset year
Varies according to dataset year
-
EURO Europe Netherlands Reijneveld 200274 1991 7 N/A 20,401
EURO Europe Poland Kaleta 200775 2006 1 25-64 38.8 598 50.0 Working population of the district of Lodz
EURO Europe Poland Woitas- Slubowska 201076
2004 4 18-66 41.1 466 50.0
EURO Europe Spain De Onis 199177 1987 1 16+ 22.9 14,445 0.0
EURO Europe Spain Silvestre Garcia 199078 1989 4 N/A N/A
EURO Europe Sweden Hellqvist 200979 1983 and 2003
8 15-70 Varies according to year
1,329 47.0
EURO Europe Sweden Pudaric 200080 1988-89 4 55-74 N/A 253 95.0
EURO Europe Turkey Fenercioglu 200981 NR 5 30.0 281 0.0 Pregnant
EURO Europe Turkey Keles 200382 1990-2002 4 38.3 2,704
EURO Europe United Kingdom Amuzu 200983 1999-2001 4 60 - 79 12.0 3,522 0.0 Females
EURO Europe United Kingdom Diller 201184 1999-2008 8 19.0 1,268 57.7
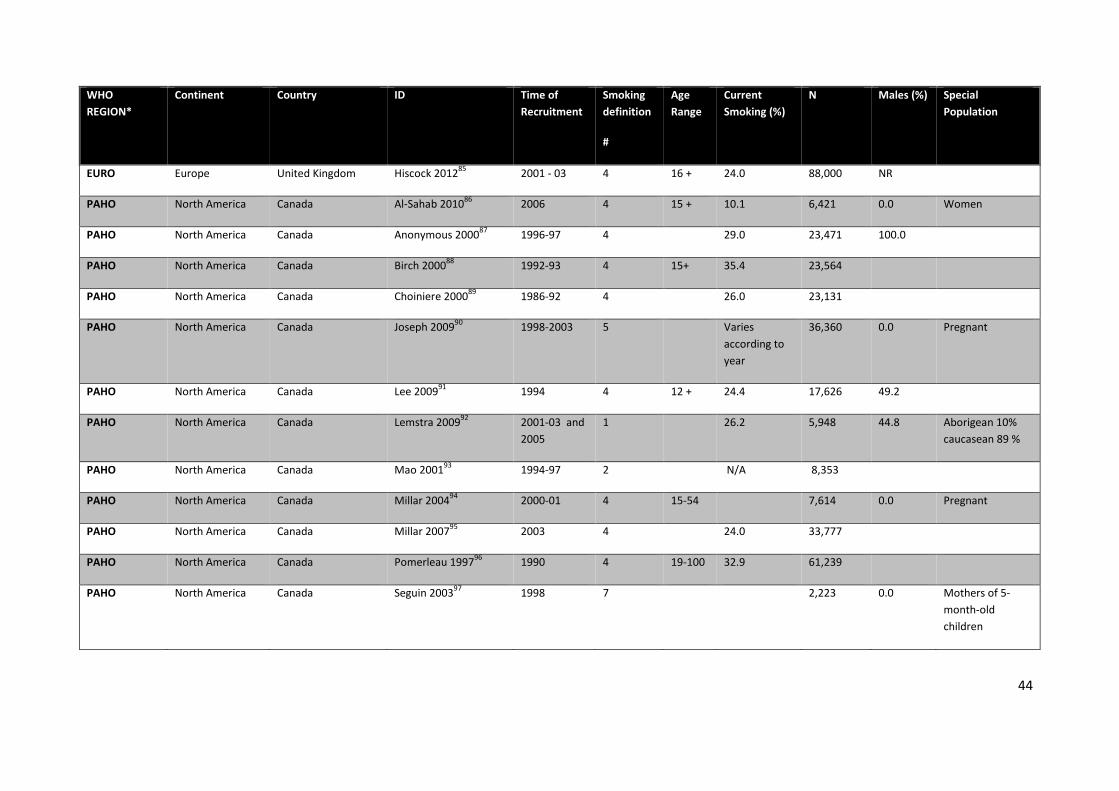
44
WHO REGION*
Continent Country ID Time of Recruitment
Smoking definition
#
Age Range
Current Smoking (%)
N Males (%) Special Population
EURO Europe United Kingdom Hiscock 201285 2001 - 03 4 16 + 24.0 88,000 NR
PAHO North America Canada Al-Sahab 201086 2006 4 15 + 10.1 6,421 0.0 Women
PAHO North America Canada Anonymous 200087 1996-97 4 29.0 23,471 100.0
PAHO North America Canada Birch 200088 1992-93 4 15+ 35.4 23,564
PAHO North America Canada Choiniere 200089 1986-92 4 26.0 23,131
PAHO North America Canada Joseph 200990 1998-2003 5 Varies according to year
36,360 0.0 Pregnant
PAHO North America Canada Lee 200991 1994 4 12 + 24.4 17,626 49.2
PAHO North America Canada Lemstra 200992 2001-03 and 2005
1 26.2 5,948 44.8 Aborigean 10% caucasean 89 %
PAHO North America Canada Mao 200193 1994-97 2 N/A 8,353
PAHO North America Canada Millar 200494 2000-01 4 15-54 7,614 0.0 Pregnant
PAHO North America Canada Millar 200795 2003 4 24.0 33,777
PAHO North America Canada Pomerleau 199796 1990 4 19-100 32.9 61,239
PAHO North America Canada Seguin 200397 1998 7 2,223 0.0 Mothers of 5-month-old children
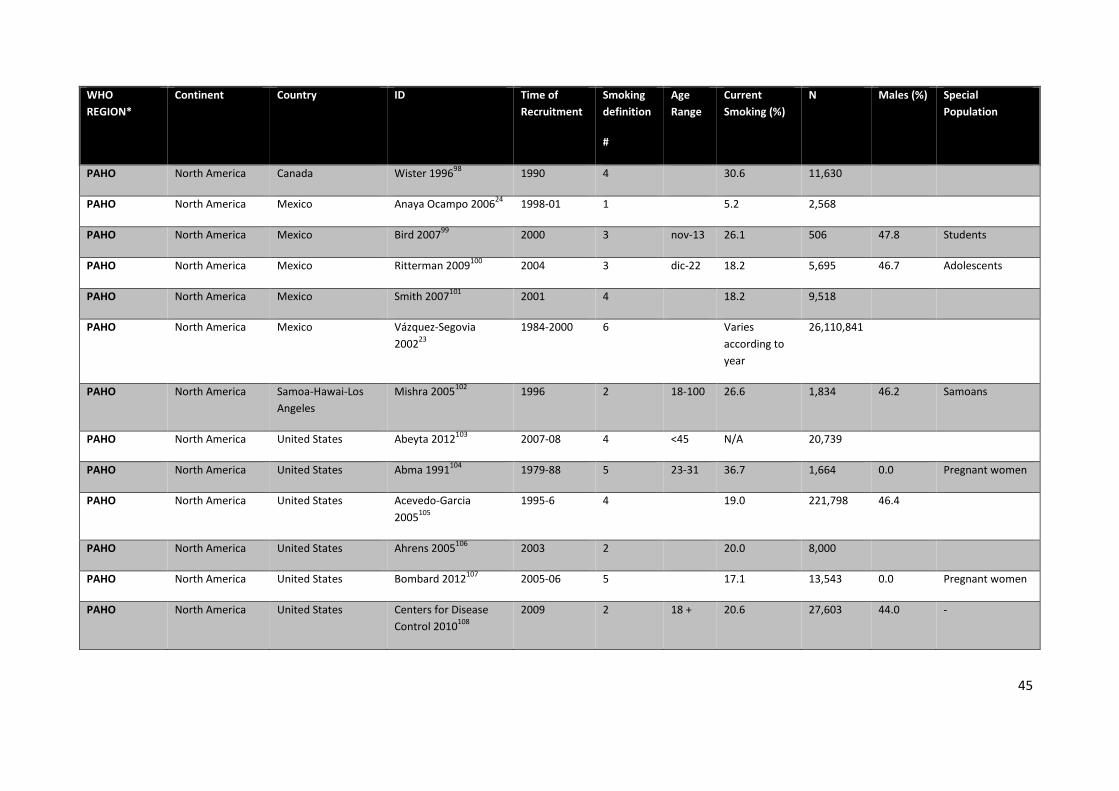
45
WHO REGION*
Continent Country ID Time of Recruitment
Smoking definition
#
Age Range
Current Smoking (%)
N Males (%) Special Population
PAHO North America Canada Wister 199698 1990 4 30.6 11,630
PAHO North America Mexico Anaya Ocampo 200624 1998-01 1 5.2 2,568
PAHO North America Mexico Bird 200799 2000 3 nov-13 26.1 506 47.8 Students
PAHO North America Mexico Ritterman 2009100 2004 3 dic-22 18.2 5,695 46.7 Adolescents
PAHO North America Mexico Smith 2007101 2001 4 18.2 9,518
PAHO North America Mexico Vázquez-Segovia 200223
1984-2000 6 Varies according to year
26,110,841
PAHO North America Samoa-Hawai-Los Angeles
Mishra 2005102 1996 2 18-100 26.6 1,834 46.2 Samoans
PAHO North America United States Abeyta 2012103 2007-08 4 <45 N/A 20,739
PAHO North America United States Abma 1991104 1979-88 5 23-31 36.7 1,664 0.0 Pregnant women
PAHO North America United States Acevedo-Garcia 2005105
1995-6 4 19.0 221,798 46.4
PAHO North America United States Ahrens 2005106 2003 2 20.0 8,000
PAHO North America United States Bombard 2012107 2005-06 5 17.1 13,543 0.0 Pregnant women
PAHO North America United States Centers for Disease Control 2010108
2009 2 18 + 20.6 27,603 44.0 -
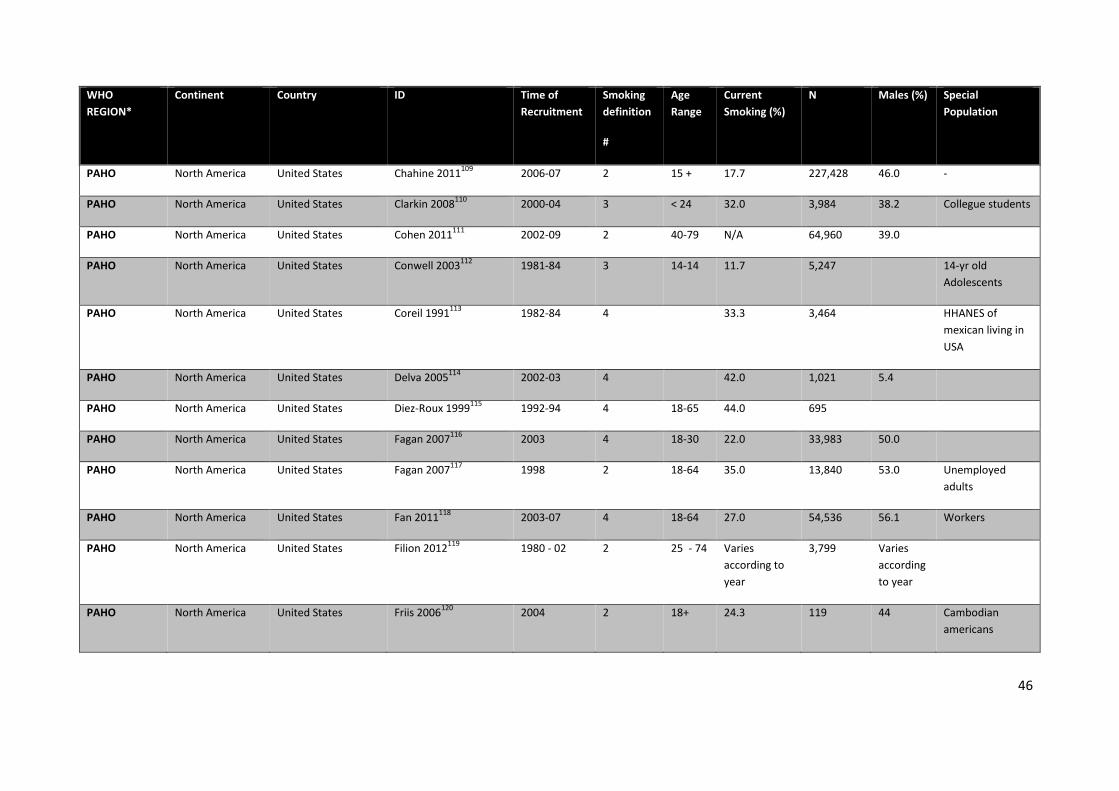
46
WHO REGION*
Continent Country ID Time of Recruitment
Smoking definition
#
Age Range
Current Smoking (%)
N Males (%) Special Population
PAHO North America United States Chahine 2011109 2006-07 2 15 + 17.7 227,428 46.0 -
PAHO North America United States Clarkin 2008110 2000-04 3 < 24 32.0 3,984 38.2 Collegue students
PAHO North America United States Cohen 2011111 2002-09 2 40-79 N/A 64,960 39.0
PAHO North America United States Conwell 2003112 1981-84 3 14-14 11.7 5,247 14-yr old Adolescents
PAHO North America United States Coreil 1991113 1982-84 4 33.3 3,464 HHANES of mexican living in USA
PAHO North America United States Delva 2005114 2002-03 4 42.0 1,021 5.4
PAHO North America United States Diez-Roux 1999115 1992-94 4 18-65 44.0 695
PAHO North America United States Fagan 2007116 2003 4 18-30 22.0 33,983 50.0
PAHO North America United States Fagan 2007117 1998 2 18-64 35.0 13,840 53.0 Unemployed adults
PAHO North America United States Fan 2011118 2003-07 4 18-64 27.0 54,536 56.1 Workers
PAHO North America United States Filion 2012119 1980 - 02 2 25 - 74 Varies according to year
3,799 Varies according to year
PAHO North America United States Friis 2006120 2004 2 18+ 24.3 119 44 Cambodian americans
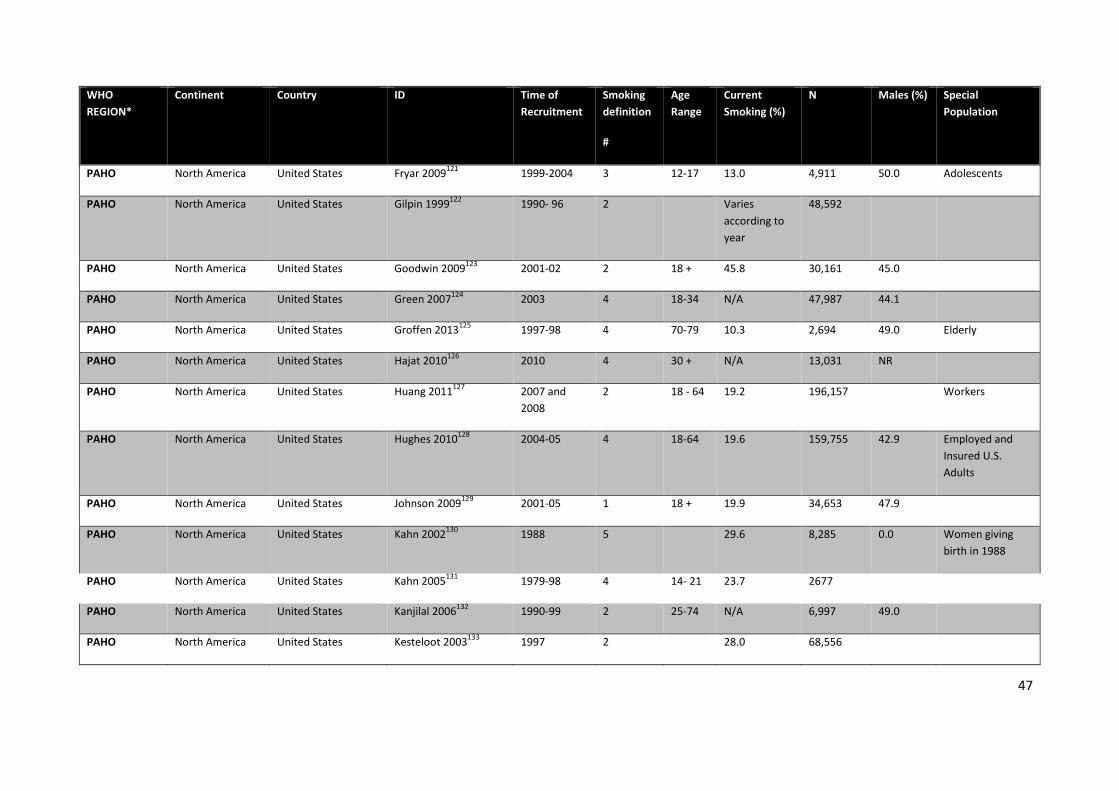
47
WHO REGION*
Continent Country ID Time of Recruitment
Smoking definition
#
Age Range
Current Smoking (%)
N Males (%) Special Population
PAHO North America United States Fryar 2009121 1999-2004 3 12-17 13.0 4,911 50.0 Adolescents
PAHO North America United States Gilpin 1999122 1990- 96 2 Varies according to year
48,592
PAHO North America United States Goodwin 2009123 2001-02 2 18 + 45.8 30,161 45.0
PAHO North America United States Green 2007124 2003 4 18-34 N/A 47,987 44.1
PAHO North America United States Groffen 2013125 1997-98 4 70-79 10.3 2,694 49.0 Elderly
PAHO North America United States Hajat 2010126 2010 4 30 + N/A 13,031 NR
PAHO North America United States Huang 2011127 2007 and 2008
2 18 - 64 19.2 196,157 Workers
PAHO North America United States Hughes 2010128 2004-05 4 18-64 19.6 159,755 42.9 Employed and Insured U.S. Adults
PAHO North America United States Johnson 2009129 2001-05 1 18 + 19.9 34,653 47.9
PAHO North America United States Kahn 2002130 1988 5 29.6 8,285 0.0 Women giving birth in 1988
PAHO North America United States Kahn 2005131 1979-98 4 14- 21 23.7 2677
PAHO North America United States Kanjilal 2006132 1990-99 2 25-74 N/A 6,997 49.0
PAHO North America United States Kesteloot 2003133 1997 2 28.0 68,556
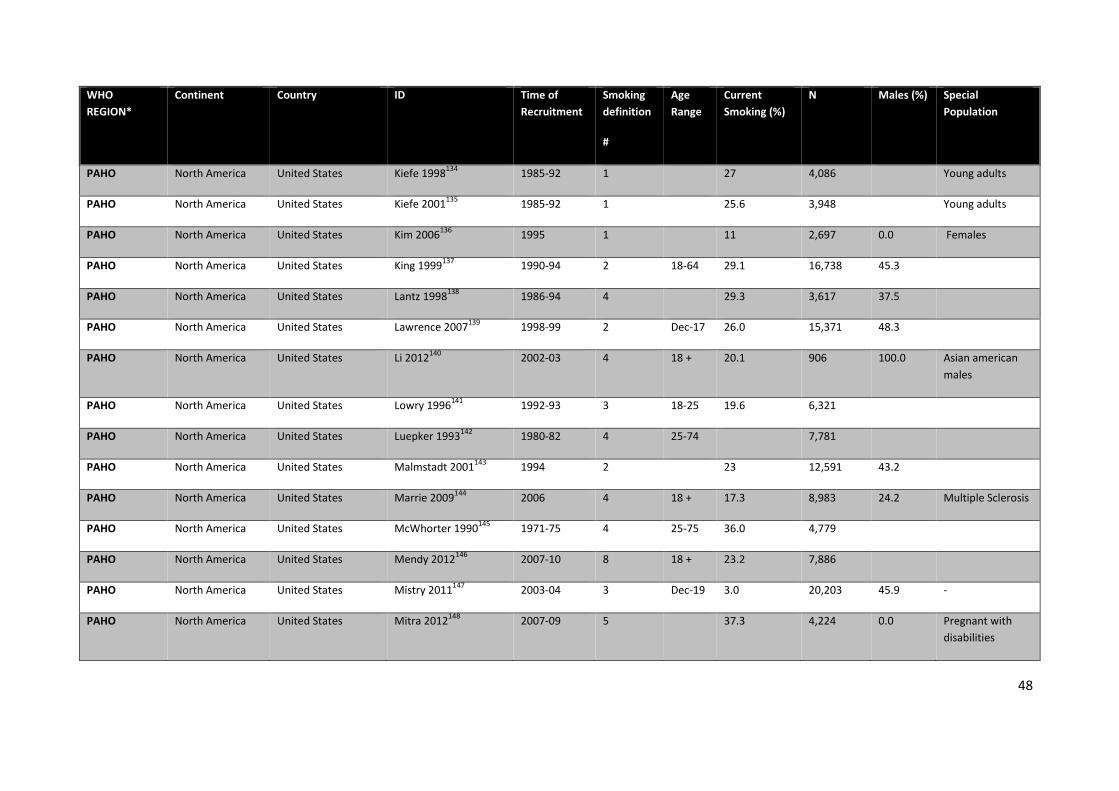
48
WHO REGION*
Continent Country ID Time of Recruitment
Smoking definition
#
Age Range
Current Smoking (%)
N Males (%) Special Population
PAHO North America United States Kiefe 1998134 1985-92 1 27 4,086 Young adults
PAHO North America United States Kiefe 2001135 1985-92 1 25.6 3,948 Young adults
PAHO North America United States Kim 2006136 1995 1 11 2,697 0.0 Females
PAHO North America United States King 1999137 1990-94 2 18-64 29.1 16,738 45.3
PAHO North America United States Lantz 1998138 1986-94 4 29.3 3,617 37.5
PAHO North America United States Lawrence 2007139 1998-99 2 Dec-17 26.0 15,371 48.3
PAHO North America United States Li 2012140 2002-03 4 18 + 20.1 906 100.0 Asian american males
PAHO North America United States Lowry 1996141 1992-93 3 18-25 19.6 6,321
PAHO North America United States Luepker 1993142 1980-82 4 25-74 7,781
PAHO North America United States Malmstadt 2001143 1994 2 23 12,591 43.2
PAHO North America United States Marrie 2009144 2006 4 18 + 17.3 8,983 24.2 Multiple Sclerosis
PAHO North America United States McWhorter 1990145 1971-75 4 25-75 36.0 4,779
PAHO North America United States Mendy 2012146 2007-10 8 18 + 23.2 7,886
PAHO North America United States Mistry 2011147 2003-04 3 Dec-19 3.0 20,203 45.9 -
PAHO North America United States Mitra 2012148 2007-09 5 37.3 4,224 0.0 Pregnant with disabilities
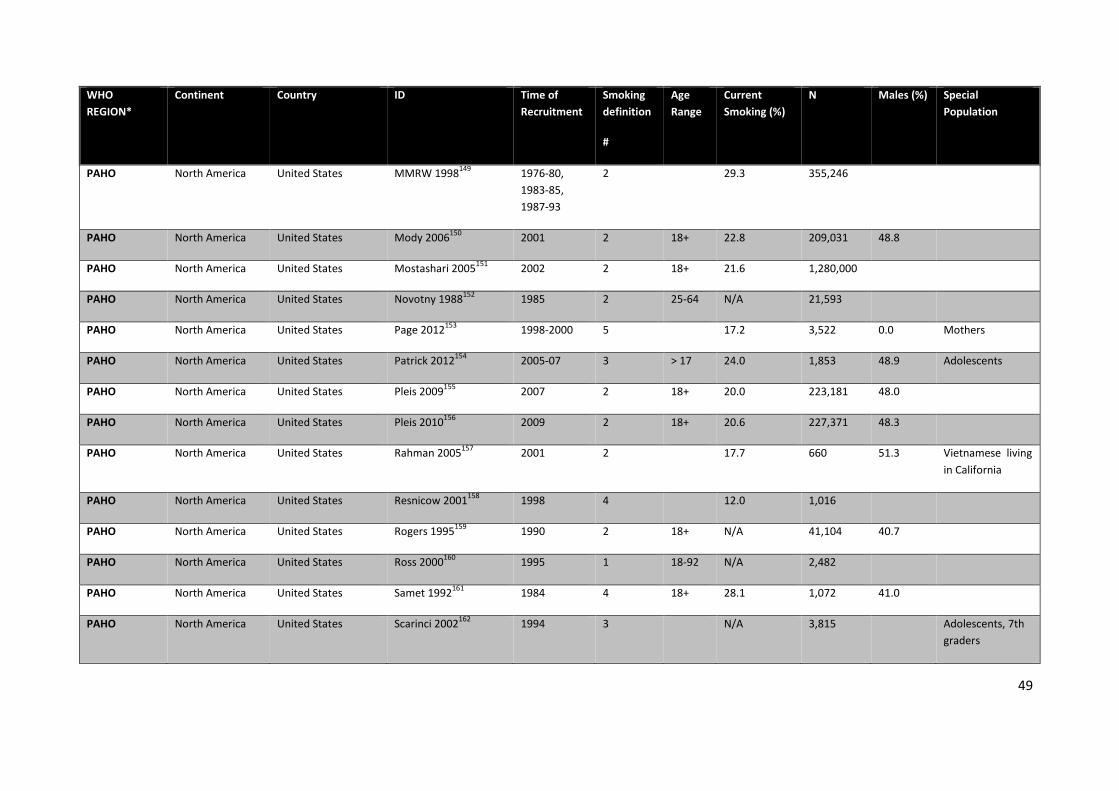
49
WHO REGION*
Continent Country ID Time of Recruitment
Smoking definition
#
Age Range
Current Smoking (%)
N Males (%) Special Population
PAHO North America United States MMRW 1998149 1976-80, 1983-85, 1987-93
2 29.3 355,246
PAHO North America United States Mody 2006150 2001 2 18+ 22.8 209,031 48.8
PAHO North America United States Mostashari 2005151 2002 2 18+ 21.6 1,280,000
PAHO North America United States Novotny 1988152 1985 2 25-64 N/A 21,593
PAHO North America United States Page 2012153 1998-2000 5 17.2 3,522 0.0 Mothers
PAHO North America United States Patrick 2012154 2005-07 3 > 17 24.0 1,853 48.9 Adolescents
PAHO North America United States Pleis 2009155 2007 2 18+ 20.0 223,181 48.0
PAHO North America United States Pleis 2010156 2009 2 18+ 20.6 227,371 48.3
PAHO North America United States Rahman 2005157 2001 2 17.7 660 51.3 Vietnamese living in California
PAHO North America United States Resnicow 2001158 1998 4 12.0 1,016
PAHO North America United States Rogers 1995159 1990 2 18+ N/A 41,104 40.7
PAHO North America United States Ross 2000160 1995 1 18-92 N/A 2,482
PAHO North America United States Samet 1992161 1984 4 18+ 28.1 1,072 41.0
PAHO North America United States Scarinci 2002162 1994 3 N/A 3,815 Adolescents, 7th graders
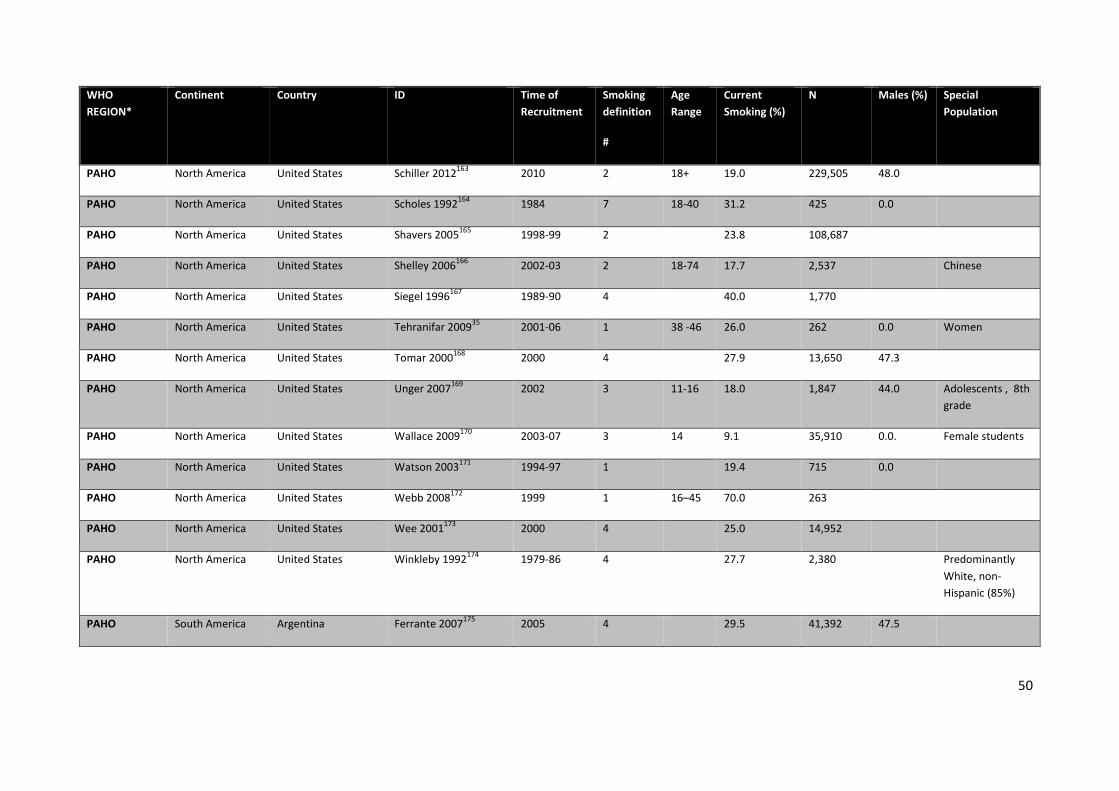
50
WHO REGION*
Continent Country ID Time of Recruitment
Smoking definition
#
Age Range
Current Smoking (%)
N Males (%) Special Population
PAHO North America United States Schiller 2012163 2010 2 18+ 19.0 229,505 48.0
PAHO North America United States Scholes 1992164 1984 7 18-40 31.2 425 0.0
PAHO North America United States Shavers 2005165 1998-99 2 23.8 108,687
PAHO North America United States Shelley 2006166 2002-03 2 18-74 17.7 2,537 Chinese
PAHO North America United States Siegel 1996167 1989-90 4 40.0 1,770
PAHO North America United States Tehranifar 200935 2001-06 1 38 -46 26.0 262 0.0 Women
PAHO North America United States Tomar 2000168 2000 4 27.9 13,650 47.3
PAHO North America United States Unger 2007169 2002 3 11-16 18.0 1,847 44.0 Adolescents , 8th grade
PAHO North America United States Wallace 2009170 2003-07 3 14 9.1 35,910 0.0. Female students
PAHO North America United States Watson 2003171 1994-97 1 19.4 715 0.0
PAHO North America United States Webb 2008172 1999 1 16–45 70.0 263
PAHO North America United States Wee 2001173 2000 4 25.0 14,952
PAHO North America United States Winkleby 1992174 1979-86 4 27.7 2,380 Predominantly White, non-Hispanic (85%)
PAHO South America Argentina Ferrante 2007175 2005 4 29.5 41,392 47.5
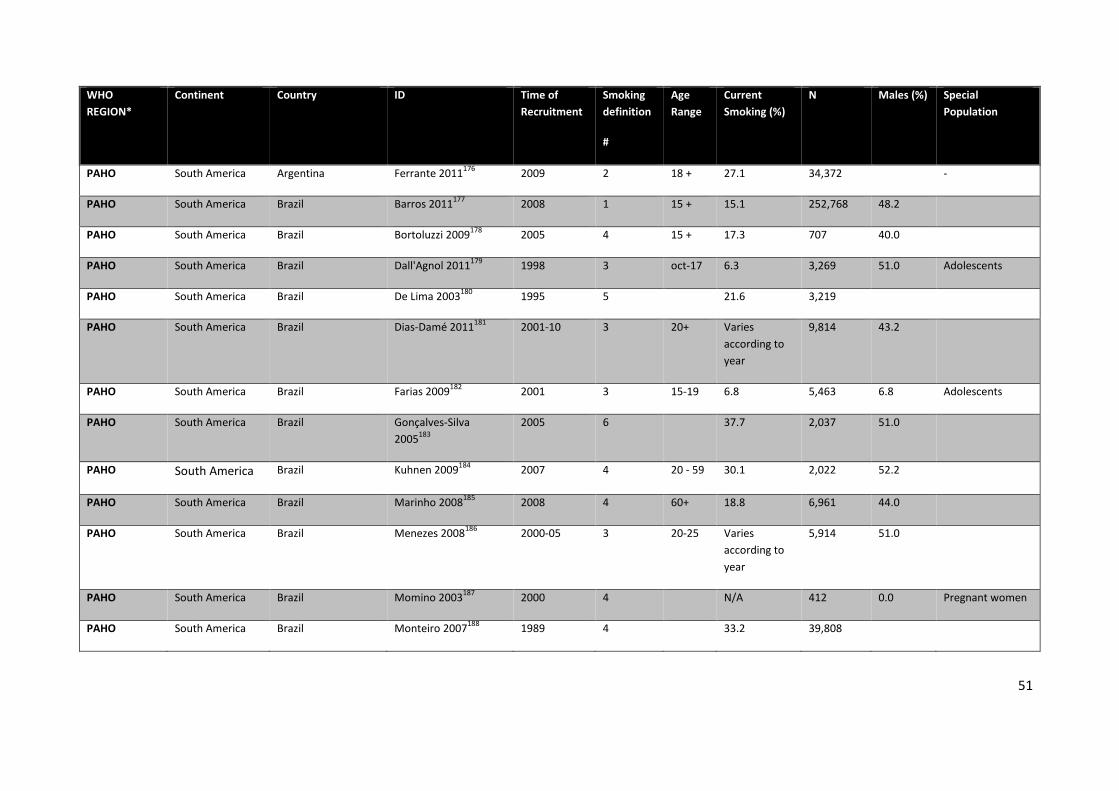
51
WHO REGION*
Continent Country ID Time of Recruitment
Smoking definition
#
Age Range
Current Smoking (%)
N Males (%) Special Population
PAHO South America Argentina Ferrante 2011176 2009 2 18 + 27.1 34,372 -
PAHO South America Brazil Barros 2011177 2008 1 15 + 15.1 252,768 48.2
PAHO South America Brazil Bortoluzzi 2009178 2005 4 15 + 17.3 707 40.0
PAHO South America Brazil Dall'Agnol 2011179 1998 3 oct-17 6.3 3,269 51.0 Adolescents
PAHO South America Brazil De Lima 2003180 1995 5 21.6 3,219
PAHO South America Brazil Dias-Damé 2011181 2001-10 3 20+ Varies according to year
9,814 43.2
PAHO South America Brazil Farias 2009182 2001 3 15-19 6.8 5,463 6.8 Adolescents
PAHO South America Brazil Gonçalves-Silva 2005183
2005 6 37.7 2,037 51.0
PAHO South America Brazil Kuhnen 2009184 2007 4 20 - 59 30.1 2,022 52.2
PAHO South America Brazil Marinho 2008185 2008 4 60+ 18.8 6,961 44.0
PAHO South America Brazil Menezes 2008186 2000-05 3 20-25 Varies according to year
5,914 51.0
PAHO South America Brazil Momino 2003187 2000 4 N/A 412 0.0 Pregnant women
PAHO South America Brazil Monteiro 2007188 1989 4 33.2 39,808
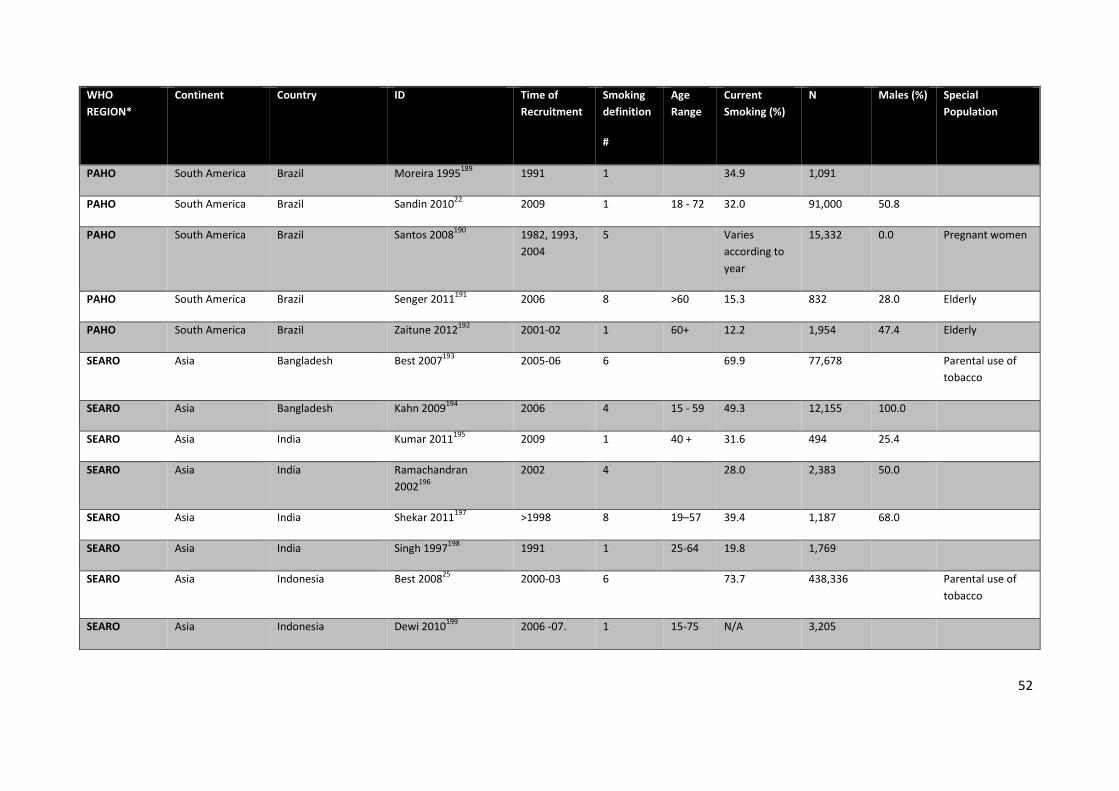
52
WHO REGION*
Continent Country ID Time of Recruitment
Smoking definition
#
Age Range
Current Smoking (%)
N Males (%) Special Population
PAHO South America Brazil Moreira 1995189 1991 1 34.9 1,091
PAHO South America Brazil Sandin 201022 2009 1 18 - 72 32.0 91,000 50.8
PAHO South America Brazil Santos 2008190 1982, 1993, 2004
5 Varies according to year
15,332 0.0 Pregnant women
PAHO South America Brazil Senger 2011191 2006 8 >60 15.3 832 28.0 Elderly
PAHO South America Brazil Zaitune 2012192 2001-02 1 60+ 12.2 1,954 47.4 Elderly
SEARO Asia Bangladesh Best 2007193 2005-06 6 69.9 77,678 Parental use of tobacco
SEARO Asia Bangladesh Kahn 2009194 2006 4 15 - 59 49.3 12,155 100.0
SEARO Asia India Kumar 2011195 2009 1 40 + 31.6 494 25.4
SEARO Asia India Ramachandran 2002196
2002 4 28.0 2,383 50.0
SEARO Asia India Shekar 2011197 >1998 8 19–57 39.4 1,187 68.0
SEARO Asia India Singh 1997198 1991 1 25-64 19.8 1,769
SEARO Asia Indonesia Best 200825 2000-03 6 73.7 438,336 Parental use of tobacco
SEARO Asia Indonesia Dewi 2010199 2006 -07. 1 15-75 N/A 3,205
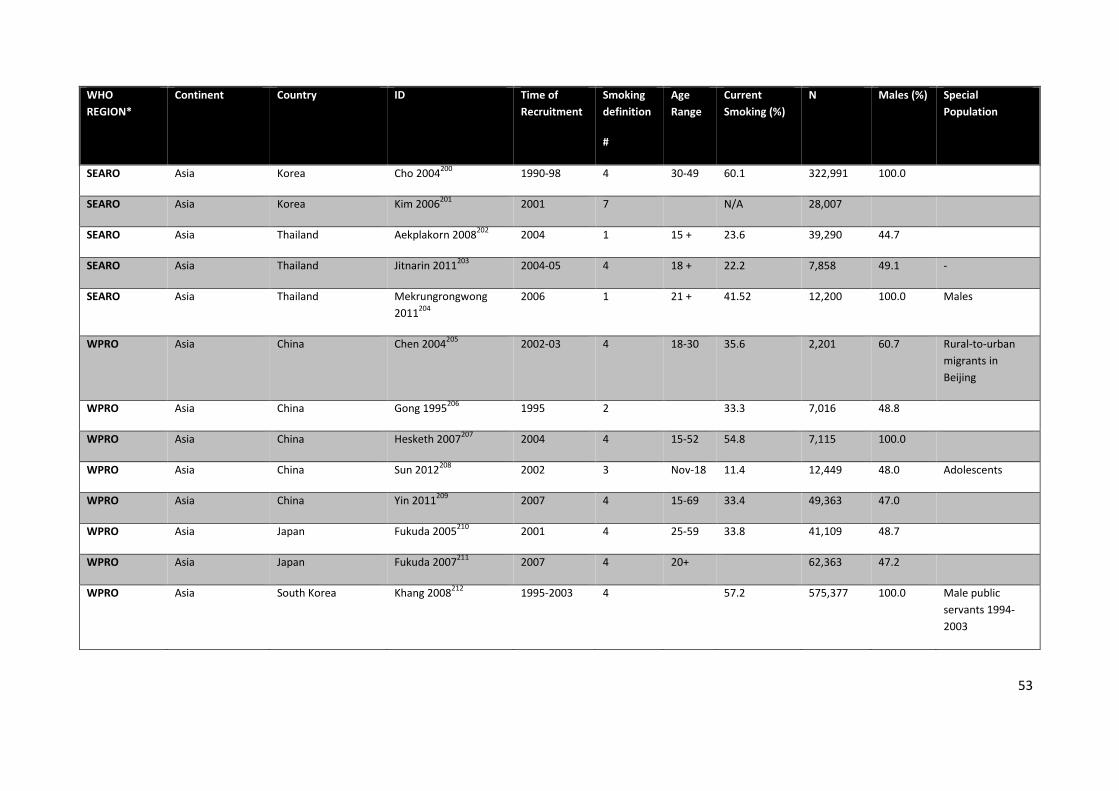
53
WHO REGION*
Continent Country ID Time of Recruitment
Smoking definition
#
Age Range
Current Smoking (%)
N Males (%) Special Population
SEARO Asia Korea Cho 2004200 1990-98 4 30-49 60.1 322,991 100.0
SEARO Asia Korea Kim 2006201 2001 7 N/A 28,007
SEARO Asia Thailand Aekplakorn 2008202 2004 1 15 + 23.6 39,290 44.7
SEARO Asia Thailand Jitnarin 2011203 2004-05 4 18 + 22.2 7,858 49.1 -
SEARO Asia Thailand Mekrungrongwong 2011204
2006 1 21 + 41.52 12,200 100.0 Males
WPRO Asia China Chen 2004205 2002-03 4 18-30 35.6 2,201 60.7 Rural-to-urban migrants in Beijing
WPRO Asia China Gong 1995206 1995 2 33.3 7,016 48.8
WPRO Asia China Hesketh 2007207 2004 4 15-52 54.8 7,115 100.0
WPRO Asia China Sun 2012208 2002 3 Nov-18 11.4 12,449 48.0 Adolescents
WPRO Asia China Yin 2011209 2007 4 15-69 33.4 49,363 47.0
WPRO Asia Japan Fukuda 2005210 2001 4 25-59 33.8 41,109 48.7
WPRO Asia Japan Fukuda 2007211 2007 4 20+ 62,363 47.2
WPRO Asia South Korea Khang 2008212 1995-2003 4 57.2 575,377 100.0 Male public servants 1994-2003
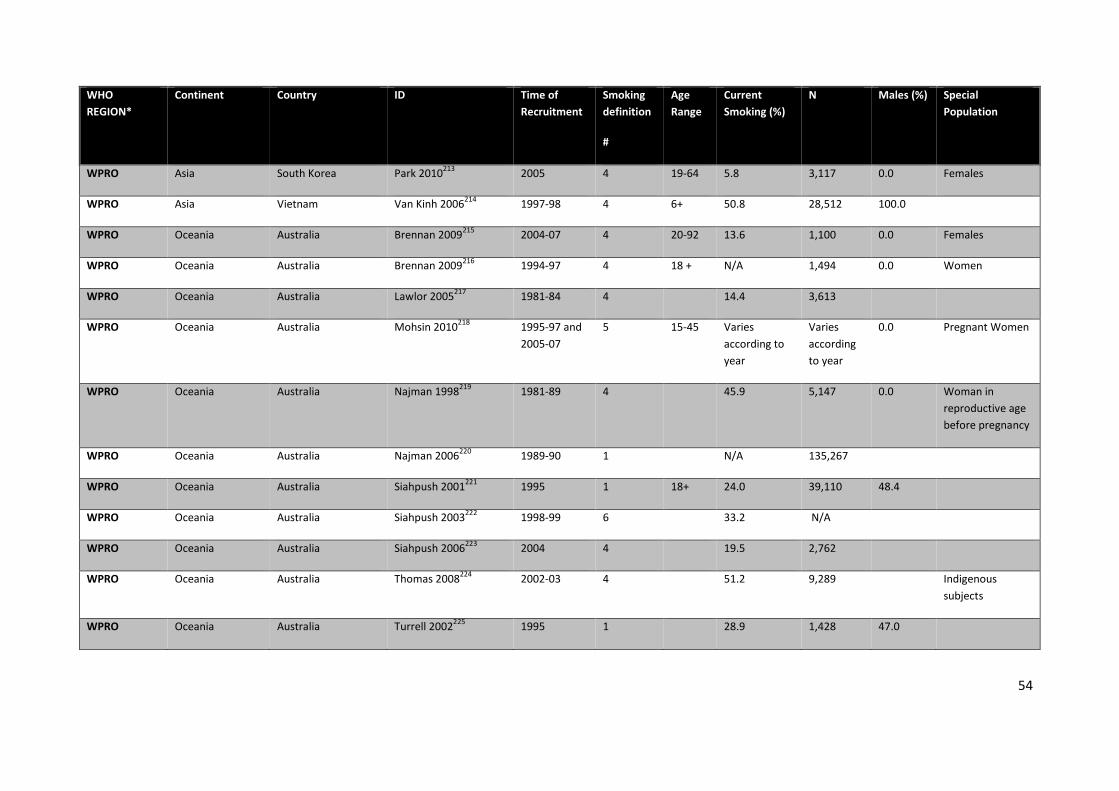
54
WHO REGION*
Continent Country ID Time of Recruitment
Smoking definition
#
Age Range
Current Smoking (%)
N Males (%) Special Population
WPRO Asia South Korea Park 2010213 2005 4 19-64 5.8 3,117 0.0 Females
WPRO Asia Vietnam Van Kinh 2006214 1997-98 4 6+ 50.8 28,512 100.0
WPRO Oceania Australia Brennan 2009215 2004-07 4 20-92 13.6 1,100 0.0 Females
WPRO Oceania Australia Brennan 2009216 1994-97 4 18 + N/A 1,494 0.0 Women
WPRO Oceania Australia Lawlor 2005217 1981-84 4 14.4 3,613
WPRO Oceania Australia Mohsin 2010218 1995-97 and 2005-07
5 15-45 Varies according to year
Varies according to year
0.0 Pregnant Women
WPRO Oceania Australia Najman 1998219 1981-89 4 45.9 5,147 0.0 Woman in reproductive age before pregnancy
WPRO Oceania Australia Najman 2006220 1989-90 1 N/A 135,267
WPRO Oceania Australia Siahpush 2001221 1995 1 18+ 24.0 39,110 48.4
WPRO Oceania Australia Siahpush 2003222 1998-99 6 33.2 N/A
WPRO Oceania Australia Siahpush 2006223 2004 4 19.5 2,762
WPRO Oceania Australia Thomas 2008224 2002-03 4 51.2 9,289 Indigenous subjects
WPRO Oceania Australia Turrell 2002225 1995 1 28.9 1,428 47.0
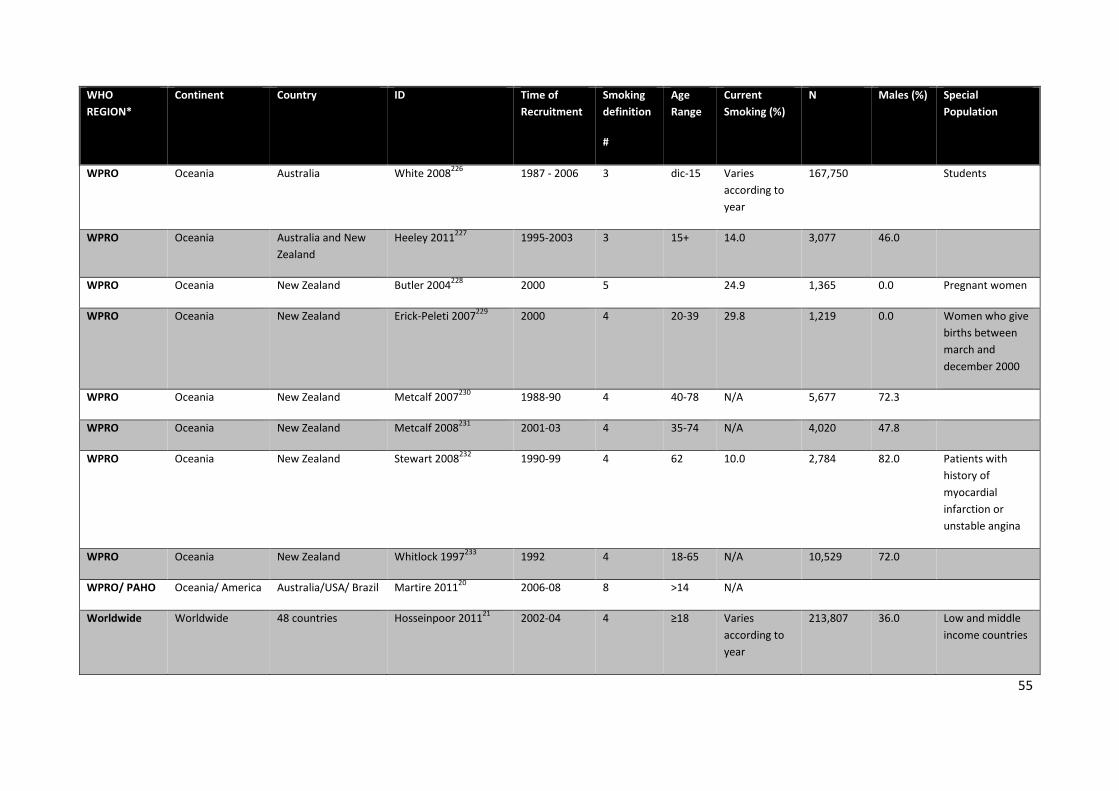
55
WHO REGION*
Continent Country ID Time of Recruitment
Smoking definition
#
Age Range
Current Smoking (%)
N Males (%) Special Population
WPRO Oceania Australia White 2008226 1987 - 2006 3 dic-15 Varies according to year
167,750 Students
WPRO Oceania Australia and New Zealand
Heeley 2011227 1995-2003 3 15+ 14.0 3,077 46.0
WPRO Oceania New Zealand Butler 2004228 2000 5 24.9 1,365 0.0 Pregnant women
WPRO Oceania New Zealand Erick-Peleti 2007229 2000 4 20-39 29.8 1,219 0.0 Women who give births between march and december 2000
WPRO Oceania New Zealand Metcalf 2007230 1988-90 4 40-78 N/A 5,677 72.3
WPRO Oceania New Zealand Metcalf 2008231 2001-03 4 35-74 N/A 4,020 47.8
WPRO Oceania New Zealand Stewart 2008232 1990-99 4 62 10.0 2,784 82.0 Patients with history of myocardial infarction or unstable angina
WPRO Oceania New Zealand Whitlock 1997233 1992 4 18-65 N/A 10,529 72.0
WPRO/ PAHO Oceania/ America Australia/USA/ Brazil Martire 201120 2006-08 8 >14 N/A
Worldwide Worldwide 48 countries Hosseinpoor 201121 2002-04 4 ≥18 Varies according to year
213,807 36.0 Low and middle income countries
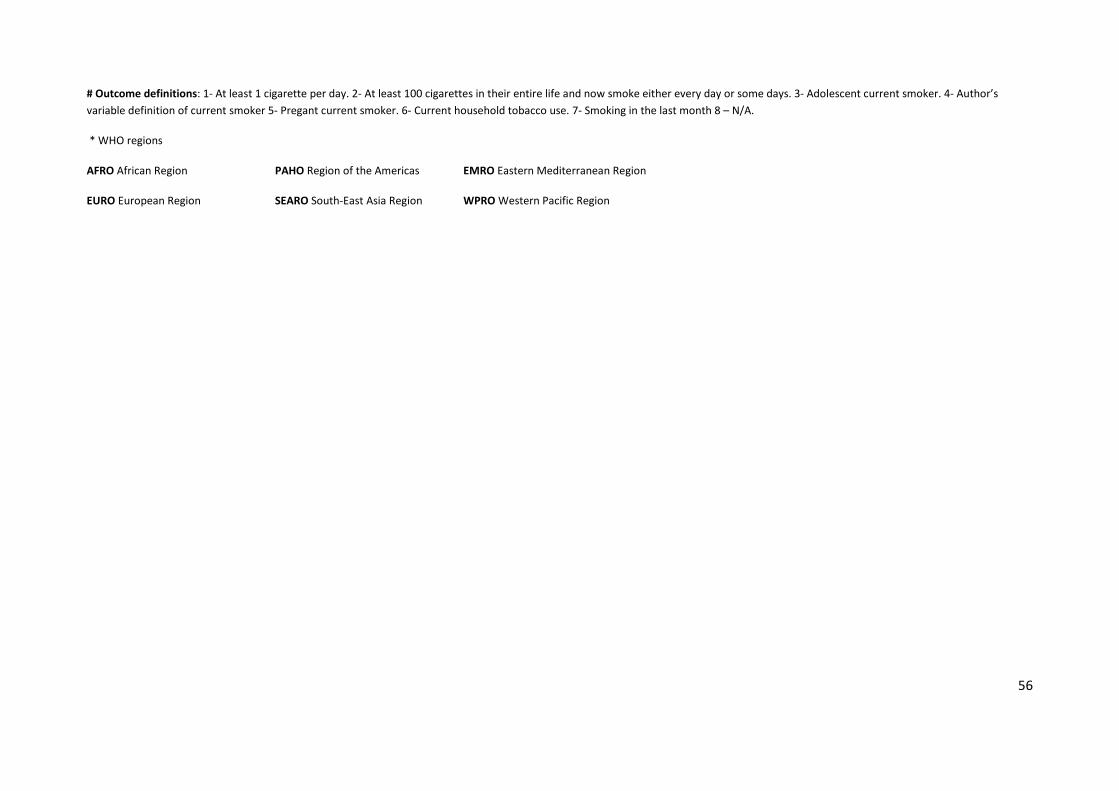
56
# Outcome definitions: 1- At least 1 cigarette per day. 2- At least 100 cigarettes in their entire life and now smoke either every day or some days. 3- Adolescent current smoker. 4- Author’s variable definition of current smoker 5- Pregant current smoker. 6- Current household tobacco use. 7- Smoking in the last month 8 – N/A.
* WHO regions
AFRO African Region PAHO Region of the Americas EMRO Eastern Mediterranean Region
EURO European Region SEARO South-East Asia Region WPRO Western Pacific Region
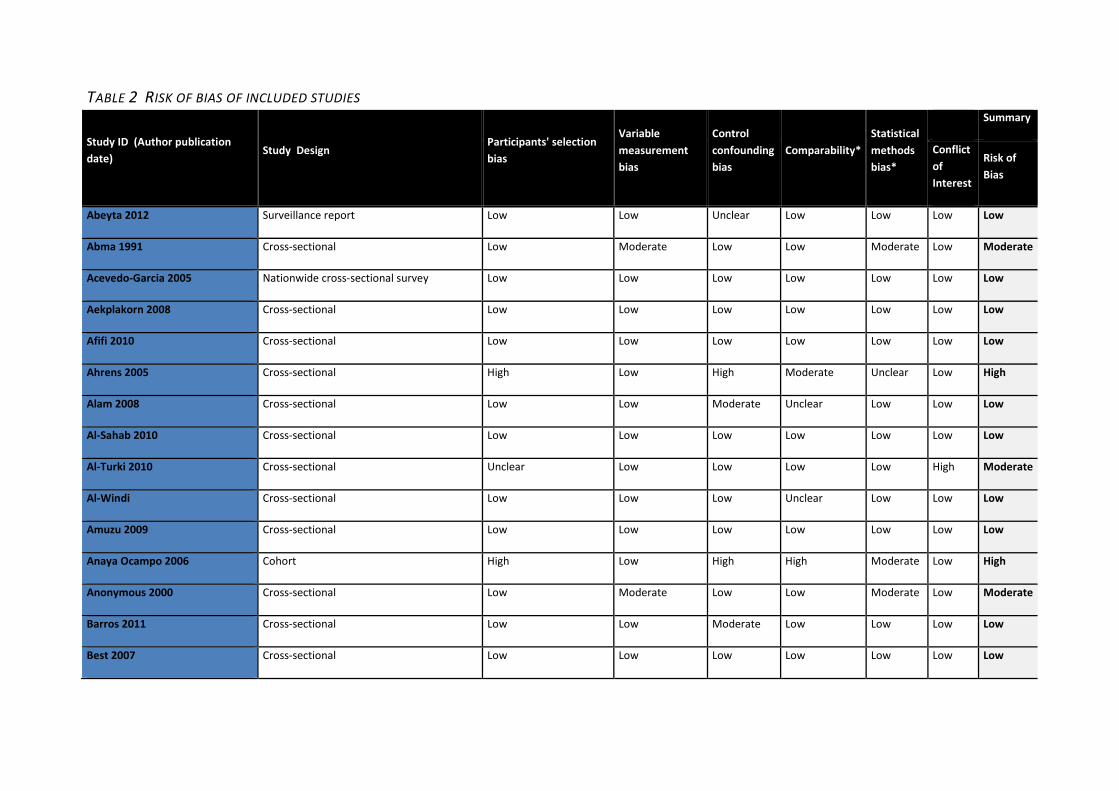
TABLE 2 RISK OF BIAS OF INCLUDED STUDIES
Study ID (Author publication date)
Study Design Participants' selection bias
Variable measurement bias
Control confounding bias
Comparability* Statistical methods bias*
Summary
Conflict of Interest
Risk of Bias
Abeyta 2012 Surveillance report Low Low Unclear Low Low Low Low
Abma 1991 Cross-sectional Low Moderate Low Low Moderate Low Moderate
Acevedo-Garcia 2005 Nationwide cross-sectional survey Low Low Low Low Low Low Low
Aekplakorn 2008 Cross-sectional Low Low Low Low Low Low Low
Afifi 2010 Cross-sectional Low Low Low Low Low Low Low
Ahrens 2005 Cross-sectional High Low High Moderate Unclear Low High
Alam 2008 Cross-sectional Low Low Moderate Unclear Low Low Low
Al-Sahab 2010 Cross-sectional Low Low Low Low Low Low Low
Al-Turki 2010 Cross-sectional Unclear Low Low Low Low High Moderate
Al-Windi Cross-sectional Low Low Low Unclear Low Low Low
Amuzu 2009 Cross-sectional Low Low Low Low Low Low Low
Anaya Ocampo 2006 Cohort High Low High High Moderate Low High
Anonymous 2000 Cross-sectional Low Moderate Low Low Moderate Low Moderate
Barros 2011 Cross-sectional Low Low Moderate Low Low Low Low
Best 2007 Cross-sectional Low Low Low Low Low Low Low
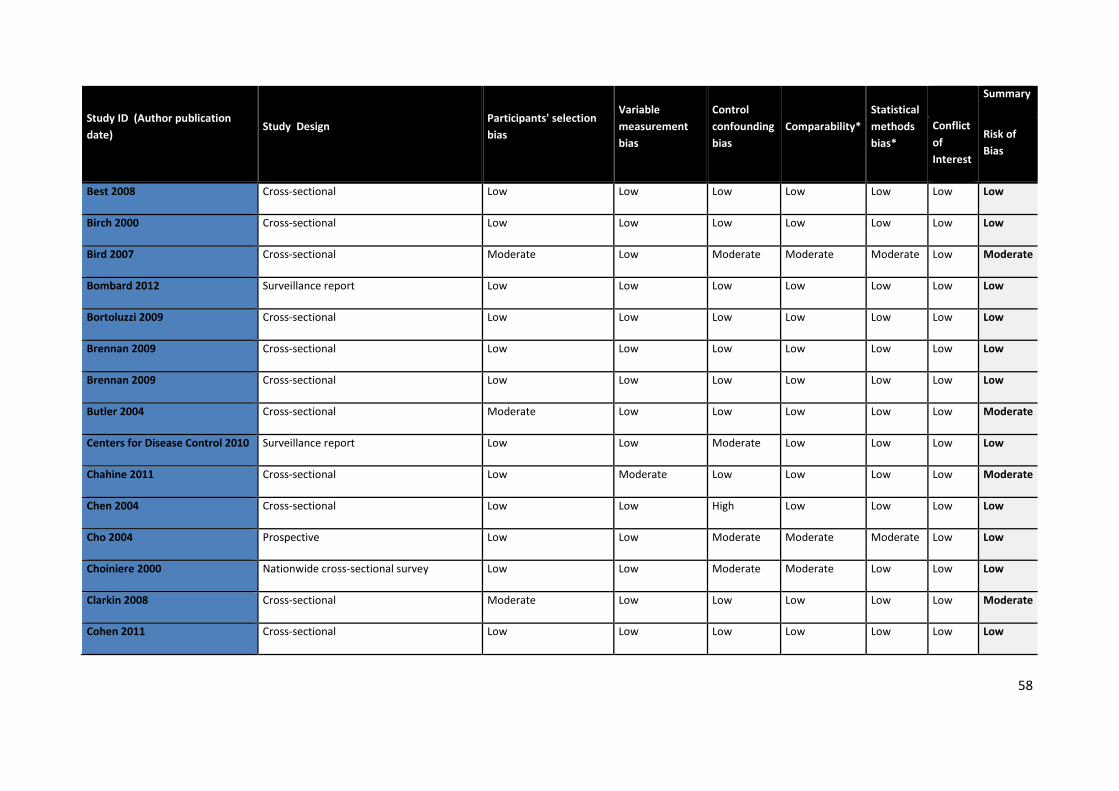
58
Study ID (Author publication date)
Study Design Participants' selection bias
Variable measurement bias
Control confounding bias
Comparability* Statistical methods bias*
Summary
Conflict of Interest
Risk of Bias
Best 2008 Cross-sectional Low Low Low Low Low Low Low
Birch 2000 Cross-sectional Low Low Low Low Low Low Low
Bird 2007 Cross-sectional Moderate Low Moderate Moderate Moderate Low Moderate
Bombard 2012 Surveillance report Low Low Low Low Low Low Low
Bortoluzzi 2009 Cross-sectional Low Low Low Low Low Low Low
Brennan 2009 Cross-sectional Low Low Low Low Low Low Low
Brennan 2009 Cross-sectional Low Low Low Low Low Low Low
Butler 2004 Cross-sectional Moderate Low Low Low Low Low Moderate
Centers for Disease Control 2010 Surveillance report Low Low Moderate Low Low Low Low
Chahine 2011 Cross-sectional Low Moderate Low Low Low Low Moderate
Chen 2004 Cross-sectional Low Low High Low Low Low Low
Cho 2004 Prospective Low Low Moderate Moderate Moderate Low Low
Choiniere 2000 Nationwide cross-sectional survey Low Low Moderate Moderate Low Low Low
Clarkin 2008 Cross-sectional Moderate Low Low Low Low Low Moderate
Cohen 2011 Cross-sectional Low Low Low Low Low Low Low

59
Study ID (Author publication date)
Study Design Participants' selection bias
Variable measurement bias
Control confounding bias
Comparability* Statistical methods bias*
Summary
Conflict of Interest
Risk of Bias
Conwell 2003 Cross-sectional High High High Moderate Moderate Low Very High
Coreil 1991 Cross-sectional High High High High High Low Very High
Dall'Agnol 2011 Cross-sectional High Low Low Low Low Low High
De Lima 2003 Cross-sectional High High High High High Low Very High
De Onis 1991 Nationwide cross-sectional survey Moderate Low Low Low Low Low Moderate
Delva 2005 Community-based Randomized Control Trial Low Low Low Low Low Low Low
Dewi 2010 Cross-sectional Moderate Moderate Moderate Low Low Low Moderate
Dias-Damé 2011 Surveillance report Unclear Low Low Low Low Low Moderate
Diez-Roux 1999 Cross-sectional Low Low Low Low Low Low Low
Diller 2011 Cross-sectional Low Low Unclear Low Low Low Low
Erick-Peleti 2007 Cross-sectional Moderate Moderate Low Moderate Low Low Moderate
Fagan 2007 Cross-sectional Moderate Moderate Low Moderate Low Low Moderate
Fagan 2007 Cross-sectional Moderate Moderate Low Moderate Low Low Moderate
Fan 2011 Surveillance report Low Low Low Low Low Low Low
Farias 2009 Cross-sectional High Low Low Low Low Low High
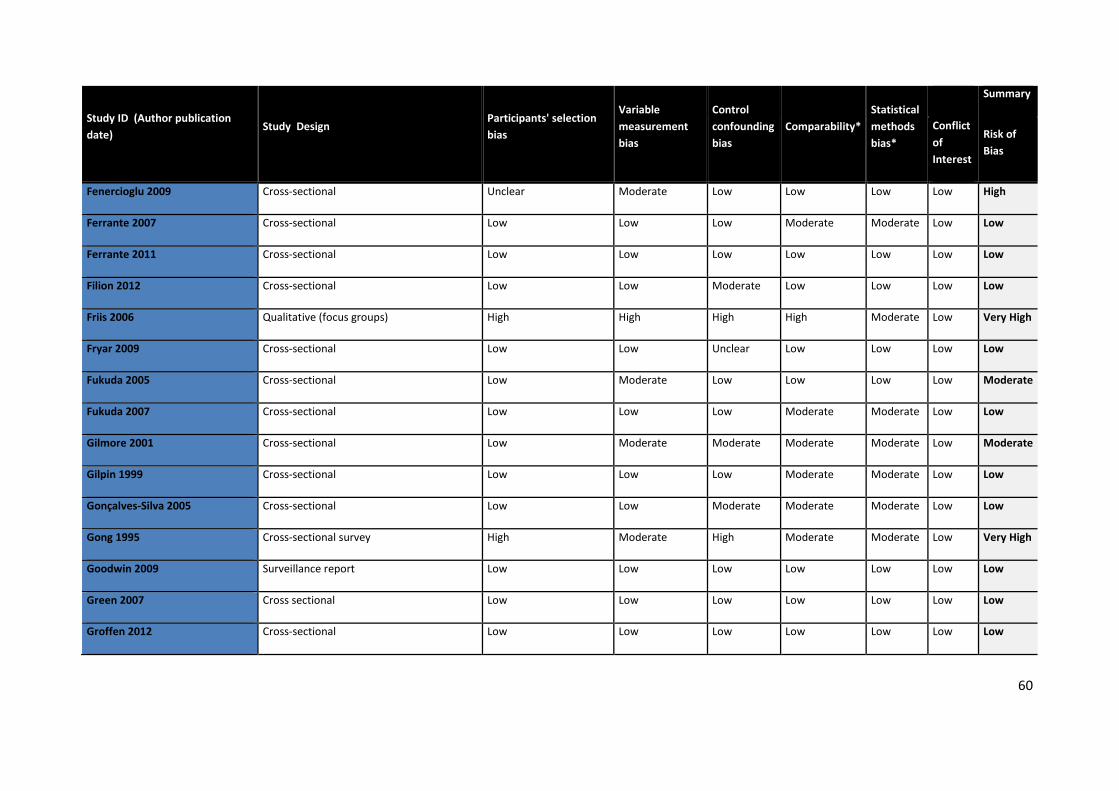
60
Study ID (Author publication date)
Study Design Participants' selection bias
Variable measurement bias
Control confounding bias
Comparability* Statistical methods bias*
Summary
Conflict of Interest
Risk of Bias
Fenercioglu 2009 Cross-sectional Unclear Moderate Low Low Low Low High
Ferrante 2007 Cross-sectional Low Low Low Moderate Moderate Low Low
Ferrante 2011 Cross-sectional Low Low Low Low Low Low Low
Filion 2012 Cross-sectional Low Low Moderate Low Low Low Low
Friis 2006 Qualitative (focus groups) High High High High Moderate Low Very High
Fryar 2009 Cross-sectional Low Low Unclear Low Low Low Low
Fukuda 2005 Cross-sectional Low Moderate Low Low Low Low Moderate
Fukuda 2007 Cross-sectional Low Low Low Moderate Moderate Low Low
Gilmore 2001 Cross-sectional Low Moderate Moderate Moderate Moderate Low Moderate
Gilpin 1999 Cross-sectional Low Low Low Moderate Moderate Low Low
Gonçalves-Silva 2005 Cross-sectional Low Low Moderate Moderate Moderate Low Low
Gong 1995 Cross-sectional survey High Moderate High Moderate Moderate Low Very High
Goodwin 2009 Surveillance report Low Low Low Low Low Low Low
Green 2007 Cross sectional Low Low Low Low Low Low Low
Groffen 2012 Cross-sectional Low Low Low Low Low Low Low

61
Study ID (Author publication date)
Study Design Participants' selection bias
Variable measurement bias
Control confounding bias
Comparability* Statistical methods bias*
Summary
Conflict of Interest
Risk of Bias
Hajat 2010 Cross-sectional Low Low Low Low Low Low Low
Halonen 2012 Surveillance report Low Low Low Low Low Low Low
Heeley 2011 Cross-sectional Low Low Low Low Low Low Low
Hellqvist 2009 Cross-sectional Low High High Low Low Low High
Hesketh2007 Cross-sectional Low Low Moderate Moderate Moderate Low Low
Hiscock 2012 Cross-sectional Low Low Low Low Low Low Low
Hosseinpoor 2011 Cross-sectional Low Low Low Low Low Low Low
Huang 2011 Surveillance report Low Low Low Low Low Low Low
Hughes 2010 Cross-sectional Low Low Low Low Low Low Low
Jitnarin 2011 Cross-sectional Low Low Low Low Low Low Low
Johnson 2009 Retrospective cohort Moderate Unclear Low Unclear Unclear Low High
Joseph 2009 Surveillance report Low Low Unclear Low Low Low Low
Kahn 2002 Cross-sectional Low Moderate Moderate Low Low Low Moderate
Kahn 2005 Prospective Moderate Moderate Moderate Low Low Low Moderate
Kahn 2009 Surveillance report Low Unclear Unclear Low Low Low Moderate

62
Study ID (Author publication date)
Study Design Participants' selection bias
Variable measurement bias
Control confounding bias
Comparability* Statistical methods bias*
Summary
Conflict of Interest
Risk of Bias
Kaleta 2007 Cross-sectional Low Moderate Moderate Moderate Moderate Low Moderate
Kanjilal 2006 Cross-sectional Moderate Low Low Moderate Low Low Moderate
Keles 2003 Prospective population-based study Low Low Moderate Moderate Moderate Low Low
Kesteloot 2003 Cross-sectional Moderate Low Moderate Moderate Moderate Low Moderate
Khang 2008 Prospective Low Low Moderate Moderate Moderate Low Low
Khuwaja 2004 Cross-sectional Moderate Low Low Moderate Moderate Low Moderate
Kiefe 1998 Prospective-study Moderate Low Low Moderate Moderate Low Moderate
Kiefe 2001 Prospective-study Moderate Low Low Moderate Moderate Low Moderate
Kim 2006 Cross-sectional Low Low Moderate Moderate Moderate Low Low
Kim 2006-JPMPH Cross-sectional Low Low Moderate Moderate Moderate Low Moderate
King 1999 Cross-sectional Low Moderate Low Low Moderate Low Moderate
Kuhnen 2009 Cross-sectional Low Low Low Low Low Low Low
Kumar 2011 Cross-sectional Unclear Moderate Low Low Low Low High
La Rosa 2004 Cross-sectional High Moderate Low Low Low Low Very High
Laaksonen 2003 Cross-sectional Moderate Moderate Low Low Low Low Moderate

63
Study ID (Author publication date)
Study Design Participants' selection bias
Variable measurement bias
Control confounding bias
Comparability* Statistical methods bias*
Summary
Conflict of Interest
Risk of Bias
Laaksonen 2005 Cross-sectional Moderate Moderate Low Low Low Low Moderate
Lantz 1998 Cross-sectional Low Moderate High High Moderate Low Moderate
Lawlor 2005 Cross-sectional Moderate Moderate High High Moderate Low Moderate
Lawrence 2007 Cross-sectional Low Low Low Low Low Low Low
Lee 2009 Cross-sectional Low Low Low Low Low Low Low
Leinsalu 2011 Cross-sectional Low Low Low Low Low Low Low
Lemstra 2009 Cross-sectional Low Low Low Low Low Low Low
Li 2012 Cross-sectional Low Low Low Low Low Low Low
Lowry 1996 Cross-sectional Low Low Low Low Low Low Low
Luepker 1993 Cross-sectional Low High High Low Moderate Low High
Malmstadt 2001 Cross-sectional Moderate Low Moderate Moderate Moderate Low Moderate
Mao 2001 Case-control Low Low Low Moderate Moderate Low Low
Marinho 2008 Cross-sectional Low Moderate Low Low Low Low Moderate
Marrie 2009 Cross-sectional Moderate Low Low Low Low Unclear Moderate
Martire 2011 Cross-sectional Low Low Unclear Low Low Low Low

64
Study ID (Author publication date)
Study Design Participants' selection bias
Variable measurement bias
Control confounding bias
Comparability* Statistical methods bias*
Summary
Conflict of Interest
Risk of Bias
McWhorter 1990 Cross-sectional Low Moderate High Moderate Moderate Low Moderate
Mekrungrongwong 2011 Cross-sectional Low Moderate Low Low Low Low Moderate
Mendy 2012 Cross-sectional Low Low Unclear Low Low Low Low
Menezes 2008 Cross-sectional Low Moderate Low Low Low Low Moderate
Merdad 2007 Cross-sectional High High High High High Low Very High
Metcalf 2007 Cross-sectional Unclear Moderate Low Low Low Low High
Metcalf 2008 Cross-sectional Moderate Moderate Low Moderate Low Low Moderate
Mfenyana 2006 Cross-sectional Moderate Moderate Low Low Low Low Moderate
Millar 2004 Cross-sectional Unclear Unclear Low Unclear Low Low High
Millar 2007 Cross-sectional Low Moderate Low Moderate Low Low Moderate
Mishra 2005 Cross-sectional Low Low Low Low Low Low Low
Mistry 2011 Cross-sectional Low Low Low Low Low Low Low
Mitra 2012 Surveillance report Low Low Low Low Low Low Low
MMRW 1998 Cross-sectional survey Moderate Unclear Unclear Unclear Unclear Low High
Mody 2006 Nationwide cross-sectional survey Low Low Low Low Low Low Low
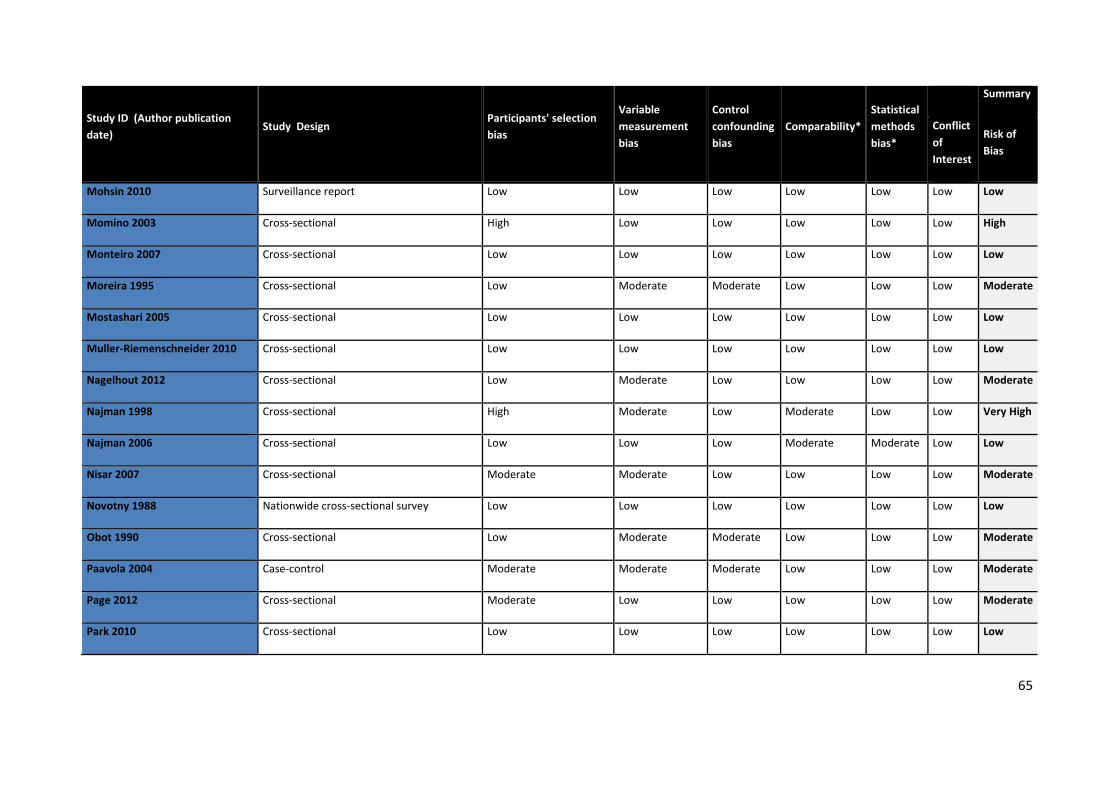
65
Study ID (Author publication date)
Study Design Participants' selection bias
Variable measurement bias
Control confounding bias
Comparability* Statistical methods bias*
Summary
Conflict of Interest
Risk of Bias
Mohsin 2010 Surveillance report Low Low Low Low Low Low Low
Momino 2003 Cross-sectional High Low Low Low Low Low High
Monteiro 2007 Cross-sectional Low Low Low Low Low Low Low
Moreira 1995 Cross-sectional Low Moderate Moderate Low Low Low Moderate
Mostashari 2005 Cross-sectional Low Low Low Low Low Low Low
Muller-Riemenschneider 2010 Cross-sectional Low Low Low Low Low Low Low
Nagelhout 2012 Cross-sectional Low Moderate Low Low Low Low Moderate
Najman 1998 Cross-sectional High Moderate Low Moderate Low Low Very High
Najman 2006 Cross-sectional Low Low Low Moderate Moderate Low Low
Nisar 2007 Cross-sectional Moderate Moderate Low Low Low Low Moderate
Novotny 1988 Nationwide cross-sectional survey Low Low Low Low Low Low Low
Obot 1990 Cross-sectional Low Moderate Moderate Low Low Low Moderate
Paavola 2004 Case-control Moderate Moderate Moderate Low Low Low Moderate
Page 2012 Cross-sectional Moderate Low Low Low Low Low Moderate
Park 2010 Cross-sectional Low Low Low Low Low Low Low
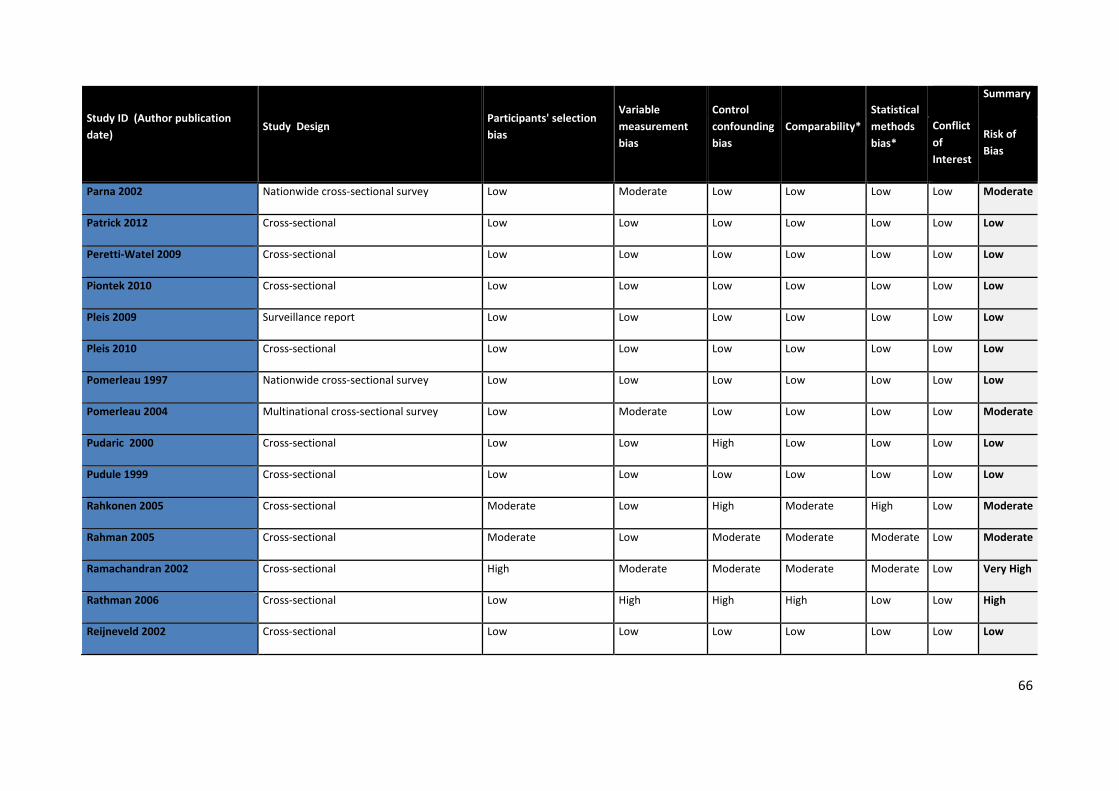
66
Study ID (Author publication date)
Study Design Participants' selection bias
Variable measurement bias
Control confounding bias
Comparability* Statistical methods bias*
Summary
Conflict of Interest
Risk of Bias
Parna 2002 Nationwide cross-sectional survey Low Moderate Low Low Low Low Moderate
Patrick 2012 Cross-sectional Low Low Low Low Low Low Low
Peretti-Watel 2009 Cross-sectional Low Low Low Low Low Low Low
Piontek 2010 Cross-sectional Low Low Low Low Low Low Low
Pleis 2009 Surveillance report Low Low Low Low Low Low Low
Pleis 2010 Cross-sectional Low Low Low Low Low Low Low
Pomerleau 1997 Nationwide cross-sectional survey Low Low Low Low Low Low Low
Pomerleau 2004 Multinational cross-sectional survey Low Moderate Low Low Low Low Moderate
Pudaric 2000 Cross-sectional Low Low High Low Low Low Low
Pudule 1999 Cross-sectional Low Low Low Low Low Low Low
Rahkonen 2005 Cross-sectional Moderate Low High Moderate High Low Moderate
Rahman 2005 Cross-sectional Moderate Low Moderate Moderate Moderate Low Moderate
Ramachandran 2002 Cross-sectional High Moderate Moderate Moderate Moderate Low Very High
Rathman 2006 Cross-sectional Low High High High Low Low High
Reijneveld 2002 Cross-sectional Low Low Low Low Low Low Low
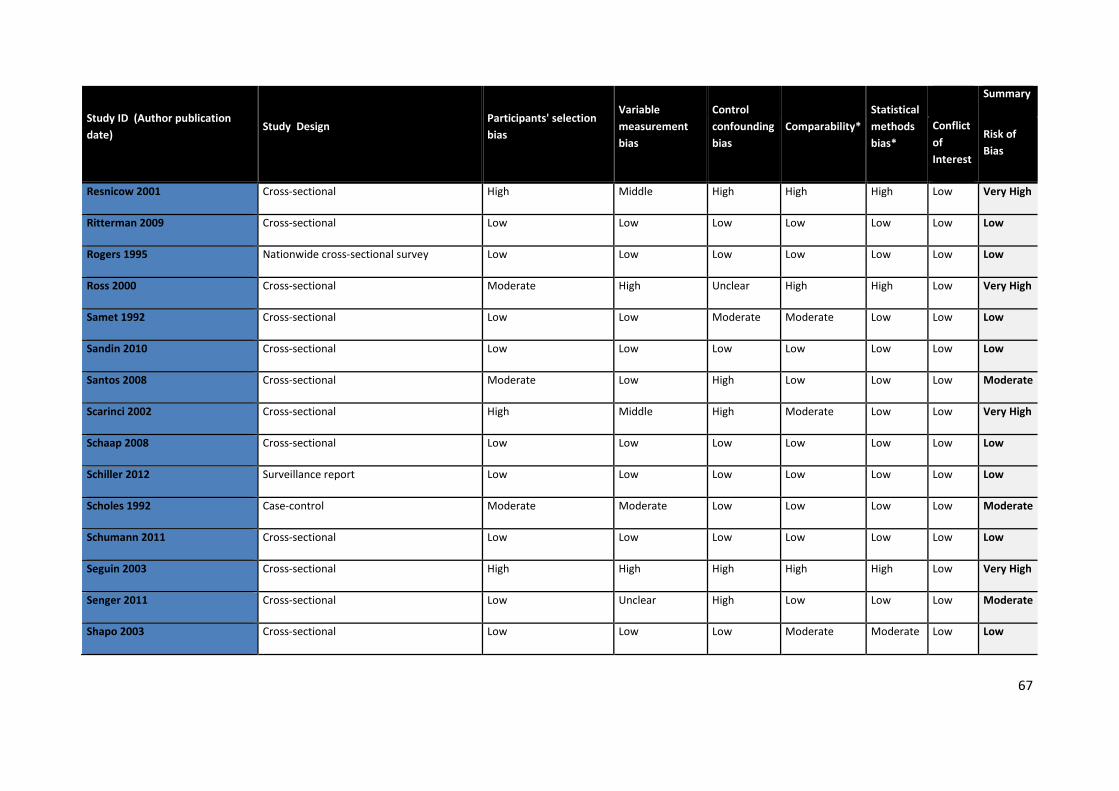
67
Study ID (Author publication date)
Study Design Participants' selection bias
Variable measurement bias
Control confounding bias
Comparability* Statistical methods bias*
Summary
Conflict of Interest
Risk of Bias
Resnicow 2001 Cross-sectional High Middle High High High Low Very High
Ritterman 2009 Cross-sectional Low Low Low Low Low Low Low
Rogers 1995 Nationwide cross-sectional survey Low Low Low Low Low Low Low
Ross 2000 Cross-sectional Moderate High Unclear High High Low Very High
Samet 1992 Cross-sectional Low Low Moderate Moderate Low Low Low
Sandin 2010 Cross-sectional Low Low Low Low Low Low Low
Santos 2008 Cross-sectional Moderate Low High Low Low Low Moderate
Scarinci 2002 Cross-sectional High Middle High Moderate Low Low Very High
Schaap 2008 Cross-sectional Low Low Low Low Low Low Low
Schiller 2012 Surveillance report Low Low Low Low Low Low Low
Scholes 1992 Case-control Moderate Moderate Low Low Low Low Moderate
Schumann 2011 Cross-sectional Low Low Low Low Low Low Low
Seguin 2003 Cross-sectional High High High High High Low Very High
Senger 2011 Cross-sectional Low Unclear High Low Low Low Moderate
Shapo 2003 Cross-sectional Low Low Low Moderate Moderate Low Low
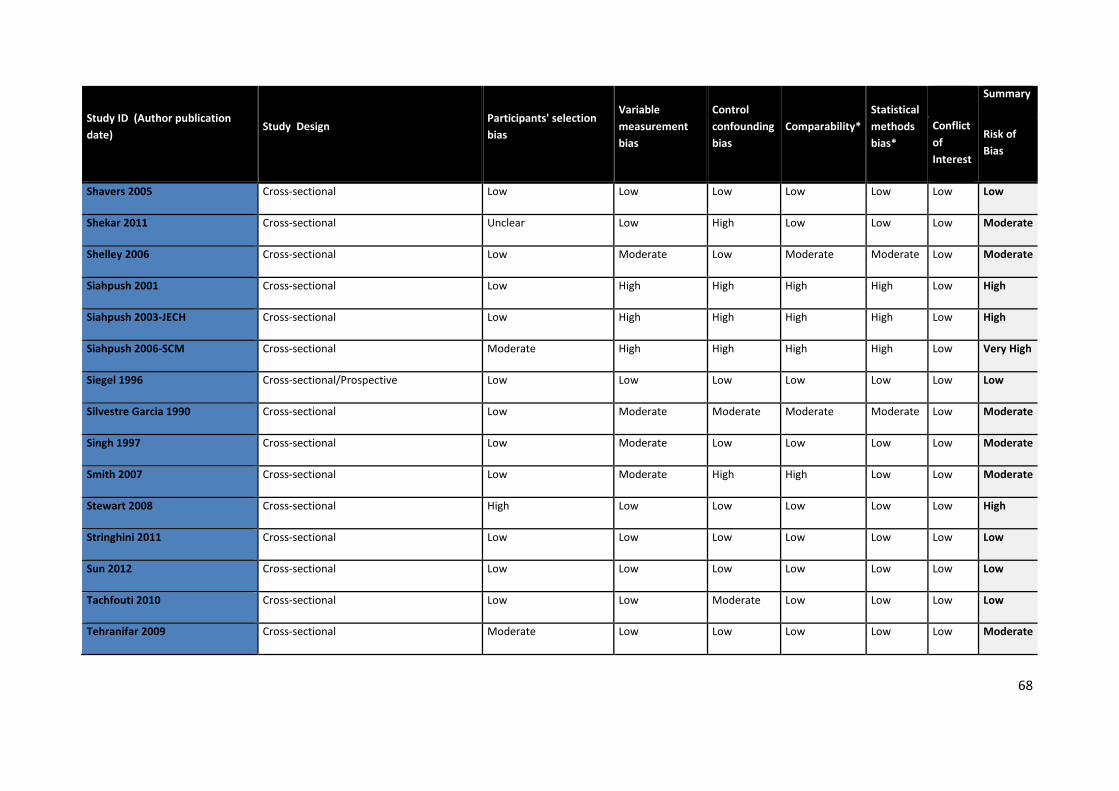
68
Study ID (Author publication date)
Study Design Participants' selection bias
Variable measurement bias
Control confounding bias
Comparability* Statistical methods bias*
Summary
Conflict of Interest
Risk of Bias
Shavers 2005 Cross-sectional Low Low Low Low Low Low Low
Shekar 2011 Cross-sectional Unclear Low High Low Low Low Moderate
Shelley 2006 Cross-sectional Low Moderate Low Moderate Moderate Low Moderate
Siahpush 2001 Cross-sectional Low High High High High Low High
Siahpush 2003-JECH Cross-sectional Low High High High High Low High
Siahpush 2006-SCM Cross-sectional Moderate High High High High Low Very High
Siegel 1996 Cross-sectional/Prospective Low Low Low Low Low Low Low
Silvestre Garcia 1990 Cross-sectional Low Moderate Moderate Moderate Moderate Low Moderate
Singh 1997 Cross-sectional Low Moderate Low Low Low Low Moderate
Smith 2007 Cross-sectional Low Moderate High High Low Low Moderate
Stewart 2008 Cross-sectional High Low Low Low Low Low High
Stringhini 2011 Cross-sectional Low Low Low Low Low Low Low
Sun 2012 Cross-sectional Low Low Low Low Low Low Low
Tachfouti 2010 Cross-sectional Low Low Moderate Low Low Low Low
Tehranifar 2009 Cross-sectional Moderate Low Low Low Low Low Moderate

69
Study ID (Author publication date)
Study Design Participants' selection bias
Variable measurement bias
Control confounding bias
Comparability* Statistical methods bias*
Summary
Conflict of Interest
Risk of Bias
Thomas 2008 Cross-sectional Low Low Moderate Moderate Moderate Low Low
Tomar 2000 Cross-sectional Low Low Low Moderate Moderate Low Low
Turrell 2002 Nationwide cross-sectional survey Low Low Low Low Low Low Low
Unger 2007 Cross-sectional Moderate Low Low Low Low Low Moderate
Van Kinh 2006 Cross-sectional Moderate Low Low Low Low Low Moderate
vanWalbeek 2002 Cross-sectional Moderate Moderate Low Low Low Low Moderate
Vázquez-Segovia 2002 Nationwide cross-sectional survey Low Low Low Low Low Low Low
Virtanen 2007 Cross-sectional High Low Low Low Low Low High
Vorster 2007 Cross-sectional Moderate Low Low Low Low Low Moderate
Wallace Jr 2009 Cross-sectional Unclear Low Low Low Low Low Moderate
Watson 2003 Cohort High Low Low Low Low Low High
Webb 2008 Cross-sectional High Low Low Low Low Low High
Wee 2001 Nationwide cross-sectional survey Low Low Low Low Low Low Low
White 2008 Cross-sectional Low Moderate Low Low Low Low Moderate
Whitlock 1997 Cross-sectional Moderate Low Moderate Moderate Moderate Low Moderate
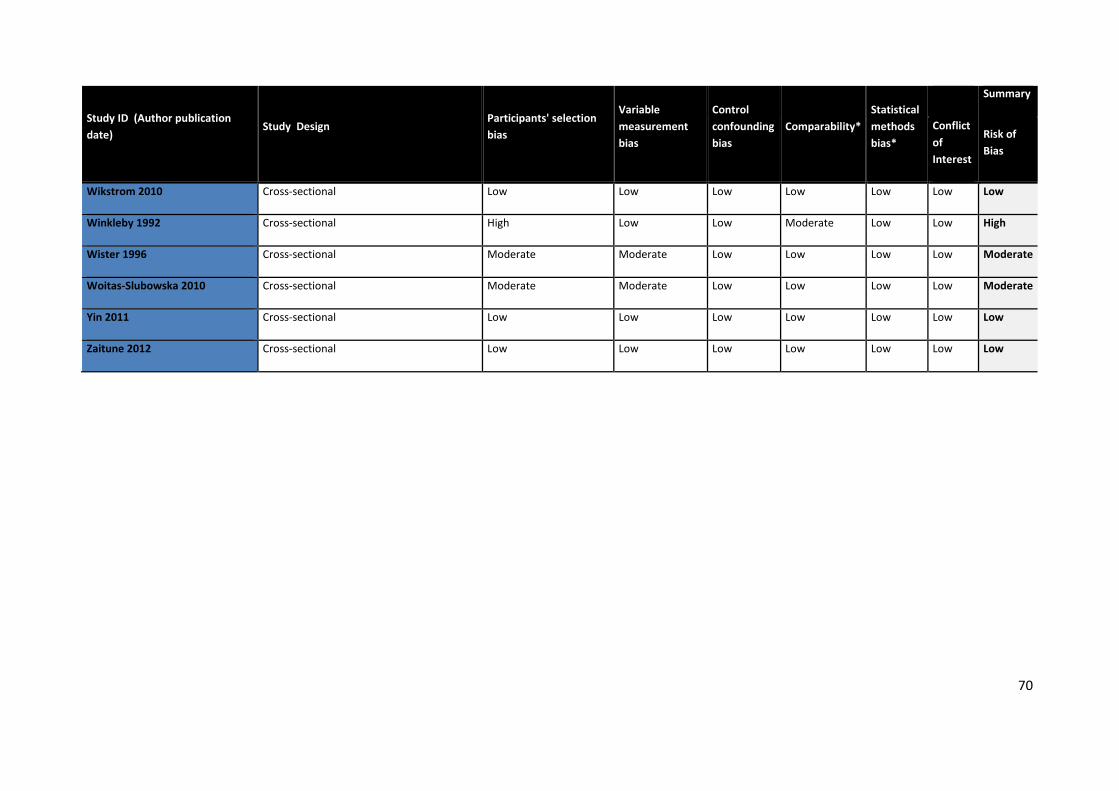
70
Study ID (Author publication date)
Study Design Participants' selection bias
Variable measurement bias
Control confounding bias
Comparability* Statistical methods bias*
Summary
Conflict of Interest
Risk of Bias
Wikstrom 2010 Cross-sectional Low Low Low Low Low Low Low
Winkleby 1992 Cross-sectional High Low Low Moderate Low Low High
Wister 1996 Cross-sectional Moderate Moderate Low Low Low Low Moderate
Woitas-Slubowska 2010 Cross-sectional Moderate Moderate Low Low Low Low Moderate
Yin 2011 Cross-sectional Low Low Low Low Low Low Low
Zaitune 2012 Cross-sectional Low Low Low Low Low Low Low
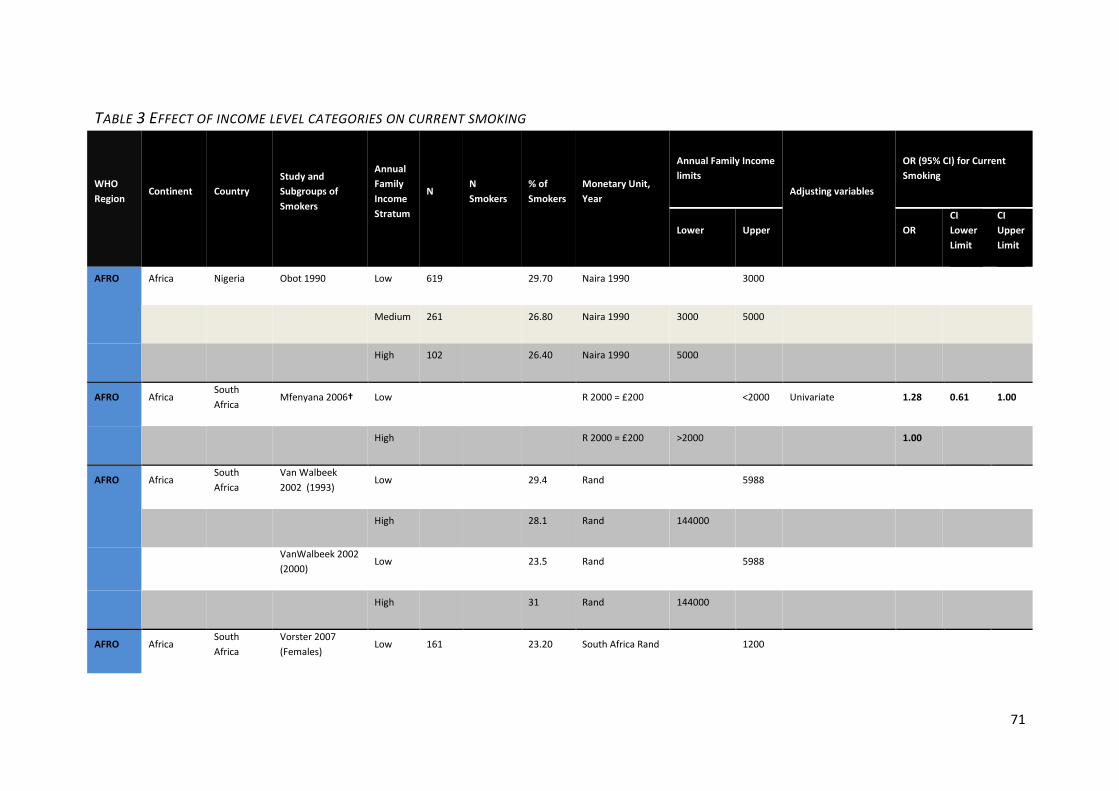
71
TABLE 3 EFFECT OF INCOME LEVEL CATEGORIES ON CURRENT SMOKING
WHO Region
Continent Country Study and Subgroups of Smokers
Annual Family Income Stratum
N N Smokers
% of Smokers
Monetary Unit, Year
Annual Family Income limits
Adjusting variables
OR (95% CI) for Current Smoking
Lower Upper OR CI Lower Limit
CI Upper Limit
AFRO Africa Nigeria Obot 1990 Low 619
29.70 Naira 1990
3000
Medium 261 26.80 Naira 1990 3000 5000
High 102 26.40 Naira 1990 5000
AFRO Africa South Africa
Mfenyana 2006† Low
R 2000 = £200
<2000 Univariate 1.28 0.61 1.00
High R 2000 = £200 >2000 1.00
AFRO Africa South Africa
Van Walbeek 2002 (1993)
Low
29.4 Rand
5988
High 28.1 Rand 144000
VanWalbeek 2002 (2000)
Low
23.5 Rand
5988
High 31 Rand 144000
AFRO Africa South Africa
Vorster 2007 (Females)
Low 161
23.20 South Africa Rand
1200
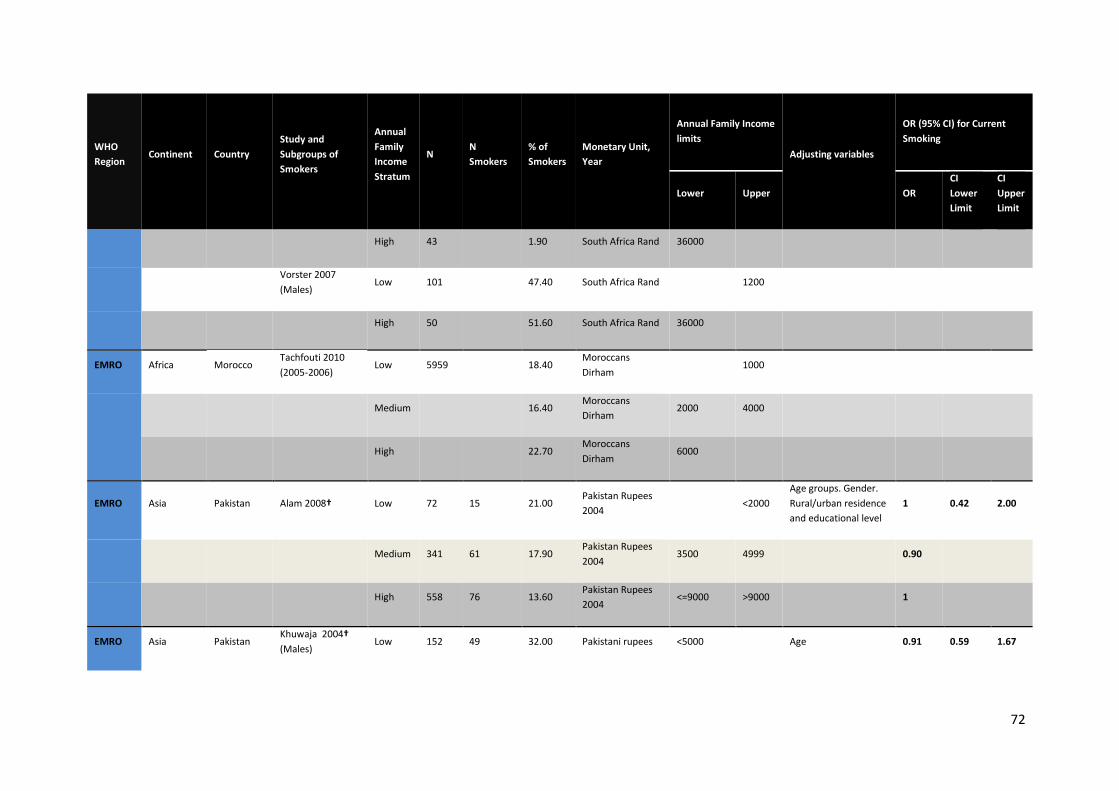
72
WHO Region
Continent Country Study and Subgroups of Smokers
Annual Family Income Stratum
N N Smokers
% of Smokers
Monetary Unit, Year
Annual Family Income limits
Adjusting variables
OR (95% CI) for Current Smoking
Lower Upper OR CI Lower Limit
CI Upper Limit
High 43 1.90 South Africa Rand 36000
Vorster 2007 (Males)
Low 101
47.40 South Africa Rand
1200
High 50 51.60 South Africa Rand 36000
EMRO Africa Morocco Tachfouti 2010 (2005-2006)
Low 5959 18.40 Moroccans Dirham
1000
Medium
16.40 Moroccans Dirham
2000 4000
High
22.70 Moroccans Dirham
6000
EMRO Asia Pakistan Alam 2008† Low 72 15 21.00 Pakistan Rupees 2004
<2000 Age groups. Gender. Rural/urban residence and educational level
1 0.42 2.00
Medium 341 61 17.90 Pakistan Rupees 2004
3500 4999 0.90
High 558 76 13.60 Pakistan Rupees 2004
<=9000 >9000 1
EMRO Asia Pakistan Khuwaja 2004† (Males)
Low 152 49 32.00 Pakistani rupees <5000
Age 0.91 0.59 1.67
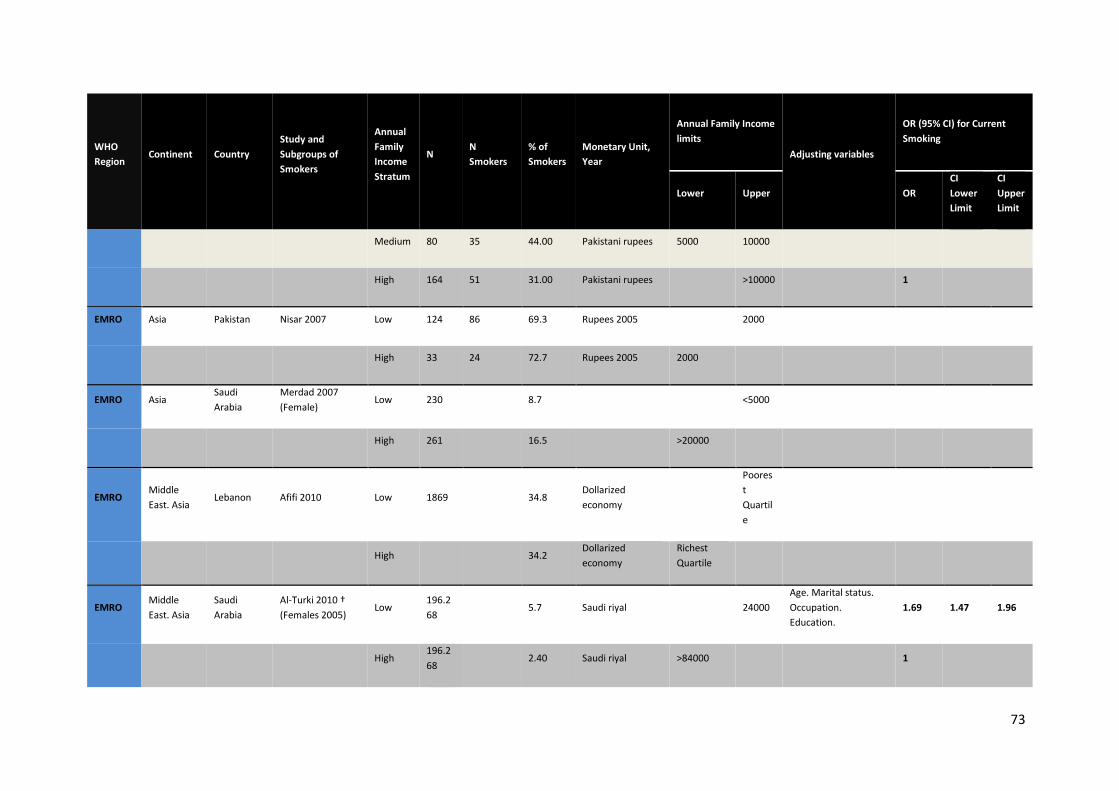
73
WHO Region
Continent Country Study and Subgroups of Smokers
Annual Family Income Stratum
N N Smokers
% of Smokers
Monetary Unit, Year
Annual Family Income limits
Adjusting variables
OR (95% CI) for Current Smoking
Lower Upper OR CI Lower Limit
CI Upper Limit
Medium 80 35 44.00 Pakistani rupees 5000 10000
High 164 51 31.00 Pakistani rupees >10000 1
EMRO Asia Pakistan Nisar 2007 Low 124 86 69.3 Rupees 2005
2000
High 33 24 72.7 Rupees 2005 2000
EMRO Asia Saudi Arabia
Merdad 2007 (Female)
Low 230
8.7
<5000
High 261 16.5 >20000
EMRO Middle East. Asia
Lebanon Afifi 2010 Low 1869 34.8 Dollarized economy
Poorest Quartile
High 34.2 Dollarized economy
Richest Quartile
EMRO Middle East. Asia
Saudi Arabia
Al-Turki 2010 † (Females 2005)
Low 196.268
5.7 Saudi riyal 24000 Age. Marital status. Occupation. Education.
1.69 1.47 1.96
High 196.268
2.40 Saudi riyal >84000 1
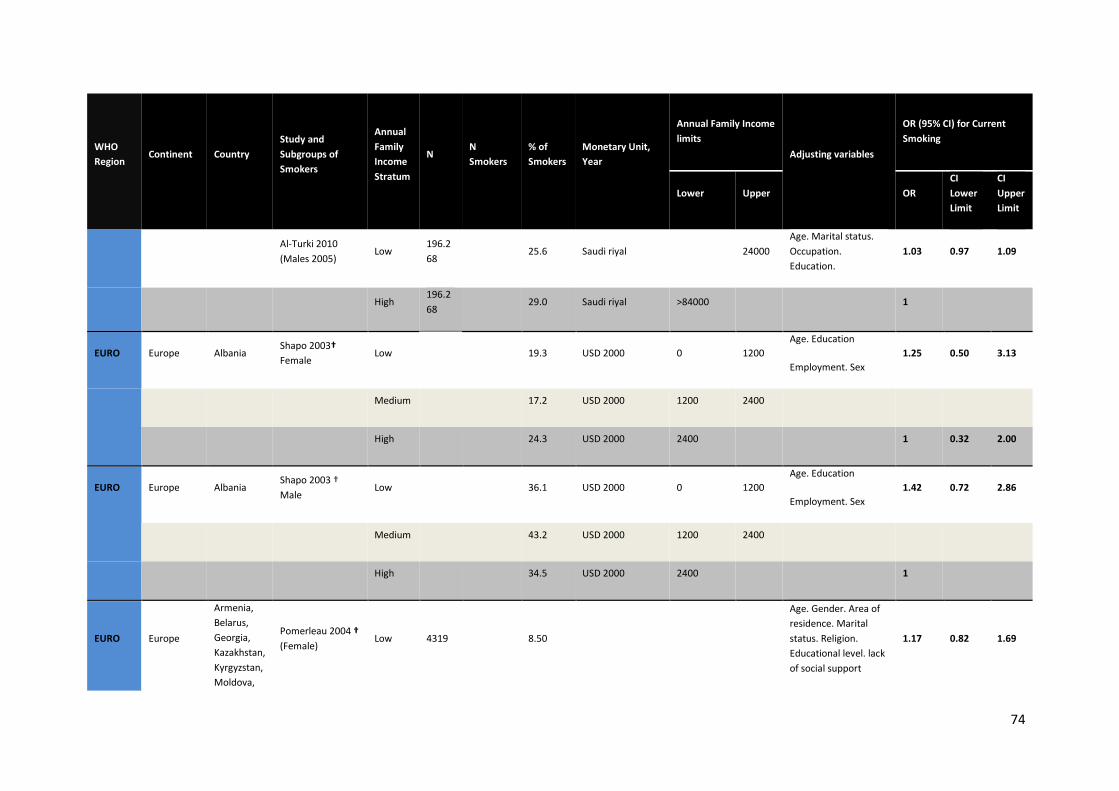
74
WHO Region
Continent Country Study and Subgroups of Smokers
Annual Family Income Stratum
N N Smokers
% of Smokers
Monetary Unit, Year
Annual Family Income limits
Adjusting variables
OR (95% CI) for Current Smoking
Lower Upper OR CI Lower Limit
CI Upper Limit
Al-Turki 2010 (Males 2005)
Low 196.268
25.6 Saudi riyal 24000 Age. Marital status. Occupation. Education.
1.03 0.97 1.09
High 196.268
29.0 Saudi riyal >84000 1
EURO Europe Albania Shapo 2003† Female
Low
19.3 USD 2000 0 1200 Age. Education
Employment. Sex 1.25 0.50 3.13
Medium 17.2 USD 2000 1200 2400
High 24.3 USD 2000 2400 1 0.32 2.00
EURO Europe Albania Shapo 2003 † Male
Low
36.1 USD 2000 0 1200 Age. Education
Employment. Sex 1.42 0.72 2.86
Medium 43.2 USD 2000 1200 2400
High 34.5 USD 2000 2400
1
EURO Europe
Armenia, Belarus, Georgia, Kazakhstan, Kyrgyzstan, Moldova,
Pomerleau 2004 † (Female)
Low 4319
8.50
Age. Gender. Area of residence. Marital status. Religion. Educational level. lack of social support
1.17 0.82 1.69
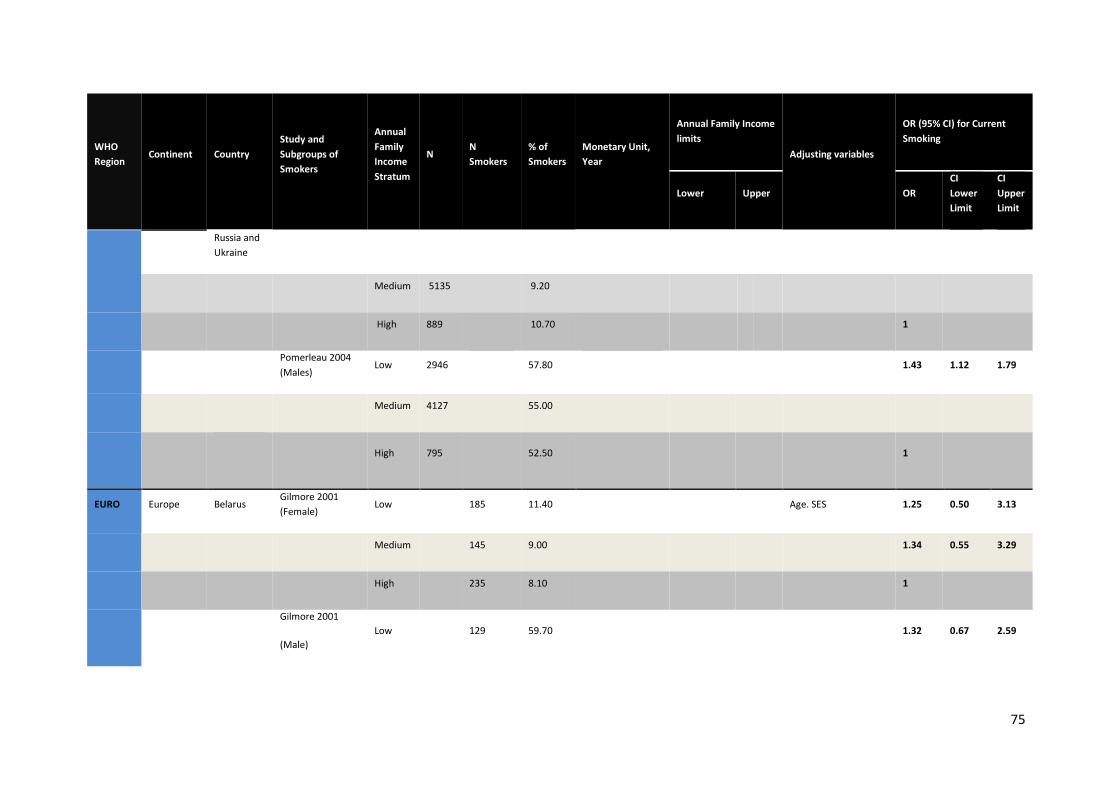
75
WHO Region
Continent Country Study and Subgroups of Smokers
Annual Family Income Stratum
N N Smokers
% of Smokers
Monetary Unit, Year
Annual Family Income limits
Adjusting variables
OR (95% CI) for Current Smoking
Lower Upper OR CI Lower Limit
CI Upper Limit
Russia and Ukraine
Medium 5135
9.20
High 889
10.70
1
Pomerleau 2004 (Males)
Low 2946
57.80
1.43 1.12 1.79
Medium 4127 55.00
High 795 52.50 1
EURO Europe Belarus Gilmore 2001 (Female)
Low
185 11.40
Age. SES 1.25 0.50 3.13
Medium 145 9.00 1.34 0.55 3.29
High 235 8.10 1
Gilmore 2001
(Male) Low
129 59.70
1.32 0.67 2.59
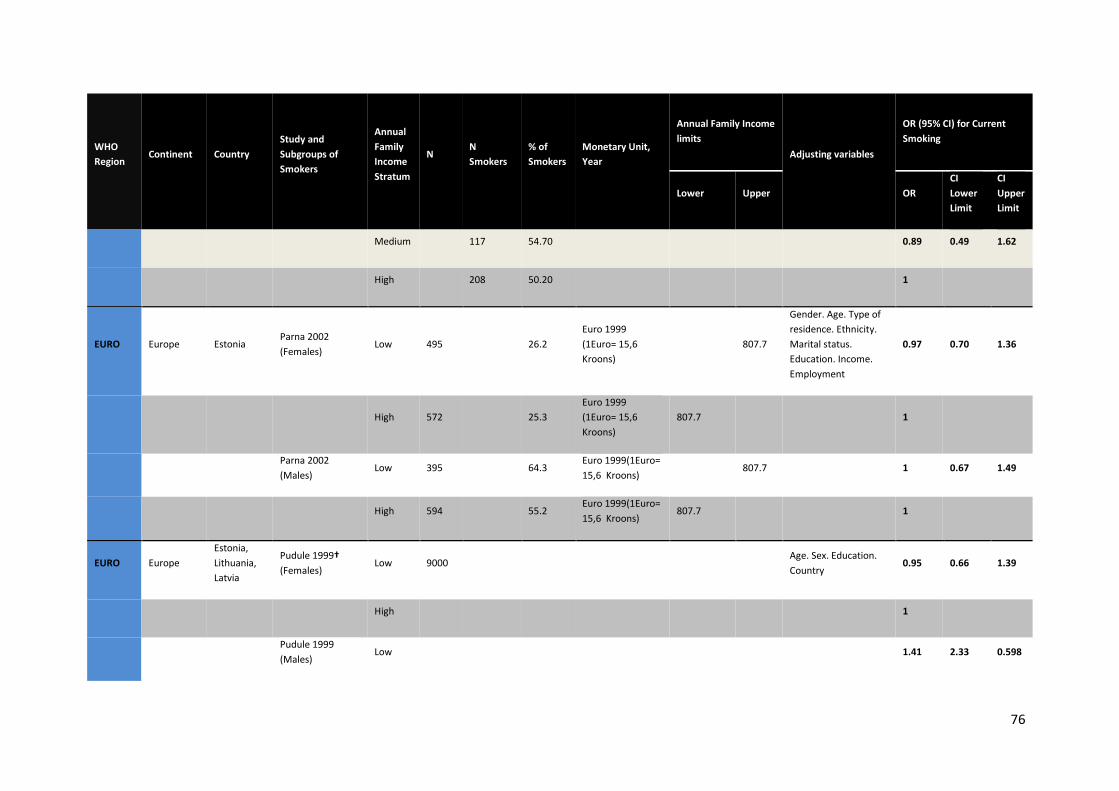
76
WHO Region
Continent Country Study and Subgroups of Smokers
Annual Family Income Stratum
N N Smokers
% of Smokers
Monetary Unit, Year
Annual Family Income limits
Adjusting variables
OR (95% CI) for Current Smoking
Lower Upper OR CI Lower Limit
CI Upper Limit
Medium 117 54.70 0.89 0.49 1.62
High 208 50.20 1
EURO Europe Estonia Parna 2002 (Females)
Low 495
26.2 Euro 1999 (1Euro= 15,6 Kroons)
807.7
Gender. Age. Type of residence. Ethnicity. Marital status. Education. Income. Employment
0.97 0.70 1.36
High 572 25.3 Euro 1999 (1Euro= 15,6 Kroons)
807.7 1
Parna 2002 (Males)
Low 395
64.3 Euro 1999(1Euro= 15,6 Kroons)
807.7
1 0.67 1.49
High 594 55.2 Euro 1999(1Euro= 15,6 Kroons)
807.7 1
EURO Europe Estonia, Lithuania, Latvia
Pudule 1999† (Females)
Low 9000 Age. Sex. Education. Country
0.95 0.66 1.39
High 1
Pudule 1999 (Males)
Low 1.41 2.33 0.598
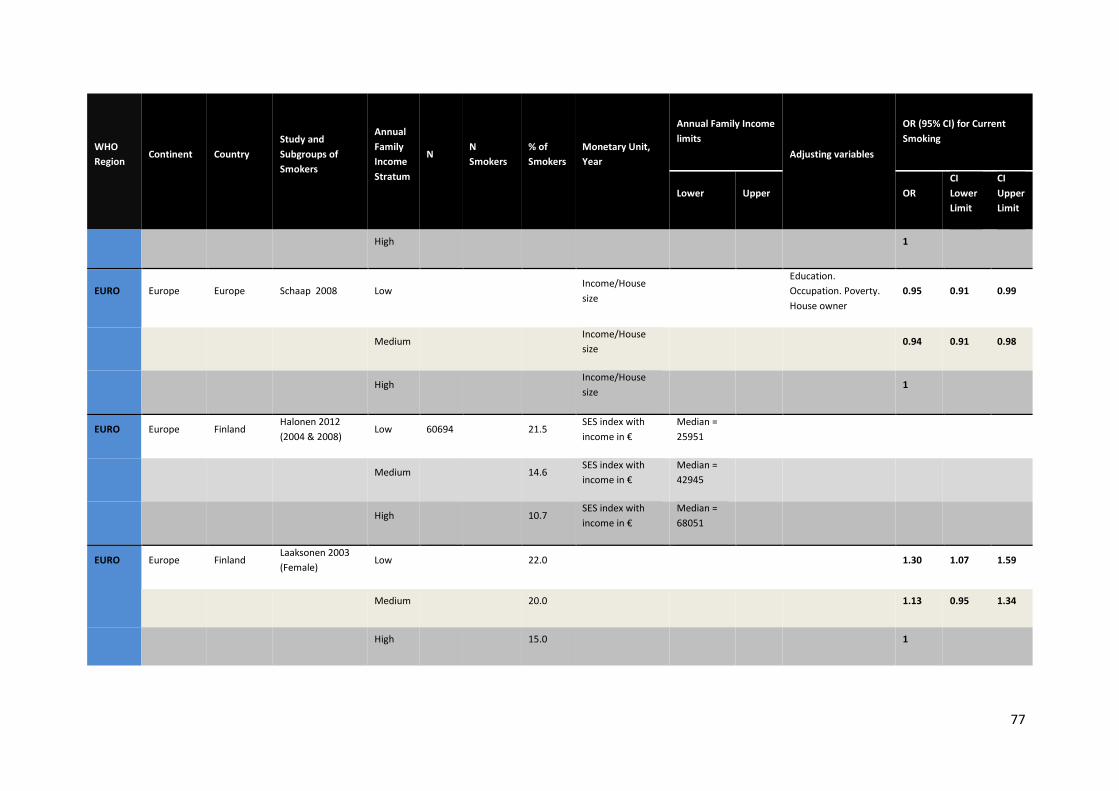
77
WHO Region
Continent Country Study and Subgroups of Smokers
Annual Family Income Stratum
N N Smokers
% of Smokers
Monetary Unit, Year
Annual Family Income limits
Adjusting variables
OR (95% CI) for Current Smoking
Lower Upper OR CI Lower Limit
CI Upper Limit
High 1
EURO Europe Europe Schaap 2008 Low
Income/House size
Education. Occupation. Poverty. House owner
0.95 0.91 0.99
Medium Income/House size
0.94 0.91 0.98
High Income/House size
1
EURO Europe Finland Halonen 2012 (2004 & 2008)
Low 60694 21.5 SES index with income in €
Median = 25951
Medium
14.6 SES index with income in €
Median = 42945
High
10.7 SES index with income in €
Median = 68051
EURO Europe Finland Laaksonen 2003 (Female)
Low
22.0
1.30 1.07 1.59
Medium 20.0 1.13 0.95 1.34
High 15.0 1
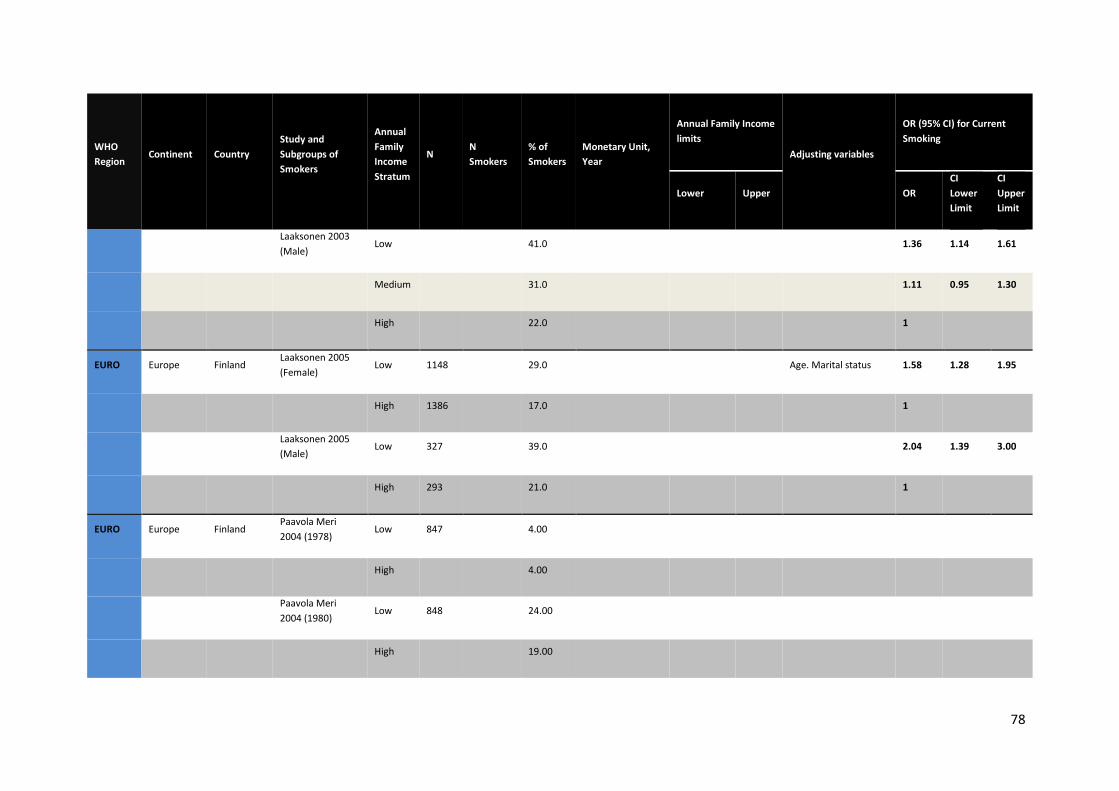
78
WHO Region
Continent Country Study and Subgroups of Smokers
Annual Family Income Stratum
N N Smokers
% of Smokers
Monetary Unit, Year
Annual Family Income limits
Adjusting variables
OR (95% CI) for Current Smoking
Lower Upper OR CI Lower Limit
CI Upper Limit
Laaksonen 2003 (Male)
Low
41.0
1.36 1.14 1.61
Medium 31.0 1.11 0.95 1.30
High 22.0 1
EURO Europe Finland Laaksonen 2005 (Female)
Low 1148
29.0
Age. Marital status 1.58 1.28 1.95
High 1386 17.0 1
Laaksonen 2005 (Male)
Low 327
39.0
2.04 1.39 3.00
High 293 21.0 1
EURO Europe Finland Paavola Meri 2004 (1978)
Low 847
4.00
High 4.00
Paavola Meri 2004 (1980)
Low 848
24.00
High 19.00
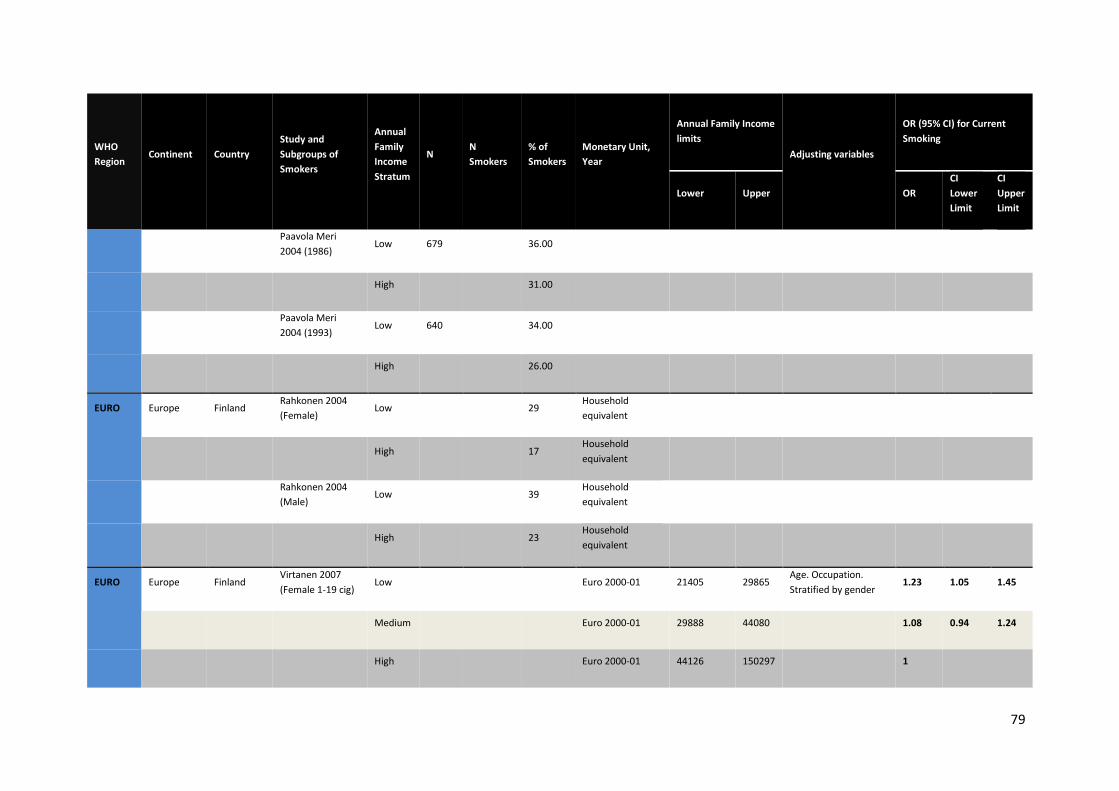
79
WHO Region
Continent Country Study and Subgroups of Smokers
Annual Family Income Stratum
N N Smokers
% of Smokers
Monetary Unit, Year
Annual Family Income limits
Adjusting variables
OR (95% CI) for Current Smoking
Lower Upper OR CI Lower Limit
CI Upper Limit
Paavola Meri 2004 (1986)
Low 679
36.00
High 31.00
Paavola Meri 2004 (1993)
Low 640
34.00
High 26.00
EURO Europe Finland Rahkonen 2004 (Female)
Low
29 Household equivalent
High 17 Household equivalent
Rahkonen 2004 (Male)
Low
39 Household equivalent
High 23 Household equivalent
EURO Europe Finland Virtanen 2007 (Female 1-19 cig)
Low Euro 2000-01 21405 29865 Age. Occupation. Stratified by gender
1.23 1.05 1.45
Medium Euro 2000-01 29888 44080 1.08 0.94 1.24
High Euro 2000-01 44126 150297 1
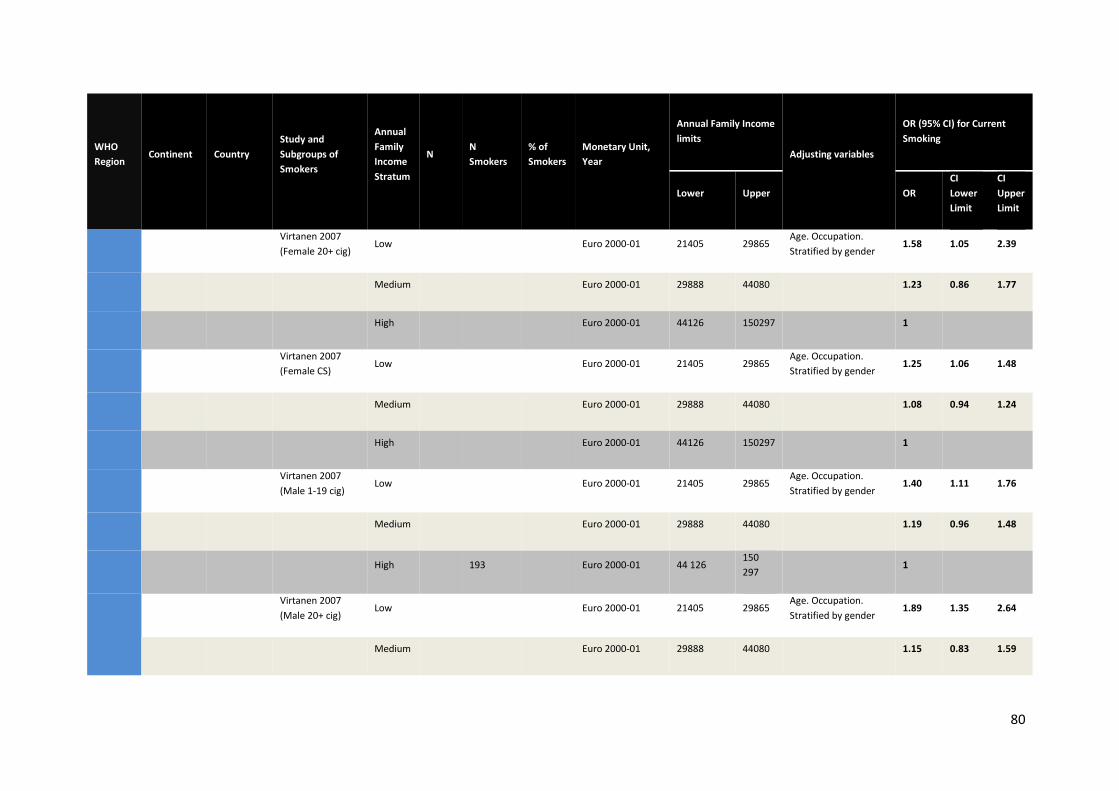
80
WHO Region
Continent Country Study and Subgroups of Smokers
Annual Family Income Stratum
N N Smokers
% of Smokers
Monetary Unit, Year
Annual Family Income limits
Adjusting variables
OR (95% CI) for Current Smoking
Lower Upper OR CI Lower Limit
CI Upper Limit
Virtanen 2007 (Female 20+ cig)
Low
Euro 2000-01 21405 29865 Age. Occupation. Stratified by gender
1.58 1.05 2.39
Medium Euro 2000-01 29888 44080 1.23 0.86 1.77
High Euro 2000-01 44126 150297 1
Virtanen 2007 (Female CS)
Low
Euro 2000-01 21405 29865 Age. Occupation. Stratified by gender
1.25 1.06 1.48
Medium Euro 2000-01 29888 44080 1.08 0.94 1.24
High Euro 2000-01 44126 150297 1
Virtanen 2007 (Male 1-19 cig)
Low
Euro 2000-01 21405 29865 Age. Occupation. Stratified by gender
1.40 1.11 1.76
Medium Euro 2000-01 29888 44080 1.19 0.96 1.48
High 193 Euro 2000-01 44 126 150 297
1
Virtanen 2007 (Male 20+ cig)
Low
Euro 2000-01 21405 29865 Age. Occupation. Stratified by gender
1.89 1.35 2.64
Medium Euro 2000-01 29888 44080 1.15 0.83 1.59
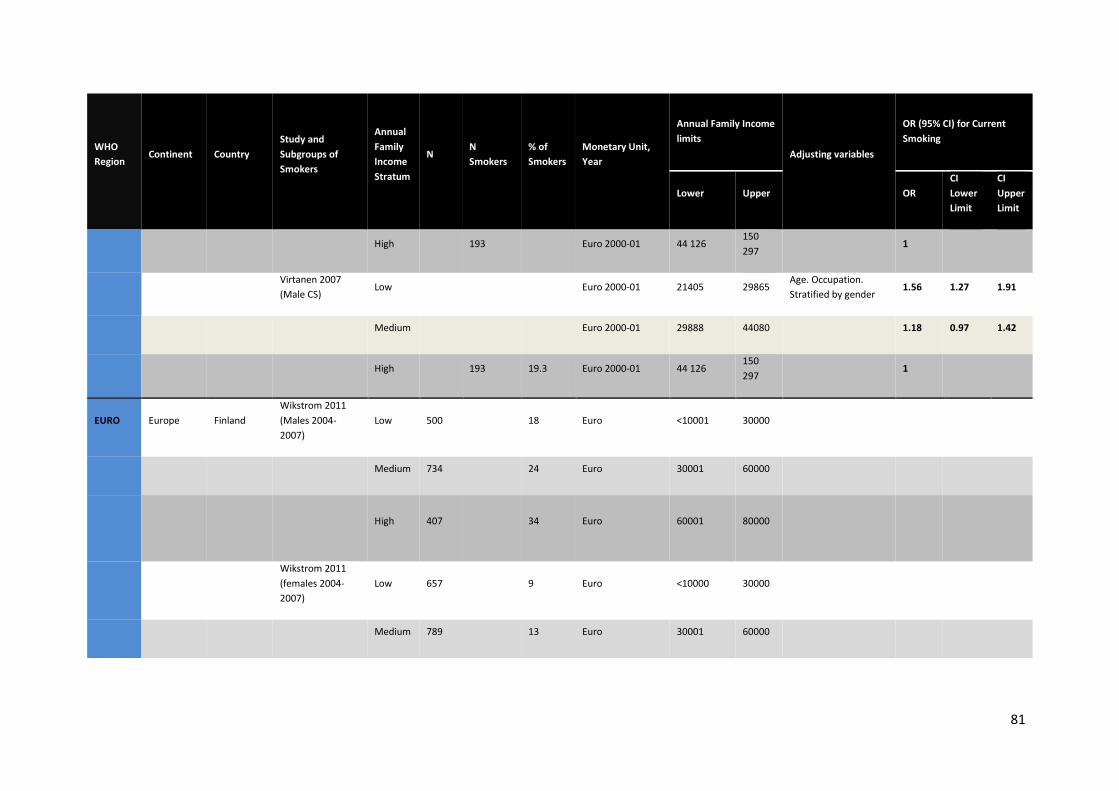
81
WHO Region
Continent Country Study and Subgroups of Smokers
Annual Family Income Stratum
N N Smokers
% of Smokers
Monetary Unit, Year
Annual Family Income limits
Adjusting variables
OR (95% CI) for Current Smoking
Lower Upper OR CI Lower Limit
CI Upper Limit
High 193 Euro 2000-01 44 126 150 297
1
Virtanen 2007 (Male CS)
Low
Euro 2000-01 21405 29865 Age. Occupation. Stratified by gender
1.56 1.27 1.91
Medium Euro 2000-01 29888 44080 1.18 0.97 1.42
High 193 19.3 Euro 2000-01 44 126 150 297
1
EURO Europe Finland Wikstrom 2011 (Males 2004-2007)
Low 500 18 Euro <10001 30000
Medium 734 24 Euro 30001 60000
High 407 34 Euro 60001 80000
Wikstrom 2011 (females 2004-2007)
Low 657 9 Euro <10000 30000
Medium 789 13 Euro 30001 60000
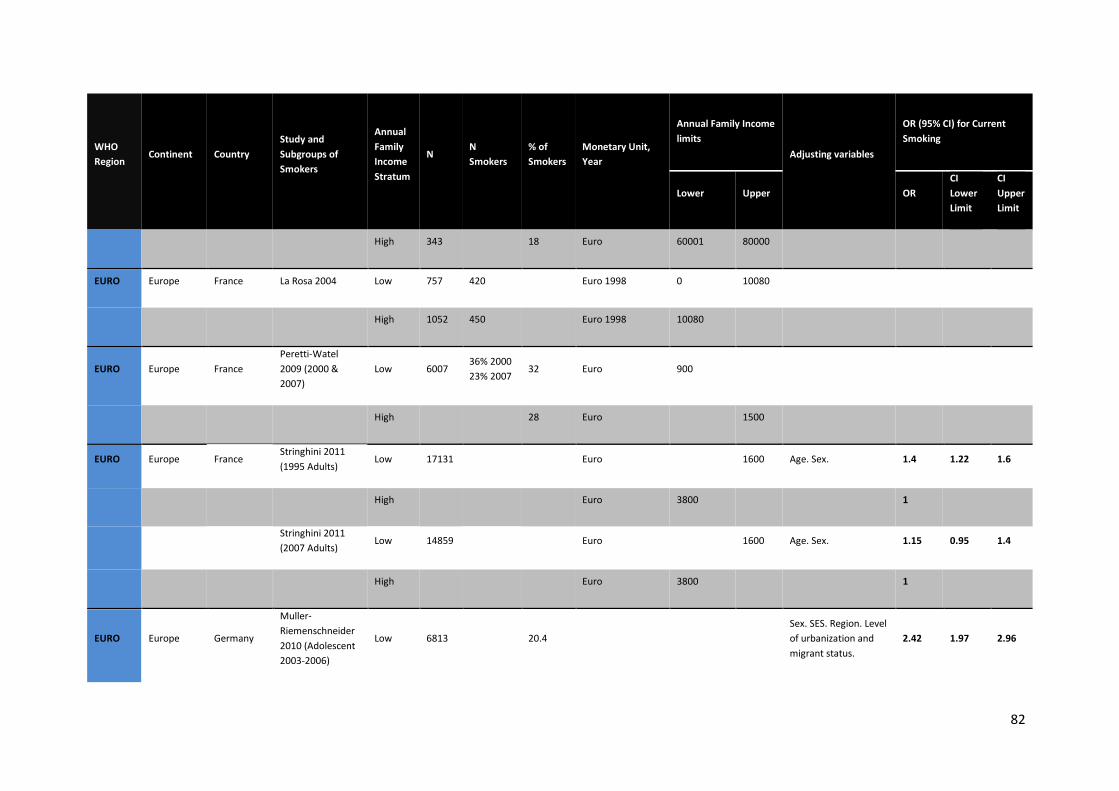
82
WHO Region
Continent Country Study and Subgroups of Smokers
Annual Family Income Stratum
N N Smokers
% of Smokers
Monetary Unit, Year
Annual Family Income limits
Adjusting variables
OR (95% CI) for Current Smoking
Lower Upper OR CI Lower Limit
CI Upper Limit
High 343 18 Euro 60001 80000
EURO Europe France La Rosa 2004 Low 757 420
Euro 1998 0 10080
High 1052 450 Euro 1998 10080
EURO Europe France Peretti-Watel 2009 (2000 & 2007)
Low 6007 36% 2000 23% 2007
32 Euro 900
High 28 Euro 1500
EURO Europe France Stringhini 2011 (1995 Adults)
Low 17131
Euro
1600 Age. Sex. 1.4 1.22 1.6
High Euro 3800 1
Stringhini 2011 (2007 Adults)
Low 14859
Euro
1600 Age. Sex. 1.15 0.95 1.4
High Euro 3800 1
EURO Europe Germany
Muller-Riemenschneider 2010 (Adolescent 2003-2006)
Low 6813 20.4 Sex. SES. Region. Level of urbanization and migrant status.
2.42 1.97 2.96
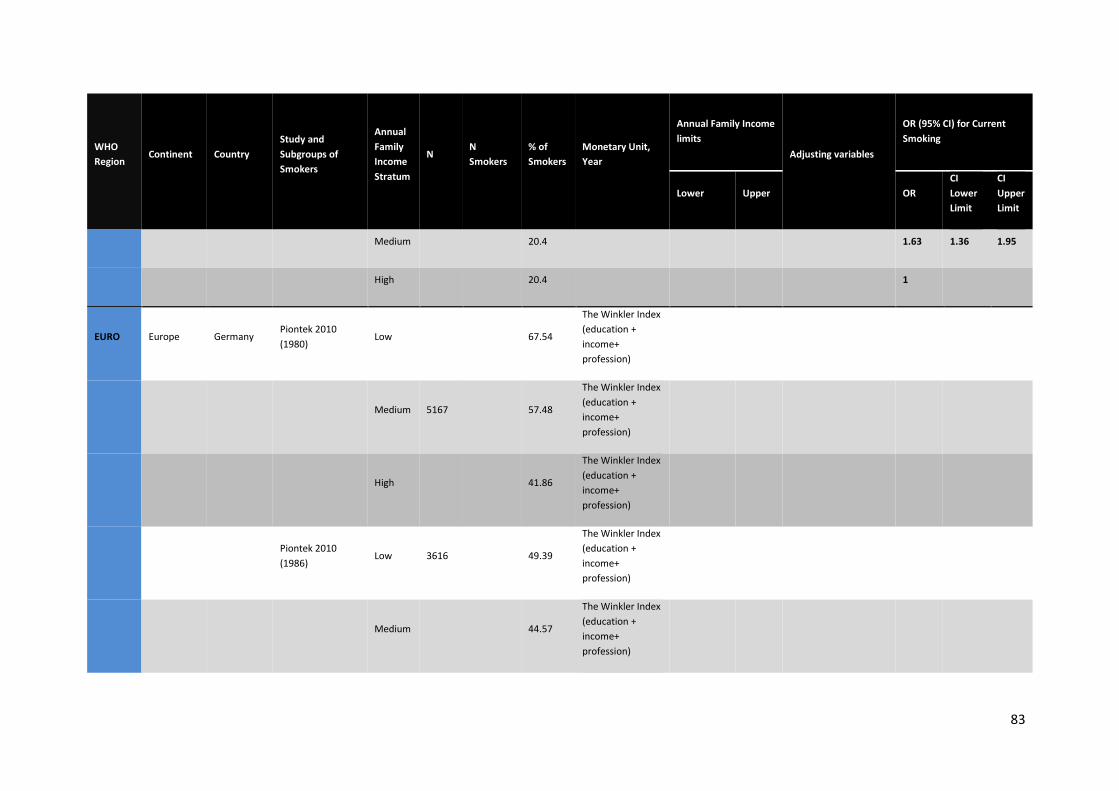
83
WHO Region
Continent Country Study and Subgroups of Smokers
Annual Family Income Stratum
N N Smokers
% of Smokers
Monetary Unit, Year
Annual Family Income limits
Adjusting variables
OR (95% CI) for Current Smoking
Lower Upper OR CI Lower Limit
CI Upper Limit
Medium 20.4 1.63 1.36 1.95
High 20.4 1
EURO Europe Germany Piontek 2010 (1980)
Low 67.54
The Winkler Index (education + income+ profession)
Medium 5167 57.48
The Winkler Index (education + income+ profession)
High 41.86
The Winkler Index (education + income+ profession)
Piontek 2010 (1986)
Low 3616 49.39
The Winkler Index (education + income+ profession)
Medium 44.57
The Winkler Index (education + income+ profession)

84
WHO Region
Continent Country Study and Subgroups of Smokers
Annual Family Income Stratum
N N Smokers
% of Smokers
Monetary Unit, Year
Annual Family Income limits
Adjusting variables
OR (95% CI) for Current Smoking
Lower Upper OR CI Lower Limit
CI Upper Limit
High 39.39
The Winkler Index (education + income+ profession)
Piontek 2010 (1990)
Low 17004 51.54
The Winkler Index (education + income+ profession)
Medium 43.3
The Winkler Index (education + income+ profession)
High 36.95
The Winkler Index (education + income+ profession)
Piontek 2010 (1995)
Low 7833 45.22
The Winkler Index (education + income+ profession)
Medium 34.1
The Winkler Index (education + income+ profession)

85
WHO Region
Continent Country Study and Subgroups of Smokers
Annual Family Income Stratum
N N Smokers
% of Smokers
Monetary Unit, Year
Annual Family Income limits
Adjusting variables
OR (95% CI) for Current Smoking
Lower Upper OR CI Lower Limit
CI Upper Limit
High 30.84
The Winkler Index (education + income+ profession)
Piontek 2010 (1997)
Low 8020 46.45
The Winkler Index (education + income+ profession)
Medium 35.35
The Winkler Index (education + income+ profession)
High 31.35
The Winkler Index (education + income+ profession)
Piontek 2010 (2000)
Low 8139 42.91
The Winkler Index (education + income+ profession)
Medium 33.6
The Winkler Index (education + income+ profession)
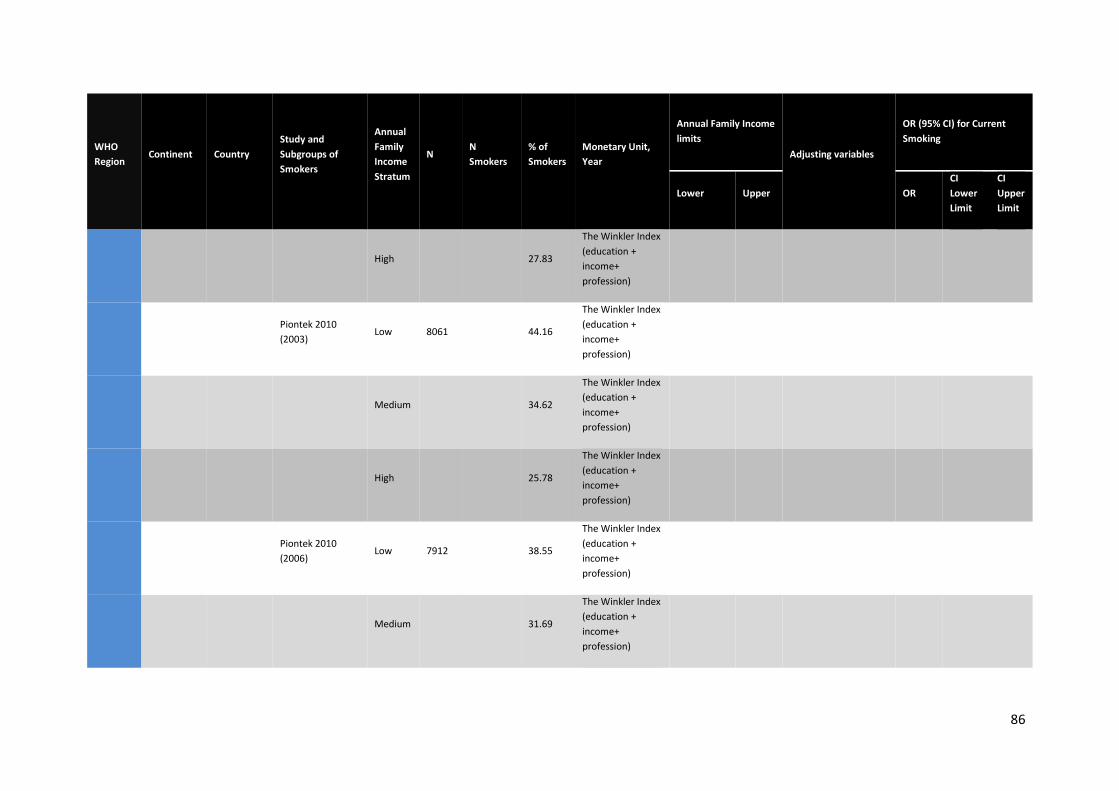
86
WHO Region
Continent Country Study and Subgroups of Smokers
Annual Family Income Stratum
N N Smokers
% of Smokers
Monetary Unit, Year
Annual Family Income limits
Adjusting variables
OR (95% CI) for Current Smoking
Lower Upper OR CI Lower Limit
CI Upper Limit
High 27.83
The Winkler Index (education + income+ profession)
Piontek 2010 (2003)
Low 8061 44.16
The Winkler Index (education + income+ profession)
Medium 34.62
The Winkler Index (education + income+ profession)
High 25.78
The Winkler Index (education + income+ profession)
Piontek 2010 (2006)
Low 7912 38.55
The Winkler Index (education + income+ profession)
Medium 31.69
The Winkler Index (education + income+ profession)
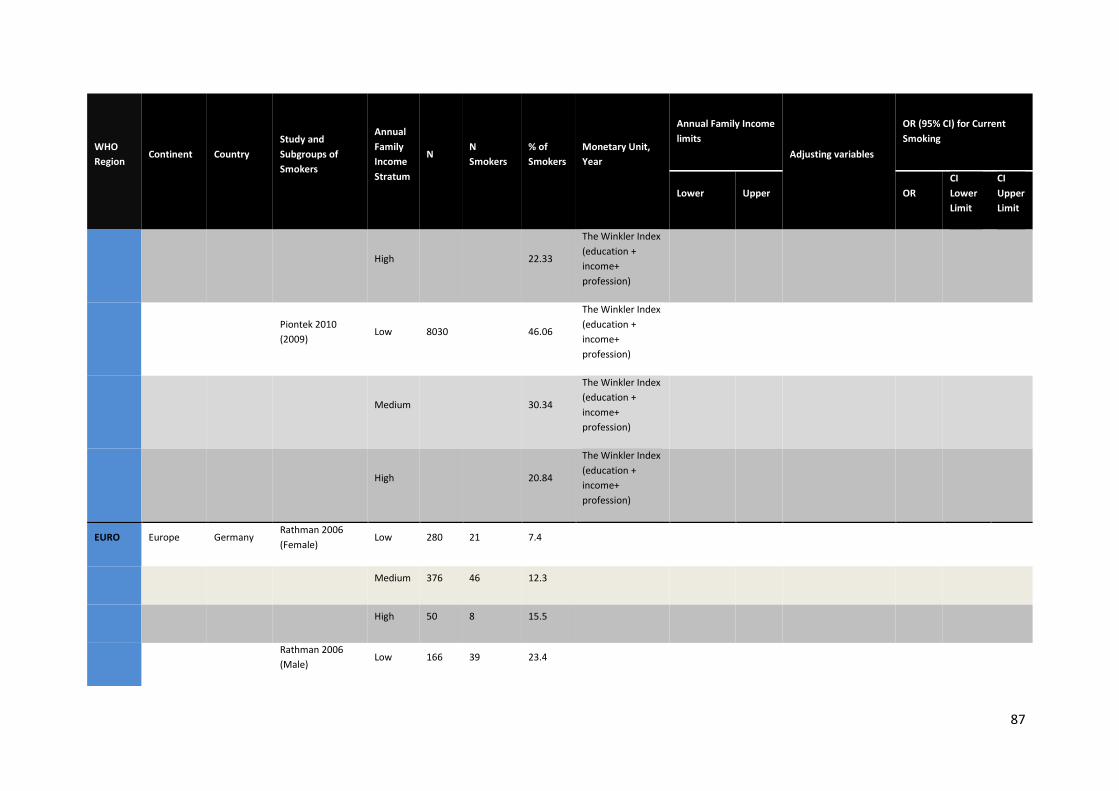
87
WHO Region
Continent Country Study and Subgroups of Smokers
Annual Family Income Stratum
N N Smokers
% of Smokers
Monetary Unit, Year
Annual Family Income limits
Adjusting variables
OR (95% CI) for Current Smoking
Lower Upper OR CI Lower Limit
CI Upper Limit
High 22.33
The Winkler Index (education + income+ profession)
Piontek 2010 (2009)
Low 8030 46.06
The Winkler Index (education + income+ profession)
Medium 30.34
The Winkler Index (education + income+ profession)
High 20.84
The Winkler Index (education + income+ profession)
EURO Europe Germany Rathman 2006 (Female)
Low 280 21 7.4
Medium 376 46 12.3
High 50 8 15.5
Rathman 2006 (Male)
Low 166 39 23.4
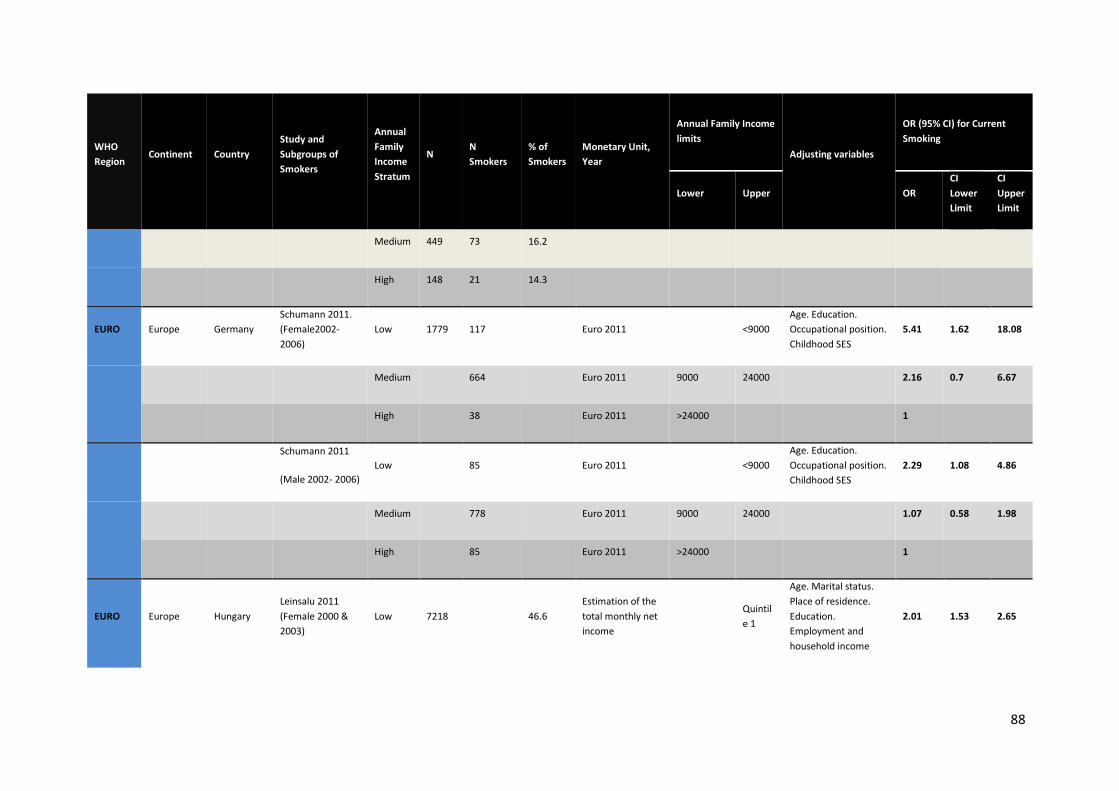
88
WHO Region
Continent Country Study and Subgroups of Smokers
Annual Family Income Stratum
N N Smokers
% of Smokers
Monetary Unit, Year
Annual Family Income limits
Adjusting variables
OR (95% CI) for Current Smoking
Lower Upper OR CI Lower Limit
CI Upper Limit
Medium 449 73 16.2
High 148 21 14.3
EURO Europe Germany Schumann 2011. (Female2002- 2006)
Low 1779 117 Euro 2011 <9000 Age. Education. Occupational position. Childhood SES
5.41 1.62 18.08
Medium 664 Euro 2011 9000 24000 2.16 0.7 6.67
High 38 Euro 2011 >24000 1
Schumann 2011
(Male 2002- 2006) Low 85 Euro 2011 <9000
Age. Education. Occupational position. Childhood SES
2.29 1.08 4.86
Medium 778 Euro 2011 9000 24000 1.07 0.58 1.98
High 85 Euro 2011 >24000 1
EURO Europe Hungary Leinsalu 2011 (Female 2000 & 2003)
Low 7218 46.6 Estimation of the total monthly net income
Quintile 1
Age. Marital status. Place of residence. Education. Employment and household income
2.01 1.53 2.65
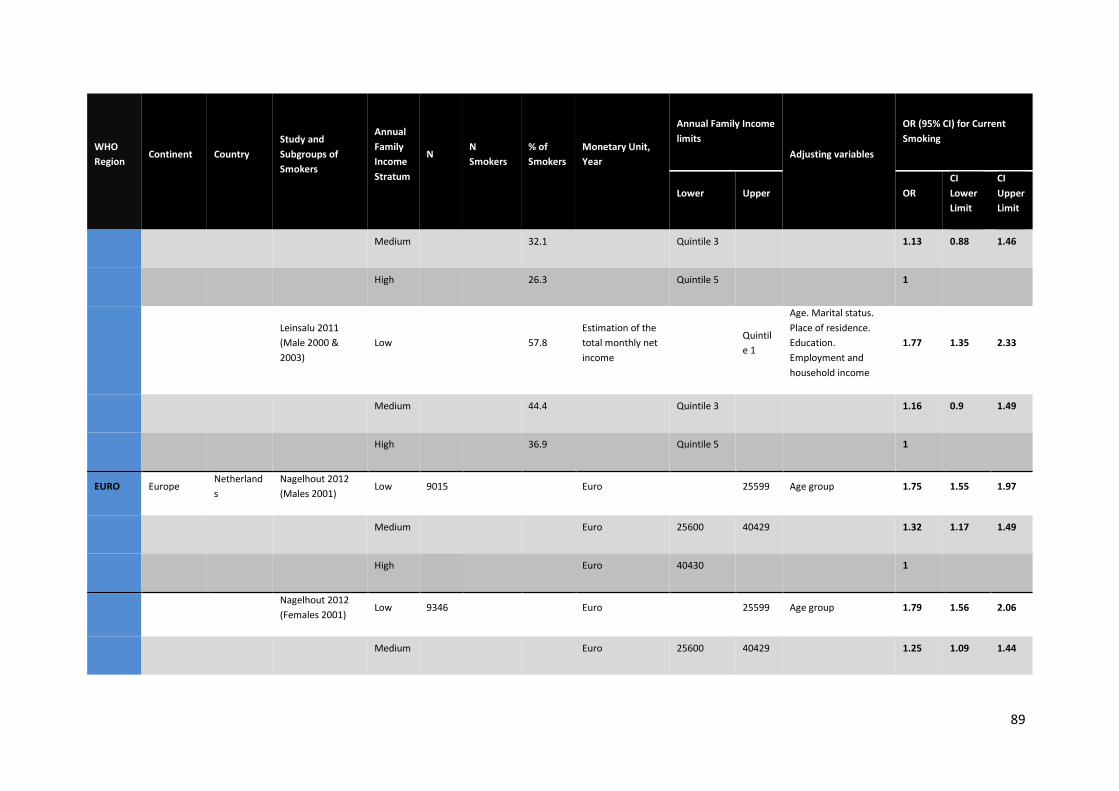
89
WHO Region
Continent Country Study and Subgroups of Smokers
Annual Family Income Stratum
N N Smokers
% of Smokers
Monetary Unit, Year
Annual Family Income limits
Adjusting variables
OR (95% CI) for Current Smoking
Lower Upper OR CI Lower Limit
CI Upper Limit
Medium 32.1 Quintile 3 1.13 0.88 1.46
High 26.3 Quintile 5 1
Leinsalu 2011 (Male 2000 & 2003)
Low
57.8 Estimation of the total monthly net income
Quintile 1
Age. Marital status. Place of residence. Education. Employment and household income
1.77 1.35 2.33
Medium 44.4 Quintile 3 1.16 0.9 1.49
High 36.9 Quintile 5 1
EURO Europe Netherlands
Nagelhout 2012 (Males 2001)
Low 9015 Euro 25599 Age group 1.75 1.55 1.97
Medium Euro 25600 40429 1.32 1.17 1.49
High Euro 40430 1
Nagelhout 2012 (Females 2001)
Low 9346 Euro 25599 Age group 1.79 1.56 2.06
Medium Euro 25600 40429 1.25 1.09 1.44
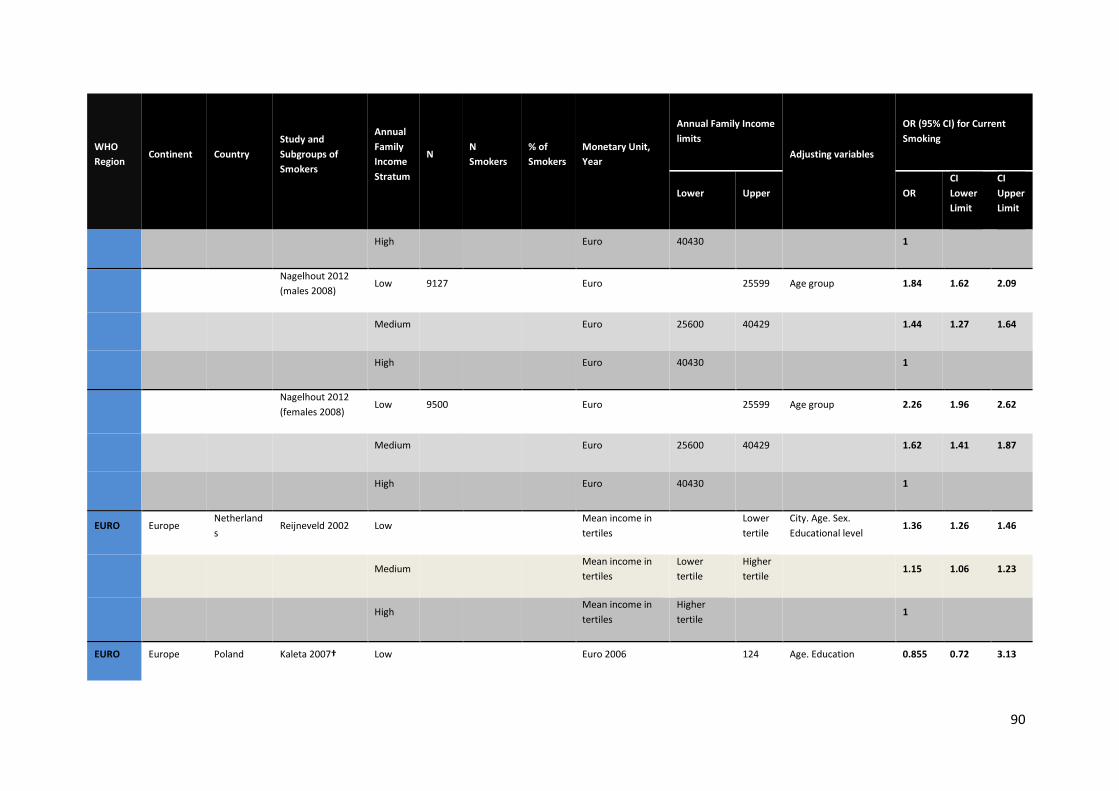
90
WHO Region
Continent Country Study and Subgroups of Smokers
Annual Family Income Stratum
N N Smokers
% of Smokers
Monetary Unit, Year
Annual Family Income limits
Adjusting variables
OR (95% CI) for Current Smoking
Lower Upper OR CI Lower Limit
CI Upper Limit
High Euro 40430 1
Nagelhout 2012 (males 2008)
Low 9127 Euro 25599 Age group 1.84 1.62 2.09
Medium Euro 25600 40429 1.44 1.27 1.64
High Euro 40430 1
Nagelhout 2012 (females 2008)
Low 9500 Euro 25599 Age group 2.26 1.96 2.62
Medium Euro 25600 40429 1.62 1.41 1.87
High Euro 40430 1
EURO Europe Netherlands
Reijneveld 2002 Low
Mean income in tertiles
Lower tertile
City. Age. Sex. Educational level
1.36 1.26 1.46
Medium Mean income in tertiles
Lower tertile
Higher tertile
1.15 1.06 1.23
High Mean income in tertiles
Higher tertile
1
EURO Europe Poland Kaleta 2007† Low
Euro 2006
124 Age. Education 0.855 0.72 3.13
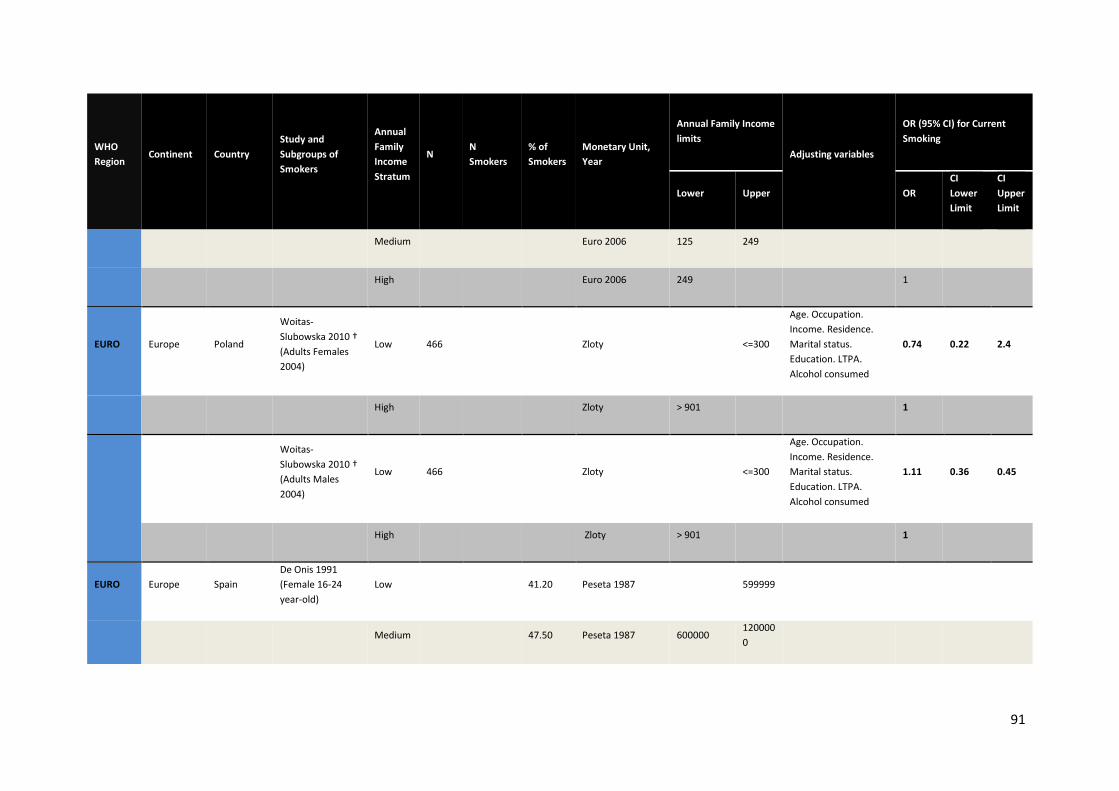
91
WHO Region
Continent Country Study and Subgroups of Smokers
Annual Family Income Stratum
N N Smokers
% of Smokers
Monetary Unit, Year
Annual Family Income limits
Adjusting variables
OR (95% CI) for Current Smoking
Lower Upper OR CI Lower Limit
CI Upper Limit
Medium Euro 2006 125 249
High Euro 2006 249 1
EURO Europe Poland
Woitas- Slubowska 2010 † (Adults Females 2004)
Low 466 Zloty <=300
Age. Occupation. Income. Residence. Marital status. Education. LTPA. Alcohol consumed
0.74 0.22 2.4
High Zloty > 901 1
Woitas- Slubowska 2010 † (Adults Males 2004)
Low 466 Zloty <=300
Age. Occupation. Income. Residence. Marital status. Education. LTPA. Alcohol consumed
1.11 0.36 0.45
High Zloty > 901 1
EURO Europe Spain De Onis 1991 (Female 16-24 year-old)
Low
41.20 Peseta 1987
599999
Medium 47.50 Peseta 1987 600000 1200000
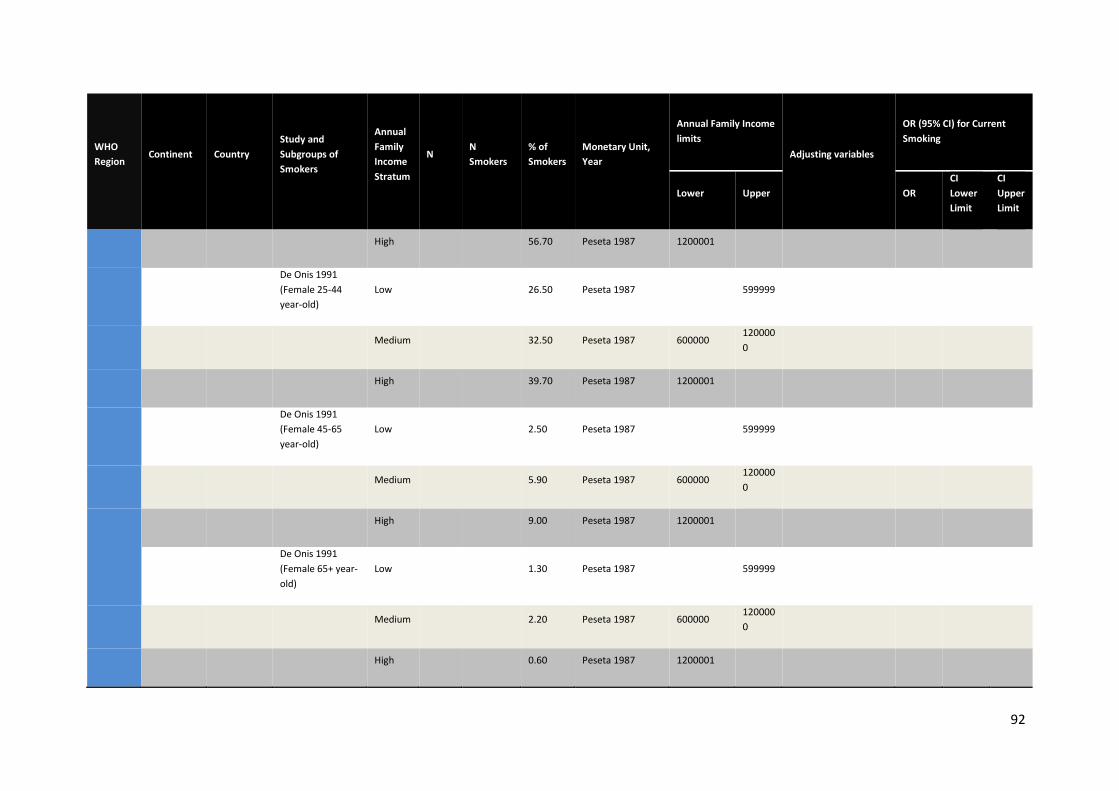
92
WHO Region
Continent Country Study and Subgroups of Smokers
Annual Family Income Stratum
N N Smokers
% of Smokers
Monetary Unit, Year
Annual Family Income limits
Adjusting variables
OR (95% CI) for Current Smoking
Lower Upper OR CI Lower Limit
CI Upper Limit
High 56.70 Peseta 1987 1200001
De Onis 1991 (Female 25-44 year-old)
Low
26.50 Peseta 1987
599999
Medium 32.50 Peseta 1987 600000 1200000
High 39.70 Peseta 1987 1200001
De Onis 1991 (Female 45-65 year-old)
Low
2.50 Peseta 1987
599999
Medium 5.90 Peseta 1987 600000 1200000
High 9.00 Peseta 1987 1200001
De Onis 1991 (Female 65+ year-old)
Low
1.30 Peseta 1987
599999
Medium 2.20 Peseta 1987 600000 1200000
High 0.60 Peseta 1987 1200001
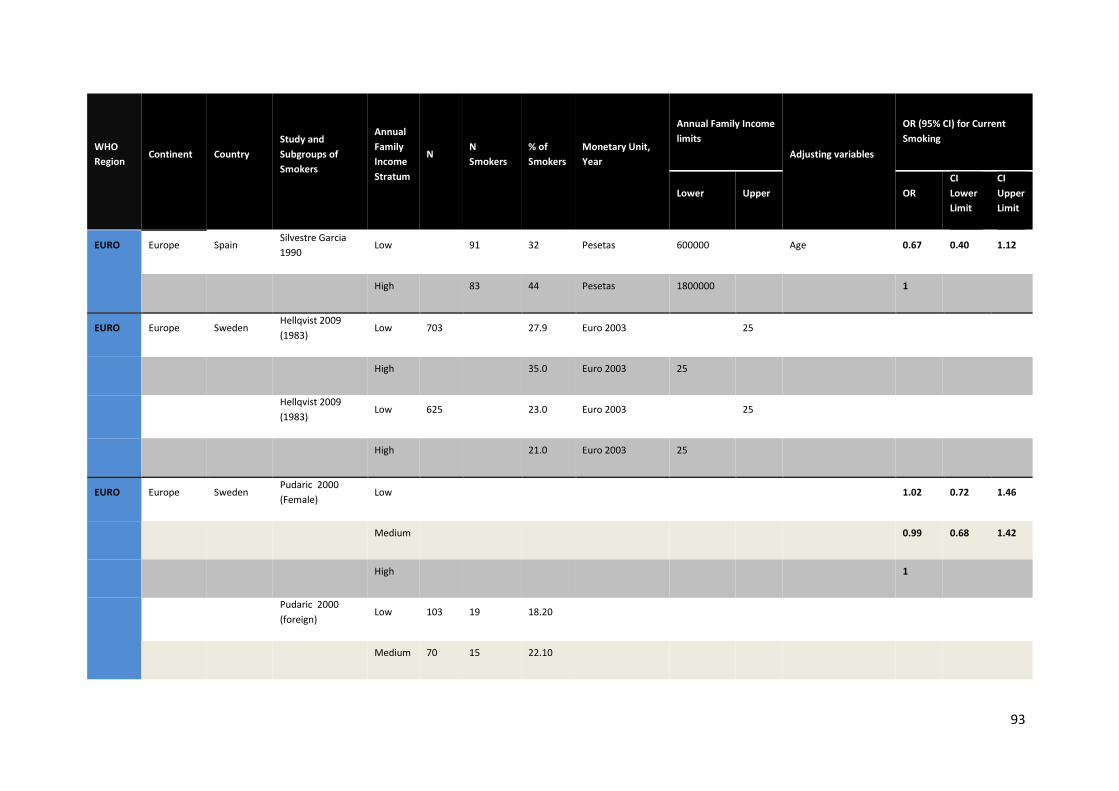
93
WHO Region
Continent Country Study and Subgroups of Smokers
Annual Family Income Stratum
N N Smokers
% of Smokers
Monetary Unit, Year
Annual Family Income limits
Adjusting variables
OR (95% CI) for Current Smoking
Lower Upper OR CI Lower Limit
CI Upper Limit
EURO Europe Spain Silvestre Garcia 1990
Low
91 32 Pesetas 600000
Age 0.67 0.40 1.12
High 83 44 Pesetas 1800000 1
EURO Europe Sweden Hellqvist 2009 (1983)
Low 703 27.9 Euro 2003 25
High 35.0 Euro 2003 25
Hellqvist 2009 (1983)
Low 625 23.0 Euro 2003 25
High 21.0 Euro 2003 25
EURO Europe Sweden Pudaric 2000 (Female)
Low
1.02 0.72 1.46
Medium 0.99 0.68 1.42
High 1
Pudaric 2000 (foreign)
Low 103 19 18.20
Medium 70 15 22.10
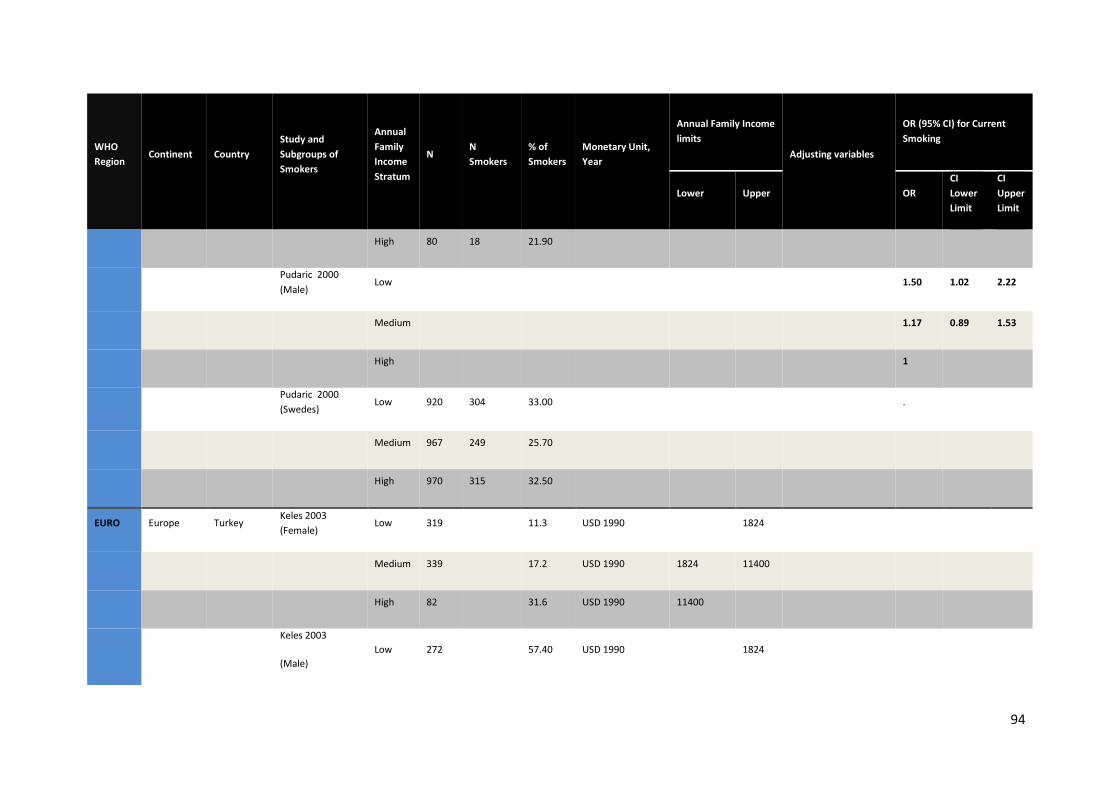
94
WHO Region
Continent Country Study and Subgroups of Smokers
Annual Family Income Stratum
N N Smokers
% of Smokers
Monetary Unit, Year
Annual Family Income limits
Adjusting variables
OR (95% CI) for Current Smoking
Lower Upper OR CI Lower Limit
CI Upper Limit
High 80 18 21.90
Pudaric 2000 (Male)
Low
1.50 1.02 2.22
Medium 1.17 0.89 1.53
High 1
Pudaric 2000 (Swedes)
Low 920 304 33.00
.
Medium 967 249 25.70
High 970 315 32.50
EURO Europe Turkey Keles 2003 (Female)
Low 319
11.3 USD 1990
1824
Medium 339 17.2 USD 1990 1824 11400
High 82 31.6 USD 1990 11400
Keles 2003
(Male) Low 272
57.40 USD 1990
1824
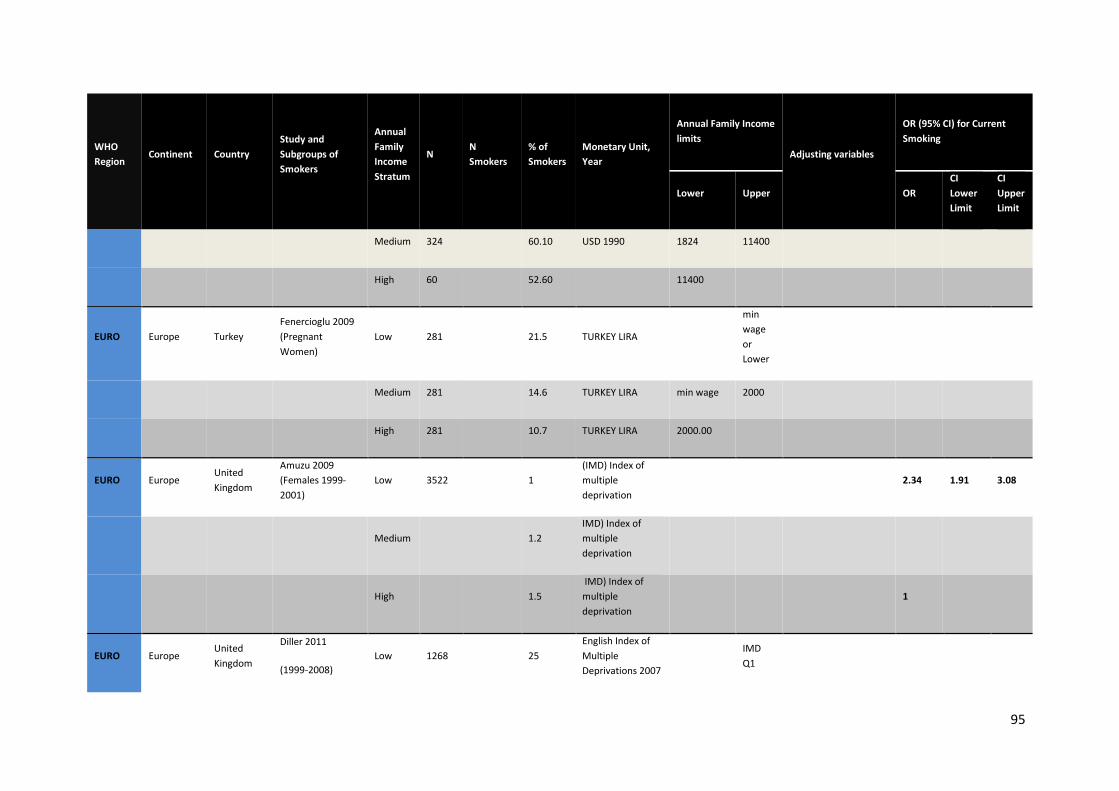
95
WHO Region
Continent Country Study and Subgroups of Smokers
Annual Family Income Stratum
N N Smokers
% of Smokers
Monetary Unit, Year
Annual Family Income limits
Adjusting variables
OR (95% CI) for Current Smoking
Lower Upper OR CI Lower Limit
CI Upper Limit
Medium 324 60.10 USD 1990 1824 11400
High 60 52.60 11400
EURO Europe Turkey Fenercioglu 2009 (Pregnant Women)
Low 281 21.5 TURKEY LIRA
min wage or Lower
Medium 281 14.6 TURKEY LIRA min wage 2000
High 281 10.7 TURKEY LIRA 2000.00
EURO Europe United Kingdom
Amuzu 2009 (Females 1999-2001)
Low 3522 1 (IMD) Index of multiple deprivation
2.34 1.91 3.08
Medium 1.2 IMD) Index of multiple deprivation
High 1.5 IMD) Index of multiple deprivation
1
EURO Europe United Kingdom
Diller 2011
(1999-2008) Low 1268 25
English Index of Multiple Deprivations 2007
IMD Q1
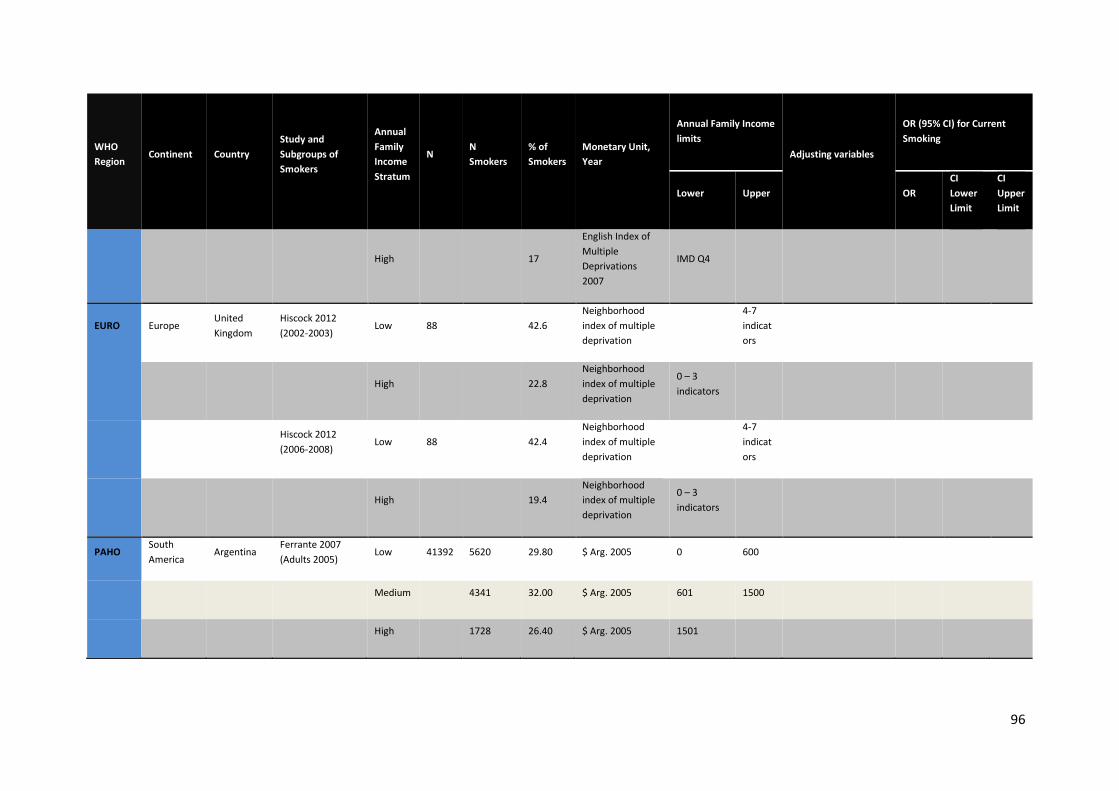
96
WHO Region
Continent Country Study and Subgroups of Smokers
Annual Family Income Stratum
N N Smokers
% of Smokers
Monetary Unit, Year
Annual Family Income limits
Adjusting variables
OR (95% CI) for Current Smoking
Lower Upper OR CI Lower Limit
CI Upper Limit
High 17
English Index of Multiple Deprivations 2007
IMD Q4
EURO Europe United Kingdom
Hiscock 2012 (2002-2003)
Low 88 42.6 Neighborhood index of multiple deprivation
4-7 indicators
High 22.8 Neighborhood index of multiple deprivation
0 – 3 indicators
Hiscock 2012 (2006-2008)
Low 88 42.4 Neighborhood index of multiple deprivation
4-7 indicators
High 19.4 Neighborhood index of multiple deprivation
0 – 3 indicators
PAHO South America
Argentina Ferrante 2007 (Adults 2005)
Low 41392 5620 29.80 $ Arg. 2005 0 600
Medium 4341 32.00 $ Arg. 2005 601 1500
High 1728 26.40 $ Arg. 2005 1501
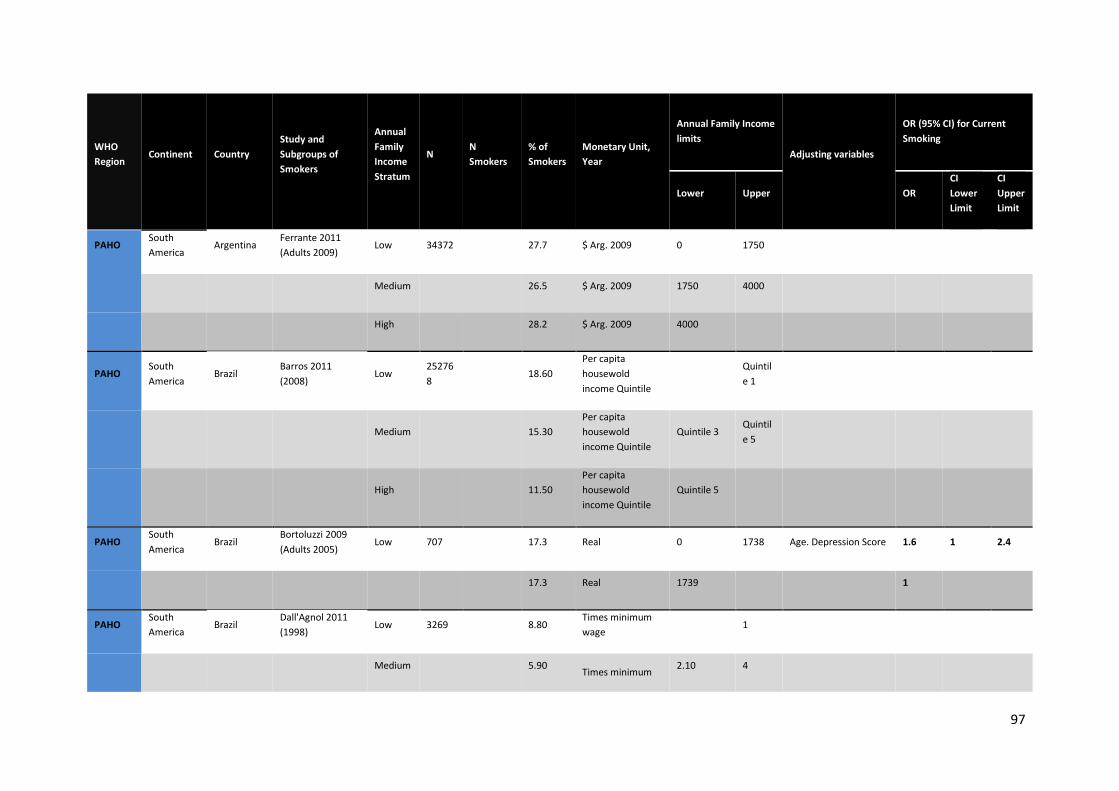
97
WHO Region
Continent Country Study and Subgroups of Smokers
Annual Family Income Stratum
N N Smokers
% of Smokers
Monetary Unit, Year
Annual Family Income limits
Adjusting variables
OR (95% CI) for Current Smoking
Lower Upper OR CI Lower Limit
CI Upper Limit
PAHO South America
Argentina Ferrante 2011 (Adults 2009)
Low 34372 27.7 $ Arg. 2009 0 1750
Medium 26.5 $ Arg. 2009 1750 4000
High 28.2 $ Arg. 2009 4000
PAHO South America
Brazil Barros 2011 (2008)
Low 252768
18.60 Per capita housewold income Quintile
Quintile 1
Medium 15.30 Per capita housewold income Quintile
Quintile 3 Quintile 5
High 11.50 Per capita housewold income Quintile
Quintile 5
PAHO South America
Brazil Bortoluzzi 2009 (Adults 2005)
Low 707 17.3 Real 0 1738 Age. Depression Score 1.6 1 2.4
17.3 Real 1739
1
PAHO South America
Brazil Dall'Agnol 2011 (1998)
Low 3269 8.80 Times minimum wage
1
Medium 5.90 Times minimum 2.10 4
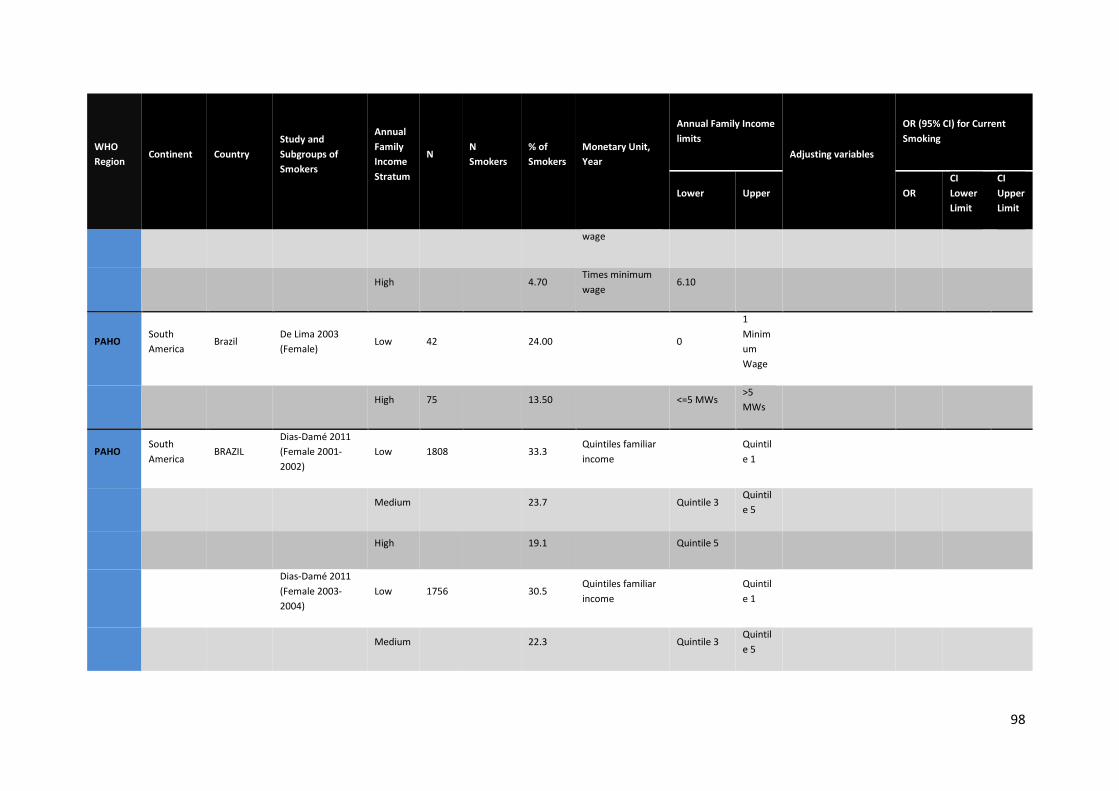
98
WHO Region
Continent Country Study and Subgroups of Smokers
Annual Family Income Stratum
N N Smokers
% of Smokers
Monetary Unit, Year
Annual Family Income limits
Adjusting variables
OR (95% CI) for Current Smoking
Lower Upper OR CI Lower Limit
CI Upper Limit
wage
High 4.70 Times minimum wage
6.10
PAHO South America
Brazil De Lima 2003 (Female)
Low 42
24.00
0
1 Minimum Wage
High 75 13.50 <=5 MWs >5 MWs
PAHO South America
BRAZIL Dias-Damé 2011 (Female 2001-2002)
Low 1808 33.3 Quintiles familiar income
Quintile 1
Medium 23.7 Quintile 3 Quintile 5
High 19.1 Quintile 5
Dias-Damé 2011 (Female 2003-2004)
Low 1756 30.5 Quintiles familiar income
Quintile 1
Medium 22.3 Quintile 3 Quintile 5
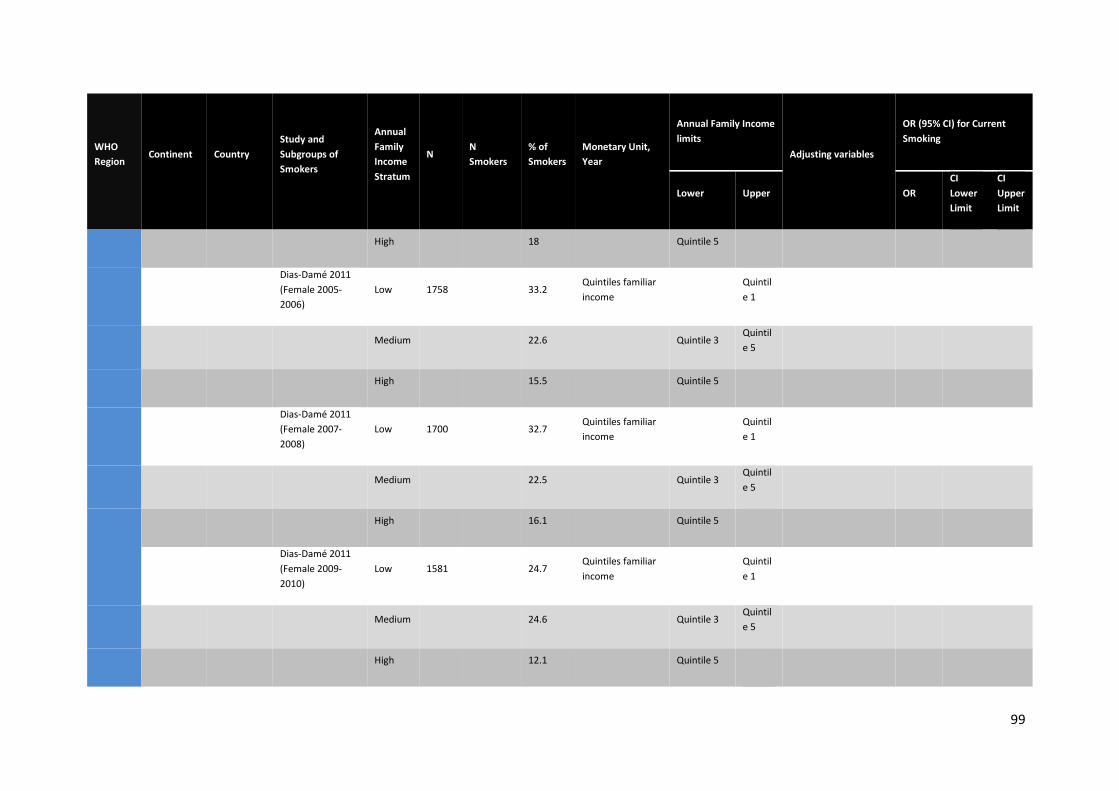
99
WHO Region
Continent Country Study and Subgroups of Smokers
Annual Family Income Stratum
N N Smokers
% of Smokers
Monetary Unit, Year
Annual Family Income limits
Adjusting variables
OR (95% CI) for Current Smoking
Lower Upper OR CI Lower Limit
CI Upper Limit
High 18 Quintile 5
Dias-Damé 2011 (Female 2005-2006)
Low 1758 33.2 Quintiles familiar income
Quintile 1
Medium 22.6 Quintile 3 Quintile 5
High 15.5 Quintile 5
Dias-Damé 2011 (Female 2007-2008)
Low 1700 32.7 Quintiles familiar income
Quintile 1
Medium 22.5 Quintile 3 Quintile 5
High 16.1 Quintile 5
Dias-Damé 2011 (Female 2009-2010)
Low 1581 24.7 Quintiles familiar income
Quintile 1
Medium 24.6 Quintile 3 Quintile 5
High 12.1 Quintile 5

100
WHO Region
Continent Country Study and Subgroups of Smokers
Annual Family Income Stratum
N N Smokers
% of Smokers
Monetary Unit, Year
Annual Family Income limits
Adjusting variables
OR (95% CI) for Current Smoking
Lower Upper OR CI Lower Limit
CI Upper Limit
Dias-Damé 2011 (Males 2001-2002)
Low 1374 45.8 Quintiles familiar income
Quintile 1
Medium 34.1 Quintile 3 Quintile 5
High 24.3 Quintile 5
Dias-Damé 2011 (Males 2003-2004)
Low 1344 45 Quintiles familiar income
Quintile 1
Medium 30 Quintile 3 Quintile 5
High 16.4 Quintile 5
Dias-Damé 2011 (Male 2005-2006)
Low 1378 41.5 Quintiles familiar income
Quintile 1
Medium 28.3 Quintile 3 Quintile 5
High 20.4 Quintile 5
Dias-Damé 2011 (Males 2007-2008)
Low 1286 42.7 Quintiles familiar income
Quintile 1
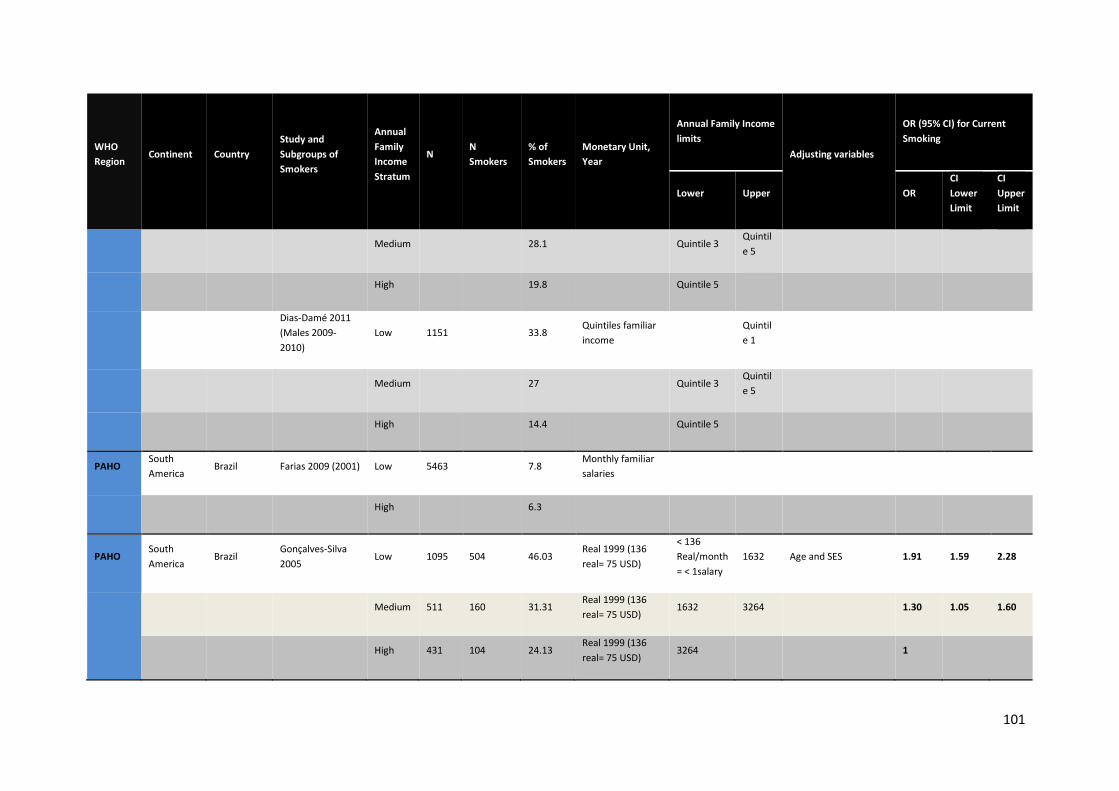
101
WHO Region
Continent Country Study and Subgroups of Smokers
Annual Family Income Stratum
N N Smokers
% of Smokers
Monetary Unit, Year
Annual Family Income limits
Adjusting variables
OR (95% CI) for Current Smoking
Lower Upper OR CI Lower Limit
CI Upper Limit
Medium 28.1 Quintile 3 Quintile 5
High 19.8 Quintile 5
Dias-Damé 2011 (Males 2009-2010)
Low 1151 33.8 Quintiles familiar income
Quintile 1
Medium 27 Quintile 3 Quintile 5
High 14.4 Quintile 5
PAHO South America
Brazil Farias 2009 (2001) Low 5463 7.8 Monthly familiar salaries
High 6.3
PAHO South America
Brazil Gonçalves-Silva 2005
Low 1095 504 46.03 Real 1999 (136 real= 75 USD)
< 136 Real/month= < 1salary
1632 Age and SES 1.91 1.59 2.28
Medium 511 160 31.31 Real 1999 (136 real= 75 USD)
1632 3264 1.30 1.05 1.60
High 431 104 24.13 Real 1999 (136 real= 75 USD)
3264 1
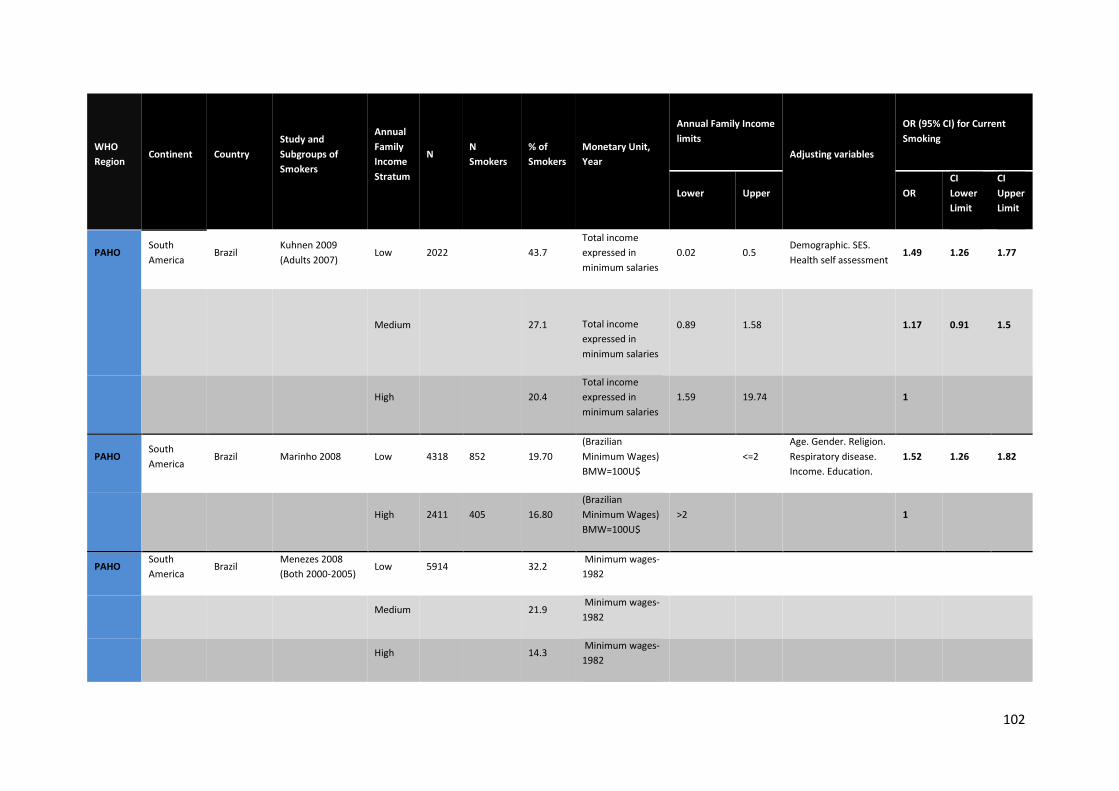
102
WHO Region
Continent Country Study and Subgroups of Smokers
Annual Family Income Stratum
N N Smokers
% of Smokers
Monetary Unit, Year
Annual Family Income limits
Adjusting variables
OR (95% CI) for Current Smoking
Lower Upper OR CI Lower Limit
CI Upper Limit
PAHO South America
Brazil Kuhnen 2009 (Adults 2007)
Low 2022 43.7 Total income expressed in minimum salaries
0.02 0.5 Demographic. SES. Health self assessment
1.49 1.26 1.77
Medium 27.1
Total income expressed in minimum salaries
0.89 1.58 1.17 0.91 1.5
High 20.4 Total income expressed in minimum salaries
1.59 19.74 1
PAHO South America
Brazil Marinho 2008 Low 4318 852 19.70 (Brazilian Minimum Wages) BMW=100U$
<=2 Age. Gender. Religion. Respiratory disease. Income. Education.
1.52 1.26 1.82
High 2411 405 16.80 (Brazilian Minimum Wages) BMW=100U$
>2 1
PAHO South America
Brazil Menezes 2008 (Both 2000-2005)
Low 5914 32.2 Minimum wages-1982
Medium 21.9 Minimum wages-1982
High 14.3 Minimum wages-1982
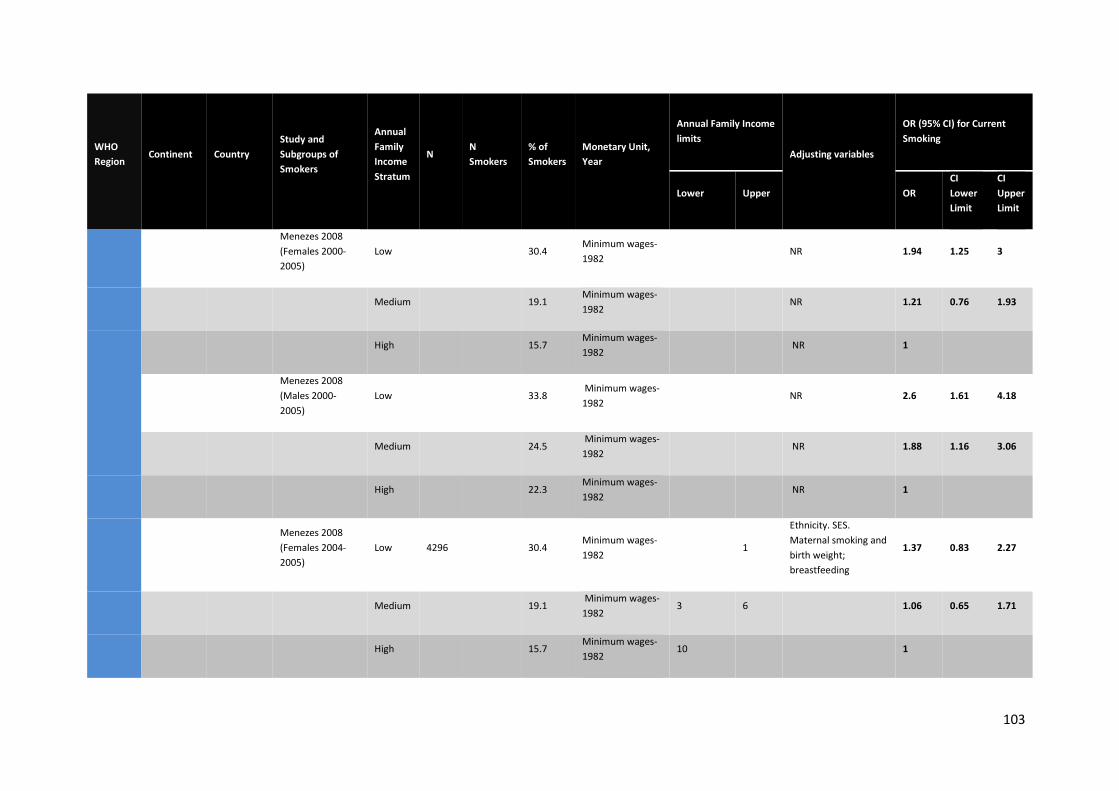
103
WHO Region
Continent Country Study and Subgroups of Smokers
Annual Family Income Stratum
N N Smokers
% of Smokers
Monetary Unit, Year
Annual Family Income limits
Adjusting variables
OR (95% CI) for Current Smoking
Lower Upper OR CI Lower Limit
CI Upper Limit
Menezes 2008 (Females 2000-2005)
Low 30.4 Minimum wages-1982
NR 1.94 1.25 3
Medium 19.1 Minimum wages-1982
NR 1.21 0.76 1.93
High 15.7 Minimum wages-1982
NR 1
Menezes 2008 (Males 2000-2005)
Low 33.8 Minimum wages-1982
NR 2.6 1.61 4.18
Medium 24.5 Minimum wages-1982
NR 1.88 1.16 3.06
High 22.3 Minimum wages-1982
NR 1
Menezes 2008 (Females 2004-2005)
Low 4296 30.4 Minimum wages-1982
1
Ethnicity. SES. Maternal smoking and birth weight; breastfeeding
1.37 0.83 2.27
Medium 19.1 Minimum wages-1982
3 6 1.06 0.65 1.71
High 15.7 Minimum wages-1982
10 1
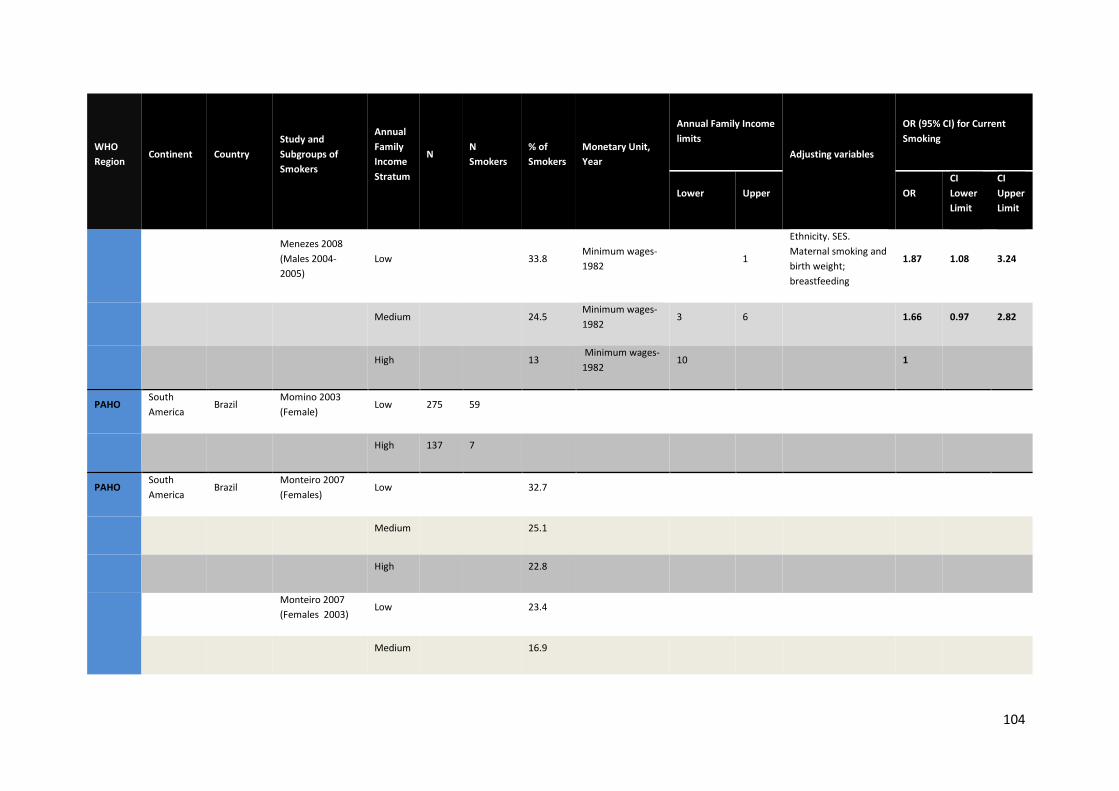
104
WHO Region
Continent Country Study and Subgroups of Smokers
Annual Family Income Stratum
N N Smokers
% of Smokers
Monetary Unit, Year
Annual Family Income limits
Adjusting variables
OR (95% CI) for Current Smoking
Lower Upper OR CI Lower Limit
CI Upper Limit
Menezes 2008 (Males 2004-2005)
Low 33.8 Minimum wages-1982
1
Ethnicity. SES. Maternal smoking and birth weight; breastfeeding
1.87 1.08 3.24
Medium 24.5 Minimum wages-1982
3 6 1.66 0.97 2.82
High 13 Minimum wages-1982
10 1
PAHO South America
Brazil Momino 2003 (Female)
Low 275 59
High 137 7
PAHO South America
Brazil Monteiro 2007 (Females)
Low
32.7
Medium 25.1
High 22.8
Monteiro 2007 (Females 2003)
Low
23.4
Medium 16.9
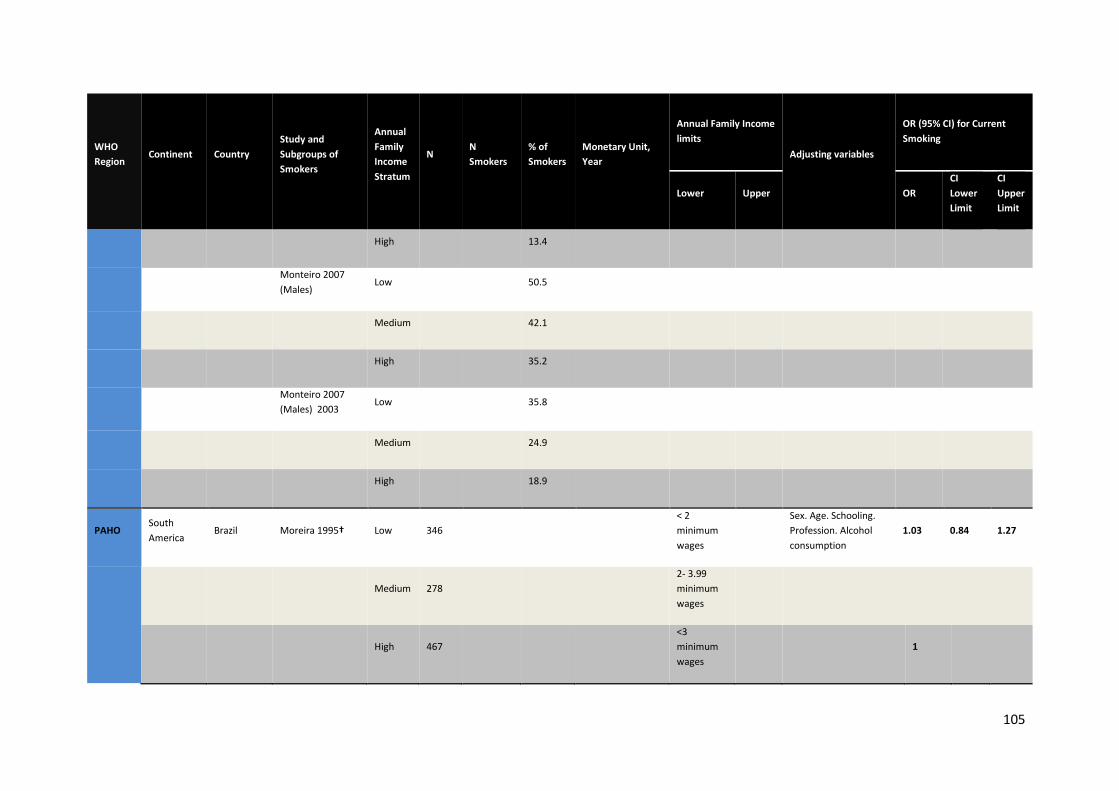
105
WHO Region
Continent Country Study and Subgroups of Smokers
Annual Family Income Stratum
N N Smokers
% of Smokers
Monetary Unit, Year
Annual Family Income limits
Adjusting variables
OR (95% CI) for Current Smoking
Lower Upper OR CI Lower Limit
CI Upper Limit
High 13.4
Monteiro 2007 (Males)
Low
50.5
Medium 42.1
High 35.2
Monteiro 2007 (Males) 2003
Low
35.8
Medium 24.9
High 18.9
PAHO South America
Brazil Moreira 1995† Low 346
< 2 minimum wages
Sex. Age. Schooling. Profession. Alcohol consumption
1.03 0.84 1.27
Medium 278 2- 3.99 minimum wages
High 467 <3 minimum wages
1
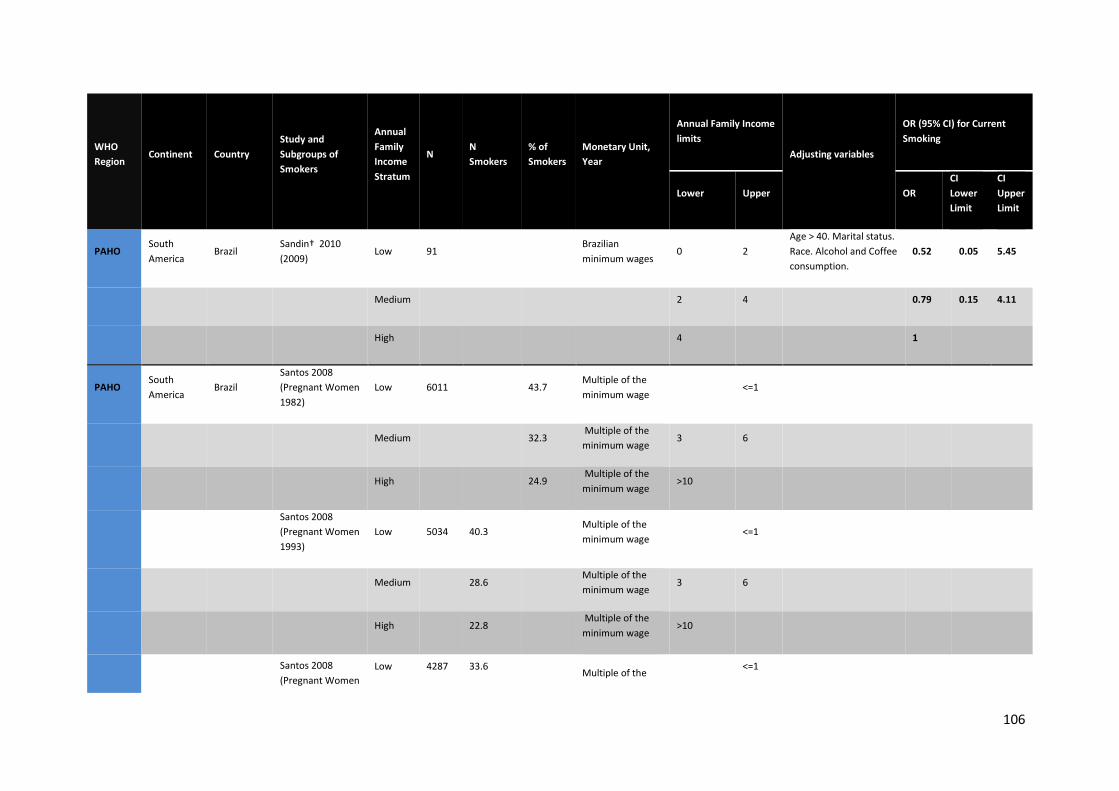
106
WHO Region
Continent Country Study and Subgroups of Smokers
Annual Family Income Stratum
N N Smokers
% of Smokers
Monetary Unit, Year
Annual Family Income limits
Adjusting variables
OR (95% CI) for Current Smoking
Lower Upper OR CI Lower Limit
CI Upper Limit
PAHO South America
Brazil Sandin† 2010 (2009)
Low 91 Brazilian minimum wages
0 2 Age > 40. Marital status. Race. Alcohol and Coffee consumption.
0.52 0.05 5.45
Medium 2 4 0.79 0.15 4.11
High 4 1
PAHO South America
Brazil Santos 2008 (Pregnant Women 1982)
Low 6011 43.7 Multiple of the minimum wage
<=1
Medium 32.3 Multiple of the minimum wage
3 6
High 24.9 Multiple of the minimum wage
>10
Santos 2008 (Pregnant Women 1993)
Low 5034 40.3 Multiple of the minimum wage
<=1
Medium 28.6 Multiple of the minimum wage
3 6
High 22.8 Multiple of the minimum wage
>10
Santos 2008 (Pregnant Women
Low 4287 33.6 Multiple of the <=1
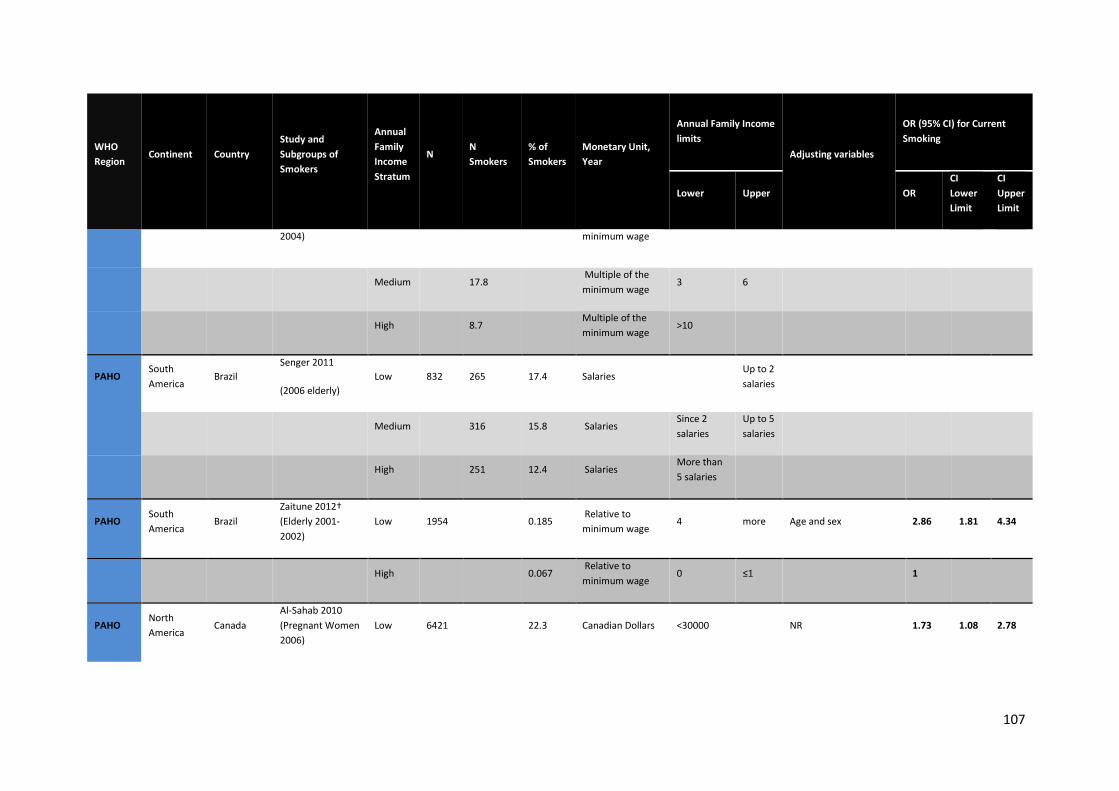
107
WHO Region
Continent Country Study and Subgroups of Smokers
Annual Family Income Stratum
N N Smokers
% of Smokers
Monetary Unit, Year
Annual Family Income limits
Adjusting variables
OR (95% CI) for Current Smoking
Lower Upper OR CI Lower Limit
CI Upper Limit
2004) minimum wage
Medium 17.8 Multiple of the minimum wage
3 6
High 8.7 Multiple of the minimum wage
>10
PAHO South America
Brazil Senger 2011
(2006 elderly) Low 832 265 17.4 Salaries
Up to 2 salaries
Medium 316 15.8 Salaries Since 2 salaries
Up to 5 salaries
High 251 12.4 Salaries More than 5 salaries
PAHO South America
Brazil Zaitune 2012† (Elderly 2001-2002)
Low 1954 0.185 Relative to minimum wage
4 more Age and sex 2.86 1.81 4.34
High 0.067 Relative to minimum wage
0 ≤1 1
PAHO North America
Canada Al-Sahab 2010 (Pregnant Women 2006)
Low 6421 22.3 Canadian Dollars <30000 NR 1.73 1.08 2.78
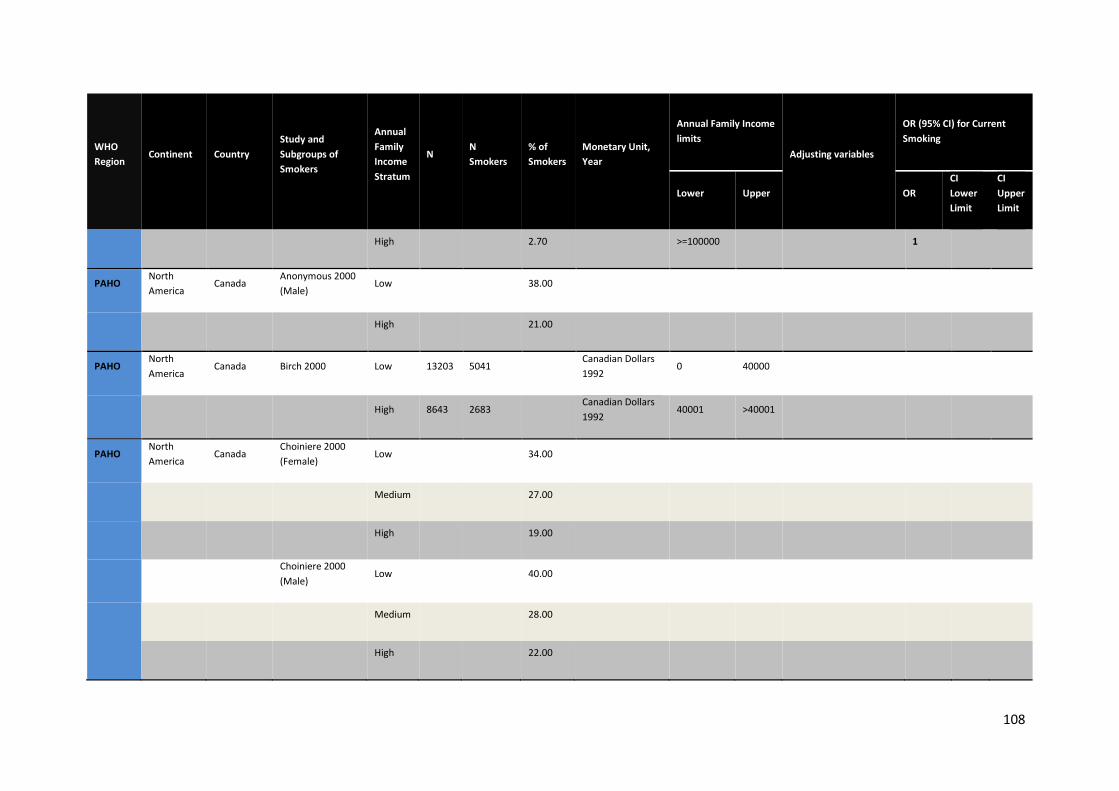
108
WHO Region
Continent Country Study and Subgroups of Smokers
Annual Family Income Stratum
N N Smokers
% of Smokers
Monetary Unit, Year
Annual Family Income limits
Adjusting variables
OR (95% CI) for Current Smoking
Lower Upper OR CI Lower Limit
CI Upper Limit
High 2.70 >=100000 1
PAHO North America
Canada Anonymous 2000 (Male)
Low
38.00
High 21.00
PAHO North America
Canada Birch 2000 Low 13203 5041
Canadian Dollars 1992
0 40000
High 8643 2683 Canadian Dollars 1992
40001 >40001
PAHO North America
Canada Choiniere 2000 (Female)
Low
34.00
Medium 27.00
High 19.00
Choiniere 2000 (Male)
Low
40.00
Medium 28.00
High 22.00
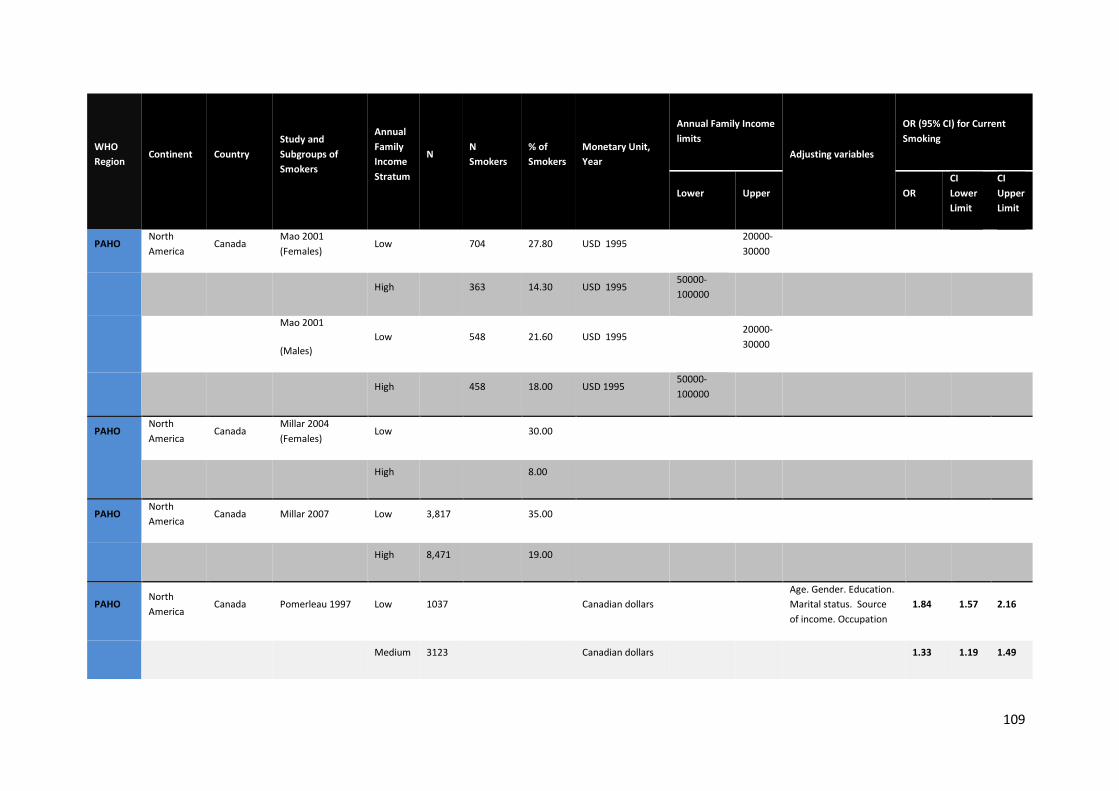
109
WHO Region
Continent Country Study and Subgroups of Smokers
Annual Family Income Stratum
N N Smokers
% of Smokers
Monetary Unit, Year
Annual Family Income limits
Adjusting variables
OR (95% CI) for Current Smoking
Lower Upper OR CI Lower Limit
CI Upper Limit
PAHO North America
Canada Mao 2001 (Females)
Low
704 27.80 USD 1995
20000-30000
High 363 14.30 USD 1995 50000-100000
Mao 2001
(Males) Low
548 21.60 USD 1995
20000-30000
High 458 18.00 USD 1995 50000-100000
PAHO North America
Canada Millar 2004 (Females)
Low
30.00
High 8.00
PAHO North America
Canada Millar 2007 Low 3,817
35.00
High 8,471 19.00
PAHO North America
Canada Pomerleau 1997 Low 1037
Canadian dollars
Age. Gender. Education. Marital status. Source of income. Occupation
1.84 1.57 2.16
Medium 3123 Canadian dollars 1.33 1.19 1.49
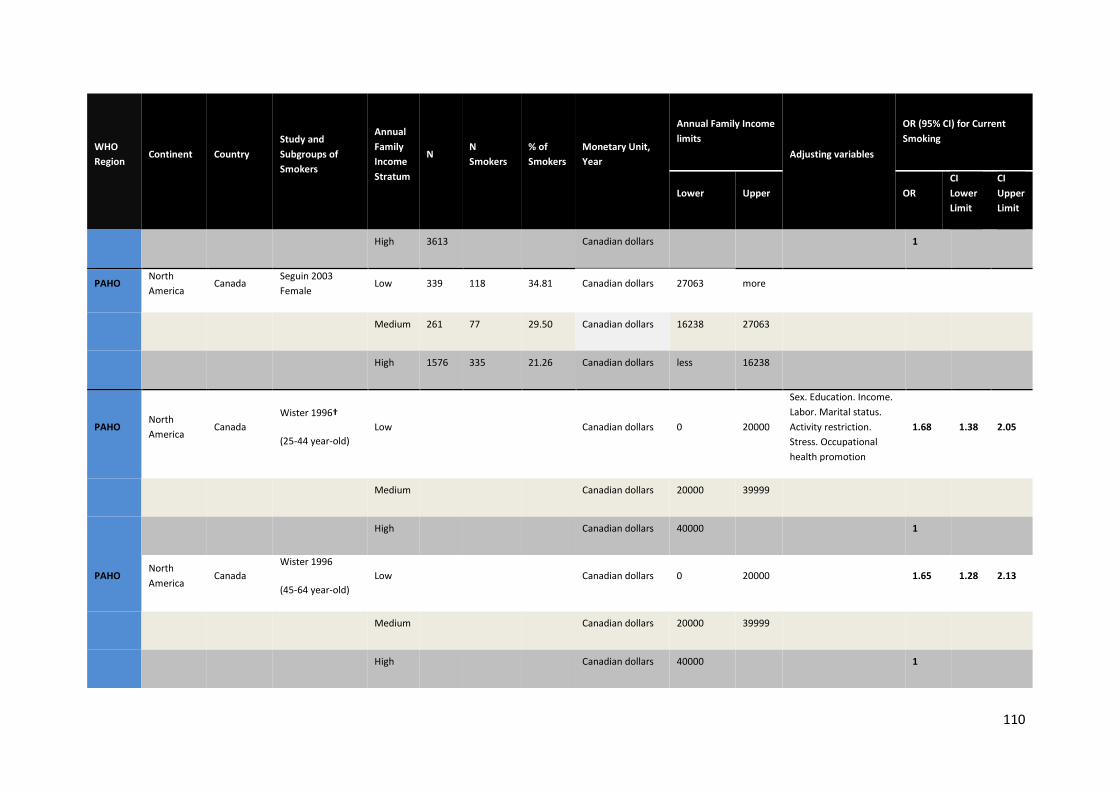
110
WHO Region
Continent Country Study and Subgroups of Smokers
Annual Family Income Stratum
N N Smokers
% of Smokers
Monetary Unit, Year
Annual Family Income limits
Adjusting variables
OR (95% CI) for Current Smoking
Lower Upper OR CI Lower Limit
CI Upper Limit
High 3613 Canadian dollars 1
PAHO North America
Canada Seguin 2003 Female
Low 339 118 34.81 Canadian dollars 27063 more
Medium 261 77 29.50 Canadian dollars 16238 27063
High 1576 335 21.26 Canadian dollars less 16238
PAHO North America
Canada Wister 1996†
(25-44 year-old) Low
Canadian dollars 0 20000
Sex. Education. Income. Labor. Marital status. Activity restriction. Stress. Occupational health promotion
1.68 1.38 2.05
Medium Canadian dollars 20000 39999
High Canadian dollars 40000 1
PAHO North America
Canada Wister 1996
(45-64 year-old) Low
Canadian dollars 0 20000
1.65 1.28 2.13
Medium Canadian dollars 20000 39999
High Canadian dollars 40000 1
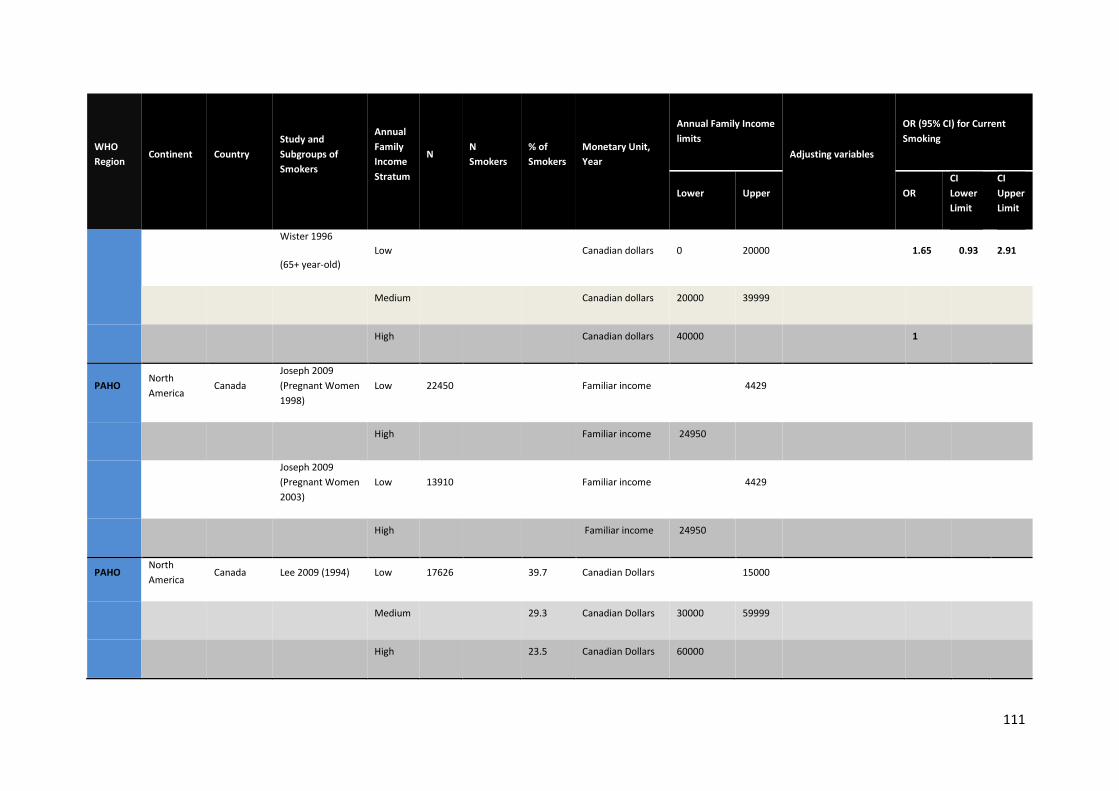
111
WHO Region
Continent Country Study and Subgroups of Smokers
Annual Family Income Stratum
N N Smokers
% of Smokers
Monetary Unit, Year
Annual Family Income limits
Adjusting variables
OR (95% CI) for Current Smoking
Lower Upper OR CI Lower Limit
CI Upper Limit
Wister 1996
(65+ year-old) Low
Canadian dollars 0 20000
1.65 0.93 2.91
Medium Canadian dollars 20000 39999
High Canadian dollars 40000 1
PAHO North America
Canada Joseph 2009 (Pregnant Women 1998)
Low 22450 Familiar income 4429
High Familiar income 24950
Joseph 2009 (Pregnant Women 2003)
Low 13910 Familiar income 4429
High Familiar income 24950
PAHO North America
Canada Lee 2009 (1994) Low 17626 39.7 Canadian Dollars 15000
Medium 29.3 Canadian Dollars 30000 59999
High 23.5 Canadian Dollars 60000
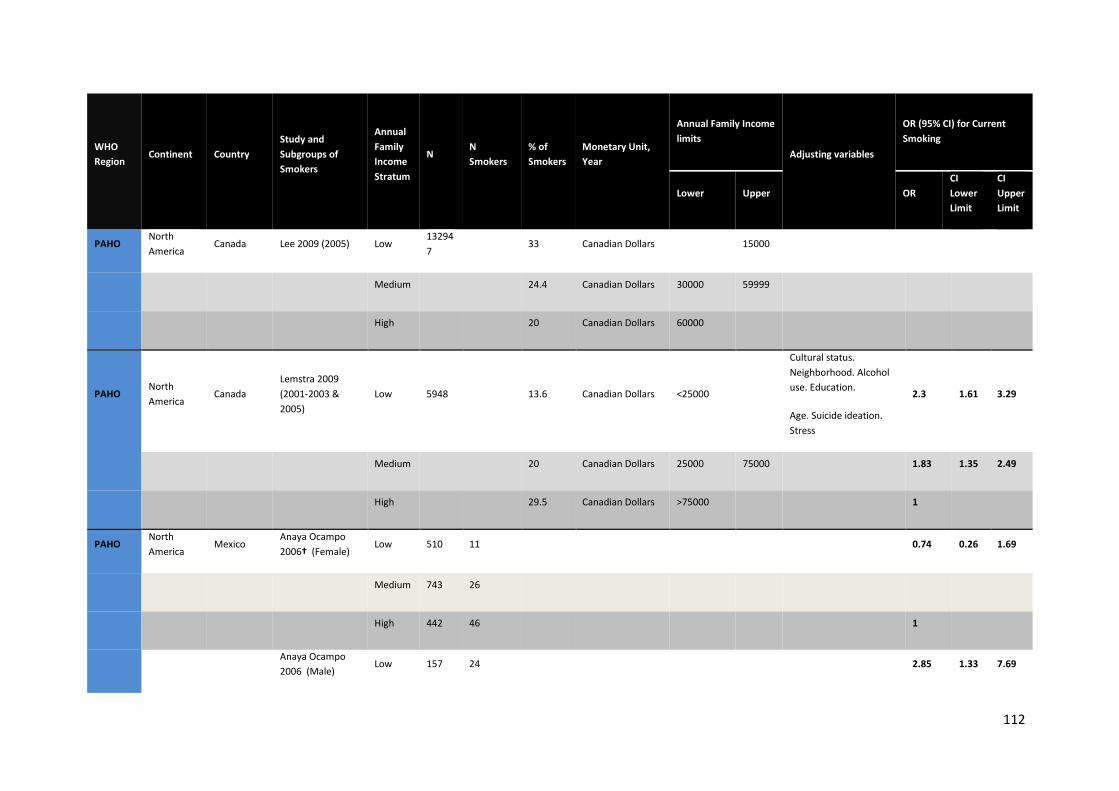
112
WHO Region
Continent Country Study and Subgroups of Smokers
Annual Family Income Stratum
N N Smokers
% of Smokers
Monetary Unit, Year
Annual Family Income limits
Adjusting variables
OR (95% CI) for Current Smoking
Lower Upper OR CI Lower Limit
CI Upper Limit
PAHO North America
Canada Lee 2009 (2005) Low 132947
33 Canadian Dollars 15000
Medium 24.4 Canadian Dollars 30000 59999
High 20 Canadian Dollars 60000
PAHO North America
Canada Lemstra 2009 (2001-2003 & 2005)
Low 5948 13.6 Canadian Dollars <25000
Cultural status. Neighborhood. Alcohol use. Education.
Age. Suicide ideation. Stress
2.3 1.61 3.29
Medium 20 Canadian Dollars 25000 75000 1.83 1.35 2.49
High 29.5 Canadian Dollars >75000 1
PAHO North America
Mexico Anaya Ocampo 2006† (Female)
Low 510 11
0.74 0.26 1.69
Medium 743 26
High 442 46 1
Anaya Ocampo 2006 (Male)
Low 157 24
2.85 1.33 7.69
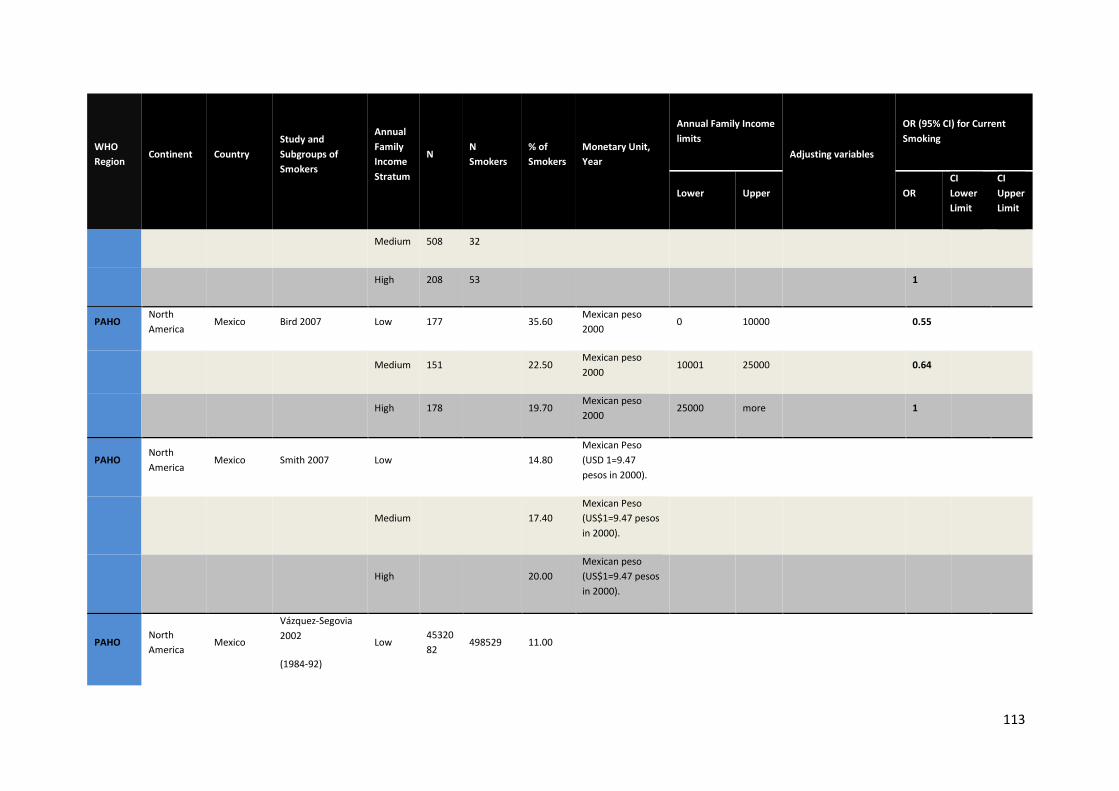
113
WHO Region
Continent Country Study and Subgroups of Smokers
Annual Family Income Stratum
N N Smokers
% of Smokers
Monetary Unit, Year
Annual Family Income limits
Adjusting variables
OR (95% CI) for Current Smoking
Lower Upper OR CI Lower Limit
CI Upper Limit
Medium 508 32
High 208 53 1
PAHO North America
Mexico Bird 2007 Low 177
35.60 Mexican peso 2000
0 10000
0.55
Medium 151 22.50 Mexican peso 2000
10001 25000 0.64
High 178 19.70 Mexican peso 2000
25000 more 1
PAHO North America
Mexico Smith 2007 Low
14.80 Mexican Peso (USD 1=9.47 pesos in 2000).
Medium 17.40 Mexican Peso (US$1=9.47 pesos in 2000).
High 20.00 Mexican peso (US$1=9.47 pesos in 2000).
PAHO North America
Mexico
Vázquez-Segovia 2002
(1984-92)
Low 4532082
498529 11.00
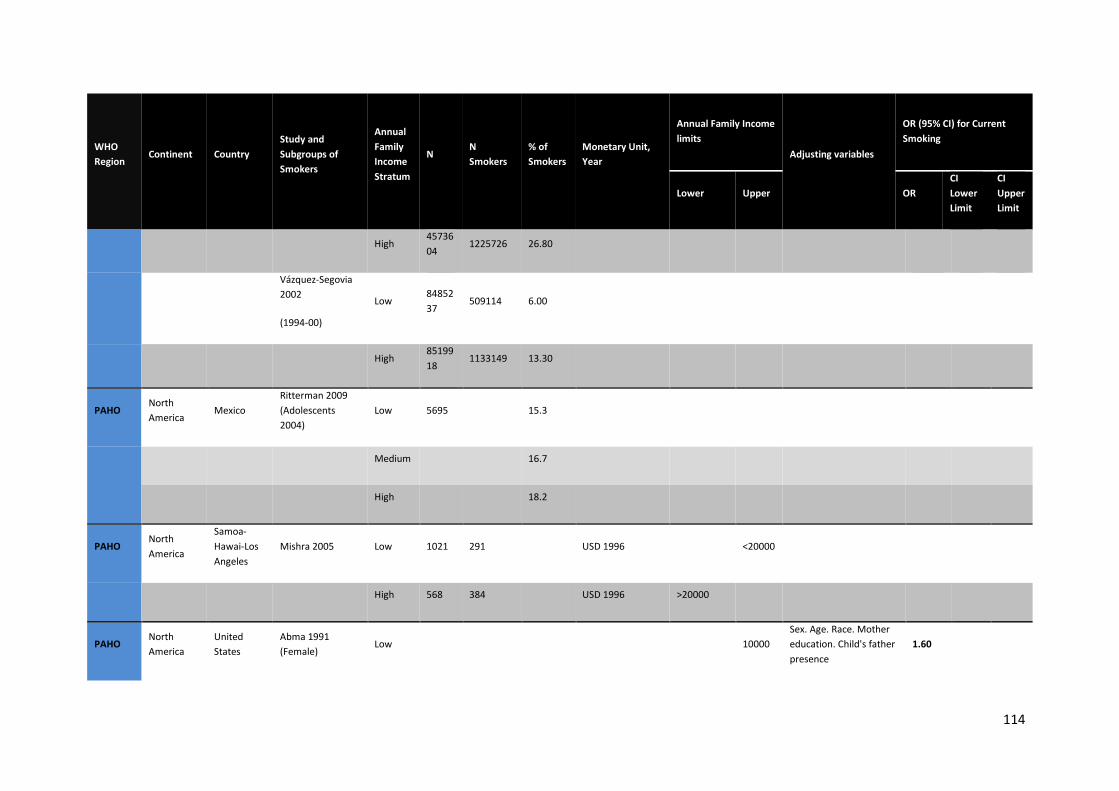
114
WHO Region
Continent Country Study and Subgroups of Smokers
Annual Family Income Stratum
N N Smokers
% of Smokers
Monetary Unit, Year
Annual Family Income limits
Adjusting variables
OR (95% CI) for Current Smoking
Lower Upper OR CI Lower Limit
CI Upper Limit
High 4573604
1225726 26.80
Vázquez-Segovia 2002
(1994-00)
Low 8485237
509114 6.00
High 8519918
1133149 13.30
PAHO North America
Mexico Ritterman 2009 (Adolescents 2004)
Low 5695 15.3
Medium 16.7
High 18.2
PAHO North America
Samoa-Hawai-Los Angeles
Mishra 2005 Low 1021 291
USD 1996
<20000
High 568 384 USD 1996 >20000
PAHO North America
United States
Abma 1991 (Female)
Low
10000 Sex. Age. Race. Mother education. Child's father presence
1.60
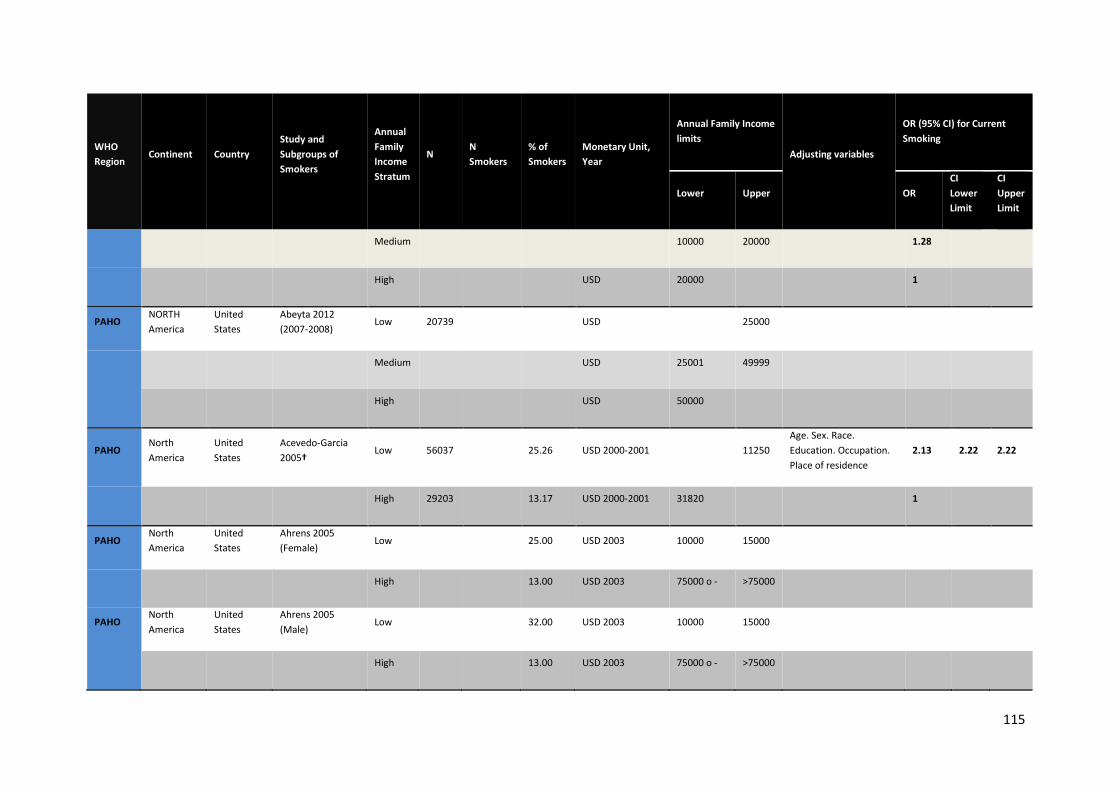
115
WHO Region
Continent Country Study and Subgroups of Smokers
Annual Family Income Stratum
N N Smokers
% of Smokers
Monetary Unit, Year
Annual Family Income limits
Adjusting variables
OR (95% CI) for Current Smoking
Lower Upper OR CI Lower Limit
CI Upper Limit
Medium 10000 20000 1.28
High USD 20000 1
PAHO NORTH America
United States
Abeyta 2012 (2007-2008)
Low 20739 USD 25000
Medium USD 25001 49999
High USD 50000
PAHO North America
United States
Acevedo-Garcia 2005†
Low 56037
25.26 USD 2000-2001
11250 Age. Sex. Race. Education. Occupation. Place of residence
2.13 2.22 2.22
High 29203 13.17 USD 2000-2001 31820 1
PAHO North America
United States
Ahrens 2005 (Female)
Low
25.00 USD 2003 10000 15000
High 13.00 USD 2003 75000 o - >75000
PAHO North America
United States
Ahrens 2005 (Male)
Low
32.00 USD 2003 10000 15000
High 13.00 USD 2003 75000 o - >75000
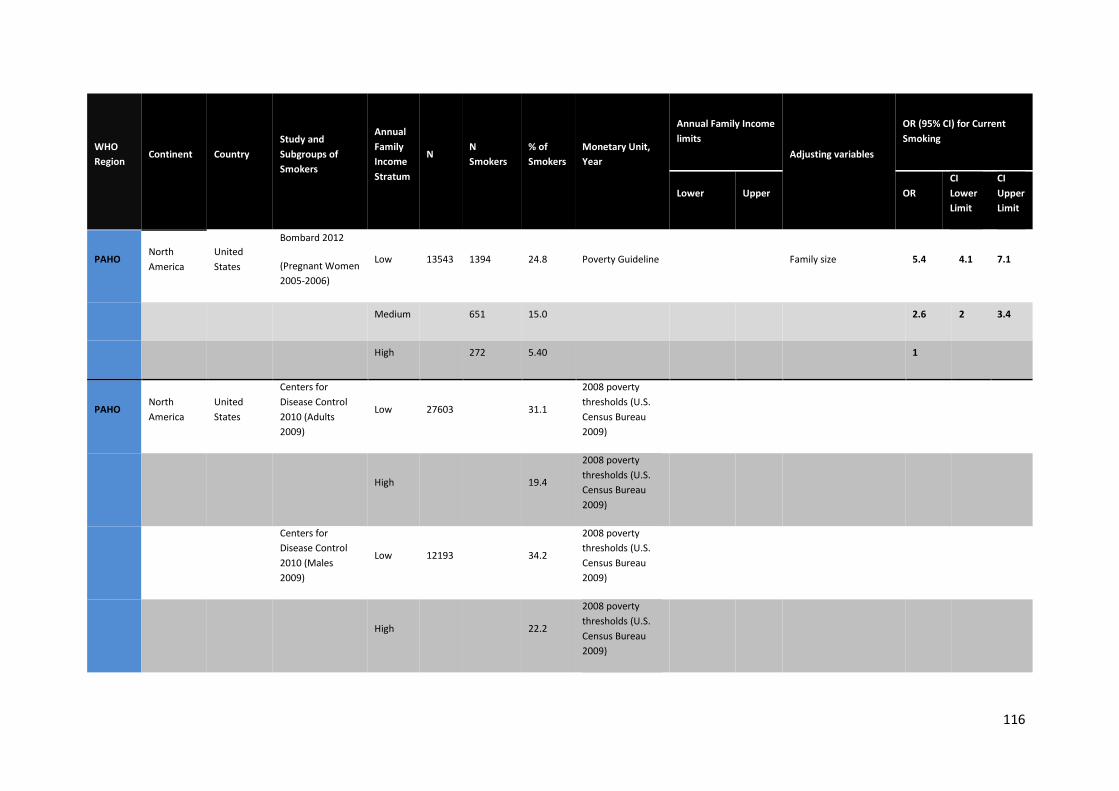
116
WHO Region
Continent Country Study and Subgroups of Smokers
Annual Family Income Stratum
N N Smokers
% of Smokers
Monetary Unit, Year
Annual Family Income limits
Adjusting variables
OR (95% CI) for Current Smoking
Lower Upper OR CI Lower Limit
CI Upper Limit
PAHO North America
United States
Bombard 2012
(Pregnant Women 2005-2006)
Low 13543 1394 24.8 Poverty Guideline Family size 5.4 4.1 7.1
Medium 651 15.0 2.6 2 3.4
High 272 5.40 1
PAHO North America
United States
Centers for Disease Control 2010 (Adults 2009)
Low 27603 31.1
2008 poverty thresholds (U.S. Census Bureau 2009)
High 19.4
2008 poverty thresholds (U.S. Census Bureau 2009)
Centers for Disease Control 2010 (Males 2009)
Low 12193 34.2
2008 poverty thresholds (U.S. Census Bureau 2009)
High 22.2
2008 poverty thresholds (U.S. Census Bureau 2009)
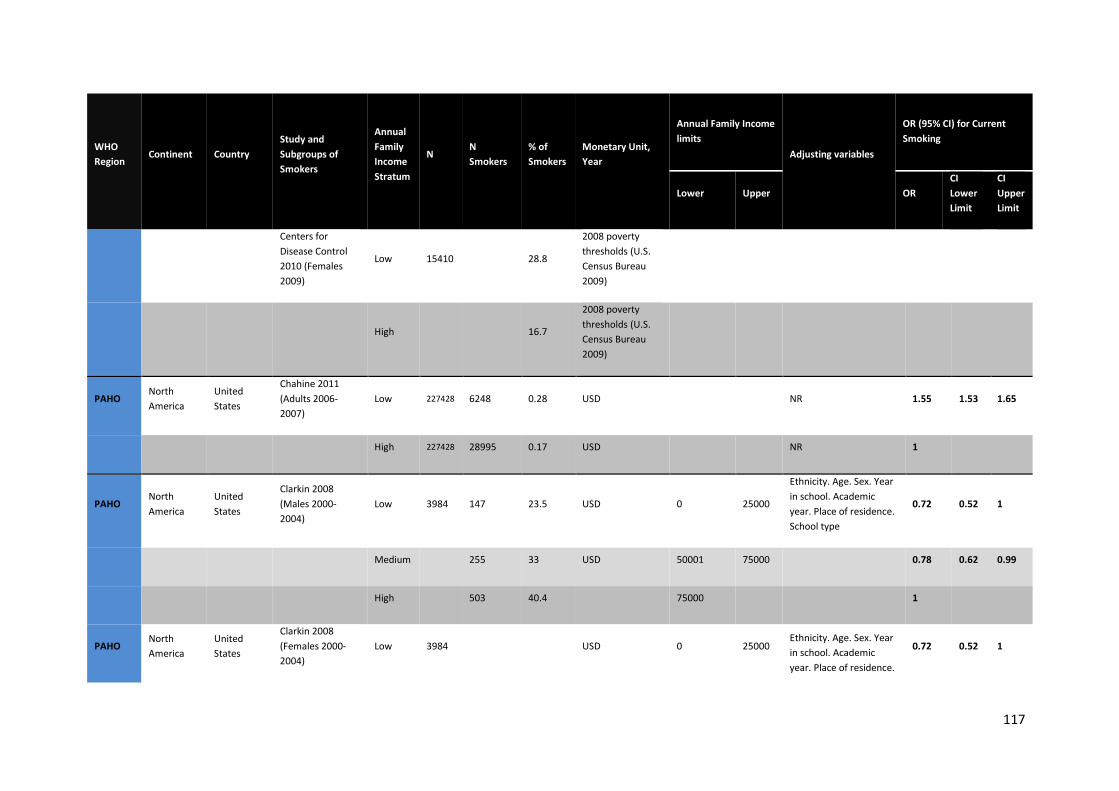
117
WHO Region
Continent Country Study and Subgroups of Smokers
Annual Family Income Stratum
N N Smokers
% of Smokers
Monetary Unit, Year
Annual Family Income limits
Adjusting variables
OR (95% CI) for Current Smoking
Lower Upper OR CI Lower Limit
CI Upper Limit
Centers for Disease Control 2010 (Females 2009)
Low 15410 28.8
2008 poverty thresholds (U.S. Census Bureau 2009)
High 16.7
2008 poverty thresholds (U.S. Census Bureau 2009)
PAHO North America
United States
Chahine 2011 (Adults 2006-2007)
Low 227428 6248 0.28 USD NR 1.55 1.53 1.65
High 227428 28995 0.17 USD NR 1
PAHO North America
United States
Clarkin 2008 (Males 2000-2004)
Low 3984 147 23.5 USD 0 25000
Ethnicity. Age. Sex. Year in school. Academic year. Place of residence. School type
0.72 0.52 1
Medium 255 33 USD 50001 75000 0.78 0.62 0.99
High 503 40.4 75000 1
PAHO North America
United States
Clarkin 2008 (Females 2000-2004)
Low 3984 USD 0 25000 Ethnicity. Age. Sex. Year in school. Academic year. Place of residence.
0.72 0.52 1
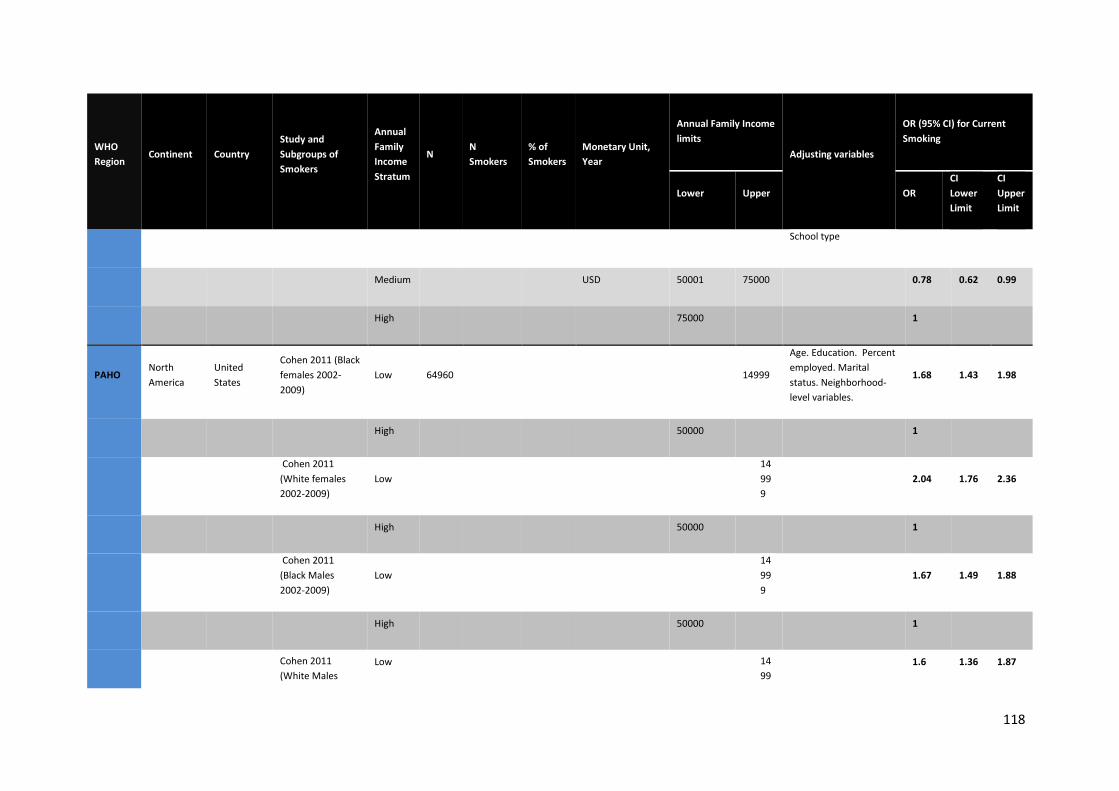
118
WHO Region
Continent Country Study and Subgroups of Smokers
Annual Family Income Stratum
N N Smokers
% of Smokers
Monetary Unit, Year
Annual Family Income limits
Adjusting variables
OR (95% CI) for Current Smoking
Lower Upper OR CI Lower Limit
CI Upper Limit
School type
Medium USD 50001 75000 0.78 0.62 0.99
High 75000 1
PAHO North America
United States
Cohen 2011 (Black females 2002-2009)
Low 64960 14999
Age. Education. Percent employed. Marital status. Neighborhood-level variables.
1.68 1.43 1.98
High 50000 1
Cohen 2011 (White females 2002-2009)
Low
14999
2.04 1.76 2.36
High 50000 1
Cohen 2011 (Black Males 2002-2009)
Low
14999
1.67 1.49 1.88
High 50000 1
Cohen 2011 (White Males
Low
1499
1.6 1.36 1.87
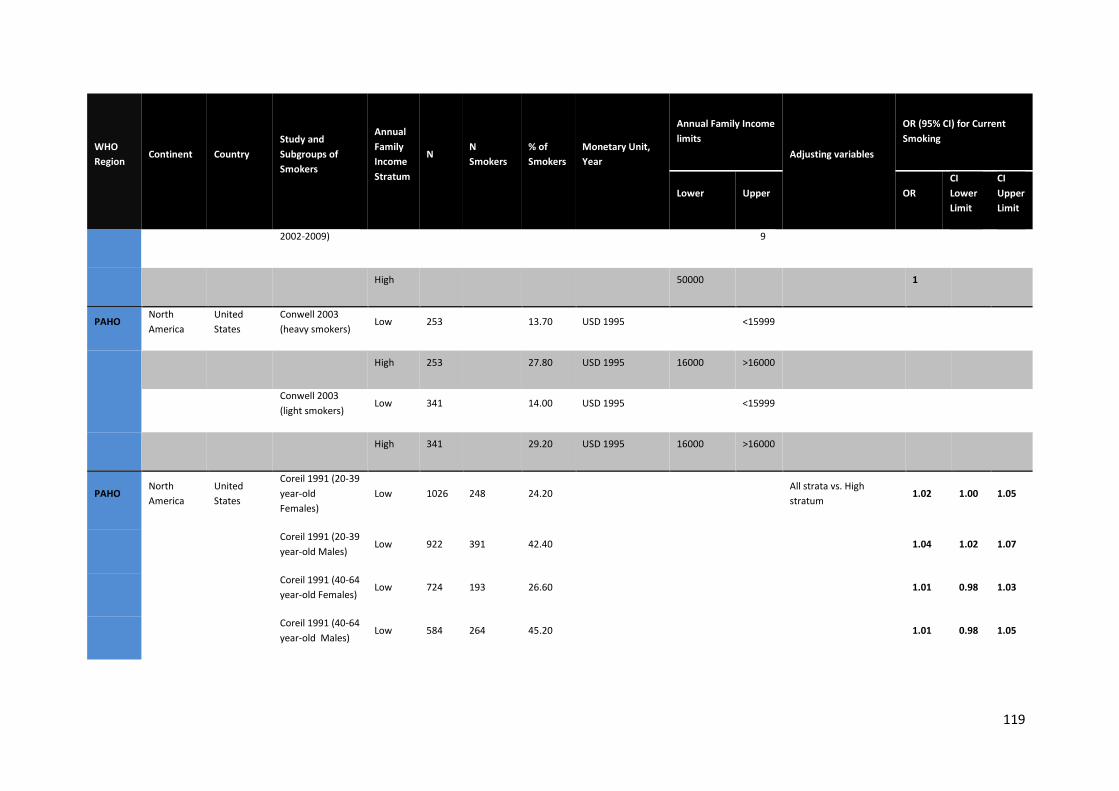
119
WHO Region
Continent Country Study and Subgroups of Smokers
Annual Family Income Stratum
N N Smokers
% of Smokers
Monetary Unit, Year
Annual Family Income limits
Adjusting variables
OR (95% CI) for Current Smoking
Lower Upper OR CI Lower Limit
CI Upper Limit
2002-2009) 9
High 50000 1
PAHO North America
United States
Conwell 2003 (heavy smokers)
Low 253
13.70 USD 1995
<15999
High 253 27.80 USD 1995 16000 >16000
Conwell 2003 (light smokers)
Low 341
14.00 USD 1995
<15999
High 341 29.20 USD 1995 16000 >16000
PAHO North America
United States
Coreil 1991 (20-39 year-old Females)
Low 1026 248 24.20
All strata vs. High stratum
1.02 1.00 1.05
Coreil 1991 (20-39 year-old Males)
Low 922 391 42.40
1.04 1.02 1.07
Coreil 1991 (40-64 year-old Females)
Low 724 193 26.60
1.01 0.98 1.03
Coreil 1991 (40-64 year-old Males)
Low 584 264 45.20
1.01 0.98 1.05
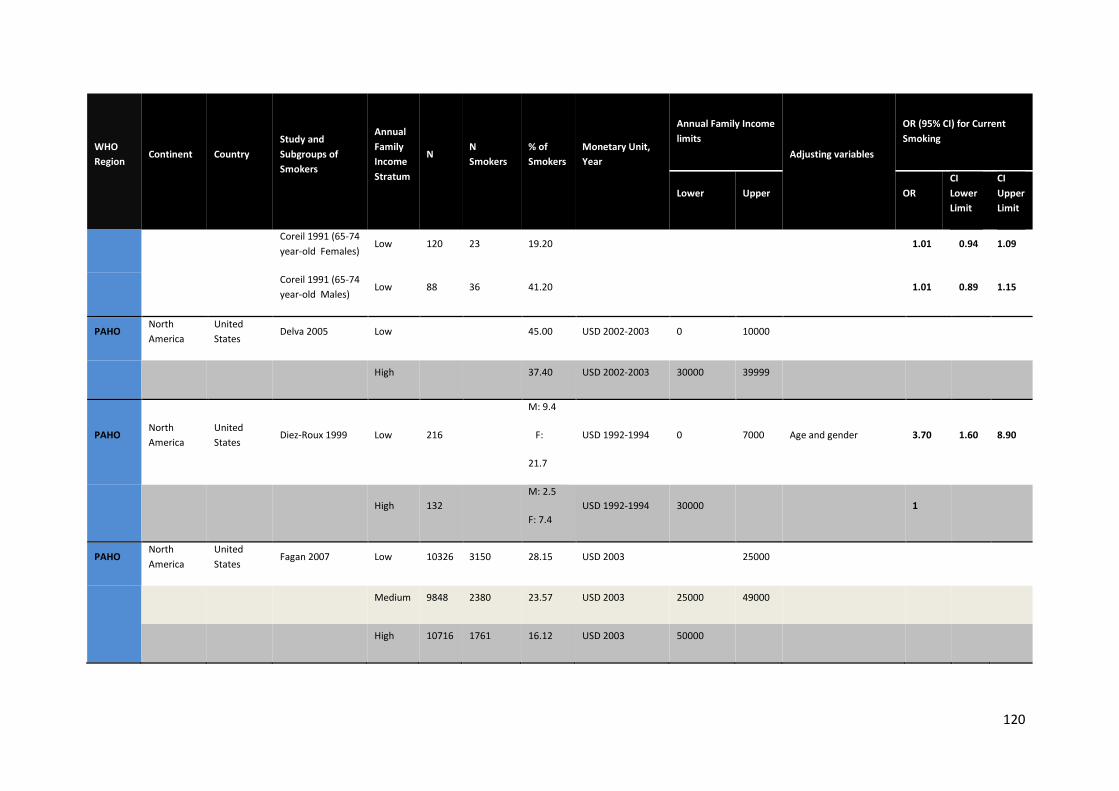
120
WHO Region
Continent Country Study and Subgroups of Smokers
Annual Family Income Stratum
N N Smokers
% of Smokers
Monetary Unit, Year
Annual Family Income limits
Adjusting variables
OR (95% CI) for Current Smoking
Lower Upper OR CI Lower Limit
CI Upper Limit
Coreil 1991 (65-74 year-old Females)
Low 120 23 19.20
1.01 0.94 1.09
Coreil 1991 (65-74 year-old Males)
Low 88 36 41.20 1.01 0.89 1.15
PAHO North America
United States
Delva 2005 Low
45.00 USD 2002-2003 0 10000
High 37.40 USD 2002-2003 30000 39999
PAHO North America
United States
Diez-Roux 1999 Low 216
M: 9.4
F:
21.7
USD 1992-1994 0 7000 Age and gender 3.70 1.60 8.90
High 132 M: 2.5
F: 7.4 USD 1992-1994 30000 1
PAHO North America
United States
Fagan 2007 Low 10326 3150 28.15 USD 2003
25000
Medium 9848 2380 23.57 USD 2003 25000 49000
High 10716 1761 16.12 USD 2003 50000
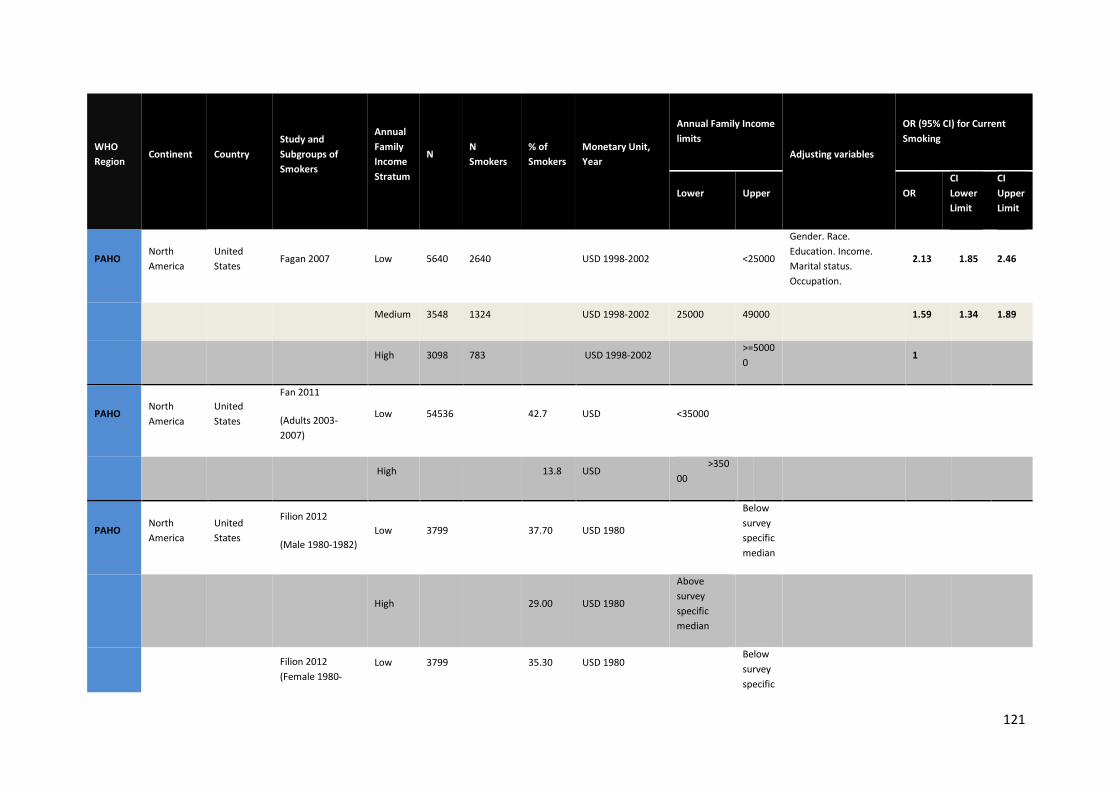
121
WHO Region
Continent Country Study and Subgroups of Smokers
Annual Family Income Stratum
N N Smokers
% of Smokers
Monetary Unit, Year
Annual Family Income limits
Adjusting variables
OR (95% CI) for Current Smoking
Lower Upper OR CI Lower Limit
CI Upper Limit
PAHO North America
United States
Fagan 2007 Low 5640 2640
USD 1998-2002
<25000
Gender. Race. Education. Income. Marital status. Occupation.
2.13 1.85 2.46
Medium 3548 1324 USD 1998-2002 25000 49000 1.59 1.34 1.89
High 3098 783 USD 1998-2002 >=50000
1
PAHO North America
United States
Fan 2011
(Adults 2003-2007)
Low 54536 42.7 USD <35000
High
13.8 USD >35000
PAHO North America
United States
Filion 2012
(Male 1980-1982) Low 3799 37.70 USD 1980
Below survey specific median
High 29.00 USD 1980
Above survey specific median
Filion 2012 (Female 1980-
Low 3799 35.30 USD 1980 Below survey specific

122
WHO Region
Continent Country Study and Subgroups of Smokers
Annual Family Income Stratum
N N Smokers
% of Smokers
Monetary Unit, Year
Annual Family Income limits
Adjusting variables
OR (95% CI) for Current Smoking
Lower Upper OR CI Lower Limit
CI Upper Limit
1982) median
High 30.60 USD 1980
Above survey specific median
Filion 2012
(Male 1985-1987) Low 4641 40.20 USD 1985
Below survey specific median
High 23.00 USD 1985
Above survey specific median
Filion 2012 (Female 1985-1987)
Low 4641 28.30 USD 1985
Below survey specific median
High 21.40 USD 1985
Above survey specific median
Filion 2012
(Male 1990-1992) Low 5059 30.20 USD 1990
Below survey specific
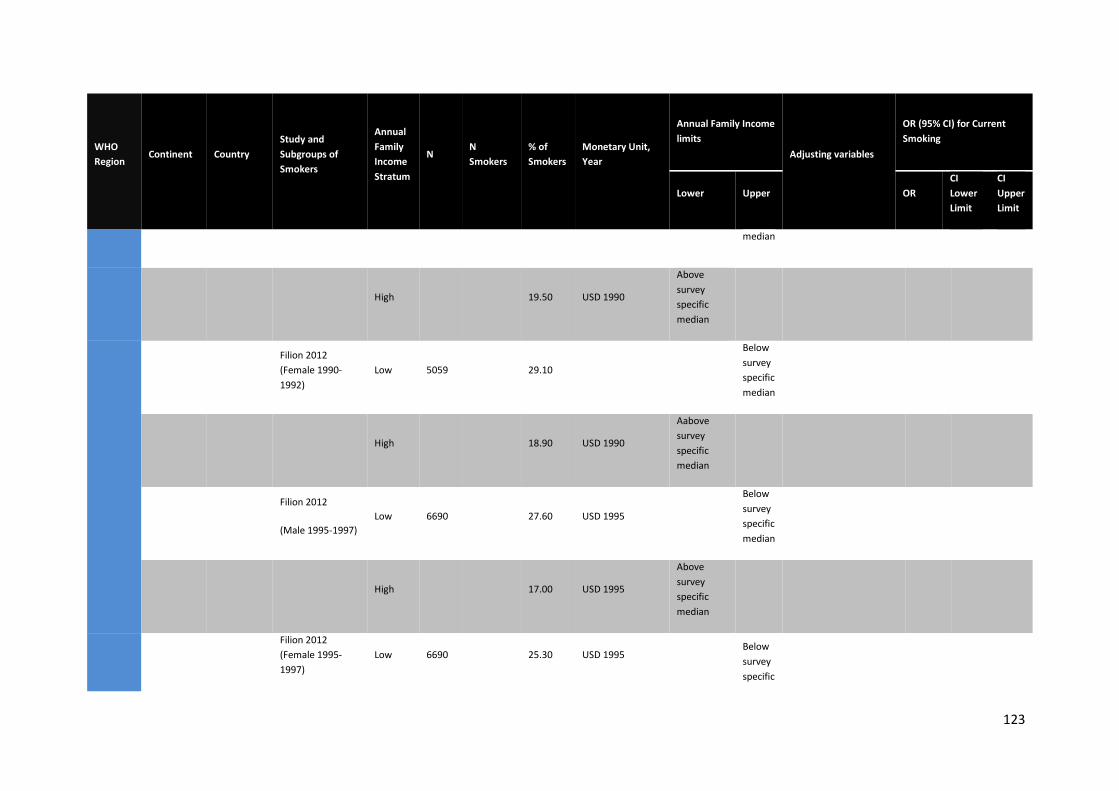
123
WHO Region
Continent Country Study and Subgroups of Smokers
Annual Family Income Stratum
N N Smokers
% of Smokers
Monetary Unit, Year
Annual Family Income limits
Adjusting variables
OR (95% CI) for Current Smoking
Lower Upper OR CI Lower Limit
CI Upper Limit
median
High 19.50 USD 1990
Above survey specific median
Filion 2012 (Female 1990-1992)
Low 5059 29.10
Below survey specific median
High 18.90 USD 1990
Aabove survey specific median
Filion 2012
(Male 1995-1997) Low 6690 27.60 USD 1995
Below survey specific median
High 17.00 USD 1995
Above survey specific median
Filion 2012 (Female 1995-1997)
Low 6690 25.30 USD 1995 Below survey specific
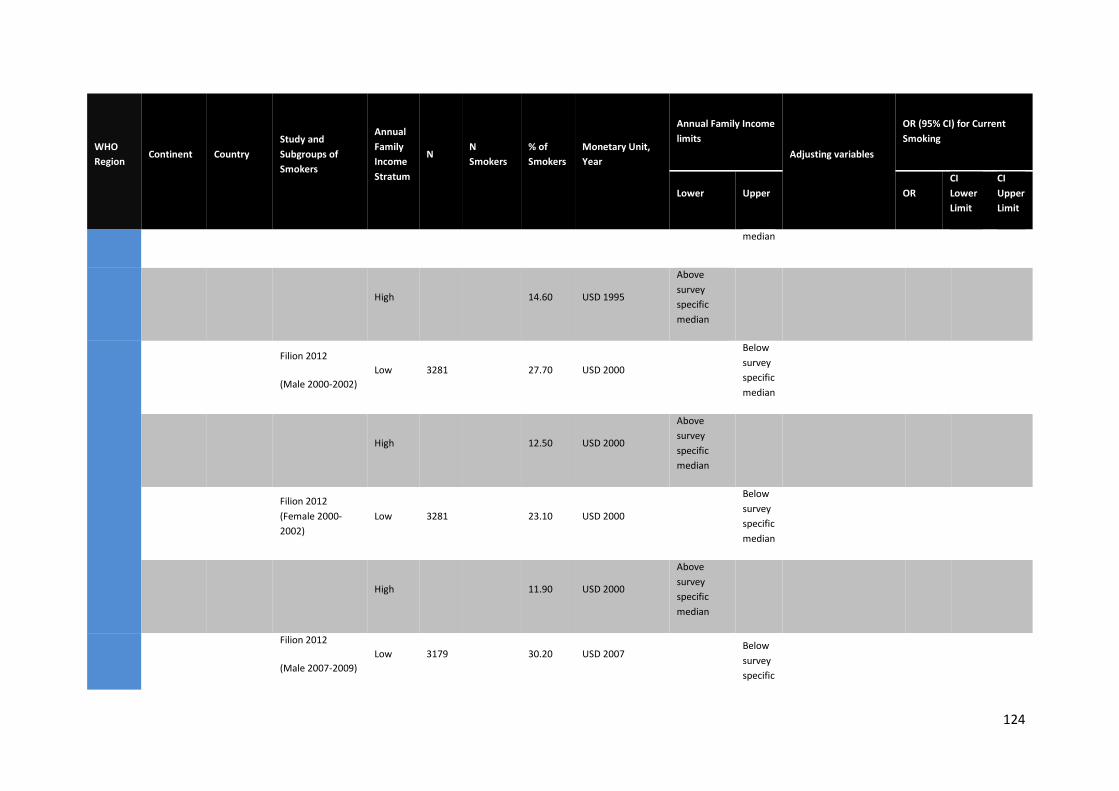
124
WHO Region
Continent Country Study and Subgroups of Smokers
Annual Family Income Stratum
N N Smokers
% of Smokers
Monetary Unit, Year
Annual Family Income limits
Adjusting variables
OR (95% CI) for Current Smoking
Lower Upper OR CI Lower Limit
CI Upper Limit
median
High 14.60 USD 1995
Above survey specific median
Filion 2012
(Male 2000-2002) Low 3281 27.70 USD 2000
Below survey specific median
High 12.50 USD 2000
Above survey specific median
Filion 2012 (Female 2000-2002)
Low 3281 23.10 USD 2000
Below survey specific median
High 11.90 USD 2000
Above survey specific median
Filion 2012
(Male 2007-2009) Low 3179 30.20 USD 2007
Below survey specific
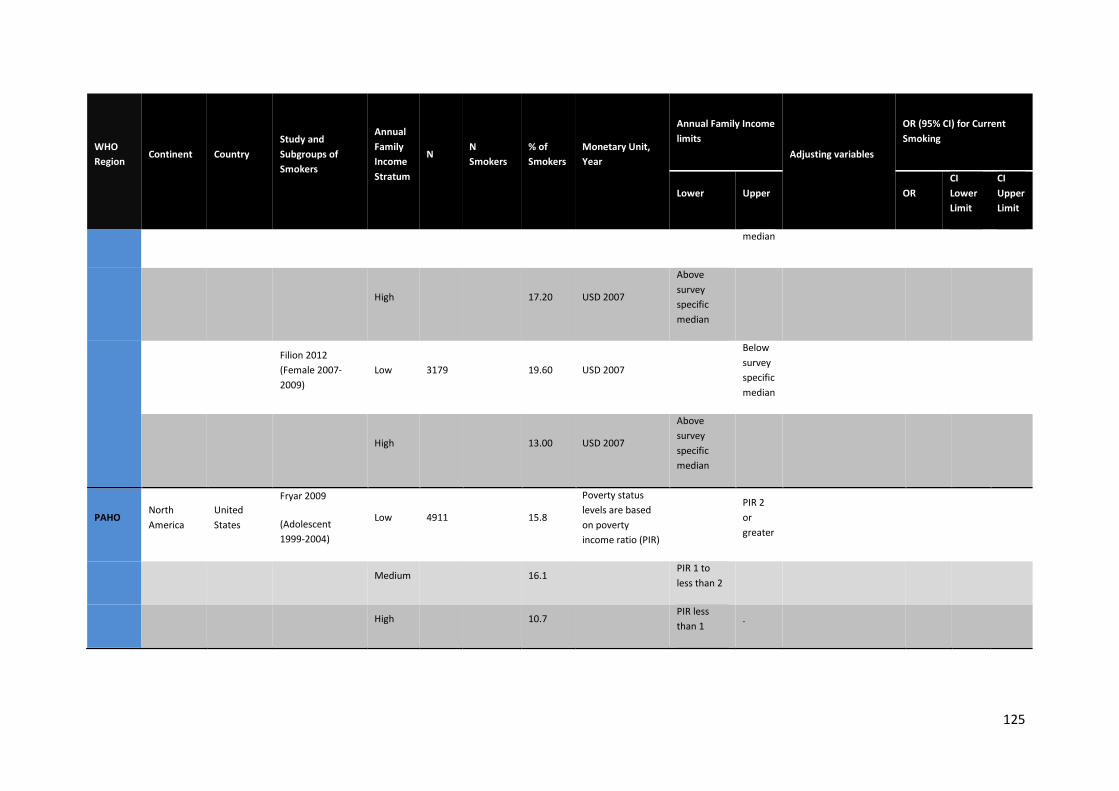
125
WHO Region
Continent Country Study and Subgroups of Smokers
Annual Family Income Stratum
N N Smokers
% of Smokers
Monetary Unit, Year
Annual Family Income limits
Adjusting variables
OR (95% CI) for Current Smoking
Lower Upper OR CI Lower Limit
CI Upper Limit
median
High 17.20 USD 2007
Above survey specific median
Filion 2012 (Female 2007-2009)
Low 3179 19.60 USD 2007
Below survey specific median
High 13.00 USD 2007
Above survey specific median
PAHO North America
United States
Fryar 2009
(Adolescent 1999-2004)
Low 4911 15.8
Poverty status levels are based on poverty income ratio (PIR)
PIR 2 or greater
Medium 16.1 PIR 1 to less than 2
High 10.7 PIR less than 1
.
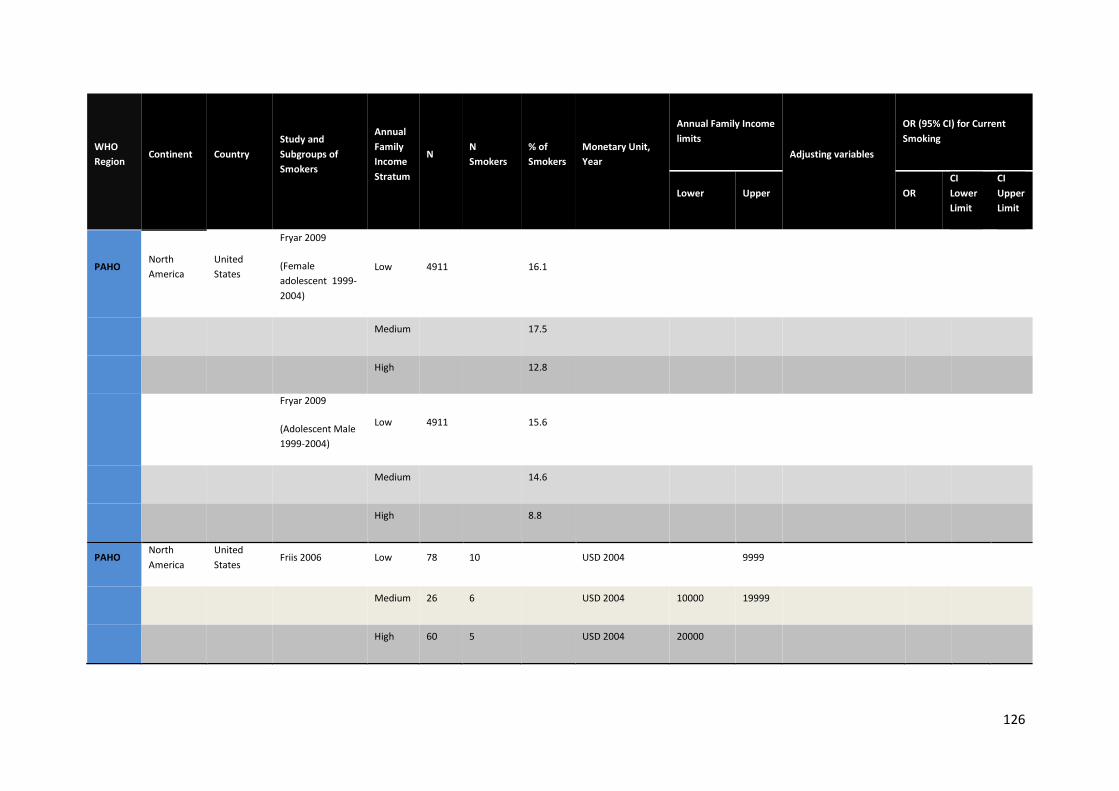
126
WHO Region
Continent Country Study and Subgroups of Smokers
Annual Family Income Stratum
N N Smokers
% of Smokers
Monetary Unit, Year
Annual Family Income limits
Adjusting variables
OR (95% CI) for Current Smoking
Lower Upper OR CI Lower Limit
CI Upper Limit
PAHO North America
United States
Fryar 2009
(Female adolescent 1999-2004)
Low 4911 16.1
Medium 17.5
High 12.8
Fryar 2009
(Adolescent Male 1999-2004)
Low 4911 15.6
Medium 14.6
High 8.8
PAHO North America
United States
Friis 2006 Low 78 10
USD 2004
9999
Medium 26 6 USD 2004 10000 19999
High 60 5 USD 2004 20000
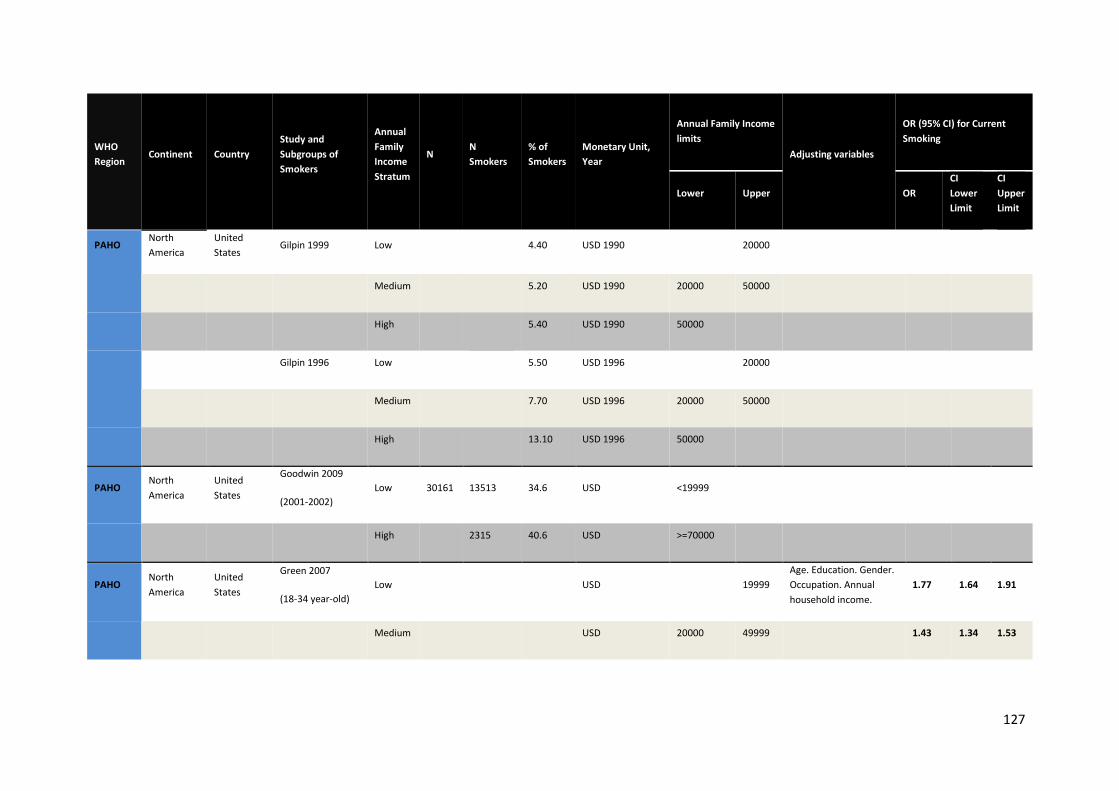
127
WHO Region
Continent Country Study and Subgroups of Smokers
Annual Family Income Stratum
N N Smokers
% of Smokers
Monetary Unit, Year
Annual Family Income limits
Adjusting variables
OR (95% CI) for Current Smoking
Lower Upper OR CI Lower Limit
CI Upper Limit
PAHO North America
United States
Gilpin 1999 Low
4.40 USD 1990
20000
Medium
5.20 USD 1990 20000 50000
High
5.40 USD 1990 50000
Gilpin 1996 Low
5.50 USD 1996
20000
Medium
7.70 USD 1996 20000 50000
High
13.10 USD 1996 50000
PAHO North America
United States
Goodwin 2009
(2001-2002) Low 30161 13513 34.6 USD <19999
High 2315 40.6 USD >=70000
PAHO North America
United States
Green 2007
(18-34 year-old) Low
USD
19999
Age. Education. Gender. Occupation. Annual household income.
1.77 1.64 1.91
Medium USD 20000 49999 1.43 1.34 1.53
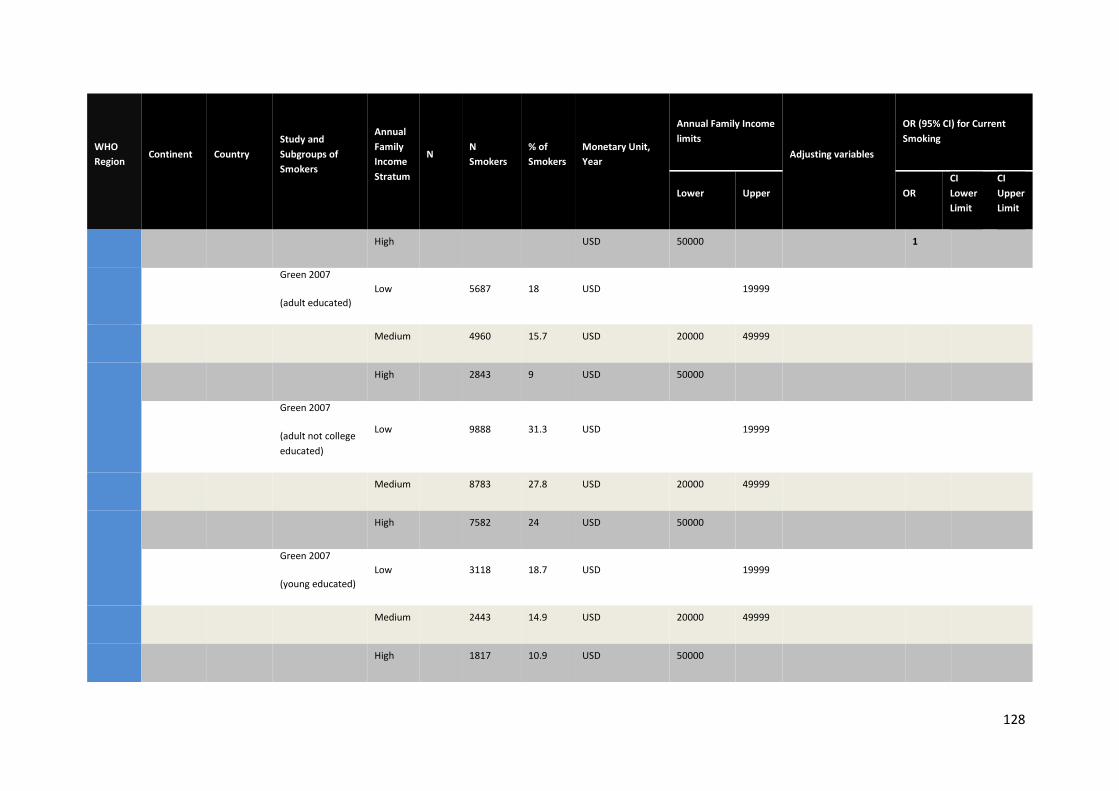
128
WHO Region
Continent Country Study and Subgroups of Smokers
Annual Family Income Stratum
N N Smokers
% of Smokers
Monetary Unit, Year
Annual Family Income limits
Adjusting variables
OR (95% CI) for Current Smoking
Lower Upper OR CI Lower Limit
CI Upper Limit
High USD 50000 1
Green 2007
(adult educated) Low
5687 18 USD
19999
Medium 4960 15.7 USD 20000 49999
High 2843 9 USD 50000
Green 2007
(adult not college educated)
Low
9888 31.3 USD
19999
Medium 8783 27.8 USD 20000 49999
High 7582 24 USD 50000
Green 2007
(young educated) Low
3118 18.7 USD
19999
Medium 2443 14.9 USD 20000 49999
High 1817 10.9 USD 50000
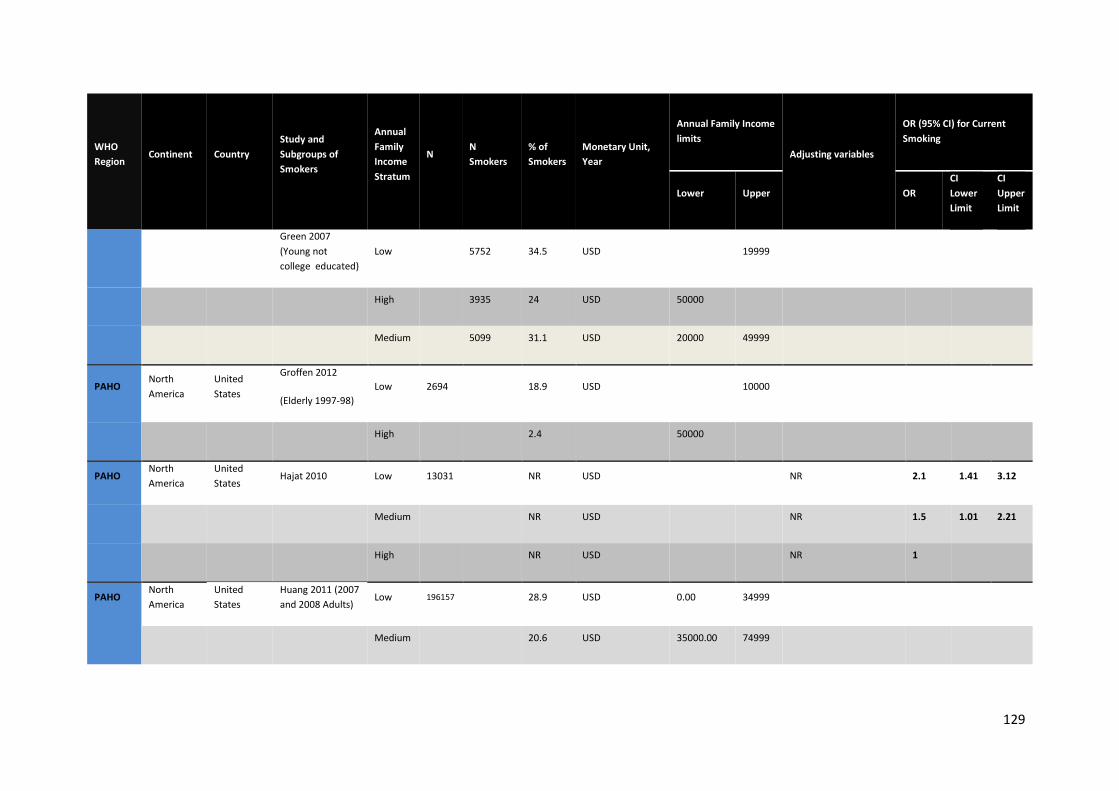
129
WHO Region
Continent Country Study and Subgroups of Smokers
Annual Family Income Stratum
N N Smokers
% of Smokers
Monetary Unit, Year
Annual Family Income limits
Adjusting variables
OR (95% CI) for Current Smoking
Lower Upper OR CI Lower Limit
CI Upper Limit
Green 2007 (Young not college educated)
Low
5752 34.5 USD
19999
High 3935 24 USD 50000
Medium 5099 31.1 USD 20000 49999
PAHO North America
United States
Groffen 2012
(Elderly 1997-98) Low 2694 18.9 USD 10000
High 2.4 50000
PAHO North America
United States
Hajat 2010 Low 13031 NR USD NR 2.1 1.41 3.12
Medium NR USD NR 1.5 1.01 2.21
High NR USD NR 1
PAHO North America
United States
Huang 2011 (2007 and 2008 Adults)
Low 196157 28.9 USD 0.00 34999
Medium 20.6 USD 35000.00 74999
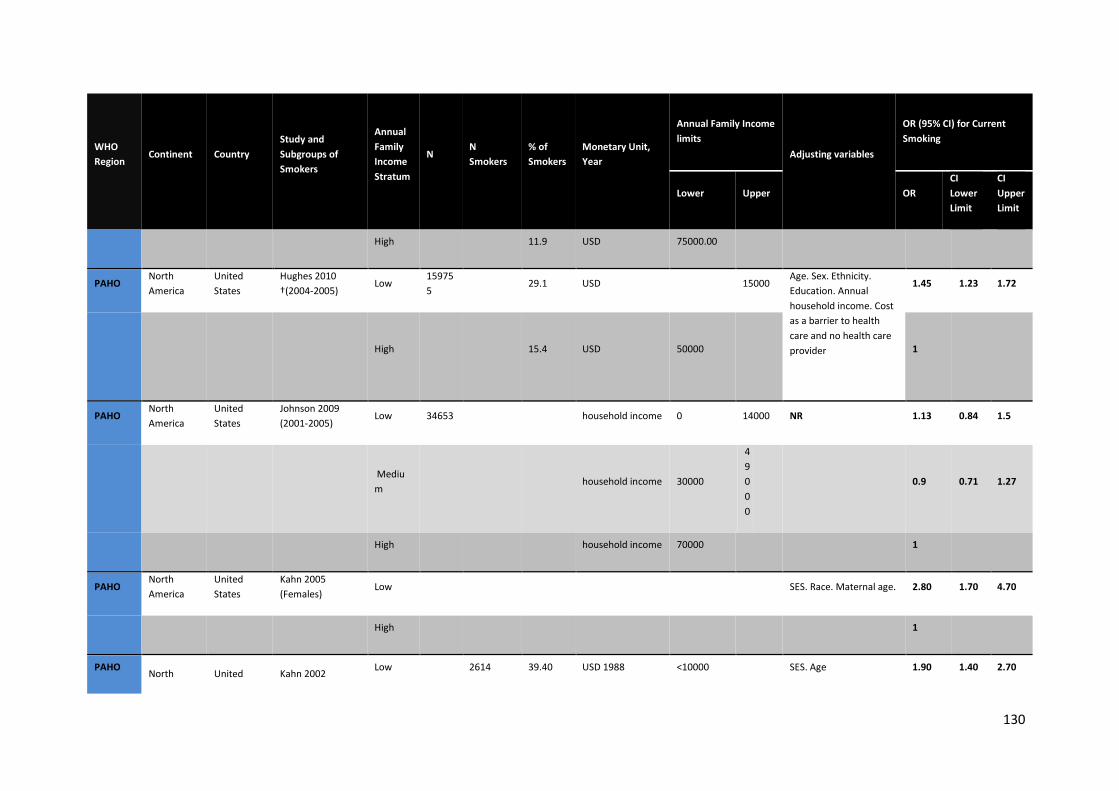
130
WHO Region
Continent Country Study and Subgroups of Smokers
Annual Family Income Stratum
N N Smokers
% of Smokers
Monetary Unit, Year
Annual Family Income limits
Adjusting variables
OR (95% CI) for Current Smoking
Lower Upper OR CI Lower Limit
CI Upper Limit
High 11.9 USD 75000.00
PAHO North America
United States
Hughes 2010 †(2004-2005)
Low 159755
29.1 USD 15000 Age. Sex. Ethnicity. Education. Annual household income. Cost as a barrier to health care and no health care provider
1.45 1.23 1.72
High 15.4 USD 50000 1
PAHO North America
United States
Johnson 2009 (2001-2005)
Low 34653 household income 0 14000 NR 1.13 0.84 1.5
Medium
household income 30000
49000
0.9 0.71 1.27
High household income 70000 1
PAHO North America
United States
Kahn 2005 (Females)
Low
SES. Race. Maternal age. 2.80 1.70 4.70
High 1
PAHO North United Kahn 2002 Low
2614 39.40 USD 1988 <10000
SES. Age 1.90 1.40 2.70
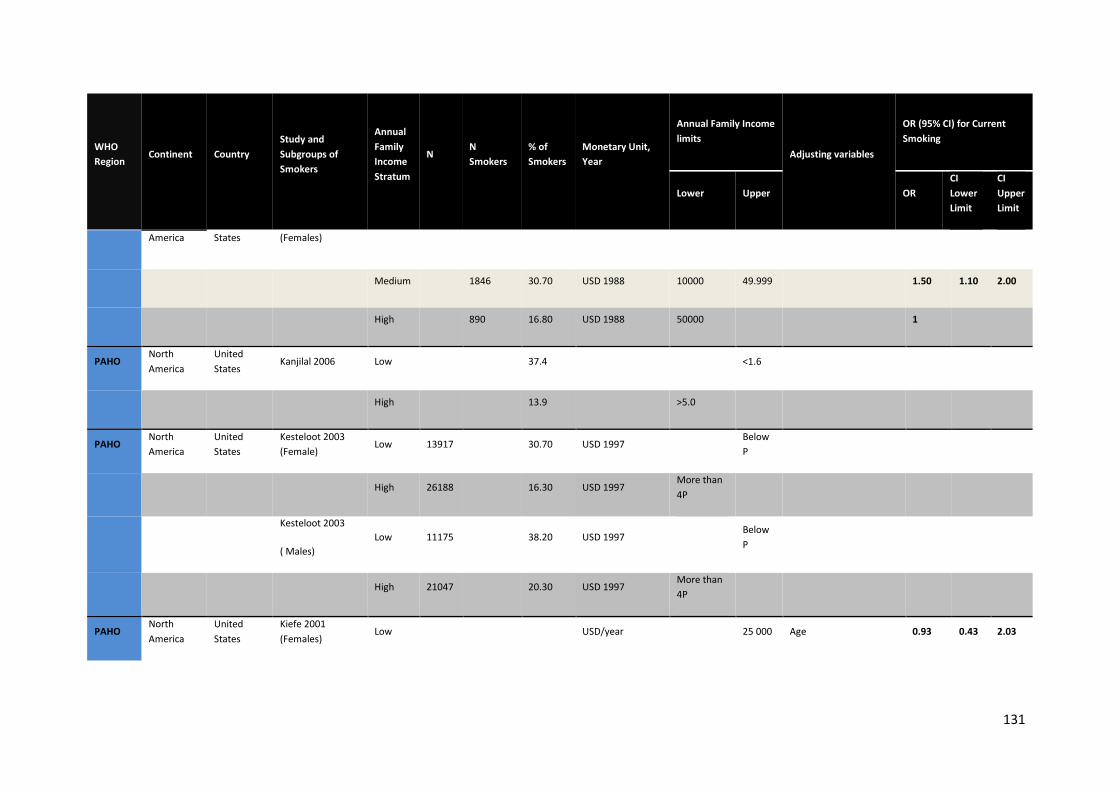
131
WHO Region
Continent Country Study and Subgroups of Smokers
Annual Family Income Stratum
N N Smokers
% of Smokers
Monetary Unit, Year
Annual Family Income limits
Adjusting variables
OR (95% CI) for Current Smoking
Lower Upper OR CI Lower Limit
CI Upper Limit
America States (Females)
Medium 1846 30.70 USD 1988 10000 49.999 1.50 1.10 2.00
High 890 16.80 USD 1988 50000 1
PAHO North America
United States
Kanjilal 2006 Low
37.4
<1.6
High 13.9 >5.0
PAHO North America
United States
Kesteloot 2003 (Female)
Low 13917
30.70 USD 1997
Below P
High 26188 16.30 USD 1997 More than 4P
Kesteloot 2003
( Males) Low 11175
38.20 USD 1997
Below P
High 21047 20.30 USD 1997 More than 4P
PAHO North America
United States
Kiefe 2001 (Females)
Low
USD/year
25 000 Age 0.93 0.43 2.03
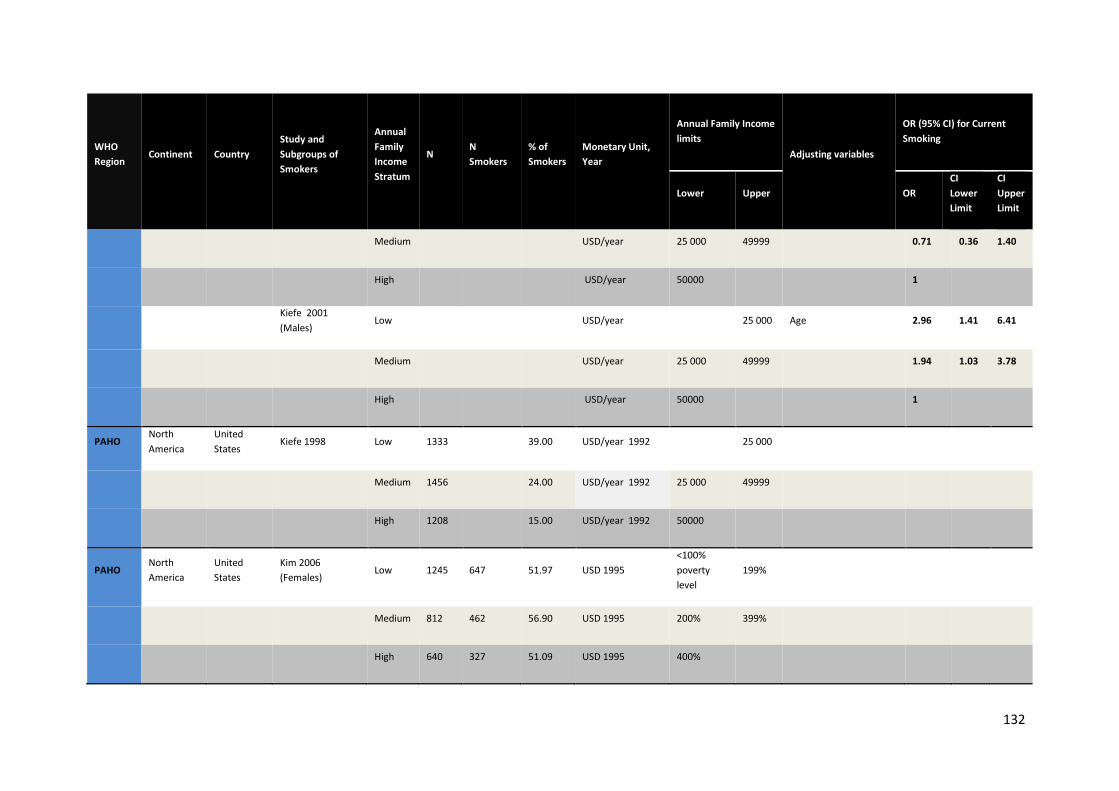
132
WHO Region
Continent Country Study and Subgroups of Smokers
Annual Family Income Stratum
N N Smokers
% of Smokers
Monetary Unit, Year
Annual Family Income limits
Adjusting variables
OR (95% CI) for Current Smoking
Lower Upper OR CI Lower Limit
CI Upper Limit
Medium USD/year 25 000 49999 0.71 0.36 1.40
High USD/year 50000 1
Kiefe 2001 (Males)
Low
USD/year
25 000 Age 2.96 1.41 6.41
Medium USD/year 25 000 49999 1.94 1.03 3.78
High USD/year 50000 1
PAHO North America
United States
Kiefe 1998 Low 1333
39.00 USD/year 1992
25 000
Medium 1456 24.00 USD/year 1992 25 000 49999
High 1208 15.00 USD/year 1992 50000
PAHO North America
United States
Kim 2006 (Females)
Low 1245 647 51.97 USD 1995 <100% poverty level
199%
Medium 812 462 56.90 USD 1995 200% 399%
High 640 327 51.09 USD 1995 400%
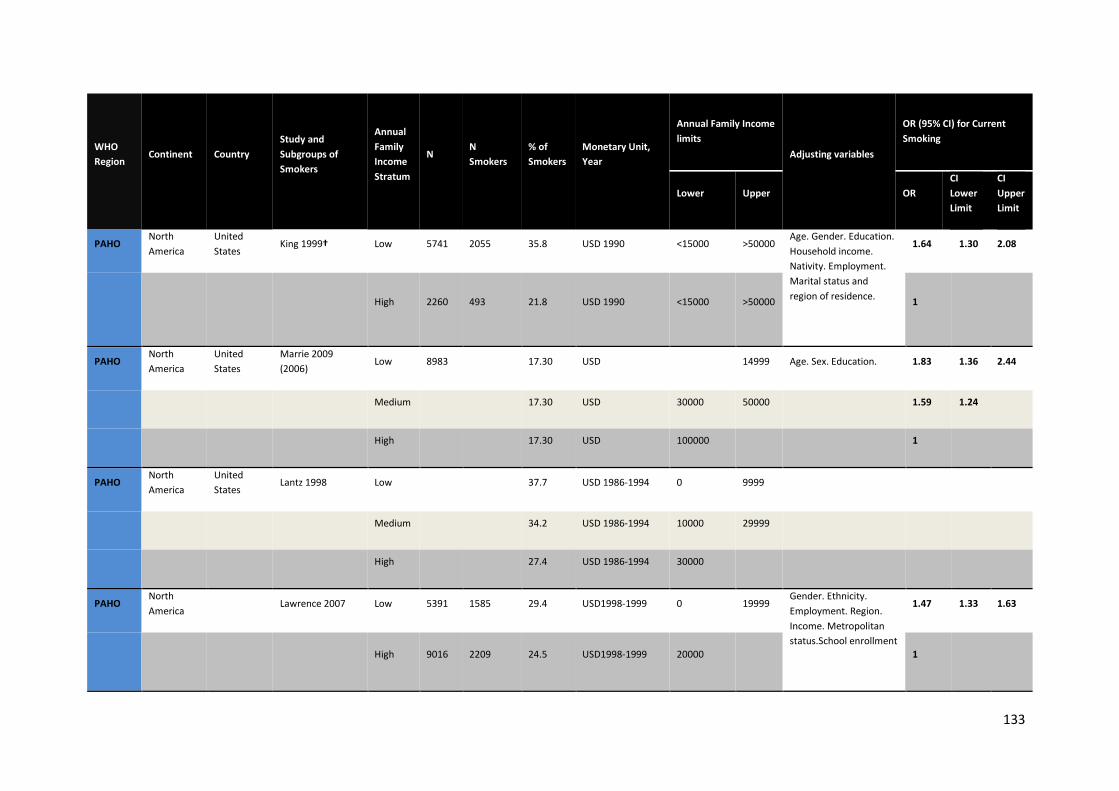
133
WHO Region
Continent Country Study and Subgroups of Smokers
Annual Family Income Stratum
N N Smokers
% of Smokers
Monetary Unit, Year
Annual Family Income limits
Adjusting variables
OR (95% CI) for Current Smoking
Lower Upper OR CI Lower Limit
CI Upper Limit
PAHO North America
United States
King 1999† Low 5741 2055 35.8 USD 1990 <15000 >50000 Age. Gender. Education. Household income. Nativity. Employment. Marital status and region of residence.
1.64 1.30 2.08
High 2260 493 21.8 USD 1990 <15000 >50000 1
PAHO North America
United States
Marrie 2009 (2006)
Low 8983
17.30 USD
14999 Age. Sex. Education. 1.83 1.36 2.44
Medium 17.30 USD 30000 50000 1.59 1.24
High 17.30 USD 100000 1
PAHO North America
United States
Lantz 1998 Low
37.7 USD 1986-1994 0 9999
Medium 34.2 USD 1986-1994 10000 29999
High 27.4 USD 1986-1994 30000
PAHO North America
Lawrence 2007 Low 5391 1585 29.4 USD1998-1999 0 19999 Gender. Ethnicity. Employment. Region. Income. Metropolitan status.School enrollment
1.47 1.33 1.63
High 9016 2209 24.5 USD1998-1999 20000 1
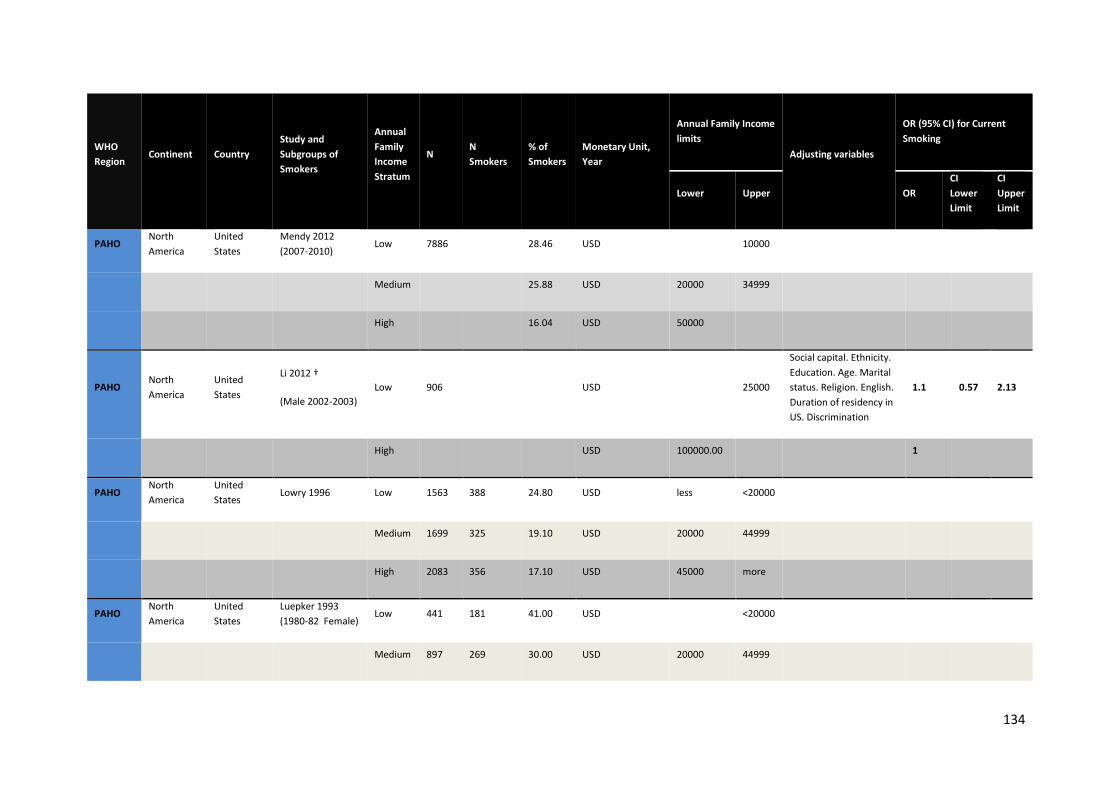
134
WHO Region
Continent Country Study and Subgroups of Smokers
Annual Family Income Stratum
N N Smokers
% of Smokers
Monetary Unit, Year
Annual Family Income limits
Adjusting variables
OR (95% CI) for Current Smoking
Lower Upper OR CI Lower Limit
CI Upper Limit
PAHO North America
United States
Mendy 2012 (2007-2010)
Low 7886 28.46 USD 10000
Medium 25.88 USD 20000 34999
High 16.04 USD 50000
PAHO North America
United States
Li 2012 †
(Male 2002-2003) Low 906 USD 25000
Social capital. Ethnicity. Education. Age. Marital status. Religion. English. Duration of residency in US. Discrimination
1.1 0.57 2.13
High USD 100000.00 1
PAHO North America
United States
Lowry 1996 Low 1563 388 24.80 USD less <20000
Medium 1699 325 19.10 USD 20000 44999
High 2083 356 17.10 USD 45000 more
PAHO North America
United States
Luepker 1993 (1980-82 Female)
Low 441 181 41.00 USD
<20000
Medium 897 269 30.00 USD 20000 44999
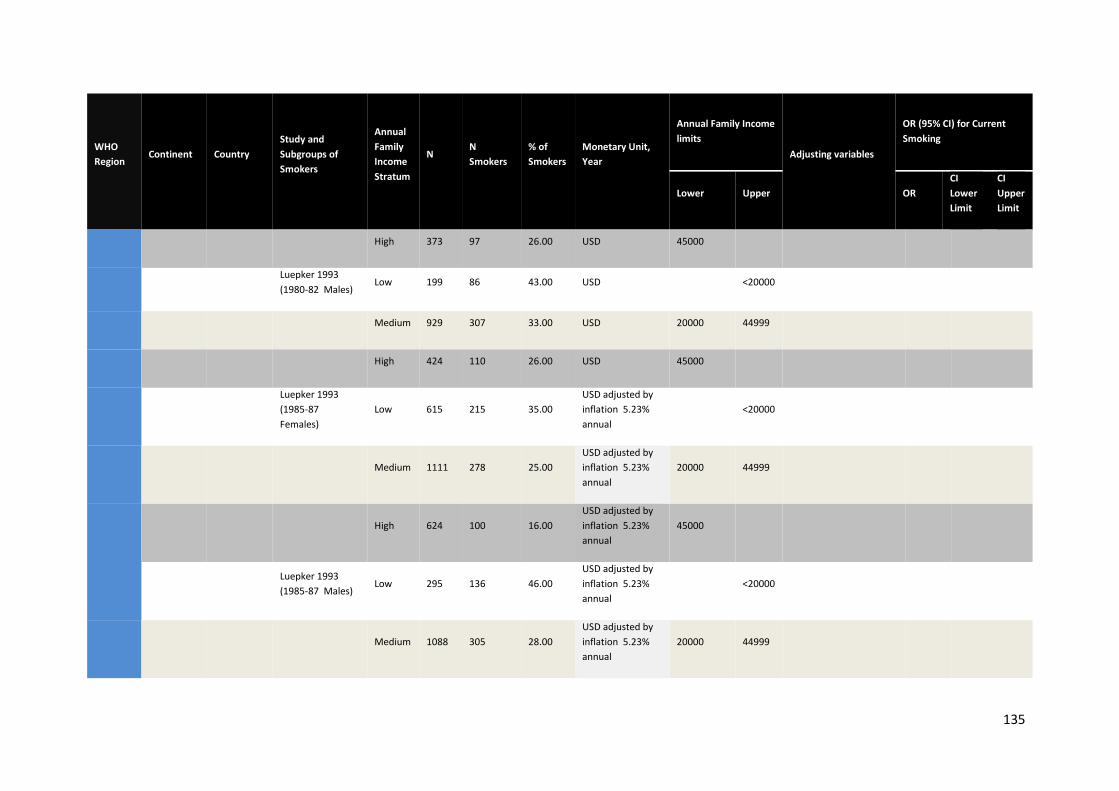
135
WHO Region
Continent Country Study and Subgroups of Smokers
Annual Family Income Stratum
N N Smokers
% of Smokers
Monetary Unit, Year
Annual Family Income limits
Adjusting variables
OR (95% CI) for Current Smoking
Lower Upper OR CI Lower Limit
CI Upper Limit
High 373 97 26.00 USD 45000
Luepker 1993 (1980-82 Males)
Low 199 86 43.00 USD
<20000
Medium 929 307 33.00 USD 20000 44999
High 424 110 26.00 USD 45000
Luepker 1993 (1985-87 Females)
Low 615 215 35.00 USD adjusted by inflation 5.23% annual
<20000
Medium 1111 278 25.00 USD adjusted by inflation 5.23% annual
20000 44999
High 624 100 16.00 USD adjusted by inflation 5.23% annual
45000
Luepker 1993 (1985-87 Males)
Low 295 136 46.00 USD adjusted by inflation 5.23% annual
<20000
Medium 1088 305 28.00 USD adjusted by inflation 5.23% annual
20000 44999
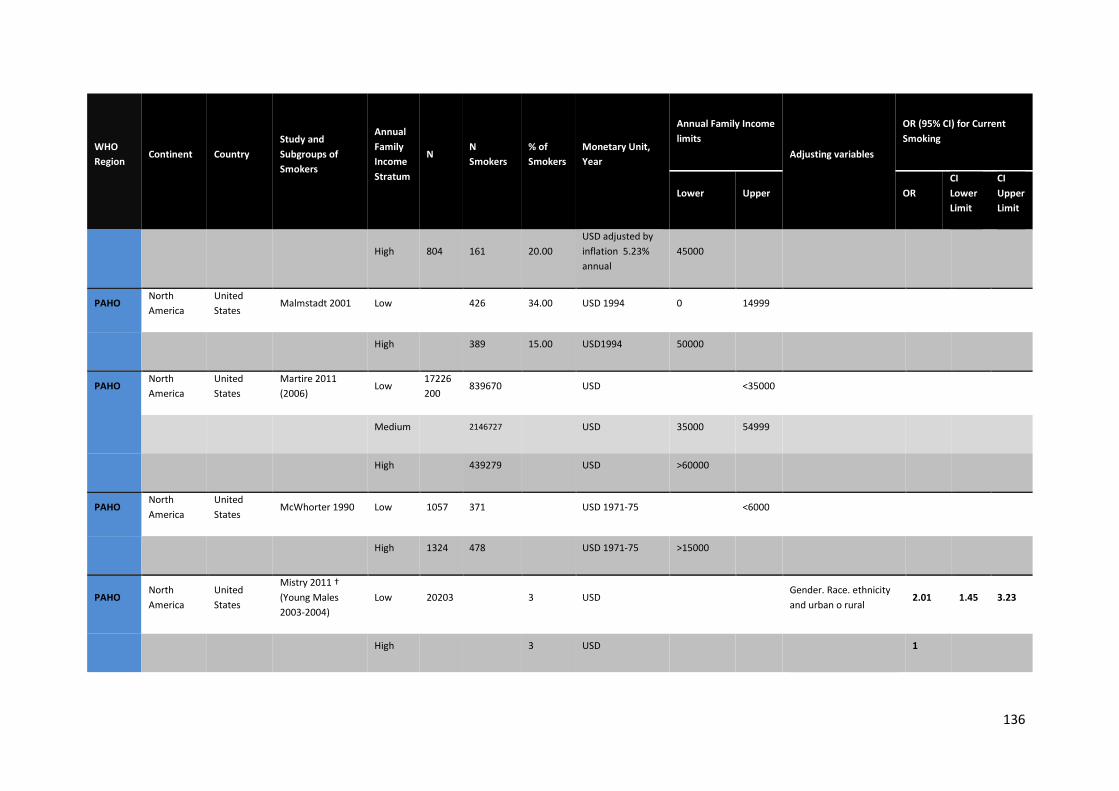
136
WHO Region
Continent Country Study and Subgroups of Smokers
Annual Family Income Stratum
N N Smokers
% of Smokers
Monetary Unit, Year
Annual Family Income limits
Adjusting variables
OR (95% CI) for Current Smoking
Lower Upper OR CI Lower Limit
CI Upper Limit
High 804 161 20.00 USD adjusted by inflation 5.23% annual
45000
PAHO North America
United States
Malmstadt 2001 Low
426 34.00 USD 1994 0 14999
High 389 15.00 USD1994 50000
PAHO North America
United States
Martire 2011 (2006)
Low 17226200
839670 USD <35000
Medium 2146727 USD 35000 54999
High 439279 USD >60000
PAHO North America
United States
McWhorter 1990 Low 1057 371
USD 1971-75
<6000
High 1324 478 USD 1971-75 >15000
PAHO North America
United States
Mistry 2011 † (Young Males 2003-2004)
Low 20203 3 USD Gender. Race. ethnicity and urban o rural
2.01 1.45 3.23
High 3 USD
1
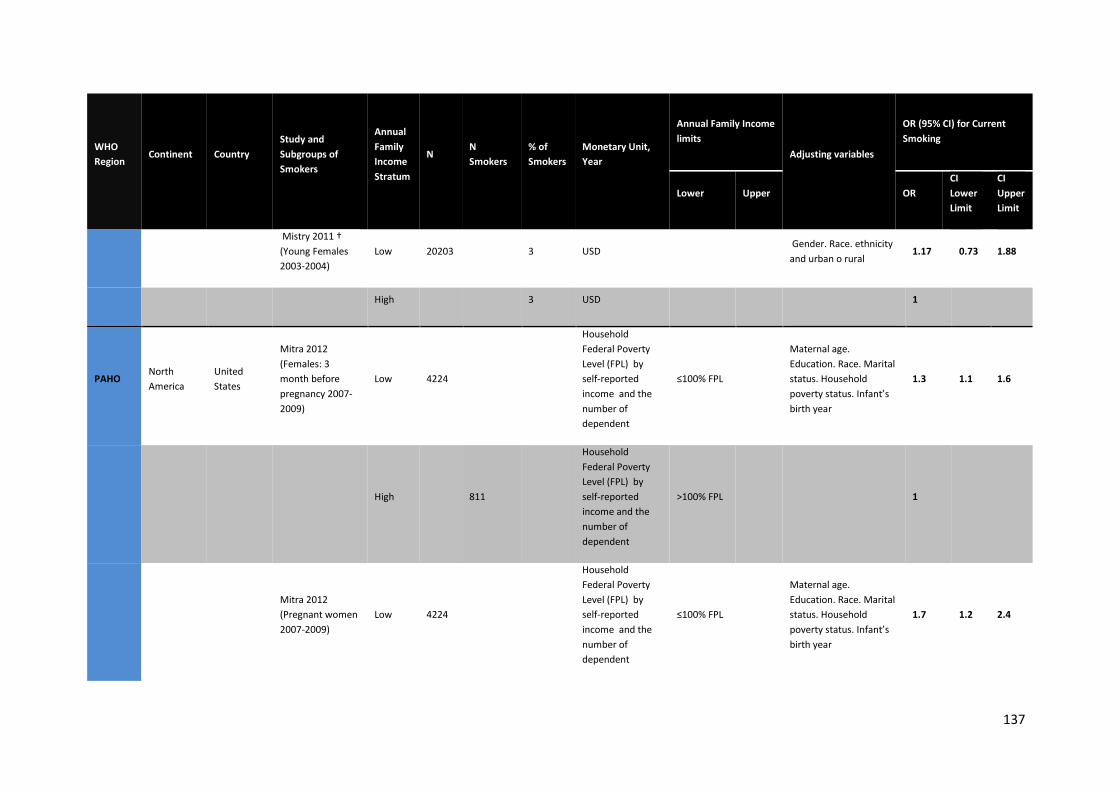
137
WHO Region
Continent Country Study and Subgroups of Smokers
Annual Family Income Stratum
N N Smokers
% of Smokers
Monetary Unit, Year
Annual Family Income limits
Adjusting variables
OR (95% CI) for Current Smoking
Lower Upper OR CI Lower Limit
CI Upper Limit
Mistry 2011 † (Young Females 2003-2004)
Low 20203 3 USD Gender. Race. ethnicity and urban o rural
1.17 0.73 1.88
High 3 USD
1
PAHO North America
United States
Mitra 2012 (Females: 3 month before pregnancy 2007-2009)
Low 4224
Household Federal Poverty Level (FPL) by self-reported income and the number of dependent
≤100% FPL
Maternal age. Education. Race. Marital status. Household poverty status. Infant’s birth year
1.3 1.1 1.6
High 811
Household Federal Poverty Level (FPL) by self-reported income and the number of dependent
>100% FPL 1
Mitra 2012 (Pregnant women 2007-2009)
Low 4224
Household Federal Poverty Level (FPL) by self-reported income and the number of dependent
≤100% FPL
Maternal age. Education. Race. Marital status. Household poverty status. Infant’s birth year
1.7 1.2 2.4
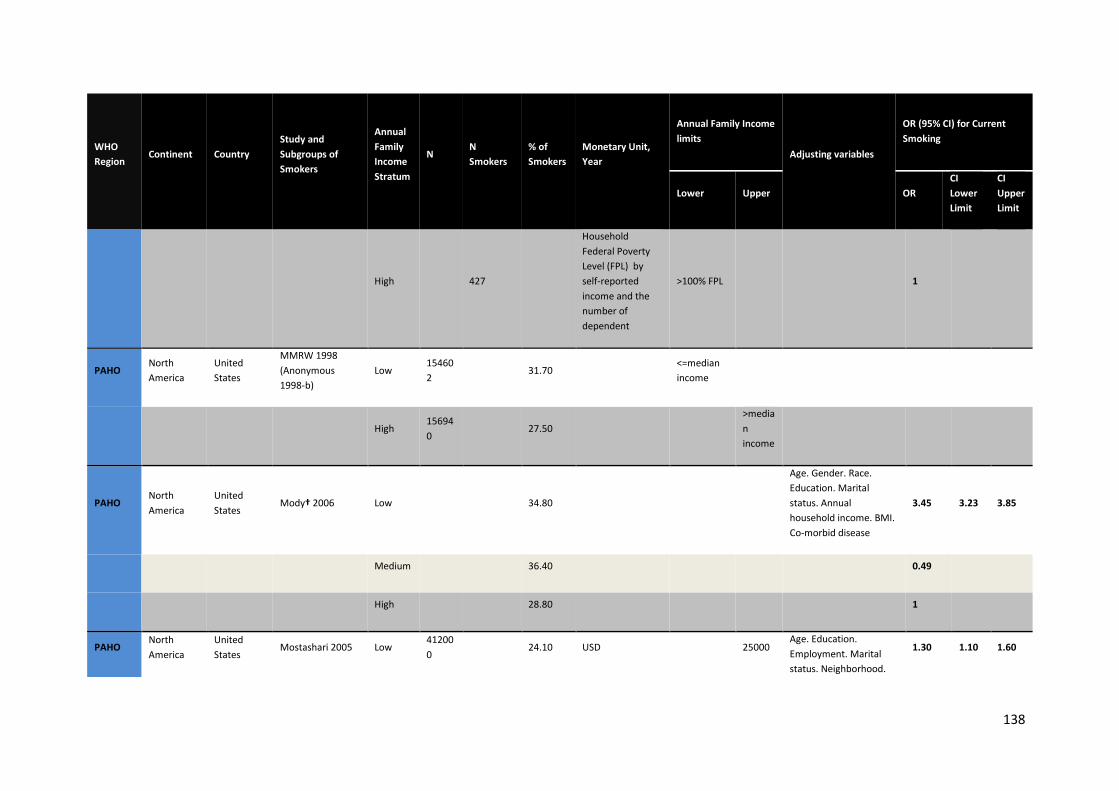
138
WHO Region
Continent Country Study and Subgroups of Smokers
Annual Family Income Stratum
N N Smokers
% of Smokers
Monetary Unit, Year
Annual Family Income limits
Adjusting variables
OR (95% CI) for Current Smoking
Lower Upper OR CI Lower Limit
CI Upper Limit
High 427
Household Federal Poverty Level (FPL) by self-reported income and the number of dependent
>100% FPL 1
PAHO North America
United States
MMRW 1998 (Anonymous 1998-b)
Low 154602
31.70
<=median income
High 156940
27.50 >median income
PAHO North America
United States
Mody† 2006 Low
34.80
Age. Gender. Race. Education. Marital status. Annual household income. BMI. Co-morbid disease
3.45 3.23 3.85
Medium 36.40 0.49
High 28.80 1
PAHO North America
United States
Mostashari 2005 Low 412000
24.10 USD
25000 Age. Education. Employment. Marital status. Neighborhood.
1.30 1.10 1.60
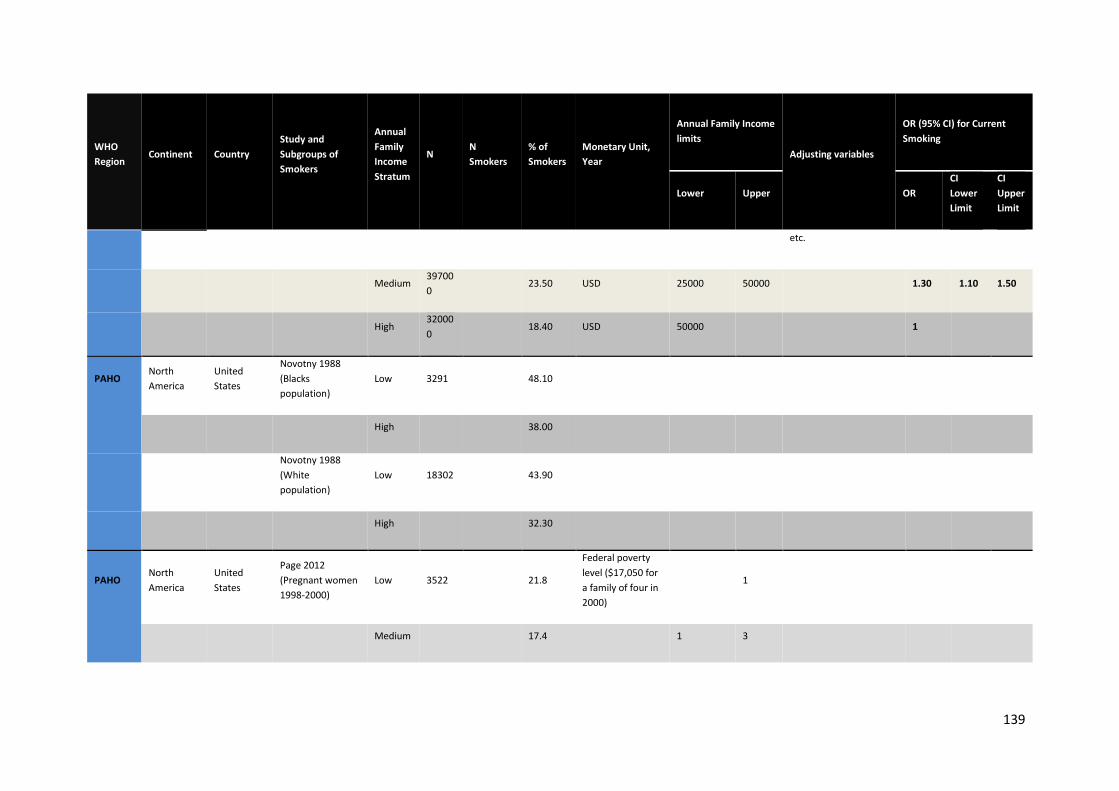
139
WHO Region
Continent Country Study and Subgroups of Smokers
Annual Family Income Stratum
N N Smokers
% of Smokers
Monetary Unit, Year
Annual Family Income limits
Adjusting variables
OR (95% CI) for Current Smoking
Lower Upper OR CI Lower Limit
CI Upper Limit
etc.
Medium 397000
23.50 USD 25000 50000 1.30 1.10 1.50
High 320000
18.40 USD 50000 1
PAHO North America
United States
Novotny 1988 (Blacks population)
Low 3291
48.10
High 38.00
Novotny 1988 (White population)
Low 18302
43.90
High 32.30
PAHO North America
United States
Page 2012 (Pregnant women 1998-2000)
Low 3522 21.8
Federal poverty level ($17,050 for a family of four in 2000)
1
Medium 17.4 1 3
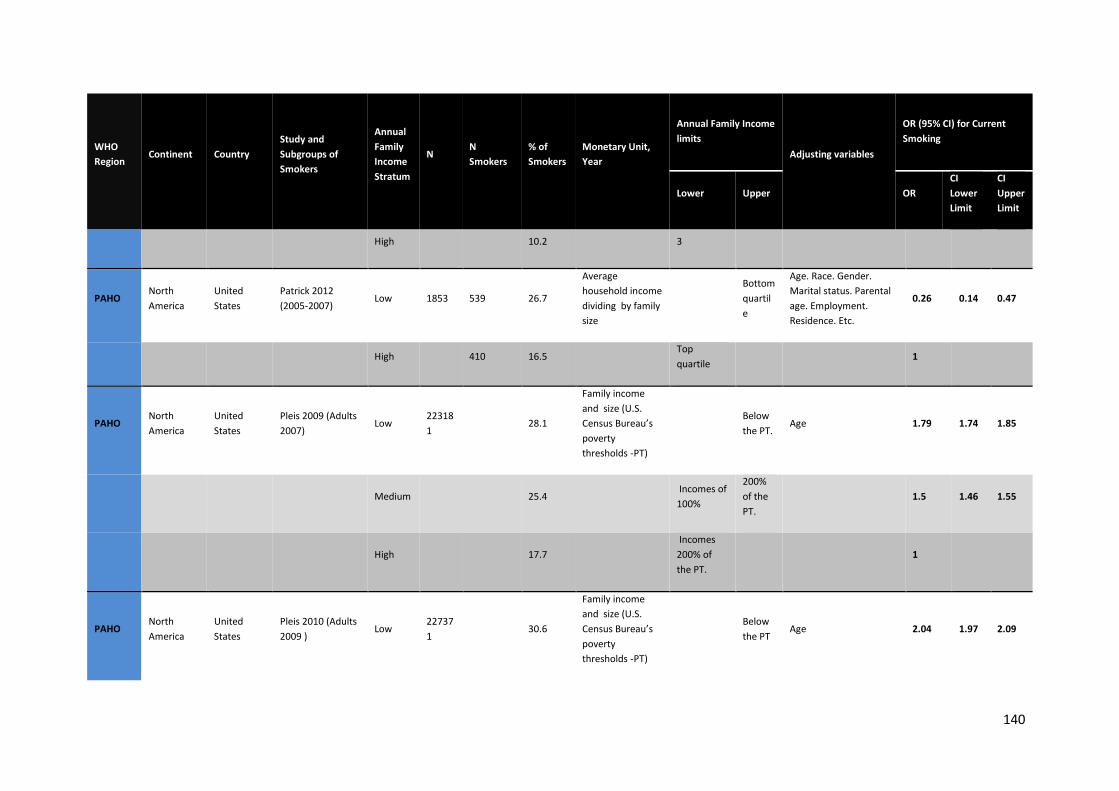
140
WHO Region
Continent Country Study and Subgroups of Smokers
Annual Family Income Stratum
N N Smokers
% of Smokers
Monetary Unit, Year
Annual Family Income limits
Adjusting variables
OR (95% CI) for Current Smoking
Lower Upper OR CI Lower Limit
CI Upper Limit
High 10.2 3
PAHO North America
United States
Patrick 2012 (2005-2007)
Low 1853 539 26.7
Average household income dividing by family size
Bottom quartile
Age. Race. Gender. Marital status. Parental age. Employment. Residence. Etc.
0.26 0.14 0.47
High 410 16.5 Top quartile
1
PAHO North America
United States
Pleis 2009 (Adults 2007)
Low 223181
28.1
Family income and size (U.S. Census Bureau’s poverty thresholds -PT)
Below the PT.
Age 1.79 1.74 1.85
Medium 25.4 Incomes of 100%
200% of the PT.
1.5 1.46 1.55
High 17.7 Incomes 200% of the PT.
1
PAHO North America
United States
Pleis 2010 (Adults 2009 )
Low 227371
30.6
Family income and size (U.S. Census Bureau’s poverty thresholds -PT)
Below the PT
Age 2.04 1.97 2.09
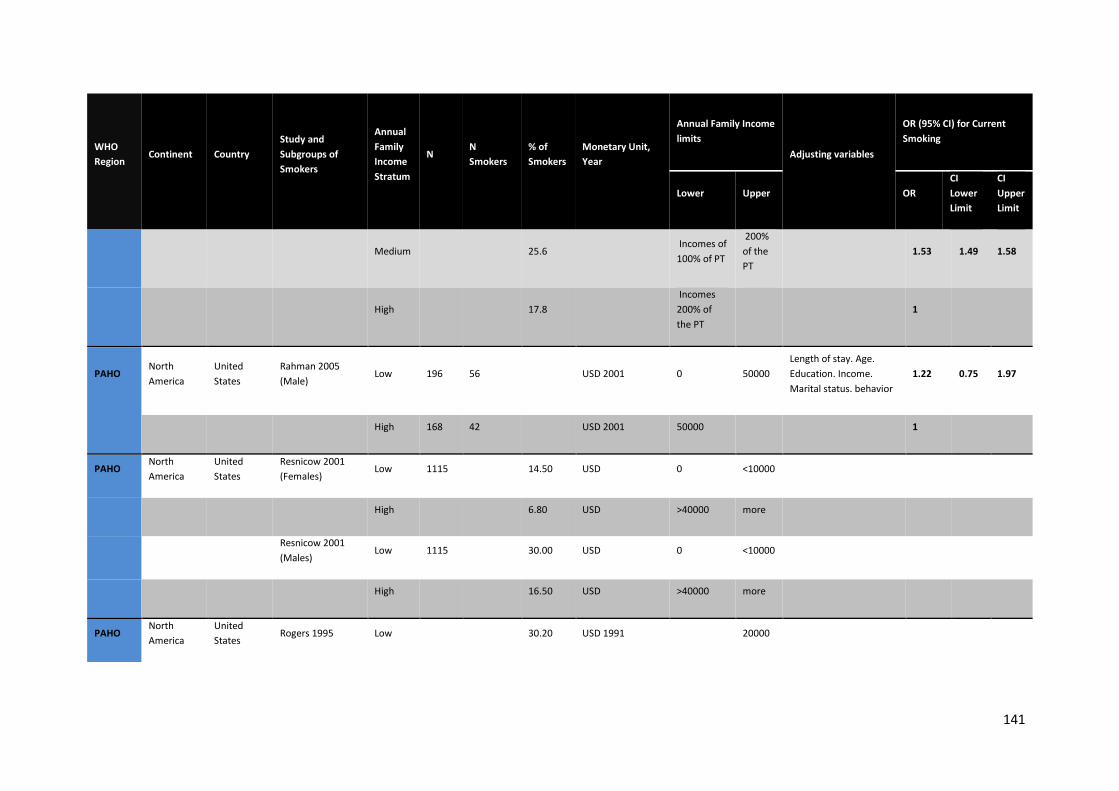
141
WHO Region
Continent Country Study and Subgroups of Smokers
Annual Family Income Stratum
N N Smokers
% of Smokers
Monetary Unit, Year
Annual Family Income limits
Adjusting variables
OR (95% CI) for Current Smoking
Lower Upper OR CI Lower Limit
CI Upper Limit
Medium 25.6 Incomes of 100% of PT
200% of the PT
1.53 1.49 1.58
High 17.8 Incomes 200% of the PT
1
PAHO North America
United States
Rahman 2005 (Male)
Low 196 56 USD 2001 0 50000 Length of stay. Age. Education. Income. Marital status. behavior
1.22 0.75 1.97
High 168 42 USD 2001 50000 1
PAHO North America
United States
Resnicow 2001 (Females)
Low 1115
14.50 USD 0 <10000
High 6.80 USD >40000 more
Resnicow 2001 (Males)
Low 1115
30.00 USD 0 <10000
High 16.50 USD >40000 more
PAHO North America
United States
Rogers 1995 Low
30.20 USD 1991
20000
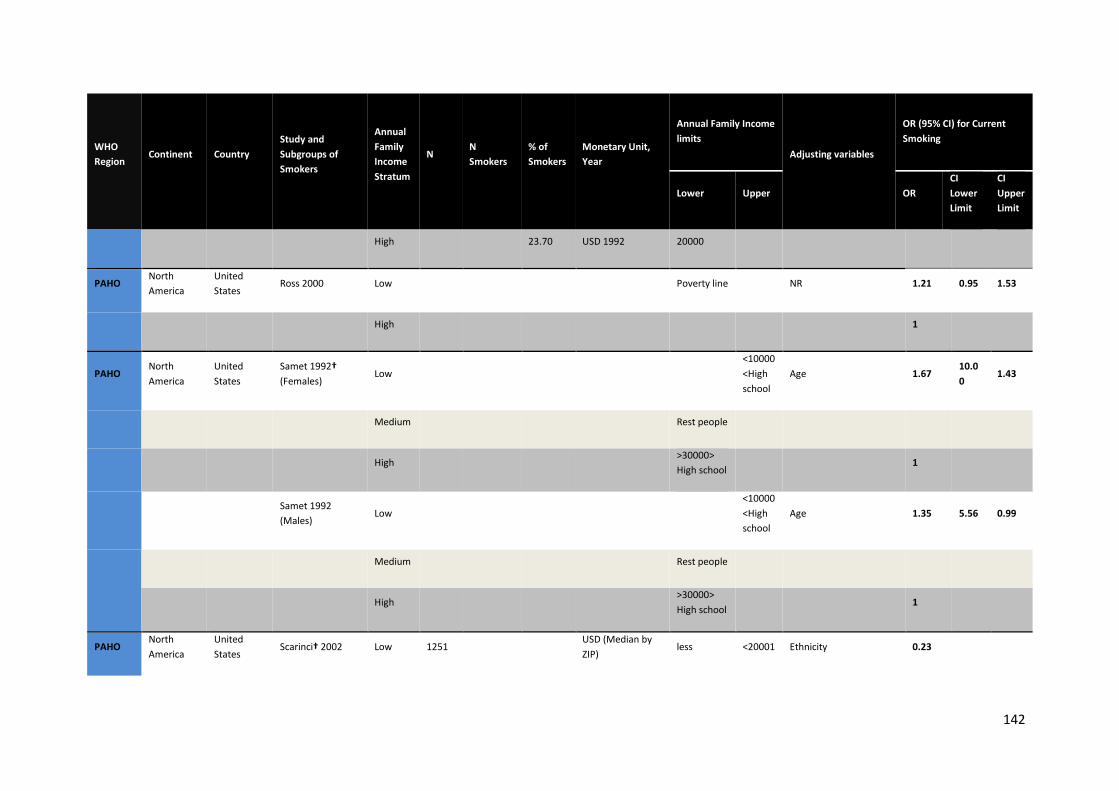
142
WHO Region
Continent Country Study and Subgroups of Smokers
Annual Family Income Stratum
N N Smokers
% of Smokers
Monetary Unit, Year
Annual Family Income limits
Adjusting variables
OR (95% CI) for Current Smoking
Lower Upper OR CI Lower Limit
CI Upper Limit
High 23.70 USD 1992 20000
PAHO North America
United States
Ross 2000 Low
Poverty line
NR 1.21 0.95 1.53
High 1
PAHO North America
United States
Samet 1992† (Females)
Low
<10000 <High school
Age 1.67 10.00
1.43
Medium Rest people
High >30000> High school
1
Samet 1992 (Males)
Low
<10000 <High school
Age 1.35 5.56 0.99
Medium Rest people
High >30000> High school
1
PAHO North America
United States
Scarinci† 2002 Low 1251
USD (Median by ZIP)
less <20001 Ethnicity 0.23
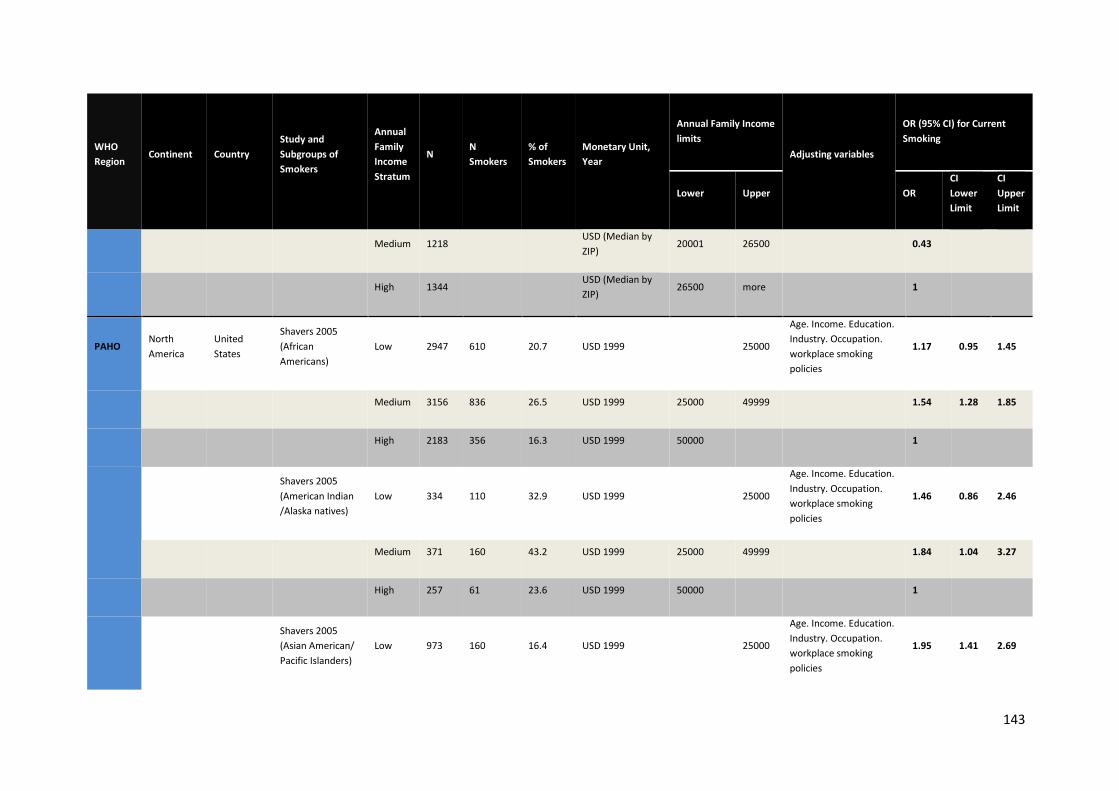
143
WHO Region
Continent Country Study and Subgroups of Smokers
Annual Family Income Stratum
N N Smokers
% of Smokers
Monetary Unit, Year
Annual Family Income limits
Adjusting variables
OR (95% CI) for Current Smoking
Lower Upper OR CI Lower Limit
CI Upper Limit
Medium 1218 USD (Median by ZIP)
20001 26500 0.43
High 1344 USD (Median by ZIP)
26500 more 1
PAHO North America
United States
Shavers 2005 (African Americans)
Low 2947 610 20.7 USD 1999
25000
Age. Income. Education. Industry. Occupation. workplace smoking policies
1.17 0.95 1.45
Medium 3156 836 26.5 USD 1999 25000 49999 1.54 1.28 1.85
High 2183 356 16.3 USD 1999 50000 1
Shavers 2005 (American Indian /Alaska natives)
Low 334 110 32.9 USD 1999
25000
Age. Income. Education. Industry. Occupation. workplace smoking policies
1.46 0.86 2.46
Medium 371 160 43.2 USD 1999 25000 49999 1.84 1.04 3.27
High 257 61 23.6 USD 1999 50000 1
Shavers 2005 (Asian American/ Pacific Islanders)
Low 973 160 16.4 USD 1999
25000
Age. Income. Education. Industry. Occupation. workplace smoking policies
1.95 1.41 2.69
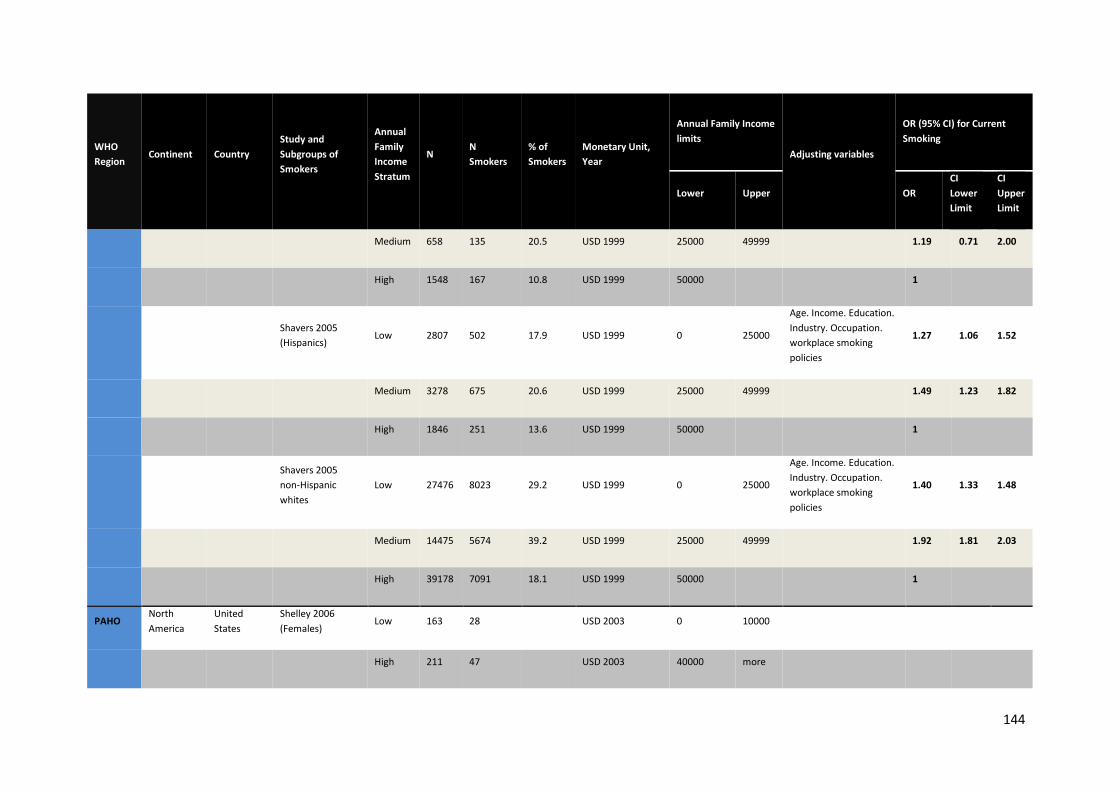
144
WHO Region
Continent Country Study and Subgroups of Smokers
Annual Family Income Stratum
N N Smokers
% of Smokers
Monetary Unit, Year
Annual Family Income limits
Adjusting variables
OR (95% CI) for Current Smoking
Lower Upper OR CI Lower Limit
CI Upper Limit
Medium 658 135 20.5 USD 1999 25000 49999 1.19 0.71 2.00
High 1548 167 10.8 USD 1999 50000 1
Shavers 2005 (Hispanics)
Low 2807 502 17.9 USD 1999 0 25000
Age. Income. Education. Industry. Occupation. workplace smoking policies
1.27 1.06 1.52
Medium 3278 675 20.6 USD 1999 25000 49999 1.49 1.23 1.82
High 1846 251 13.6 USD 1999 50000 1
Shavers 2005 non-Hispanic whites
Low 27476 8023 29.2 USD 1999 0 25000
Age. Income. Education. Industry. Occupation. workplace smoking policies
1.40 1.33 1.48
Medium 14475 5674 39.2 USD 1999 25000 49999 1.92 1.81 2.03
High 39178 7091 18.1 USD 1999 50000 1
PAHO North America
United States
Shelley 2006 (Females)
Low 163 28
USD 2003 0 10000
High 211 47 USD 2003 40000 more
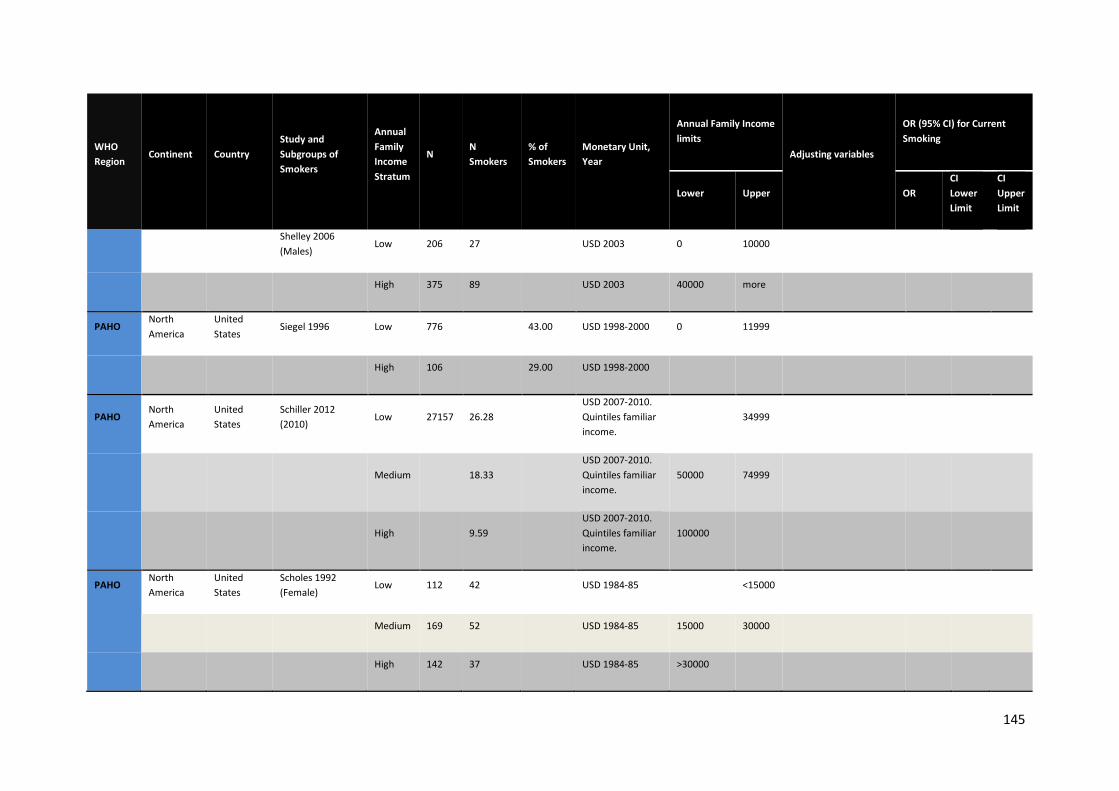
145
WHO Region
Continent Country Study and Subgroups of Smokers
Annual Family Income Stratum
N N Smokers
% of Smokers
Monetary Unit, Year
Annual Family Income limits
Adjusting variables
OR (95% CI) for Current Smoking
Lower Upper OR CI Lower Limit
CI Upper Limit
Shelley 2006 (Males)
Low 206 27
USD 2003 0 10000
High 375 89 USD 2003 40000 more
PAHO North America
United States
Siegel 1996 Low 776
43.00 USD 1998-2000 0 11999
High 106 29.00 USD 1998-2000
PAHO North America
United States
Schiller 2012 (2010)
Low 27157 26.28 USD 2007-2010. Quintiles familiar income.
34999
Medium 18.33 USD 2007-2010. Quintiles familiar income.
50000 74999
High 9.59 USD 2007-2010. Quintiles familiar income.
100000
PAHO North America
United States
Scholes 1992 (Female)
Low 112 42
USD 1984-85
<15000
Medium 169 52 USD 1984-85 15000 30000
High 142 37 USD 1984-85 >30000
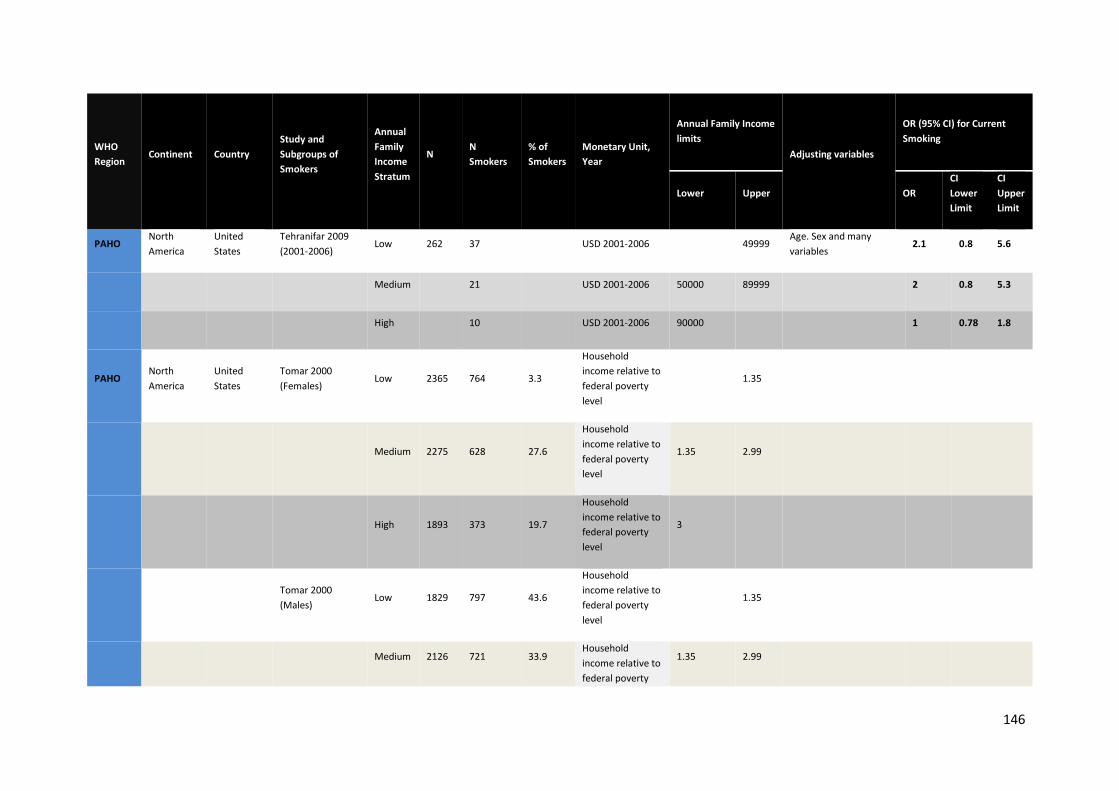
146
WHO Region
Continent Country Study and Subgroups of Smokers
Annual Family Income Stratum
N N Smokers
% of Smokers
Monetary Unit, Year
Annual Family Income limits
Adjusting variables
OR (95% CI) for Current Smoking
Lower Upper OR CI Lower Limit
CI Upper Limit
PAHO North America
United States
Tehranifar 2009 (2001-2006)
Low 262 37 USD 2001-2006 49999 Age. Sex and many variables
2.1 0.8 5.6
Medium 21 USD 2001-2006 50000 89999 2 0.8 5.3
High 10 USD 2001-2006 90000 1 0.78 1.8
PAHO North America
United States
Tomar 2000 (Females)
Low 2365 764 3.3
Household income relative to federal poverty level
1.35
Medium 2275 628 27.6
Household income relative to federal poverty level
1.35 2.99
High 1893 373 19.7
Household income relative to federal poverty level
3
Tomar 2000 (Males)
Low 1829 797 43.6
Household income relative to federal poverty level
1.35
Medium 2126 721 33.9 Household income relative to federal poverty
1.35 2.99
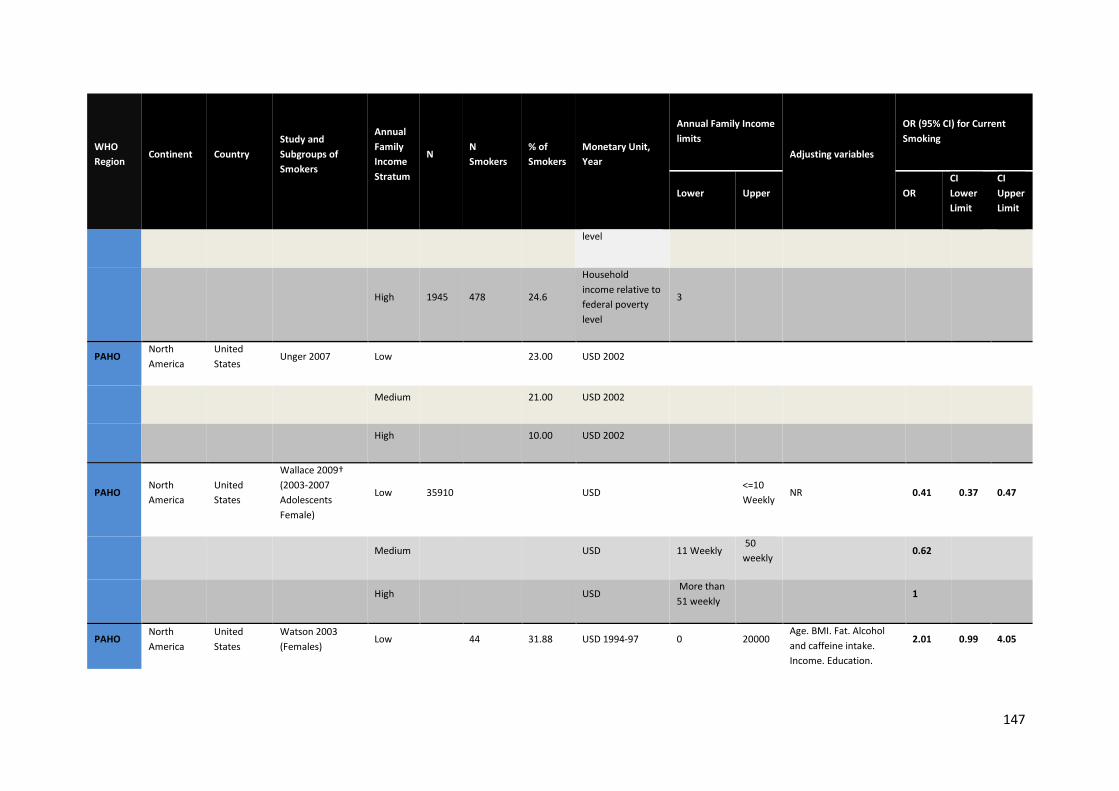
147
WHO Region
Continent Country Study and Subgroups of Smokers
Annual Family Income Stratum
N N Smokers
% of Smokers
Monetary Unit, Year
Annual Family Income limits
Adjusting variables
OR (95% CI) for Current Smoking
Lower Upper OR CI Lower Limit
CI Upper Limit
level
High 1945 478 24.6
Household income relative to federal poverty level
3
PAHO North America
United States
Unger 2007 Low
23.00 USD 2002
Medium 21.00 USD 2002
High 10.00 USD 2002
PAHO North America
United States
Wallace 2009† (2003-2007 Adolescents Female)
Low 35910 USD <=10 Weekly
NR 0.41 0.37 0.47
Medium USD 11 Weekly 50 weekly
0.62
High USD More than 51 weekly
1
PAHO North America
United States
Watson 2003 (Females)
Low
44 31.88 USD 1994-97 0 20000 Age. BMI. Fat. Alcohol and caffeine intake. Income. Education.
2.01 0.99 4.05
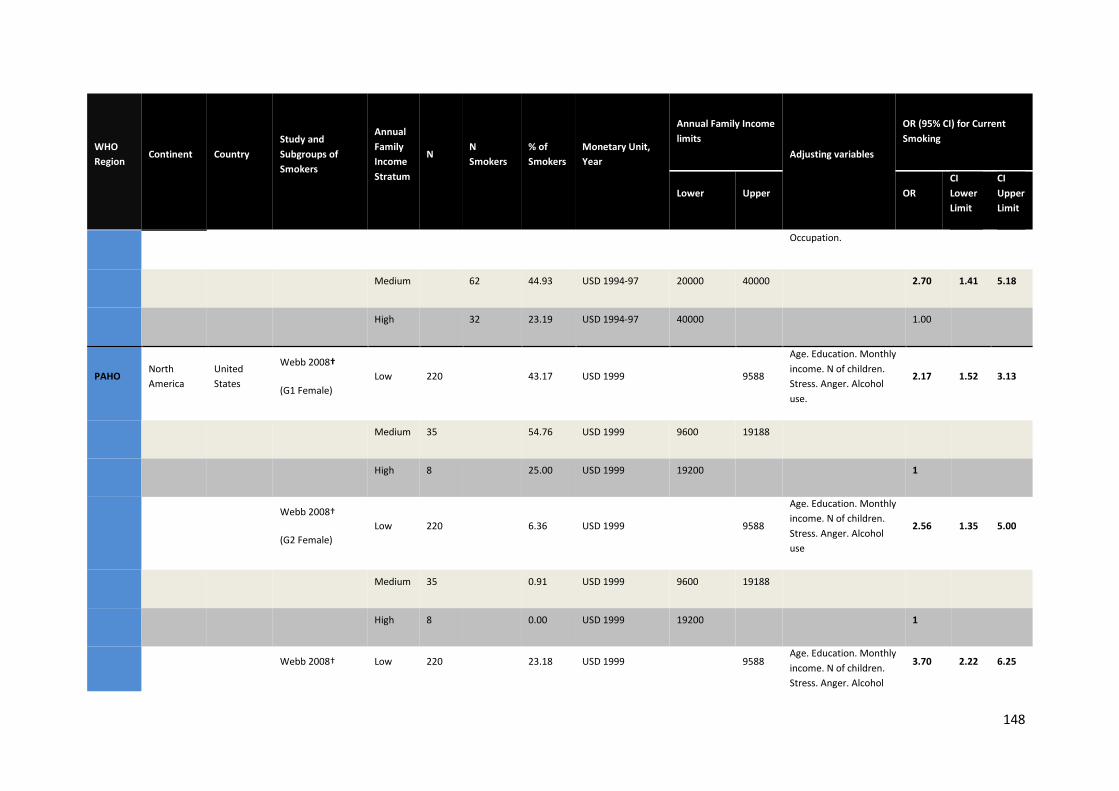
148
WHO Region
Continent Country Study and Subgroups of Smokers
Annual Family Income Stratum
N N Smokers
% of Smokers
Monetary Unit, Year
Annual Family Income limits
Adjusting variables
OR (95% CI) for Current Smoking
Lower Upper OR CI Lower Limit
CI Upper Limit
Occupation.
Medium 62 44.93 USD 1994-97 20000 40000 2.70 1.41 5.18
High 32 23.19 USD 1994-97 40000 1.00
PAHO North America
United States
Webb 2008†
(G1 Female) Low 220
43.17 USD 1999
9588
Age. Education. Monthly income. N of children. Stress. Anger. Alcohol use.
2.17 1.52 3.13
Medium 35 54.76 USD 1999 9600 19188
High 8 25.00 USD 1999 19200 1
Webb 2008†
(G2 Female) Low 220
6.36 USD 1999
9588
Age. Education. Monthly income. N of children. Stress. Anger. Alcohol use
2.56 1.35 5.00
Medium 35 0.91 USD 1999 9600 19188
High 8 0.00 USD 1999 19200 1
Webb 2008† Low 220
23.18 USD 1999
9588 Age. Education. Monthly income. N of children. Stress. Anger. Alcohol
3.70 2.22 6.25
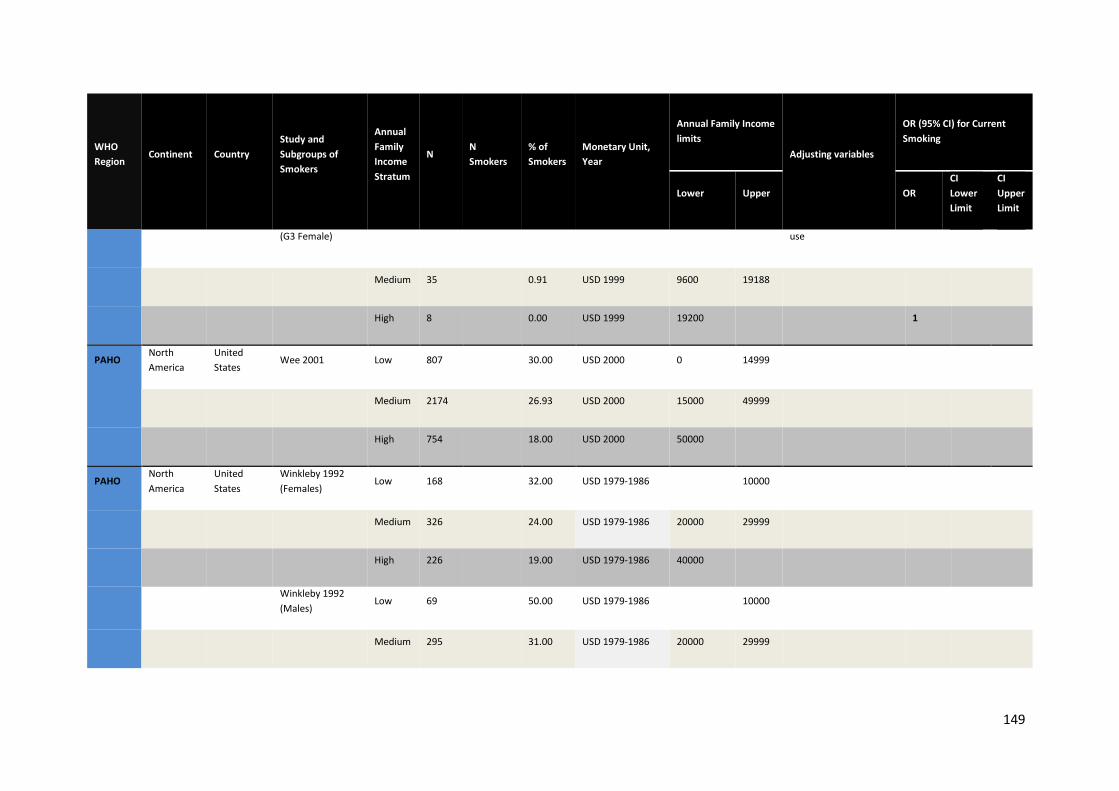
149
WHO Region
Continent Country Study and Subgroups of Smokers
Annual Family Income Stratum
N N Smokers
% of Smokers
Monetary Unit, Year
Annual Family Income limits
Adjusting variables
OR (95% CI) for Current Smoking
Lower Upper OR CI Lower Limit
CI Upper Limit
(G3 Female) use
Medium 35 0.91 USD 1999 9600 19188
High 8 0.00 USD 1999 19200 1
PAHO North America
United States
Wee 2001 Low 807
30.00 USD 2000 0 14999
Medium 2174 26.93 USD 2000 15000 49999
High 754 18.00 USD 2000 50000
PAHO North America
United States
Winkleby 1992 (Females)
Low 168
32.00 USD 1979-1986
10000
Medium 326 24.00 USD 1979-1986 20000 29999
High 226 19.00 USD 1979-1986 40000
Winkleby 1992 (Males)
Low 69
50.00 USD 1979-1986
10000
Medium 295 31.00 USD 1979-1986 20000 29999
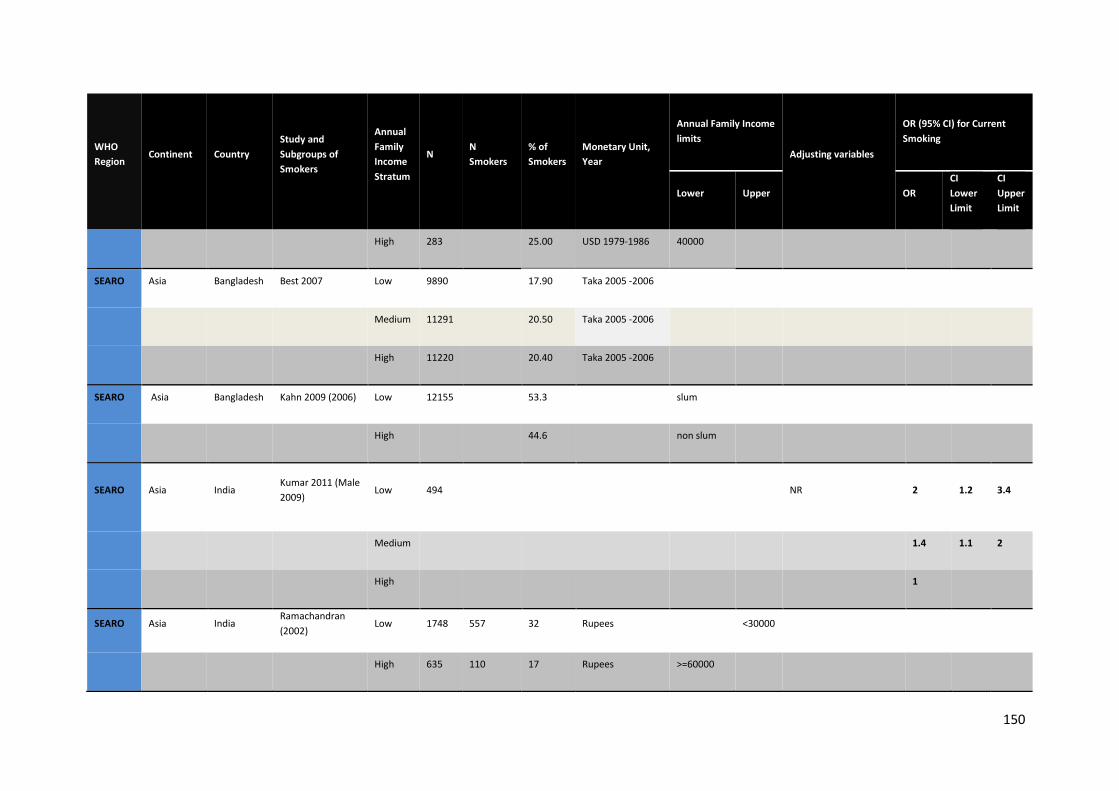
150
WHO Region
Continent Country Study and Subgroups of Smokers
Annual Family Income Stratum
N N Smokers
% of Smokers
Monetary Unit, Year
Annual Family Income limits
Adjusting variables
OR (95% CI) for Current Smoking
Lower Upper OR CI Lower Limit
CI Upper Limit
High 283 25.00 USD 1979-1986 40000
SEARO Asia Bangladesh Best 2007 Low 9890
17.90 Taka 2005 -2006
Medium 11291 20.50 Taka 2005 -2006
High 11220 20.40 Taka 2005 -2006
SEARO Asia Bangladesh Kahn 2009 (2006) Low 12155 53.3 slum
High 44.6 non slum
SEARO Asia India Kumar 2011 (Male 2009)
Low 494 NR 2 1.2 3.4
Medium 1.4 1.1 2
High 1
SEARO Asia India Ramachandran (2002)
Low 1748 557 32 Rupees
<30000
High 635 110 17 Rupees >=60000
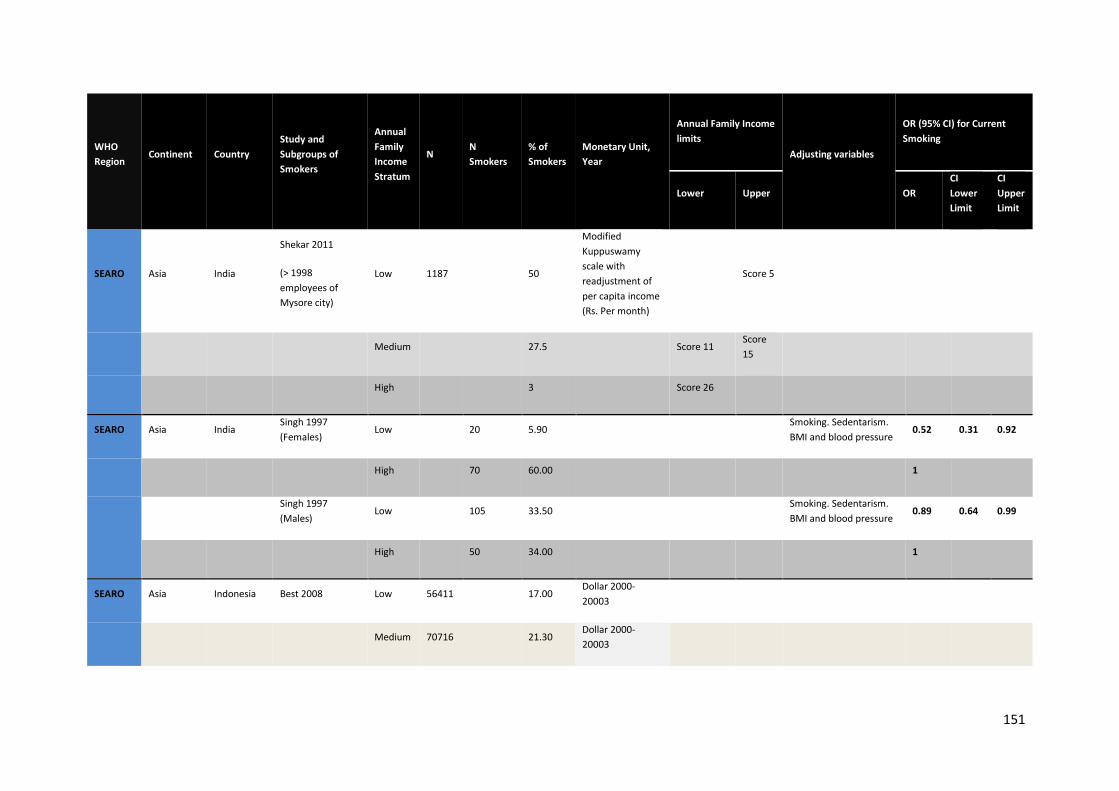
151
WHO Region
Continent Country Study and Subgroups of Smokers
Annual Family Income Stratum
N N Smokers
% of Smokers
Monetary Unit, Year
Annual Family Income limits
Adjusting variables
OR (95% CI) for Current Smoking
Lower Upper OR CI Lower Limit
CI Upper Limit
SEARO Asia India
Shekar 2011
(> 1998 employees of Mysore city)
Low 1187 50
Modified Kuppuswamy scale with readjustment of per capita income (Rs. Per month)
Score 5
Medium 27.5 Score 11 Score 15
High 3 Score 26
SEARO Asia India Singh 1997 (Females)
Low
20 5.90
Smoking. Sedentarism. BMI and blood pressure
0.52 0.31 0.92
High 70 60.00 1
Singh 1997 (Males)
Low
105 33.50
Smoking. Sedentarism. BMI and blood pressure
0.89 0.64 0.99
High 50 34.00 1
SEARO Asia Indonesia Best 2008 Low 56411
17.00 Dollar 2000-20003
Medium 70716 21.30 Dollar 2000-20003

152
WHO Region
Continent Country Study and Subgroups of Smokers
Annual Family Income Stratum
N N Smokers
% of Smokers
Monetary Unit, Year
Annual Family Income limits
Adjusting variables
OR (95% CI) for Current Smoking
Lower Upper OR CI Lower Limit
CI Upper Limit
High 69482 20.90 Dollar 2000-20003
SEARO Asia Indonesia
Dewi 2010 (Females 15-34 years-old. Asia Pacific Islander)
Low 3205 2 Income < or > = than mean
High 4 Income < or > = than mean
Dewi 2010 (Females 35-54 years-old. Asia Pacific Islander)
Low 0 Income < or > = than mean
High 1 Income < or > = than mean
Dewi 2010 (Females 55-75 years-old. Asia Pacific Islander)
Low 3 Income < or > = than mean
High 2 Income < or > = than mean
Dewi 2010 (Males 15-34 years-old. Asia Pacific Islander)
Low 62 Income < or > = than mean
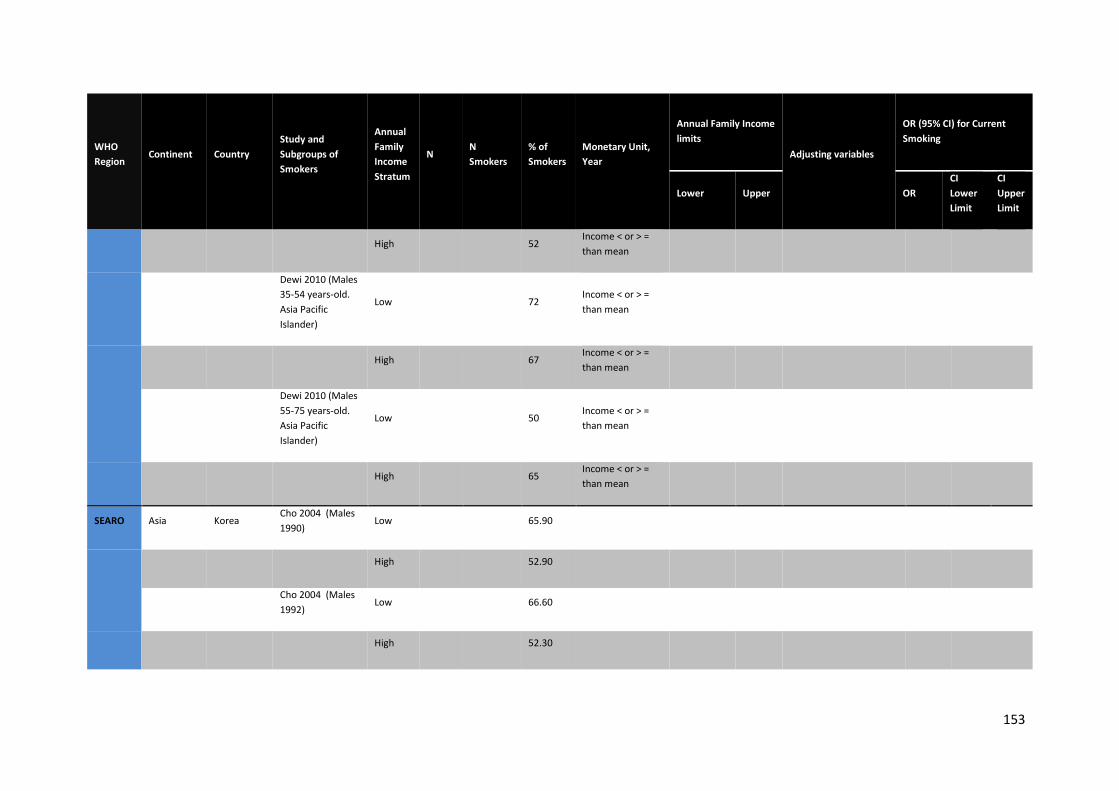
153
WHO Region
Continent Country Study and Subgroups of Smokers
Annual Family Income Stratum
N N Smokers
% of Smokers
Monetary Unit, Year
Annual Family Income limits
Adjusting variables
OR (95% CI) for Current Smoking
Lower Upper OR CI Lower Limit
CI Upper Limit
High 52 Income < or > = than mean
Dewi 2010 (Males 35-54 years-old. Asia Pacific Islander)
Low 72 Income < or > = than mean
High 67 Income < or > = than mean
Dewi 2010 (Males 55-75 years-old. Asia Pacific Islander)
Low 50 Income < or > = than mean
High 65 Income < or > = than mean
SEARO Asia Korea Cho 2004 (Males 1990)
Low
65.90
High 52.90
Cho 2004 (Males 1992)
Low
66.60
High 52.30
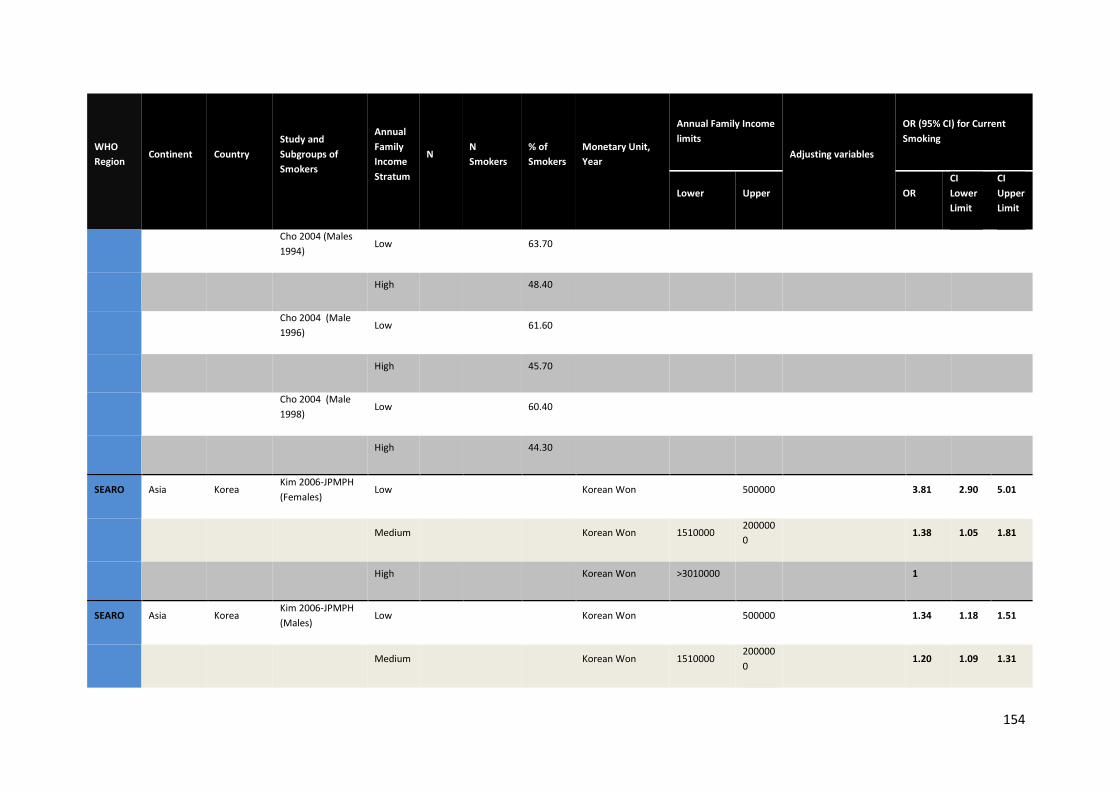
154
WHO Region
Continent Country Study and Subgroups of Smokers
Annual Family Income Stratum
N N Smokers
% of Smokers
Monetary Unit, Year
Annual Family Income limits
Adjusting variables
OR (95% CI) for Current Smoking
Lower Upper OR CI Lower Limit
CI Upper Limit
Cho 2004 (Males 1994)
Low
63.70
High 48.40
Cho 2004 (Male 1996)
Low
61.60
High 45.70
Cho 2004 (Male 1998)
Low
60.40
High 44.30
SEARO Asia Korea Kim 2006-JPMPH (Females)
Low
Korean Won
500000
3.81 2.90 5.01
Medium Korean Won 1510000 2000000
1.38 1.05 1.81
High Korean Won >3010000 1
SEARO Asia Korea Kim 2006-JPMPH (Males)
Low
Korean Won
500000
1.34 1.18 1.51
Medium Korean Won 1510000 2000000
1.20 1.09 1.31
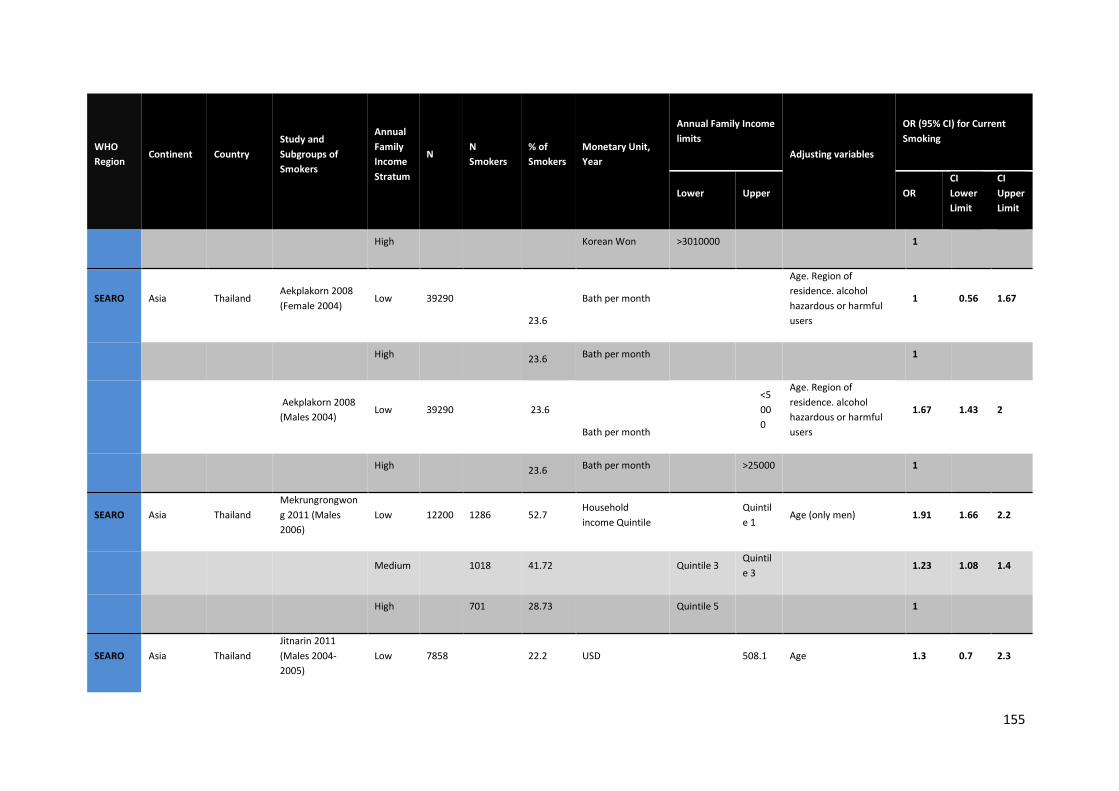
155
WHO Region
Continent Country Study and Subgroups of Smokers
Annual Family Income Stratum
N N Smokers
% of Smokers
Monetary Unit, Year
Annual Family Income limits
Adjusting variables
OR (95% CI) for Current Smoking
Lower Upper OR CI Lower Limit
CI Upper Limit
High Korean Won >3010000 1
SEARO Asia Thailand Aekplakorn 2008 (Female 2004)
Low 39290
23.6
Bath per month
Age. Region of residence. alcohol hazardous or harmful users
1 0.56 1.67
High 23.6 Bath per month 1
Aekplakorn 2008 (Males 2004)
Low 39290
23.6
Bath per month
<5000
Age. Region of residence. alcohol hazardous or harmful users
1.67 1.43 2
High 23.6 Bath per month >25000 1
SEARO Asia Thailand Mekrungrongwong 2011 (Males 2006)
Low 12200 1286 52.7 Household income Quintile
Quintile 1
Age (only men) 1.91 1.66 2.2
Medium 1018 41.72 Quintile 3 Quintile 3
1.23 1.08 1.4
High 701 28.73 Quintile 5 1
SEARO Asia Thailand Jitnarin 2011 (Males 2004-2005)
Low 7858 22.2 USD 508.1 Age 1.3 0.7 2.3
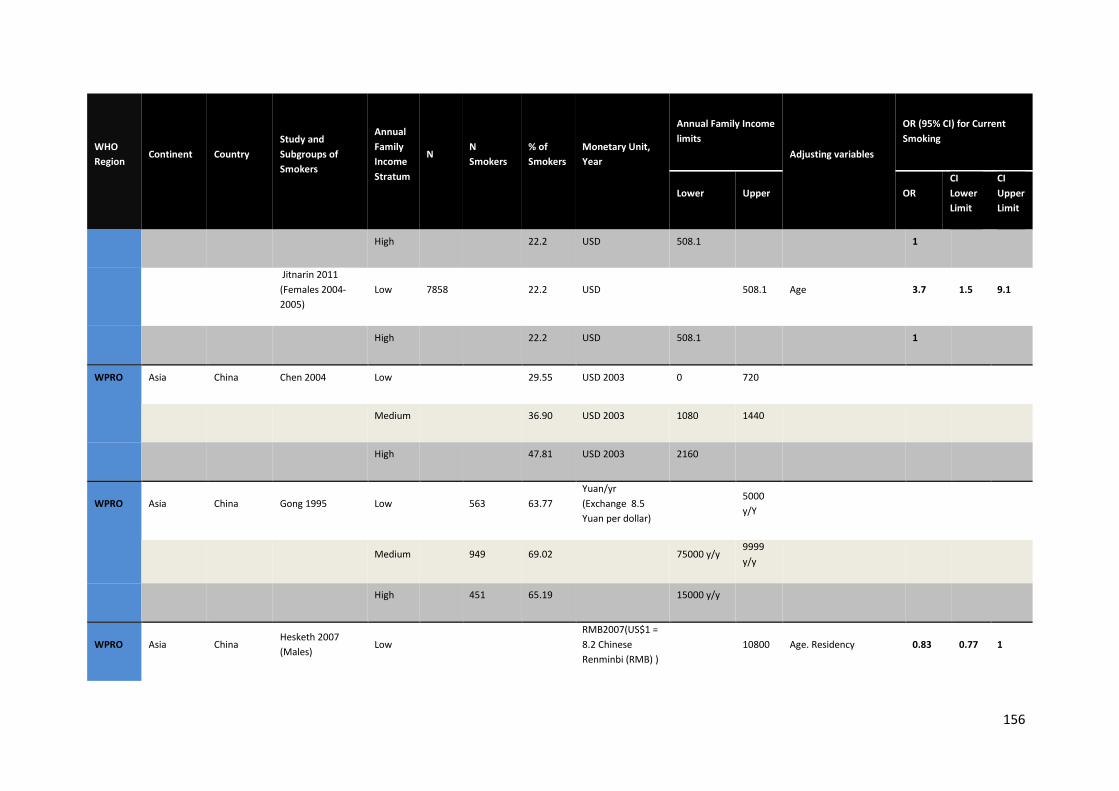
156
WHO Region
Continent Country Study and Subgroups of Smokers
Annual Family Income Stratum
N N Smokers
% of Smokers
Monetary Unit, Year
Annual Family Income limits
Adjusting variables
OR (95% CI) for Current Smoking
Lower Upper OR CI Lower Limit
CI Upper Limit
High 22.2 USD 508.1 1
Jitnarin 2011 (Females 2004-2005)
Low 7858 22.2 USD 508.1 Age 3.7 1.5 9.1
High 22.2 USD 508.1 1
WPRO Asia China Chen 2004 Low
29.55 USD 2003 0 720
Medium 36.90 USD 2003 1080 1440
High 47.81 USD 2003 2160
WPRO Asia China Gong 1995 Low
563 63.77 Yuan/yr (Exchange 8.5 Yuan per dollar)
5000 y/Y
Medium 949 69.02 75000 y/y 9999 y/y
High 451 65.19 15000 y/y
WPRO Asia China Hesketh 2007 (Males)
Low
RMB2007(US$1 = 8.2 Chinese Renminbi (RMB) )
10800 Age. Residency 0.83 0.77 1
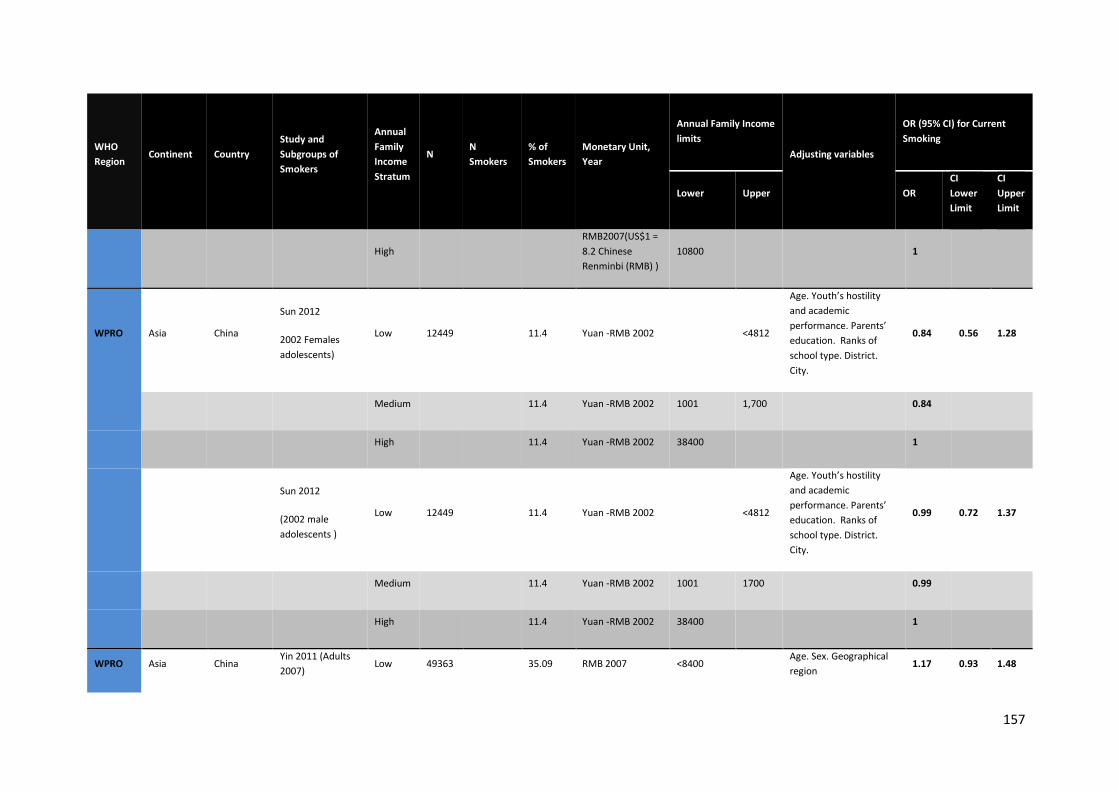
157
WHO Region
Continent Country Study and Subgroups of Smokers
Annual Family Income Stratum
N N Smokers
% of Smokers
Monetary Unit, Year
Annual Family Income limits
Adjusting variables
OR (95% CI) for Current Smoking
Lower Upper OR CI Lower Limit
CI Upper Limit
High RMB2007(US$1 = 8.2 Chinese Renminbi (RMB) )
10800 1
WPRO Asia China
Sun 2012
2002 Females adolescents)
Low 12449 11.4 Yuan -RMB 2002 <4812
Age. Youth’s hostility and academic performance. Parents’ education. Ranks of school type. District. City.
0.84 0.56 1.28
Medium 11.4 Yuan -RMB 2002 1001 1,700 0.84
High 11.4 Yuan -RMB 2002 38400 1
Sun 2012
(2002 male adolescents )
Low 12449 11.4 Yuan -RMB 2002 <4812
Age. Youth’s hostility and academic performance. Parents’ education. Ranks of school type. District. City.
0.99 0.72 1.37
Medium 11.4 Yuan -RMB 2002 1001 1700 0.99
High 11.4 Yuan -RMB 2002 38400 1
WPRO Asia China Yin 2011 (Adults 2007)
Low 49363 35.09 RMB 2007 <8400 Age. Sex. Geographical region
1.17 0.93 1.48
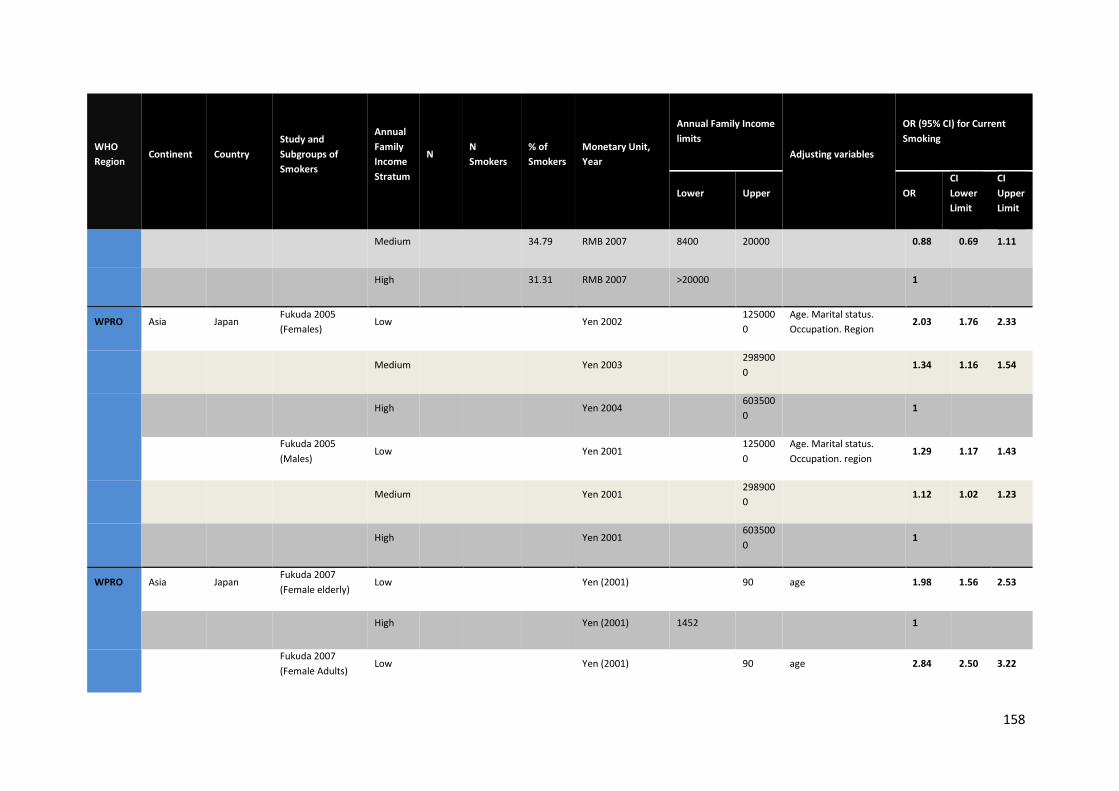
158
WHO Region
Continent Country Study and Subgroups of Smokers
Annual Family Income Stratum
N N Smokers
% of Smokers
Monetary Unit, Year
Annual Family Income limits
Adjusting variables
OR (95% CI) for Current Smoking
Lower Upper OR CI Lower Limit
CI Upper Limit
Medium 34.79 RMB 2007 8400 20000 0.88 0.69 1.11
High 31.31 RMB 2007 >20000 1
WPRO Asia Japan Fukuda 2005 (Females)
Low
Yen 2002
1250000
Age. Marital status. Occupation. Region
2.03 1.76 2.33
Medium Yen 2003 2989000
1.34 1.16 1.54
High Yen 2004 6035000
1
Fukuda 2005 (Males)
Low
Yen 2001
1250000
Age. Marital status. Occupation. region
1.29 1.17 1.43
Medium Yen 2001 2989000
1.12 1.02 1.23
High Yen 2001 6035000
1
WPRO Asia Japan Fukuda 2007 (Female elderly)
Low
Yen (2001)
90 age 1.98 1.56 2.53
High Yen (2001) 1452 1
Fukuda 2007 (Female Adults)
Low
Yen (2001)
90 age 2.84 2.50 3.22
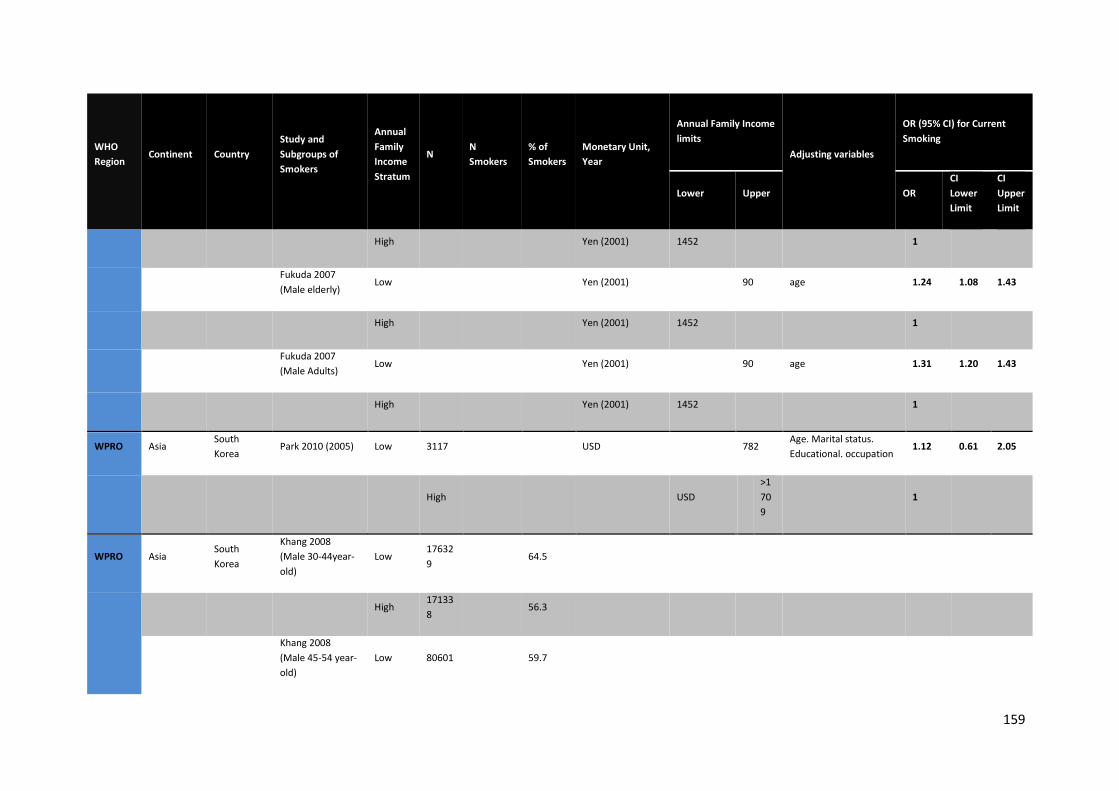
159
WHO Region
Continent Country Study and Subgroups of Smokers
Annual Family Income Stratum
N N Smokers
% of Smokers
Monetary Unit, Year
Annual Family Income limits
Adjusting variables
OR (95% CI) for Current Smoking
Lower Upper OR CI Lower Limit
CI Upper Limit
High Yen (2001) 1452 1
Fukuda 2007 (Male elderly)
Low
Yen (2001)
90 age 1.24 1.08 1.43
High Yen (2001) 1452 1
Fukuda 2007 (Male Adults)
Low
Yen (2001)
90 age 1.31 1.20 1.43
High Yen (2001) 1452 1
WPRO Asia South Korea
Park 2010 (2005) Low 3117
USD
782 Age. Marital status. Educational. occupation
1.12 0.61 2.05
High USD >1709
1
WPRO Asia South Korea
Khang 2008 (Male 30-44year-old)
Low 176329
64.5
High 171338
56.3
Khang 2008 (Male 45-54 year-old)
Low 80601
59.7
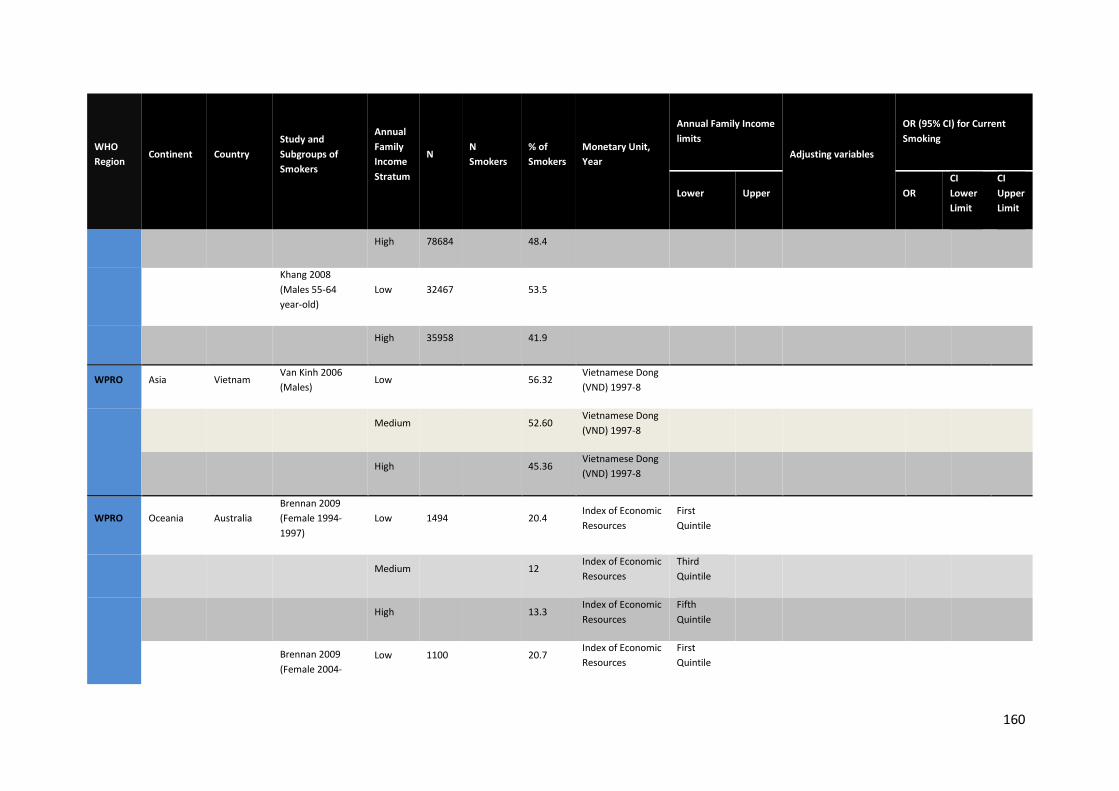
160
WHO Region
Continent Country Study and Subgroups of Smokers
Annual Family Income Stratum
N N Smokers
% of Smokers
Monetary Unit, Year
Annual Family Income limits
Adjusting variables
OR (95% CI) for Current Smoking
Lower Upper OR CI Lower Limit
CI Upper Limit
High 78684 48.4
Khang 2008 (Males 55-64 year-old)
Low 32467
53.5
High 35958 41.9
WPRO Asia Vietnam Van Kinh 2006 (Males)
Low
56.32 Vietnamese Dong (VND) 1997-8
Medium 52.60 Vietnamese Dong (VND) 1997-8
High 45.36 Vietnamese Dong (VND) 1997-8
WPRO Oceania Australia Brennan 2009 (Female 1994-1997)
Low 1494 20.4 Index of Economic Resources
First Quintile
Medium 12 Index of Economic Resources
Third Quintile
High 13.3 Index of Economic Resources
Fifth Quintile
Brennan 2009 (Female 2004-
Low 1100 20.7 Index of Economic Resources
First Quintile
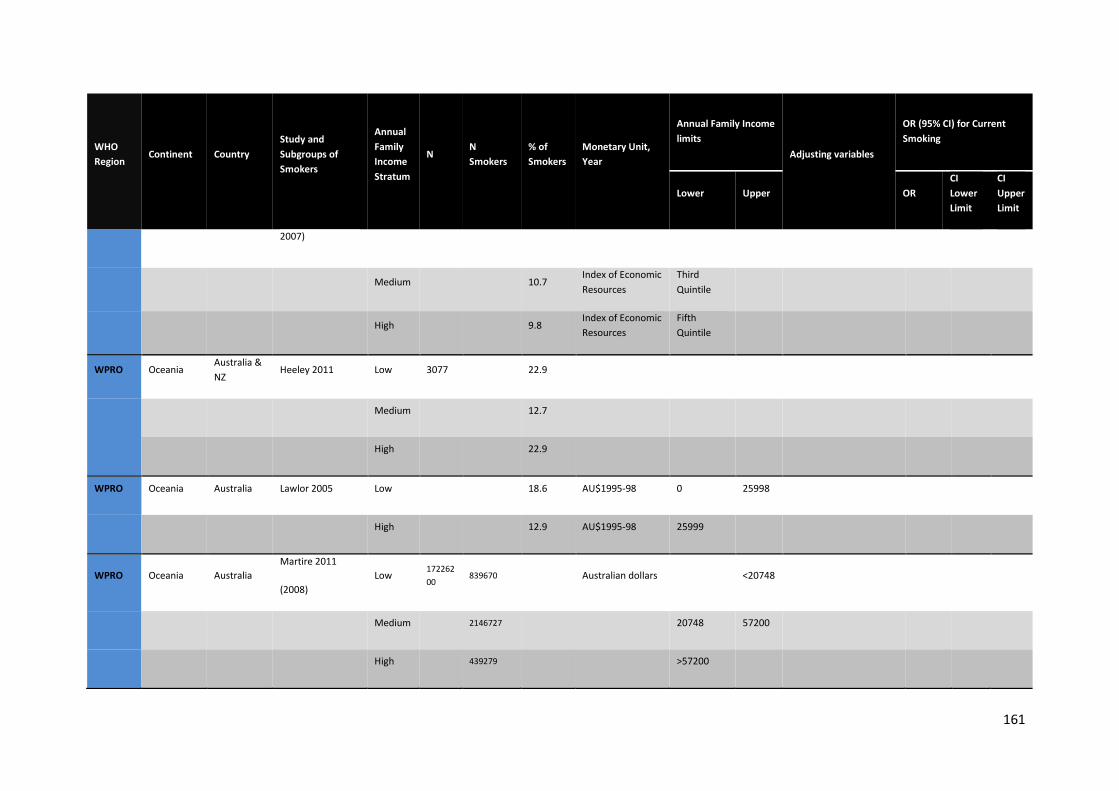
161
WHO Region
Continent Country Study and Subgroups of Smokers
Annual Family Income Stratum
N N Smokers
% of Smokers
Monetary Unit, Year
Annual Family Income limits
Adjusting variables
OR (95% CI) for Current Smoking
Lower Upper OR CI Lower Limit
CI Upper Limit
2007)
Medium 10.7 Index of Economic Resources
Third Quintile
High 9.8 Index of Economic Resources
Fifth Quintile
WPRO Oceania Australia & NZ
Heeley 2011 Low 3077 22.9
Medium 12.7
High 22.9
WPRO Oceania Australia Lawlor 2005 Low
18.6 AU$1995-98 0 25998
High 12.9 AU$1995-98 25999
WPRO Oceania Australia Martire 2011
(2008) Low
17226200
839670 Australian dollars <20748
Medium 2146727 20748 57200
High 439279 >57200
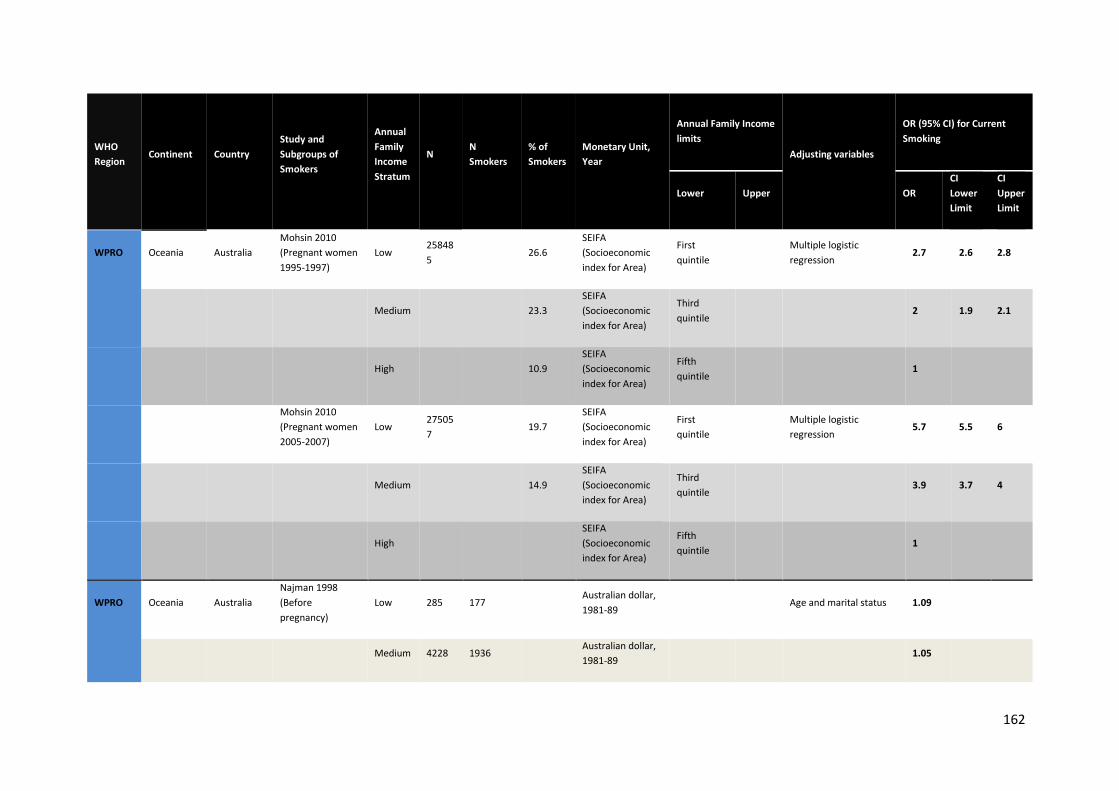
162
WHO Region
Continent Country Study and Subgroups of Smokers
Annual Family Income Stratum
N N Smokers
% of Smokers
Monetary Unit, Year
Annual Family Income limits
Adjusting variables
OR (95% CI) for Current Smoking
Lower Upper OR CI Lower Limit
CI Upper Limit
WPRO Oceania Australia Mohsin 2010 (Pregnant women 1995-1997)
Low 258485
26.6 SEIFA (Socioeconomic index for Area)
First quintile
Multiple logistic regression
2.7 2.6 2.8
Medium 23.3 SEIFA (Socioeconomic index for Area)
Third quintile
2 1.9 2.1
High 10.9 SEIFA (Socioeconomic index for Area)
Fifth quintile
1
Mohsin 2010 (Pregnant women 2005-2007)
Low 275057
19.7 SEIFA (Socioeconomic index for Area)
First quintile
Multiple logistic regression
5.7 5.5 6
Medium 14.9 SEIFA (Socioeconomic index for Area)
Third quintile
3.9 3.7 4
High SEIFA (Socioeconomic index for Area)
Fifth quintile
1
WPRO Oceania Australia Najman 1998 (Before pregnancy)
Low 285 177 Australian dollar, 1981-89
Age and marital status 1.09
Medium 4228 1936 Australian dollar, 1981-89
1.05
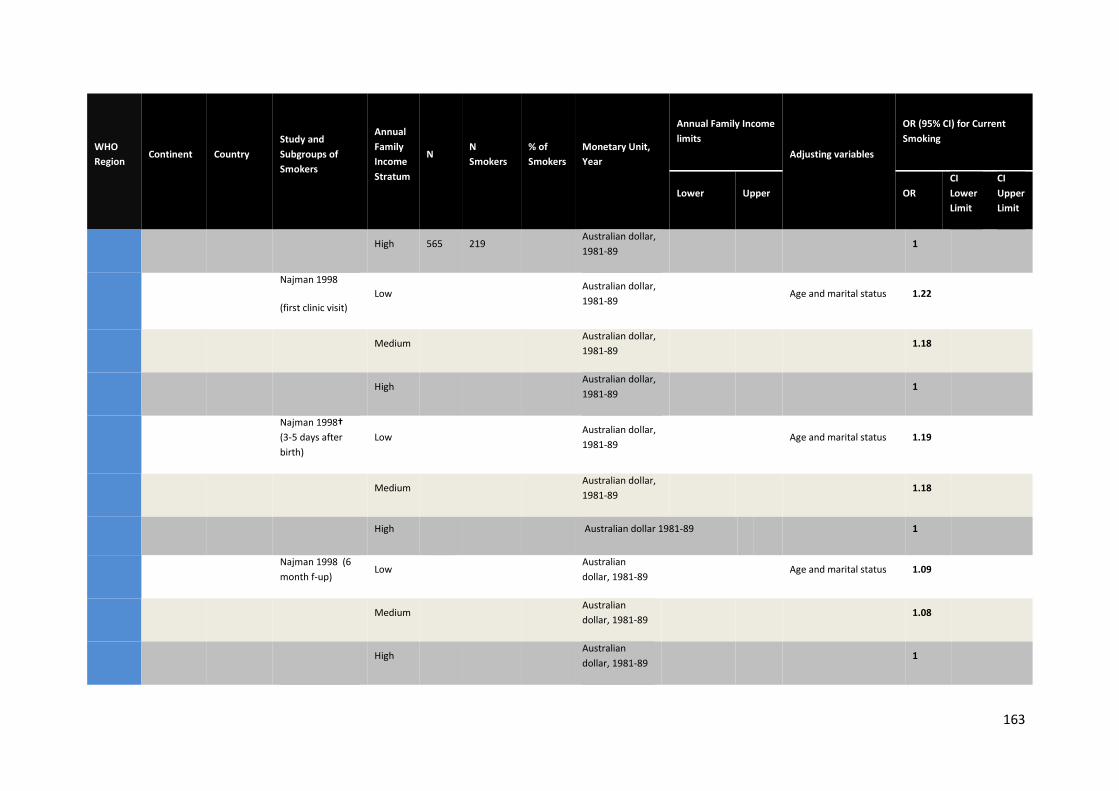
163
WHO Region
Continent Country Study and Subgroups of Smokers
Annual Family Income Stratum
N N Smokers
% of Smokers
Monetary Unit, Year
Annual Family Income limits
Adjusting variables
OR (95% CI) for Current Smoking
Lower Upper OR CI Lower Limit
CI Upper Limit
High 565 219 Australian dollar, 1981-89
1
Najman 1998
(first clinic visit) Low
Australian dollar, 1981-89
Age and marital status 1.22
Medium Australian dollar, 1981-89
1.18
High Australian dollar, 1981-89
1
Najman 1998† (3-5 days after birth)
Low
Australian dollar, 1981-89
Age and marital status 1.19
Medium Australian dollar, 1981-89
1.18
High
Australian dollar 1981-89 1
Najman 1998 (6 month f-up)
Low
Australian dollar, 1981-89
Age and marital status 1.09
Medium Australian dollar, 1981-89
1.08
High Australian dollar, 1981-89
1
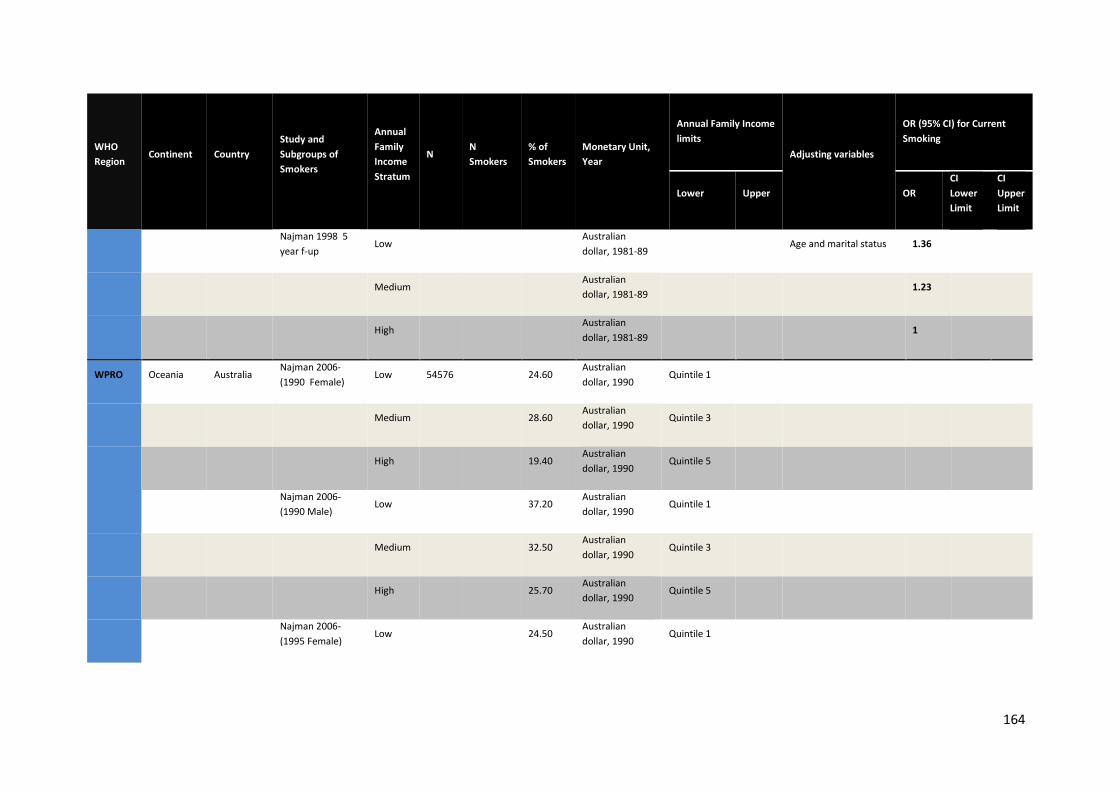
164
WHO Region
Continent Country Study and Subgroups of Smokers
Annual Family Income Stratum
N N Smokers
% of Smokers
Monetary Unit, Year
Annual Family Income limits
Adjusting variables
OR (95% CI) for Current Smoking
Lower Upper OR CI Lower Limit
CI Upper Limit
Najman 1998 5 year f-up
Low
Australian dollar, 1981-89
Age and marital status 1.36
Medium Australian dollar, 1981-89
1.23
High Australian dollar, 1981-89
1
WPRO Oceania Australia Najman 2006-(1990 Female)
Low 54576
24.60 Australian dollar, 1990
Quintile 1
Medium 28.60 Australian dollar, 1990
Quintile 3
High 19.40 Australian dollar, 1990
Quintile 5
Najman 2006-(1990 Male)
Low
37.20 Australian dollar, 1990
Quintile 1
Medium 32.50 Australian dollar, 1990
Quintile 3
High 25.70 Australian dollar, 1990
Quintile 5
Najman 2006-(1995 Female)
Low
24.50 Australian dollar, 1990
Quintile 1
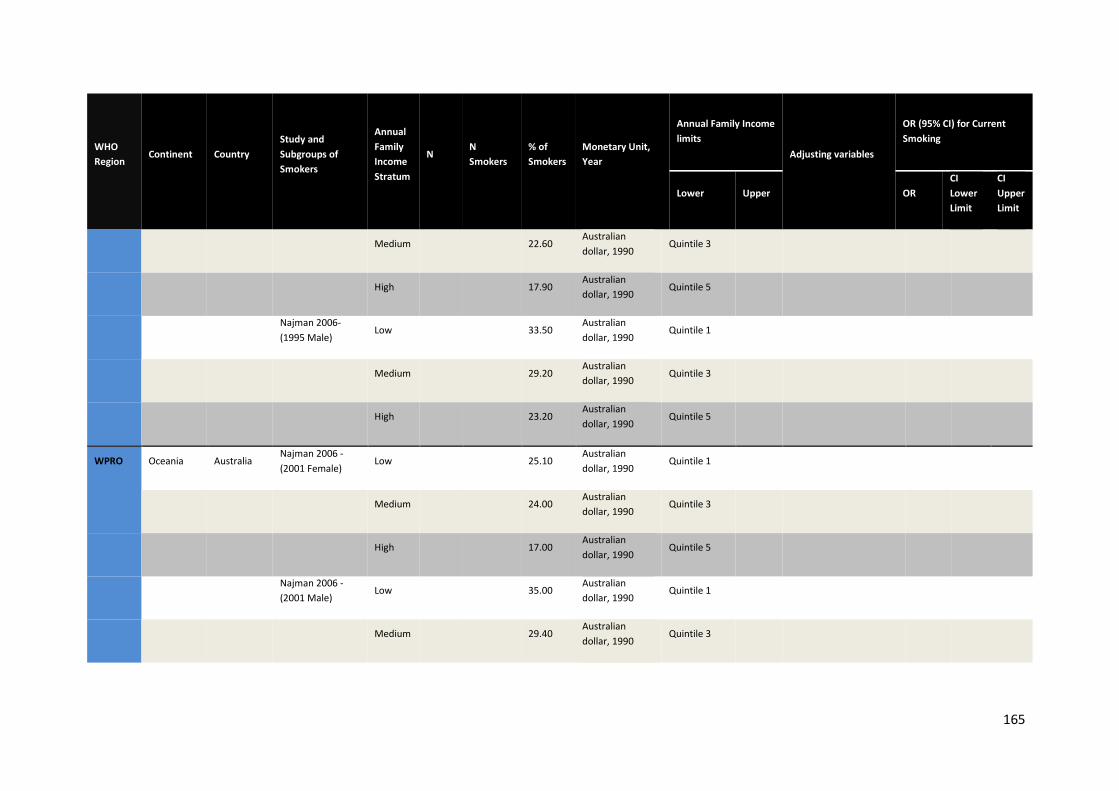
165
WHO Region
Continent Country Study and Subgroups of Smokers
Annual Family Income Stratum
N N Smokers
% of Smokers
Monetary Unit, Year
Annual Family Income limits
Adjusting variables
OR (95% CI) for Current Smoking
Lower Upper OR CI Lower Limit
CI Upper Limit
Medium 22.60 Australian dollar, 1990
Quintile 3
High 17.90 Australian dollar, 1990
Quintile 5
Najman 2006-(1995 Male)
Low
33.50 Australian dollar, 1990
Quintile 1
Medium 29.20 Australian dollar, 1990
Quintile 3
High 23.20 Australian dollar, 1990
Quintile 5
WPRO Oceania Australia Najman 2006 - (2001 Female)
Low
25.10 Australian dollar, 1990
Quintile 1
Medium 24.00 Australian dollar, 1990
Quintile 3
High 17.00 Australian dollar, 1990
Quintile 5
Najman 2006 - (2001 Male)
Low
35.00 Australian dollar, 1990
Quintile 1
Medium 29.40 Australian dollar, 1990
Quintile 3
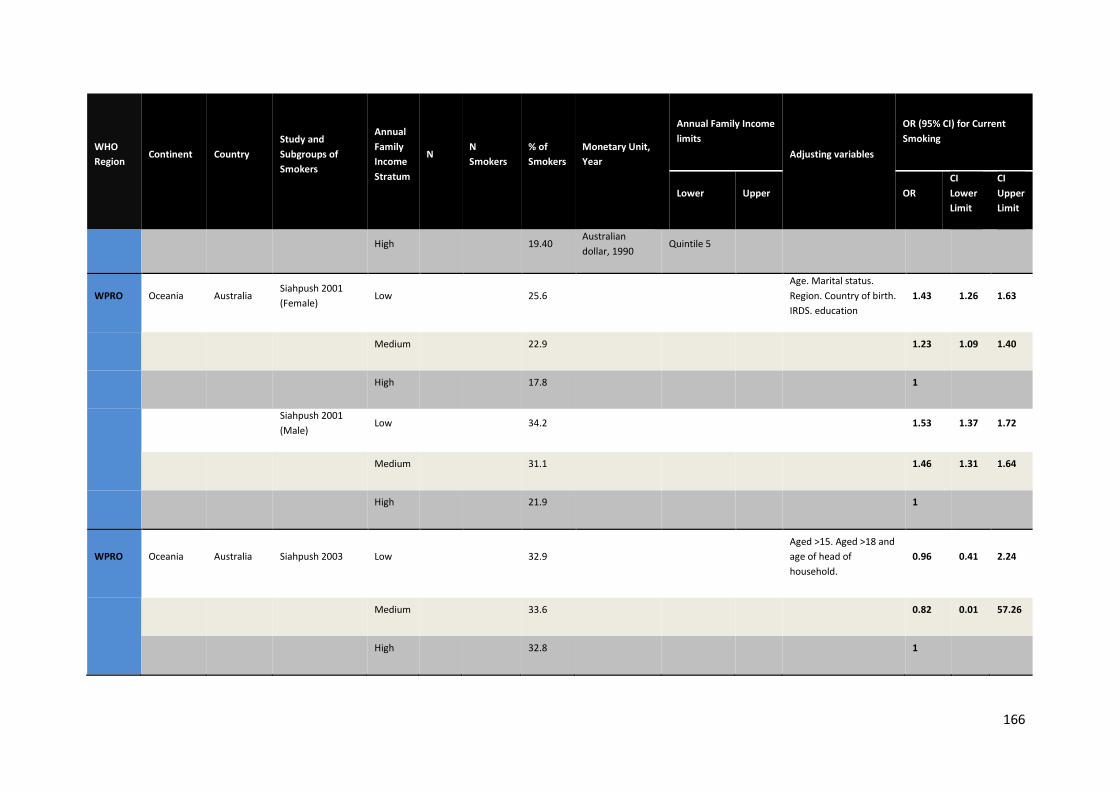
166
WHO Region
Continent Country Study and Subgroups of Smokers
Annual Family Income Stratum
N N Smokers
% of Smokers
Monetary Unit, Year
Annual Family Income limits
Adjusting variables
OR (95% CI) for Current Smoking
Lower Upper OR CI Lower Limit
CI Upper Limit
High 19.40 Australian dollar, 1990
Quintile 5
WPRO Oceania Australia Siahpush 2001 (Female)
Low
25.6
Age. Marital status. Region. Country of birth. IRDS. education
1.43 1.26 1.63
Medium 22.9 1.23 1.09 1.40
High 17.8 1
Siahpush 2001 (Male)
Low
34.2
1.53 1.37 1.72
Medium 31.1 1.46 1.31 1.64
High 21.9 1
WPRO Oceania Australia Siahpush 2003 Low 32.9 Aged >15. Aged >18 and age of head of household.
0.96 0.41 2.24
Medium 33.6 0.82 0.01 57.26
High 32.8 1
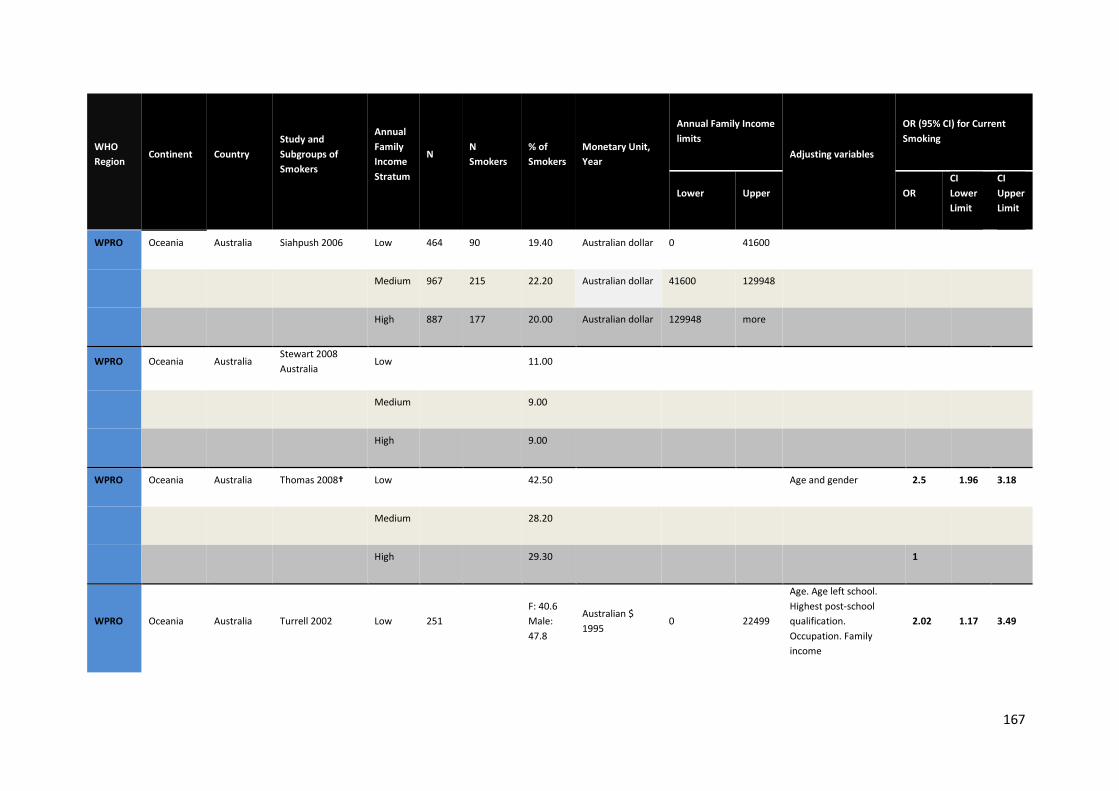
167
WHO Region
Continent Country Study and Subgroups of Smokers
Annual Family Income Stratum
N N Smokers
% of Smokers
Monetary Unit, Year
Annual Family Income limits
Adjusting variables
OR (95% CI) for Current Smoking
Lower Upper OR CI Lower Limit
CI Upper Limit
WPRO Oceania Australia Siahpush 2006 Low 464 90 19.40 Australian dollar 0 41600
Medium 967 215 22.20 Australian dollar 41600 129948
High 887 177 20.00 Australian dollar 129948 more
WPRO Oceania Australia Stewart 2008 Australia
Low
11.00
Medium 9.00
High 9.00
WPRO Oceania Australia Thomas 2008† Low
42.50
Age and gender 2.5 1.96 3.18
Medium 28.20
High 29.30 1
WPRO Oceania Australia Turrell 2002 Low 251
F: 40.6 Male: 47.8
Australian $ 1995
0 22499
Age. Age left school. Highest post-school qualification. Occupation. Family income
2.02 1.17 3.49
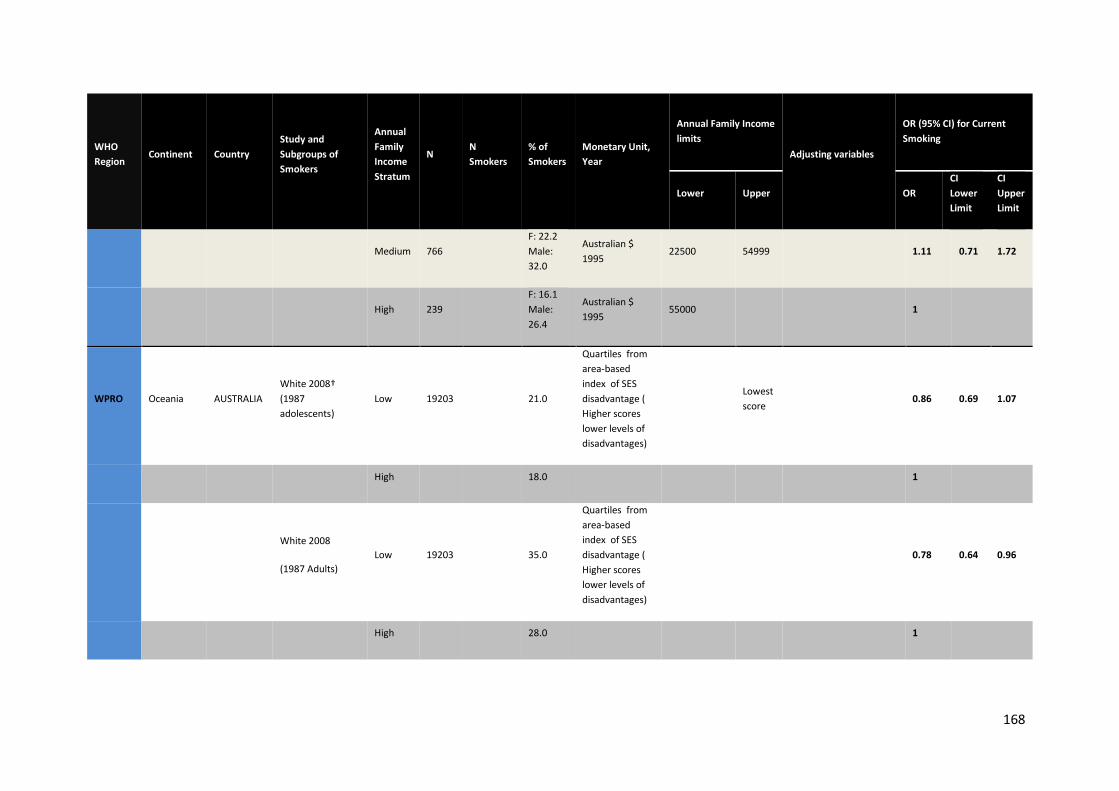
168
WHO Region
Continent Country Study and Subgroups of Smokers
Annual Family Income Stratum
N N Smokers
% of Smokers
Monetary Unit, Year
Annual Family Income limits
Adjusting variables
OR (95% CI) for Current Smoking
Lower Upper OR CI Lower Limit
CI Upper Limit
Medium 766 F: 22.2 Male: 32.0
Australian $ 1995
22500 54999 1.11 0.71 1.72
High 239 F: 16.1 Male: 26.4
Australian $ 1995
55000 1
WPRO Oceania AUSTRALIA White 2008† (1987 adolescents)
Low 19203 21.0
Quartiles from area-based index of SES disadvantage ( Higher scores lower levels of disadvantages)
Lowest score
0.86 0.69 1.07
High 18.0 1
White 2008
(1987 Adults) Low 19203 35.0
Quartiles from area-based index of SES disadvantage ( Higher scores lower levels of disadvantages)
0.78 0.64 0.96
High 28.0 1
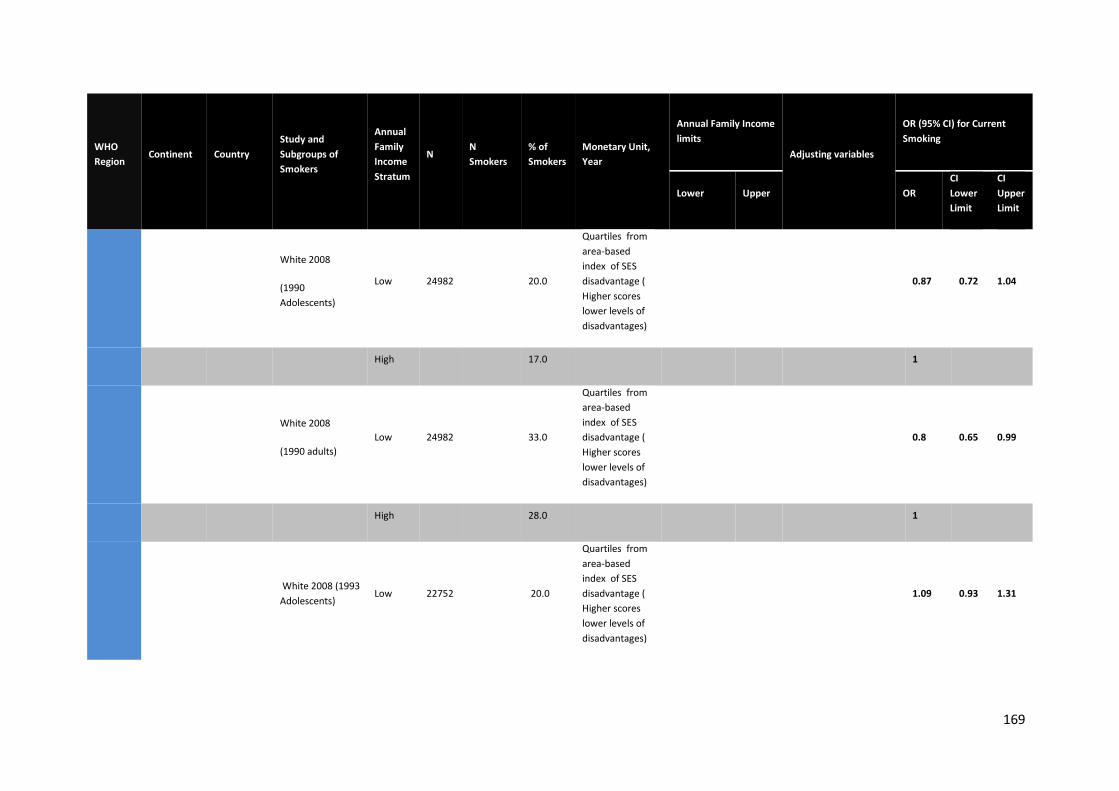
169
WHO Region
Continent Country Study and Subgroups of Smokers
Annual Family Income Stratum
N N Smokers
% of Smokers
Monetary Unit, Year
Annual Family Income limits
Adjusting variables
OR (95% CI) for Current Smoking
Lower Upper OR CI Lower Limit
CI Upper Limit
White 2008
(1990 Adolescents)
Low 24982 20.0
Quartiles from area-based index of SES disadvantage ( Higher scores lower levels of disadvantages)
0.87 0.72 1.04
High 17.0 1
White 2008
(1990 adults) Low 24982 33.0
Quartiles from area-based index of SES disadvantage ( Higher scores lower levels of disadvantages)
0.8 0.65 0.99
High 28.0 1
White 2008 (1993 Adolescents)
Low 22752
20.0
Quartiles from area-based index of SES disadvantage ( Higher scores lower levels of disadvantages)
1.09 0.93 1.31
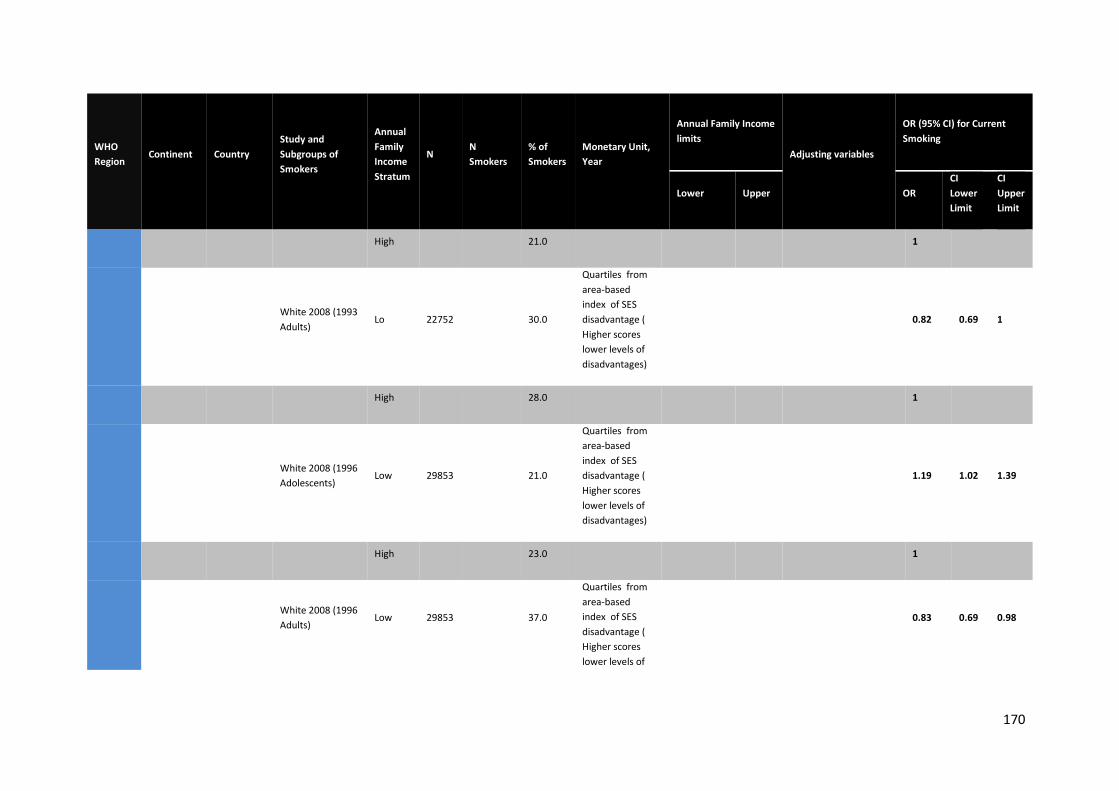
170
WHO Region
Continent Country Study and Subgroups of Smokers
Annual Family Income Stratum
N N Smokers
% of Smokers
Monetary Unit, Year
Annual Family Income limits
Adjusting variables
OR (95% CI) for Current Smoking
Lower Upper OR CI Lower Limit
CI Upper Limit
High 21.0 1
White 2008 (1993 Adults)
Lo 22752 30.0
Quartiles from area-based index of SES disadvantage ( Higher scores lower levels of disadvantages)
0.82 0.69 1
High 28.0 1
White 2008 (1996 Adolescents)
Low 29853 21.0
Quartiles from area-based index of SES disadvantage ( Higher scores lower levels of disadvantages)
1.19 1.02 1.39
High 23.0 1
White 2008 (1996 Adults)
Low 29853 37.0
Quartiles from area-based index of SES disadvantage ( Higher scores lower levels of
0.83 0.69 0.98
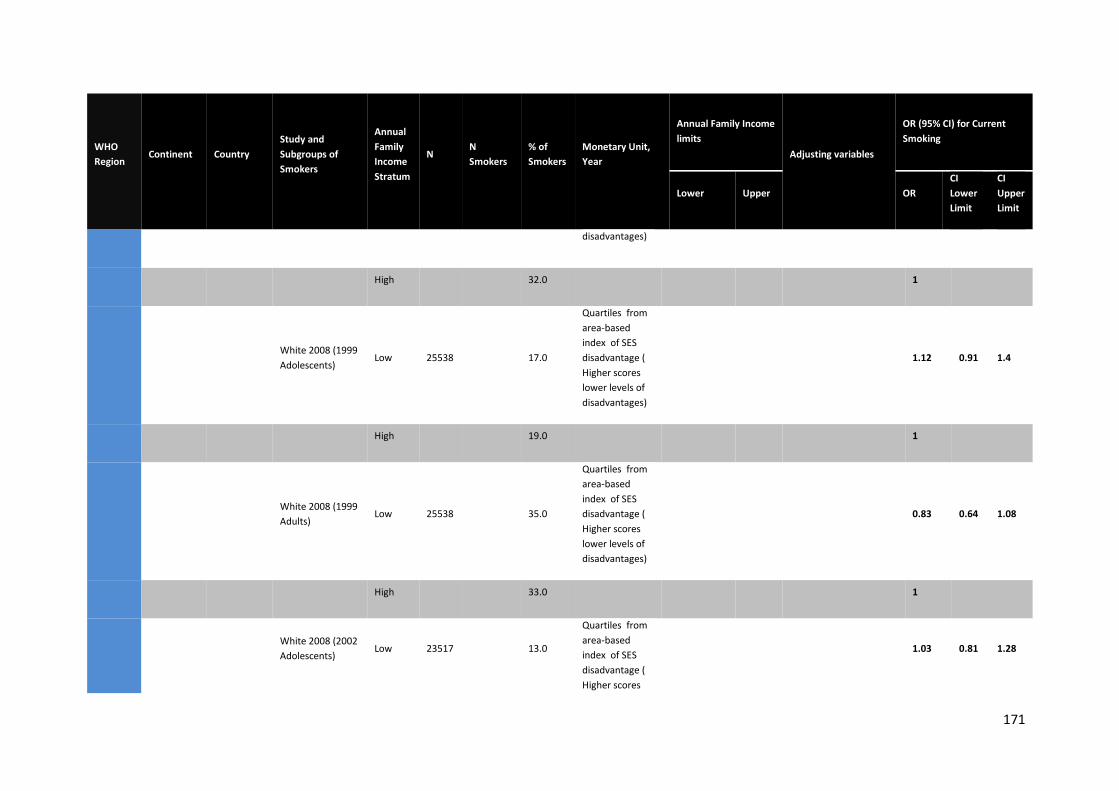
171
WHO Region
Continent Country Study and Subgroups of Smokers
Annual Family Income Stratum
N N Smokers
% of Smokers
Monetary Unit, Year
Annual Family Income limits
Adjusting variables
OR (95% CI) for Current Smoking
Lower Upper OR CI Lower Limit
CI Upper Limit
disadvantages)
High 32.0 1
White 2008 (1999 Adolescents)
Low 25538 17.0
Quartiles from area-based index of SES disadvantage ( Higher scores lower levels of disadvantages)
1.12 0.91 1.4
High 19.0 1
White 2008 (1999 Adults)
Low 25538 35.0
Quartiles from area-based index of SES disadvantage ( Higher scores lower levels of disadvantages)
0.83 0.64 1.08
High 33.0 1
White 2008 (2002 Adolescents)
Low 23517 13.0
Quartiles from area-based index of SES disadvantage ( Higher scores
1.03 0.81 1.28
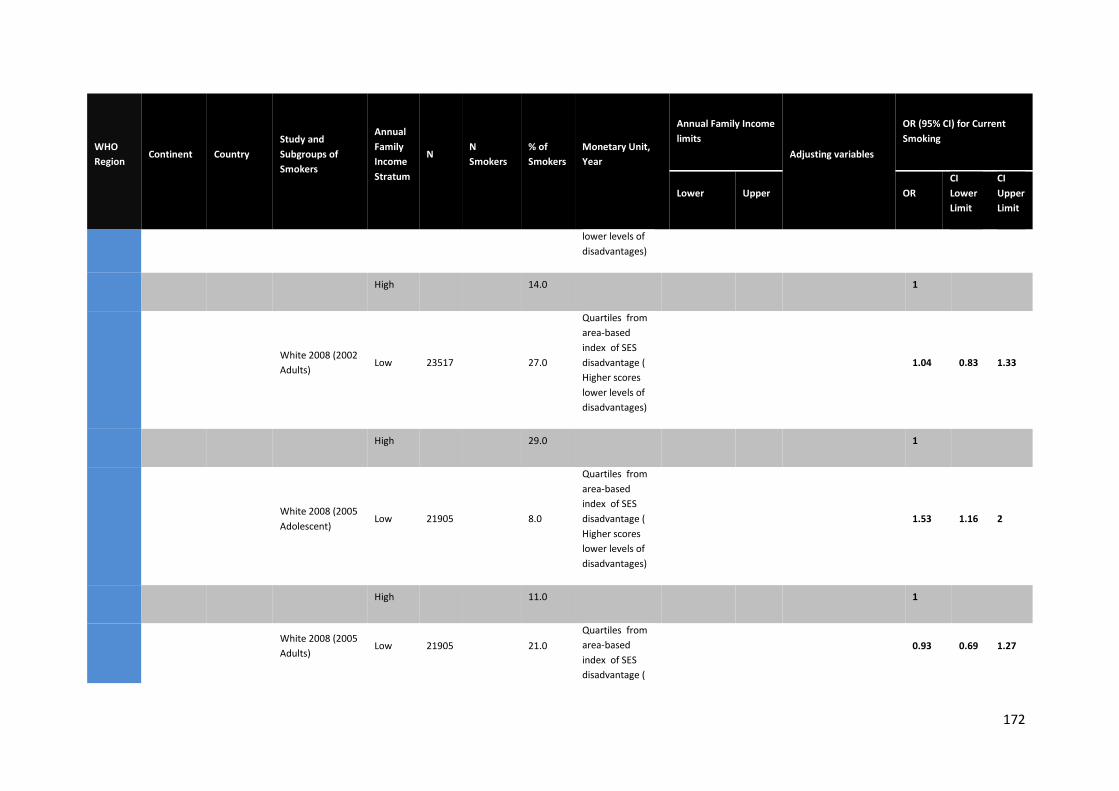
172
WHO Region
Continent Country Study and Subgroups of Smokers
Annual Family Income Stratum
N N Smokers
% of Smokers
Monetary Unit, Year
Annual Family Income limits
Adjusting variables
OR (95% CI) for Current Smoking
Lower Upper OR CI Lower Limit
CI Upper Limit
lower levels of disadvantages)
High 14.0 1
White 2008 (2002 Adults)
Low 23517 27.0
Quartiles from area-based index of SES disadvantage ( Higher scores lower levels of disadvantages)
1.04 0.83 1.33
High 29.0 1
White 2008 (2005 Adolescent)
Low 21905 8.0
Quartiles from area-based index of SES disadvantage ( Higher scores lower levels of disadvantages)
1.53 1.16 2
High 11.0 1
White 2008 (2005 Adults)
Low 21905 21.0 Quartiles from area-based index of SES disadvantage (
0.93 0.69 1.27
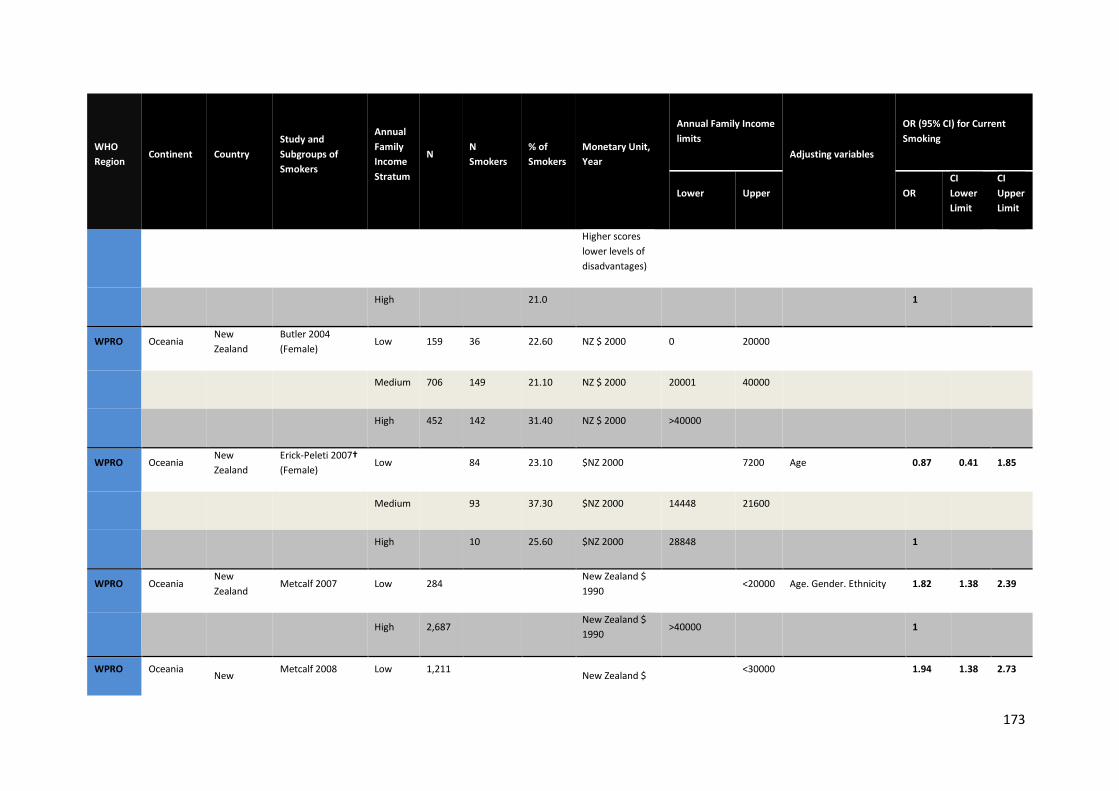
173
WHO Region
Continent Country Study and Subgroups of Smokers
Annual Family Income Stratum
N N Smokers
% of Smokers
Monetary Unit, Year
Annual Family Income limits
Adjusting variables
OR (95% CI) for Current Smoking
Lower Upper OR CI Lower Limit
CI Upper Limit
Higher scores lower levels of disadvantages)
High 21.0 1
WPRO Oceania New Zealand
Butler 2004 (Female)
Low 159 36 22.60 NZ $ 2000 0 20000
Medium 706 149 21.10 NZ $ 2000 20001 40000
High 452 142 31.40 NZ $ 2000 >40000
WPRO Oceania New Zealand
Erick-Peleti 2007† (Female)
Low
84 23.10 $NZ 2000
7200 Age 0.87 0.41 1.85
Medium 93 37.30 $NZ 2000 14448 21600
High 10 25.60 $NZ 2000 28848 1
WPRO Oceania New Zealand
Metcalf 2007 Low 284
New Zealand $ 1990
<20000 Age. Gender. Ethnicity 1.82 1.38 2.39
High 2,687 New Zealand $ 1990
>40000 1
WPRO Oceania New Metcalf 2008 Low 1,211
New Zealand $
<30000
1.94 1.38 2.73
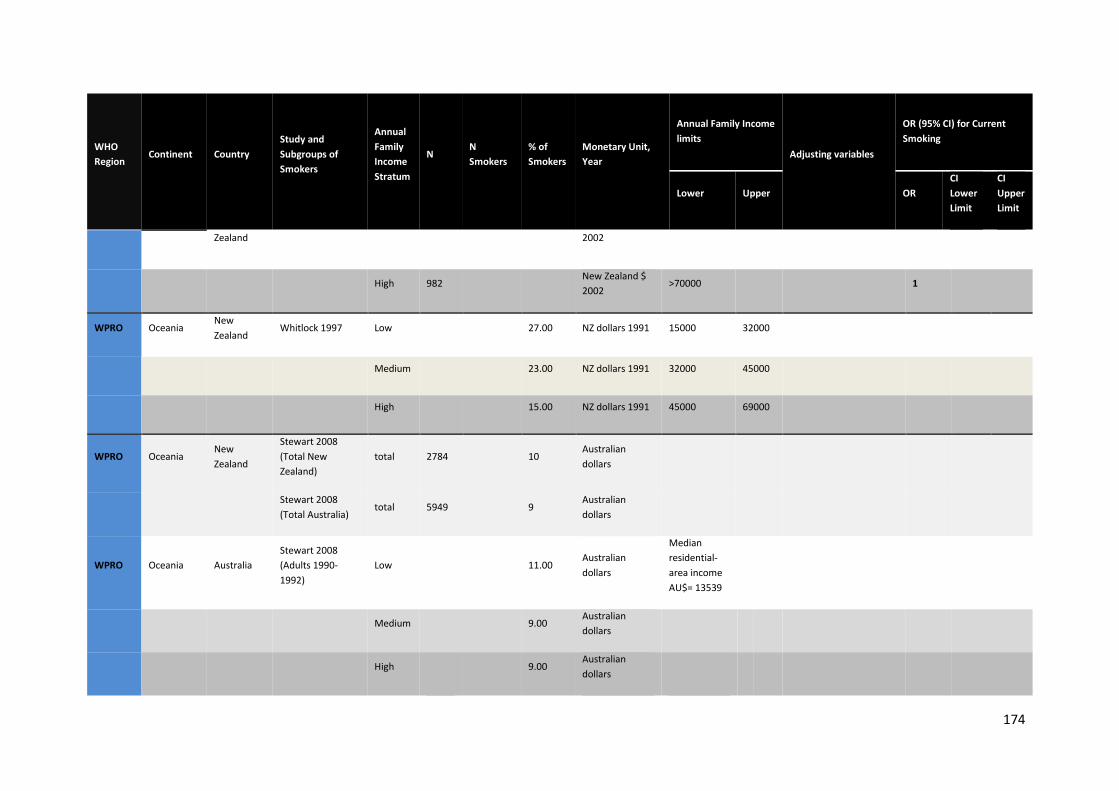
174
WHO Region
Continent Country Study and Subgroups of Smokers
Annual Family Income Stratum
N N Smokers
% of Smokers
Monetary Unit, Year
Annual Family Income limits
Adjusting variables
OR (95% CI) for Current Smoking
Lower Upper OR CI Lower Limit
CI Upper Limit
Zealand 2002
High 982 New Zealand $ 2002
>70000 1
WPRO Oceania New Zealand
Whitlock 1997 Low
27.00 NZ dollars 1991 15000 32000
Medium 23.00 NZ dollars 1991 32000 45000
High 15.00 NZ dollars 1991 45000 69000
WPRO Oceania New Zealand
Stewart 2008 (Total New Zealand)
total 2784
10 Australian dollars
Stewart 2008 (Total Australia)
total 5949 9 Australian dollars
WPRO Oceania Australia Stewart 2008 (Adults 1990-1992)
Low 11.00 Australian dollars
Median residential-area income AU$= 13539
Medium
9.00 Australian dollars
High
9.00 Australian dollars
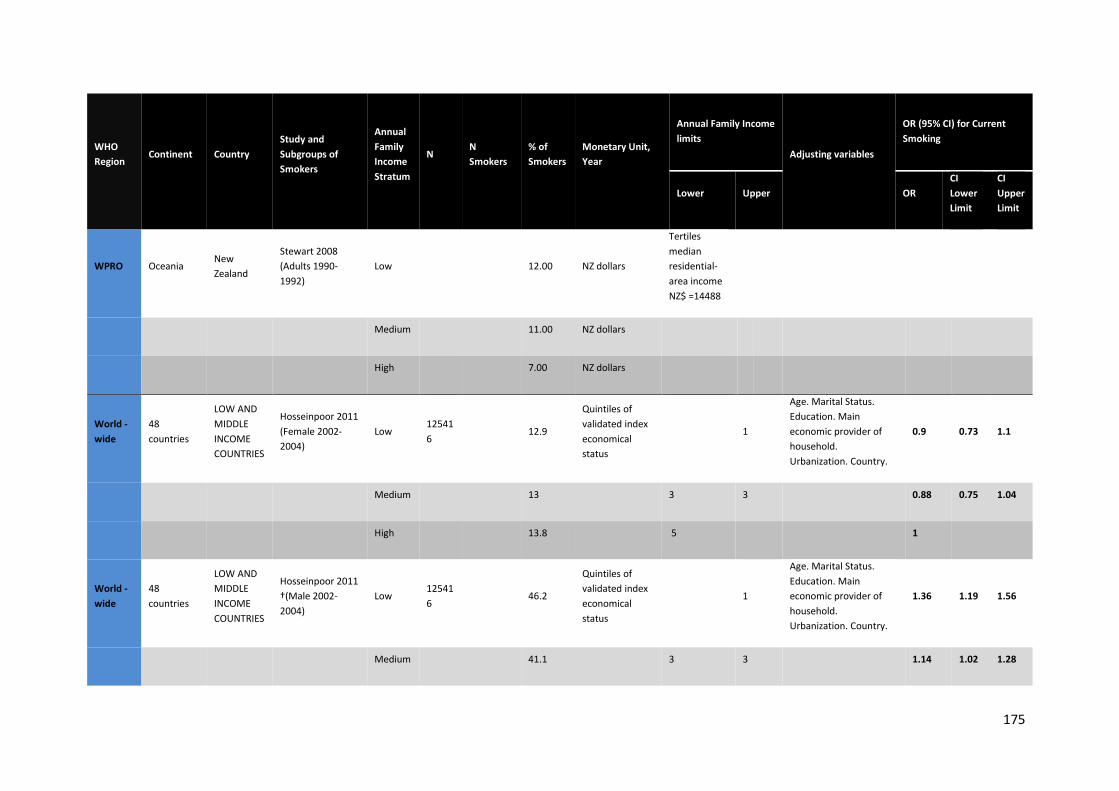
175
WHO Region
Continent Country Study and Subgroups of Smokers
Annual Family Income Stratum
N N Smokers
% of Smokers
Monetary Unit, Year
Annual Family Income limits
Adjusting variables
OR (95% CI) for Current Smoking
Lower Upper OR CI Lower Limit
CI Upper Limit
WPRO Oceania New Zealand
Stewart 2008 (Adults 1990-1992)
Low 12.00 NZ dollars
Tertiles median residential-area income NZ$ =14488
Medium
11.00 NZ dollars
High
7.00 NZ dollars
World - wide
48 countries
LOW AND MIDDLE INCOME COUNTRIES
Hosseinpoor 2011 (Female 2002-2004)
Low 125416
12.9
Quintiles of validated index economical status
1
Age. Marital Status. Education. Main economic provider of household. Urbanization. Country.
0.9 0.73 1.1
Medium 13 3 3 0.88 0.75 1.04
High 13.8 5
1
World - wide
48 countries
LOW AND MIDDLE INCOME COUNTRIES
Hosseinpoor 2011 †(Male 2002-2004)
Low 125416
46.2
Quintiles of validated index economical status
1
Age. Marital Status. Education. Main economic provider of household. Urbanization. Country.
1.36 1.19 1.56
Medium 41.1 3 3 1.14 1.02 1.28
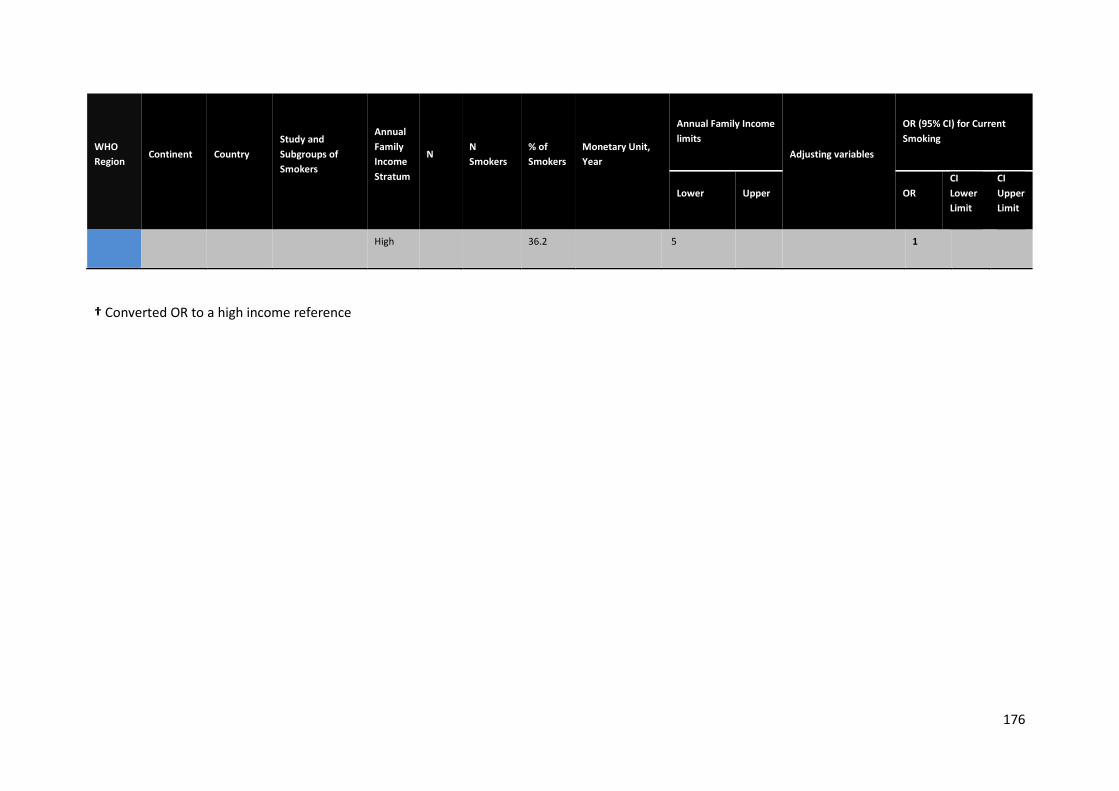
176
WHO Region
Continent Country Study and Subgroups of Smokers
Annual Family Income Stratum
N N Smokers
% of Smokers
Monetary Unit, Year
Annual Family Income limits
Adjusting variables
OR (95% CI) for Current Smoking
Lower Upper OR CI Lower Limit
CI Upper Limit
High 36.2 5
1
† Converted OR to a high income reference
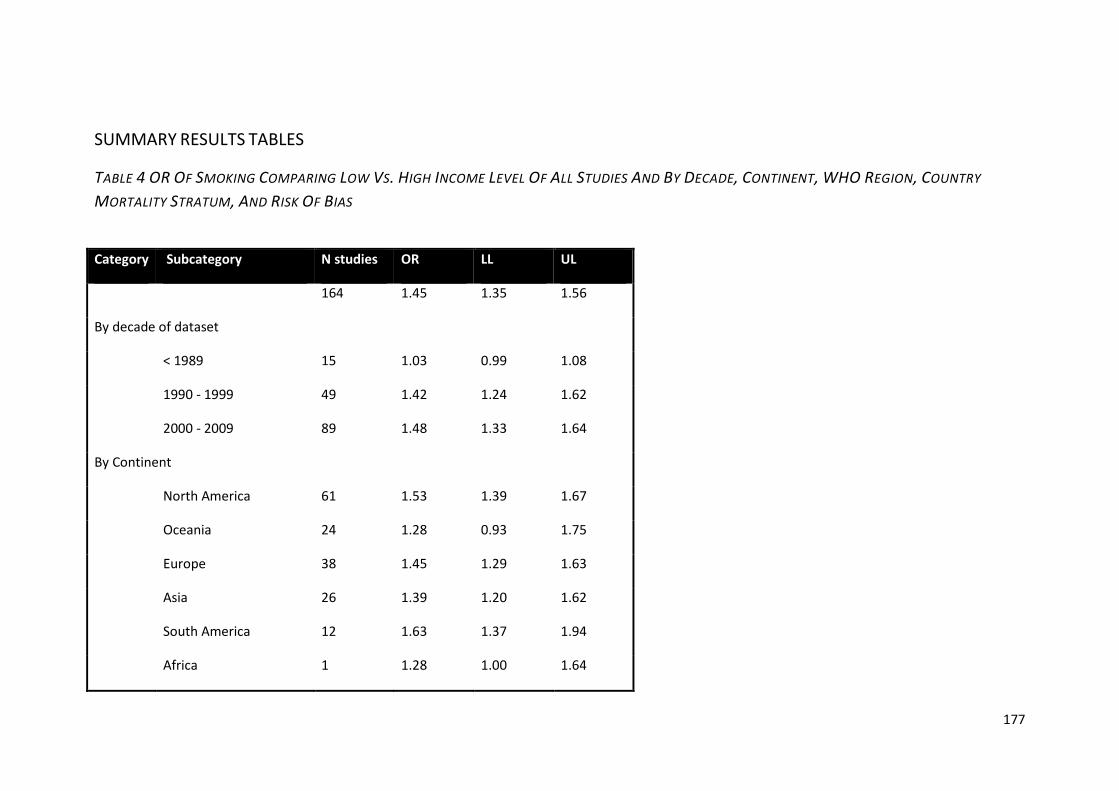
177
SUMMARY RESULTS TABLES
TABLE 4 OR OF SMOKING COMPARING LOW VS. HIGH INCOME LEVEL OF ALL STUDIES AND BY DECADE, CONTINENT, WHO REGION, COUNTRY
MORTALITY STRATUM, AND RISK OF BIAS
Category Subcategory N studies OR LL UL
164 1.45 1.35 1.56
By decade of dataset
< 1989 15 1.03 0.99 1.08
1990 - 1999 49 1.42 1.24 1.62
2000 - 2009 89 1.48 1.33 1.64
By Continent
North America 61 1.53 1.39 1.67
Oceania 24 1.28 0.93 1.75
Europe 38 1.45 1.29 1.63
Asia 26 1.39 1.20 1.62
South America 12 1.63 1.37 1.94
Africa 1 1.28 1.00 1.64
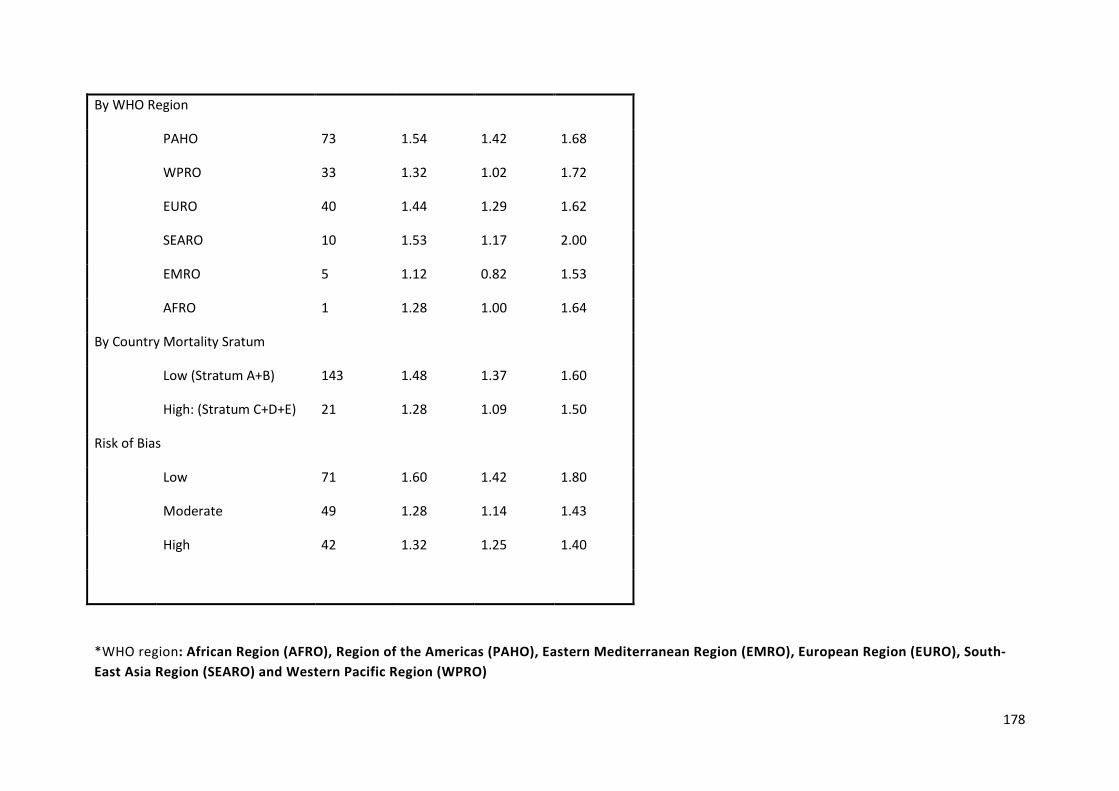
178
By WHO Region
PAHO 73 1.54 1.42 1.68
WPRO 33 1.32 1.02 1.72
EURO 40 1.44 1.29 1.62
SEARO 10 1.53 1.17 2.00
EMRO 5 1.12 0.82 1.53
AFRO 1 1.28 1.00 1.64
By Country Mortality Sratum
Low (Stratum A+B) 143 1.48 1.37 1.60
High: (Stratum C+D+E) 21 1.28 1.09 1.50
Risk of Bias
Low 71 1.60 1.42 1.80
Moderate 49 1.28 1.14 1.43
High 42 1.32 1.25 1.40
*WHO region: African Region (AFRO), Region of the Americas (PAHO), Eastern Mediterranean Region (EMRO), European Region (EURO), South-East Asia Region (SEARO) and Western Pacific Region (WPRO)
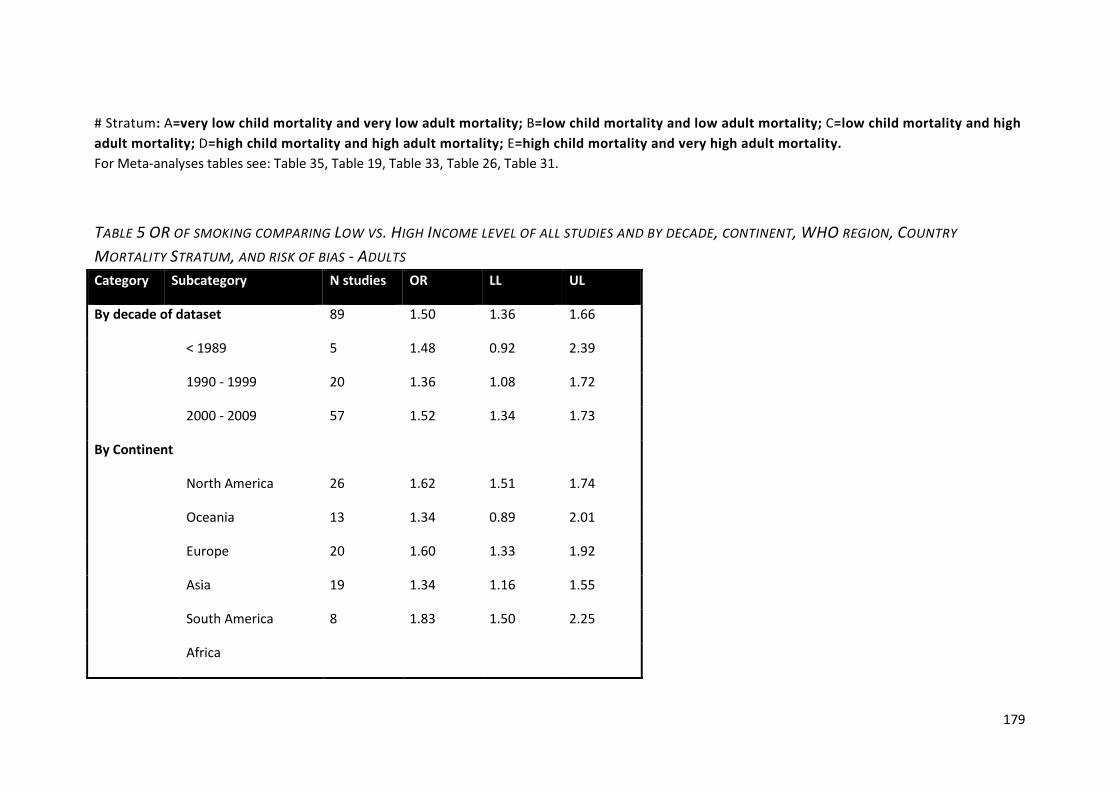
179
# Stratum: A=very low child mortality and very low adult mortality; B=low child mortality and low adult mortality; C=low child mortality and high adult mortality; D=high child mortality and high adult mortality; E=high child mortality and very high adult mortality. For Meta-analyses tables see: Table 35, Table 19, Table 33, Table 26, Table 31.
TABLE 5 OR OF SMOKING COMPARING LOW VS. HIGH INCOME LEVEL OF ALL STUDIES AND BY DECADE, CONTINENT, WHO REGION, COUNTRY
MORTALITY STRATUM, AND RISK OF BIAS - ADULTS Category Subcategory N studies OR LL UL
By decade of dataset 89 1.50 1.36 1.66
< 1989 5 1.48 0.92 2.39
1990 - 1999 20 1.36 1.08 1.72
2000 - 2009 57 1.52 1.34 1.73
By Continent
North America 26 1.62 1.51 1.74
Oceania 13 1.34 0.89 2.01
Europe 20 1.60 1.33 1.92
Asia 19 1.34 1.16 1.55
South America 8 1.83 1.50 2.25
Africa
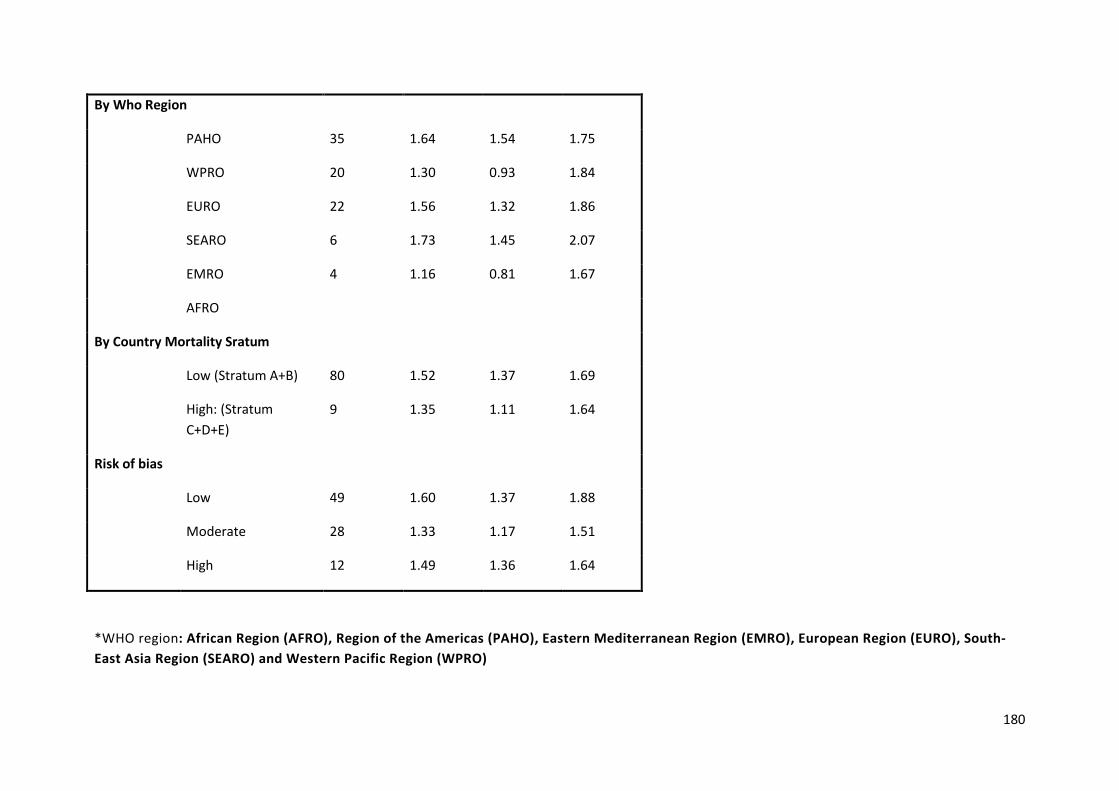
180
By Who Region
PAHO 35 1.64 1.54 1.75
WPRO 20 1.30 0.93 1.84
EURO 22 1.56 1.32 1.86
SEARO 6 1.73 1.45 2.07
EMRO 4 1.16 0.81 1.67
AFRO
By Country Mortality Sratum
Low (Stratum A+B) 80 1.52 1.37 1.69
High: (Stratum C+D+E)
9 1.35 1.11 1.64
Risk of bias
Low 49 1.60 1.37 1.88
Moderate 28 1.33 1.17 1.51
High 12 1.49 1.36 1.64
*WHO region: African Region (AFRO), Region of the Americas (PAHO), Eastern Mediterranean Region (EMRO), European Region (EURO), South-East Asia Region (SEARO) and Western Pacific Region (WPRO)
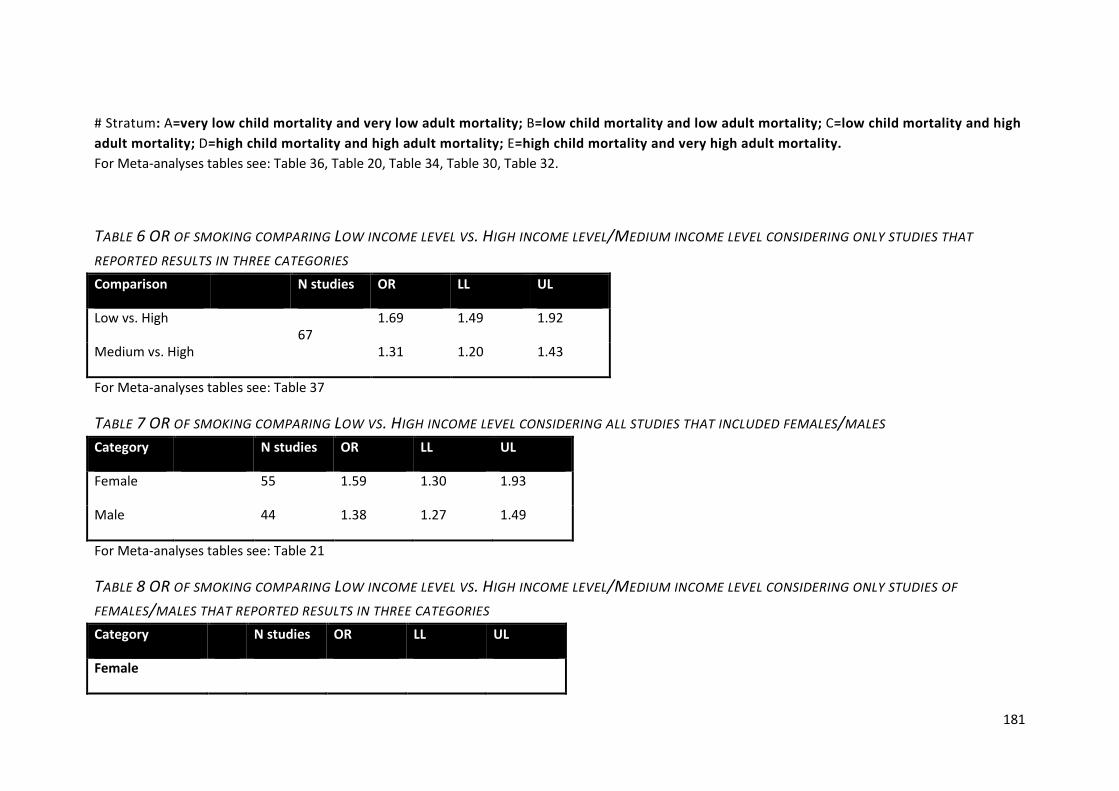
181
# Stratum: A=very low child mortality and very low adult mortality; B=low child mortality and low adult mortality; C=low child mortality and high adult mortality; D=high child mortality and high adult mortality; E=high child mortality and very high adult mortality. For Meta-analyses tables see: Table 36, Table 20, Table 34, Table 30, Table 32.
TABLE 6 OR OF SMOKING COMPARING LOW INCOME LEVEL VS. HIGH INCOME LEVEL/MEDIUM INCOME LEVEL CONSIDERING ONLY STUDIES THAT
REPORTED RESULTS IN THREE CATEGORIES Comparison N studies OR LL UL
Low vs. High 67
1.69 1.49 1.92
Medium vs. High 1.31 1.20 1.43
For Meta-analyses tables see: Table 37
TABLE 7 OR OF SMOKING COMPARING LOW VS. HIGH INCOME LEVEL CONSIDERING ALL STUDIES THAT INCLUDED FEMALES/MALES Category N studies OR LL UL
Female 55 1.59 1.30 1.93
Male 44 1.38 1.27 1.49
For Meta-analyses tables see: Table 21
TABLE 8 OR OF SMOKING COMPARING LOW INCOME LEVEL VS. HIGH INCOME LEVEL/MEDIUM INCOME LEVEL CONSIDERING ONLY STUDIES OF
FEMALES/MALES THAT REPORTED RESULTS IN THREE CATEGORIES Category N studies OR LL UL
Female
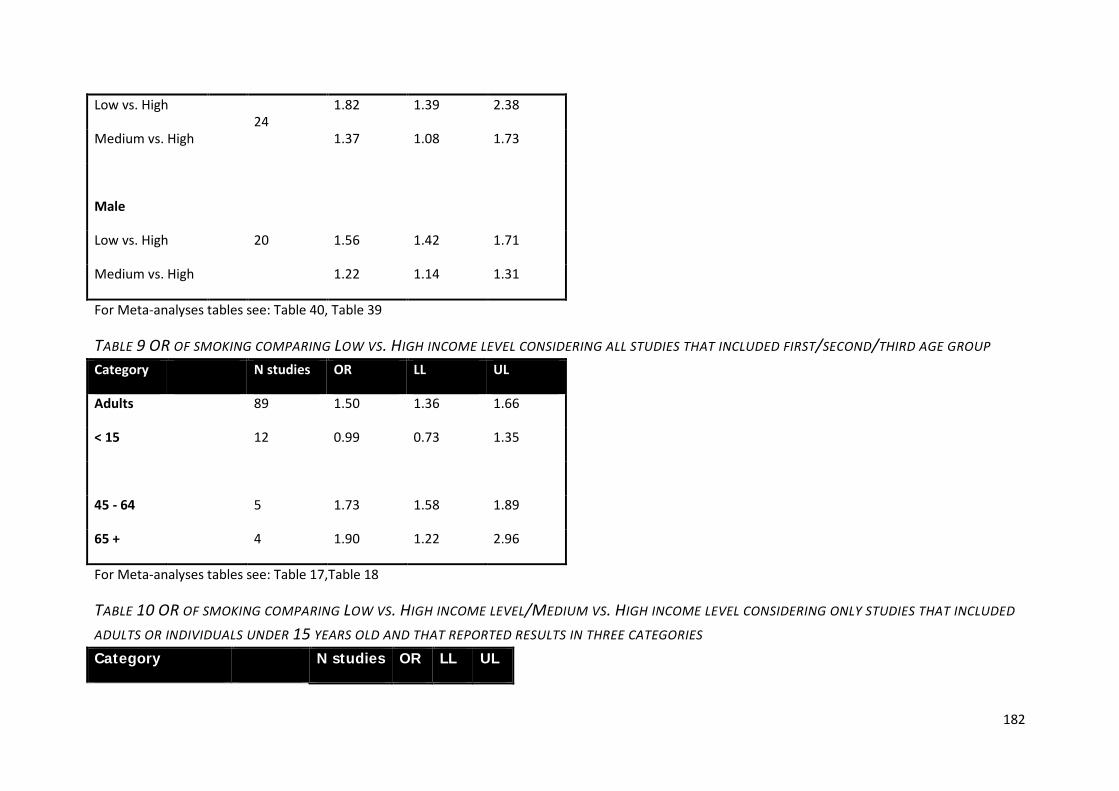
182
Low vs. High 24
1.82 1.39 2.38
Medium vs. High 1.37 1.08 1.73
Male
Low vs. High 20 1.56 1.42 1.71
Medium vs. High 1.22 1.14 1.31
For Meta-analyses tables see: Table 40, Table 39
TABLE 9 OR OF SMOKING COMPARING LOW VS. HIGH INCOME LEVEL CONSIDERING ALL STUDIES THAT INCLUDED FIRST/SECOND/THIRD AGE GROUP Category N studies OR LL UL
Adults 89 1.50 1.36 1.66
< 15 12 0.99 0.73 1.35
45 - 64 5 1.73 1.58 1.89
65 + 4 1.90 1.22 2.96
For Meta-analyses tables see: Table 17,Table 18
TABLE 10 OR OF SMOKING COMPARING LOW VS. HIGH INCOME LEVEL/MEDIUM VS. HIGH INCOME LEVEL CONSIDERING ONLY STUDIES THAT INCLUDED
ADULTS OR INDIVIDUALS UNDER 15 YEARS OLD AND THAT REPORTED RESULTS IN THREE CATEGORIES Category N studies OR LL UL
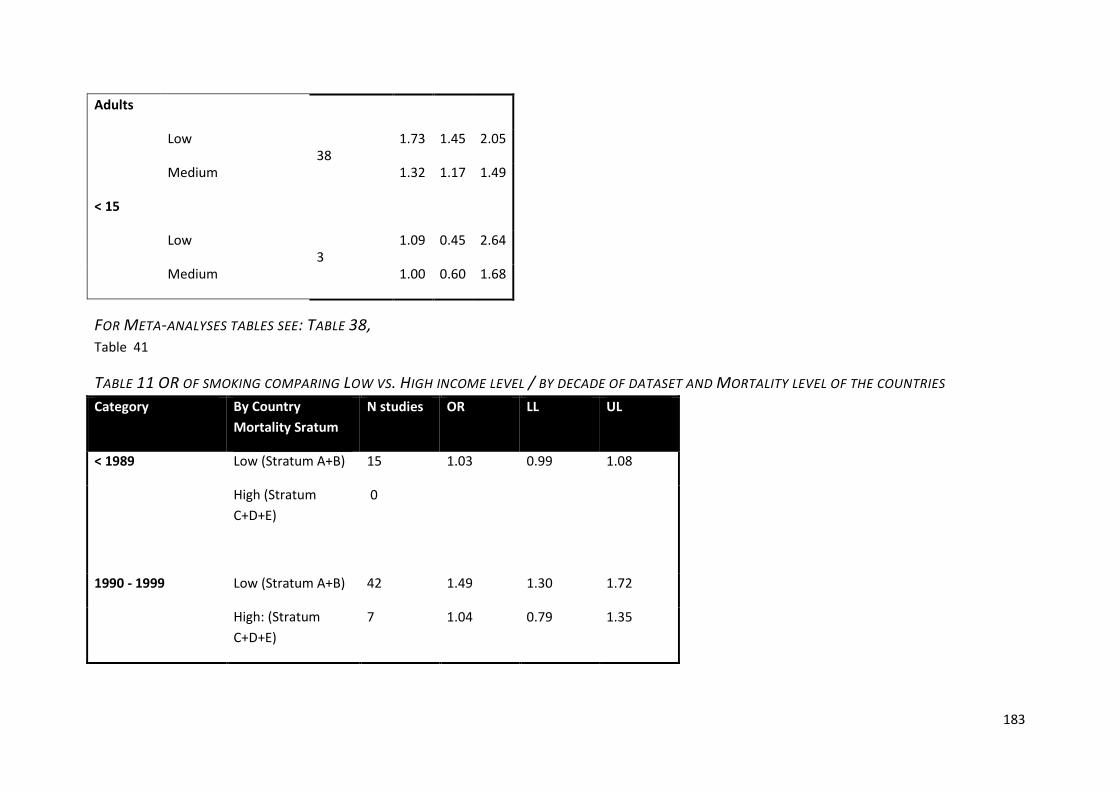
183
Adults
Low 38
1.73 1.45 2.05
Medium 1.32 1.17 1.49
< 15
Low 3
1.09 0.45 2.64
Medium 1.00 0.60 1.68
FOR META-ANALYSES TABLES SEE: TABLE 38, Table 41
TABLE 11 OR OF SMOKING COMPARING LOW VS. HIGH INCOME LEVEL / BY DECADE OF DATASET AND MORTALITY LEVEL OF THE COUNTRIES Category By Country
Mortality Sratum N studies OR LL UL
< 1989 Low (Stratum A+B) 15 1.03 0.99 1.08
High (Stratum C+D+E)
0
1990 - 1999 Low (Stratum A+B) 42 1.49 1.30 1.72
High: (Stratum C+D+E)
7 1.04 0.79 1.35
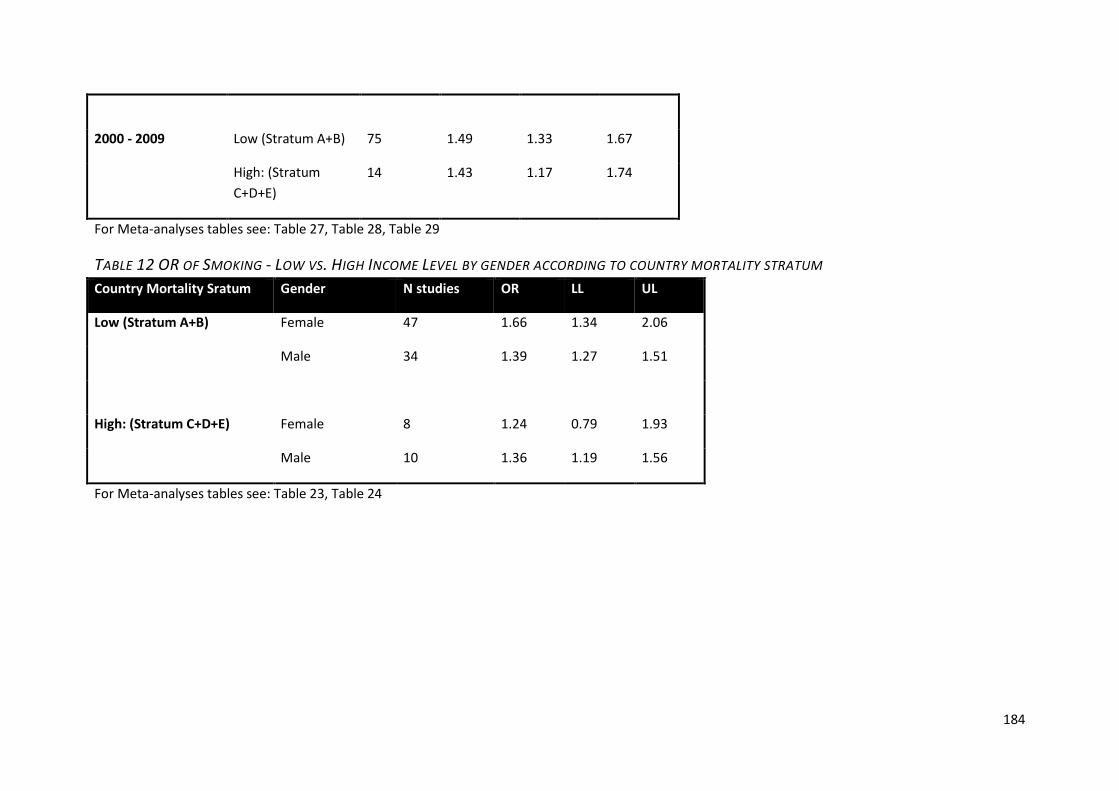
184
2000 - 2009 Low (Stratum A+B) 75 1.49 1.33 1.67
High: (Stratum C+D+E)
14 1.43 1.17 1.74
For Meta-analyses tables see: Table 27, Table 28, Table 29
TABLE 12 OR OF SMOKING - LOW VS. HIGH INCOME LEVEL BY GENDER ACCORDING TO COUNTRY MORTALITY STRATUM Country Mortality Sratum Gender N studies OR LL UL
Low (Stratum A+B) Female 47 1.66 1.34 2.06
Male 34 1.39 1.27 1.51
High: (Stratum C+D+E) Female 8 1.24 0.79 1.93
Male 10 1.36 1.19 1.56
For Meta-analyses tables see: Table 23, Table 24
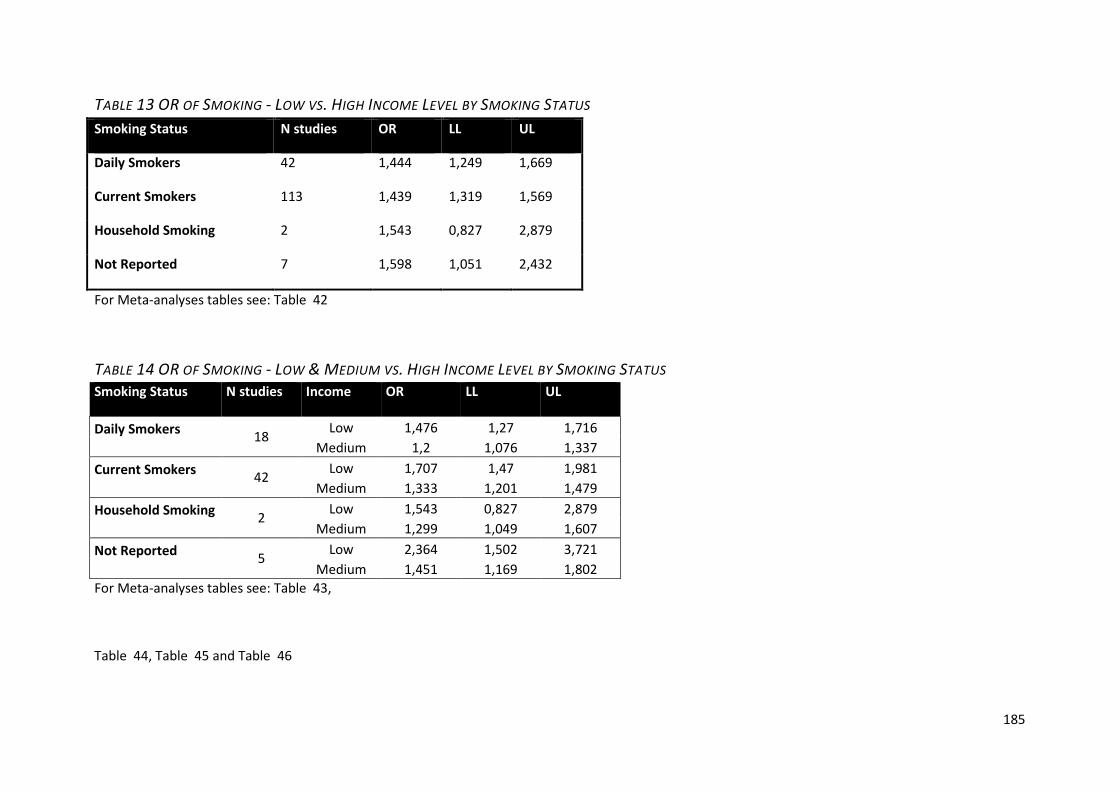
185
TABLE 13 OR OF SMOKING - LOW VS. HIGH INCOME LEVEL BY SMOKING STATUS Smoking Status N studies OR LL UL
Daily Smokers 42 1,444 1,249 1,669
Current Smokers 113 1,439 1,319 1,569
Household Smoking 2 1,543 0,827 2,879
Not Reported 7 1,598 1,051 2,432
For Meta-analyses tables see: Table 42
TABLE 14 OR OF SMOKING - LOW & MEDIUM VS. HIGH INCOME LEVEL BY SMOKING STATUS Smoking Status N studies Income OR LL UL
Daily Smokers 18 Low 1,476 1,27 1,716 Medium 1,2 1,076 1,337
Current Smokers 42 Low 1,707 1,47 1,981 Medium 1,333 1,201 1,479
Household Smoking 2 Low 1,543 0,827 2,879 Medium 1,299 1,049 1,607
Not Reported 5 Low 2,364 1,502 3,721 Medium 1,451 1,169 1,802
For Meta-analyses tables see: Table 43,
Table 44, Table 45 and Table 46
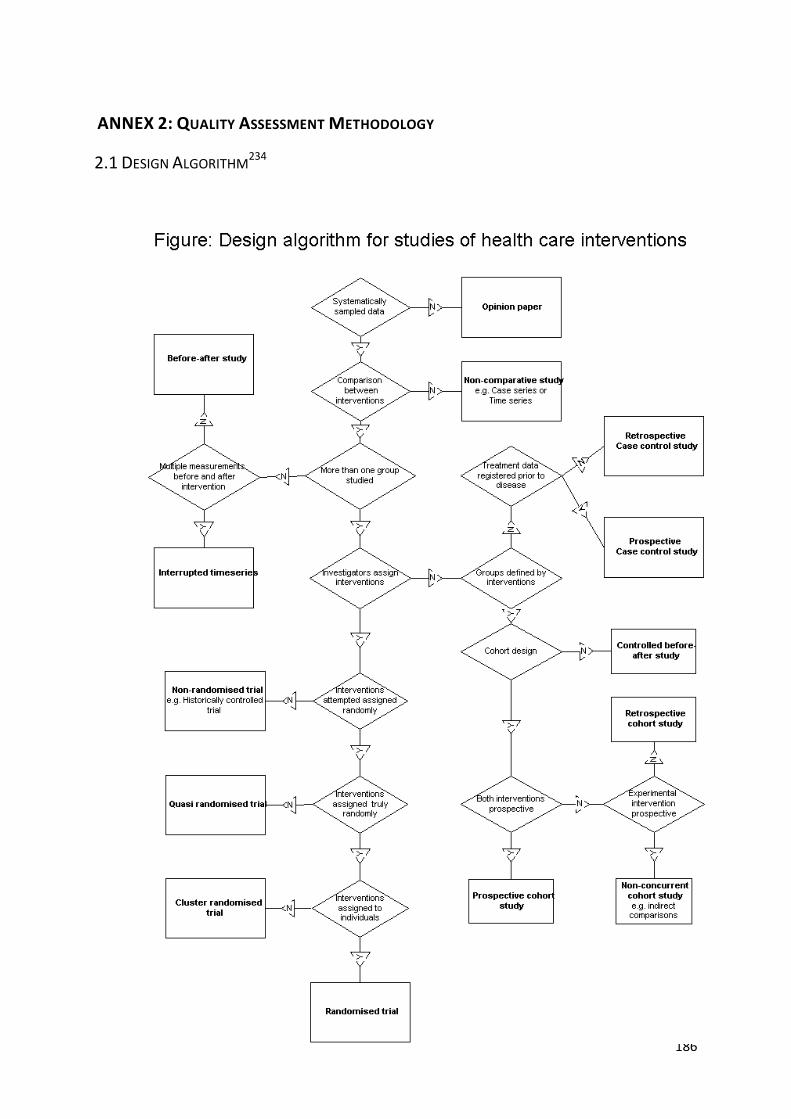
186
ANNEX 2: QUALITY ASSESSMENT METHODOLOGY
2.1 DESIGN ALGORITHM234
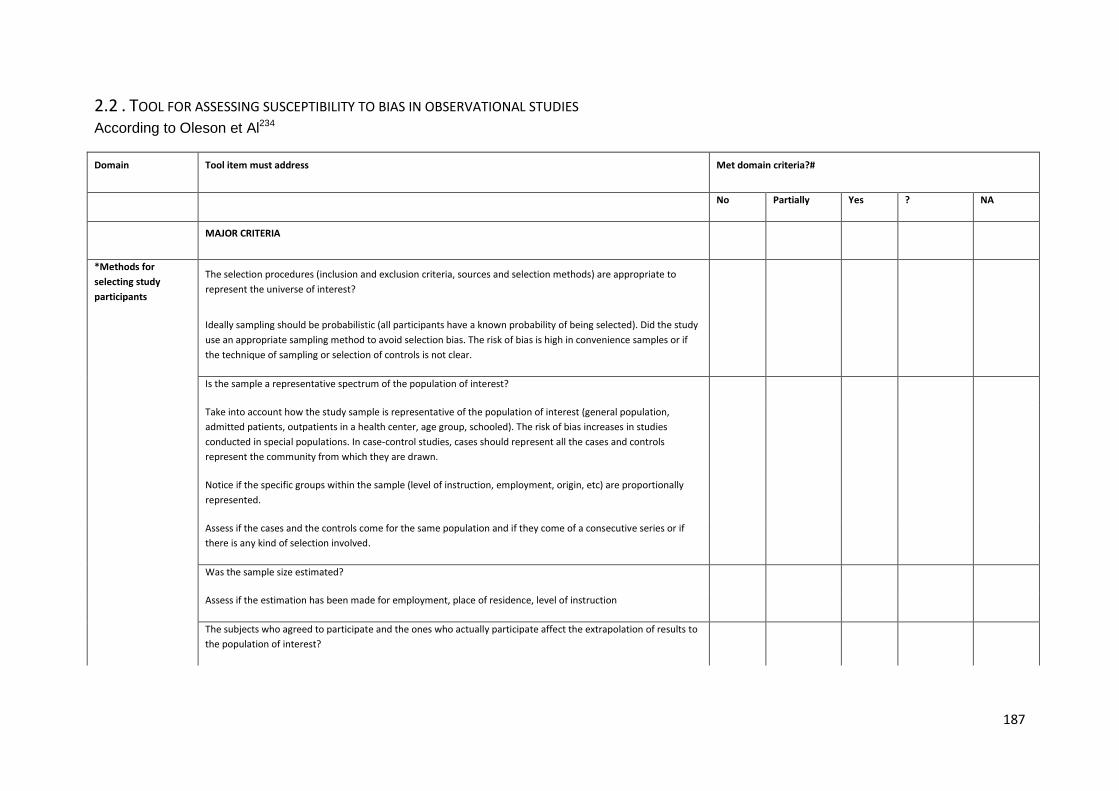
187
2.2 . TOOL FOR ASSESSING SUSCEPTIBILITY TO BIAS IN OBSERVATIONAL STUDIES According to Oleson et Al234
Domain Tool item must address Met domain criteria?#
No Partially Yes ? NA
MAJOR CRITERIA
*Methods for selecting study participants
The selection procedures (inclusion and exclusion criteria, sources and selection methods) are appropriate to represent the universe of interest?
Ideally sampling should be probabilistic (all participants have a known probability of being selected). Did the study use an appropriate sampling method to avoid selection bias. The risk of bias is high in convenience samples or if the technique of sampling or selection of controls is not clear.
Is the sample a representative spectrum of the population of interest?
Take into account how the study sample is representative of the population of interest (general population, admitted patients, outpatients in a health center, age group, schooled). The risk of bias increases in studies conducted in special populations. In case-control studies, cases should represent all the cases and controls represent the community from which they are drawn.
Notice if the specific groups within the sample (level of instruction, employment, origin, etc) are proportionally represented.
Assess if the cases and the controls come for the same population and if they come of a consecutive series or if there is any kind of selection involved.
Was the sample size estimated?
Assess if the estimation has been made for employment, place of residence, level of instruction
The subjects who agreed to participate and the ones who actually participate affect the extrapolation of results to the population of interest?
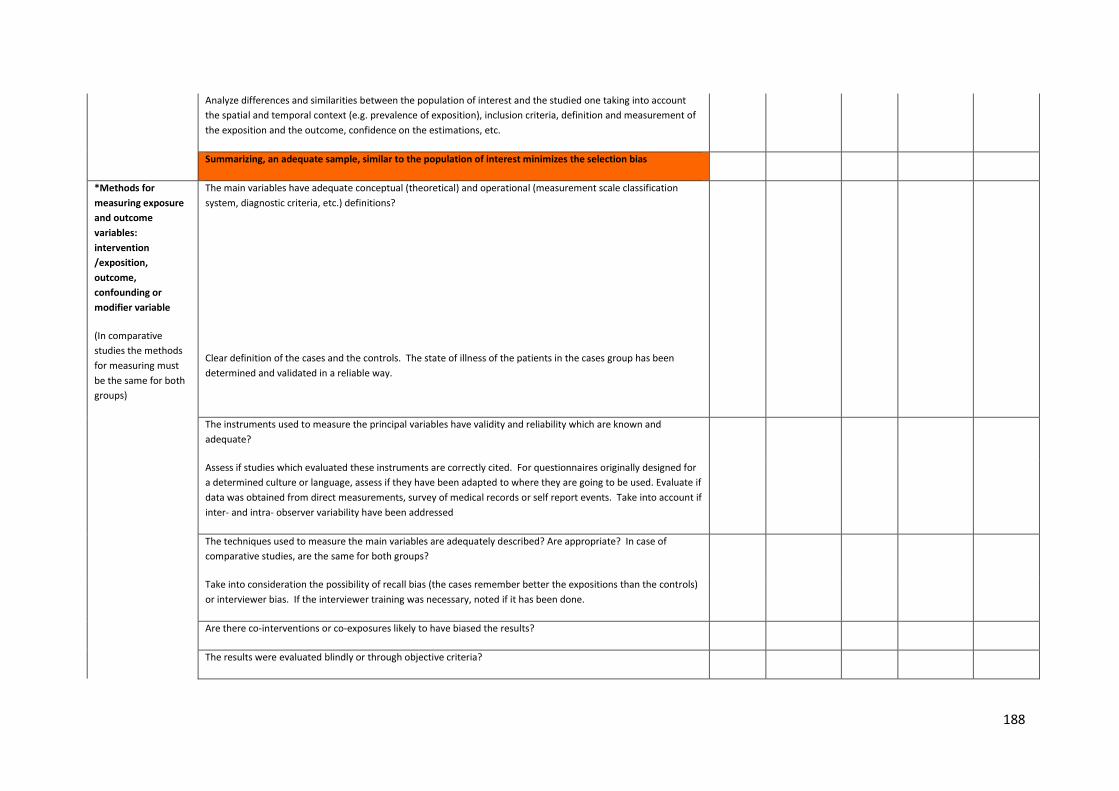
188
Analyze differences and similarities between the population of interest and the studied one taking into account the spatial and temporal context (e.g. prevalence of exposition), inclusion criteria, definition and measurement of the exposition and the outcome, confidence on the estimations, etc.
Summarizing, an adequate sample, similar to the population of interest minimizes the selection bias
*Methods for measuring exposure and outcome variables: intervention /exposition, outcome, confounding or modifier variable
The main variables have adequate conceptual (theoretical) and operational (measurement scale classification system, diagnostic criteria, etc.) definitions?
(In comparative studies the methods for measuring must be the same for both groups)
Clear definition of the cases and the controls. The state of illness of the patients in the cases group has been determined and validated in a reliable way.
The instruments used to measure the principal variables have validity and reliability which are known and adequate?
Assess if studies which evaluated these instruments are correctly cited. For questionnaires originally designed for a determined culture or language, assess if they have been adapted to where they are going to be used. Evaluate if data was obtained from direct measurements, survey of medical records or self report events. Take into account if inter- and intra- observer variability have been addressed
The techniques used to measure the main variables are adequately described? Are appropriate? In case of comparative studies, are the same for both groups?
Take into consideration the possibility of recall bias (the cases remember better the expositions than the controls) or interviewer bias. If the interviewer training was necessary, noted if it has been done.
Are there co-interventions or co-exposures likely to have biased the results?
The results were evaluated blindly or through objective criteria?
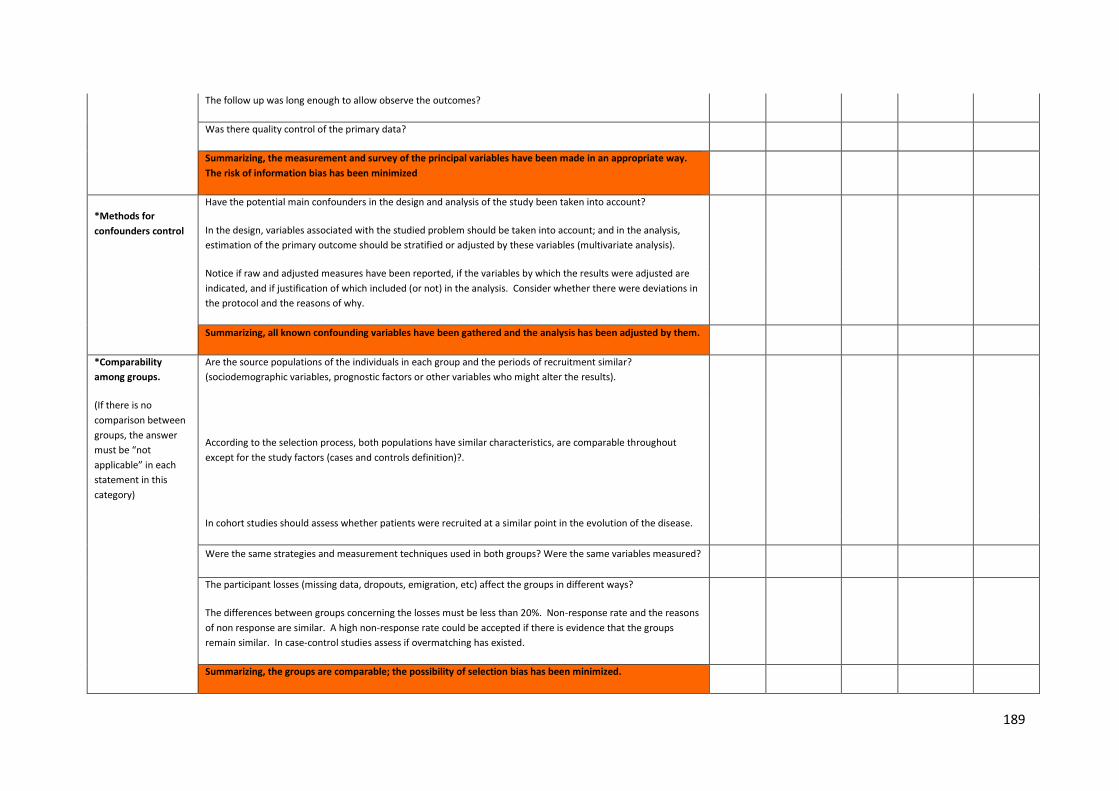
189
The follow up was long enough to allow observe the outcomes?
Was there quality control of the primary data?
Summarizing, the measurement and survey of the principal variables have been made in an appropriate way. The risk of information bias has been minimized
*Methods for confounders control
Have the potential main confounders in the design and analysis of the study been taken into account?
In the design, variables associated with the studied problem should be taken into account; and in the analysis, estimation of the primary outcome should be stratified or adjusted by these variables (multivariate analysis).
Notice if raw and adjusted measures have been reported, if the variables by which the results were adjusted are indicated, and if justification of which included (or not) in the analysis. Consider whether there were deviations in the protocol and the reasons of why.
Summarizing, all known confounding variables have been gathered and the analysis has been adjusted by them.
*Comparability among groups.
Are the source populations of the individuals in each group and the periods of recruitment similar? (sociodemographic variables, prognostic factors or other variables who might alter the results).
(If there is no comparison between groups, the answer must be “not applicable” in each statement in this category)
According to the selection process, both populations have similar characteristics, are comparable throughout except for the study factors (cases and controls definition)?.
In cohort studies should assess whether patients were recruited at a similar point in the evolution of the disease.
Were the same strategies and measurement techniques used in both groups? Were the same variables measured?
The participant losses (missing data, dropouts, emigration, etc) affect the groups in different ways?
The differences between groups concerning the losses must be less than 20%. Non-response rate and the reasons of non response are similar. A high non-response rate could be accepted if there is evidence that the groups remain similar. In case-control studies assess if overmatching has existed.
Summarizing, the groups are comparable; the possibility of selection bias has been minimized.
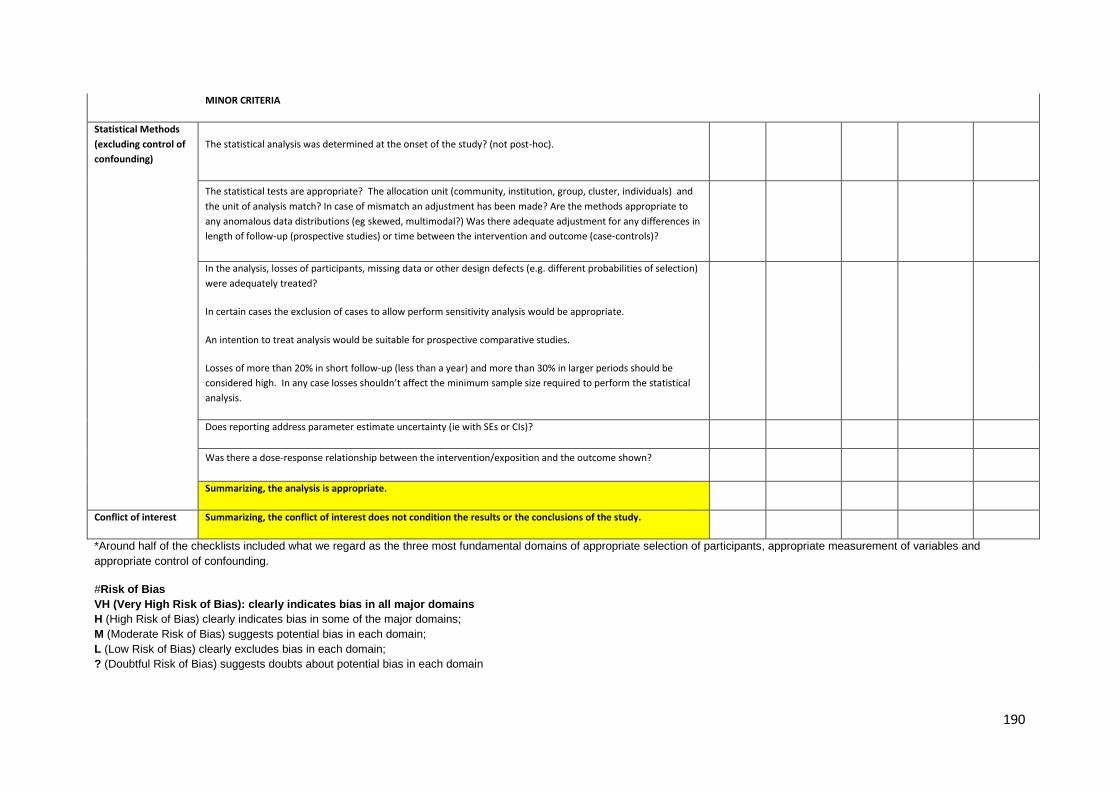
190
MINOR CRITERIA
Statistical Methods (excluding control of confounding)
The statistical analysis was determined at the onset of the study? (not post-hoc).
The statistical tests are appropriate? The allocation unit (community, institution, group, cluster, individuals) and the unit of analysis match? In case of mismatch an adjustment has been made? Are the methods appropriate to any anomalous data distributions (eg skewed, multimodal?) Was there adequate adjustment for any differences in length of follow-up (prospective studies) or time between the intervention and outcome (case-controls)?
In the analysis, losses of participants, missing data or other design defects (e.g. different probabilities of selection) were adequately treated?
In certain cases the exclusion of cases to allow perform sensitivity analysis would be appropriate.
An intention to treat analysis would be suitable for prospective comparative studies.
Losses of more than 20% in short follow-up (less than a year) and more than 30% in larger periods should be considered high. In any case losses shouldn’t affect the minimum sample size required to perform the statistical analysis.
Does reporting address parameter estimate uncertainty (ie with SEs or CIs)?
Was there a dose-response relationship between the intervention/exposition and the outcome shown?
Summarizing, the analysis is appropriate.
Conflict of interest Summarizing, the conflict of interest does not condition the results or the conclusions of the study.
*Around half of the checklists included what we regard as the three most fundamental domains of appropriate selection of participants, appropriate measurement of variables and appropriate control of confounding.
#Risk of Bias VH (Very High Risk of Bias): clearly indicates bias in all major domains H (High Risk of Bias) clearly indicates bias in some of the major domains; M (Moderate Risk of Bias) suggests potential bias in each domain; L (Low Risk of Bias) clearly excludes bias in each domain; ? (Doubtful Risk of Bias) suggests doubts about potential bias in each domain

191
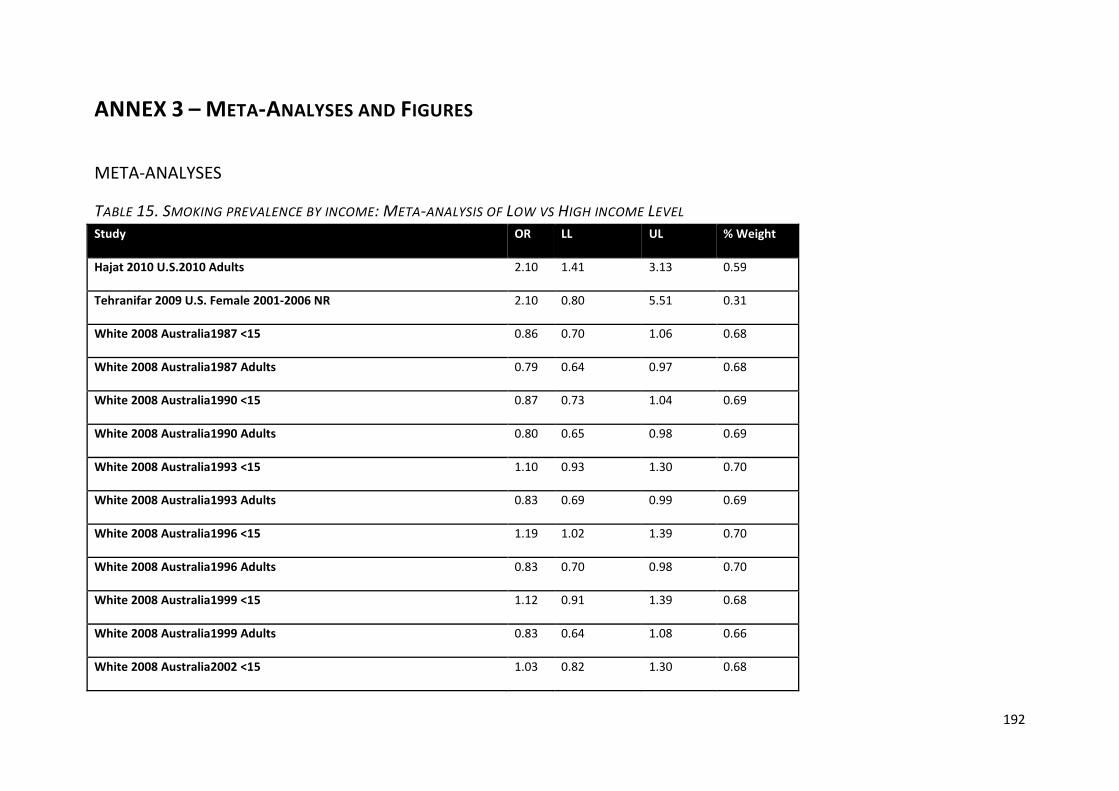
192
ANNEX 3 – META-ANALYSES AND FIGURES
META-ANALYSES
TABLE 15. SMOKING PREVALENCE BY INCOME: META-ANALYSIS OF LOW VS HIGH INCOME LEVEL Study OR LL UL % Weight
Hajat 2010 U.S.2010 Adults 2.10 1.41 3.13 0.59
Tehranifar 2009 U.S. Female 2001-2006 NR 2.10 0.80 5.51 0.31
White 2008 Australia1987 <15 0.86 0.70 1.06 0.68
White 2008 Australia1987 Adults 0.79 0.64 0.97 0.68
White 2008 Australia1990 <15 0.87 0.73 1.04 0.69
White 2008 Australia1990 Adults 0.80 0.65 0.98 0.69
White 2008 Australia1993 <15 1.10 0.93 1.30 0.70
White 2008 Australia1993 Adults 0.83 0.69 0.99 0.69
White 2008 Australia1996 <15 1.19 1.02 1.39 0.70
White 2008 Australia1996 Adults 0.83 0.70 0.98 0.70
White 2008 Australia1999 <15 1.12 0.91 1.39 0.68
White 2008 Australia1999 Adults 0.83 0.64 1.08 0.66
White 2008 Australia2002 <15 1.03 0.82 1.30 0.68
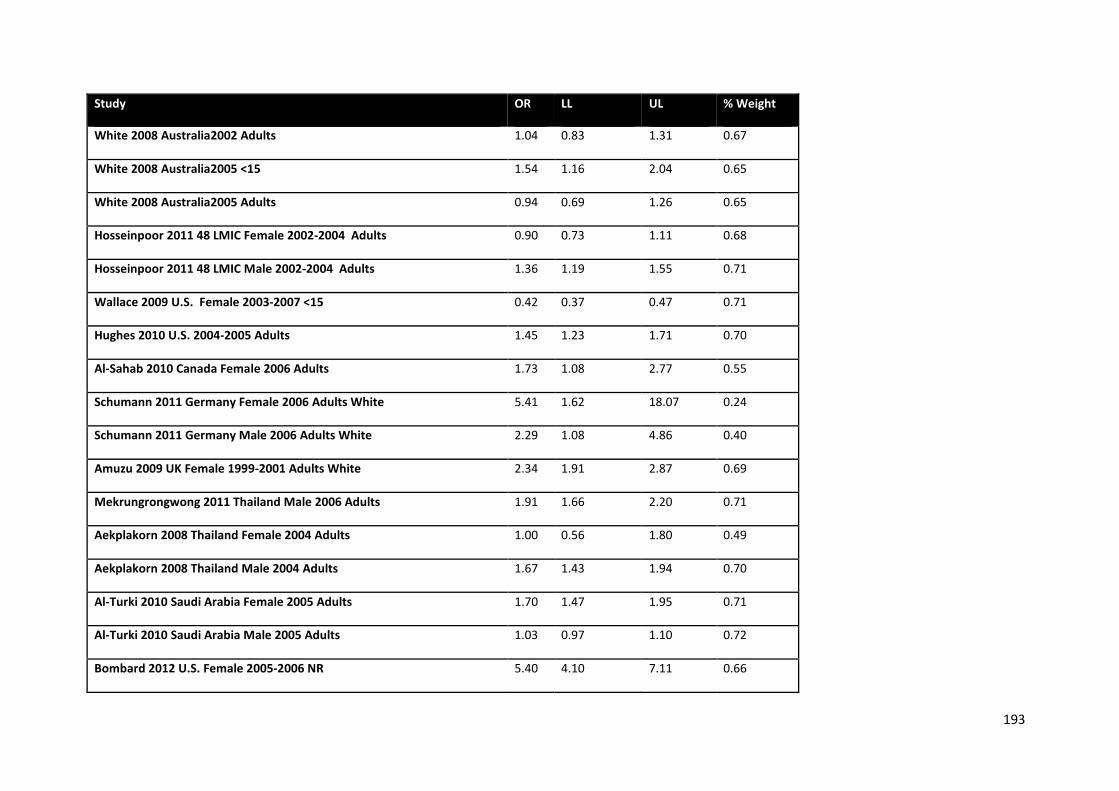
193
Study OR LL UL % Weight
White 2008 Australia2002 Adults 1.04 0.83 1.31 0.67
White 2008 Australia2005 <15 1.54 1.16 2.04 0.65
White 2008 Australia2005 Adults 0.94 0.69 1.26 0.65
Hosseinpoor 2011 48 LMIC Female 2002-2004 Adults 0.90 0.73 1.11 0.68
Hosseinpoor 2011 48 LMIC Male 2002-2004 Adults 1.36 1.19 1.55 0.71
Wallace 2009 U.S. Female 2003-2007 <15 0.42 0.37 0.47 0.71
Hughes 2010 U.S. 2004-2005 Adults 1.45 1.23 1.71 0.70
Al-Sahab 2010 Canada Female 2006 Adults 1.73 1.08 2.77 0.55
Schumann 2011 Germany Female 2006 Adults White 5.41 1.62 18.07 0.24
Schumann 2011 Germany Male 2006 Adults White 2.29 1.08 4.86 0.40
Amuzu 2009 UK Female 1999-2001 Adults White 2.34 1.91 2.87 0.69
Mekrungrongwong 2011 Thailand Male 2006 Adults 1.91 1.66 2.20 0.71
Aekplakorn 2008 Thailand Female 2004 Adults 1.00 0.56 1.80 0.49
Aekplakorn 2008 Thailand Male 2004 Adults 1.67 1.43 1.94 0.70
Al-Turki 2010 Saudi Arabia Female 2005 Adults 1.70 1.47 1.95 0.71
Al-Turki 2010 Saudi Arabia Male 2005 Adults 1.03 0.97 1.10 0.72
Bombard 2012 U.S. Female 2005-2006 NR 5.40 4.10 7.11 0.66
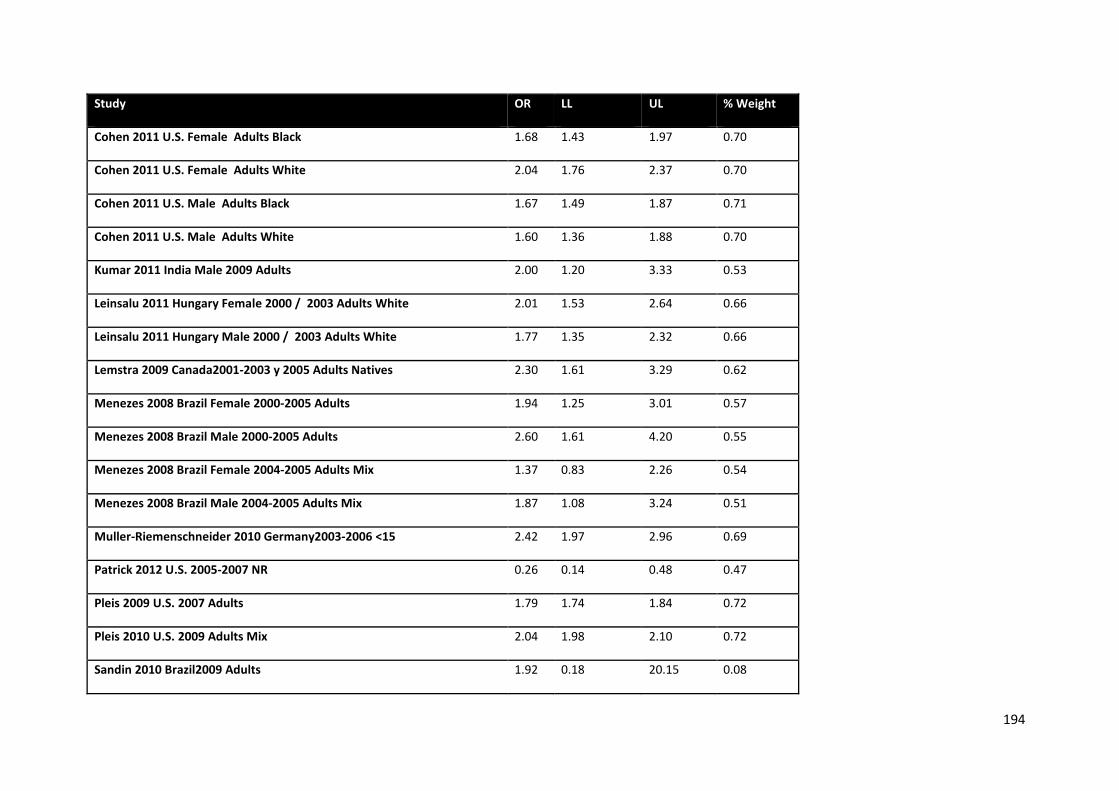
194
Study OR LL UL % Weight
Cohen 2011 U.S. Female Adults Black 1.68 1.43 1.97 0.70
Cohen 2011 U.S. Female Adults White 2.04 1.76 2.37 0.70
Cohen 2011 U.S. Male Adults Black 1.67 1.49 1.87 0.71
Cohen 2011 U.S. Male Adults White 1.60 1.36 1.88 0.70
Kumar 2011 India Male 2009 Adults 2.00 1.20 3.33 0.53
Leinsalu 2011 Hungary Female 2000 / 2003 Adults White 2.01 1.53 2.64 0.66
Leinsalu 2011 Hungary Male 2000 / 2003 Adults White 1.77 1.35 2.32 0.66
Lemstra 2009 Canada2001-2003 y 2005 Adults Natives 2.30 1.61 3.29 0.62
Menezes 2008 Brazil Female 2000-2005 Adults 1.94 1.25 3.01 0.57
Menezes 2008 Brazil Male 2000-2005 Adults 2.60 1.61 4.20 0.55
Menezes 2008 Brazil Female 2004-2005 Adults Mix 1.37 0.83 2.26 0.54
Menezes 2008 Brazil Male 2004-2005 Adults Mix 1.87 1.08 3.24 0.51
Muller-Riemenschneider 2010 Germany2003-2006 <15 2.42 1.97 2.96 0.69
Patrick 2012 U.S. 2005-2007 NR 0.26 0.14 0.48 0.47
Pleis 2009 U.S. 2007 Adults 1.79 1.74 1.84 0.72
Pleis 2010 U.S. 2009 Adults Mix 2.04 1.98 2.10 0.72
Sandin 2010 Brazil2009 Adults 1.92 0.18 20.15 0.08
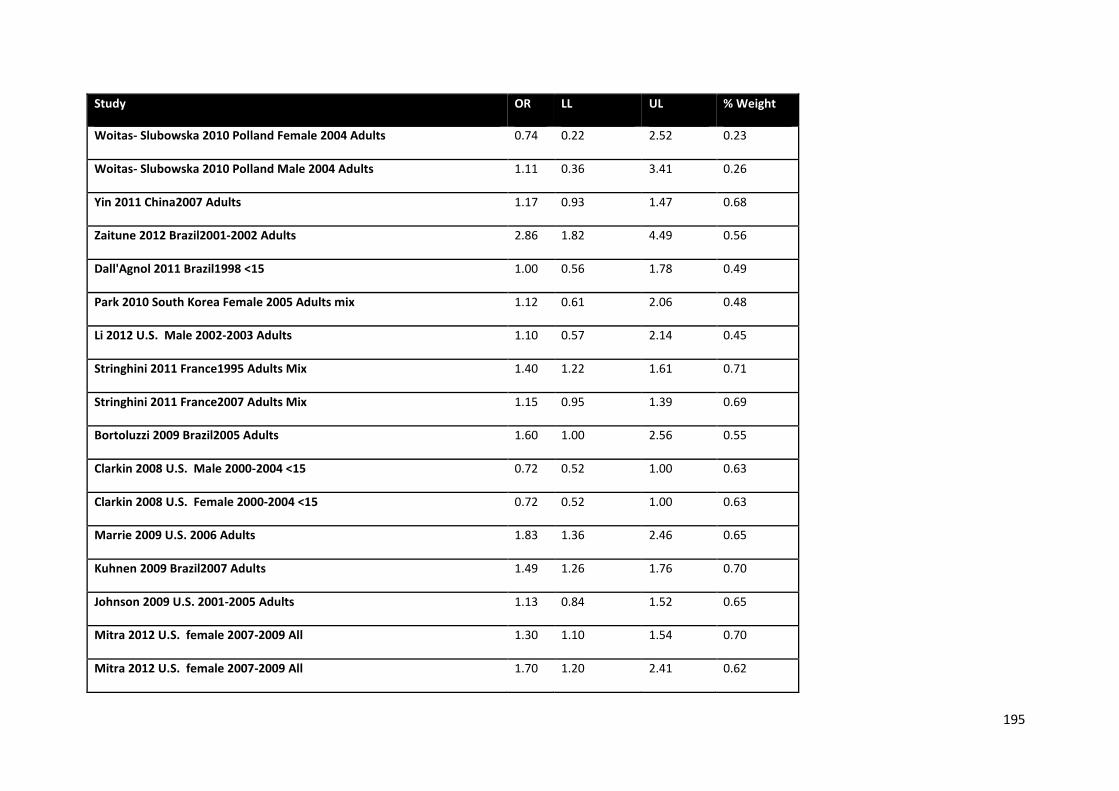
195
Study OR LL UL % Weight
Woitas- Slubowska 2010 Polland Female 2004 Adults 0.74 0.22 2.52 0.23
Woitas- Slubowska 2010 Polland Male 2004 Adults 1.11 0.36 3.41 0.26
Yin 2011 China2007 Adults 1.17 0.93 1.47 0.68
Zaitune 2012 Brazil2001-2002 Adults 2.86 1.82 4.49 0.56
Dall'Agnol 2011 Brazil1998 <15 1.00 0.56 1.78 0.49
Park 2010 South Korea Female 2005 Adults mix 1.12 0.61 2.06 0.48
Li 2012 U.S. Male 2002-2003 Adults 1.10 0.57 2.14 0.45
Stringhini 2011 France1995 Adults Mix 1.40 1.22 1.61 0.71
Stringhini 2011 France2007 Adults Mix 1.15 0.95 1.39 0.69
Bortoluzzi 2009 Brazil2005 Adults 1.60 1.00 2.56 0.55
Clarkin 2008 U.S. Male 2000-2004 <15 0.72 0.52 1.00 0.63
Clarkin 2008 U.S. Female 2000-2004 <15 0.72 0.52 1.00 0.63
Marrie 2009 U.S. 2006 Adults 1.83 1.36 2.46 0.65
Kuhnen 2009 Brazil2007 Adults 1.49 1.26 1.76 0.70
Johnson 2009 U.S. 2001-2005 Adults 1.13 0.84 1.52 0.65
Mitra 2012 U.S. female 2007-2009 All 1.30 1.10 1.54 0.70
Mitra 2012 U.S. female 2007-2009 All 1.70 1.20 2.41 0.62
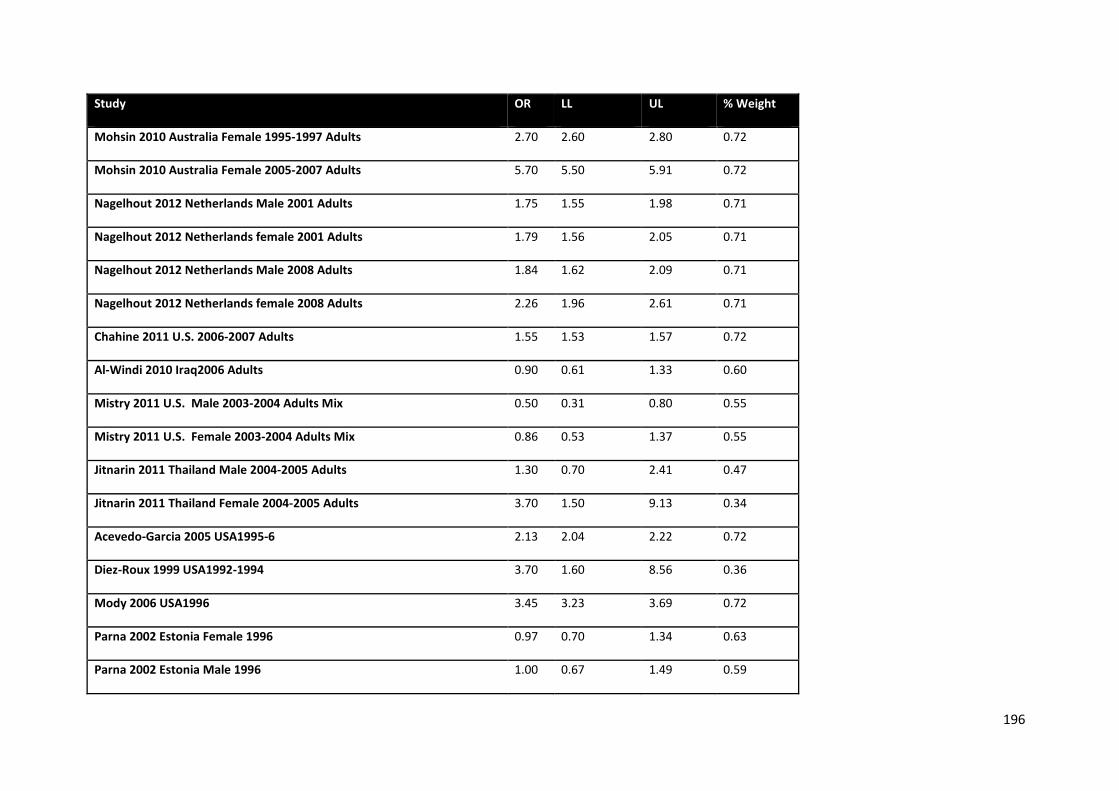
196
Study OR LL UL % Weight
Mohsin 2010 Australia Female 1995-1997 Adults 2.70 2.60 2.80 0.72
Mohsin 2010 Australia Female 2005-2007 Adults 5.70 5.50 5.91 0.72
Nagelhout 2012 Netherlands Male 2001 Adults 1.75 1.55 1.98 0.71
Nagelhout 2012 Netherlands female 2001 Adults 1.79 1.56 2.05 0.71
Nagelhout 2012 Netherlands Male 2008 Adults 1.84 1.62 2.09 0.71
Nagelhout 2012 Netherlands female 2008 Adults 2.26 1.96 2.61 0.71
Chahine 2011 U.S. 2006-2007 Adults 1.55 1.53 1.57 0.72
Al-Windi 2010 Iraq2006 Adults 0.90 0.61 1.33 0.60
Mistry 2011 U.S. Male 2003-2004 Adults Mix 0.50 0.31 0.80 0.55
Mistry 2011 U.S. Female 2003-2004 Adults Mix 0.86 0.53 1.37 0.55
Jitnarin 2011 Thailand Male 2004-2005 Adults 1.30 0.70 2.41 0.47
Jitnarin 2011 Thailand Female 2004-2005 Adults 3.70 1.50 9.13 0.34
Acevedo-Garcia 2005 USA1995-6 2.13 2.04 2.22 0.72
Diez-Roux 1999 USA1992-1994 3.70 1.60 8.56 0.36
Mody 2006 USA1996 3.45 3.23 3.69 0.72
Parna 2002 Estonia Female 1996 0.97 0.70 1.34 0.63
Parna 2002 Estonia Male 1996 1.00 0.67 1.49 0.59
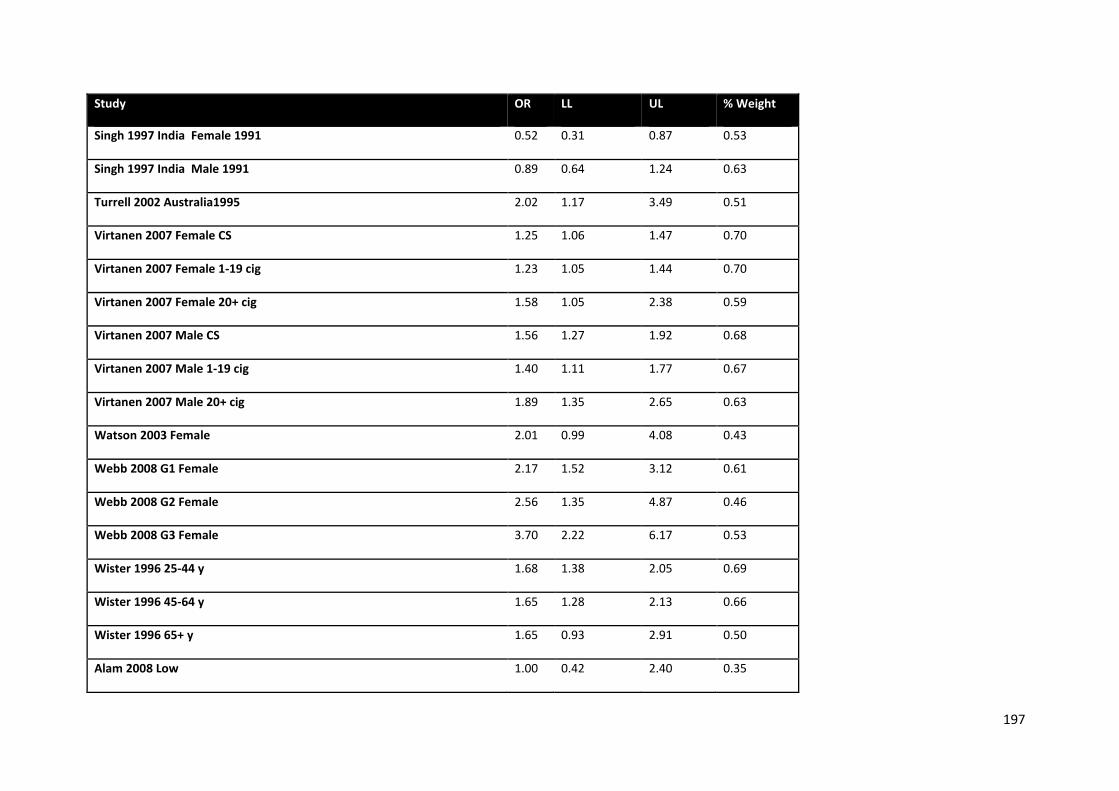
197
Study OR LL UL % Weight
Singh 1997 India Female 1991 0.52 0.31 0.87 0.53
Singh 1997 India Male 1991 0.89 0.64 1.24 0.63
Turrell 2002 Australia1995 2.02 1.17 3.49 0.51
Virtanen 2007 Female CS 1.25 1.06 1.47 0.70
Virtanen 2007 Female 1-19 cig 1.23 1.05 1.44 0.70
Virtanen 2007 Female 20+ cig 1.58 1.05 2.38 0.59
Virtanen 2007 Male CS 1.56 1.27 1.92 0.68
Virtanen 2007 Male 1-19 cig 1.40 1.11 1.77 0.67
Virtanen 2007 Male 20+ cig 1.89 1.35 2.65 0.63
Watson 2003 Female 2.01 0.99 4.08 0.43
Webb 2008 G1 Female 2.17 1.52 3.12 0.61
Webb 2008 G2 Female 2.56 1.35 4.87 0.46
Webb 2008 G3 Female 3.70 2.22 6.17 0.53
Wister 1996 25-44 y 1.68 1.38 2.05 0.69
Wister 1996 45-64 y 1.65 1.28 2.13 0.66
Wister 1996 65+ y 1.65 0.93 2.91 0.50
Alam 2008 Low 1.00 0.42 2.40 0.35

198
Study OR LL UL % Weight
Anaya Ocampo 2006 Male 2.86 1.33 6.12 0.40
Anaya Ocampo 2006 Female 0.74 0.26 2.15 0.28
Coreil 1991 20-39 Female 1.02 1.00 1.05 0.72
Coreil 1991 20-39 Male 1.05 1.02 1.07 0.72
Coreil 1991 40-64 Female 1.01 0.98 1.03 0.72
Coreil 1991 40-64 Male 1.01 0.98 1.05 0.72
Coreil 1991 65-74 Female 1.01 0.94 1.10 0.72
Coreil 1991 65-74 Male 1.01 0.89 1.15 0.71
King 1999 Low 1.64 1.30 2.07 0.67
Laaksonen 2003 Male 1.36 1.14 1.62 0.69
Laaksonen 2003 Female 1.30 1.07 1.58 0.69
Laaksonen 2005 Male 2.04 1.39 2.99 0.60
Laaksonen 2005 Female 1.58 1.28 1.95 0.68
Lawrence 2007 Low 1.47 1.33 1.63 0.72
Shapo 2003 Male 1.43 0.73 2.82 0.44
Shapo 2003 Female 1.25 0.50 3.13 0.33
Shavers 2005 African Americans 1.54 1.28 1.85 0.69
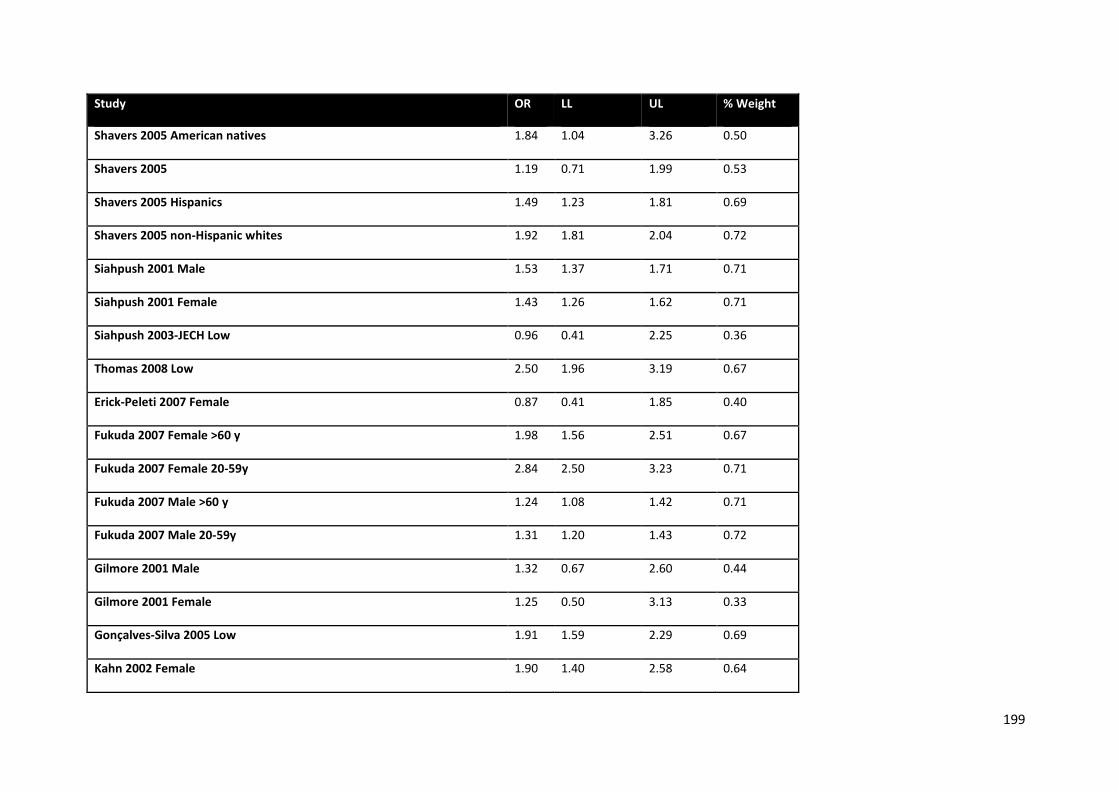
199
Study OR LL UL % Weight
Shavers 2005 American natives 1.84 1.04 3.26 0.50
Shavers 2005 1.19 0.71 1.99 0.53
Shavers 2005 Hispanics 1.49 1.23 1.81 0.69
Shavers 2005 non-Hispanic whites 1.92 1.81 2.04 0.72
Siahpush 2001 Male 1.53 1.37 1.71 0.71
Siahpush 2001 Female 1.43 1.26 1.62 0.71
Siahpush 2003-JECH Low 0.96 0.41 2.25 0.36
Thomas 2008 Low 2.50 1.96 3.19 0.67
Erick-Peleti 2007 Female 0.87 0.41 1.85 0.40
Fukuda 2007 Female >60 y 1.98 1.56 2.51 0.67
Fukuda 2007 Female 20-59y 2.84 2.50 3.23 0.71
Fukuda 2007 Male >60 y 1.24 1.08 1.42 0.71
Fukuda 2007 Male 20-59y 1.31 1.20 1.43 0.72
Gilmore 2001 Male 1.32 0.67 2.60 0.44
Gilmore 2001 Female 1.25 0.50 3.13 0.33
Gonçalves-Silva 2005 Low 1.91 1.59 2.29 0.69
Kahn 2002 Female 1.90 1.40 2.58 0.64

200
Study OR LL UL % Weight
Kahn 2005 Female 2.80 1.70 4.61 0.54
Kaleta 2007 Low 0.86 0.72 1.02 0.70
Khuwaja 2004 Male 0.91 0.59 1.41 0.57
Kiefe 2001 Male 2.96 1.41 6.21 0.41
Kiefe 2001 Female 0.93 0.43 2.01 0.39
Reijneveld 2002 1.36 1.26 1.47 0.72
Ross 2000 1.21 0.95 1.53 0.67
Samet 1992 Female 4.17 1.67 10.42 0.33
Samet 1992 Male 2.70 1.35 5.41 0.43
Schaap 2008 0.95 0.91 0.99 0.72
Mostashari 2005 1.30 1.10 1.54 0.70
Rahman 2005 Male 1.22 0.75 1.99 0.54
Kim 2006-JPMPH Male 1.34 1.18 1.52 0.71
Kim 2006-JPMPH Female 3.81 2.90 5.01 0.66
Fagan 2008-NTR 2.13 1.85 2.45 0.71
Fukuda 2005 Male 1.29 1.17 1.42 0.72
Fukuda 2005 Female 2.03 1.76 2.34 0.70

201
Study OR LL UL % Weight
Metcalf 2007 1.82 1.38 2.40 0.65
Metcalf 2008 1.94 1.38 2.73 0.62
Mfenyana 2006 1.28 1.00 1.64 0.67
Marinho 2008 1.52 1.26 1.83 0.69
Hesketh2007 Male 0.83 0.77 0.90 0.72
Pudaric 2000 Male 1.50 1.02 2.21 0.60
Pudaric 2000 Female 1.02 0.72 1.45 0.62
Pudule 1999 Female 0.95 0.66 1.38 0.61
Pudule 1999 Male 1.82 1.41 2.35 0.66
Pomerleau 2004 Female 1.18 0.82 1.69 0.61
Pomerleau 2004 Male 1.43 1.12 1.82 0.67
Pomerleau 1997 1.84 1.57 2.16 0.70
Moreira 1995 1.03 0.84 1.27 0.68
Silvestre Garcia 1990 Low 0.67 0.40 1.12 0.53
Green 2007 18-34 y 1.77 1.64 1.91 0.72
D+L pooled ES 1.45 1.35 1.56 100.00
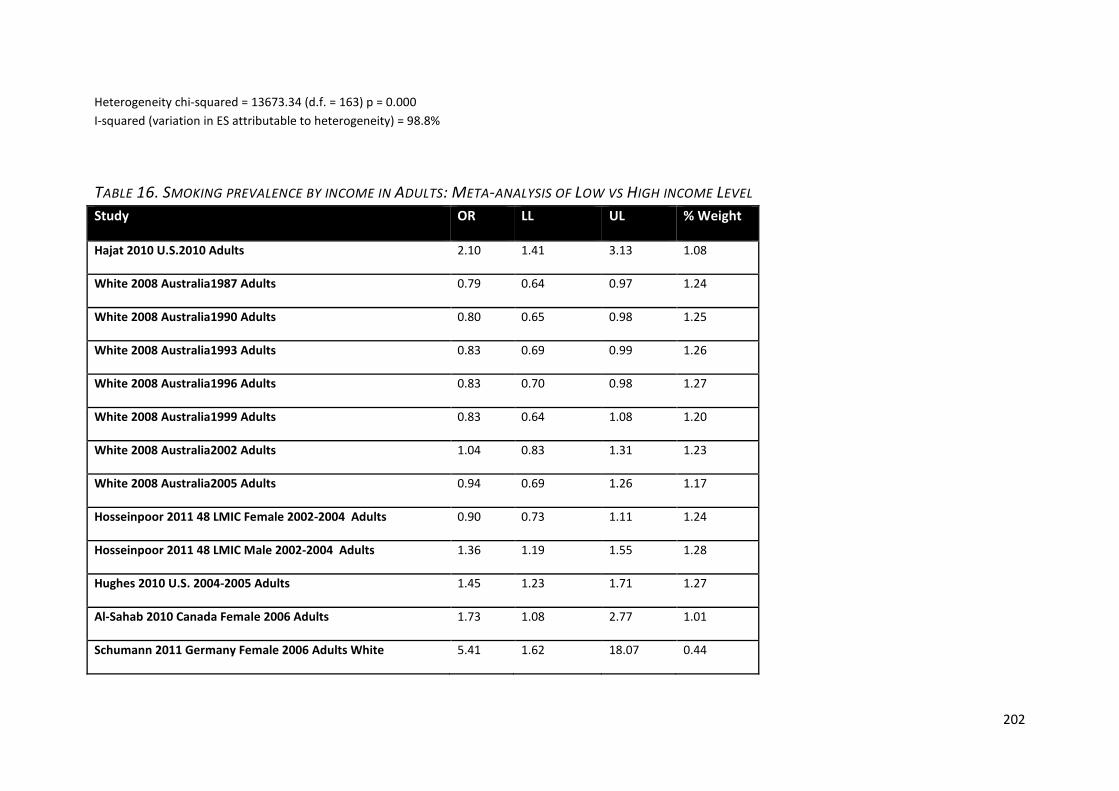
202
Heterogeneity chi-squared = 13673.34 (d.f. = 163) p = 0.000 I-squared (variation in ES attributable to heterogeneity) = 98.8%
TABLE 16. SMOKING PREVALENCE BY INCOME IN ADULTS: META-ANALYSIS OF LOW VS HIGH INCOME LEVEL Study OR LL UL % Weight
Hajat 2010 U.S.2010 Adults 2.10 1.41 3.13 1.08
White 2008 Australia1987 Adults 0.79 0.64 0.97 1.24
White 2008 Australia1990 Adults 0.80 0.65 0.98 1.25
White 2008 Australia1993 Adults 0.83 0.69 0.99 1.26
White 2008 Australia1996 Adults 0.83 0.70 0.98 1.27
White 2008 Australia1999 Adults 0.83 0.64 1.08 1.20
White 2008 Australia2002 Adults 1.04 0.83 1.31 1.23
White 2008 Australia2005 Adults 0.94 0.69 1.26 1.17
Hosseinpoor 2011 48 LMIC Female 2002-2004 Adults 0.90 0.73 1.11 1.24
Hosseinpoor 2011 48 LMIC Male 2002-2004 Adults 1.36 1.19 1.55 1.28
Hughes 2010 U.S. 2004-2005 Adults 1.45 1.23 1.71 1.27
Al-Sahab 2010 Canada Female 2006 Adults 1.73 1.08 2.77 1.01
Schumann 2011 Germany Female 2006 Adults White 5.41 1.62 18.07 0.44
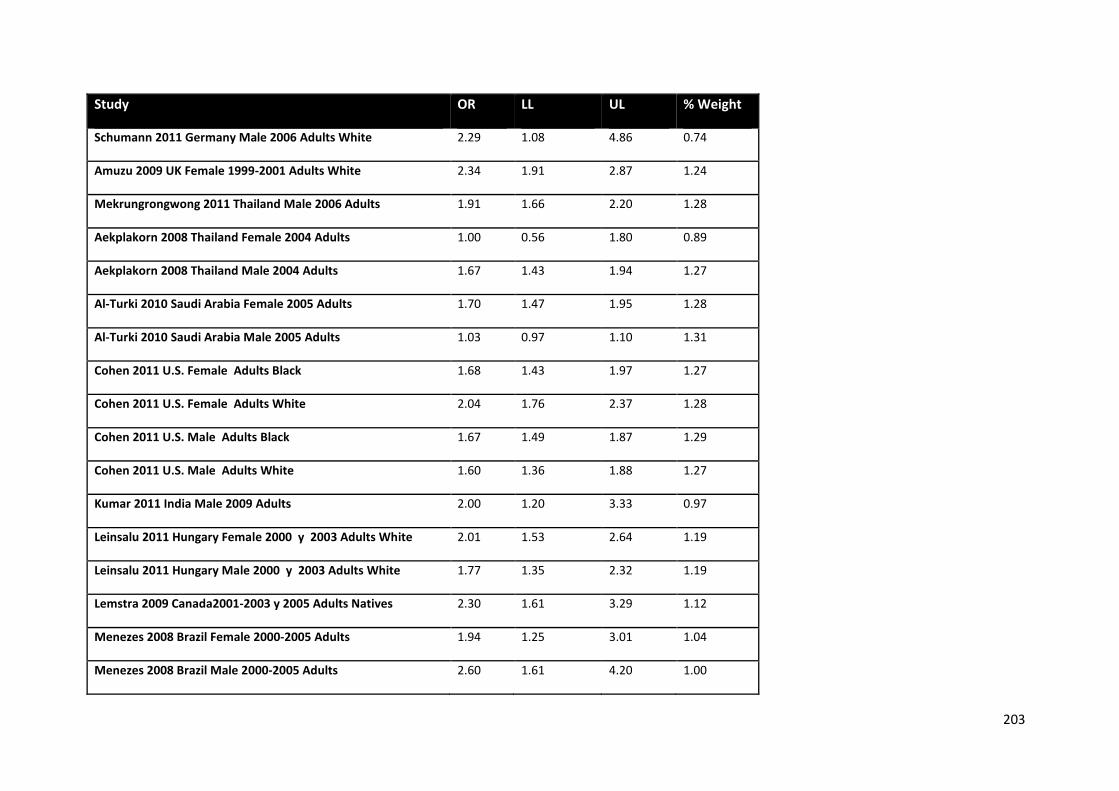
203
Study OR LL UL % Weight
Schumann 2011 Germany Male 2006 Adults White 2.29 1.08 4.86 0.74
Amuzu 2009 UK Female 1999-2001 Adults White 2.34 1.91 2.87 1.24
Mekrungrongwong 2011 Thailand Male 2006 Adults 1.91 1.66 2.20 1.28
Aekplakorn 2008 Thailand Female 2004 Adults 1.00 0.56 1.80 0.89
Aekplakorn 2008 Thailand Male 2004 Adults 1.67 1.43 1.94 1.27
Al-Turki 2010 Saudi Arabia Female 2005 Adults 1.70 1.47 1.95 1.28
Al-Turki 2010 Saudi Arabia Male 2005 Adults 1.03 0.97 1.10 1.31
Cohen 2011 U.S. Female Adults Black 1.68 1.43 1.97 1.27
Cohen 2011 U.S. Female Adults White 2.04 1.76 2.37 1.28
Cohen 2011 U.S. Male Adults Black 1.67 1.49 1.87 1.29
Cohen 2011 U.S. Male Adults White 1.60 1.36 1.88 1.27
Kumar 2011 India Male 2009 Adults 2.00 1.20 3.33 0.97
Leinsalu 2011 Hungary Female 2000 y 2003 Adults White 2.01 1.53 2.64 1.19
Leinsalu 2011 Hungary Male 2000 y 2003 Adults White 1.77 1.35 2.32 1.19
Lemstra 2009 Canada2001-2003 y 2005 Adults Natives 2.30 1.61 3.29 1.12
Menezes 2008 Brazil Female 2000-2005 Adults 1.94 1.25 3.01 1.04
Menezes 2008 Brazil Male 2000-2005 Adults 2.60 1.61 4.20 1.00
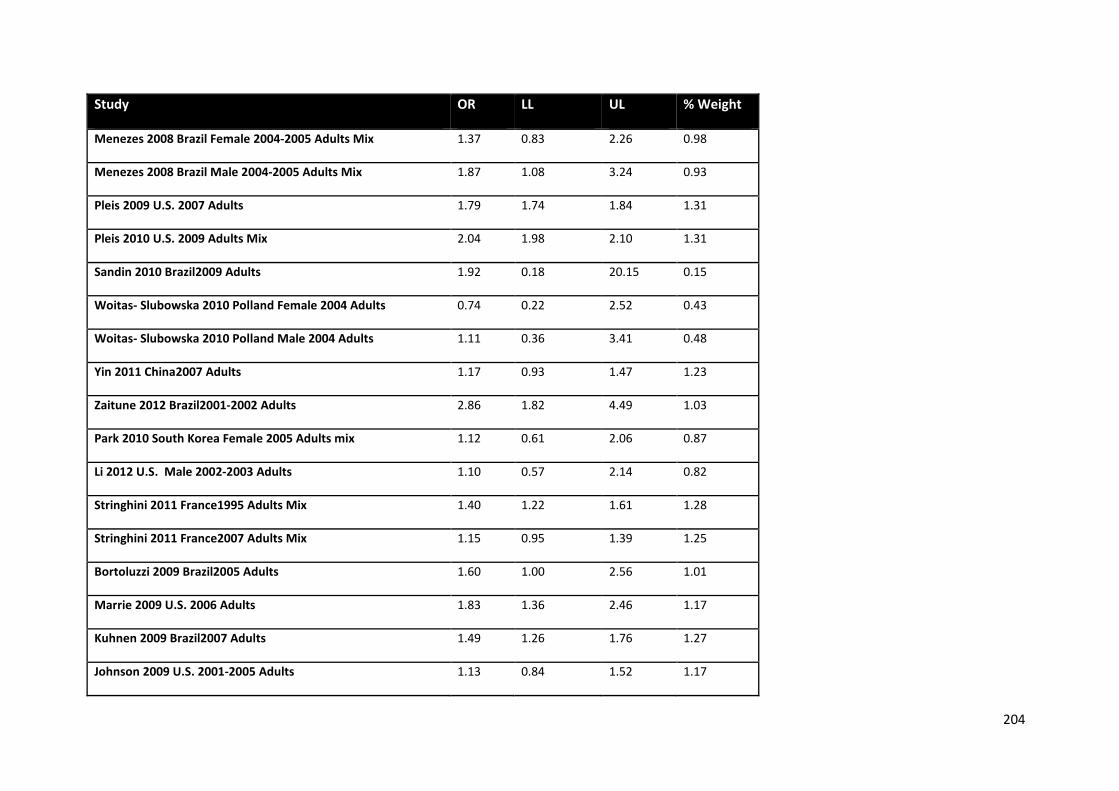
204
Study OR LL UL % Weight
Menezes 2008 Brazil Female 2004-2005 Adults Mix 1.37 0.83 2.26 0.98
Menezes 2008 Brazil Male 2004-2005 Adults Mix 1.87 1.08 3.24 0.93
Pleis 2009 U.S. 2007 Adults 1.79 1.74 1.84 1.31
Pleis 2010 U.S. 2009 Adults Mix 2.04 1.98 2.10 1.31
Sandin 2010 Brazil2009 Adults 1.92 0.18 20.15 0.15
Woitas- Slubowska 2010 Polland Female 2004 Adults 0.74 0.22 2.52 0.43
Woitas- Slubowska 2010 Polland Male 2004 Adults 1.11 0.36 3.41 0.48
Yin 2011 China2007 Adults 1.17 0.93 1.47 1.23
Zaitune 2012 Brazil2001-2002 Adults 2.86 1.82 4.49 1.03
Park 2010 South Korea Female 2005 Adults mix 1.12 0.61 2.06 0.87
Li 2012 U.S. Male 2002-2003 Adults 1.10 0.57 2.14 0.82
Stringhini 2011 France1995 Adults Mix 1.40 1.22 1.61 1.28
Stringhini 2011 France2007 Adults Mix 1.15 0.95 1.39 1.25
Bortoluzzi 2009 Brazil2005 Adults 1.60 1.00 2.56 1.01
Marrie 2009 U.S. 2006 Adults 1.83 1.36 2.46 1.17
Kuhnen 2009 Brazil2007 Adults 1.49 1.26 1.76 1.27
Johnson 2009 U.S. 2001-2005 Adults 1.13 0.84 1.52 1.17
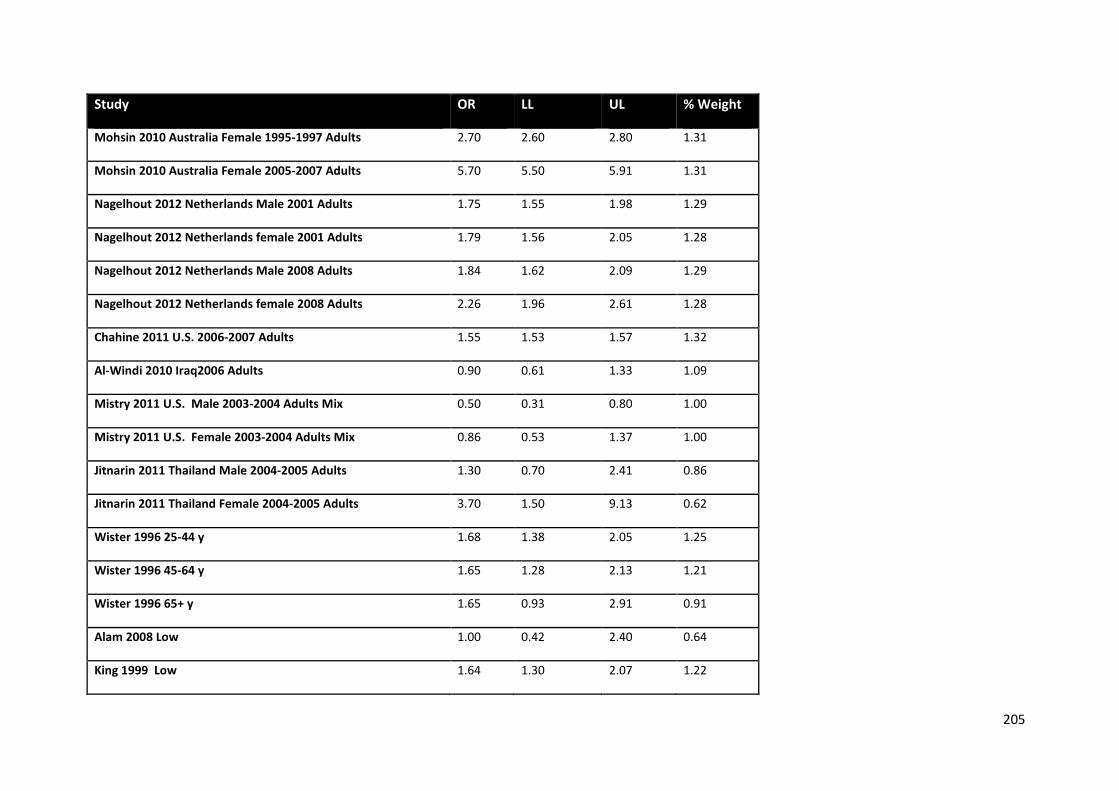
205
Study OR LL UL % Weight
Mohsin 2010 Australia Female 1995-1997 Adults 2.70 2.60 2.80 1.31
Mohsin 2010 Australia Female 2005-2007 Adults 5.70 5.50 5.91 1.31
Nagelhout 2012 Netherlands Male 2001 Adults 1.75 1.55 1.98 1.29
Nagelhout 2012 Netherlands female 2001 Adults 1.79 1.56 2.05 1.28
Nagelhout 2012 Netherlands Male 2008 Adults 1.84 1.62 2.09 1.29
Nagelhout 2012 Netherlands female 2008 Adults 2.26 1.96 2.61 1.28
Chahine 2011 U.S. 2006-2007 Adults 1.55 1.53 1.57 1.32
Al-Windi 2010 Iraq2006 Adults 0.90 0.61 1.33 1.09
Mistry 2011 U.S. Male 2003-2004 Adults Mix 0.50 0.31 0.80 1.00
Mistry 2011 U.S. Female 2003-2004 Adults Mix 0.86 0.53 1.37 1.00
Jitnarin 2011 Thailand Male 2004-2005 Adults 1.30 0.70 2.41 0.86
Jitnarin 2011 Thailand Female 2004-2005 Adults 3.70 1.50 9.13 0.62
Wister 1996 25-44 y 1.68 1.38 2.05 1.25
Wister 1996 45-64 y 1.65 1.28 2.13 1.21
Wister 1996 65+ y 1.65 0.93 2.91 0.91
Alam 2008 Low 1.00 0.42 2.40 0.64
King 1999 Low 1.64 1.30 2.07 1.22
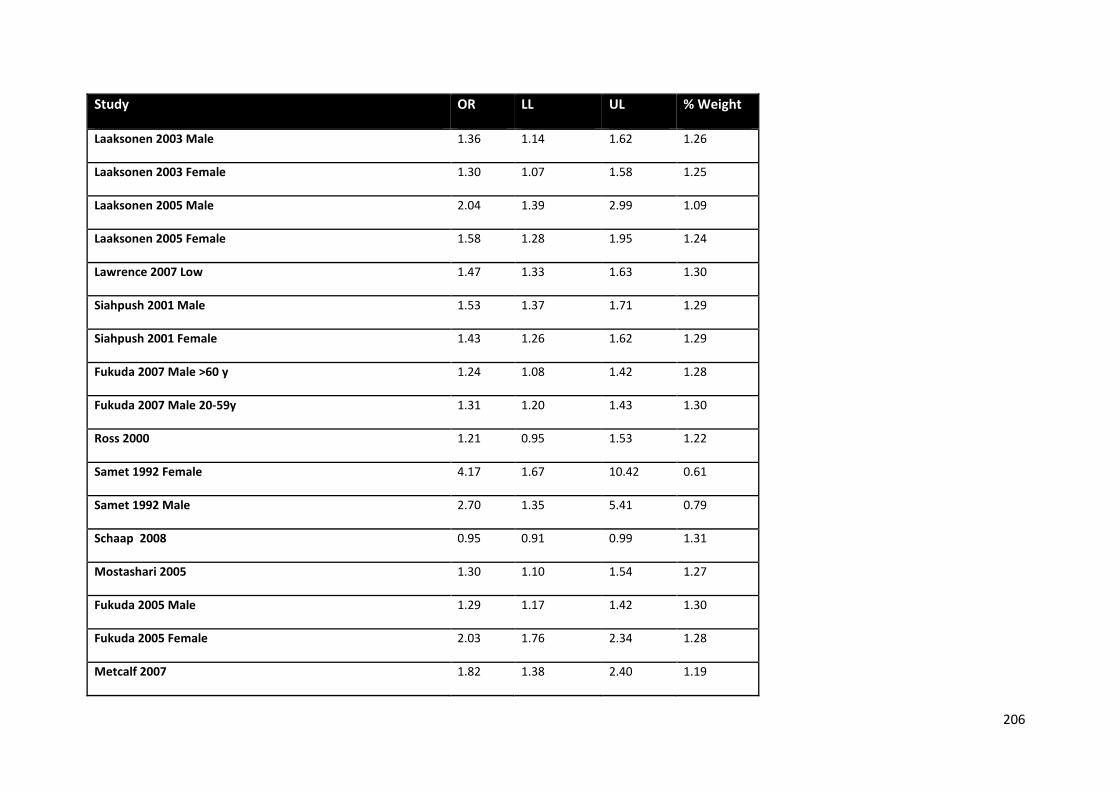
206
Study OR LL UL % Weight
Laaksonen 2003 Male 1.36 1.14 1.62 1.26
Laaksonen 2003 Female 1.30 1.07 1.58 1.25
Laaksonen 2005 Male 2.04 1.39 2.99 1.09
Laaksonen 2005 Female 1.58 1.28 1.95 1.24
Lawrence 2007 Low 1.47 1.33 1.63 1.30
Siahpush 2001 Male 1.53 1.37 1.71 1.29
Siahpush 2001 Female 1.43 1.26 1.62 1.29
Fukuda 2007 Male >60 y 1.24 1.08 1.42 1.28
Fukuda 2007 Male 20-59y 1.31 1.20 1.43 1.30
Ross 2000 1.21 0.95 1.53 1.22
Samet 1992 Female 4.17 1.67 10.42 0.61
Samet 1992 Male 2.70 1.35 5.41 0.79
Schaap 2008 0.95 0.91 0.99 1.31
Mostashari 2005 1.30 1.10 1.54 1.27
Fukuda 2005 Male 1.29 1.17 1.42 1.30
Fukuda 2005 Female 2.03 1.76 2.34 1.28
Metcalf 2007 1.82 1.38 2.40 1.19
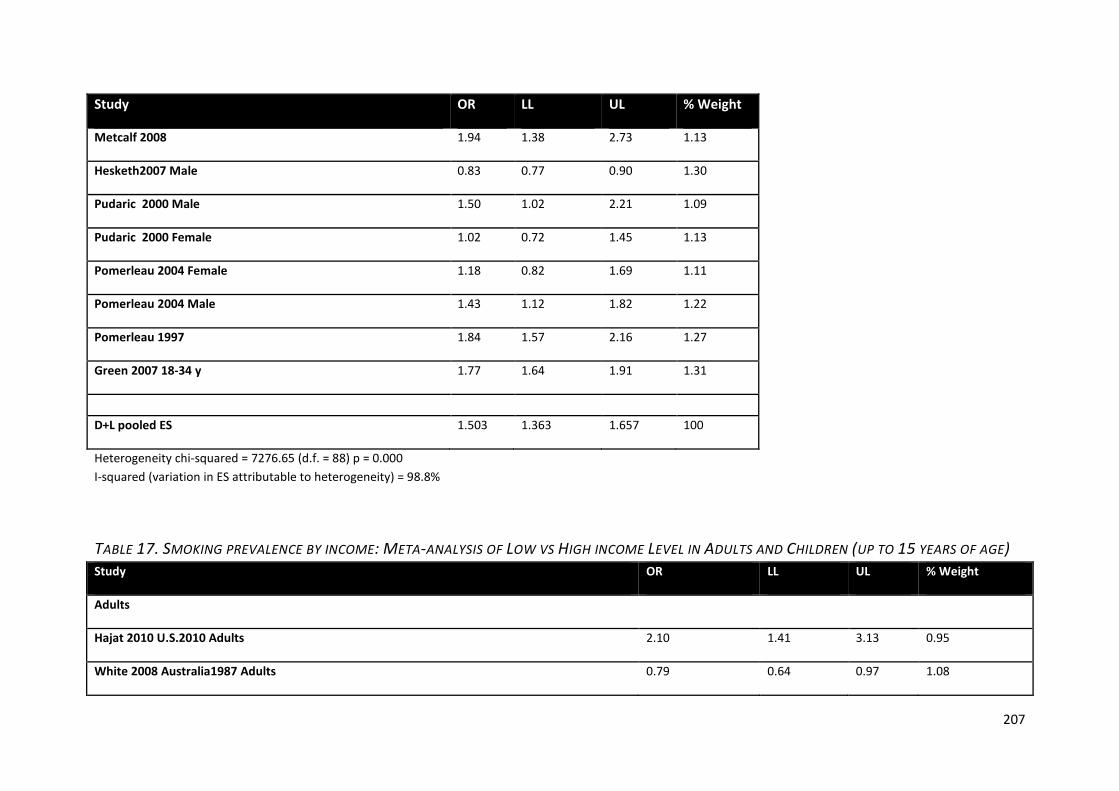
207
Study OR LL UL % Weight
Metcalf 2008 1.94 1.38 2.73 1.13
Hesketh2007 Male 0.83 0.77 0.90 1.30
Pudaric 2000 Male 1.50 1.02 2.21 1.09
Pudaric 2000 Female 1.02 0.72 1.45 1.13
Pomerleau 2004 Female 1.18 0.82 1.69 1.11
Pomerleau 2004 Male 1.43 1.12 1.82 1.22
Pomerleau 1997 1.84 1.57 2.16 1.27
Green 2007 18-34 y 1.77 1.64 1.91 1.31
D+L pooled ES 1.503 1.363 1.657 100
Heterogeneity chi-squared = 7276.65 (d.f. = 88) p = 0.000 I-squared (variation in ES attributable to heterogeneity) = 98.8%
TABLE 17. SMOKING PREVALENCE BY INCOME: META-ANALYSIS OF LOW VS HIGH INCOME LEVEL IN ADULTS AND CHILDREN (UP TO 15 YEARS OF AGE) Study OR LL UL % Weight
Adults
Hajat 2010 U.S.2010 Adults 2.10 1.41 3.13 0.95
White 2008 Australia1987 Adults 0.79 0.64 0.97 1.08
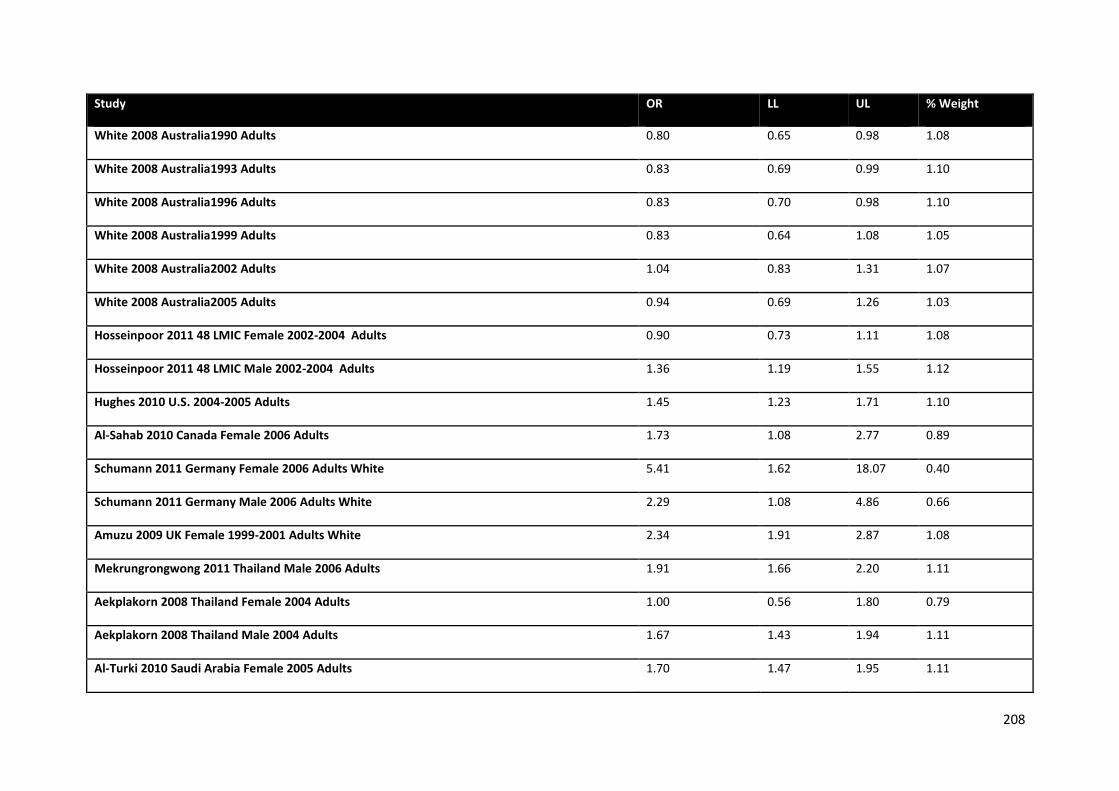
208
Study OR LL UL % Weight
White 2008 Australia1990 Adults 0.80 0.65 0.98 1.08
White 2008 Australia1993 Adults 0.83 0.69 0.99 1.10
White 2008 Australia1996 Adults 0.83 0.70 0.98 1.10
White 2008 Australia1999 Adults 0.83 0.64 1.08 1.05
White 2008 Australia2002 Adults 1.04 0.83 1.31 1.07
White 2008 Australia2005 Adults 0.94 0.69 1.26 1.03
Hosseinpoor 2011 48 LMIC Female 2002-2004 Adults 0.90 0.73 1.11 1.08
Hosseinpoor 2011 48 LMIC Male 2002-2004 Adults 1.36 1.19 1.55 1.12
Hughes 2010 U.S. 2004-2005 Adults 1.45 1.23 1.71 1.10
Al-Sahab 2010 Canada Female 2006 Adults 1.73 1.08 2.77 0.89
Schumann 2011 Germany Female 2006 Adults White 5.41 1.62 18.07 0.40
Schumann 2011 Germany Male 2006 Adults White 2.29 1.08 4.86 0.66
Amuzu 2009 UK Female 1999-2001 Adults White 2.34 1.91 2.87 1.08
Mekrungrongwong 2011 Thailand Male 2006 Adults 1.91 1.66 2.20 1.11
Aekplakorn 2008 Thailand Female 2004 Adults 1.00 0.56 1.80 0.79
Aekplakorn 2008 Thailand Male 2004 Adults 1.67 1.43 1.94 1.11
Al-Turki 2010 Saudi Arabia Female 2005 Adults 1.70 1.47 1.95 1.11
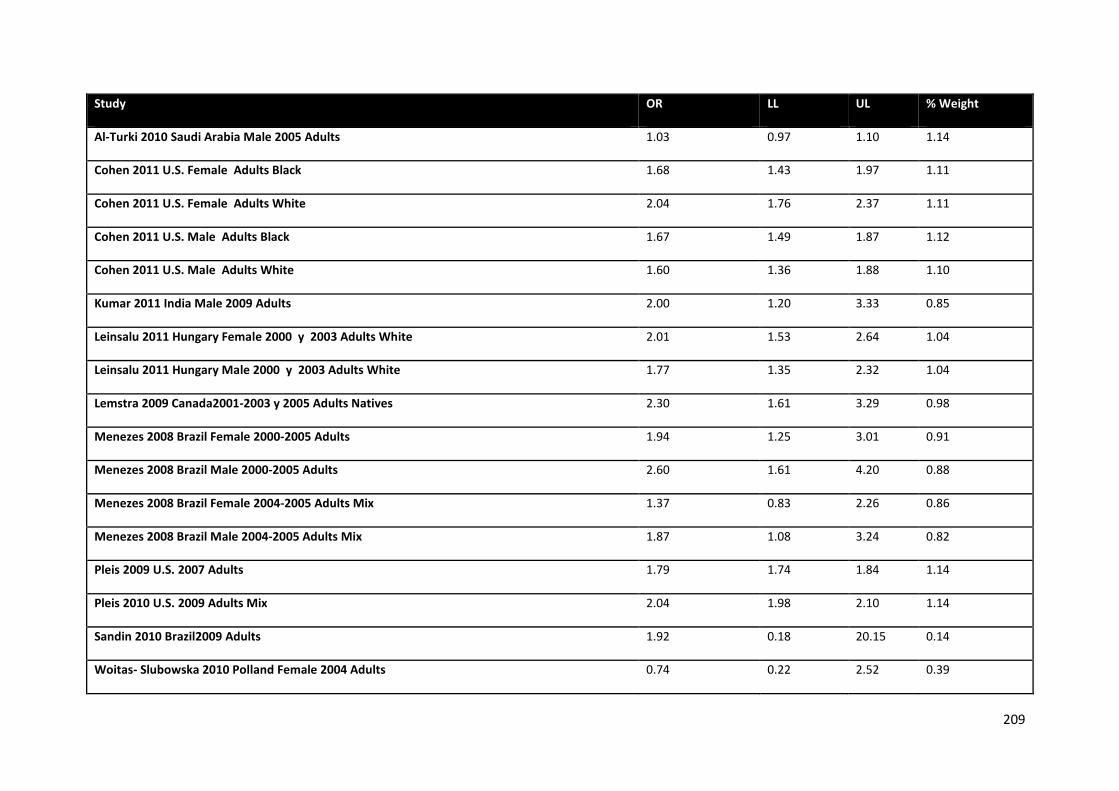
209
Study OR LL UL % Weight
Al-Turki 2010 Saudi Arabia Male 2005 Adults 1.03 0.97 1.10 1.14
Cohen 2011 U.S. Female Adults Black 1.68 1.43 1.97 1.11
Cohen 2011 U.S. Female Adults White 2.04 1.76 2.37 1.11
Cohen 2011 U.S. Male Adults Black 1.67 1.49 1.87 1.12
Cohen 2011 U.S. Male Adults White 1.60 1.36 1.88 1.10
Kumar 2011 India Male 2009 Adults 2.00 1.20 3.33 0.85
Leinsalu 2011 Hungary Female 2000 y 2003 Adults White 2.01 1.53 2.64 1.04
Leinsalu 2011 Hungary Male 2000 y 2003 Adults White 1.77 1.35 2.32 1.04
Lemstra 2009 Canada2001-2003 y 2005 Adults Natives 2.30 1.61 3.29 0.98
Menezes 2008 Brazil Female 2000-2005 Adults 1.94 1.25 3.01 0.91
Menezes 2008 Brazil Male 2000-2005 Adults 2.60 1.61 4.20 0.88
Menezes 2008 Brazil Female 2004-2005 Adults Mix 1.37 0.83 2.26 0.86
Menezes 2008 Brazil Male 2004-2005 Adults Mix 1.87 1.08 3.24 0.82
Pleis 2009 U.S. 2007 Adults 1.79 1.74 1.84 1.14
Pleis 2010 U.S. 2009 Adults Mix 2.04 1.98 2.10 1.14
Sandin 2010 Brazil2009 Adults 1.92 0.18 20.15 0.14
Woitas- Slubowska 2010 Polland Female 2004 Adults 0.74 0.22 2.52 0.39
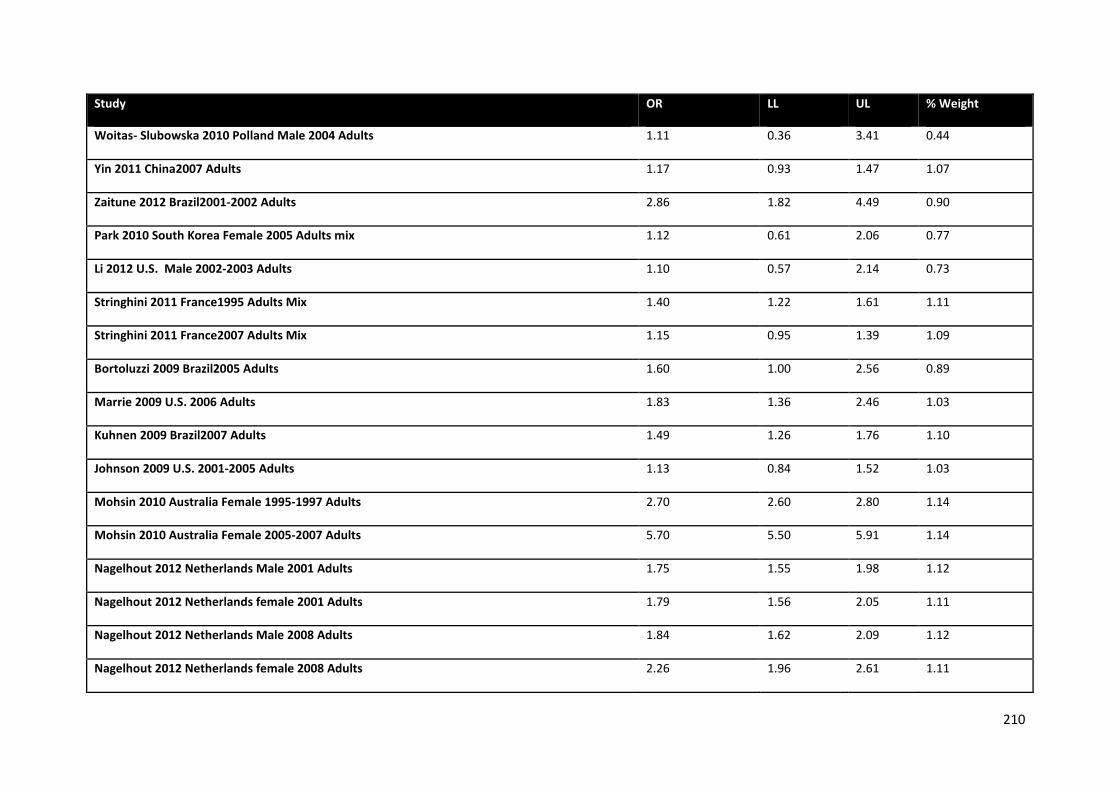
210
Study OR LL UL % Weight
Woitas- Slubowska 2010 Polland Male 2004 Adults 1.11 0.36 3.41 0.44
Yin 2011 China2007 Adults 1.17 0.93 1.47 1.07
Zaitune 2012 Brazil2001-2002 Adults 2.86 1.82 4.49 0.90
Park 2010 South Korea Female 2005 Adults mix 1.12 0.61 2.06 0.77
Li 2012 U.S. Male 2002-2003 Adults 1.10 0.57 2.14 0.73
Stringhini 2011 France1995 Adults Mix 1.40 1.22 1.61 1.11
Stringhini 2011 France2007 Adults Mix 1.15 0.95 1.39 1.09
Bortoluzzi 2009 Brazil2005 Adults 1.60 1.00 2.56 0.89
Marrie 2009 U.S. 2006 Adults 1.83 1.36 2.46 1.03
Kuhnen 2009 Brazil2007 Adults 1.49 1.26 1.76 1.10
Johnson 2009 U.S. 2001-2005 Adults 1.13 0.84 1.52 1.03
Mohsin 2010 Australia Female 1995-1997 Adults 2.70 2.60 2.80 1.14
Mohsin 2010 Australia Female 2005-2007 Adults 5.70 5.50 5.91 1.14
Nagelhout 2012 Netherlands Male 2001 Adults 1.75 1.55 1.98 1.12
Nagelhout 2012 Netherlands female 2001 Adults 1.79 1.56 2.05 1.11
Nagelhout 2012 Netherlands Male 2008 Adults 1.84 1.62 2.09 1.12
Nagelhout 2012 Netherlands female 2008 Adults 2.26 1.96 2.61 1.11
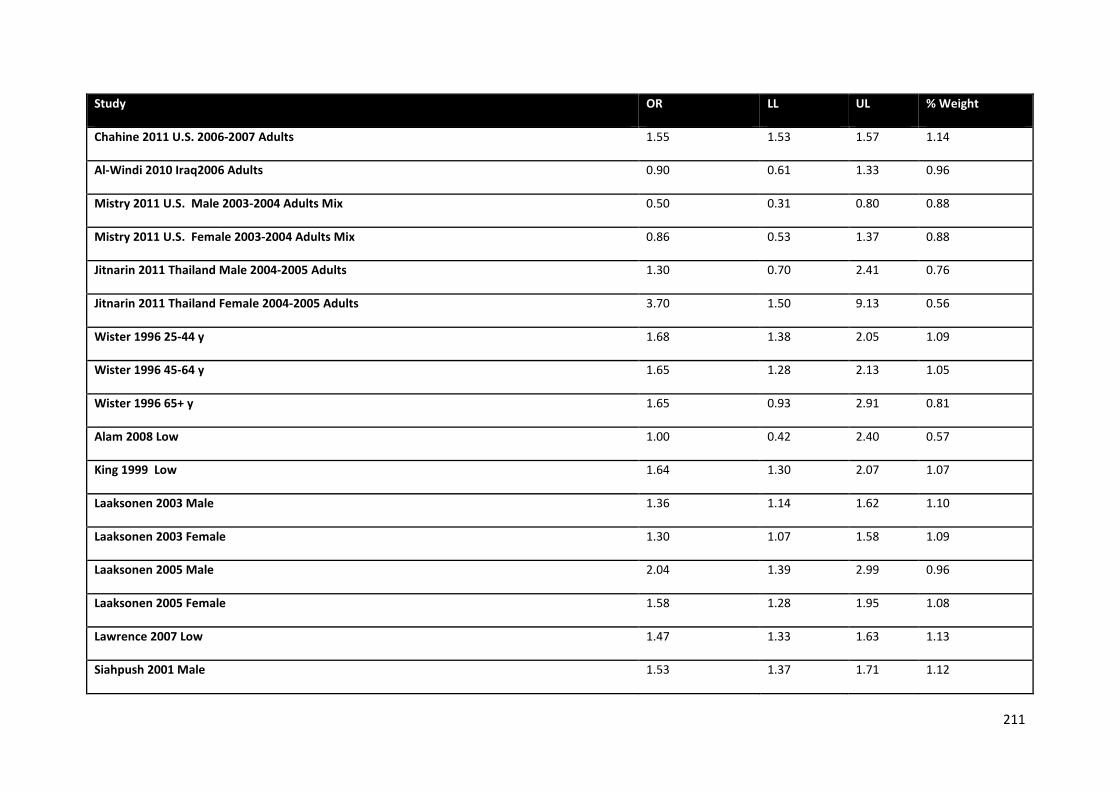
211
Study OR LL UL % Weight
Chahine 2011 U.S. 2006-2007 Adults 1.55 1.53 1.57 1.14
Al-Windi 2010 Iraq2006 Adults 0.90 0.61 1.33 0.96
Mistry 2011 U.S. Male 2003-2004 Adults Mix 0.50 0.31 0.80 0.88
Mistry 2011 U.S. Female 2003-2004 Adults Mix 0.86 0.53 1.37 0.88
Jitnarin 2011 Thailand Male 2004-2005 Adults 1.30 0.70 2.41 0.76
Jitnarin 2011 Thailand Female 2004-2005 Adults 3.70 1.50 9.13 0.56
Wister 1996 25-44 y 1.68 1.38 2.05 1.09
Wister 1996 45-64 y 1.65 1.28 2.13 1.05
Wister 1996 65+ y 1.65 0.93 2.91 0.81
Alam 2008 Low 1.00 0.42 2.40 0.57
King 1999 Low 1.64 1.30 2.07 1.07
Laaksonen 2003 Male 1.36 1.14 1.62 1.10
Laaksonen 2003 Female 1.30 1.07 1.58 1.09
Laaksonen 2005 Male 2.04 1.39 2.99 0.96
Laaksonen 2005 Female 1.58 1.28 1.95 1.08
Lawrence 2007 Low 1.47 1.33 1.63 1.13
Siahpush 2001 Male 1.53 1.37 1.71 1.12
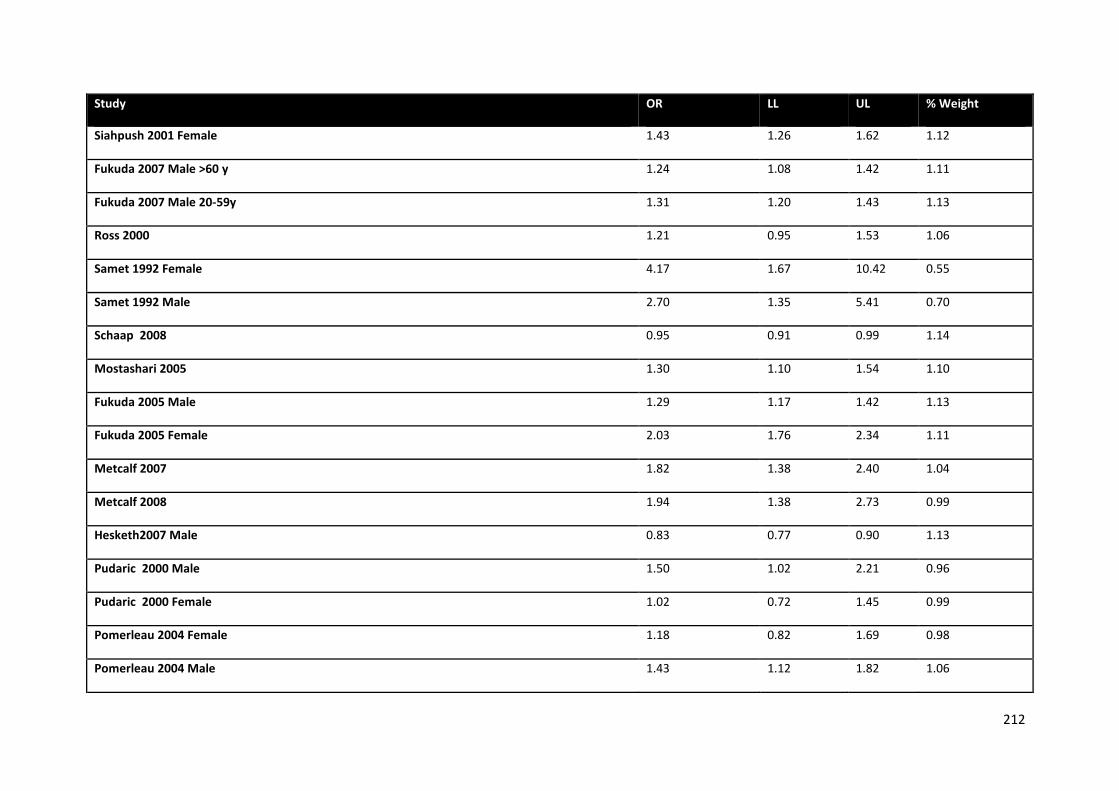
212
Study OR LL UL % Weight
Siahpush 2001 Female 1.43 1.26 1.62 1.12
Fukuda 2007 Male >60 y 1.24 1.08 1.42 1.11
Fukuda 2007 Male 20-59y 1.31 1.20 1.43 1.13
Ross 2000 1.21 0.95 1.53 1.06
Samet 1992 Female 4.17 1.67 10.42 0.55
Samet 1992 Male 2.70 1.35 5.41 0.70
Schaap 2008 0.95 0.91 0.99 1.14
Mostashari 2005 1.30 1.10 1.54 1.10
Fukuda 2005 Male 1.29 1.17 1.42 1.13
Fukuda 2005 Female 2.03 1.76 2.34 1.11
Metcalf 2007 1.82 1.38 2.40 1.04
Metcalf 2008 1.94 1.38 2.73 0.99
Hesketh2007 Male 0.83 0.77 0.90 1.13
Pudaric 2000 Male 1.50 1.02 2.21 0.96
Pudaric 2000 Female 1.02 0.72 1.45 0.99
Pomerleau 2004 Female 1.18 0.82 1.69 0.98
Pomerleau 2004 Male 1.43 1.12 1.82 1.06
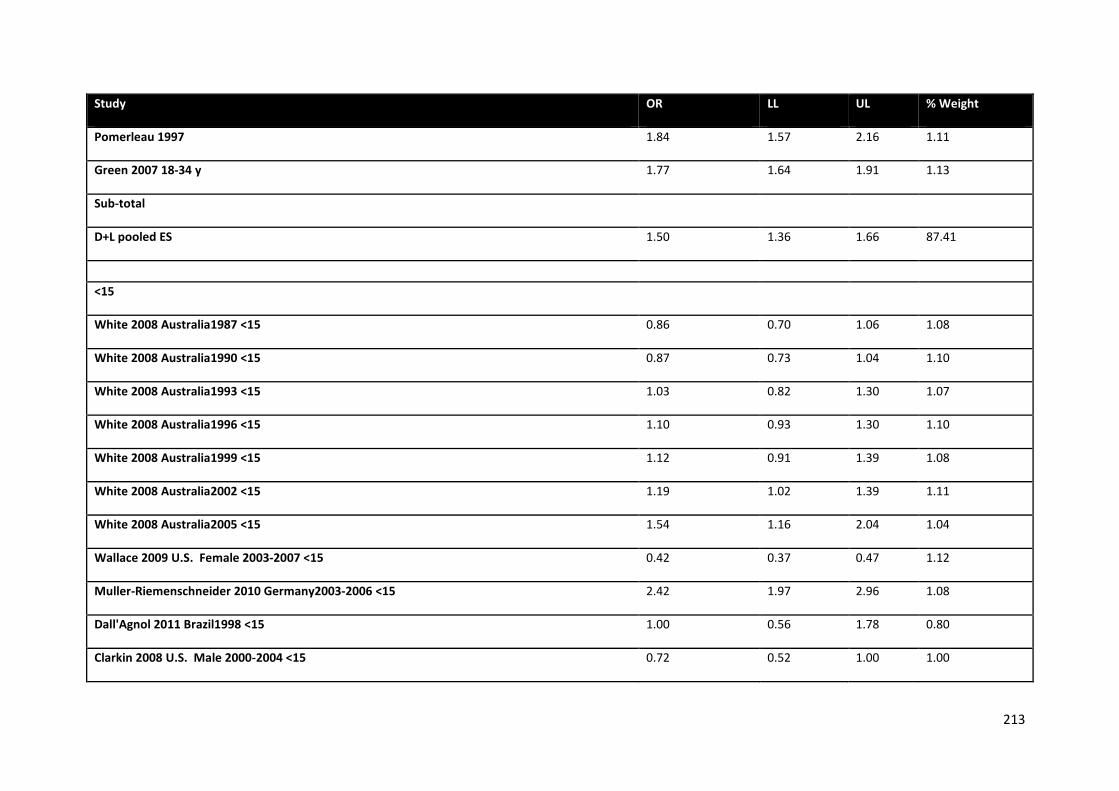
213
Study OR LL UL % Weight
Pomerleau 1997 1.84 1.57 2.16 1.11
Green 2007 18-34 y 1.77 1.64 1.91 1.13
Sub-total
D+L pooled ES 1.50 1.36 1.66 87.41
<15
White 2008 Australia1987 <15 0.86 0.70 1.06 1.08
White 2008 Australia1990 <15 0.87 0.73 1.04 1.10
White 2008 Australia1993 <15 1.03 0.82 1.30 1.07
White 2008 Australia1996 <15 1.10 0.93 1.30 1.10
White 2008 Australia1999 <15 1.12 0.91 1.39 1.08
White 2008 Australia2002 <15 1.19 1.02 1.39 1.11
White 2008 Australia2005 <15 1.54 1.16 2.04 1.04
Wallace 2009 U.S. Female 2003-2007 <15 0.42 0.37 0.47 1.12
Muller-Riemenschneider 2010 Germany2003-2006 <15 2.42 1.97 2.96 1.08
Dall'Agnol 2011 Brazil1998 <15 1.00 0.56 1.78 0.80
Clarkin 2008 U.S. Male 2000-2004 <15 0.72 0.52 1.00 1.00
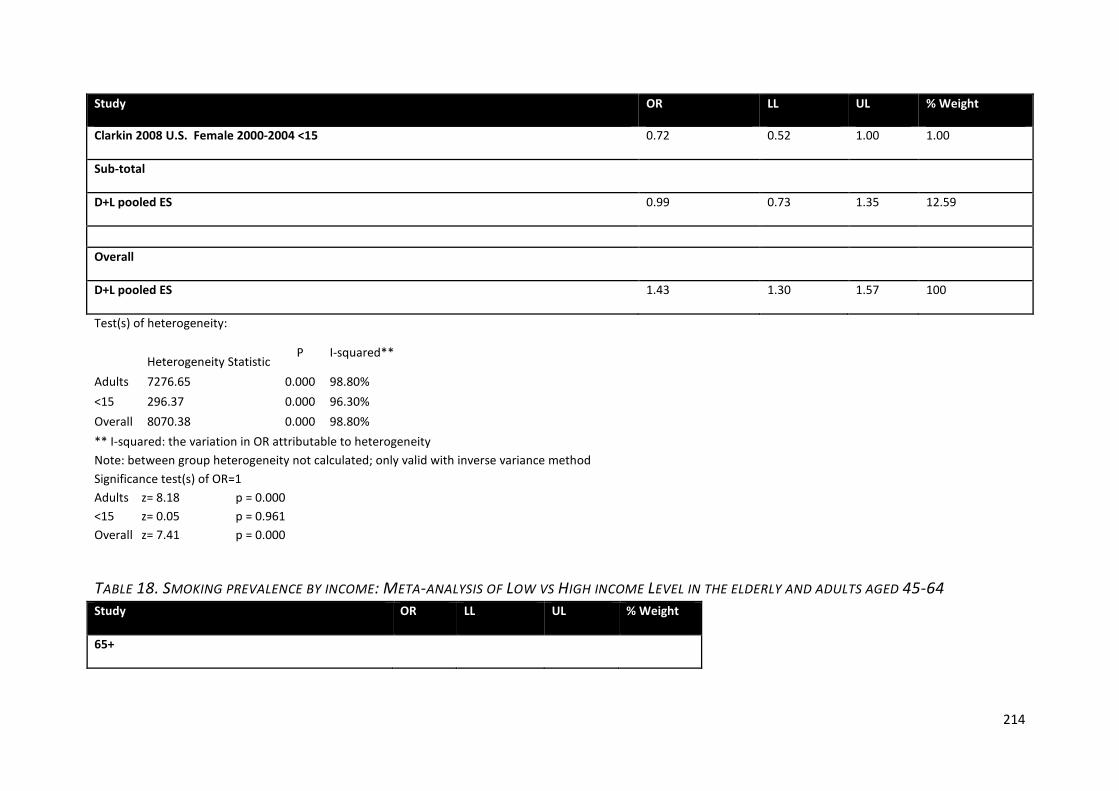
214
Study OR LL UL % Weight
Clarkin 2008 U.S. Female 2000-2004 <15 0.72 0.52 1.00 1.00
Sub-total
D+L pooled ES 0.99 0.73 1.35 12.59
Overall
D+L pooled ES 1.43 1.30 1.57 100
Test(s) of heterogeneity:
Heterogeneity Statistic P I-squared**
Adults 7276.65 0.000 98.80% <15 296.37 0.000 96.30% Overall 8070.38 0.000 98.80% ** I-squared: the variation in OR attributable to heterogeneity Note: between group heterogeneity not calculated; only valid with inverse variance method Significance test(s) of OR=1 Adults z= 8.18 p = 0.000 <15 z= 0.05 p = 0.961 Overall z= 7.41 p = 0.000
TABLE 18. SMOKING PREVALENCE BY INCOME: META-ANALYSIS OF LOW VS HIGH INCOME LEVEL IN THE ELDERLY AND ADULTS AGED 45-64 Study OR LL UL % Weight
65+
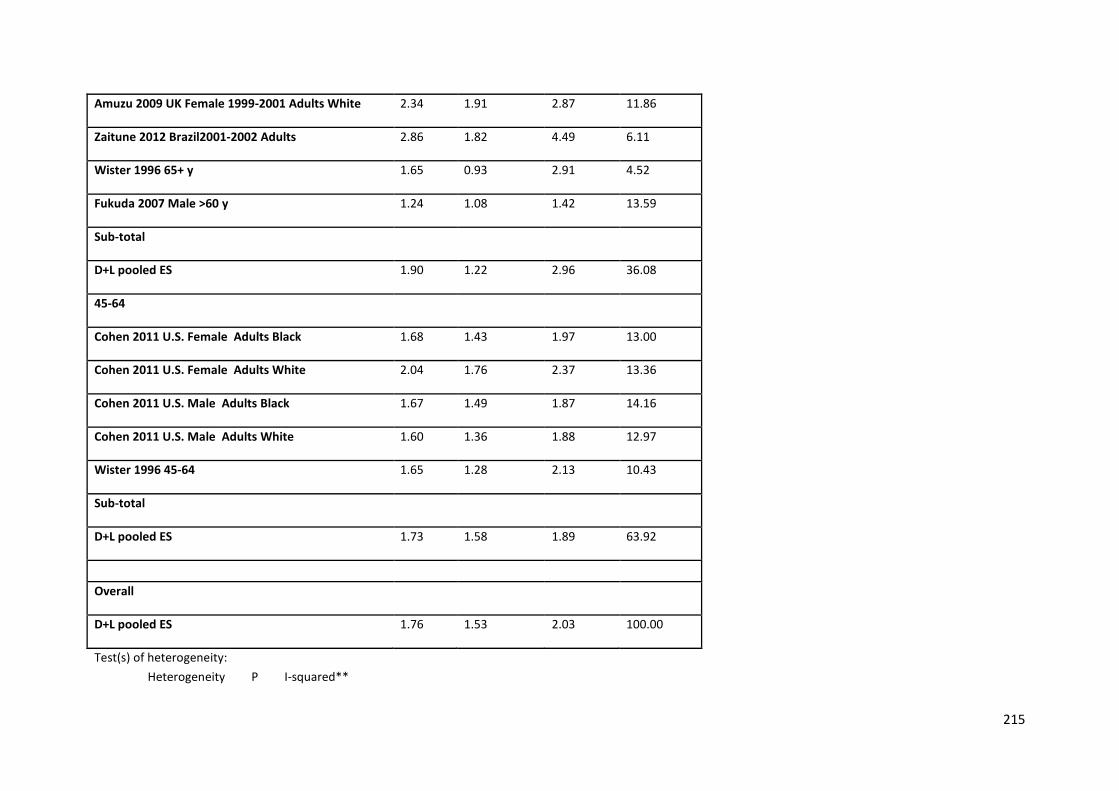
215
Amuzu 2009 UK Female 1999-2001 Adults White 2.34 1.91 2.87 11.86
Zaitune 2012 Brazil2001-2002 Adults 2.86 1.82 4.49 6.11
Wister 1996 65+ y 1.65 0.93 2.91 4.52
Fukuda 2007 Male >60 y 1.24 1.08 1.42 13.59
Sub-total
D+L pooled ES 1.90 1.22 2.96 36.08
45-64
Cohen 2011 U.S. Female Adults Black 1.68 1.43 1.97 13.00
Cohen 2011 U.S. Female Adults White 2.04 1.76 2.37 13.36
Cohen 2011 U.S. Male Adults Black 1.67 1.49 1.87 14.16
Cohen 2011 U.S. Male Adults White 1.60 1.36 1.88 12.97
Wister 1996 45-64 1.65 1.28 2.13 10.43
Sub-total
D+L pooled ES 1.73 1.58 1.89 63.92
Overall
D+L pooled ES 1.76 1.53 2.03 100.00
Test(s) of heterogeneity: Heterogeneity P I-squared**
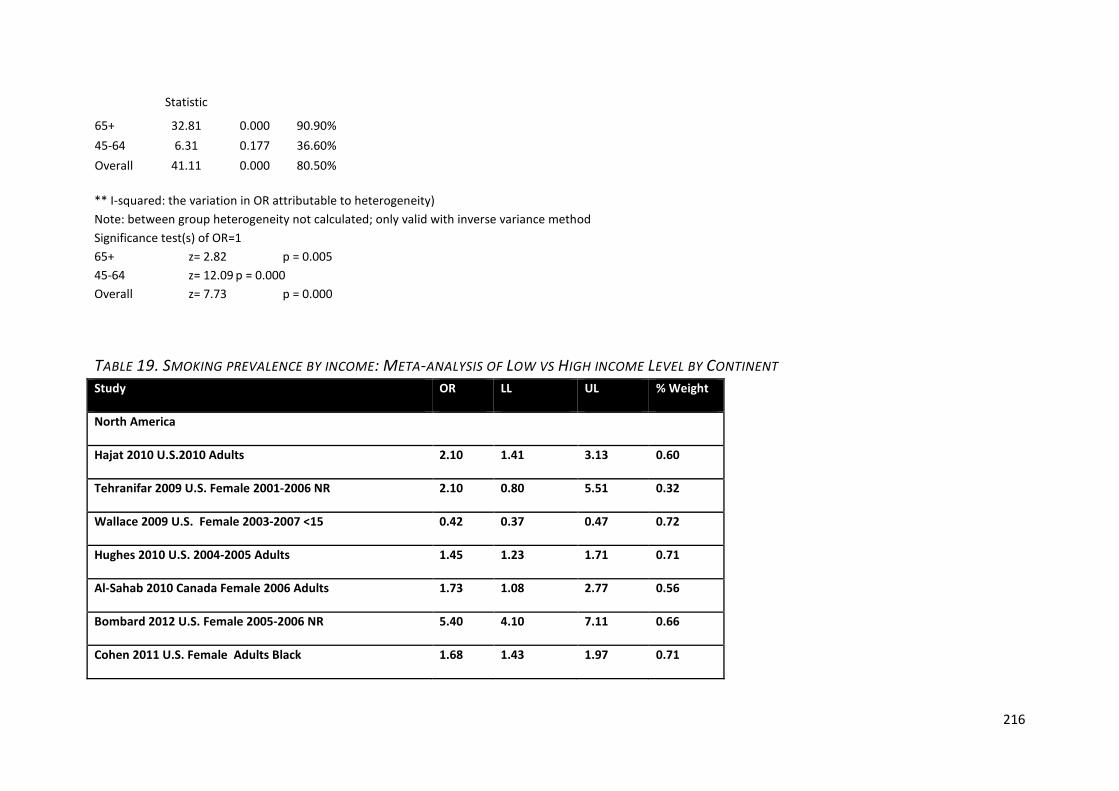
216
Statistic
65+ 32.81 0.000 90.90% 45-64 6.31 0.177 36.60% Overall 41.11 0.000 80.50% ** I-squared: the variation in OR attributable to heterogeneity) Note: between group heterogeneity not calculated; only valid with inverse variance method Significance test(s) of OR=1 65+ z= 2.82 p = 0.005 45-64 z= 12.09 p = 0.000 Overall z= 7.73 p = 0.000
TABLE 19. SMOKING PREVALENCE BY INCOME: META-ANALYSIS OF LOW VS HIGH INCOME LEVEL BY CONTINENT Study OR LL UL % Weight
North America
Hajat 2010 U.S.2010 Adults 2.10 1.41 3.13 0.60
Tehranifar 2009 U.S. Female 2001-2006 NR 2.10 0.80 5.51 0.32
Wallace 2009 U.S. Female 2003-2007 <15 0.42 0.37 0.47 0.72
Hughes 2010 U.S. 2004-2005 Adults 1.45 1.23 1.71 0.71
Al-Sahab 2010 Canada Female 2006 Adults 1.73 1.08 2.77 0.56
Bombard 2012 U.S. Female 2005-2006 NR 5.40 4.10 7.11 0.66
Cohen 2011 U.S. Female Adults Black 1.68 1.43 1.97 0.71
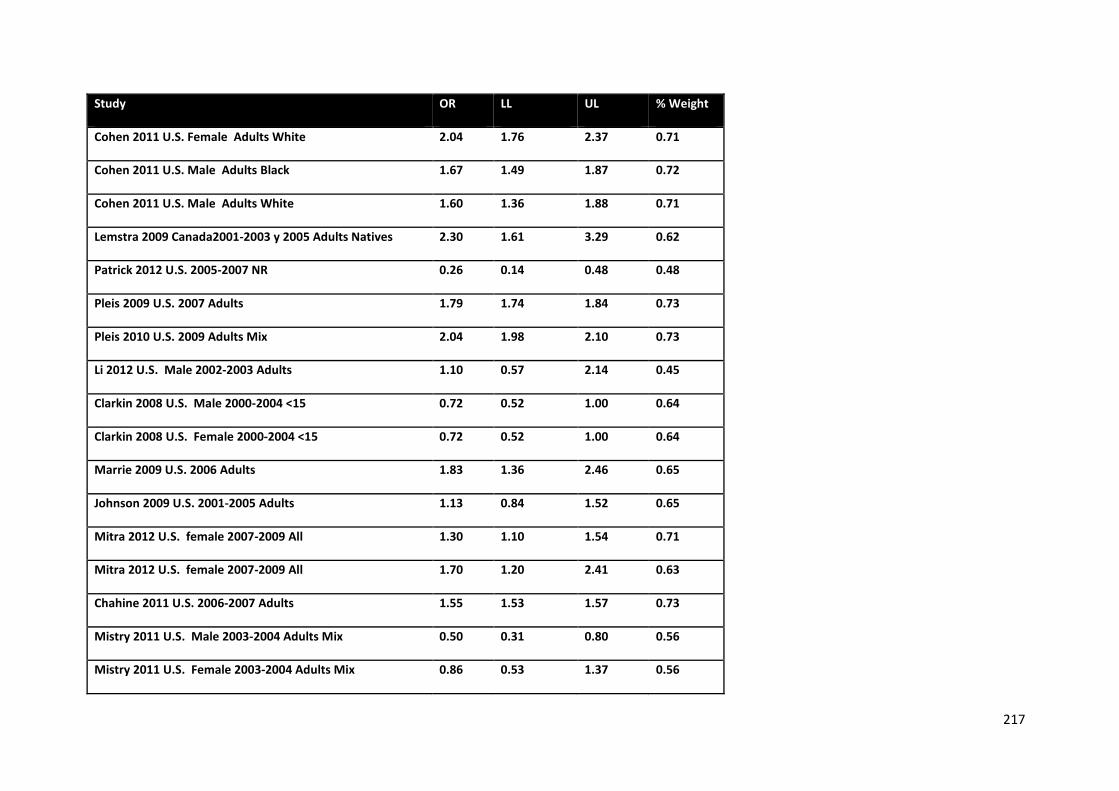
217
Study OR LL UL % Weight
Cohen 2011 U.S. Female Adults White 2.04 1.76 2.37 0.71
Cohen 2011 U.S. Male Adults Black 1.67 1.49 1.87 0.72
Cohen 2011 U.S. Male Adults White 1.60 1.36 1.88 0.71
Lemstra 2009 Canada2001-2003 y 2005 Adults Natives 2.30 1.61 3.29 0.62
Patrick 2012 U.S. 2005-2007 NR 0.26 0.14 0.48 0.48
Pleis 2009 U.S. 2007 Adults 1.79 1.74 1.84 0.73
Pleis 2010 U.S. 2009 Adults Mix 2.04 1.98 2.10 0.73
Li 2012 U.S. Male 2002-2003 Adults 1.10 0.57 2.14 0.45
Clarkin 2008 U.S. Male 2000-2004 <15 0.72 0.52 1.00 0.64
Clarkin 2008 U.S. Female 2000-2004 <15 0.72 0.52 1.00 0.64
Marrie 2009 U.S. 2006 Adults 1.83 1.36 2.46 0.65
Johnson 2009 U.S. 2001-2005 Adults 1.13 0.84 1.52 0.65
Mitra 2012 U.S. female 2007-2009 All 1.30 1.10 1.54 0.71
Mitra 2012 U.S. female 2007-2009 All 1.70 1.20 2.41 0.63
Chahine 2011 U.S. 2006-2007 Adults 1.55 1.53 1.57 0.73
Mistry 2011 U.S. Male 2003-2004 Adults Mix 0.50 0.31 0.80 0.56
Mistry 2011 U.S. Female 2003-2004 Adults Mix 0.86 0.53 1.37 0.56
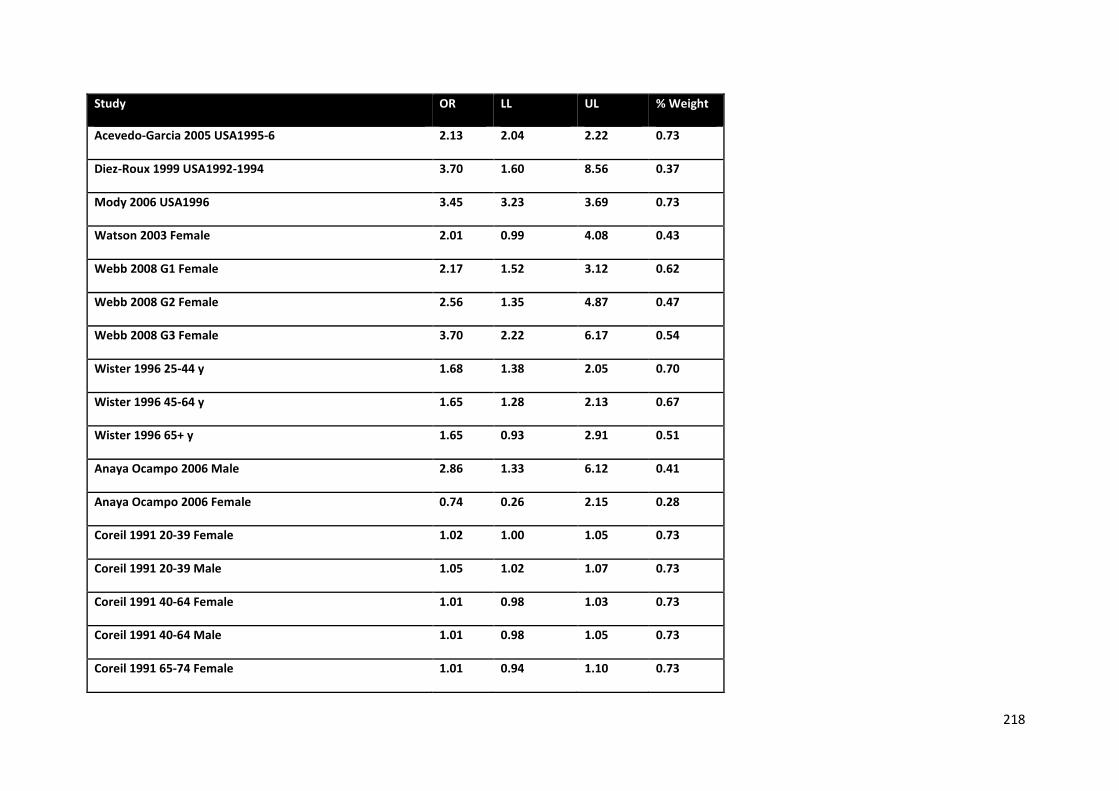
218
Study OR LL UL % Weight
Acevedo-Garcia 2005 USA1995-6 2.13 2.04 2.22 0.73
Diez-Roux 1999 USA1992-1994 3.70 1.60 8.56 0.37
Mody 2006 USA1996 3.45 3.23 3.69 0.73
Watson 2003 Female 2.01 0.99 4.08 0.43
Webb 2008 G1 Female 2.17 1.52 3.12 0.62
Webb 2008 G2 Female 2.56 1.35 4.87 0.47
Webb 2008 G3 Female 3.70 2.22 6.17 0.54
Wister 1996 25-44 y 1.68 1.38 2.05 0.70
Wister 1996 45-64 y 1.65 1.28 2.13 0.67
Wister 1996 65+ y 1.65 0.93 2.91 0.51
Anaya Ocampo 2006 Male 2.86 1.33 6.12 0.41
Anaya Ocampo 2006 Female 0.74 0.26 2.15 0.28
Coreil 1991 20-39 Female 1.02 1.00 1.05 0.73
Coreil 1991 20-39 Male 1.05 1.02 1.07 0.73
Coreil 1991 40-64 Female 1.01 0.98 1.03 0.73
Coreil 1991 40-64 Male 1.01 0.98 1.05 0.73
Coreil 1991 65-74 Female 1.01 0.94 1.10 0.73
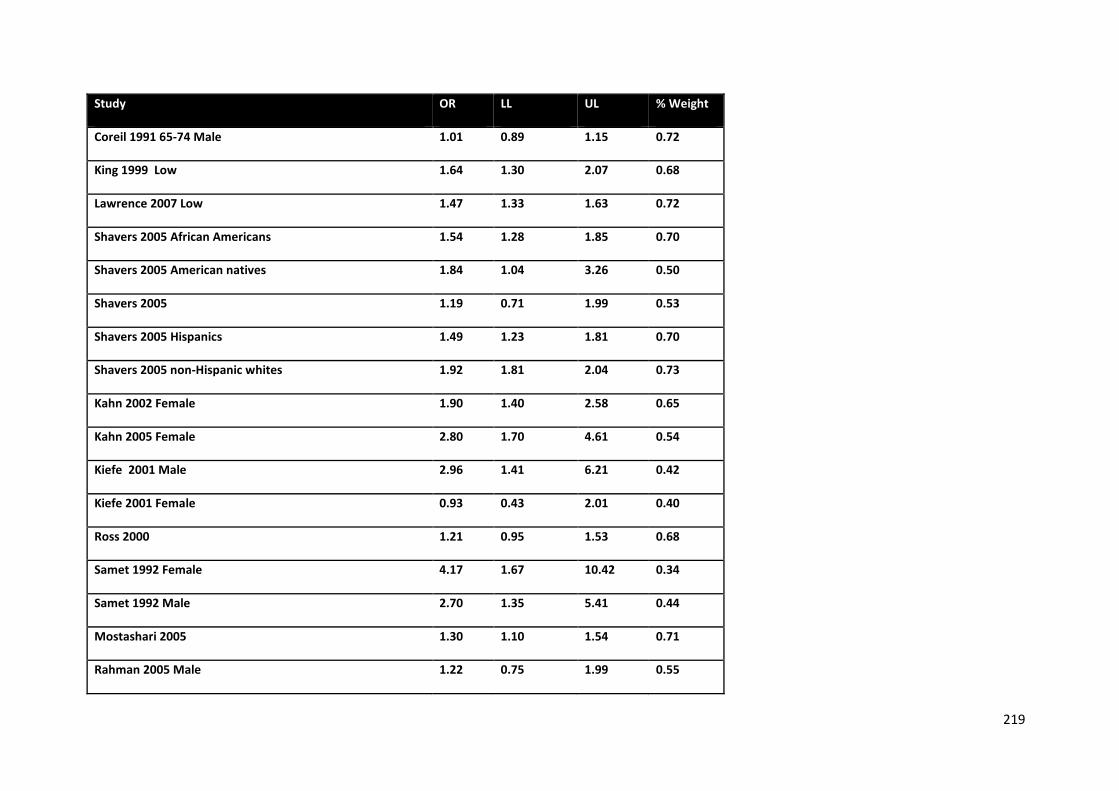
219
Study OR LL UL % Weight
Coreil 1991 65-74 Male 1.01 0.89 1.15 0.72
King 1999 Low 1.64 1.30 2.07 0.68
Lawrence 2007 Low 1.47 1.33 1.63 0.72
Shavers 2005 African Americans 1.54 1.28 1.85 0.70
Shavers 2005 American natives 1.84 1.04 3.26 0.50
Shavers 2005 1.19 0.71 1.99 0.53
Shavers 2005 Hispanics 1.49 1.23 1.81 0.70
Shavers 2005 non-Hispanic whites 1.92 1.81 2.04 0.73
Kahn 2002 Female 1.90 1.40 2.58 0.65
Kahn 2005 Female 2.80 1.70 4.61 0.54
Kiefe 2001 Male 2.96 1.41 6.21 0.42
Kiefe 2001 Female 0.93 0.43 2.01 0.40
Ross 2000 1.21 0.95 1.53 0.68
Samet 1992 Female 4.17 1.67 10.42 0.34
Samet 1992 Male 2.70 1.35 5.41 0.44
Mostashari 2005 1.30 1.10 1.54 0.71
Rahman 2005 Male 1.22 0.75 1.99 0.55
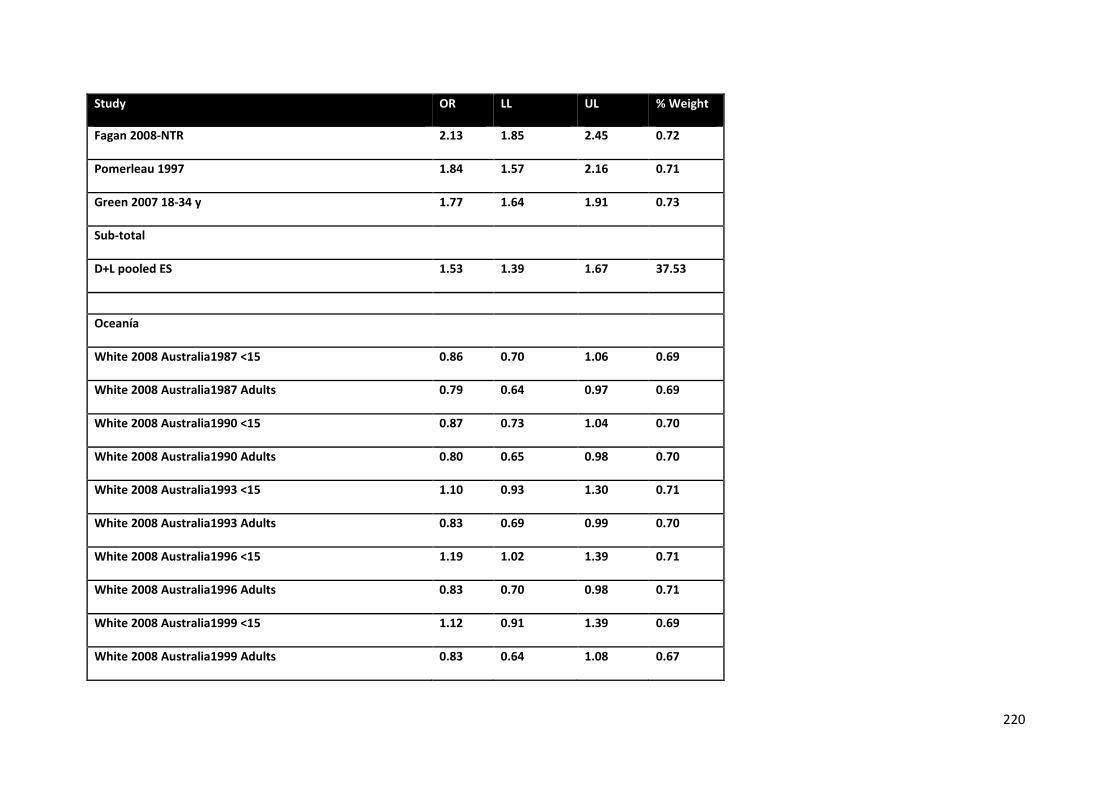
220
Study OR LL UL % Weight
Fagan 2008-NTR 2.13 1.85 2.45 0.72
Pomerleau 1997 1.84 1.57 2.16 0.71
Green 2007 18-34 y 1.77 1.64 1.91 0.73
Sub-total
D+L pooled ES 1.53 1.39 1.67 37.53
Oceanía
White 2008 Australia1987 <15 0.86 0.70 1.06 0.69
White 2008 Australia1987 Adults 0.79 0.64 0.97 0.69
White 2008 Australia1990 <15 0.87 0.73 1.04 0.70
White 2008 Australia1990 Adults 0.80 0.65 0.98 0.70
White 2008 Australia1993 <15 1.10 0.93 1.30 0.71
White 2008 Australia1993 Adults 0.83 0.69 0.99 0.70
White 2008 Australia1996 <15 1.19 1.02 1.39 0.71
White 2008 Australia1996 Adults 0.83 0.70 0.98 0.71
White 2008 Australia1999 <15 1.12 0.91 1.39 0.69
White 2008 Australia1999 Adults 0.83 0.64 1.08 0.67
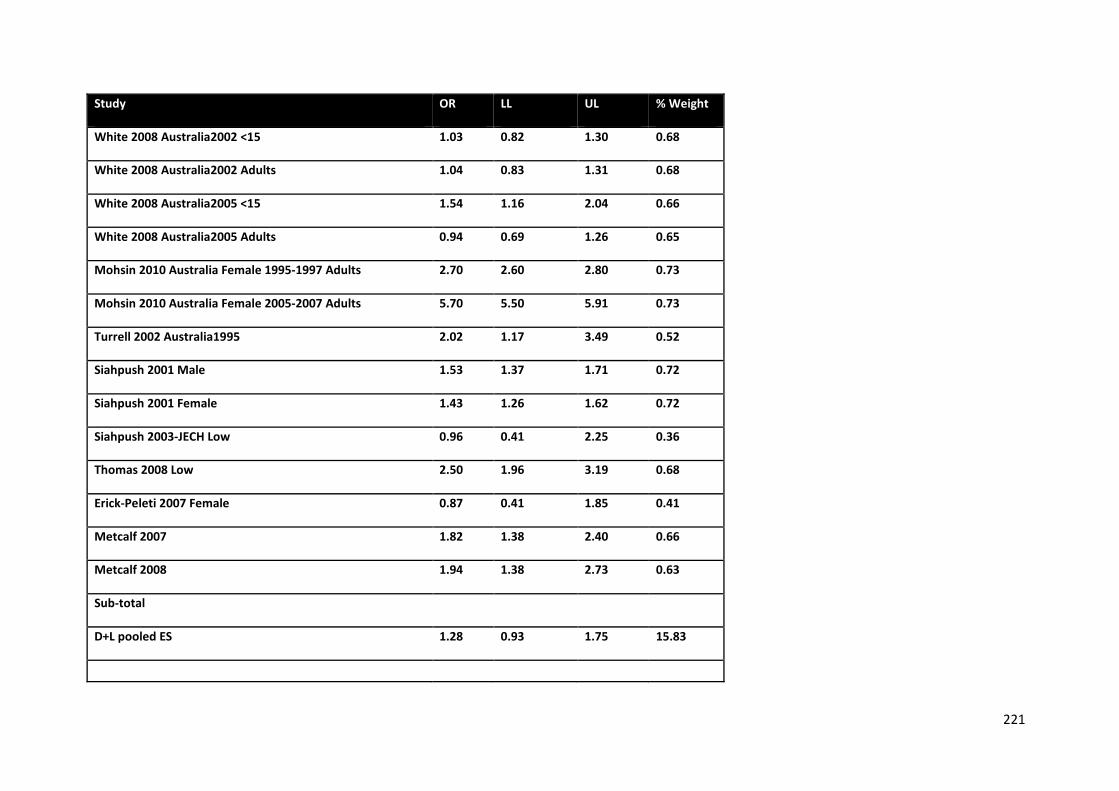
221
Study OR LL UL % Weight
White 2008 Australia2002 <15 1.03 0.82 1.30 0.68
White 2008 Australia2002 Adults 1.04 0.83 1.31 0.68
White 2008 Australia2005 <15 1.54 1.16 2.04 0.66
White 2008 Australia2005 Adults 0.94 0.69 1.26 0.65
Mohsin 2010 Australia Female 1995-1997 Adults 2.70 2.60 2.80 0.73
Mohsin 2010 Australia Female 2005-2007 Adults 5.70 5.50 5.91 0.73
Turrell 2002 Australia1995 2.02 1.17 3.49 0.52
Siahpush 2001 Male 1.53 1.37 1.71 0.72
Siahpush 2001 Female 1.43 1.26 1.62 0.72
Siahpush 2003-JECH Low 0.96 0.41 2.25 0.36
Thomas 2008 Low 2.50 1.96 3.19 0.68
Erick-Peleti 2007 Female 0.87 0.41 1.85 0.41
Metcalf 2007 1.82 1.38 2.40 0.66
Metcalf 2008 1.94 1.38 2.73 0.63
Sub-total
D+L pooled ES 1.28 0.93 1.75 15.83
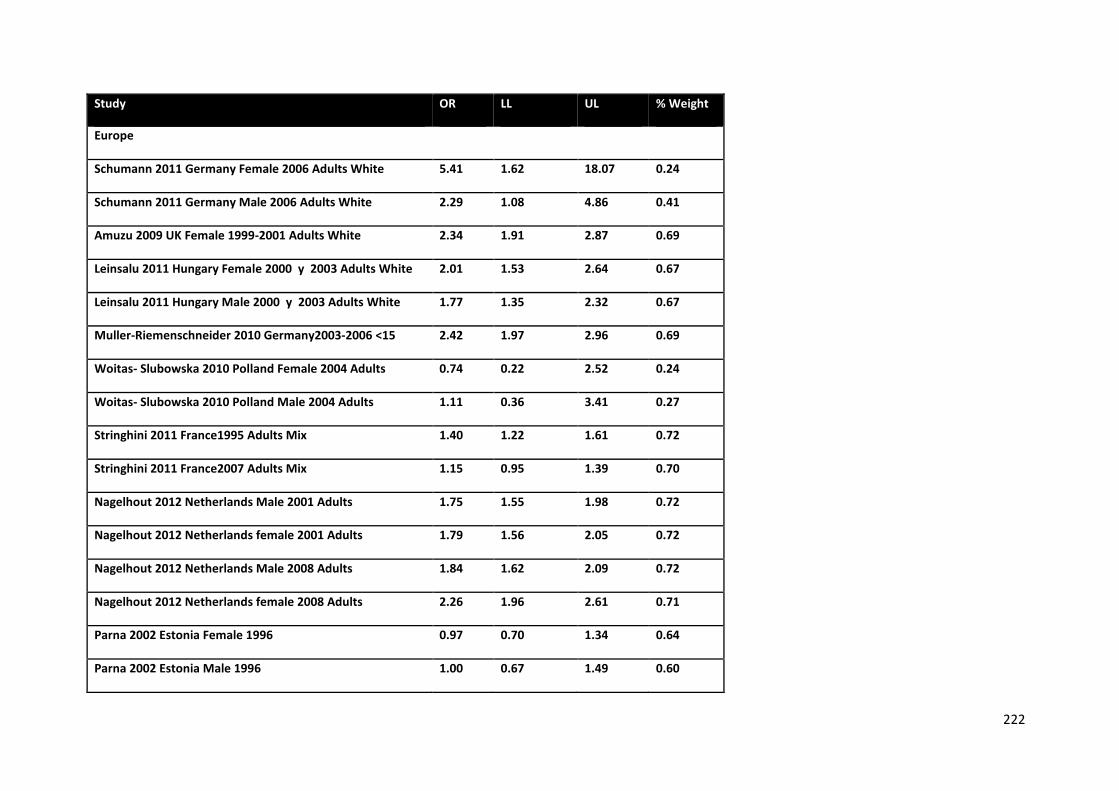
222
Study OR LL UL % Weight
Europe
Schumann 2011 Germany Female 2006 Adults White 5.41 1.62 18.07 0.24
Schumann 2011 Germany Male 2006 Adults White 2.29 1.08 4.86 0.41
Amuzu 2009 UK Female 1999-2001 Adults White 2.34 1.91 2.87 0.69
Leinsalu 2011 Hungary Female 2000 y 2003 Adults White 2.01 1.53 2.64 0.67
Leinsalu 2011 Hungary Male 2000 y 2003 Adults White 1.77 1.35 2.32 0.67
Muller-Riemenschneider 2010 Germany2003-2006 <15 2.42 1.97 2.96 0.69
Woitas- Slubowska 2010 Polland Female 2004 Adults 0.74 0.22 2.52 0.24
Woitas- Slubowska 2010 Polland Male 2004 Adults 1.11 0.36 3.41 0.27
Stringhini 2011 France1995 Adults Mix 1.40 1.22 1.61 0.72
Stringhini 2011 France2007 Adults Mix 1.15 0.95 1.39 0.70
Nagelhout 2012 Netherlands Male 2001 Adults 1.75 1.55 1.98 0.72
Nagelhout 2012 Netherlands female 2001 Adults 1.79 1.56 2.05 0.72
Nagelhout 2012 Netherlands Male 2008 Adults 1.84 1.62 2.09 0.72
Nagelhout 2012 Netherlands female 2008 Adults 2.26 1.96 2.61 0.71
Parna 2002 Estonia Female 1996 0.97 0.70 1.34 0.64
Parna 2002 Estonia Male 1996 1.00 0.67 1.49 0.60
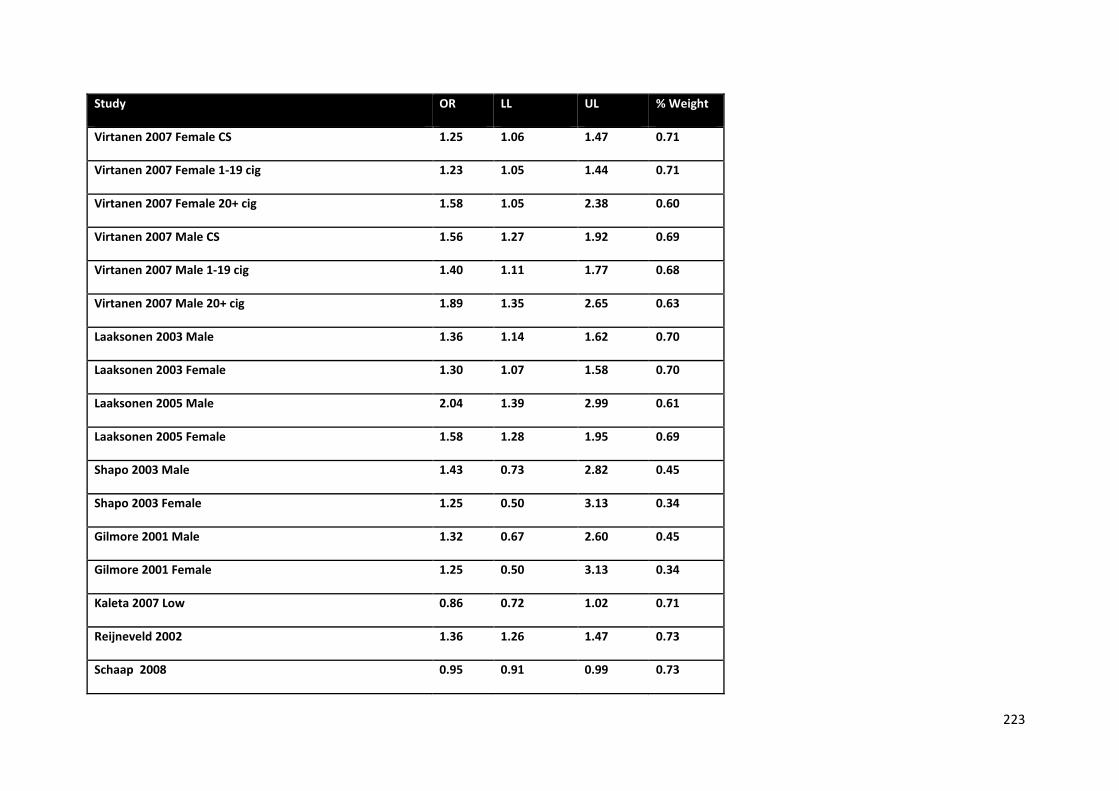
223
Study OR LL UL % Weight
Virtanen 2007 Female CS 1.25 1.06 1.47 0.71
Virtanen 2007 Female 1-19 cig 1.23 1.05 1.44 0.71
Virtanen 2007 Female 20+ cig 1.58 1.05 2.38 0.60
Virtanen 2007 Male CS 1.56 1.27 1.92 0.69
Virtanen 2007 Male 1-19 cig 1.40 1.11 1.77 0.68
Virtanen 2007 Male 20+ cig 1.89 1.35 2.65 0.63
Laaksonen 2003 Male 1.36 1.14 1.62 0.70
Laaksonen 2003 Female 1.30 1.07 1.58 0.70
Laaksonen 2005 Male 2.04 1.39 2.99 0.61
Laaksonen 2005 Female 1.58 1.28 1.95 0.69
Shapo 2003 Male 1.43 0.73 2.82 0.45
Shapo 2003 Female 1.25 0.50 3.13 0.34
Gilmore 2001 Male 1.32 0.67 2.60 0.45
Gilmore 2001 Female 1.25 0.50 3.13 0.34
Kaleta 2007 Low 0.86 0.72 1.02 0.71
Reijneveld 2002 1.36 1.26 1.47 0.73
Schaap 2008 0.95 0.91 0.99 0.73
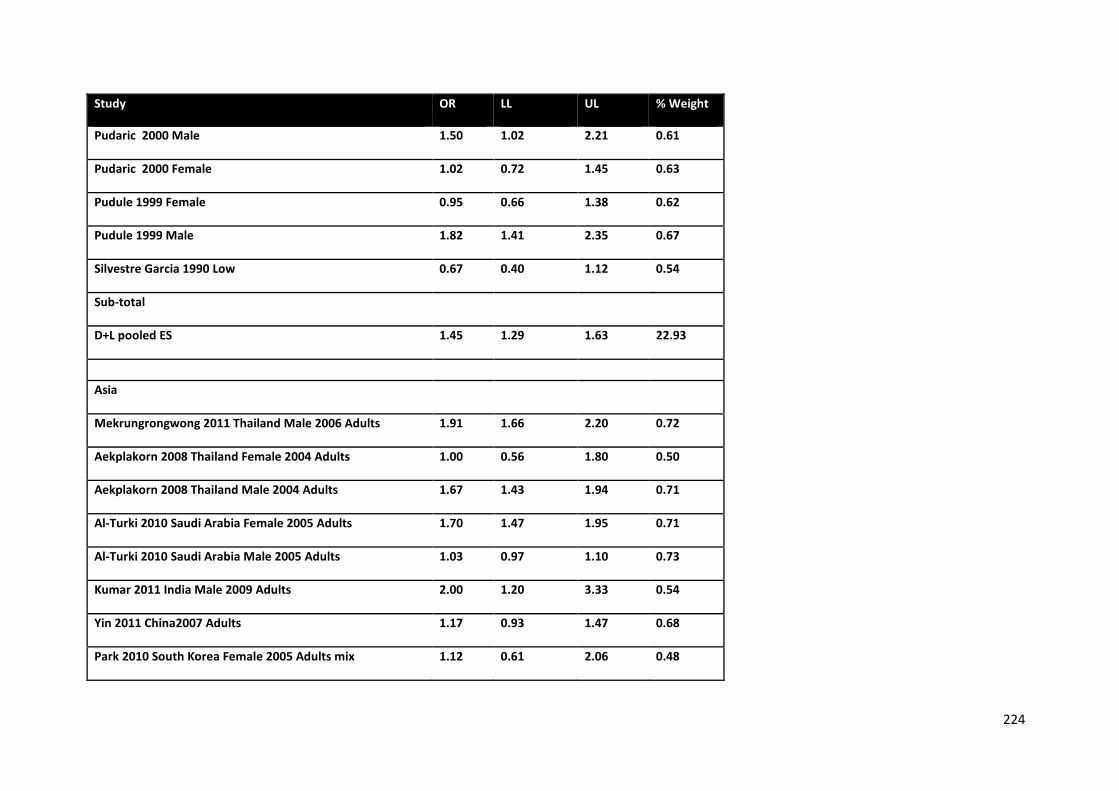
224
Study OR LL UL % Weight
Pudaric 2000 Male 1.50 1.02 2.21 0.61
Pudaric 2000 Female 1.02 0.72 1.45 0.63
Pudule 1999 Female 0.95 0.66 1.38 0.62
Pudule 1999 Male 1.82 1.41 2.35 0.67
Silvestre Garcia 1990 Low 0.67 0.40 1.12 0.54
Sub-total
D+L pooled ES 1.45 1.29 1.63 22.93
Asia
Mekrungrongwong 2011 Thailand Male 2006 Adults 1.91 1.66 2.20 0.72
Aekplakorn 2008 Thailand Female 2004 Adults 1.00 0.56 1.80 0.50
Aekplakorn 2008 Thailand Male 2004 Adults 1.67 1.43 1.94 0.71
Al-Turki 2010 Saudi Arabia Female 2005 Adults 1.70 1.47 1.95 0.71
Al-Turki 2010 Saudi Arabia Male 2005 Adults 1.03 0.97 1.10 0.73
Kumar 2011 India Male 2009 Adults 2.00 1.20 3.33 0.54
Yin 2011 China2007 Adults 1.17 0.93 1.47 0.68
Park 2010 South Korea Female 2005 Adults mix 1.12 0.61 2.06 0.48
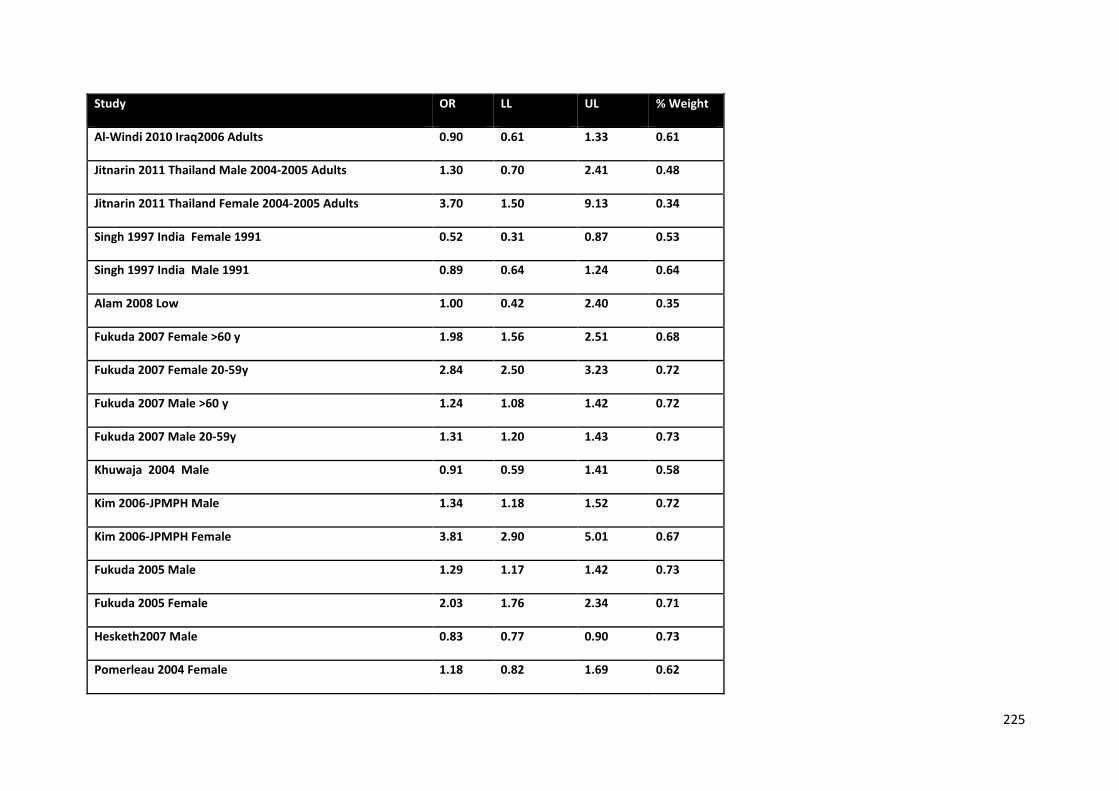
225
Study OR LL UL % Weight
Al-Windi 2010 Iraq2006 Adults 0.90 0.61 1.33 0.61
Jitnarin 2011 Thailand Male 2004-2005 Adults 1.30 0.70 2.41 0.48
Jitnarin 2011 Thailand Female 2004-2005 Adults 3.70 1.50 9.13 0.34
Singh 1997 India Female 1991 0.52 0.31 0.87 0.53
Singh 1997 India Male 1991 0.89 0.64 1.24 0.64
Alam 2008 Low 1.00 0.42 2.40 0.35
Fukuda 2007 Female >60 y 1.98 1.56 2.51 0.68
Fukuda 2007 Female 20-59y 2.84 2.50 3.23 0.72
Fukuda 2007 Male >60 y 1.24 1.08 1.42 0.72
Fukuda 2007 Male 20-59y 1.31 1.20 1.43 0.73
Khuwaja 2004 Male 0.91 0.59 1.41 0.58
Kim 2006-JPMPH Male 1.34 1.18 1.52 0.72
Kim 2006-JPMPH Female 3.81 2.90 5.01 0.67
Fukuda 2005 Male 1.29 1.17 1.42 0.73
Fukuda 2005 Female 2.03 1.76 2.34 0.71
Hesketh2007 Male 0.83 0.77 0.90 0.73
Pomerleau 2004 Female 1.18 0.82 1.69 0.62
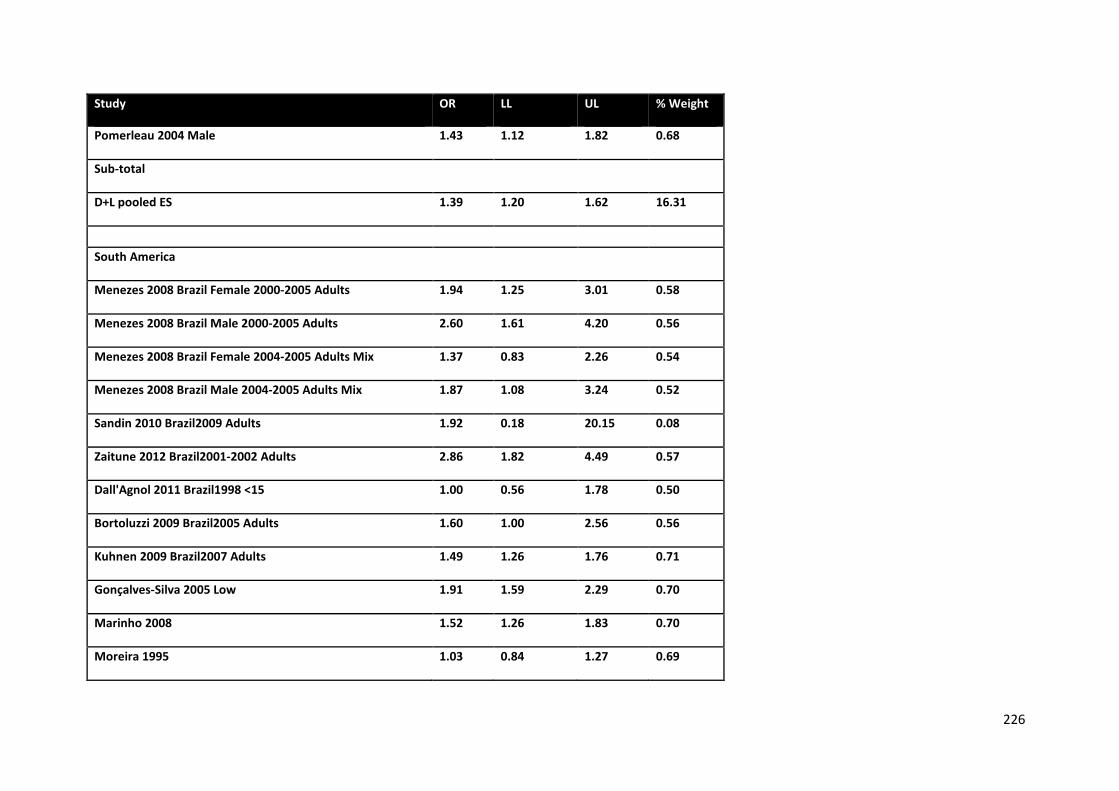
226
Study OR LL UL % Weight
Pomerleau 2004 Male 1.43 1.12 1.82 0.68
Sub-total
D+L pooled ES 1.39 1.20 1.62 16.31
South America
Menezes 2008 Brazil Female 2000-2005 Adults 1.94 1.25 3.01 0.58
Menezes 2008 Brazil Male 2000-2005 Adults 2.60 1.61 4.20 0.56
Menezes 2008 Brazil Female 2004-2005 Adults Mix 1.37 0.83 2.26 0.54
Menezes 2008 Brazil Male 2004-2005 Adults Mix 1.87 1.08 3.24 0.52
Sandin 2010 Brazil2009 Adults 1.92 0.18 20.15 0.08
Zaitune 2012 Brazil2001-2002 Adults 2.86 1.82 4.49 0.57
Dall'Agnol 2011 Brazil1998 <15 1.00 0.56 1.78 0.50
Bortoluzzi 2009 Brazil2005 Adults 1.60 1.00 2.56 0.56
Kuhnen 2009 Brazil2007 Adults 1.49 1.26 1.76 0.71
Gonçalves-Silva 2005 Low 1.91 1.59 2.29 0.70
Marinho 2008 1.52 1.26 1.83 0.70
Moreira 1995 1.03 0.84 1.27 0.69
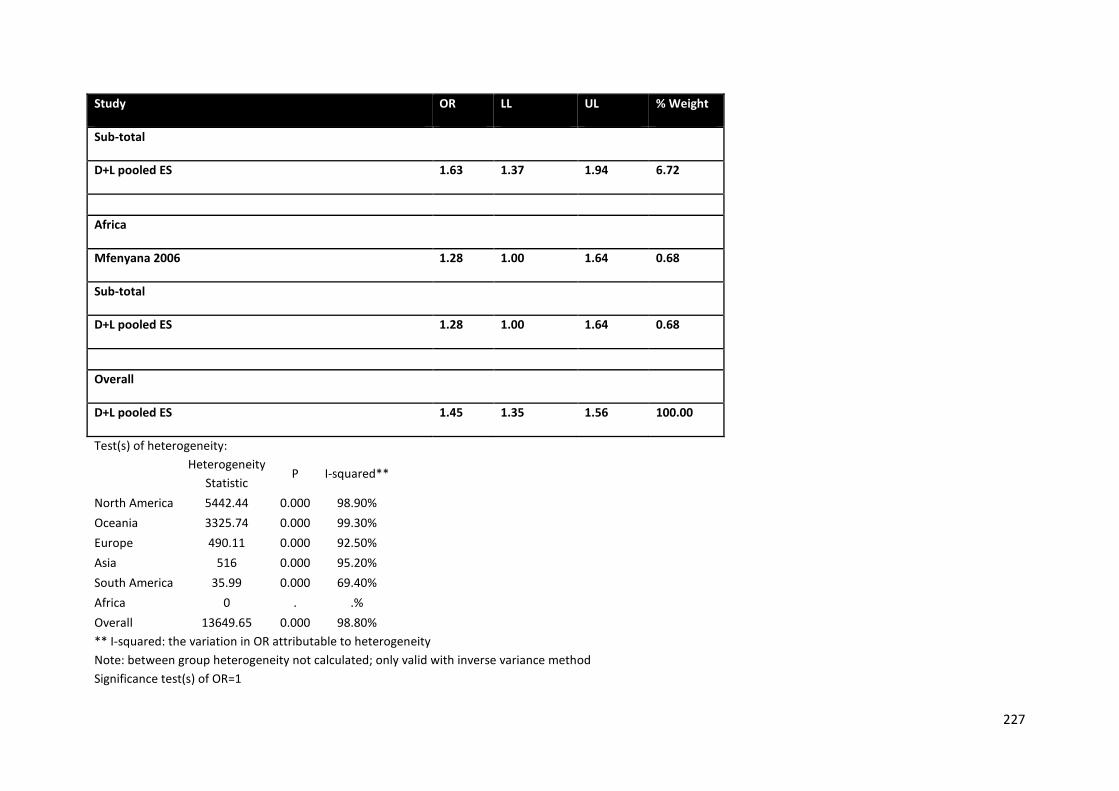
227
Study OR LL UL % Weight
Sub-total
D+L pooled ES 1.63 1.37 1.94 6.72
Africa
Mfenyana 2006 1.28 1.00 1.64 0.68
Sub-total
D+L pooled ES 1.28 1.00 1.64 0.68
Overall
D+L pooled ES 1.45 1.35 1.56 100.00
Test(s) of heterogeneity:
Heterogeneity Statistic
P I-squared**
North America 5442.44 0.000 98.90% Oceania 3325.74 0.000 99.30% Europe 490.11 0.000 92.50% Asia 516 0.000 95.20% South America 35.99 0.000 69.40% Africa 0 . .% Overall 13649.65 0.000 98.80% ** I-squared: the variation in OR attributable to heterogeneity Note: between group heterogeneity not calculated; only valid with inverse variance method Significance test(s) of OR=1
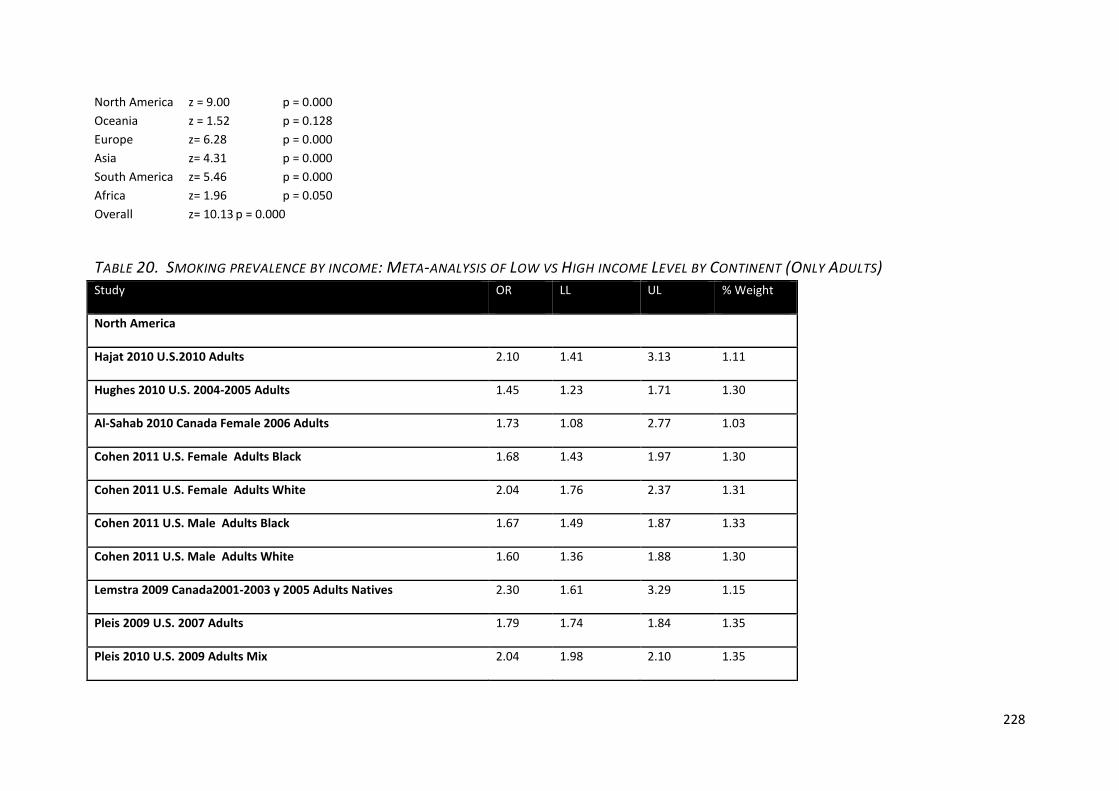
228
North America z = 9.00 p = 0.000 Oceania z = 1.52 p = 0.128 Europe z= 6.28 p = 0.000 Asia z= 4.31 p = 0.000 South America z= 5.46 p = 0.000 Africa z= 1.96 p = 0.050 Overall z= 10.13 p = 0.000
TABLE 20. SMOKING PREVALENCE BY INCOME: META-ANALYSIS OF LOW VS HIGH INCOME LEVEL BY CONTINENT (ONLY ADULTS) Study OR LL UL % Weight
North America
Hajat 2010 U.S.2010 Adults 2.10 1.41 3.13 1.11
Hughes 2010 U.S. 2004-2005 Adults 1.45 1.23 1.71 1.30
Al-Sahab 2010 Canada Female 2006 Adults 1.73 1.08 2.77 1.03
Cohen 2011 U.S. Female Adults Black 1.68 1.43 1.97 1.30
Cohen 2011 U.S. Female Adults White 2.04 1.76 2.37 1.31
Cohen 2011 U.S. Male Adults Black 1.67 1.49 1.87 1.33
Cohen 2011 U.S. Male Adults White 1.60 1.36 1.88 1.30
Lemstra 2009 Canada2001-2003 y 2005 Adults Natives 2.30 1.61 3.29 1.15
Pleis 2009 U.S. 2007 Adults 1.79 1.74 1.84 1.35
Pleis 2010 U.S. 2009 Adults Mix 2.04 1.98 2.10 1.35
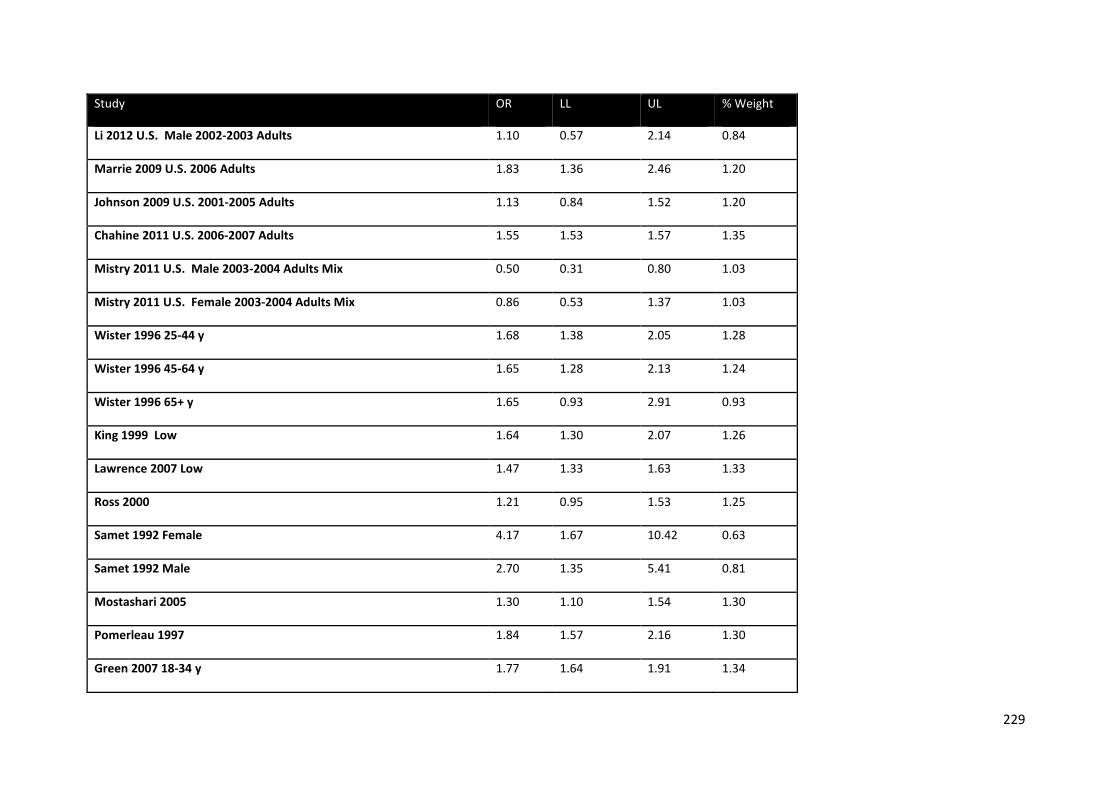
229
Study OR LL UL % Weight
Li 2012 U.S. Male 2002-2003 Adults 1.10 0.57 2.14 0.84
Marrie 2009 U.S. 2006 Adults 1.83 1.36 2.46 1.20
Johnson 2009 U.S. 2001-2005 Adults 1.13 0.84 1.52 1.20
Chahine 2011 U.S. 2006-2007 Adults 1.55 1.53 1.57 1.35
Mistry 2011 U.S. Male 2003-2004 Adults Mix 0.50 0.31 0.80 1.03
Mistry 2011 U.S. Female 2003-2004 Adults Mix 0.86 0.53 1.37 1.03
Wister 1996 25-44 y 1.68 1.38 2.05 1.28
Wister 1996 45-64 y 1.65 1.28 2.13 1.24
Wister 1996 65+ y 1.65 0.93 2.91 0.93
King 1999 Low 1.64 1.30 2.07 1.26
Lawrence 2007 Low 1.47 1.33 1.63 1.33
Ross 2000 1.21 0.95 1.53 1.25
Samet 1992 Female 4.17 1.67 10.42 0.63
Samet 1992 Male 2.70 1.35 5.41 0.81
Mostashari 2005 1.30 1.10 1.54 1.30
Pomerleau 1997 1.84 1.57 2.16 1.30
Green 2007 18-34 y 1.77 1.64 1.91 1.34
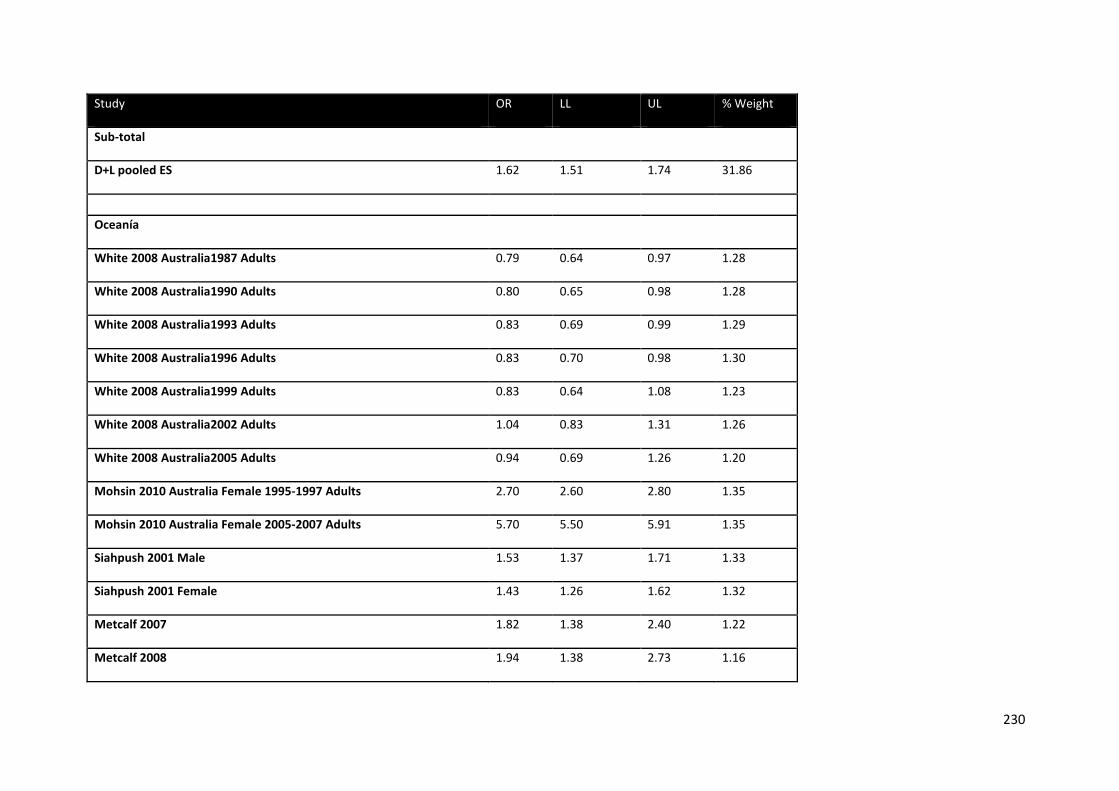
230
Study OR LL UL % Weight
Sub-total
D+L pooled ES 1.62 1.51 1.74 31.86
Oceanía
White 2008 Australia1987 Adults 0.79 0.64 0.97 1.28
White 2008 Australia1990 Adults 0.80 0.65 0.98 1.28
White 2008 Australia1993 Adults 0.83 0.69 0.99 1.29
White 2008 Australia1996 Adults 0.83 0.70 0.98 1.30
White 2008 Australia1999 Adults 0.83 0.64 1.08 1.23
White 2008 Australia2002 Adults 1.04 0.83 1.31 1.26
White 2008 Australia2005 Adults 0.94 0.69 1.26 1.20
Mohsin 2010 Australia Female 1995-1997 Adults 2.70 2.60 2.80 1.35
Mohsin 2010 Australia Female 2005-2007 Adults 5.70 5.50 5.91 1.35
Siahpush 2001 Male 1.53 1.37 1.71 1.33
Siahpush 2001 Female 1.43 1.26 1.62 1.32
Metcalf 2007 1.82 1.38 2.40 1.22
Metcalf 2008 1.94 1.38 2.73 1.16
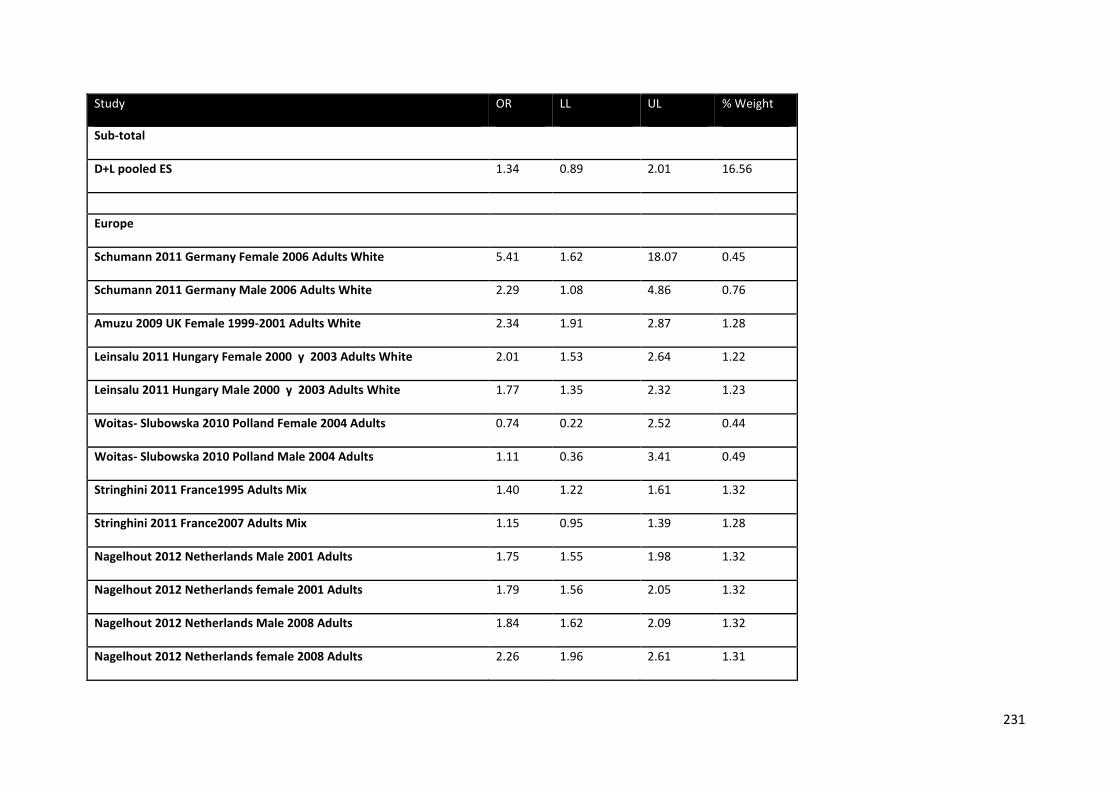
231
Study OR LL UL % Weight
Sub-total
D+L pooled ES 1.34 0.89 2.01 16.56
Europe
Schumann 2011 Germany Female 2006 Adults White 5.41 1.62 18.07 0.45
Schumann 2011 Germany Male 2006 Adults White 2.29 1.08 4.86 0.76
Amuzu 2009 UK Female 1999-2001 Adults White 2.34 1.91 2.87 1.28
Leinsalu 2011 Hungary Female 2000 y 2003 Adults White 2.01 1.53 2.64 1.22
Leinsalu 2011 Hungary Male 2000 y 2003 Adults White 1.77 1.35 2.32 1.23
Woitas- Slubowska 2010 Polland Female 2004 Adults 0.74 0.22 2.52 0.44
Woitas- Slubowska 2010 Polland Male 2004 Adults 1.11 0.36 3.41 0.49
Stringhini 2011 France1995 Adults Mix 1.40 1.22 1.61 1.32
Stringhini 2011 France2007 Adults Mix 1.15 0.95 1.39 1.28
Nagelhout 2012 Netherlands Male 2001 Adults 1.75 1.55 1.98 1.32
Nagelhout 2012 Netherlands female 2001 Adults 1.79 1.56 2.05 1.32
Nagelhout 2012 Netherlands Male 2008 Adults 1.84 1.62 2.09 1.32
Nagelhout 2012 Netherlands female 2008 Adults 2.26 1.96 2.61 1.31
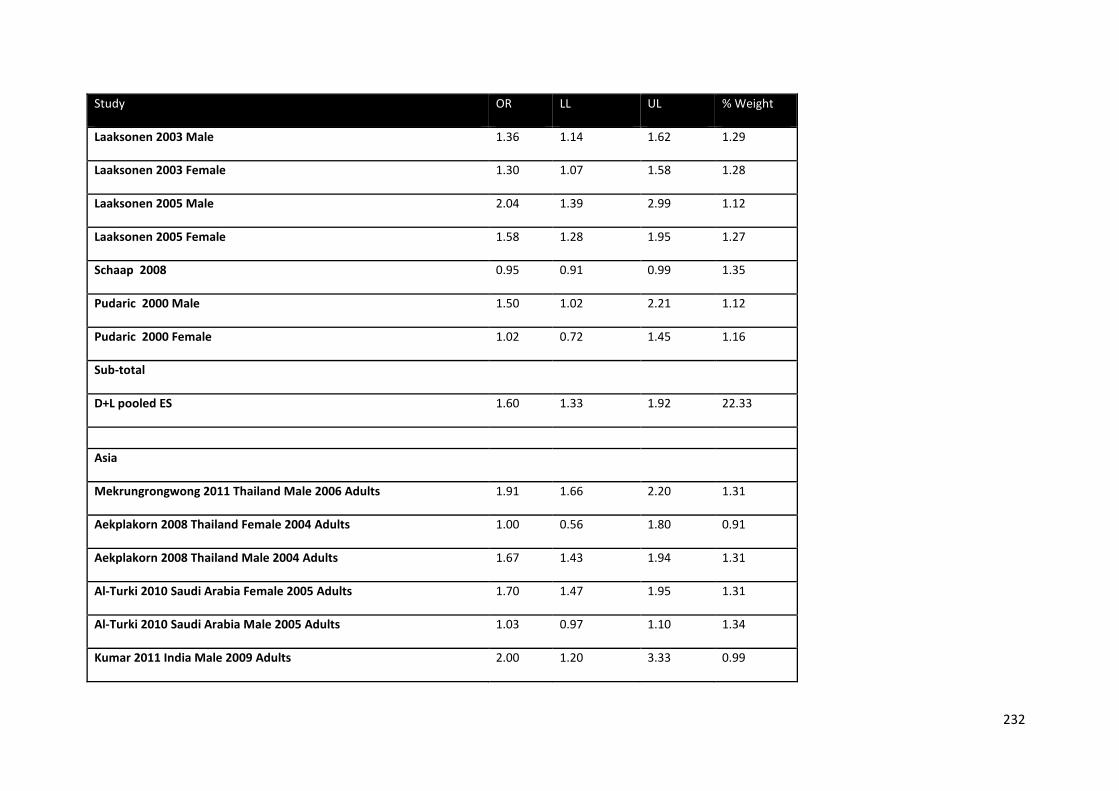
232
Study OR LL UL % Weight
Laaksonen 2003 Male 1.36 1.14 1.62 1.29
Laaksonen 2003 Female 1.30 1.07 1.58 1.28
Laaksonen 2005 Male 2.04 1.39 2.99 1.12
Laaksonen 2005 Female 1.58 1.28 1.95 1.27
Schaap 2008 0.95 0.91 0.99 1.35
Pudaric 2000 Male 1.50 1.02 2.21 1.12
Pudaric 2000 Female 1.02 0.72 1.45 1.16
Sub-total
D+L pooled ES 1.60 1.33 1.92 22.33
Asia
Mekrungrongwong 2011 Thailand Male 2006 Adults 1.91 1.66 2.20 1.31
Aekplakorn 2008 Thailand Female 2004 Adults 1.00 0.56 1.80 0.91
Aekplakorn 2008 Thailand Male 2004 Adults 1.67 1.43 1.94 1.31
Al-Turki 2010 Saudi Arabia Female 2005 Adults 1.70 1.47 1.95 1.31
Al-Turki 2010 Saudi Arabia Male 2005 Adults 1.03 0.97 1.10 1.34
Kumar 2011 India Male 2009 Adults 2.00 1.20 3.33 0.99
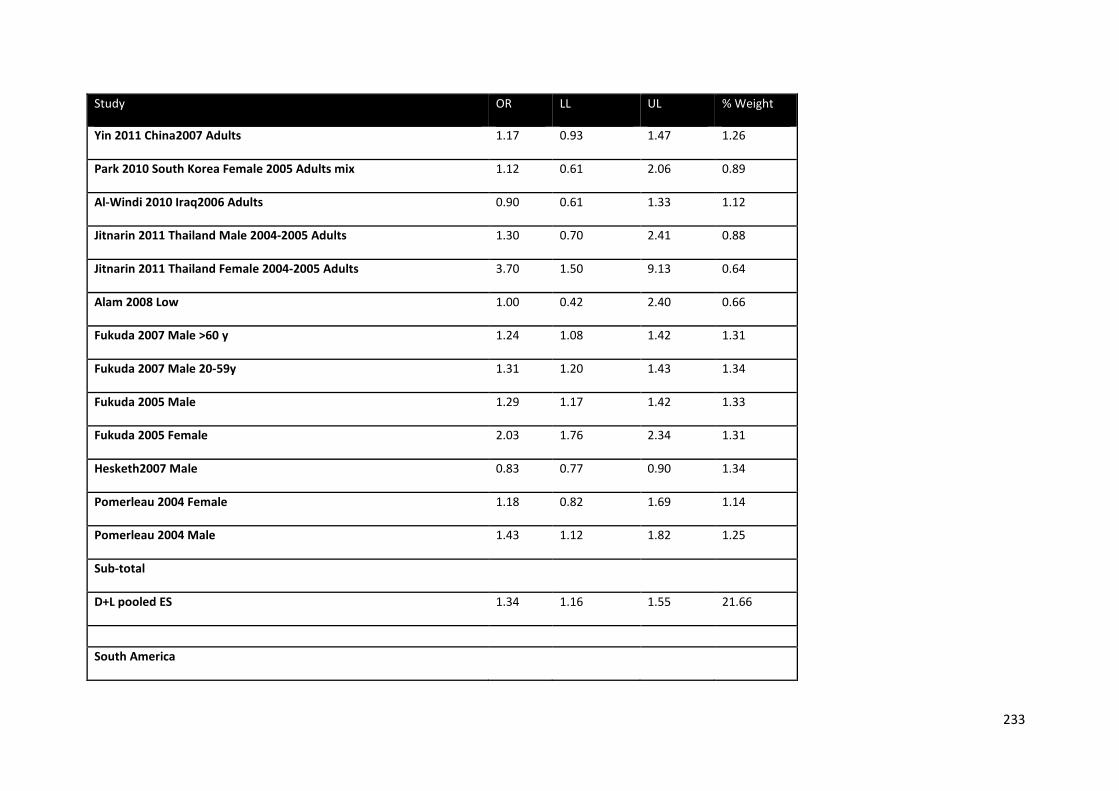
233
Study OR LL UL % Weight
Yin 2011 China2007 Adults 1.17 0.93 1.47 1.26
Park 2010 South Korea Female 2005 Adults mix 1.12 0.61 2.06 0.89
Al-Windi 2010 Iraq2006 Adults 0.90 0.61 1.33 1.12
Jitnarin 2011 Thailand Male 2004-2005 Adults 1.30 0.70 2.41 0.88
Jitnarin 2011 Thailand Female 2004-2005 Adults 3.70 1.50 9.13 0.64
Alam 2008 Low 1.00 0.42 2.40 0.66
Fukuda 2007 Male >60 y 1.24 1.08 1.42 1.31
Fukuda 2007 Male 20-59y 1.31 1.20 1.43 1.34
Fukuda 2005 Male 1.29 1.17 1.42 1.33
Fukuda 2005 Female 2.03 1.76 2.34 1.31
Hesketh2007 Male 0.83 0.77 0.90 1.34
Pomerleau 2004 Female 1.18 0.82 1.69 1.14
Pomerleau 2004 Male 1.43 1.12 1.82 1.25
Sub-total
D+L pooled ES 1.34 1.16 1.55 21.66
South America
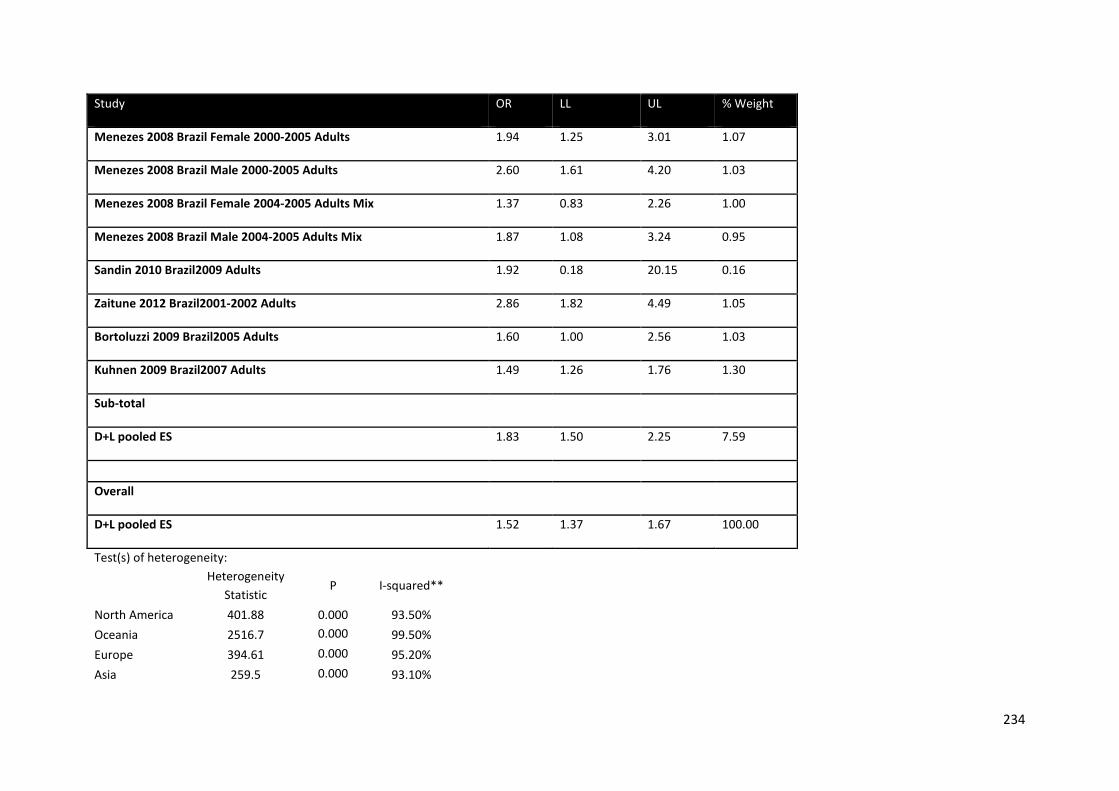
234
Study OR LL UL % Weight
Menezes 2008 Brazil Female 2000-2005 Adults 1.94 1.25 3.01 1.07
Menezes 2008 Brazil Male 2000-2005 Adults 2.60 1.61 4.20 1.03
Menezes 2008 Brazil Female 2004-2005 Adults Mix 1.37 0.83 2.26 1.00
Menezes 2008 Brazil Male 2004-2005 Adults Mix 1.87 1.08 3.24 0.95
Sandin 2010 Brazil2009 Adults 1.92 0.18 20.15 0.16
Zaitune 2012 Brazil2001-2002 Adults 2.86 1.82 4.49 1.05
Bortoluzzi 2009 Brazil2005 Adults 1.60 1.00 2.56 1.03
Kuhnen 2009 Brazil2007 Adults 1.49 1.26 1.76 1.30
Sub-total
D+L pooled ES 1.83 1.50 2.25 7.59
Overall
D+L pooled ES 1.52 1.37 1.67 100.00
Test(s) of heterogeneity:
Heterogeneity Statistic
P I-squared**
North America 401.88 0.000 93.50% Oceania 2516.7 0.000 99.50% Europe 394.61 0.000 95.20% Asia 259.5 0.000 93.10%
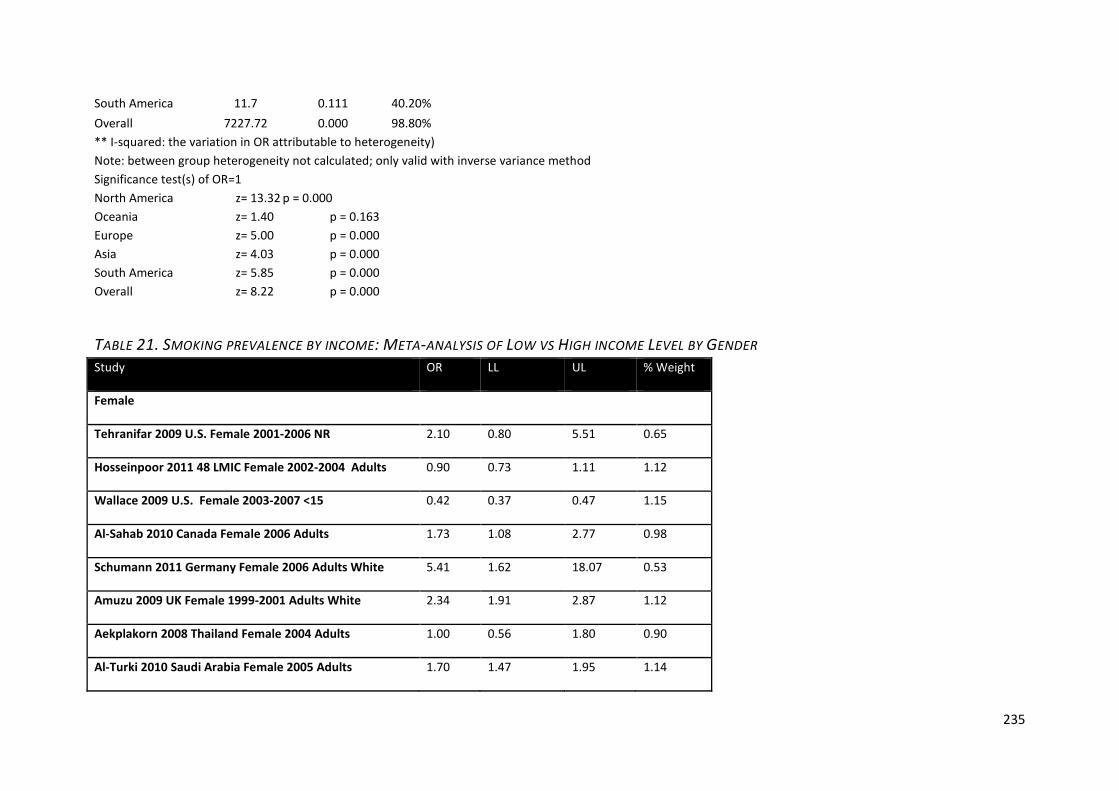
235
South America 11.7 0.111 40.20% Overall 7227.72 0.000 98.80% ** I-squared: the variation in OR attributable to heterogeneity) Note: between group heterogeneity not calculated; only valid with inverse variance method Significance test(s) of OR=1 North America z= 13.32 p = 0.000 Oceania z= 1.40 p = 0.163 Europe z= 5.00 p = 0.000 Asia z= 4.03 p = 0.000 South America z= 5.85 p = 0.000 Overall z= 8.22 p = 0.000
TABLE 21. SMOKING PREVALENCE BY INCOME: META-ANALYSIS OF LOW VS HIGH INCOME LEVEL BY GENDER Study OR LL UL % Weight
Female
Tehranifar 2009 U.S. Female 2001-2006 NR 2.10 0.80 5.51 0.65
Hosseinpoor 2011 48 LMIC Female 2002-2004 Adults 0.90 0.73 1.11 1.12
Wallace 2009 U.S. Female 2003-2007 <15 0.42 0.37 0.47 1.15
Al-Sahab 2010 Canada Female 2006 Adults 1.73 1.08 2.77 0.98
Schumann 2011 Germany Female 2006 Adults White 5.41 1.62 18.07 0.53
Amuzu 2009 UK Female 1999-2001 Adults White 2.34 1.91 2.87 1.12
Aekplakorn 2008 Thailand Female 2004 Adults 1.00 0.56 1.80 0.90
Al-Turki 2010 Saudi Arabia Female 2005 Adults 1.70 1.47 1.95 1.14
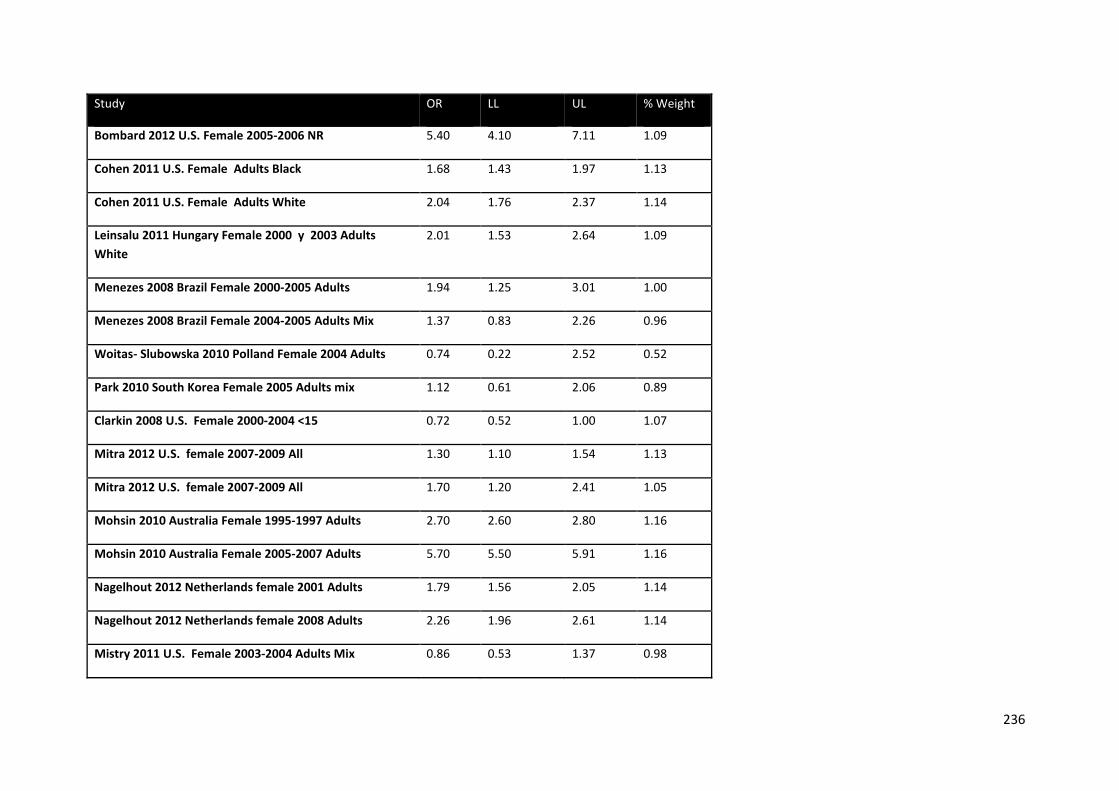
236
Study OR LL UL % Weight
Bombard 2012 U.S. Female 2005-2006 NR 5.40 4.10 7.11 1.09
Cohen 2011 U.S. Female Adults Black 1.68 1.43 1.97 1.13
Cohen 2011 U.S. Female Adults White 2.04 1.76 2.37 1.14
Leinsalu 2011 Hungary Female 2000 y 2003 Adults White
2.01 1.53 2.64 1.09
Menezes 2008 Brazil Female 2000-2005 Adults 1.94 1.25 3.01 1.00
Menezes 2008 Brazil Female 2004-2005 Adults Mix 1.37 0.83 2.26 0.96
Woitas- Slubowska 2010 Polland Female 2004 Adults 0.74 0.22 2.52 0.52
Park 2010 South Korea Female 2005 Adults mix 1.12 0.61 2.06 0.89
Clarkin 2008 U.S. Female 2000-2004 <15 0.72 0.52 1.00 1.07
Mitra 2012 U.S. female 2007-2009 All 1.30 1.10 1.54 1.13
Mitra 2012 U.S. female 2007-2009 All 1.70 1.20 2.41 1.05
Mohsin 2010 Australia Female 1995-1997 Adults 2.70 2.60 2.80 1.16
Mohsin 2010 Australia Female 2005-2007 Adults 5.70 5.50 5.91 1.16
Nagelhout 2012 Netherlands female 2001 Adults 1.79 1.56 2.05 1.14
Nagelhout 2012 Netherlands female 2008 Adults 2.26 1.96 2.61 1.14
Mistry 2011 U.S. Female 2003-2004 Adults Mix 0.86 0.53 1.37 0.98
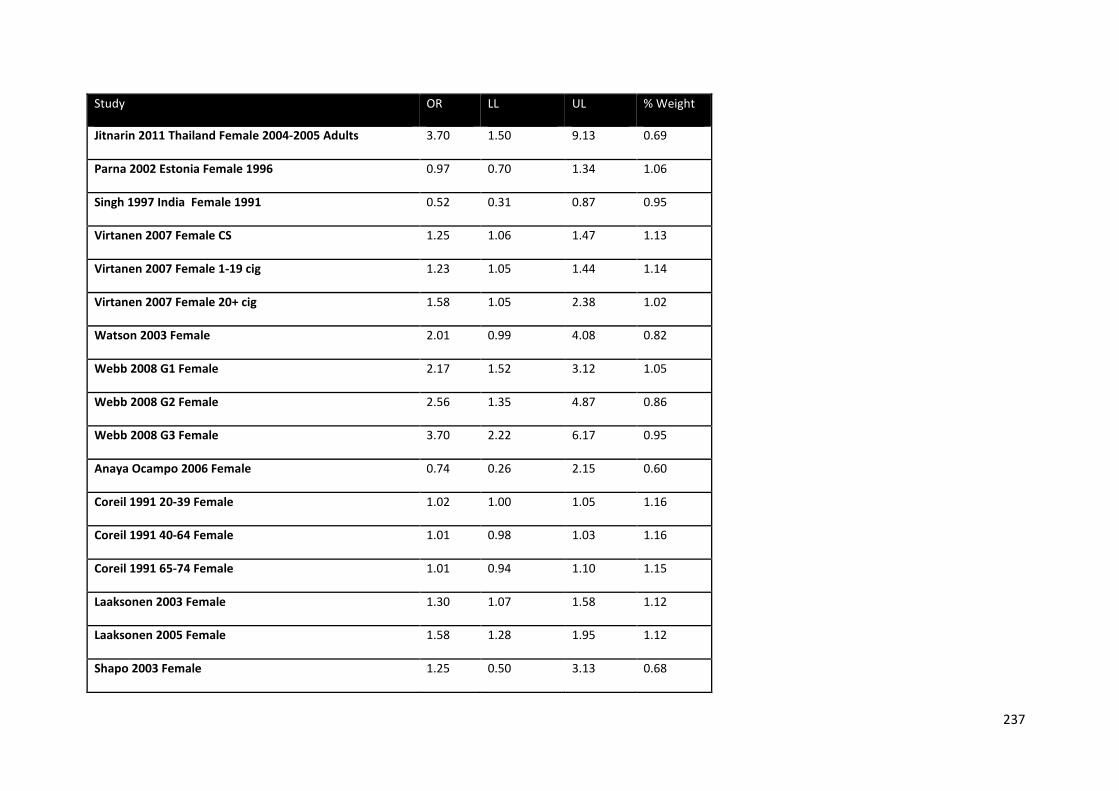
237
Study OR LL UL % Weight
Jitnarin 2011 Thailand Female 2004-2005 Adults 3.70 1.50 9.13 0.69
Parna 2002 Estonia Female 1996 0.97 0.70 1.34 1.06
Singh 1997 India Female 1991 0.52 0.31 0.87 0.95
Virtanen 2007 Female CS 1.25 1.06 1.47 1.13
Virtanen 2007 Female 1-19 cig 1.23 1.05 1.44 1.14
Virtanen 2007 Female 20+ cig 1.58 1.05 2.38 1.02
Watson 2003 Female 2.01 0.99 4.08 0.82
Webb 2008 G1 Female 2.17 1.52 3.12 1.05
Webb 2008 G2 Female 2.56 1.35 4.87 0.86
Webb 2008 G3 Female 3.70 2.22 6.17 0.95
Anaya Ocampo 2006 Female 0.74 0.26 2.15 0.60
Coreil 1991 20-39 Female 1.02 1.00 1.05 1.16
Coreil 1991 40-64 Female 1.01 0.98 1.03 1.16
Coreil 1991 65-74 Female 1.01 0.94 1.10 1.15
Laaksonen 2003 Female 1.30 1.07 1.58 1.12
Laaksonen 2005 Female 1.58 1.28 1.95 1.12
Shapo 2003 Female 1.25 0.50 3.13 0.68

238
Study OR LL UL % Weight
Siahpush 2001 Female 1.43 1.26 1.62 1.14
Erick-Peleti 2007 Female 0.87 0.41 1.85 0.79
Fukuda 2007 Female >60 y 1.98 1.56 2.51 1.11
Fukuda 2007 Female 20-59y 2.84 2.50 3.23 1.14
Gilmore 2001 Female 1.25 0.50 3.13 0.68
Kahn 2002 Female 1.90 1.40 2.58 1.08
Kahn 2005 Female 2.80 1.70 4.61 0.96
Kiefe 2001 Female 0.93 0.43 2.01 0.78
Samet 1992 Female 4.17 1.67 10.42 0.68
Kim 2006-JPMPH Female 3.81 2.90 5.01 1.09
Fukuda 2005 Female 2.03 1.76 2.34 1.14
Pudaric 2000 Female 1.02 0.72 1.45 1.05
Pudule 1999 Female 0.95 0.66 1.38 1.04
Pomerleau 2004 Female 1.18 0.82 1.69 1.05
Sub-total
D+L pooled ES 1.59 1.30 1.93 54.62
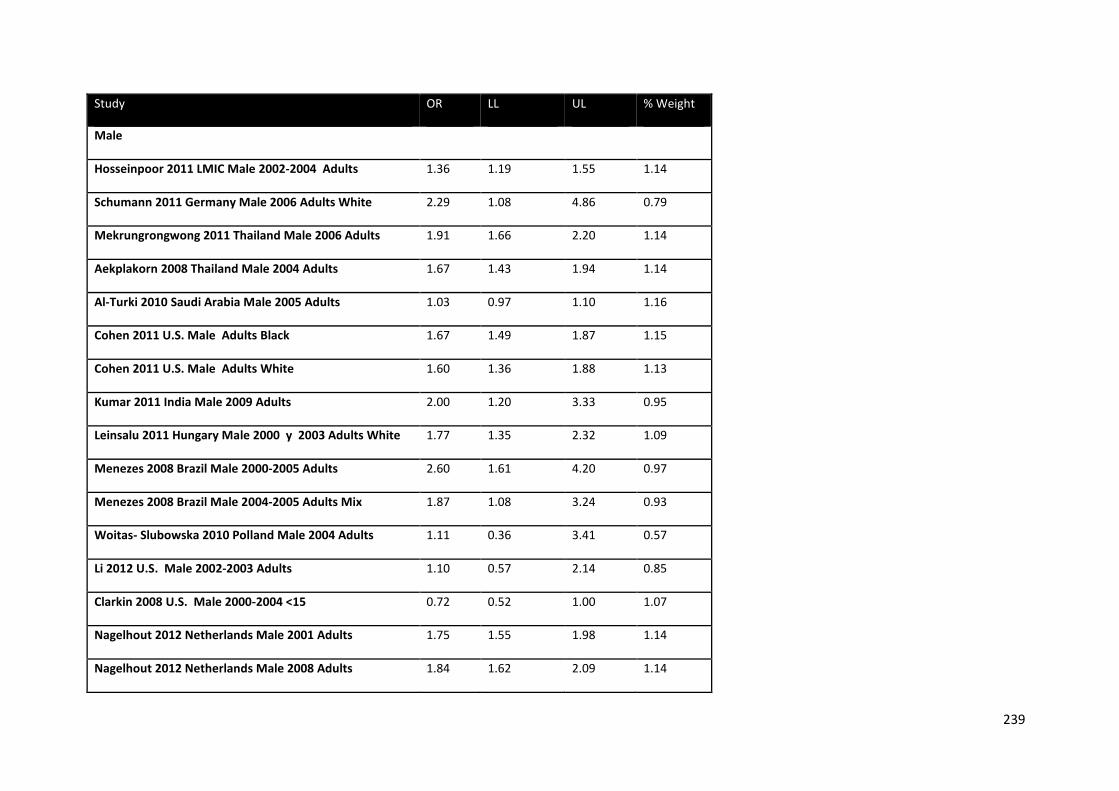
239
Study OR LL UL % Weight
Male
Hosseinpoor 2011 LMIC Male 2002-2004 Adults 1.36 1.19 1.55 1.14
Schumann 2011 Germany Male 2006 Adults White 2.29 1.08 4.86 0.79
Mekrungrongwong 2011 Thailand Male 2006 Adults 1.91 1.66 2.20 1.14
Aekplakorn 2008 Thailand Male 2004 Adults 1.67 1.43 1.94 1.14
Al-Turki 2010 Saudi Arabia Male 2005 Adults 1.03 0.97 1.10 1.16
Cohen 2011 U.S. Male Adults Black 1.67 1.49 1.87 1.15
Cohen 2011 U.S. Male Adults White 1.60 1.36 1.88 1.13
Kumar 2011 India Male 2009 Adults 2.00 1.20 3.33 0.95
Leinsalu 2011 Hungary Male 2000 y 2003 Adults White 1.77 1.35 2.32 1.09
Menezes 2008 Brazil Male 2000-2005 Adults 2.60 1.61 4.20 0.97
Menezes 2008 Brazil Male 2004-2005 Adults Mix 1.87 1.08 3.24 0.93
Woitas- Slubowska 2010 Polland Male 2004 Adults 1.11 0.36 3.41 0.57
Li 2012 U.S. Male 2002-2003 Adults 1.10 0.57 2.14 0.85
Clarkin 2008 U.S. Male 2000-2004 <15 0.72 0.52 1.00 1.07
Nagelhout 2012 Netherlands Male 2001 Adults 1.75 1.55 1.98 1.14
Nagelhout 2012 Netherlands Male 2008 Adults 1.84 1.62 2.09 1.14
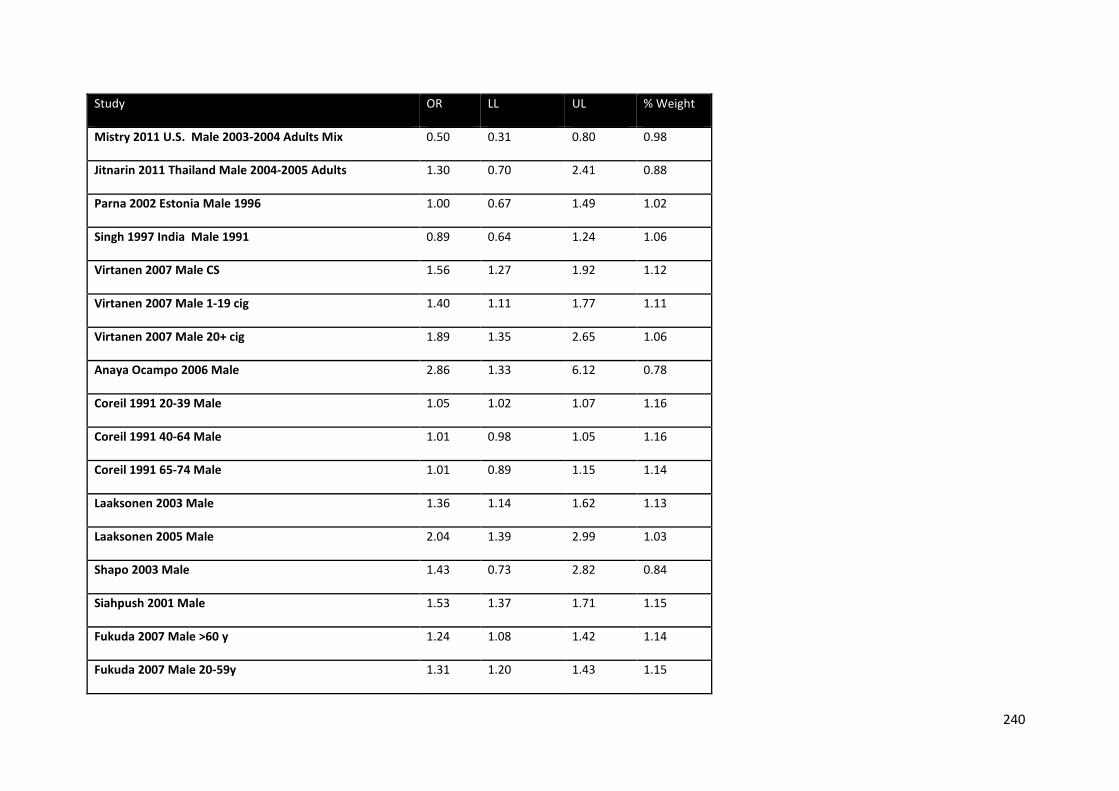
240
Study OR LL UL % Weight
Mistry 2011 U.S. Male 2003-2004 Adults Mix 0.50 0.31 0.80 0.98
Jitnarin 2011 Thailand Male 2004-2005 Adults 1.30 0.70 2.41 0.88
Parna 2002 Estonia Male 1996 1.00 0.67 1.49 1.02
Singh 1997 India Male 1991 0.89 0.64 1.24 1.06
Virtanen 2007 Male CS 1.56 1.27 1.92 1.12
Virtanen 2007 Male 1-19 cig 1.40 1.11 1.77 1.11
Virtanen 2007 Male 20+ cig 1.89 1.35 2.65 1.06
Anaya Ocampo 2006 Male 2.86 1.33 6.12 0.78
Coreil 1991 20-39 Male 1.05 1.02 1.07 1.16
Coreil 1991 40-64 Male 1.01 0.98 1.05 1.16
Coreil 1991 65-74 Male 1.01 0.89 1.15 1.14
Laaksonen 2003 Male 1.36 1.14 1.62 1.13
Laaksonen 2005 Male 2.04 1.39 2.99 1.03
Shapo 2003 Male 1.43 0.73 2.82 0.84
Siahpush 2001 Male 1.53 1.37 1.71 1.15
Fukuda 2007 Male >60 y 1.24 1.08 1.42 1.14
Fukuda 2007 Male 20-59y 1.31 1.20 1.43 1.15

241
Study OR LL UL % Weight
Gilmore 2001 Male 1.32 0.67 2.60 0.84
Khuwaja 2004 Male 0.91 0.59 1.41 1.00
Kiefe 2001 Male 2.96 1.41 6.21 0.80
Samet 1992 Male 2.70 1.35 5.41 0.83
Rahman 2005 Male 1.22 0.75 1.99 0.97
Kim 2006-JPMPH Male 1.34 1.18 1.52 1.14
Fukuda 2005 Male 1.29 1.17 1.42 1.15
Hesketh2007 Male 0.83 0.77 0.90 1.15
Pudaric 2000 Male 1.50 1.02 2.21 1.03
Pudule 1999 Male 1.82 1.41 2.35 1.10
Pomerleau 2004 Male 1.43 1.12 1.82 1.11
Sub-total
D+L pooled ES 1.38 1.27 1.49 45.38
Overall
D+L pooled ES 1.51 1.34 1.69 100.00
Test(s) of heterogeneity:
Heterogeneity Statistic P I-squared**
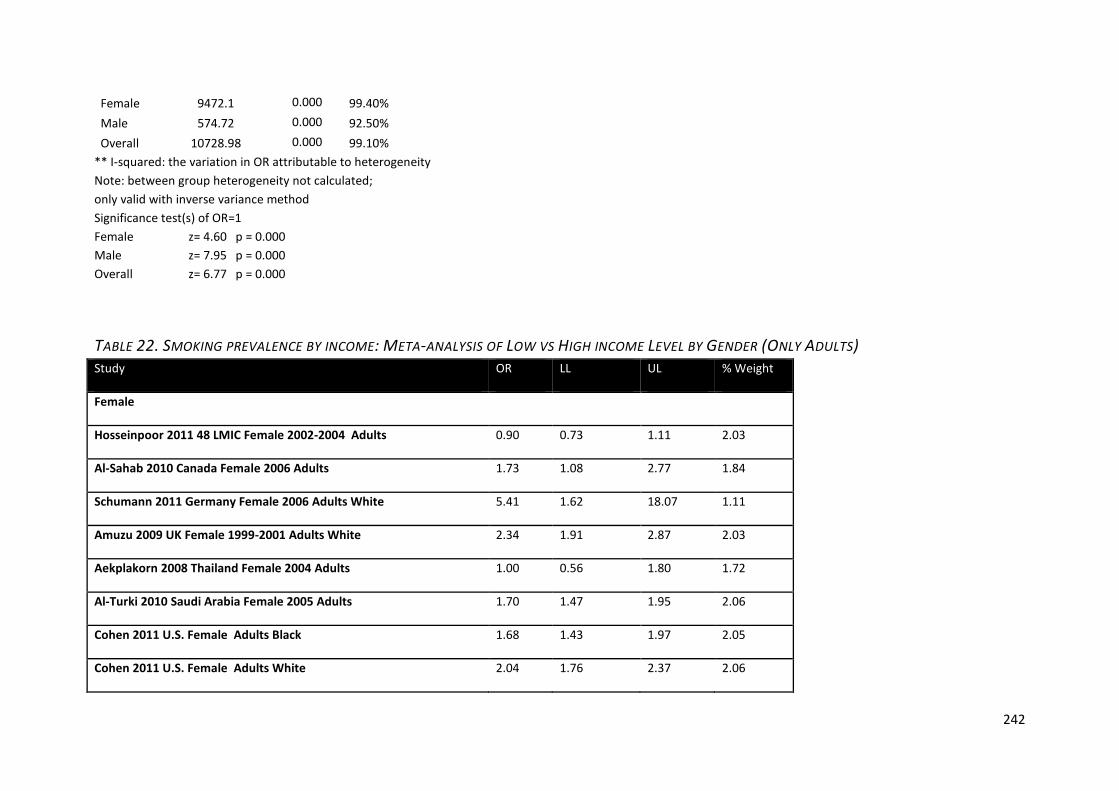
242
Female 9472.1 0.000 99.40% Male 574.72 0.000 92.50% Overall 10728.98 0.000 99.10%
** I-squared: the variation in OR attributable to heterogeneity Note: between group heterogeneity not calculated; only valid with inverse variance method Significance test(s) of OR=1 Female z= 4.60 p = 0.000 Male z= 7.95 p = 0.000 Overall z= 6.77 p = 0.000
TABLE 22. SMOKING PREVALENCE BY INCOME: META-ANALYSIS OF LOW VS HIGH INCOME LEVEL BY GENDER (ONLY ADULTS) Study OR LL UL % Weight
Female
Hosseinpoor 2011 48 LMIC Female 2002-2004 Adults 0.90 0.73 1.11 2.03
Al-Sahab 2010 Canada Female 2006 Adults 1.73 1.08 2.77 1.84
Schumann 2011 Germany Female 2006 Adults White 5.41 1.62 18.07 1.11
Amuzu 2009 UK Female 1999-2001 Adults White 2.34 1.91 2.87 2.03
Aekplakorn 2008 Thailand Female 2004 Adults 1.00 0.56 1.80 1.72
Al-Turki 2010 Saudi Arabia Female 2005 Adults 1.70 1.47 1.95 2.06
Cohen 2011 U.S. Female Adults Black 1.68 1.43 1.97 2.05
Cohen 2011 U.S. Female Adults White 2.04 1.76 2.37 2.06
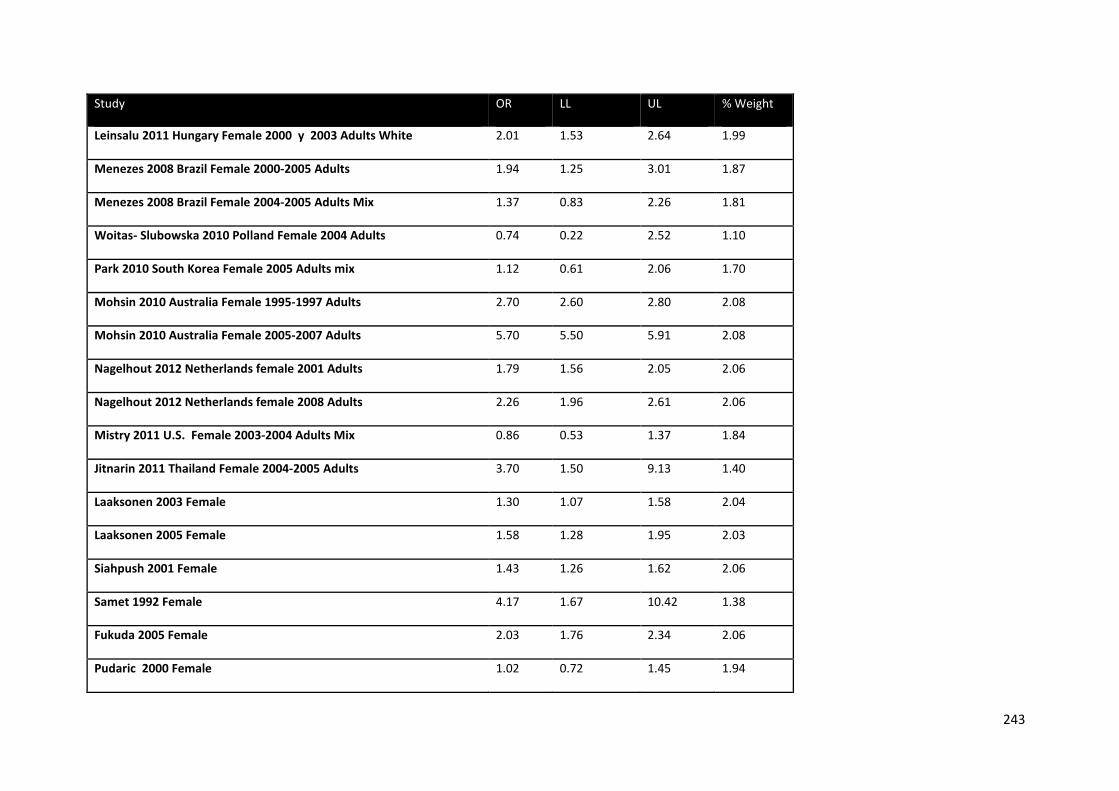
243
Study OR LL UL % Weight
Leinsalu 2011 Hungary Female 2000 y 2003 Adults White 2.01 1.53 2.64 1.99
Menezes 2008 Brazil Female 2000-2005 Adults 1.94 1.25 3.01 1.87
Menezes 2008 Brazil Female 2004-2005 Adults Mix 1.37 0.83 2.26 1.81
Woitas- Slubowska 2010 Polland Female 2004 Adults 0.74 0.22 2.52 1.10
Park 2010 South Korea Female 2005 Adults mix 1.12 0.61 2.06 1.70
Mohsin 2010 Australia Female 1995-1997 Adults 2.70 2.60 2.80 2.08
Mohsin 2010 Australia Female 2005-2007 Adults 5.70 5.50 5.91 2.08
Nagelhout 2012 Netherlands female 2001 Adults 1.79 1.56 2.05 2.06
Nagelhout 2012 Netherlands female 2008 Adults 2.26 1.96 2.61 2.06
Mistry 2011 U.S. Female 2003-2004 Adults Mix 0.86 0.53 1.37 1.84
Jitnarin 2011 Thailand Female 2004-2005 Adults 3.70 1.50 9.13 1.40
Laaksonen 2003 Female 1.30 1.07 1.58 2.04
Laaksonen 2005 Female 1.58 1.28 1.95 2.03
Siahpush 2001 Female 1.43 1.26 1.62 2.06
Samet 1992 Female 4.17 1.67 10.42 1.38
Fukuda 2005 Female 2.03 1.76 2.34 2.06
Pudaric 2000 Female 1.02 0.72 1.45 1.94
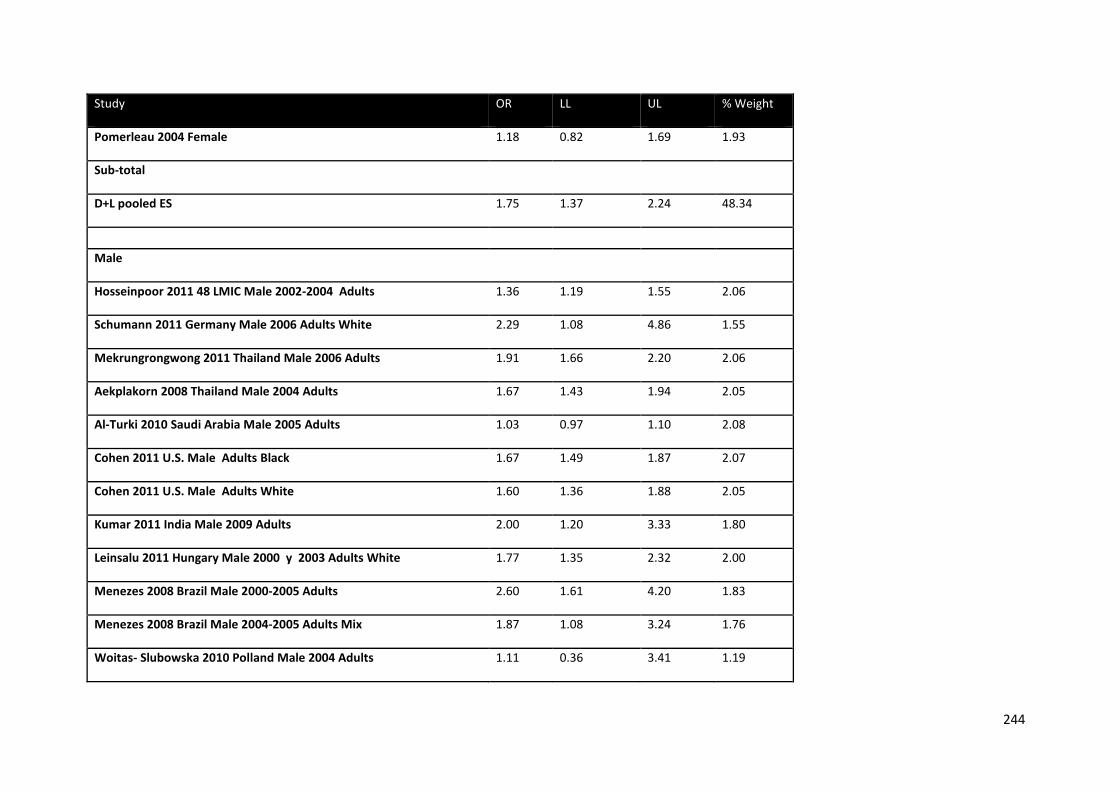
244
Study OR LL UL % Weight
Pomerleau 2004 Female 1.18 0.82 1.69 1.93
Sub-total
D+L pooled ES 1.75 1.37 2.24 48.34
Male
Hosseinpoor 2011 48 LMIC Male 2002-2004 Adults 1.36 1.19 1.55 2.06
Schumann 2011 Germany Male 2006 Adults White 2.29 1.08 4.86 1.55
Mekrungrongwong 2011 Thailand Male 2006 Adults 1.91 1.66 2.20 2.06
Aekplakorn 2008 Thailand Male 2004 Adults 1.67 1.43 1.94 2.05
Al-Turki 2010 Saudi Arabia Male 2005 Adults 1.03 0.97 1.10 2.08
Cohen 2011 U.S. Male Adults Black 1.67 1.49 1.87 2.07
Cohen 2011 U.S. Male Adults White 1.60 1.36 1.88 2.05
Kumar 2011 India Male 2009 Adults 2.00 1.20 3.33 1.80
Leinsalu 2011 Hungary Male 2000 y 2003 Adults White 1.77 1.35 2.32 2.00
Menezes 2008 Brazil Male 2000-2005 Adults 2.60 1.61 4.20 1.83
Menezes 2008 Brazil Male 2004-2005 Adults Mix 1.87 1.08 3.24 1.76
Woitas- Slubowska 2010 Polland Male 2004 Adults 1.11 0.36 3.41 1.19
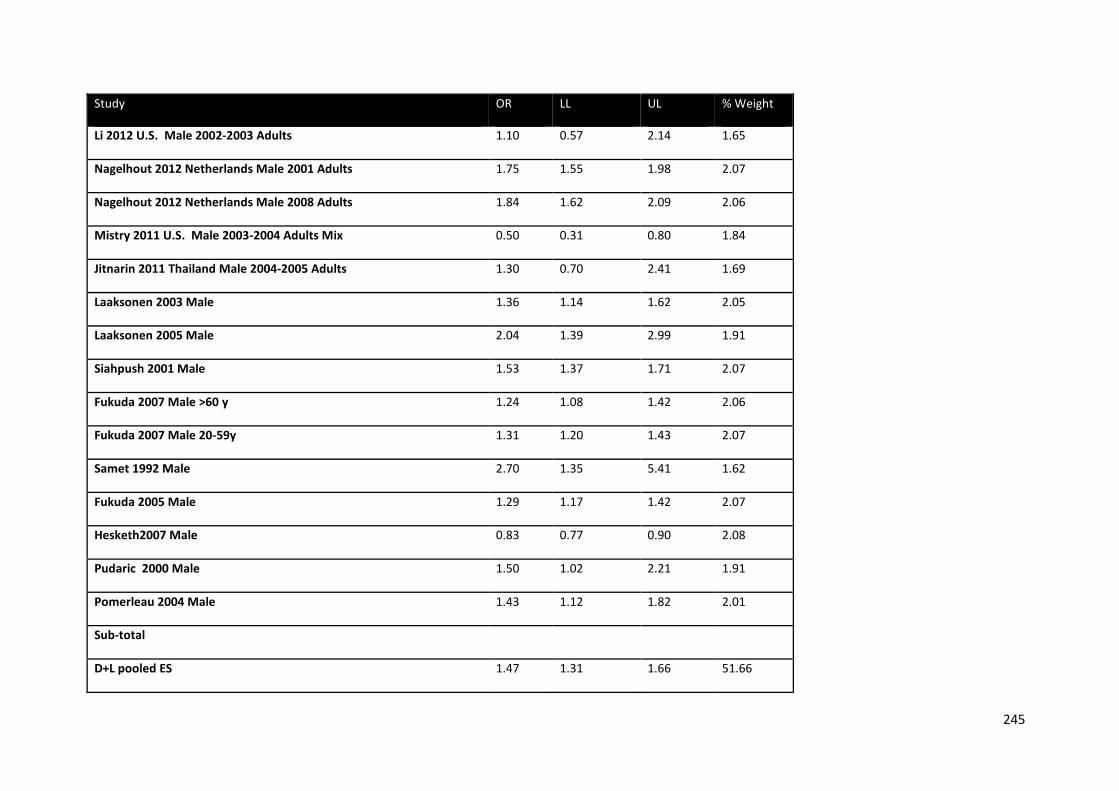
245
Study OR LL UL % Weight
Li 2012 U.S. Male 2002-2003 Adults 1.10 0.57 2.14 1.65
Nagelhout 2012 Netherlands Male 2001 Adults 1.75 1.55 1.98 2.07
Nagelhout 2012 Netherlands Male 2008 Adults 1.84 1.62 2.09 2.06
Mistry 2011 U.S. Male 2003-2004 Adults Mix 0.50 0.31 0.80 1.84
Jitnarin 2011 Thailand Male 2004-2005 Adults 1.30 0.70 2.41 1.69
Laaksonen 2003 Male 1.36 1.14 1.62 2.05
Laaksonen 2005 Male 2.04 1.39 2.99 1.91
Siahpush 2001 Male 1.53 1.37 1.71 2.07
Fukuda 2007 Male >60 y 1.24 1.08 1.42 2.06
Fukuda 2007 Male 20-59y 1.31 1.20 1.43 2.07
Samet 1992 Male 2.70 1.35 5.41 1.62
Fukuda 2005 Male 1.29 1.17 1.42 2.07
Hesketh2007 Male 0.83 0.77 0.90 2.08
Pudaric 2000 Male 1.50 1.02 2.21 1.91
Pomerleau 2004 Male 1.43 1.12 1.82 2.01
Sub-total
D+L pooled ES 1.47 1.31 1.66 51.66
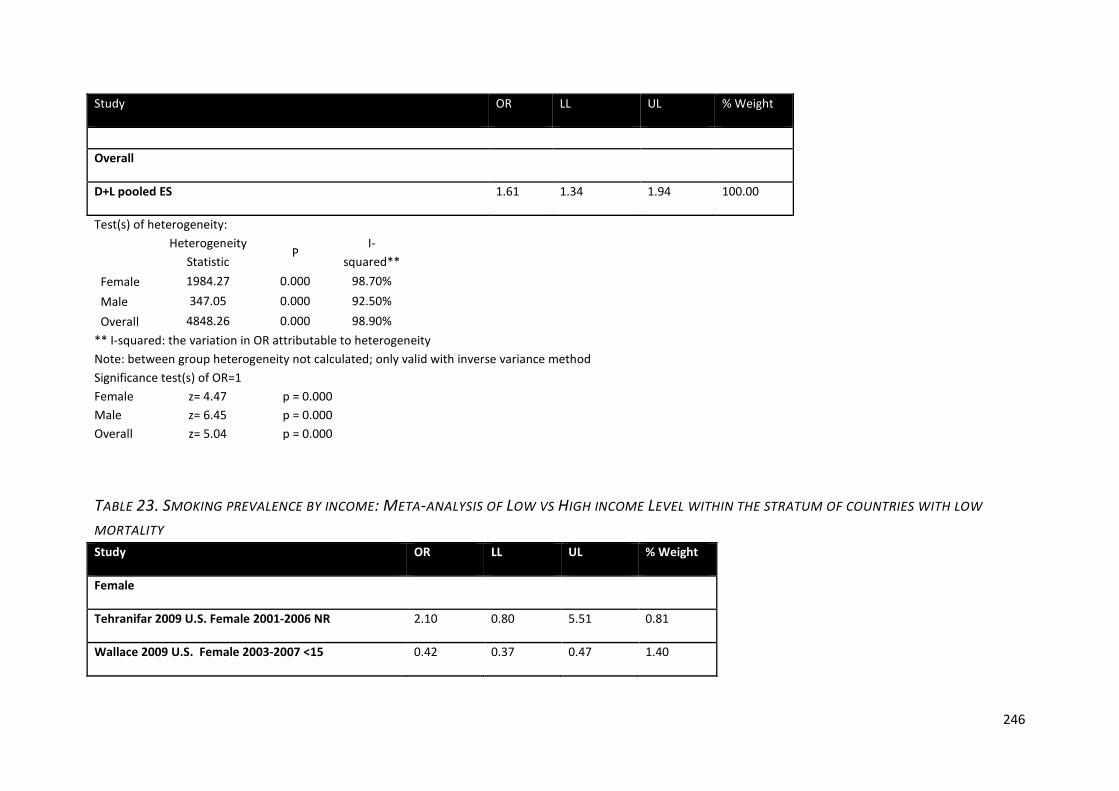
246
Study OR LL UL % Weight
Overall
D+L pooled ES 1.61 1.34 1.94 100.00
Test(s) of heterogeneity:
Heterogeneity Statistic
P I-
squared** Female 1984.27 0.000 98.70% Male 347.05 0.000 92.50% Overall 4848.26 0.000 98.90%
** I-squared: the variation in OR attributable to heterogeneity Note: between group heterogeneity not calculated; only valid with inverse variance method Significance test(s) of OR=1 Female z= 4.47 p = 0.000 Male z= 6.45 p = 0.000 Overall z= 5.04 p = 0.000
TABLE 23. SMOKING PREVALENCE BY INCOME: META-ANALYSIS OF LOW VS HIGH INCOME LEVEL WITHIN THE STRATUM OF COUNTRIES WITH LOW
MORTALITY Study OR LL UL % Weight
Female
Tehranifar 2009 U.S. Female 2001-2006 NR 2.10 0.80 5.51 0.81
Wallace 2009 U.S. Female 2003-2007 <15 0.42 0.37 0.47 1.40
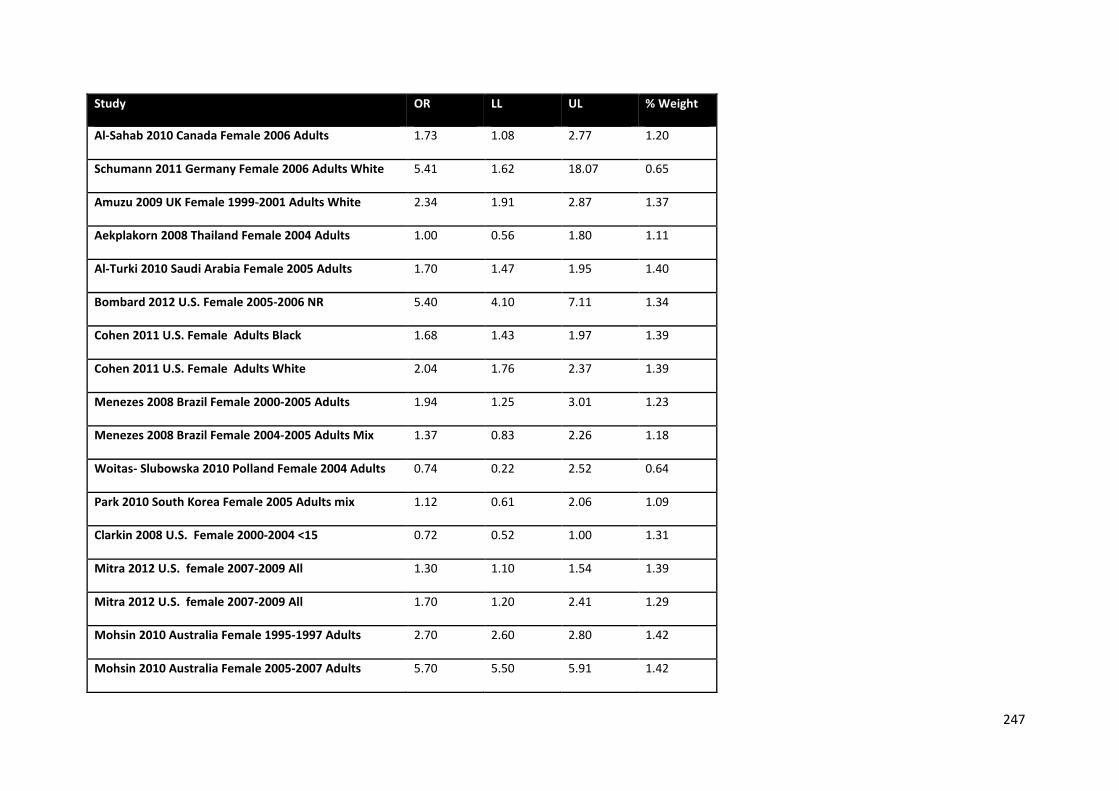
247
Study OR LL UL % Weight
Al-Sahab 2010 Canada Female 2006 Adults 1.73 1.08 2.77 1.20
Schumann 2011 Germany Female 2006 Adults White 5.41 1.62 18.07 0.65
Amuzu 2009 UK Female 1999-2001 Adults White 2.34 1.91 2.87 1.37
Aekplakorn 2008 Thailand Female 2004 Adults 1.00 0.56 1.80 1.11
Al-Turki 2010 Saudi Arabia Female 2005 Adults 1.70 1.47 1.95 1.40
Bombard 2012 U.S. Female 2005-2006 NR 5.40 4.10 7.11 1.34
Cohen 2011 U.S. Female Adults Black 1.68 1.43 1.97 1.39
Cohen 2011 U.S. Female Adults White 2.04 1.76 2.37 1.39
Menezes 2008 Brazil Female 2000-2005 Adults 1.94 1.25 3.01 1.23
Menezes 2008 Brazil Female 2004-2005 Adults Mix 1.37 0.83 2.26 1.18
Woitas- Slubowska 2010 Polland Female 2004 Adults 0.74 0.22 2.52 0.64
Park 2010 South Korea Female 2005 Adults mix 1.12 0.61 2.06 1.09
Clarkin 2008 U.S. Female 2000-2004 <15 0.72 0.52 1.00 1.31
Mitra 2012 U.S. female 2007-2009 All 1.30 1.10 1.54 1.39
Mitra 2012 U.S. female 2007-2009 All 1.70 1.20 2.41 1.29
Mohsin 2010 Australia Female 1995-1997 Adults 2.70 2.60 2.80 1.42
Mohsin 2010 Australia Female 2005-2007 Adults 5.70 5.50 5.91 1.42
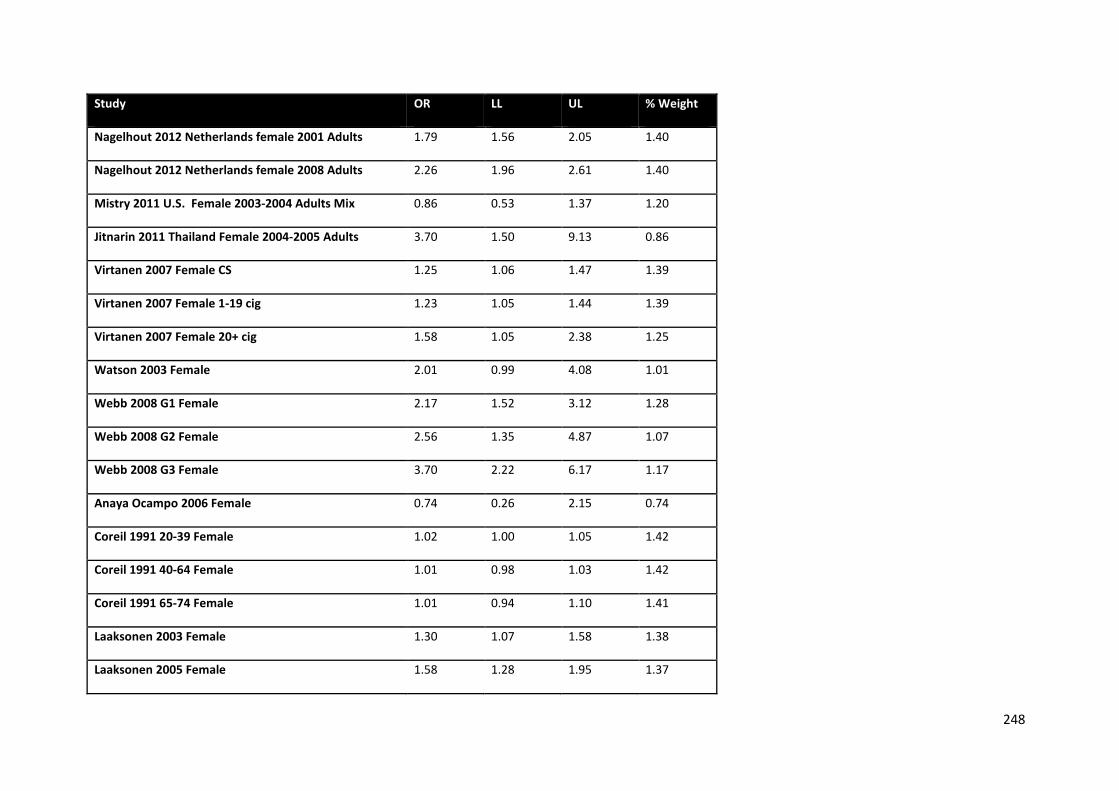
248
Study OR LL UL % Weight
Nagelhout 2012 Netherlands female 2001 Adults 1.79 1.56 2.05 1.40
Nagelhout 2012 Netherlands female 2008 Adults 2.26 1.96 2.61 1.40
Mistry 2011 U.S. Female 2003-2004 Adults Mix 0.86 0.53 1.37 1.20
Jitnarin 2011 Thailand Female 2004-2005 Adults 3.70 1.50 9.13 0.86
Virtanen 2007 Female CS 1.25 1.06 1.47 1.39
Virtanen 2007 Female 1-19 cig 1.23 1.05 1.44 1.39
Virtanen 2007 Female 20+ cig 1.58 1.05 2.38 1.25
Watson 2003 Female 2.01 0.99 4.08 1.01
Webb 2008 G1 Female 2.17 1.52 3.12 1.28
Webb 2008 G2 Female 2.56 1.35 4.87 1.07
Webb 2008 G3 Female 3.70 2.22 6.17 1.17
Anaya Ocampo 2006 Female 0.74 0.26 2.15 0.74
Coreil 1991 20-39 Female 1.02 1.00 1.05 1.42
Coreil 1991 40-64 Female 1.01 0.98 1.03 1.42
Coreil 1991 65-74 Female 1.01 0.94 1.10 1.41
Laaksonen 2003 Female 1.30 1.07 1.58 1.38
Laaksonen 2005 Female 1.58 1.28 1.95 1.37
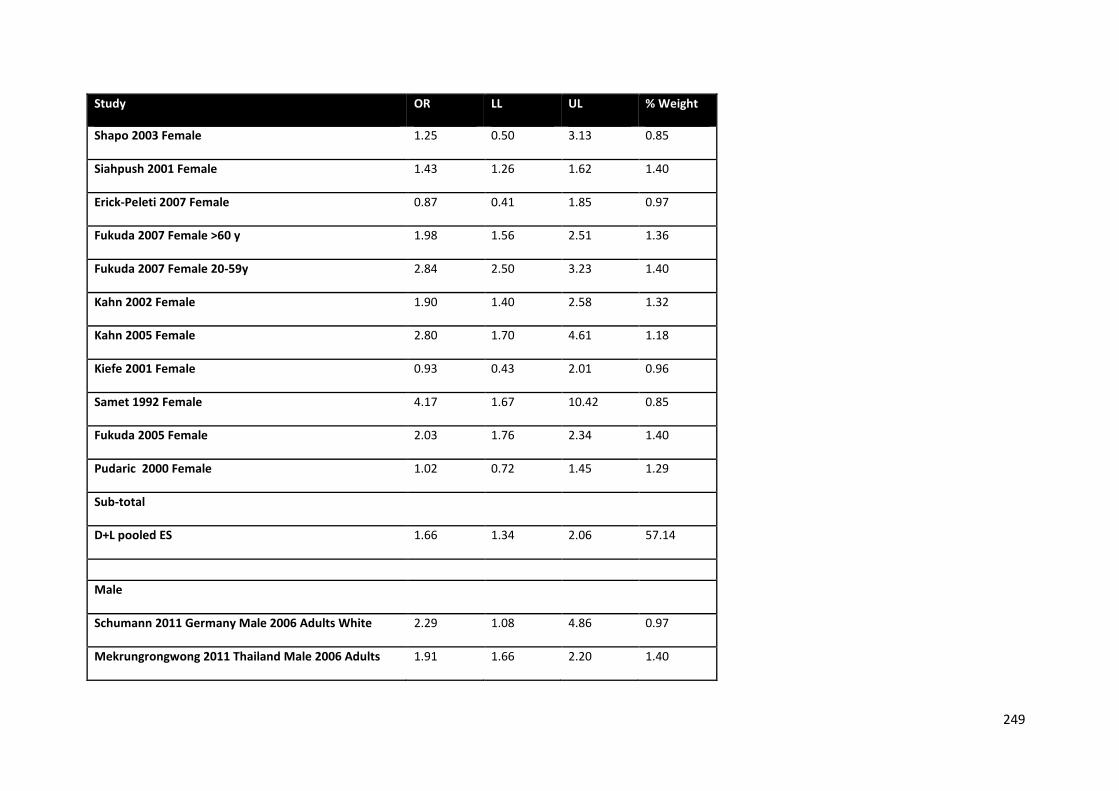
249
Study OR LL UL % Weight
Shapo 2003 Female 1.25 0.50 3.13 0.85
Siahpush 2001 Female 1.43 1.26 1.62 1.40
Erick-Peleti 2007 Female 0.87 0.41 1.85 0.97
Fukuda 2007 Female >60 y 1.98 1.56 2.51 1.36
Fukuda 2007 Female 20-59y 2.84 2.50 3.23 1.40
Kahn 2002 Female 1.90 1.40 2.58 1.32
Kahn 2005 Female 2.80 1.70 4.61 1.18
Kiefe 2001 Female 0.93 0.43 2.01 0.96
Samet 1992 Female 4.17 1.67 10.42 0.85
Fukuda 2005 Female 2.03 1.76 2.34 1.40
Pudaric 2000 Female 1.02 0.72 1.45 1.29
Sub-total
D+L pooled ES 1.66 1.34 2.06 57.14
Male
Schumann 2011 Germany Male 2006 Adults White 2.29 1.08 4.86 0.97
Mekrungrongwong 2011 Thailand Male 2006 Adults 1.91 1.66 2.20 1.40
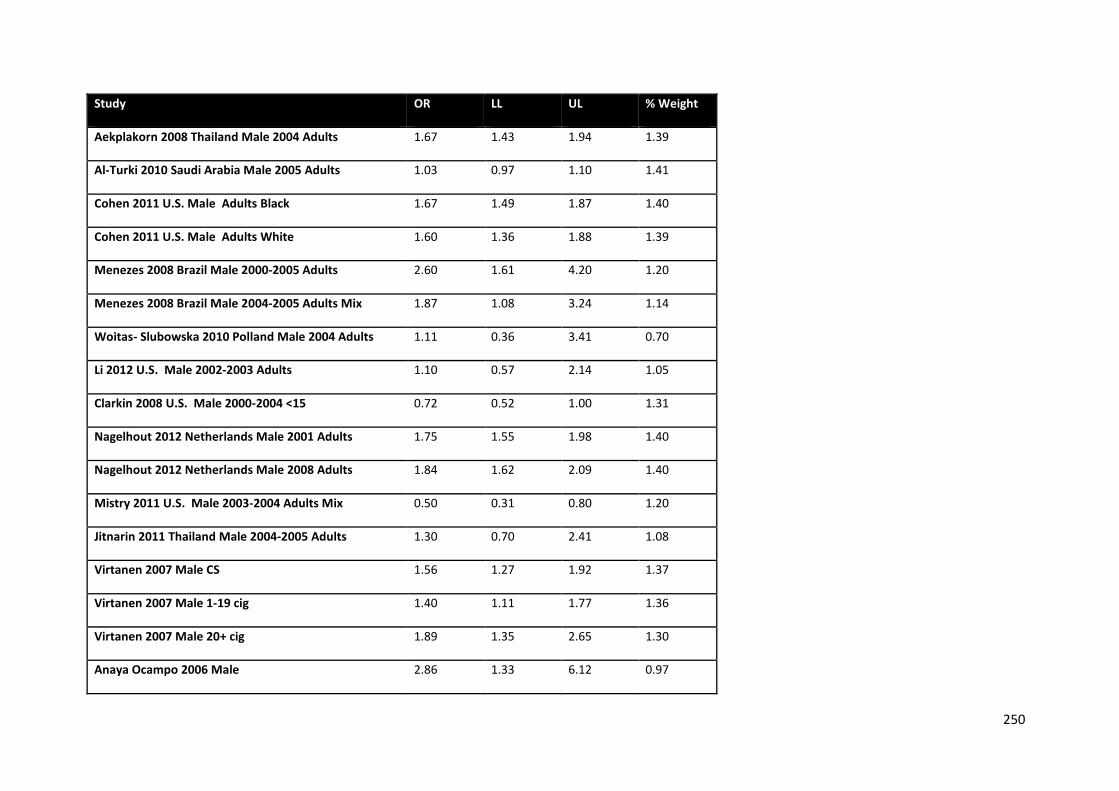
250
Study OR LL UL % Weight
Aekplakorn 2008 Thailand Male 2004 Adults 1.67 1.43 1.94 1.39
Al-Turki 2010 Saudi Arabia Male 2005 Adults 1.03 0.97 1.10 1.41
Cohen 2011 U.S. Male Adults Black 1.67 1.49 1.87 1.40
Cohen 2011 U.S. Male Adults White 1.60 1.36 1.88 1.39
Menezes 2008 Brazil Male 2000-2005 Adults 2.60 1.61 4.20 1.20
Menezes 2008 Brazil Male 2004-2005 Adults Mix 1.87 1.08 3.24 1.14
Woitas- Slubowska 2010 Polland Male 2004 Adults 1.11 0.36 3.41 0.70
Li 2012 U.S. Male 2002-2003 Adults 1.10 0.57 2.14 1.05
Clarkin 2008 U.S. Male 2000-2004 <15 0.72 0.52 1.00 1.31
Nagelhout 2012 Netherlands Male 2001 Adults 1.75 1.55 1.98 1.40
Nagelhout 2012 Netherlands Male 2008 Adults 1.84 1.62 2.09 1.40
Mistry 2011 U.S. Male 2003-2004 Adults Mix 0.50 0.31 0.80 1.20
Jitnarin 2011 Thailand Male 2004-2005 Adults 1.30 0.70 2.41 1.08
Virtanen 2007 Male CS 1.56 1.27 1.92 1.37
Virtanen 2007 Male 1-19 cig 1.40 1.11 1.77 1.36
Virtanen 2007 Male 20+ cig 1.89 1.35 2.65 1.30
Anaya Ocampo 2006 Male 2.86 1.33 6.12 0.97
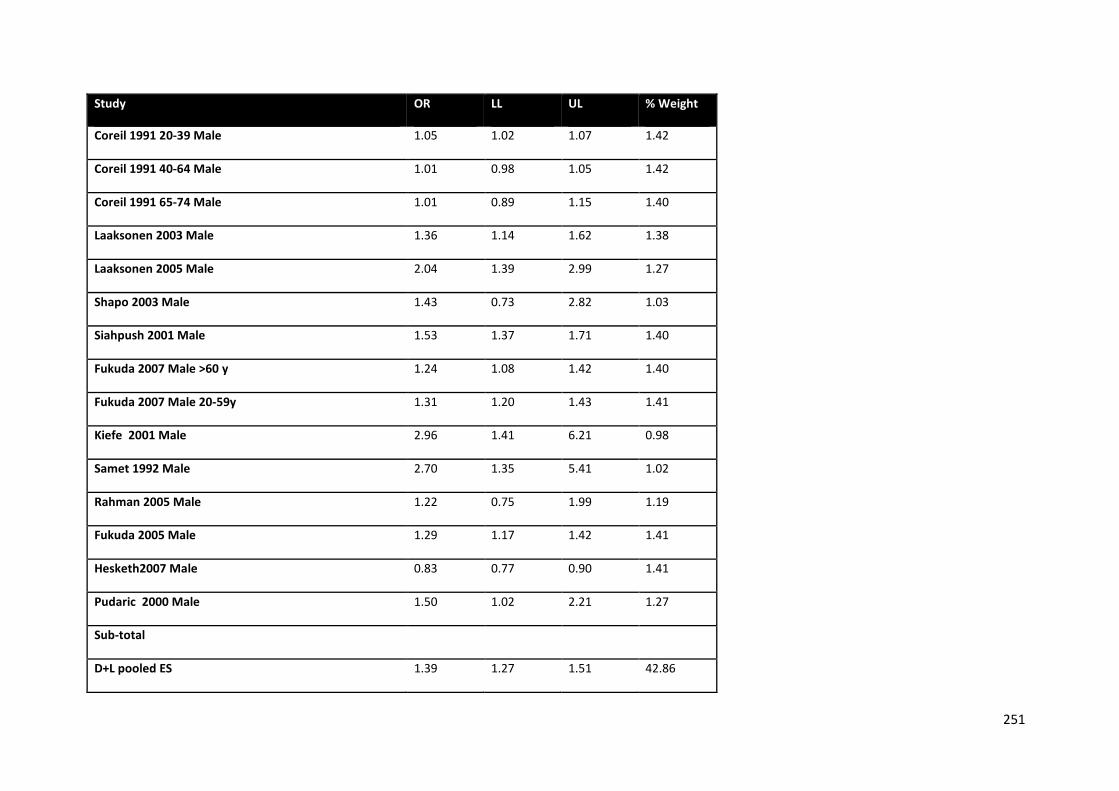
251
Study OR LL UL % Weight
Coreil 1991 20-39 Male 1.05 1.02 1.07 1.42
Coreil 1991 40-64 Male 1.01 0.98 1.05 1.42
Coreil 1991 65-74 Male 1.01 0.89 1.15 1.40
Laaksonen 2003 Male 1.36 1.14 1.62 1.38
Laaksonen 2005 Male 2.04 1.39 2.99 1.27
Shapo 2003 Male 1.43 0.73 2.82 1.03
Siahpush 2001 Male 1.53 1.37 1.71 1.40
Fukuda 2007 Male >60 y 1.24 1.08 1.42 1.40
Fukuda 2007 Male 20-59y 1.31 1.20 1.43 1.41
Kiefe 2001 Male 2.96 1.41 6.21 0.98
Samet 1992 Male 2.70 1.35 5.41 1.02
Rahman 2005 Male 1.22 0.75 1.99 1.19
Fukuda 2005 Male 1.29 1.17 1.42 1.41
Hesketh2007 Male 0.83 0.77 0.90 1.41
Pudaric 2000 Male 1.50 1.02 2.21 1.27
Sub-total
D+L pooled ES 1.39 1.27 1.51 42.86
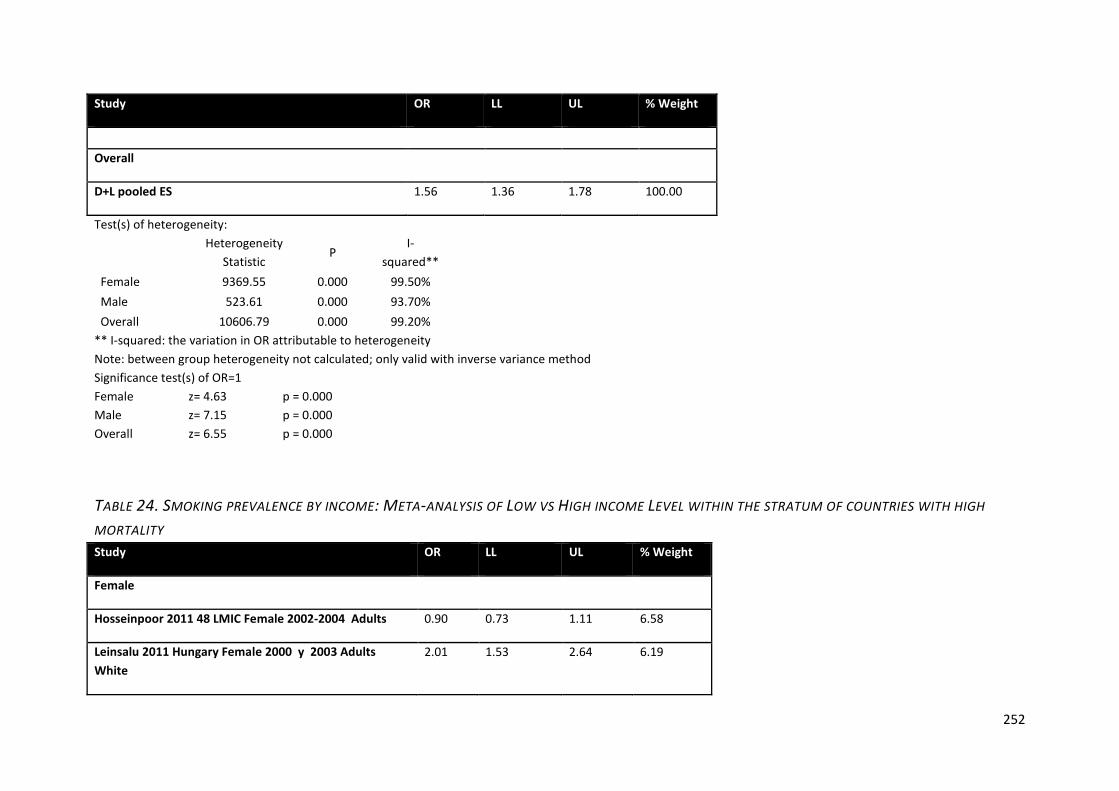
252
Study OR LL UL % Weight
Overall
D+L pooled ES 1.56 1.36 1.78 100.00
Test(s) of heterogeneity:
Heterogeneity Statistic
P I-
squared** Female 9369.55 0.000 99.50% Male 523.61 0.000 93.70% Overall 10606.79 0.000 99.20%
** I-squared: the variation in OR attributable to heterogeneity Note: between group heterogeneity not calculated; only valid with inverse variance method Significance test(s) of OR=1 Female z= 4.63 p = 0.000 Male z= 7.15 p = 0.000 Overall z= 6.55 p = 0.000
TABLE 24. SMOKING PREVALENCE BY INCOME: META-ANALYSIS OF LOW VS HIGH INCOME LEVEL WITHIN THE STRATUM OF COUNTRIES WITH HIGH
MORTALITY Study OR LL UL % Weight
Female
Hosseinpoor 2011 48 LMIC Female 2002-2004 Adults 0.90 0.73 1.11 6.58
Leinsalu 2011 Hungary Female 2000 y 2003 Adults White
2.01 1.53 2.64 6.19
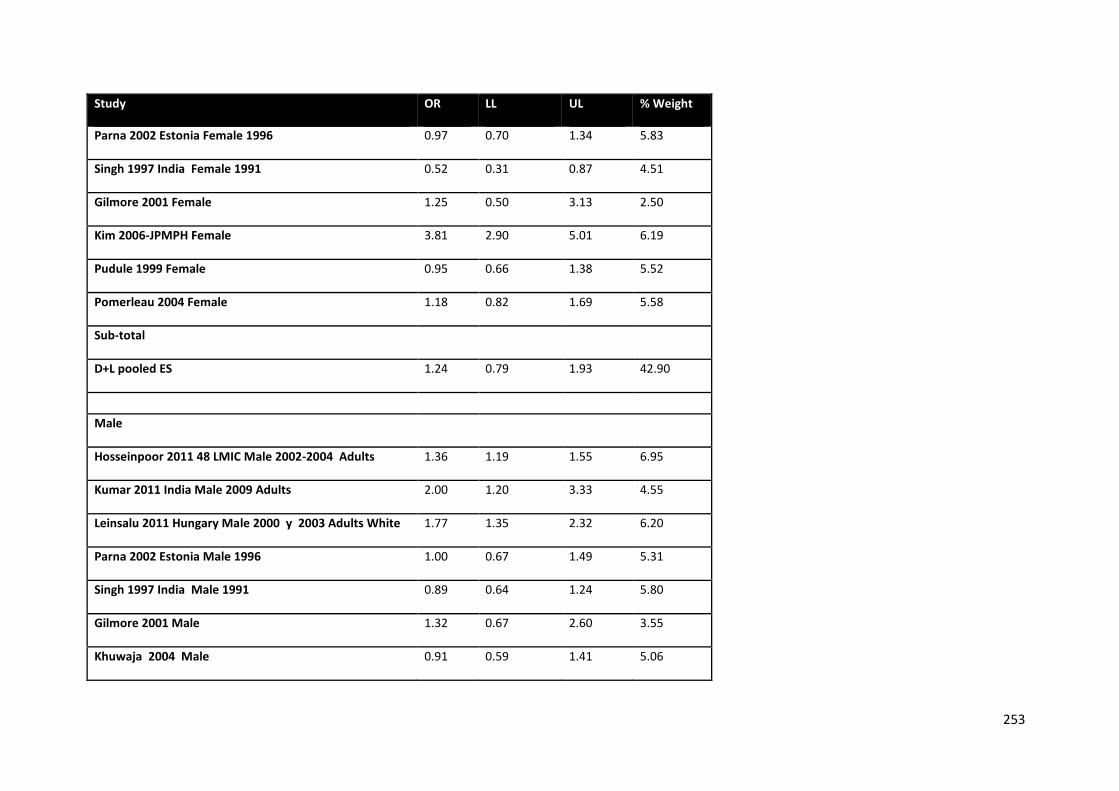
253
Study OR LL UL % Weight
Parna 2002 Estonia Female 1996 0.97 0.70 1.34 5.83
Singh 1997 India Female 1991 0.52 0.31 0.87 4.51
Gilmore 2001 Female 1.25 0.50 3.13 2.50
Kim 2006-JPMPH Female 3.81 2.90 5.01 6.19
Pudule 1999 Female 0.95 0.66 1.38 5.52
Pomerleau 2004 Female 1.18 0.82 1.69 5.58
Sub-total
D+L pooled ES 1.24 0.79 1.93 42.90
Male
Hosseinpoor 2011 48 LMIC Male 2002-2004 Adults 1.36 1.19 1.55 6.95
Kumar 2011 India Male 2009 Adults 2.00 1.20 3.33 4.55
Leinsalu 2011 Hungary Male 2000 y 2003 Adults White 1.77 1.35 2.32 6.20
Parna 2002 Estonia Male 1996 1.00 0.67 1.49 5.31
Singh 1997 India Male 1991 0.89 0.64 1.24 5.80
Gilmore 2001 Male 1.32 0.67 2.60 3.55
Khuwaja 2004 Male 0.91 0.59 1.41 5.06
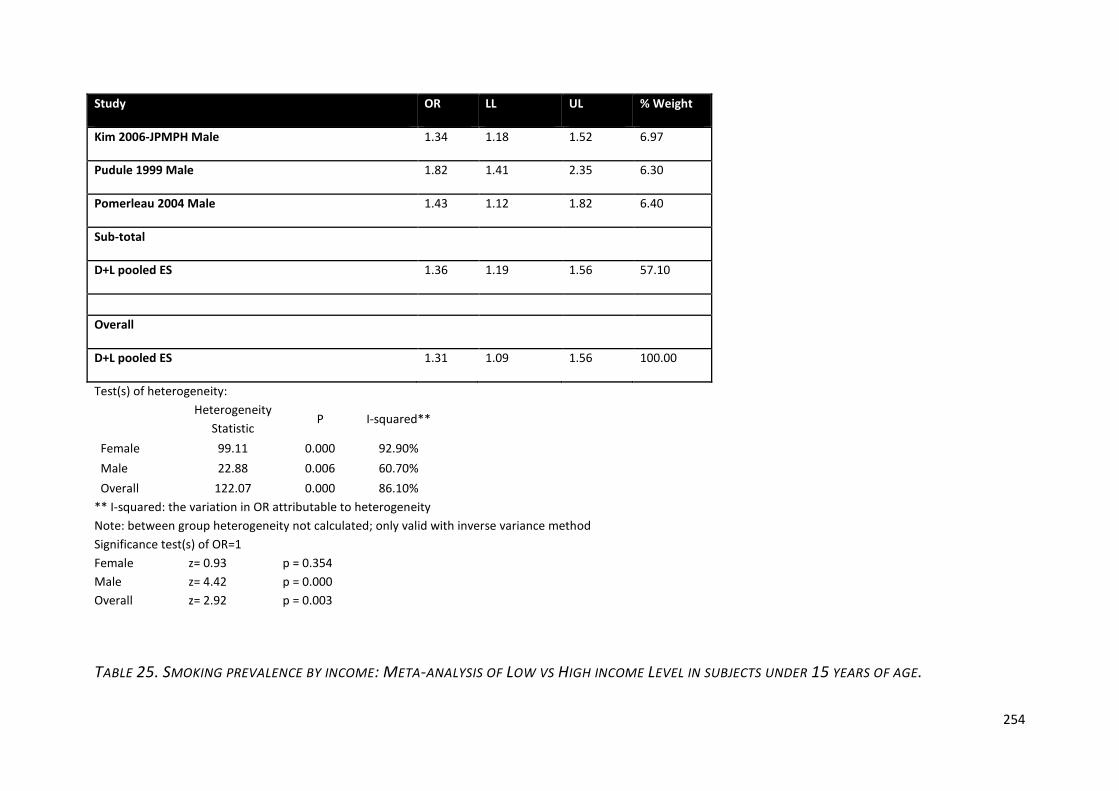
254
Study OR LL UL % Weight
Kim 2006-JPMPH Male 1.34 1.18 1.52 6.97
Pudule 1999 Male 1.82 1.41 2.35 6.30
Pomerleau 2004 Male 1.43 1.12 1.82 6.40
Sub-total
D+L pooled ES 1.36 1.19 1.56 57.10
Overall
D+L pooled ES 1.31 1.09 1.56 100.00
Test(s) of heterogeneity:
Heterogeneity Statistic
P I-squared**
Female 99.11 0.000 92.90% Male 22.88 0.006 60.70% Overall 122.07 0.000 86.10%
** I-squared: the variation in OR attributable to heterogeneity Note: between group heterogeneity not calculated; only valid with inverse variance method Significance test(s) of OR=1 Female z= 0.93 p = 0.354 Male z= 4.42 p = 0.000 Overall z= 2.92 p = 0.003
TABLE 25. SMOKING PREVALENCE BY INCOME: META-ANALYSIS OF LOW VS HIGH INCOME LEVEL IN SUBJECTS UNDER 15 YEARS OF AGE.
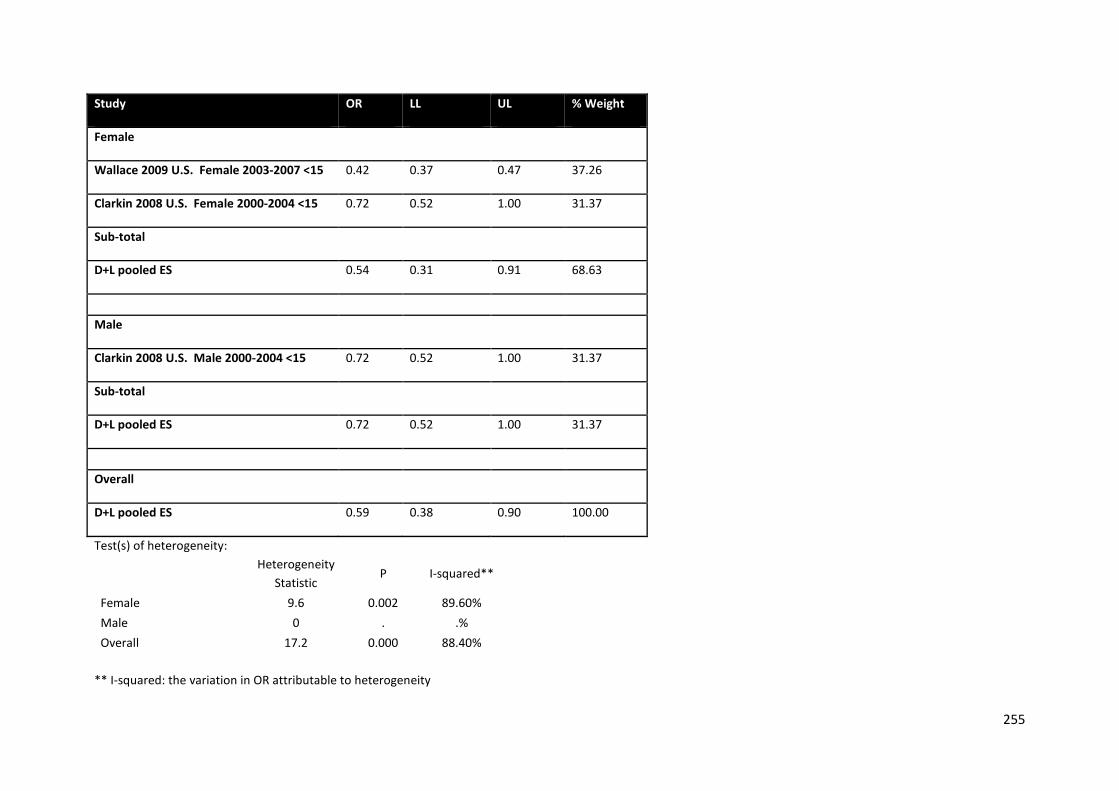
255
Study OR LL UL % Weight
Female
Wallace 2009 U.S. Female 2003-2007 <15 0.42 0.37 0.47 37.26
Clarkin 2008 U.S. Female 2000-2004 <15 0.72 0.52 1.00 31.37
Sub-total
D+L pooled ES 0.54 0.31 0.91 68.63
Male
Clarkin 2008 U.S. Male 2000-2004 <15 0.72 0.52 1.00 31.37
Sub-total
D+L pooled ES 0.72 0.52 1.00 31.37
Overall
D+L pooled ES 0.59 0.38 0.90 100.00
Test(s) of heterogeneity:
Heterogeneity Statistic
P I-squared**
Female 9.6 0.002 89.60% Male 0 . .% Overall 17.2 0.000 88.40%
** I-squared: the variation in OR attributable to heterogeneity
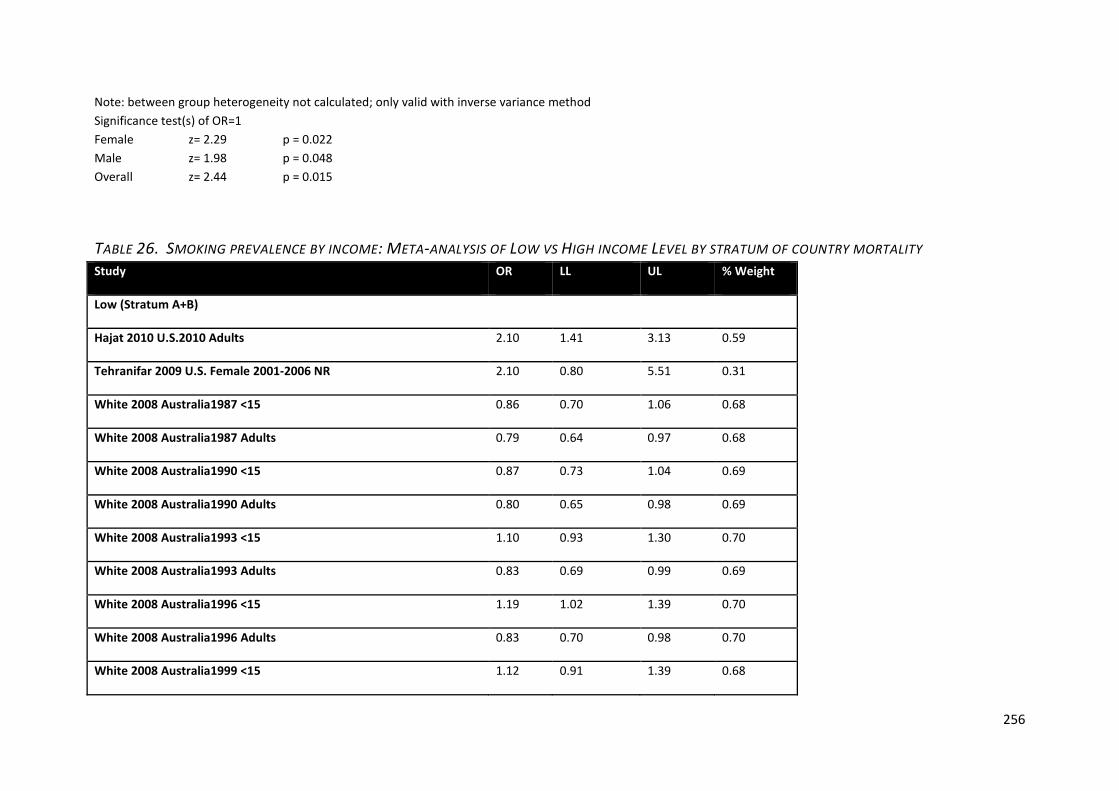
256
Note: between group heterogeneity not calculated; only valid with inverse variance method Significance test(s) of OR=1 Female z= 2.29 p = 0.022 Male z= 1.98 p = 0.048 Overall z= 2.44 p = 0.015
TABLE 26. SMOKING PREVALENCE BY INCOME: META-ANALYSIS OF LOW VS HIGH INCOME LEVEL BY STRATUM OF COUNTRY MORTALITY Study OR LL UL % Weight
Low (Stratum A+B)
Hajat 2010 U.S.2010 Adults 2.10 1.41 3.13 0.59
Tehranifar 2009 U.S. Female 2001-2006 NR 2.10 0.80 5.51 0.31
White 2008 Australia1987 <15 0.86 0.70 1.06 0.68
White 2008 Australia1987 Adults 0.79 0.64 0.97 0.68
White 2008 Australia1990 <15 0.87 0.73 1.04 0.69
White 2008 Australia1990 Adults 0.80 0.65 0.98 0.69
White 2008 Australia1993 <15 1.10 0.93 1.30 0.70
White 2008 Australia1993 Adults 0.83 0.69 0.99 0.69
White 2008 Australia1996 <15 1.19 1.02 1.39 0.70
White 2008 Australia1996 Adults 0.83 0.70 0.98 0.70
White 2008 Australia1999 <15 1.12 0.91 1.39 0.68
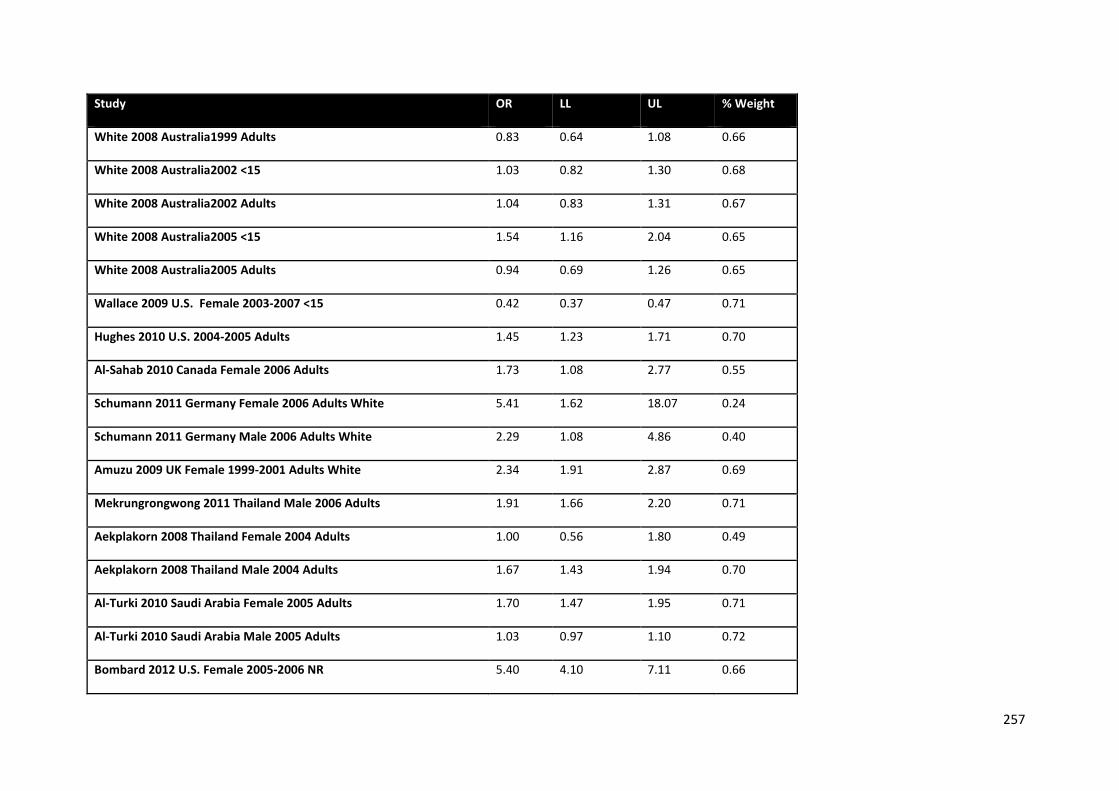
257
Study OR LL UL % Weight
White 2008 Australia1999 Adults 0.83 0.64 1.08 0.66
White 2008 Australia2002 <15 1.03 0.82 1.30 0.68
White 2008 Australia2002 Adults 1.04 0.83 1.31 0.67
White 2008 Australia2005 <15 1.54 1.16 2.04 0.65
White 2008 Australia2005 Adults 0.94 0.69 1.26 0.65
Wallace 2009 U.S. Female 2003-2007 <15 0.42 0.37 0.47 0.71
Hughes 2010 U.S. 2004-2005 Adults 1.45 1.23 1.71 0.70
Al-Sahab 2010 Canada Female 2006 Adults 1.73 1.08 2.77 0.55
Schumann 2011 Germany Female 2006 Adults White 5.41 1.62 18.07 0.24
Schumann 2011 Germany Male 2006 Adults White 2.29 1.08 4.86 0.40
Amuzu 2009 UK Female 1999-2001 Adults White 2.34 1.91 2.87 0.69
Mekrungrongwong 2011 Thailand Male 2006 Adults 1.91 1.66 2.20 0.71
Aekplakorn 2008 Thailand Female 2004 Adults 1.00 0.56 1.80 0.49
Aekplakorn 2008 Thailand Male 2004 Adults 1.67 1.43 1.94 0.70
Al-Turki 2010 Saudi Arabia Female 2005 Adults 1.70 1.47 1.95 0.71
Al-Turki 2010 Saudi Arabia Male 2005 Adults 1.03 0.97 1.10 0.72
Bombard 2012 U.S. Female 2005-2006 NR 5.40 4.10 7.11 0.66
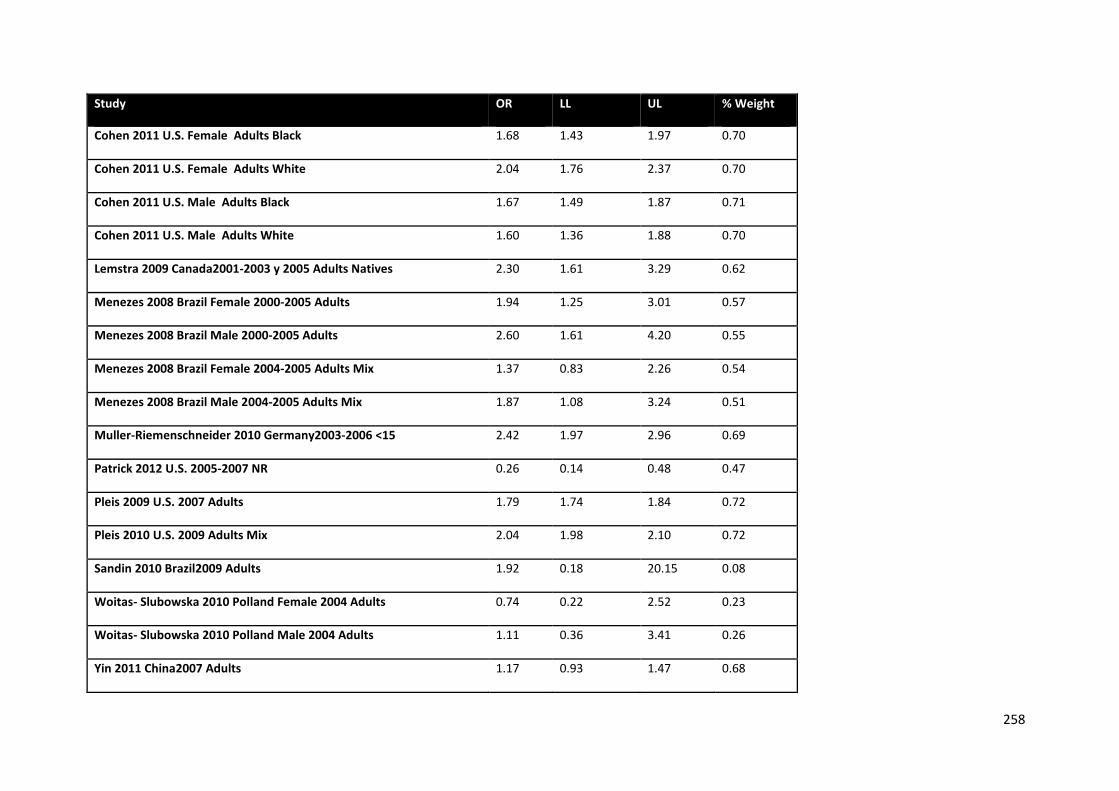
258
Study OR LL UL % Weight
Cohen 2011 U.S. Female Adults Black 1.68 1.43 1.97 0.70
Cohen 2011 U.S. Female Adults White 2.04 1.76 2.37 0.70
Cohen 2011 U.S. Male Adults Black 1.67 1.49 1.87 0.71
Cohen 2011 U.S. Male Adults White 1.60 1.36 1.88 0.70
Lemstra 2009 Canada2001-2003 y 2005 Adults Natives 2.30 1.61 3.29 0.62
Menezes 2008 Brazil Female 2000-2005 Adults 1.94 1.25 3.01 0.57
Menezes 2008 Brazil Male 2000-2005 Adults 2.60 1.61 4.20 0.55
Menezes 2008 Brazil Female 2004-2005 Adults Mix 1.37 0.83 2.26 0.54
Menezes 2008 Brazil Male 2004-2005 Adults Mix 1.87 1.08 3.24 0.51
Muller-Riemenschneider 2010 Germany2003-2006 <15 2.42 1.97 2.96 0.69
Patrick 2012 U.S. 2005-2007 NR 0.26 0.14 0.48 0.47
Pleis 2009 U.S. 2007 Adults 1.79 1.74 1.84 0.72
Pleis 2010 U.S. 2009 Adults Mix 2.04 1.98 2.10 0.72
Sandin 2010 Brazil2009 Adults 1.92 0.18 20.15 0.08
Woitas- Slubowska 2010 Polland Female 2004 Adults 0.74 0.22 2.52 0.23
Woitas- Slubowska 2010 Polland Male 2004 Adults 1.11 0.36 3.41 0.26
Yin 2011 China2007 Adults 1.17 0.93 1.47 0.68
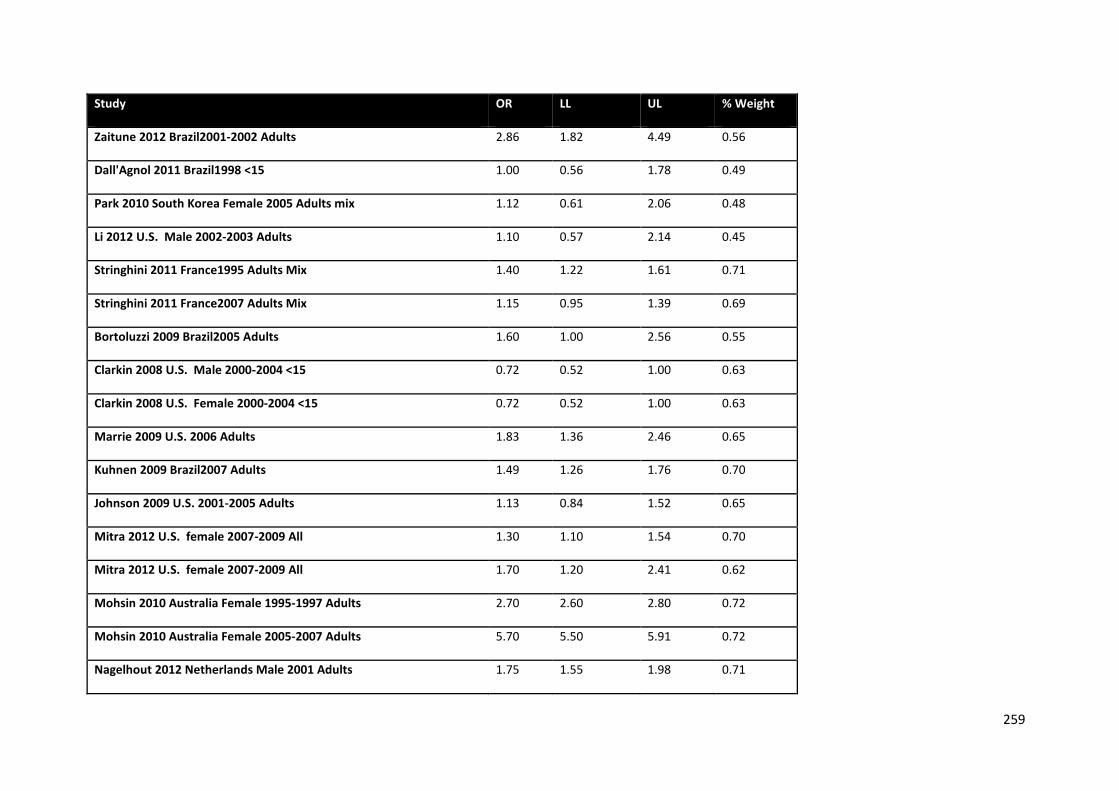
259
Study OR LL UL % Weight
Zaitune 2012 Brazil2001-2002 Adults 2.86 1.82 4.49 0.56
Dall'Agnol 2011 Brazil1998 <15 1.00 0.56 1.78 0.49
Park 2010 South Korea Female 2005 Adults mix 1.12 0.61 2.06 0.48
Li 2012 U.S. Male 2002-2003 Adults 1.10 0.57 2.14 0.45
Stringhini 2011 France1995 Adults Mix 1.40 1.22 1.61 0.71
Stringhini 2011 France2007 Adults Mix 1.15 0.95 1.39 0.69
Bortoluzzi 2009 Brazil2005 Adults 1.60 1.00 2.56 0.55
Clarkin 2008 U.S. Male 2000-2004 <15 0.72 0.52 1.00 0.63
Clarkin 2008 U.S. Female 2000-2004 <15 0.72 0.52 1.00 0.63
Marrie 2009 U.S. 2006 Adults 1.83 1.36 2.46 0.65
Kuhnen 2009 Brazil2007 Adults 1.49 1.26 1.76 0.70
Johnson 2009 U.S. 2001-2005 Adults 1.13 0.84 1.52 0.65
Mitra 2012 U.S. female 2007-2009 All 1.30 1.10 1.54 0.70
Mitra 2012 U.S. female 2007-2009 All 1.70 1.20 2.41 0.62
Mohsin 2010 Australia Female 1995-1997 Adults 2.70 2.60 2.80 0.72
Mohsin 2010 Australia Female 2005-2007 Adults 5.70 5.50 5.91 0.72
Nagelhout 2012 Netherlands Male 2001 Adults 1.75 1.55 1.98 0.71
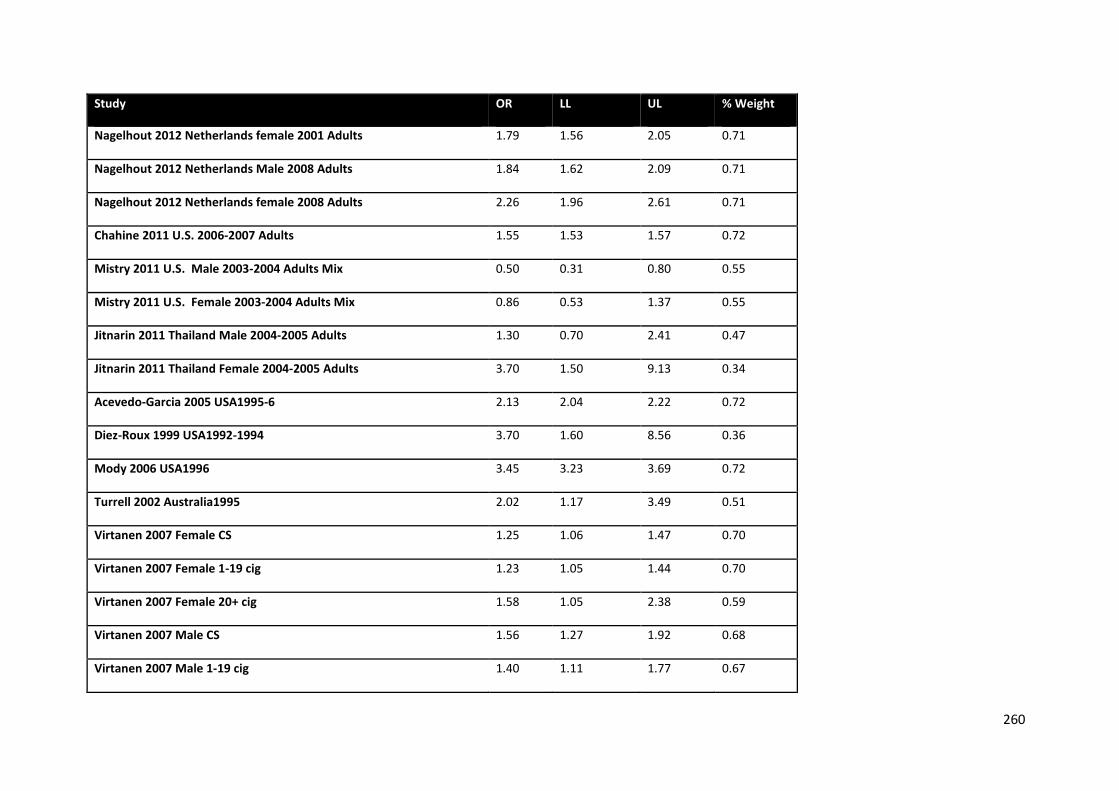
260
Study OR LL UL % Weight
Nagelhout 2012 Netherlands female 2001 Adults 1.79 1.56 2.05 0.71
Nagelhout 2012 Netherlands Male 2008 Adults 1.84 1.62 2.09 0.71
Nagelhout 2012 Netherlands female 2008 Adults 2.26 1.96 2.61 0.71
Chahine 2011 U.S. 2006-2007 Adults 1.55 1.53 1.57 0.72
Mistry 2011 U.S. Male 2003-2004 Adults Mix 0.50 0.31 0.80 0.55
Mistry 2011 U.S. Female 2003-2004 Adults Mix 0.86 0.53 1.37 0.55
Jitnarin 2011 Thailand Male 2004-2005 Adults 1.30 0.70 2.41 0.47
Jitnarin 2011 Thailand Female 2004-2005 Adults 3.70 1.50 9.13 0.34
Acevedo-Garcia 2005 USA1995-6 2.13 2.04 2.22 0.72
Diez-Roux 1999 USA1992-1994 3.70 1.60 8.56 0.36
Mody 2006 USA1996 3.45 3.23 3.69 0.72
Turrell 2002 Australia1995 2.02 1.17 3.49 0.51
Virtanen 2007 Female CS 1.25 1.06 1.47 0.70
Virtanen 2007 Female 1-19 cig 1.23 1.05 1.44 0.70
Virtanen 2007 Female 20+ cig 1.58 1.05 2.38 0.59
Virtanen 2007 Male CS 1.56 1.27 1.92 0.68
Virtanen 2007 Male 1-19 cig 1.40 1.11 1.77 0.67

261
Study OR LL UL % Weight
Virtanen 2007 Male 20+ cig 1.89 1.35 2.65 0.63
Watson 2003 Female 2.01 0.99 4.08 0.43
Webb 2008 G1 Female 2.17 1.52 3.12 0.61
Webb 2008 G2 Female 2.56 1.35 4.87 0.46
Webb 2008 G3 Female 3.70 2.22 6.17 0.53
Wister 1996 25-44 y 1.68 1.38 2.05 0.69
Wister 1996 45-64 y 1.65 1.28 2.13 0.66
Wister 1996 65+ y 1.65 0.93 2.91 0.50
Anaya Ocampo 2006 Male 2.86 1.33 6.12 0.40
Anaya Ocampo 2006 Female 0.74 0.26 2.15 0.28
Coreil 1991 20-39 Female 1.02 1.00 1.05 0.72
Coreil 1991 20-39 Male 1.05 1.02 1.07 0.72
Coreil 1991 40-64 Female 1.01 0.98 1.03 0.72
Coreil 1991 40-64 Male 1.01 0.98 1.05 0.72
Coreil 1991 65-74 Female 1.01 0.94 1.10 0.72
Coreil 1991 65-74 Male 1.01 0.89 1.15 0.71
King 1999 Low 1.64 1.30 2.07 0.67
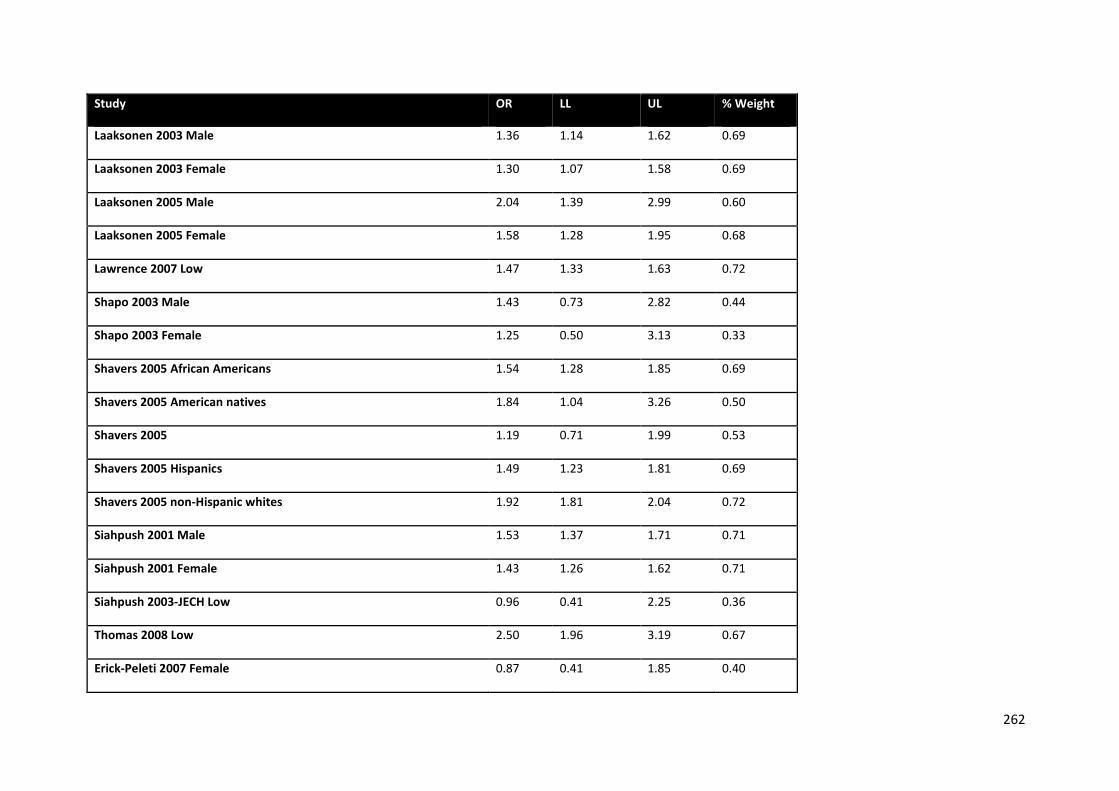
262
Study OR LL UL % Weight
Laaksonen 2003 Male 1.36 1.14 1.62 0.69
Laaksonen 2003 Female 1.30 1.07 1.58 0.69
Laaksonen 2005 Male 2.04 1.39 2.99 0.60
Laaksonen 2005 Female 1.58 1.28 1.95 0.68
Lawrence 2007 Low 1.47 1.33 1.63 0.72
Shapo 2003 Male 1.43 0.73 2.82 0.44
Shapo 2003 Female 1.25 0.50 3.13 0.33
Shavers 2005 African Americans 1.54 1.28 1.85 0.69
Shavers 2005 American natives 1.84 1.04 3.26 0.50
Shavers 2005 1.19 0.71 1.99 0.53
Shavers 2005 Hispanics 1.49 1.23 1.81 0.69
Shavers 2005 non-Hispanic whites 1.92 1.81 2.04 0.72
Siahpush 2001 Male 1.53 1.37 1.71 0.71
Siahpush 2001 Female 1.43 1.26 1.62 0.71
Siahpush 2003-JECH Low 0.96 0.41 2.25 0.36
Thomas 2008 Low 2.50 1.96 3.19 0.67
Erick-Peleti 2007 Female 0.87 0.41 1.85 0.40
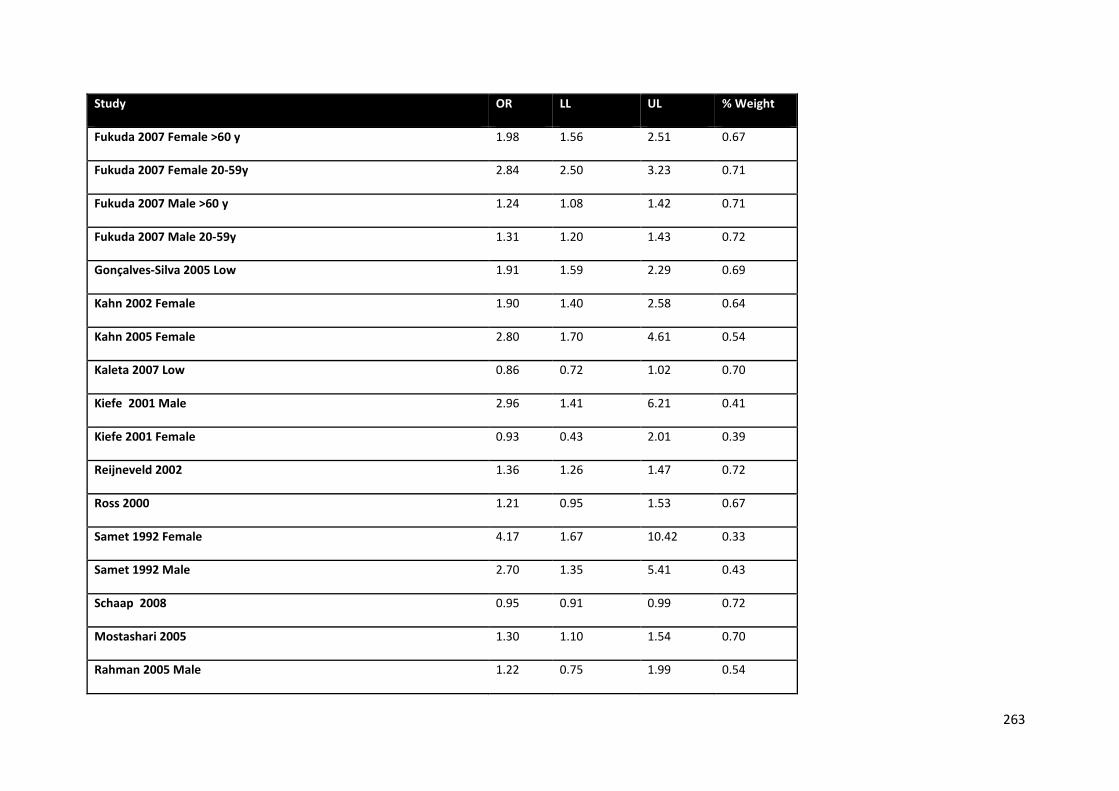
263
Study OR LL UL % Weight
Fukuda 2007 Female >60 y 1.98 1.56 2.51 0.67
Fukuda 2007 Female 20-59y 2.84 2.50 3.23 0.71
Fukuda 2007 Male >60 y 1.24 1.08 1.42 0.71
Fukuda 2007 Male 20-59y 1.31 1.20 1.43 0.72
Gonçalves-Silva 2005 Low 1.91 1.59 2.29 0.69
Kahn 2002 Female 1.90 1.40 2.58 0.64
Kahn 2005 Female 2.80 1.70 4.61 0.54
Kaleta 2007 Low 0.86 0.72 1.02 0.70
Kiefe 2001 Male 2.96 1.41 6.21 0.41
Kiefe 2001 Female 0.93 0.43 2.01 0.39
Reijneveld 2002 1.36 1.26 1.47 0.72
Ross 2000 1.21 0.95 1.53 0.67
Samet 1992 Female 4.17 1.67 10.42 0.33
Samet 1992 Male 2.70 1.35 5.41 0.43
Schaap 2008 0.95 0.91 0.99 0.72
Mostashari 2005 1.30 1.10 1.54 0.70
Rahman 2005 Male 1.22 0.75 1.99 0.54

264
Study OR LL UL % Weight
Fagan 2008-NTR 2.13 1.85 2.45 0.71
Fukuda 2005 Male 1.29 1.17 1.42 0.72
Fukuda 2005 Female 2.03 1.76 2.34 0.70
Metcalf 2007 1.82 1.38 2.40 0.65
Metcalf 2008 1.94 1.38 2.73 0.62
Marinho 2008 1.52 1.26 1.83 0.69
Hesketh2007 Male 0.83 0.77 0.90 0.72
Pudaric 2000 Male 1.50 1.02 2.21 0.60
Pudaric 2000 Female 1.02 0.72 1.45 0.62
Pomerleau 1997 1.84 1.57 2.16 0.70
Moreira 1995 1.03 0.84 1.27 0.68
Silvestre Garcia 1990 Low 0.67 0.40 1.12 0.53
Green 2007 18-34 y 1.77 1.64 1.91 0.72
Sub-total
D+L pooled ES 1.48 1.37 1.60 87.51
High: (Stratum C+D+E
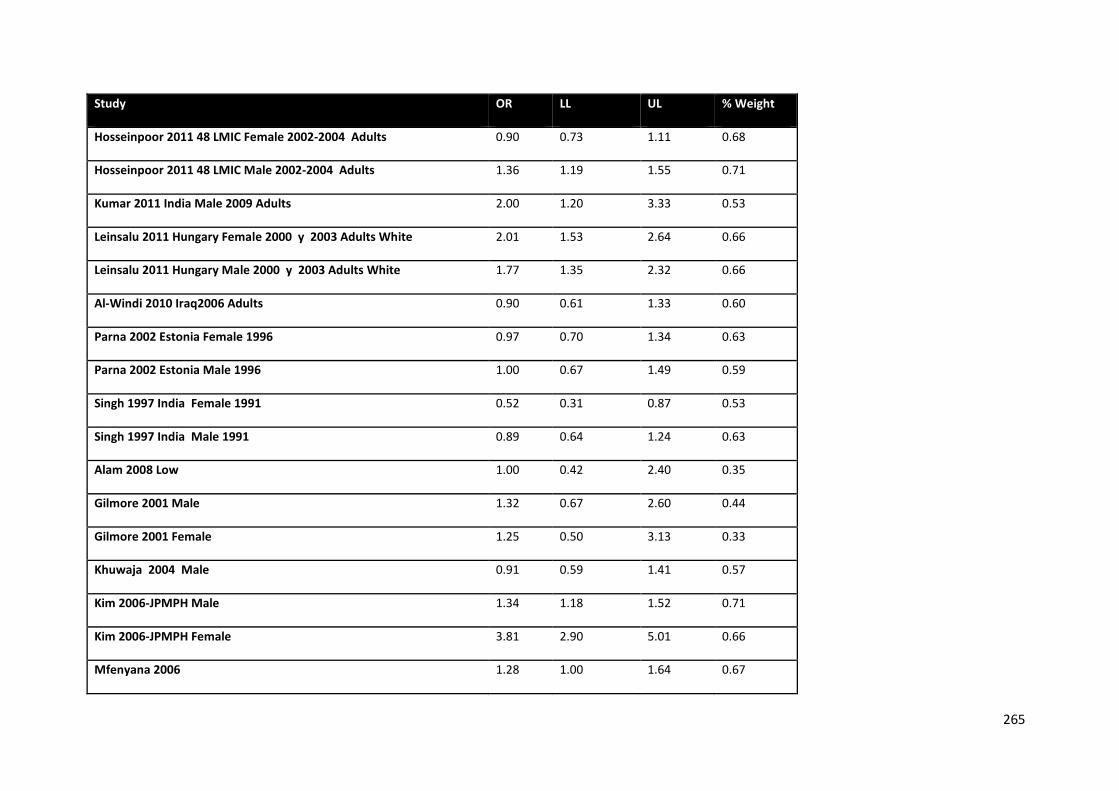
265
Study OR LL UL % Weight
Hosseinpoor 2011 48 LMIC Female 2002-2004 Adults 0.90 0.73 1.11 0.68
Hosseinpoor 2011 48 LMIC Male 2002-2004 Adults 1.36 1.19 1.55 0.71
Kumar 2011 India Male 2009 Adults 2.00 1.20 3.33 0.53
Leinsalu 2011 Hungary Female 2000 y 2003 Adults White 2.01 1.53 2.64 0.66
Leinsalu 2011 Hungary Male 2000 y 2003 Adults White 1.77 1.35 2.32 0.66
Al-Windi 2010 Iraq2006 Adults 0.90 0.61 1.33 0.60
Parna 2002 Estonia Female 1996 0.97 0.70 1.34 0.63
Parna 2002 Estonia Male 1996 1.00 0.67 1.49 0.59
Singh 1997 India Female 1991 0.52 0.31 0.87 0.53
Singh 1997 India Male 1991 0.89 0.64 1.24 0.63
Alam 2008 Low 1.00 0.42 2.40 0.35
Gilmore 2001 Male 1.32 0.67 2.60 0.44
Gilmore 2001 Female 1.25 0.50 3.13 0.33
Khuwaja 2004 Male 0.91 0.59 1.41 0.57
Kim 2006-JPMPH Male 1.34 1.18 1.52 0.71
Kim 2006-JPMPH Female 3.81 2.90 5.01 0.66
Mfenyana 2006 1.28 1.00 1.64 0.67
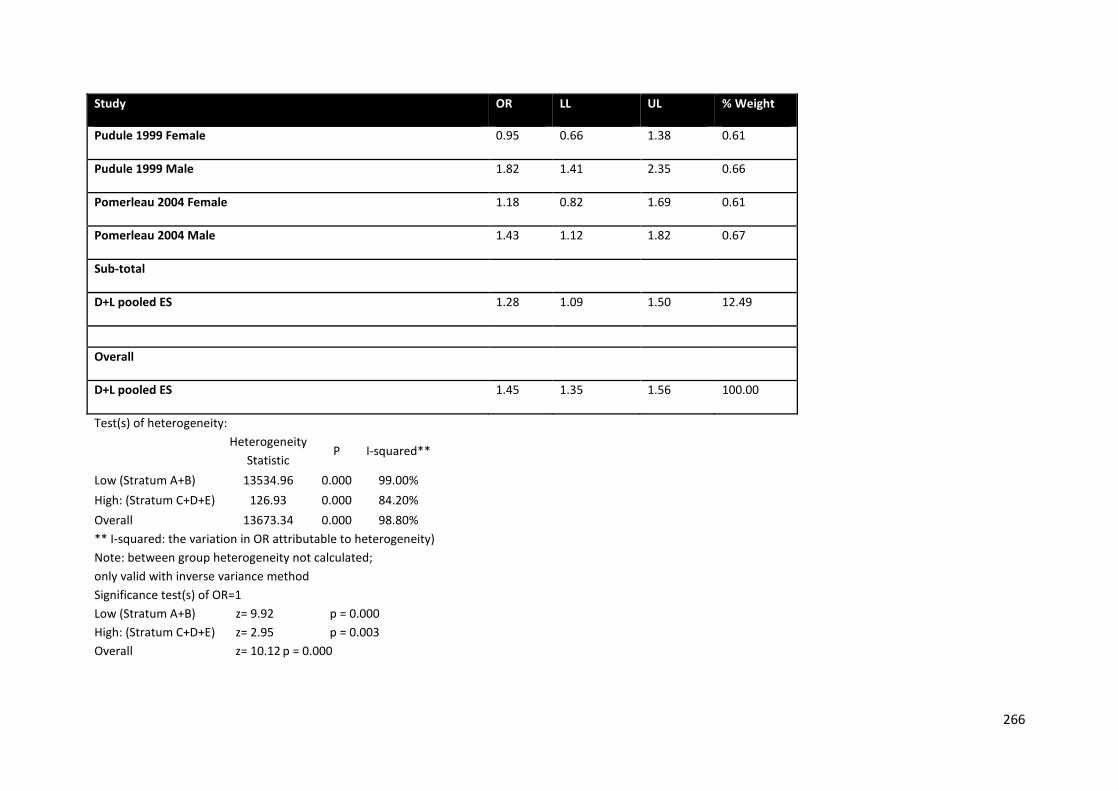
266
Study OR LL UL % Weight
Pudule 1999 Female 0.95 0.66 1.38 0.61
Pudule 1999 Male 1.82 1.41 2.35 0.66
Pomerleau 2004 Female 1.18 0.82 1.69 0.61
Pomerleau 2004 Male 1.43 1.12 1.82 0.67
Sub-total
D+L pooled ES 1.28 1.09 1.50 12.49
Overall
D+L pooled ES 1.45 1.35 1.56 100.00
Test(s) of heterogeneity:
Heterogeneity Statistic
P I-squared**
Low (Stratum A+B) 13534.96 0.000 99.00% High: (Stratum C+D+E) 126.93 0.000 84.20% Overall 13673.34 0.000 98.80% ** I-squared: the variation in OR attributable to heterogeneity) Note: between group heterogeneity not calculated; only valid with inverse variance method Significance test(s) of OR=1 Low (Stratum A+B) z= 9.92 p = 0.000 High: (Stratum C+D+E) z= 2.95 p = 0.003 Overall z= 10.12 p = 0.000
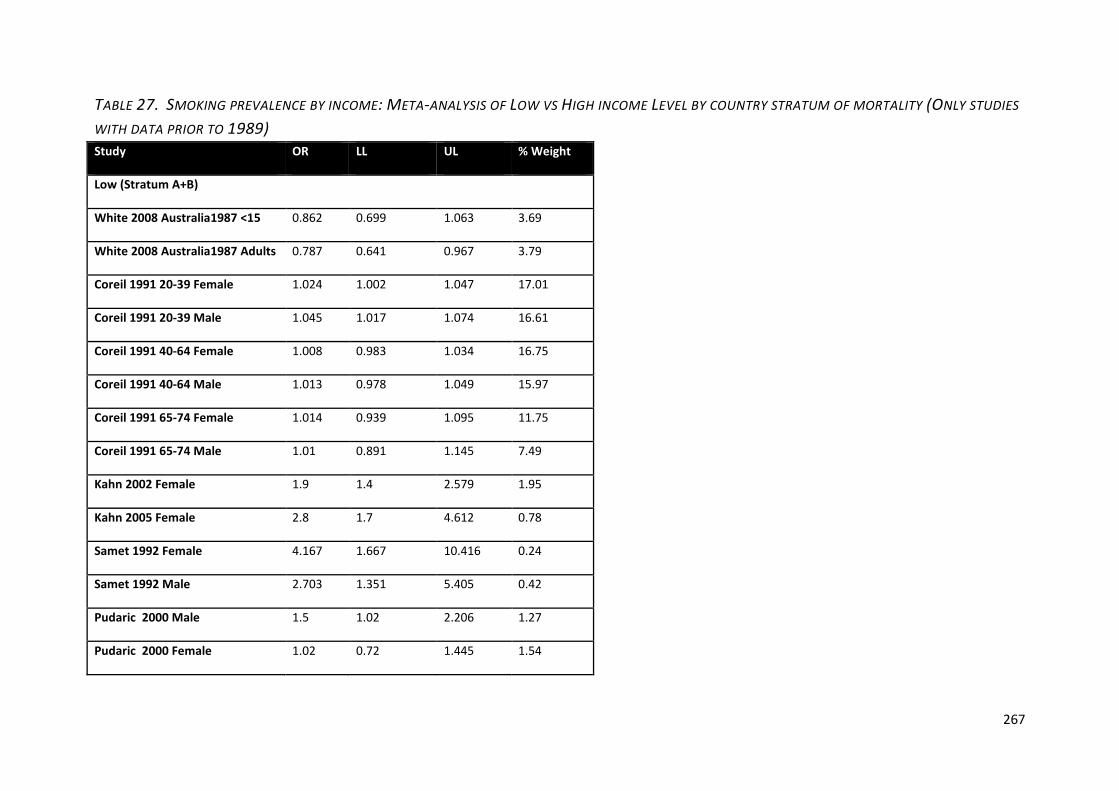
267
TABLE 27. SMOKING PREVALENCE BY INCOME: META-ANALYSIS OF LOW VS HIGH INCOME LEVEL BY COUNTRY STRATUM OF MORTALITY (ONLY STUDIES
WITH DATA PRIOR TO 1989) Study OR LL UL % Weight
Low (Stratum A+B)
White 2008 Australia1987 <15 0.862 0.699 1.063 3.69
White 2008 Australia1987 Adults 0.787 0.641 0.967 3.79
Coreil 1991 20-39 Female 1.024 1.002 1.047 17.01
Coreil 1991 20-39 Male 1.045 1.017 1.074 16.61
Coreil 1991 40-64 Female 1.008 0.983 1.034 16.75
Coreil 1991 40-64 Male 1.013 0.978 1.049 15.97
Coreil 1991 65-74 Female 1.014 0.939 1.095 11.75
Coreil 1991 65-74 Male 1.01 0.891 1.145 7.49
Kahn 2002 Female 1.9 1.4 2.579 1.95
Kahn 2005 Female 2.8 1.7 4.612 0.78
Samet 1992 Female 4.167 1.667 10.416 0.24
Samet 1992 Male 2.703 1.351 5.405 0.42
Pudaric 2000 Male 1.5 1.02 2.206 1.27
Pudaric 2000 Female 1.02 0.72 1.445 1.54
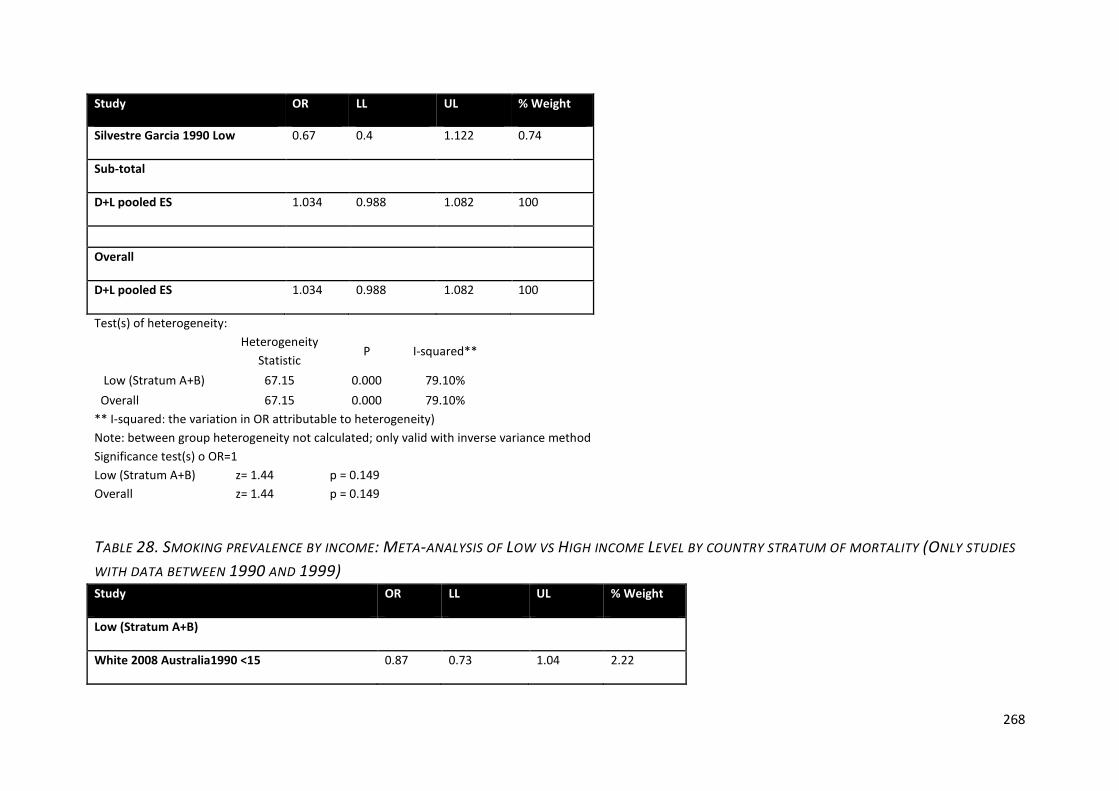
268
Study OR LL UL % Weight
Silvestre Garcia 1990 Low 0.67 0.4 1.122 0.74
Sub-total
D+L pooled ES 1.034 0.988 1.082 100
Overall
D+L pooled ES 1.034 0.988 1.082 100
Test(s) of heterogeneity:
Heterogeneity Statistic
P I-squared**
Low (Stratum A+B) 67.15 0.000 79.10% Overall 67.15 0.000 79.10%
** I-squared: the variation in OR attributable to heterogeneity) Note: between group heterogeneity not calculated; only valid with inverse variance method Significance test(s) o OR=1 Low (Stratum A+B) z= 1.44 p = 0.149 Overall z= 1.44 p = 0.149
TABLE 28. SMOKING PREVALENCE BY INCOME: META-ANALYSIS OF LOW VS HIGH INCOME LEVEL BY COUNTRY STRATUM OF MORTALITY (ONLY STUDIES
WITH DATA BETWEEN 1990 AND 1999) Study OR LL UL % Weight
Low (Stratum A+B)
White 2008 Australia1990 <15 0.87 0.73 1.04 2.22
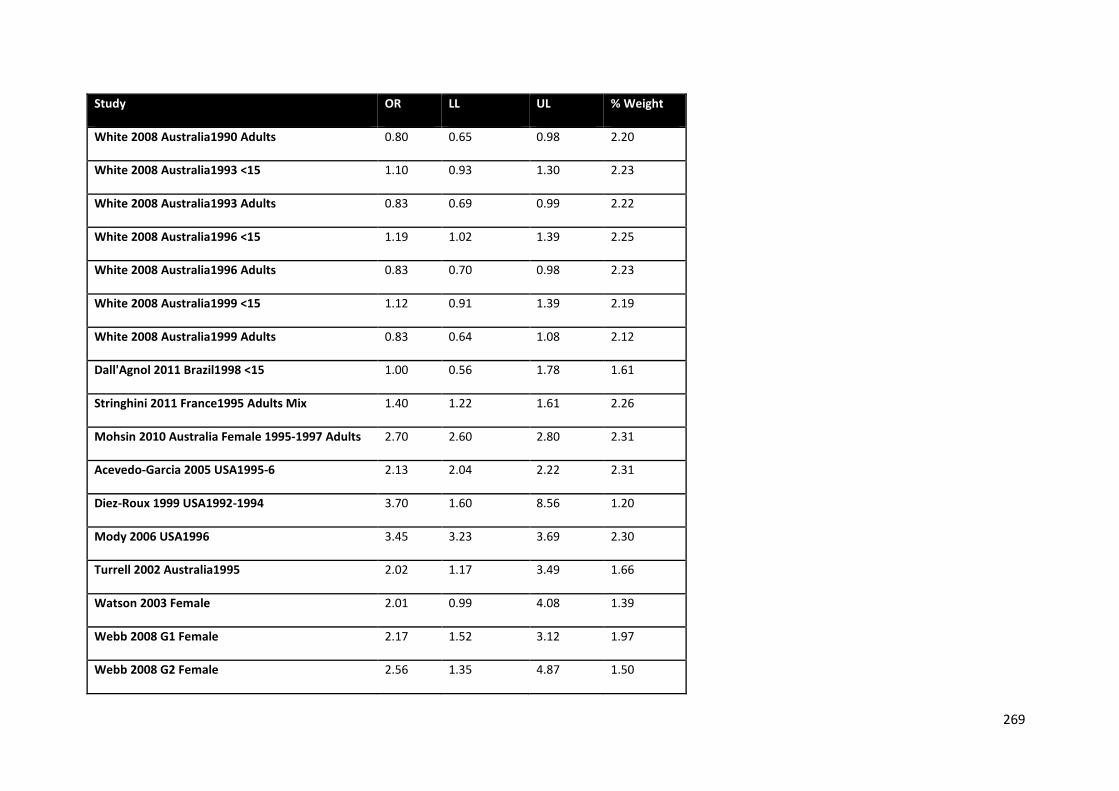
269
Study OR LL UL % Weight
White 2008 Australia1990 Adults 0.80 0.65 0.98 2.20
White 2008 Australia1993 <15 1.10 0.93 1.30 2.23
White 2008 Australia1993 Adults 0.83 0.69 0.99 2.22
White 2008 Australia1996 <15 1.19 1.02 1.39 2.25
White 2008 Australia1996 Adults 0.83 0.70 0.98 2.23
White 2008 Australia1999 <15 1.12 0.91 1.39 2.19
White 2008 Australia1999 Adults 0.83 0.64 1.08 2.12
Dall'Agnol 2011 Brazil1998 <15 1.00 0.56 1.78 1.61
Stringhini 2011 France1995 Adults Mix 1.40 1.22 1.61 2.26
Mohsin 2010 Australia Female 1995-1997 Adults 2.70 2.60 2.80 2.31
Acevedo-Garcia 2005 USA1995-6 2.13 2.04 2.22 2.31
Diez-Roux 1999 USA1992-1994 3.70 1.60 8.56 1.20
Mody 2006 USA1996 3.45 3.23 3.69 2.30
Turrell 2002 Australia1995 2.02 1.17 3.49 1.66
Watson 2003 Female 2.01 0.99 4.08 1.39
Webb 2008 G1 Female 2.17 1.52 3.12 1.97
Webb 2008 G2 Female 2.56 1.35 4.87 1.50
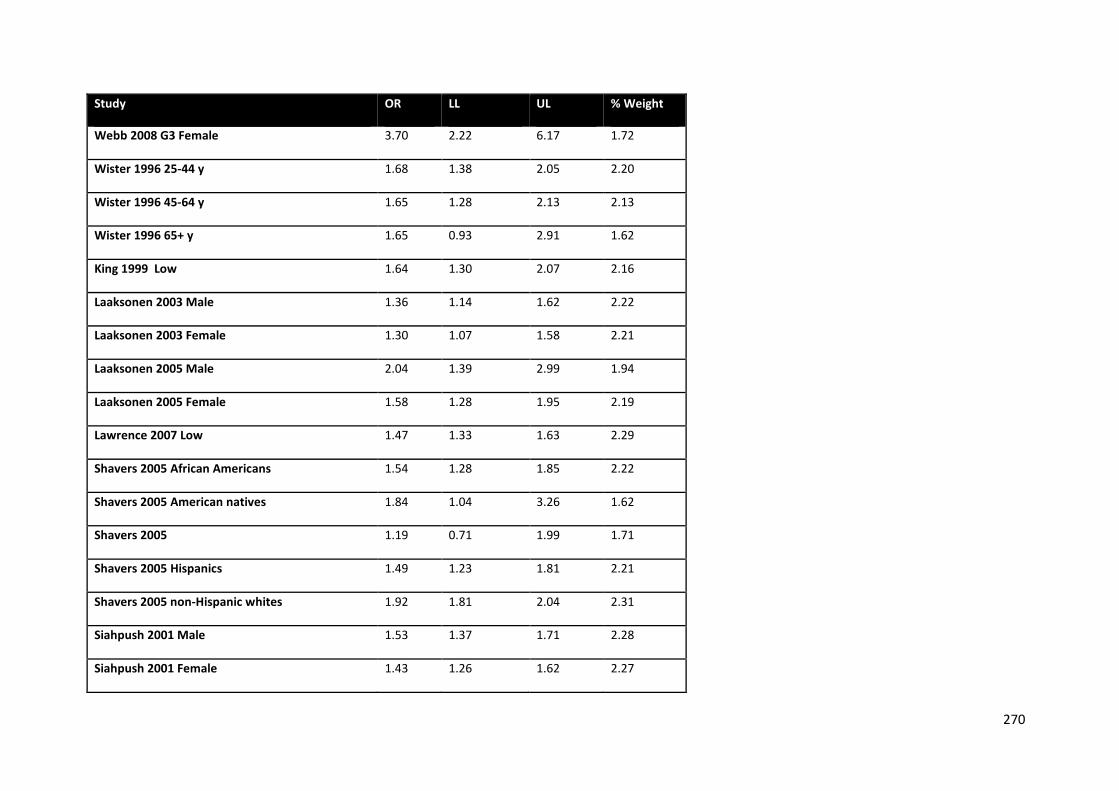
270
Study OR LL UL % Weight
Webb 2008 G3 Female 3.70 2.22 6.17 1.72
Wister 1996 25-44 y 1.68 1.38 2.05 2.20
Wister 1996 45-64 y 1.65 1.28 2.13 2.13
Wister 1996 65+ y 1.65 0.93 2.91 1.62
King 1999 Low 1.64 1.30 2.07 2.16
Laaksonen 2003 Male 1.36 1.14 1.62 2.22
Laaksonen 2003 Female 1.30 1.07 1.58 2.21
Laaksonen 2005 Male 2.04 1.39 2.99 1.94
Laaksonen 2005 Female 1.58 1.28 1.95 2.19
Lawrence 2007 Low 1.47 1.33 1.63 2.29
Shavers 2005 African Americans 1.54 1.28 1.85 2.22
Shavers 2005 American natives 1.84 1.04 3.26 1.62
Shavers 2005 1.19 0.71 1.99 1.71
Shavers 2005 Hispanics 1.49 1.23 1.81 2.21
Shavers 2005 non-Hispanic whites 1.92 1.81 2.04 2.31
Siahpush 2001 Male 1.53 1.37 1.71 2.28
Siahpush 2001 Female 1.43 1.26 1.62 2.27
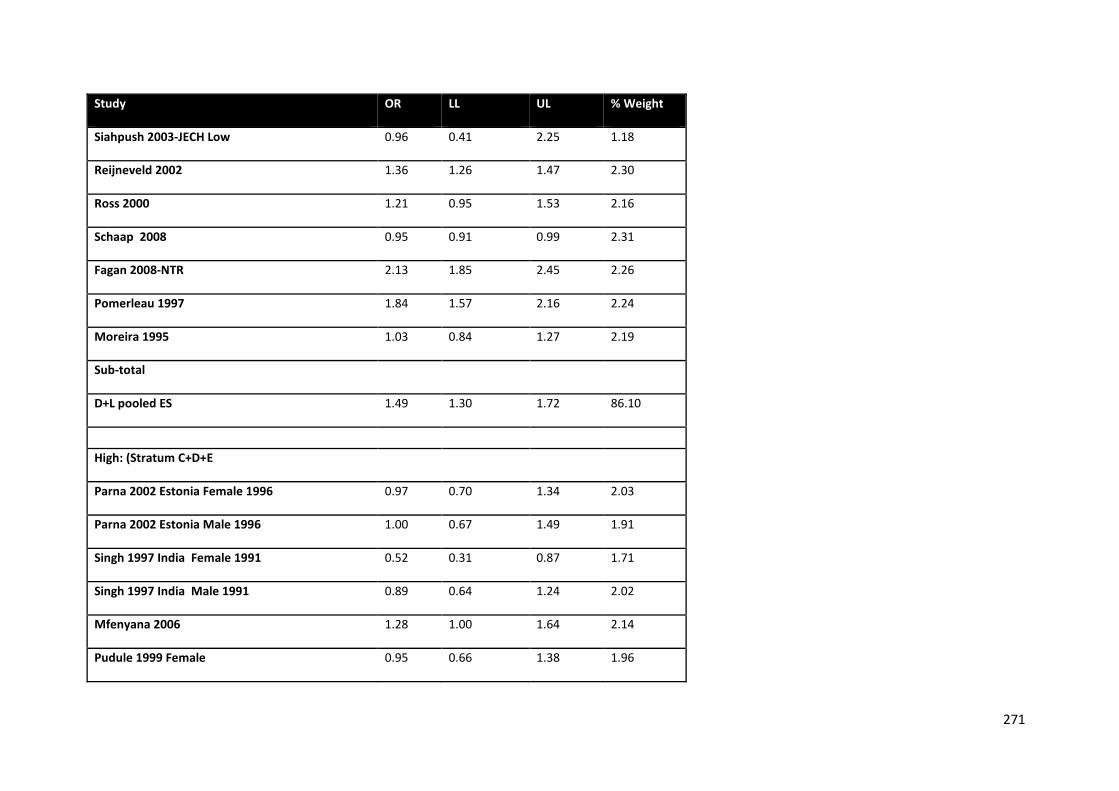
271
Study OR LL UL % Weight
Siahpush 2003-JECH Low 0.96 0.41 2.25 1.18
Reijneveld 2002 1.36 1.26 1.47 2.30
Ross 2000 1.21 0.95 1.53 2.16
Schaap 2008 0.95 0.91 0.99 2.31
Fagan 2008-NTR 2.13 1.85 2.45 2.26
Pomerleau 1997 1.84 1.57 2.16 2.24
Moreira 1995 1.03 0.84 1.27 2.19
Sub-total
D+L pooled ES 1.49 1.30 1.72 86.10
High: (Stratum C+D+E
Parna 2002 Estonia Female 1996 0.97 0.70 1.34 2.03
Parna 2002 Estonia Male 1996 1.00 0.67 1.49 1.91
Singh 1997 India Female 1991 0.52 0.31 0.87 1.71
Singh 1997 India Male 1991 0.89 0.64 1.24 2.02
Mfenyana 2006 1.28 1.00 1.64 2.14
Pudule 1999 Female 0.95 0.66 1.38 1.96
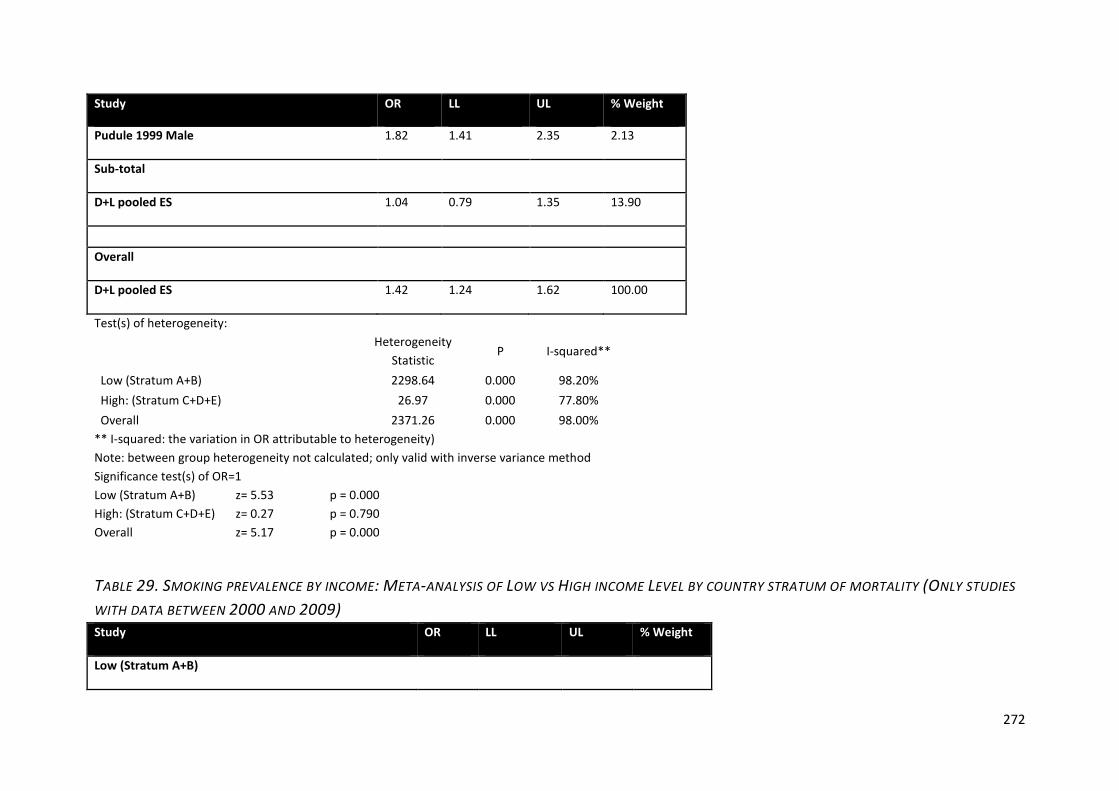
272
Study OR LL UL % Weight
Pudule 1999 Male 1.82 1.41 2.35 2.13
Sub-total
D+L pooled ES 1.04 0.79 1.35 13.90
Overall
D+L pooled ES 1.42 1.24 1.62 100.00
Test(s) of heterogeneity:
Heterogeneity Statistic
P I-squared**
Low (Stratum A+B) 2298.64 0.000 98.20% High: (Stratum C+D+E) 26.97 0.000 77.80% Overall 2371.26 0.000 98.00%
** I-squared: the variation in OR attributable to heterogeneity) Note: between group heterogeneity not calculated; only valid with inverse variance method Significance test(s) of OR=1 Low (Stratum A+B) z= 5.53 p = 0.000 High: (Stratum C+D+E) z= 0.27 p = 0.790 Overall z= 5.17 p = 0.000
TABLE 29. SMOKING PREVALENCE BY INCOME: META-ANALYSIS OF LOW VS HIGH INCOME LEVEL BY COUNTRY STRATUM OF MORTALITY (ONLY STUDIES
WITH DATA BETWEEN 2000 AND 2009) Study OR LL UL % Weight
Low (Stratum A+B)

273
Study OR LL UL % Weight
Tehranifar 2009 U.S. Female 2001-2006 NR 2.10 0.80 5.51 0.62
White 2008 Australia2002 <15 1.03 0.82 1.30 1.26
White 2008 Australia2002 Adults 1.04 0.83 1.31 1.26
White 2008 Australia2005 <15 1.54 1.16 2.04 1.22
White 2008 Australia2005 Adults 0.94 0.69 1.26 1.21
Wallace 2009 U.S. Female 2003-2007 <15 0.42 0.37 0.47 1.32
Hughes 2010 U.S. 2004-2005 Adults 1.45 1.23 1.71 1.30
Al-Sahab 2010 Canada Female 2006 Adults 1.73 1.08 2.77 1.05
Schumann 2011 Germany Female 2006 Adults White 5.41 1.62 18.07 0.48
Schumann 2011 Germany Male 2006 Adults White 2.29 1.08 4.86 0.79
Mekrungrongwong 2011 Thailand Male 2006 Adults 1.91 1.66 2.20 1.31
Aekplakorn 2008 Thailand Female 2004 Adults 1.00 0.56 1.80 0.94
Aekplakorn 2008 Thailand Male 2004 Adults 1.67 1.43 1.94 1.30
Al-Turki 2010 Saudi Arabia Female 2005 Adults 1.70 1.47 1.95 1.31
Al-Turki 2010 Saudi Arabia Male 2005 Adults 1.03 0.97 1.10 1.33
Bombard 2012 U.S. Female 2005-2006 NR 5.40 4.10 7.11 1.22
Lemstra 2009 Canada2001-2003 y 2005 Adults Natives 2.30 1.61 3.29 1.16
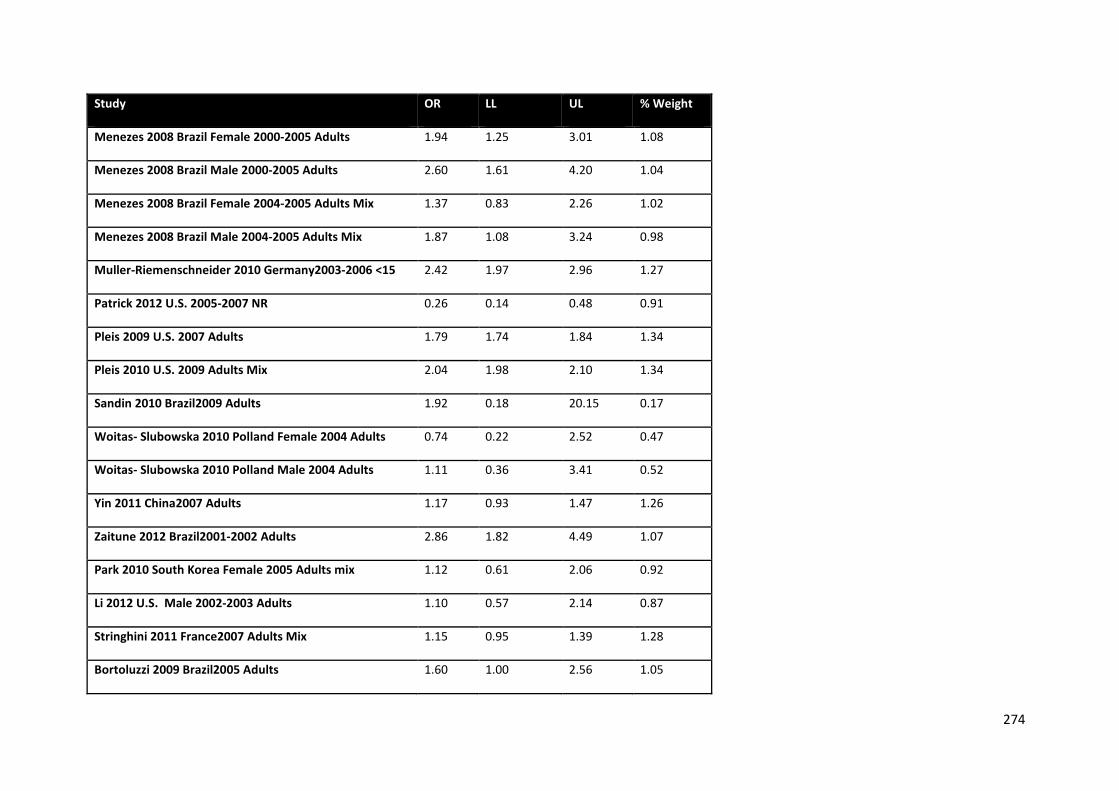
274
Study OR LL UL % Weight
Menezes 2008 Brazil Female 2000-2005 Adults 1.94 1.25 3.01 1.08
Menezes 2008 Brazil Male 2000-2005 Adults 2.60 1.61 4.20 1.04
Menezes 2008 Brazil Female 2004-2005 Adults Mix 1.37 0.83 2.26 1.02
Menezes 2008 Brazil Male 2004-2005 Adults Mix 1.87 1.08 3.24 0.98
Muller-Riemenschneider 2010 Germany2003-2006 <15 2.42 1.97 2.96 1.27
Patrick 2012 U.S. 2005-2007 NR 0.26 0.14 0.48 0.91
Pleis 2009 U.S. 2007 Adults 1.79 1.74 1.84 1.34
Pleis 2010 U.S. 2009 Adults Mix 2.04 1.98 2.10 1.34
Sandin 2010 Brazil2009 Adults 1.92 0.18 20.15 0.17
Woitas- Slubowska 2010 Polland Female 2004 Adults 0.74 0.22 2.52 0.47
Woitas- Slubowska 2010 Polland Male 2004 Adults 1.11 0.36 3.41 0.52
Yin 2011 China2007 Adults 1.17 0.93 1.47 1.26
Zaitune 2012 Brazil2001-2002 Adults 2.86 1.82 4.49 1.07
Park 2010 South Korea Female 2005 Adults mix 1.12 0.61 2.06 0.92
Li 2012 U.S. Male 2002-2003 Adults 1.10 0.57 2.14 0.87
Stringhini 2011 France2007 Adults Mix 1.15 0.95 1.39 1.28
Bortoluzzi 2009 Brazil2005 Adults 1.60 1.00 2.56 1.05

275
Study OR LL UL % Weight
Clarkin 2008 U.S. Male 2000-2004 <15 0.72 0.52 1.00 1.18
Clarkin 2008 U.S. Female 2000-2004 <15 0.72 0.52 1.00 1.18
Marrie 2009 U.S. 2006 Adults 1.83 1.36 2.46 1.21
Kuhnen 2009 Brazil2007 Adults 1.49 1.26 1.76 1.29
Johnson 2009 U.S. 2001-2005 Adults 1.13 0.84 1.52 1.21
Mitra 2012 U.S. female 2007-2009 All 1.30 1.10 1.54 1.29
Mitra 2012 U.S. female 2007-2009 All 1.70 1.20 2.41 1.16
Mohsin 2010 Australia Female 2005-2007 Adults 5.70 5.50 5.91 1.34
Nagelhout 2012 Netherlands Male 2001 Adults 1.75 1.55 1.98 1.32
Nagelhout 2012 Netherlands female 2001 Adults 1.79 1.56 2.05 1.31
Nagelhout 2012 Netherlands Male 2008 Adults 1.84 1.62 2.09 1.31
Nagelhout 2012 Netherlands female 2008 Adults 2.26 1.96 2.61 1.31
Chahine 2011 U.S. 2006-2007 Adults 1.55 1.53 1.57 1.34
Mistry 2011 U.S. Male 2003-2004 Adults Mix 0.50 0.31 0.80 1.05
Mistry 2011 U.S. Female 2003-2004 Adults Mix 0.86 0.53 1.37 1.05
Jitnarin 2011 Thailand Male 2004-2005 Adults 1.30 0.70 2.41 0.91
Jitnarin 2011 Thailand Female 2004-2005 Adults 3.70 1.50 9.13 0.67
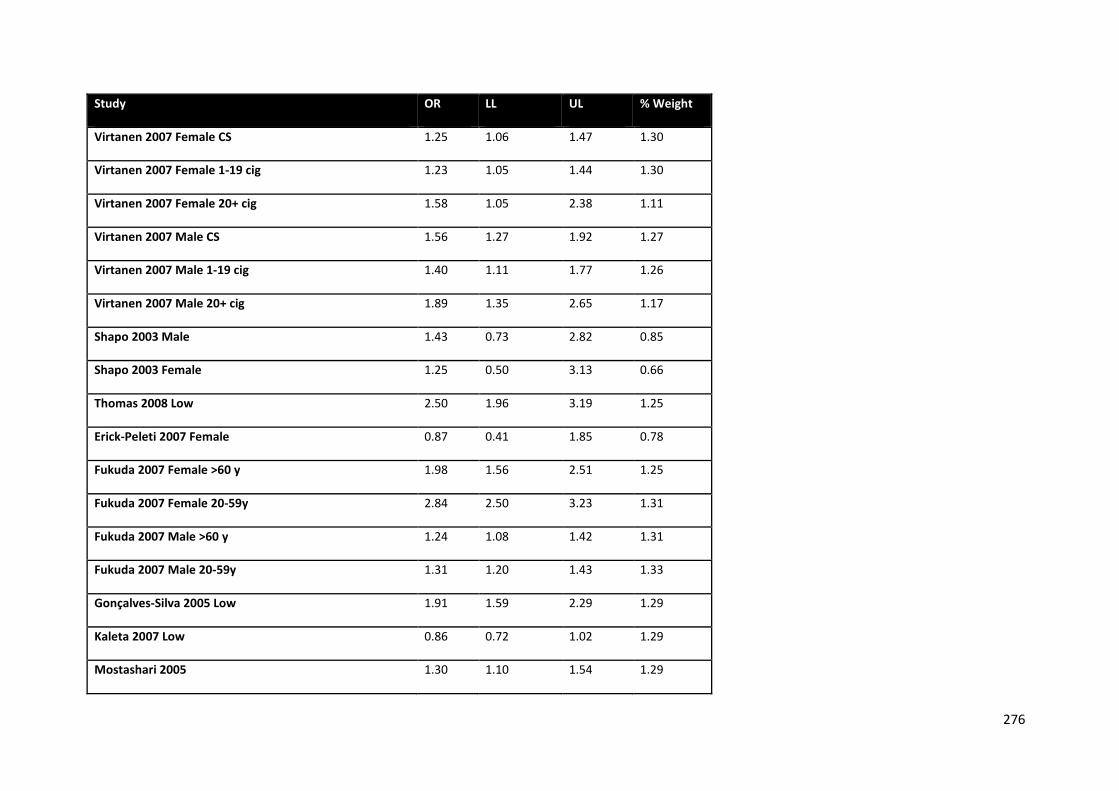
276
Study OR LL UL % Weight
Virtanen 2007 Female CS 1.25 1.06 1.47 1.30
Virtanen 2007 Female 1-19 cig 1.23 1.05 1.44 1.30
Virtanen 2007 Female 20+ cig 1.58 1.05 2.38 1.11
Virtanen 2007 Male CS 1.56 1.27 1.92 1.27
Virtanen 2007 Male 1-19 cig 1.40 1.11 1.77 1.26
Virtanen 2007 Male 20+ cig 1.89 1.35 2.65 1.17
Shapo 2003 Male 1.43 0.73 2.82 0.85
Shapo 2003 Female 1.25 0.50 3.13 0.66
Thomas 2008 Low 2.50 1.96 3.19 1.25
Erick-Peleti 2007 Female 0.87 0.41 1.85 0.78
Fukuda 2007 Female >60 y 1.98 1.56 2.51 1.25
Fukuda 2007 Female 20-59y 2.84 2.50 3.23 1.31
Fukuda 2007 Male >60 y 1.24 1.08 1.42 1.31
Fukuda 2007 Male 20-59y 1.31 1.20 1.43 1.33
Gonçalves-Silva 2005 Low 1.91 1.59 2.29 1.29
Kaleta 2007 Low 0.86 0.72 1.02 1.29
Mostashari 2005 1.30 1.10 1.54 1.29
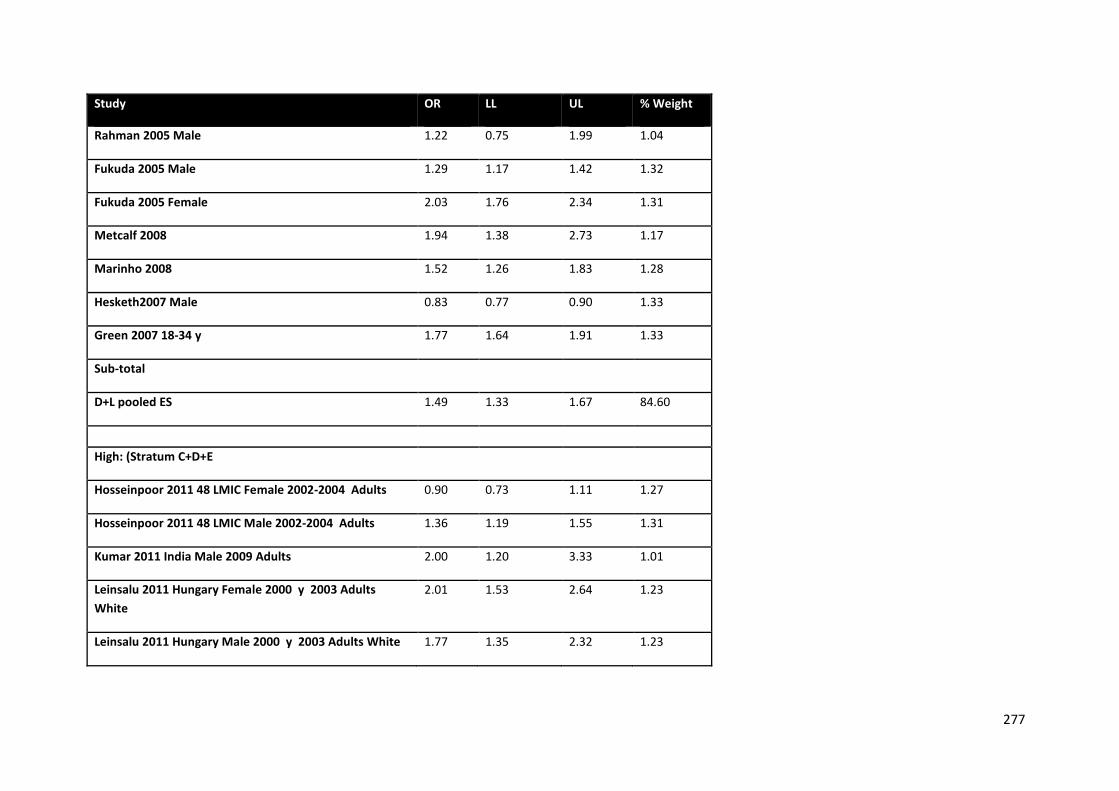
277
Study OR LL UL % Weight
Rahman 2005 Male 1.22 0.75 1.99 1.04
Fukuda 2005 Male 1.29 1.17 1.42 1.32
Fukuda 2005 Female 2.03 1.76 2.34 1.31
Metcalf 2008 1.94 1.38 2.73 1.17
Marinho 2008 1.52 1.26 1.83 1.28
Hesketh2007 Male 0.83 0.77 0.90 1.33
Green 2007 18-34 y 1.77 1.64 1.91 1.33
Sub-total
D+L pooled ES 1.49 1.33 1.67 84.60
High: (Stratum C+D+E
Hosseinpoor 2011 48 LMIC Female 2002-2004 Adults 0.90 0.73 1.11 1.27
Hosseinpoor 2011 48 LMIC Male 2002-2004 Adults 1.36 1.19 1.55 1.31
Kumar 2011 India Male 2009 Adults 2.00 1.20 3.33 1.01
Leinsalu 2011 Hungary Female 2000 y 2003 Adults White
2.01 1.53 2.64 1.23
Leinsalu 2011 Hungary Male 2000 y 2003 Adults White 1.77 1.35 2.32 1.23
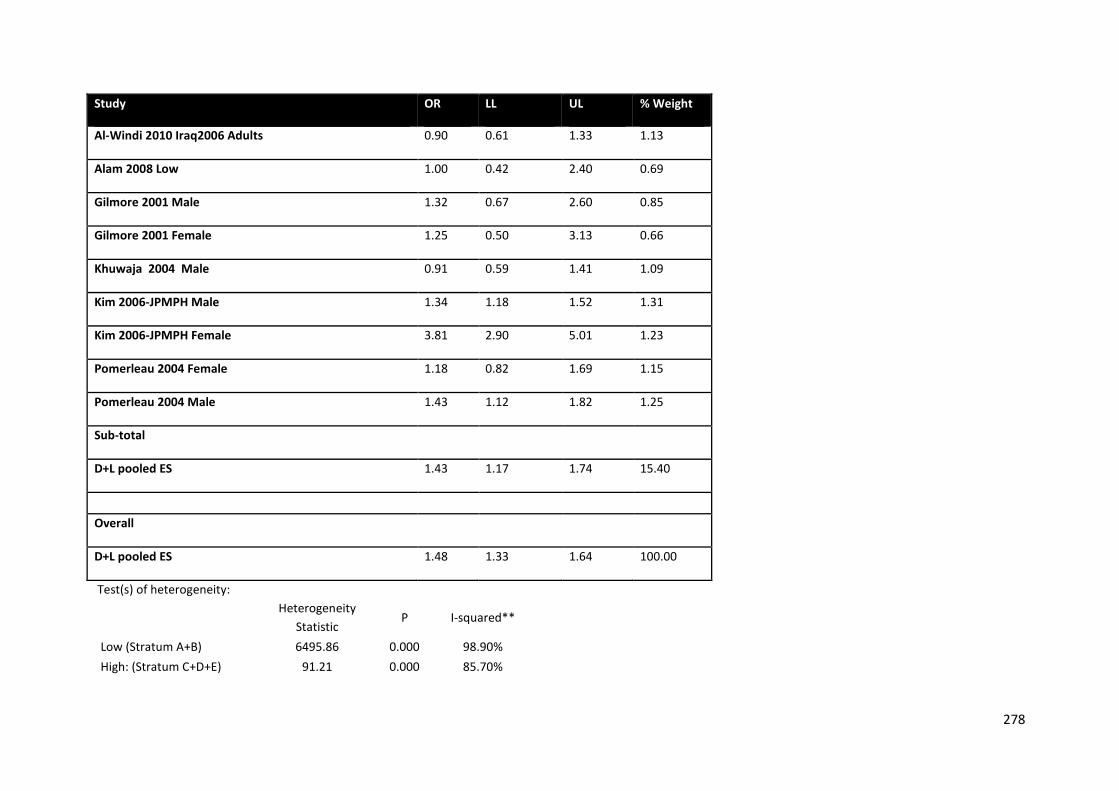
278
Study OR LL UL % Weight
Al-Windi 2010 Iraq2006 Adults 0.90 0.61 1.33 1.13
Alam 2008 Low 1.00 0.42 2.40 0.69
Gilmore 2001 Male 1.32 0.67 2.60 0.85
Gilmore 2001 Female 1.25 0.50 3.13 0.66
Khuwaja 2004 Male 0.91 0.59 1.41 1.09
Kim 2006-JPMPH Male 1.34 1.18 1.52 1.31
Kim 2006-JPMPH Female 3.81 2.90 5.01 1.23
Pomerleau 2004 Female 1.18 0.82 1.69 1.15
Pomerleau 2004 Male 1.43 1.12 1.82 1.25
Sub-total
D+L pooled ES 1.43 1.17 1.74 15.40
Overall
D+L pooled ES 1.48 1.33 1.64 100.00
Test(s) of heterogeneity:
Heterogeneity Statistic
P I-squared**
Low (Stratum A+B) 6495.86 0.000 98.90% High: (Stratum C+D+E) 91.21 0.000 85.70%
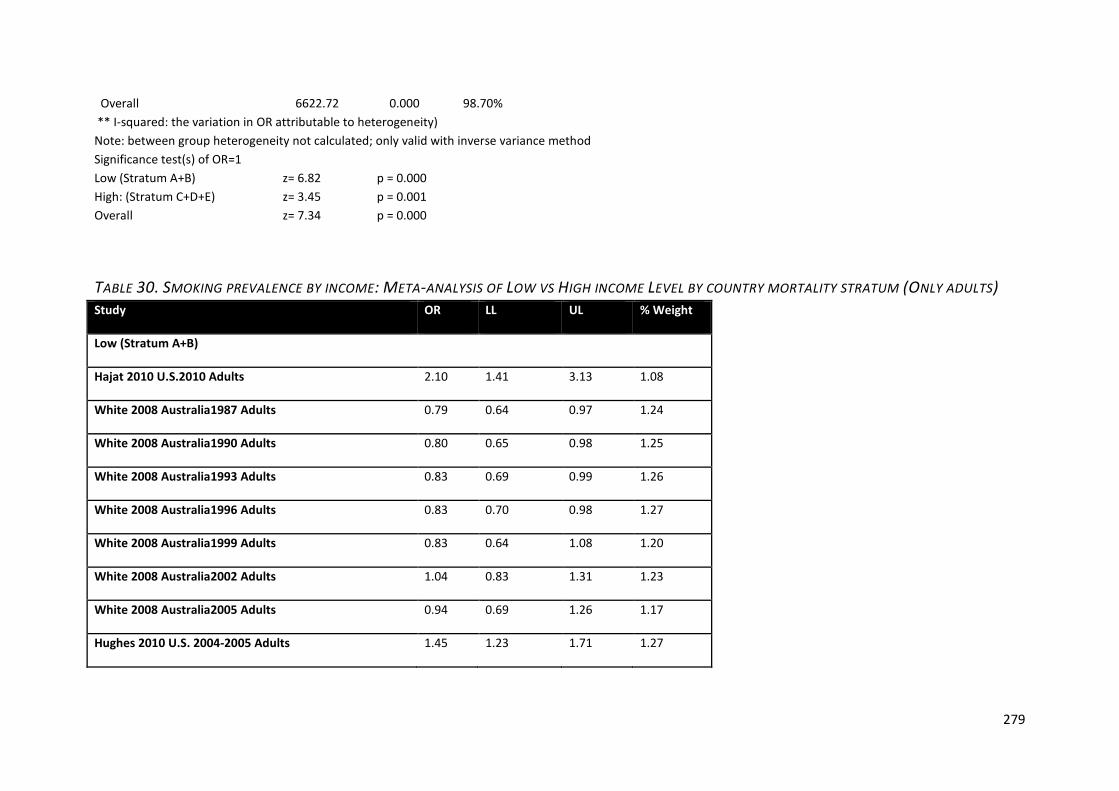
279
Overall 6622.72 0.000 98.70% ** I-squared: the variation in OR attributable to heterogeneity) Note: between group heterogeneity not calculated; only valid with inverse variance method Significance test(s) of OR=1 Low (Stratum A+B) z= 6.82 p = 0.000 High: (Stratum C+D+E) z= 3.45 p = 0.001 Overall z= 7.34 p = 0.000
TABLE 30. SMOKING PREVALENCE BY INCOME: META-ANALYSIS OF LOW VS HIGH INCOME LEVEL BY COUNTRY MORTALITY STRATUM (ONLY ADULTS) Study OR LL UL % Weight
Low (Stratum A+B)
Hajat 2010 U.S.2010 Adults 2.10 1.41 3.13 1.08
White 2008 Australia1987 Adults 0.79 0.64 0.97 1.24
White 2008 Australia1990 Adults 0.80 0.65 0.98 1.25
White 2008 Australia1993 Adults 0.83 0.69 0.99 1.26
White 2008 Australia1996 Adults 0.83 0.70 0.98 1.27
White 2008 Australia1999 Adults 0.83 0.64 1.08 1.20
White 2008 Australia2002 Adults 1.04 0.83 1.31 1.23
White 2008 Australia2005 Adults 0.94 0.69 1.26 1.17
Hughes 2010 U.S. 2004-2005 Adults 1.45 1.23 1.71 1.27
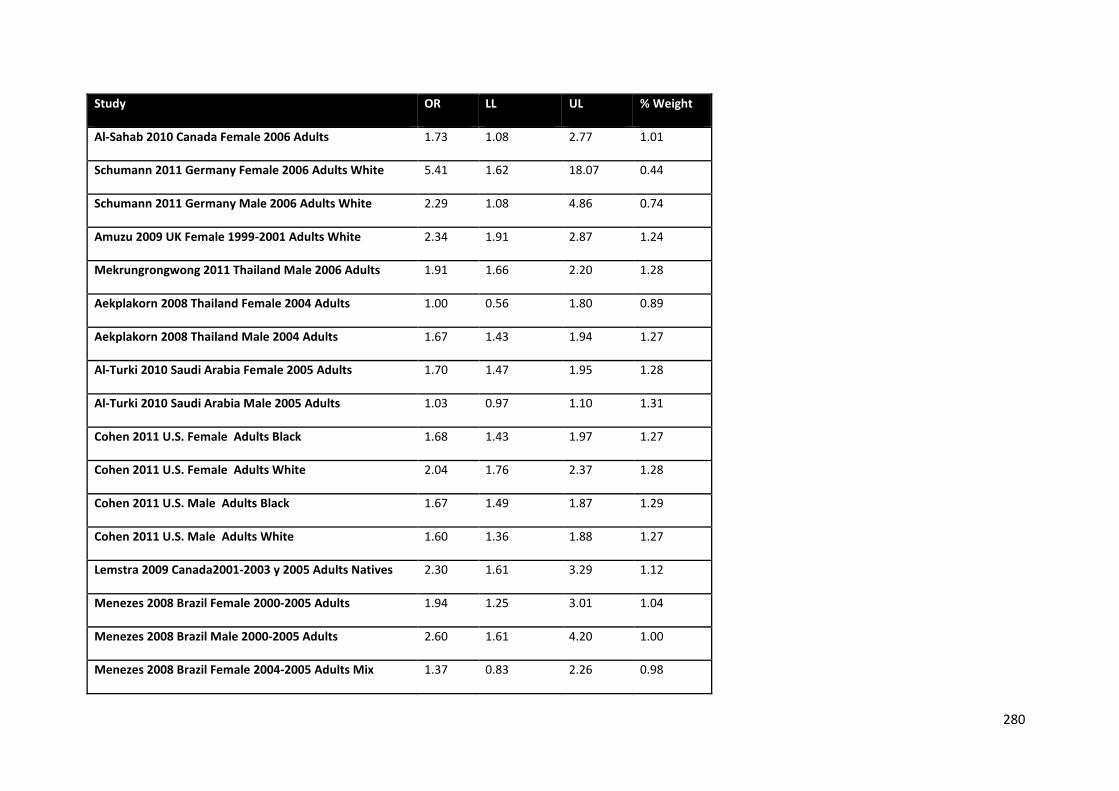
280
Study OR LL UL % Weight
Al-Sahab 2010 Canada Female 2006 Adults 1.73 1.08 2.77 1.01
Schumann 2011 Germany Female 2006 Adults White 5.41 1.62 18.07 0.44
Schumann 2011 Germany Male 2006 Adults White 2.29 1.08 4.86 0.74
Amuzu 2009 UK Female 1999-2001 Adults White 2.34 1.91 2.87 1.24
Mekrungrongwong 2011 Thailand Male 2006 Adults 1.91 1.66 2.20 1.28
Aekplakorn 2008 Thailand Female 2004 Adults 1.00 0.56 1.80 0.89
Aekplakorn 2008 Thailand Male 2004 Adults 1.67 1.43 1.94 1.27
Al-Turki 2010 Saudi Arabia Female 2005 Adults 1.70 1.47 1.95 1.28
Al-Turki 2010 Saudi Arabia Male 2005 Adults 1.03 0.97 1.10 1.31
Cohen 2011 U.S. Female Adults Black 1.68 1.43 1.97 1.27
Cohen 2011 U.S. Female Adults White 2.04 1.76 2.37 1.28
Cohen 2011 U.S. Male Adults Black 1.67 1.49 1.87 1.29
Cohen 2011 U.S. Male Adults White 1.60 1.36 1.88 1.27
Lemstra 2009 Canada2001-2003 y 2005 Adults Natives 2.30 1.61 3.29 1.12
Menezes 2008 Brazil Female 2000-2005 Adults 1.94 1.25 3.01 1.04
Menezes 2008 Brazil Male 2000-2005 Adults 2.60 1.61 4.20 1.00
Menezes 2008 Brazil Female 2004-2005 Adults Mix 1.37 0.83 2.26 0.98

281
Study OR LL UL % Weight
Menezes 2008 Brazil Male 2004-2005 Adults Mix 1.87 1.08 3.24 0.93
Pleis 2009 U.S. 2007 Adults 1.79 1.74 1.84 1.31
Pleis 2010 U.S. 2009 Adults Mix 2.04 1.98 2.10 1.31
Sandin 2010 Brazil2009 Adults 1.92 0.18 20.15 0.15
Woitas- Slubowska 2010 Polland Female 2004 Adults 0.74 0.22 2.52 0.43
Woitas- Slubowska 2010 Polland Male 2004 Adults 1.11 0.36 3.41 0.48
Yin 2011 China2007 Adults 1.17 0.93 1.47 1.23
Zaitune 2012 Brazil2001-2002 Adults 2.86 1.82 4.49 1.03
Park 2010 South Korea Female 2005 Adults mix 1.12 0.61 2.06 0.87
Li 2012 U.S. Male 2002-2003 Adults 1.10 0.57 2.14 0.82
Stringhini 2011 France1995 Adults Mix 1.40 1.22 1.61 1.28
Stringhini 2011 France2007 Adults Mix 1.15 0.95 1.39 1.25
Bortoluzzi 2009 Brazil2005 Adults 1.60 1.00 2.56 1.01
Marrie 2009 U.S. 2006 Adults 1.83 1.36 2.46 1.17
Kuhnen 2009 Brazil2007 Adults 1.49 1.26 1.76 1.27
Johnson 2009 U.S. 2001-2005 Adults 1.13 0.84 1.52 1.17
Mohsin 2010 Australia Female 1995-1997 Adults 2.70 2.60 2.80 1.31
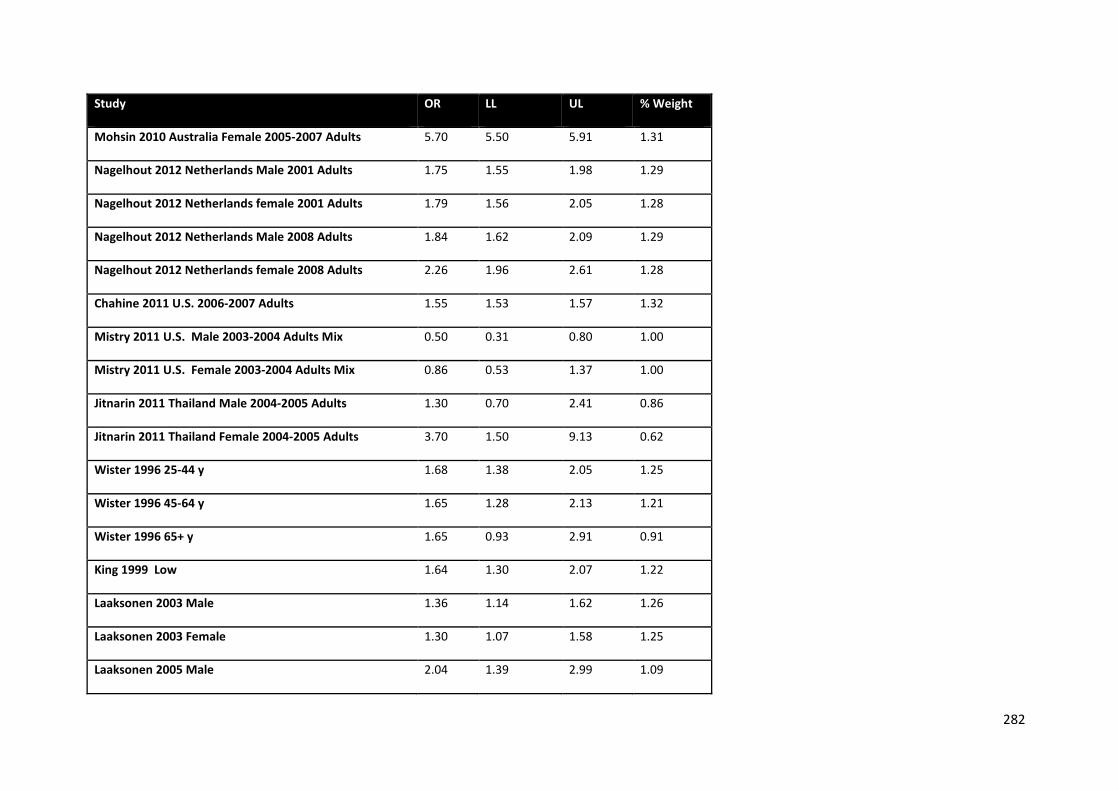
282
Study OR LL UL % Weight
Mohsin 2010 Australia Female 2005-2007 Adults 5.70 5.50 5.91 1.31
Nagelhout 2012 Netherlands Male 2001 Adults 1.75 1.55 1.98 1.29
Nagelhout 2012 Netherlands female 2001 Adults 1.79 1.56 2.05 1.28
Nagelhout 2012 Netherlands Male 2008 Adults 1.84 1.62 2.09 1.29
Nagelhout 2012 Netherlands female 2008 Adults 2.26 1.96 2.61 1.28
Chahine 2011 U.S. 2006-2007 Adults 1.55 1.53 1.57 1.32
Mistry 2011 U.S. Male 2003-2004 Adults Mix 0.50 0.31 0.80 1.00
Mistry 2011 U.S. Female 2003-2004 Adults Mix 0.86 0.53 1.37 1.00
Jitnarin 2011 Thailand Male 2004-2005 Adults 1.30 0.70 2.41 0.86
Jitnarin 2011 Thailand Female 2004-2005 Adults 3.70 1.50 9.13 0.62
Wister 1996 25-44 y 1.68 1.38 2.05 1.25
Wister 1996 45-64 y 1.65 1.28 2.13 1.21
Wister 1996 65+ y 1.65 0.93 2.91 0.91
King 1999 Low 1.64 1.30 2.07 1.22
Laaksonen 2003 Male 1.36 1.14 1.62 1.26
Laaksonen 2003 Female 1.30 1.07 1.58 1.25
Laaksonen 2005 Male 2.04 1.39 2.99 1.09
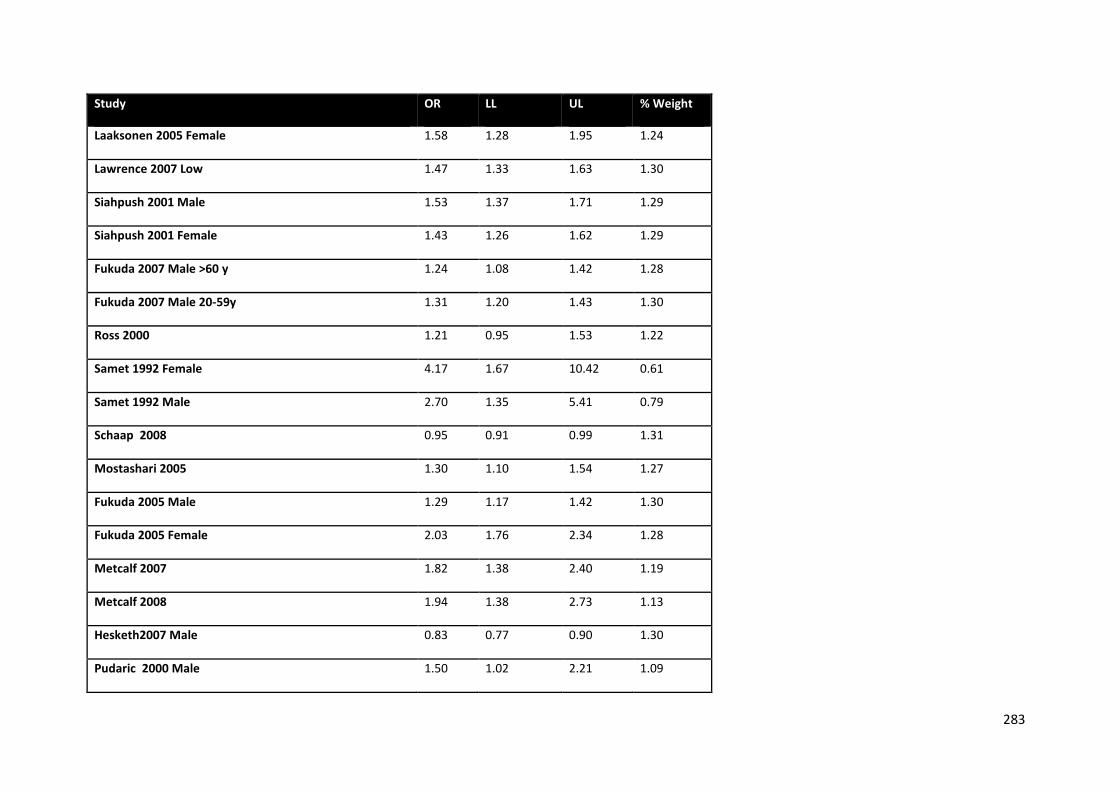
283
Study OR LL UL % Weight
Laaksonen 2005 Female 1.58 1.28 1.95 1.24
Lawrence 2007 Low 1.47 1.33 1.63 1.30
Siahpush 2001 Male 1.53 1.37 1.71 1.29
Siahpush 2001 Female 1.43 1.26 1.62 1.29
Fukuda 2007 Male >60 y 1.24 1.08 1.42 1.28
Fukuda 2007 Male 20-59y 1.31 1.20 1.43 1.30
Ross 2000 1.21 0.95 1.53 1.22
Samet 1992 Female 4.17 1.67 10.42 0.61
Samet 1992 Male 2.70 1.35 5.41 0.79
Schaap 2008 0.95 0.91 0.99 1.31
Mostashari 2005 1.30 1.10 1.54 1.27
Fukuda 2005 Male 1.29 1.17 1.42 1.30
Fukuda 2005 Female 2.03 1.76 2.34 1.28
Metcalf 2007 1.82 1.38 2.40 1.19
Metcalf 2008 1.94 1.38 2.73 1.13
Hesketh2007 Male 0.83 0.77 0.90 1.30
Pudaric 2000 Male 1.50 1.02 2.21 1.09
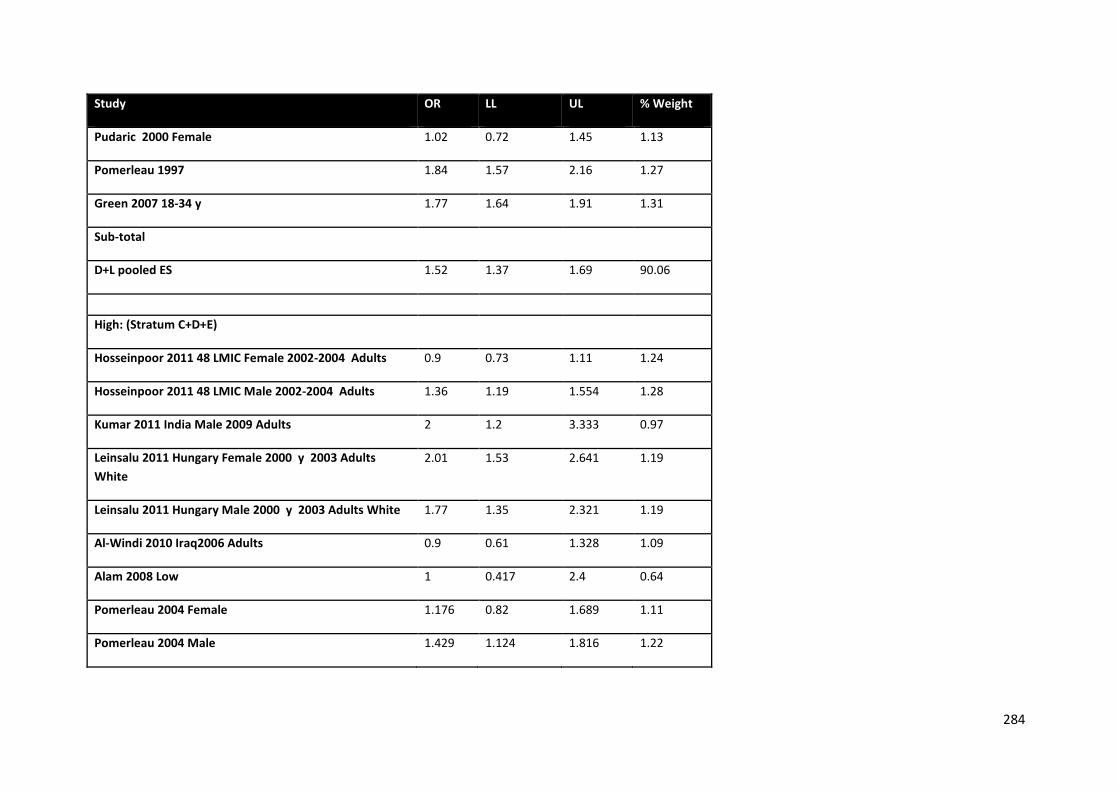
284
Study OR LL UL % Weight
Pudaric 2000 Female 1.02 0.72 1.45 1.13
Pomerleau 1997 1.84 1.57 2.16 1.27
Green 2007 18-34 y 1.77 1.64 1.91 1.31
Sub-total
D+L pooled ES 1.52 1.37 1.69 90.06
High: (Stratum C+D+E)
Hosseinpoor 2011 48 LMIC Female 2002-2004 Adults 0.9 0.73 1.11 1.24
Hosseinpoor 2011 48 LMIC Male 2002-2004 Adults 1.36 1.19 1.554 1.28
Kumar 2011 India Male 2009 Adults 2 1.2 3.333 0.97
Leinsalu 2011 Hungary Female 2000 y 2003 Adults White
2.01 1.53 2.641 1.19
Leinsalu 2011 Hungary Male 2000 y 2003 Adults White 1.77 1.35 2.321 1.19
Al-Windi 2010 Iraq2006 Adults 0.9 0.61 1.328 1.09
Alam 2008 Low 1 0.417 2.4 0.64
Pomerleau 2004 Female 1.176 0.82 1.689 1.11
Pomerleau 2004 Male 1.429 1.124 1.816 1.22
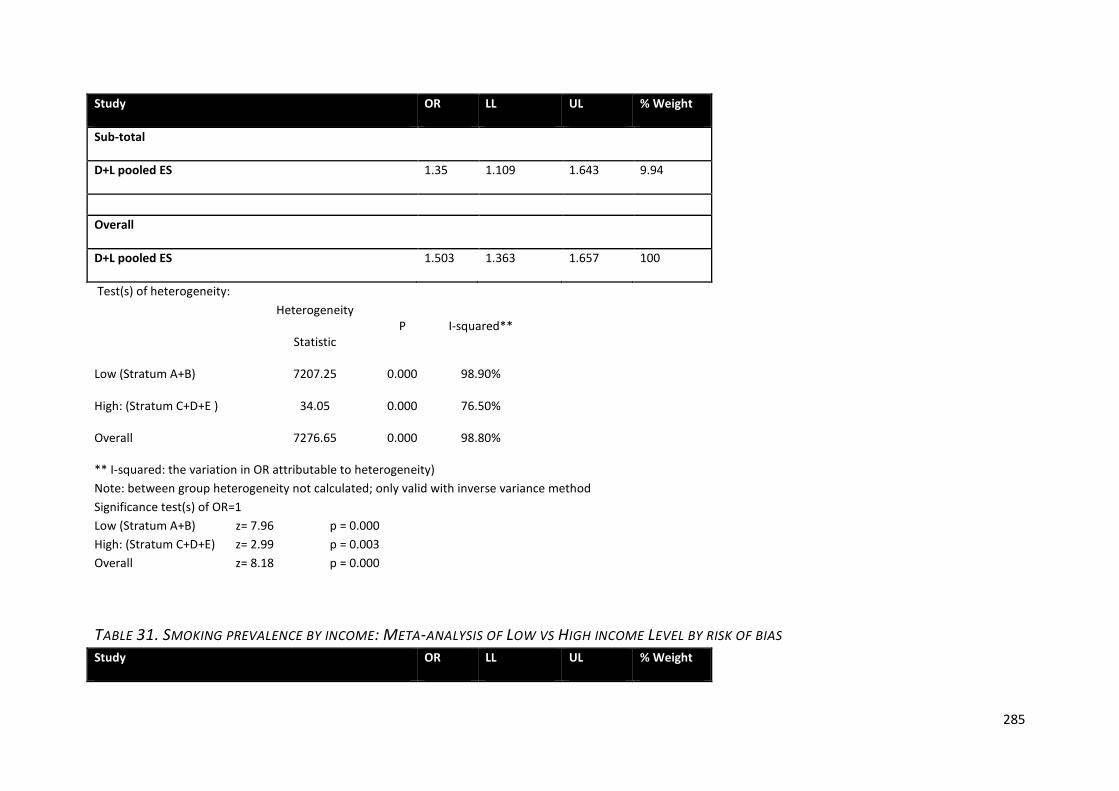
285
Study OR LL UL % Weight
Sub-total
D+L pooled ES 1.35 1.109 1.643 9.94
Overall
D+L pooled ES 1.503 1.363 1.657 100
Test(s) of heterogeneity: Heterogeneity
Statistic P I-squared**
Low (Stratum A+B) 7207.25 0.000 98.90%
High: (Stratum C+D+E ) 34.05 0.000 76.50%
Overall 7276.65 0.000 98.80%
** I-squared: the variation in OR attributable to heterogeneity) Note: between group heterogeneity not calculated; only valid with inverse variance method Significance test(s) of OR=1 Low (Stratum A+B) z= 7.96 p = 0.000 High: (Stratum C+D+E) z= 2.99 p = 0.003 Overall z= 8.18 p = 0.000
TABLE 31. SMOKING PREVALENCE BY INCOME: META-ANALYSIS OF LOW VS HIGH INCOME LEVEL BY RISK OF BIAS Study OR LL UL % Weight

286
Study OR LL UL % Weight
Low
Hajat 2010 U.S.2010 Adults 2.10 1.41 3.13 0.60
Hosseinpoor 2011 48 LMIC Female 2002-2004 Adults 0.90 0.73 1.11 0.69
Hosseinpoor 2011 48 LMIC Male 2002-2004 Adults 1.36 1.19 1.55 0.72
Hughes 2010 U.S. 2004-2005 Adults 1.45 1.23 1.71 0.71
Al-Sahab 2010 Canada Female 2006 Adults 1.73 1.08 2.77 0.56
Schumann 2011 Germany Female 2006 Adults White 5.41 1.62 18.07 0.24
Schumann 2011 Germany Male 2006 Adults White 2.29 1.08 4.86 0.41
Amuzu 2009 UK Female 1999-2001 Adults White 2.34 1.91 2.87 0.69
Aekplakorn 2008 Thailand Female 2004 Adults 1.00 0.56 1.80 0.49
Aekplakorn 2008 Thailand Male 2004 Adults 1.67 1.43 1.94 0.71
Bombard 2012 U.S. Female 2005-2006 NR 5.40 4.10 7.11 0.66
Cohen 2011 U.S. Female Adults Black 1.68 1.43 1.97 0.71
Cohen 2011 U.S. Female Adults White 2.04 1.76 2.37 0.71
Cohen 2011 U.S. Male Adults Black 1.67 1.49 1.87 0.72
Cohen 2011 U.S. Male Adults White 1.60 1.36 1.88 0.71
Leinsalu 2011 Hungary Female 2000 y 2003 Adults 2.01 1.53 2.64 0.67
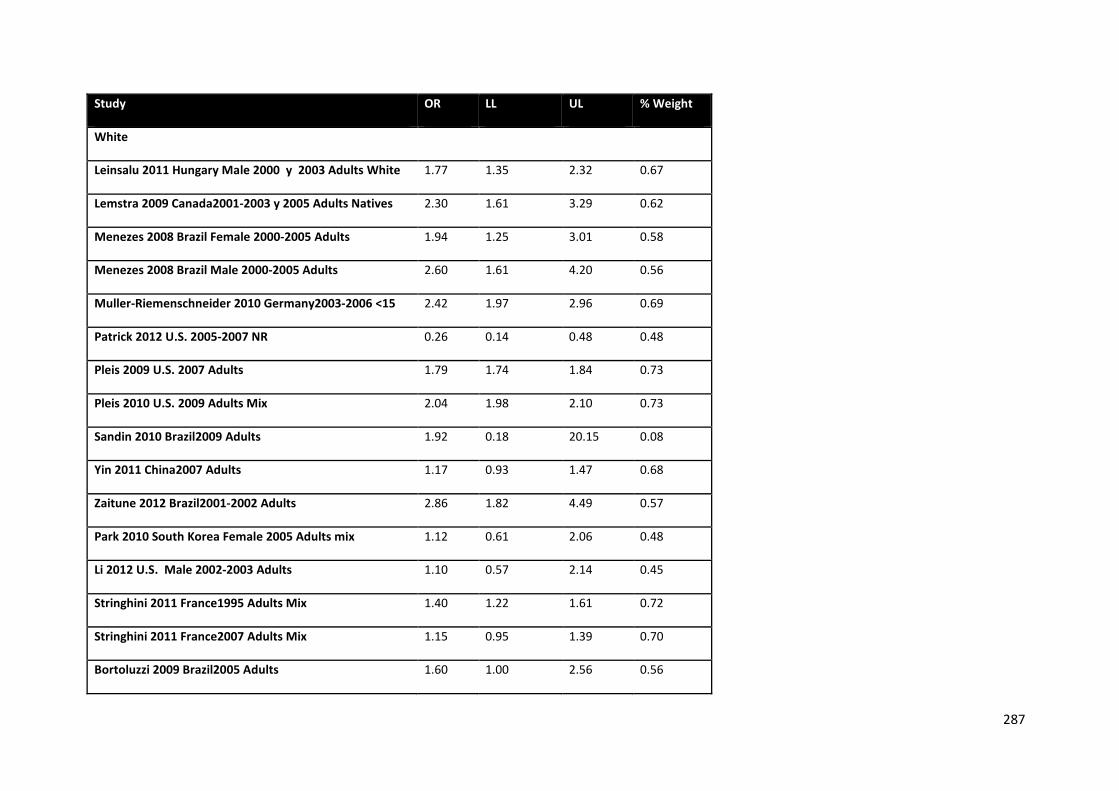
287
Study OR LL UL % Weight
White
Leinsalu 2011 Hungary Male 2000 y 2003 Adults White 1.77 1.35 2.32 0.67
Lemstra 2009 Canada2001-2003 y 2005 Adults Natives 2.30 1.61 3.29 0.62
Menezes 2008 Brazil Female 2000-2005 Adults 1.94 1.25 3.01 0.58
Menezes 2008 Brazil Male 2000-2005 Adults 2.60 1.61 4.20 0.56
Muller-Riemenschneider 2010 Germany2003-2006 <15 2.42 1.97 2.96 0.69
Patrick 2012 U.S. 2005-2007 NR 0.26 0.14 0.48 0.48
Pleis 2009 U.S. 2007 Adults 1.79 1.74 1.84 0.73
Pleis 2010 U.S. 2009 Adults Mix 2.04 1.98 2.10 0.73
Sandin 2010 Brazil2009 Adults 1.92 0.18 20.15 0.08
Yin 2011 China2007 Adults 1.17 0.93 1.47 0.68
Zaitune 2012 Brazil2001-2002 Adults 2.86 1.82 4.49 0.57
Park 2010 South Korea Female 2005 Adults mix 1.12 0.61 2.06 0.48
Li 2012 U.S. Male 2002-2003 Adults 1.10 0.57 2.14 0.45
Stringhini 2011 France1995 Adults Mix 1.40 1.22 1.61 0.72
Stringhini 2011 France2007 Adults Mix 1.15 0.95 1.39 0.70
Bortoluzzi 2009 Brazil2005 Adults 1.60 1.00 2.56 0.56

288
Study OR LL UL % Weight
Kuhnen 2009 Brazil2007 Adults 1.49 1.26 1.76 0.71
Mohsin 2010 Australia Female 1995-1997 Adults 2.70 2.60 2.80 0.73
Mohsin 2010 Australia Female 2005-2007 Adults 5.70 5.50 5.91 0.73
Al-Windi 2010 Iraq2006 Adults 0.90 0.61 1.33 0.61
Mistry 2011 U.S. Male 2003-2004 Adults Mix 0.50 0.31 0.80 0.56
Mistry 2011 U.S. Female 2003-2004 Adults Mix 0.86 0.53 1.37 0.56
Jitnarin 2011 Thailand Male 2004-2005 Adults 1.30 0.70 2.41 0.48
Jitnarin 2011 Thailand Female 2004-2005 Adults 3.70 1.50 9.13 0.34
Acevedo-Garcia 2005 USA1995-6 2.13 2.04 2.22 0.73
Diez-Roux 1999 USA1992-1994 3.70 1.60 8.56 0.37
Mody 2006 USA1996 3.45 3.23 3.69 0.73
Parna 2002 Estonia Female 1996 0.97 0.70 1.34 0.64
Parna 2002 Estonia Male 1996 1.00 0.67 1.49 0.60
Singh 1997 India Female 1991 0.52 0.31 0.87 0.53
Singh 1997 India Male 1991 0.89 0.64 1.24 0.64
Turrell 2002 Australia1995 2.02 1.17 3.49 0.52
King 1999 Low 1.64 1.30 2.07 0.68
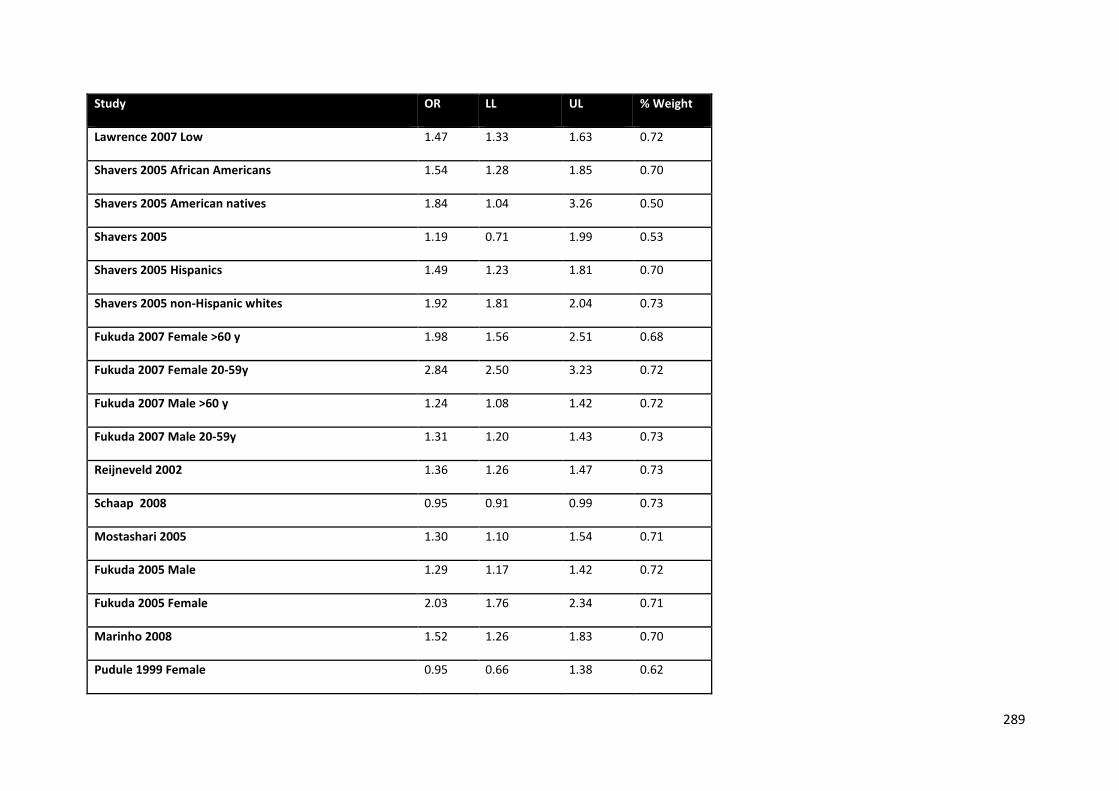
289
Study OR LL UL % Weight
Lawrence 2007 Low 1.47 1.33 1.63 0.72
Shavers 2005 African Americans 1.54 1.28 1.85 0.70
Shavers 2005 American natives 1.84 1.04 3.26 0.50
Shavers 2005 1.19 0.71 1.99 0.53
Shavers 2005 Hispanics 1.49 1.23 1.81 0.70
Shavers 2005 non-Hispanic whites 1.92 1.81 2.04 0.73
Fukuda 2007 Female >60 y 1.98 1.56 2.51 0.68
Fukuda 2007 Female 20-59y 2.84 2.50 3.23 0.72
Fukuda 2007 Male >60 y 1.24 1.08 1.42 0.72
Fukuda 2007 Male 20-59y 1.31 1.20 1.43 0.73
Reijneveld 2002 1.36 1.26 1.47 0.73
Schaap 2008 0.95 0.91 0.99 0.73
Mostashari 2005 1.30 1.10 1.54 0.71
Fukuda 2005 Male 1.29 1.17 1.42 0.72
Fukuda 2005 Female 2.03 1.76 2.34 0.71
Marinho 2008 1.52 1.26 1.83 0.70
Pudule 1999 Female 0.95 0.66 1.38 0.62
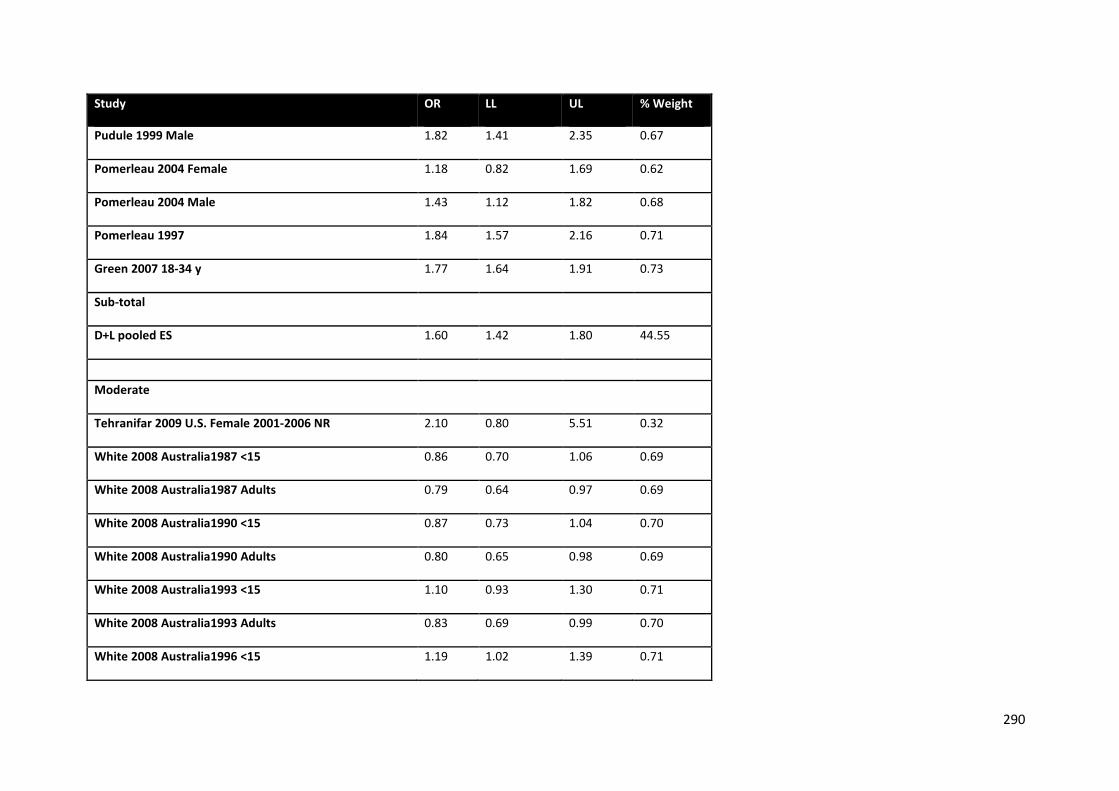
290
Study OR LL UL % Weight
Pudule 1999 Male 1.82 1.41 2.35 0.67
Pomerleau 2004 Female 1.18 0.82 1.69 0.62
Pomerleau 2004 Male 1.43 1.12 1.82 0.68
Pomerleau 1997 1.84 1.57 2.16 0.71
Green 2007 18-34 y 1.77 1.64 1.91 0.73
Sub-total
D+L pooled ES 1.60 1.42 1.80 44.55
Moderate
Tehranifar 2009 U.S. Female 2001-2006 NR 2.10 0.80 5.51 0.32
White 2008 Australia1987 <15 0.86 0.70 1.06 0.69
White 2008 Australia1987 Adults 0.79 0.64 0.97 0.69
White 2008 Australia1990 <15 0.87 0.73 1.04 0.70
White 2008 Australia1990 Adults 0.80 0.65 0.98 0.69
White 2008 Australia1993 <15 1.10 0.93 1.30 0.71
White 2008 Australia1993 Adults 0.83 0.69 0.99 0.70
White 2008 Australia1996 <15 1.19 1.02 1.39 0.71
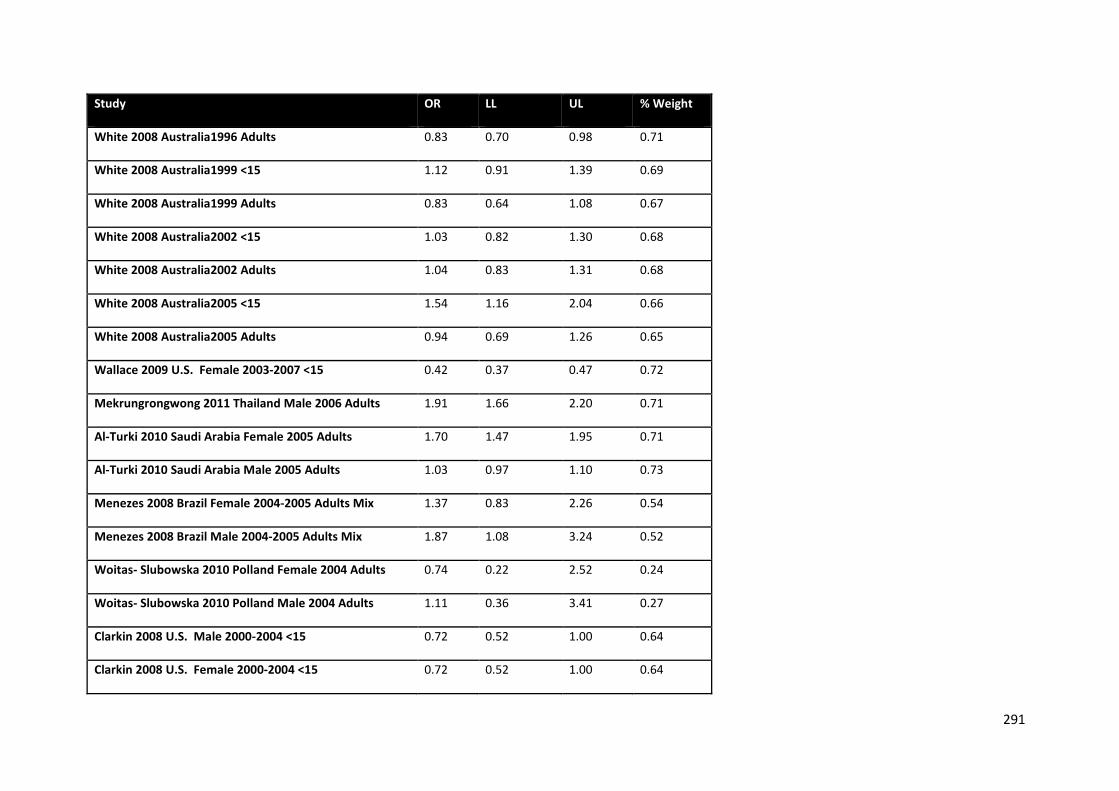
291
Study OR LL UL % Weight
White 2008 Australia1996 Adults 0.83 0.70 0.98 0.71
White 2008 Australia1999 <15 1.12 0.91 1.39 0.69
White 2008 Australia1999 Adults 0.83 0.64 1.08 0.67
White 2008 Australia2002 <15 1.03 0.82 1.30 0.68
White 2008 Australia2002 Adults 1.04 0.83 1.31 0.68
White 2008 Australia2005 <15 1.54 1.16 2.04 0.66
White 2008 Australia2005 Adults 0.94 0.69 1.26 0.65
Wallace 2009 U.S. Female 2003-2007 <15 0.42 0.37 0.47 0.72
Mekrungrongwong 2011 Thailand Male 2006 Adults 1.91 1.66 2.20 0.71
Al-Turki 2010 Saudi Arabia Female 2005 Adults 1.70 1.47 1.95 0.71
Al-Turki 2010 Saudi Arabia Male 2005 Adults 1.03 0.97 1.10 0.73
Menezes 2008 Brazil Female 2004-2005 Adults Mix 1.37 0.83 2.26 0.54
Menezes 2008 Brazil Male 2004-2005 Adults Mix 1.87 1.08 3.24 0.52
Woitas- Slubowska 2010 Polland Female 2004 Adults 0.74 0.22 2.52 0.24
Woitas- Slubowska 2010 Polland Male 2004 Adults 1.11 0.36 3.41 0.27
Clarkin 2008 U.S. Male 2000-2004 <15 0.72 0.52 1.00 0.64
Clarkin 2008 U.S. Female 2000-2004 <15 0.72 0.52 1.00 0.64
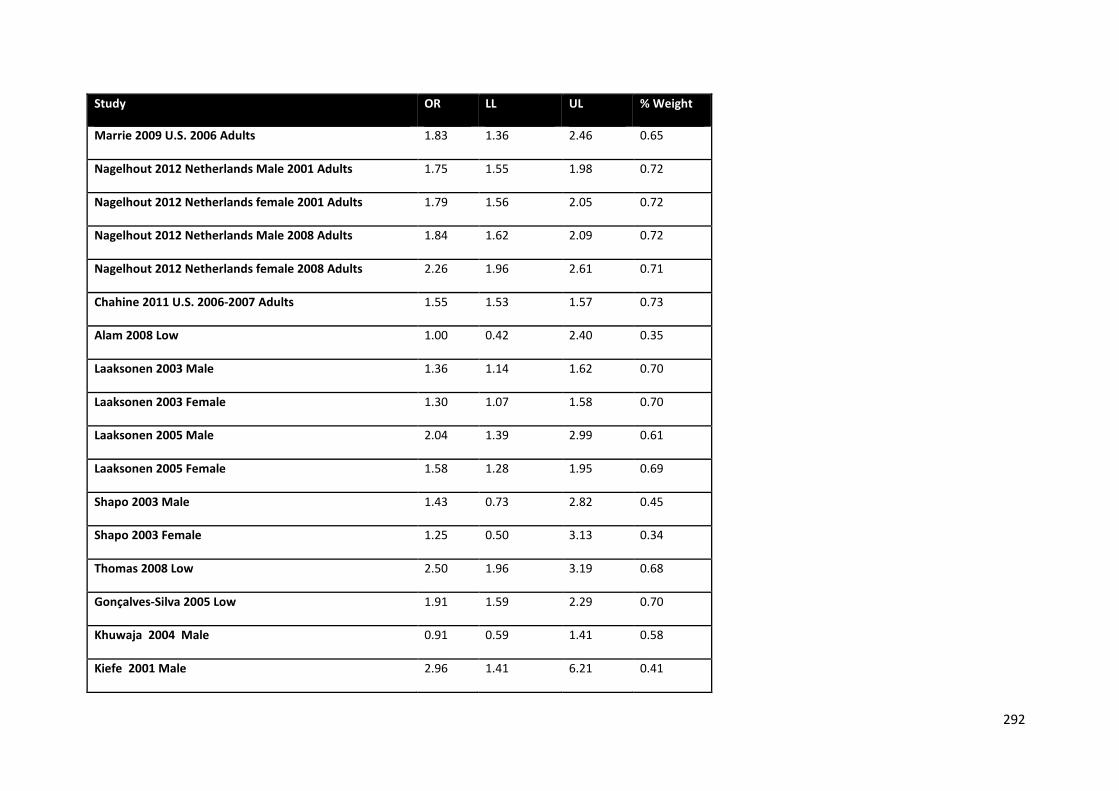
292
Study OR LL UL % Weight
Marrie 2009 U.S. 2006 Adults 1.83 1.36 2.46 0.65
Nagelhout 2012 Netherlands Male 2001 Adults 1.75 1.55 1.98 0.72
Nagelhout 2012 Netherlands female 2001 Adults 1.79 1.56 2.05 0.72
Nagelhout 2012 Netherlands Male 2008 Adults 1.84 1.62 2.09 0.72
Nagelhout 2012 Netherlands female 2008 Adults 2.26 1.96 2.61 0.71
Chahine 2011 U.S. 2006-2007 Adults 1.55 1.53 1.57 0.73
Alam 2008 Low 1.00 0.42 2.40 0.35
Laaksonen 2003 Male 1.36 1.14 1.62 0.70
Laaksonen 2003 Female 1.30 1.07 1.58 0.70
Laaksonen 2005 Male 2.04 1.39 2.99 0.61
Laaksonen 2005 Female 1.58 1.28 1.95 0.69
Shapo 2003 Male 1.43 0.73 2.82 0.45
Shapo 2003 Female 1.25 0.50 3.13 0.34
Thomas 2008 Low 2.50 1.96 3.19 0.68
Gonçalves-Silva 2005 Low 1.91 1.59 2.29 0.70
Khuwaja 2004 Male 0.91 0.59 1.41 0.58
Kiefe 2001 Male 2.96 1.41 6.21 0.41
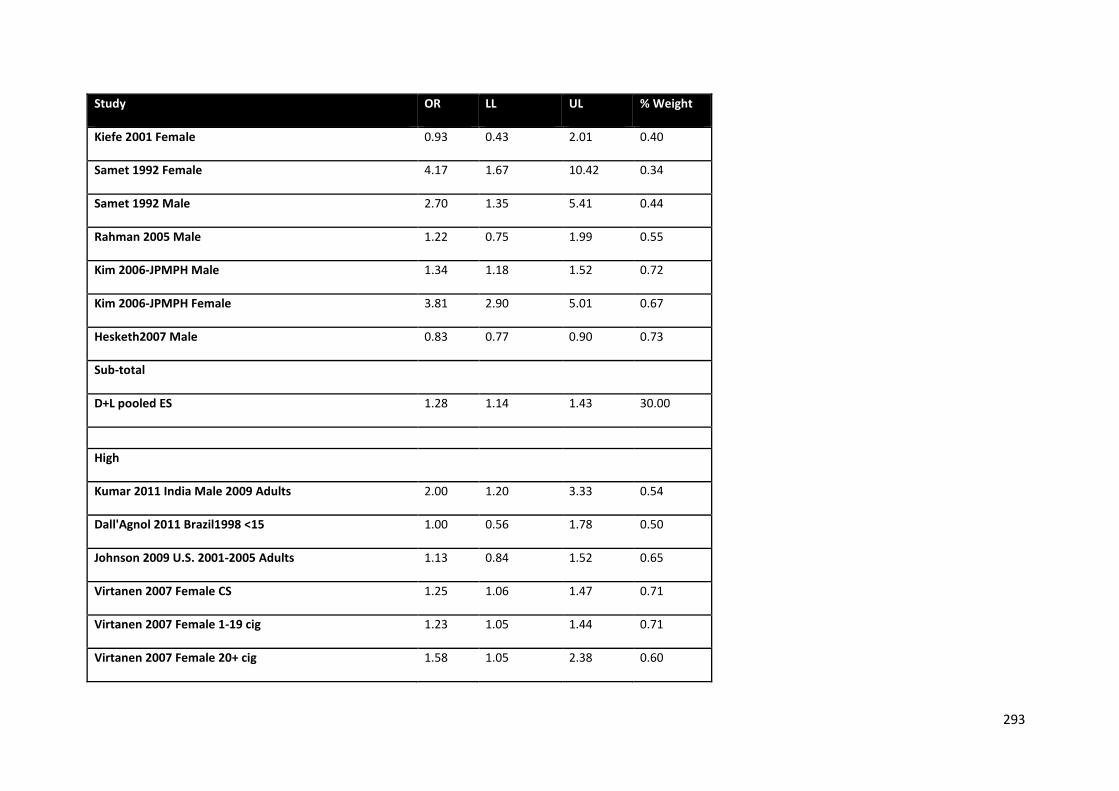
293
Study OR LL UL % Weight
Kiefe 2001 Female 0.93 0.43 2.01 0.40
Samet 1992 Female 4.17 1.67 10.42 0.34
Samet 1992 Male 2.70 1.35 5.41 0.44
Rahman 2005 Male 1.22 0.75 1.99 0.55
Kim 2006-JPMPH Male 1.34 1.18 1.52 0.72
Kim 2006-JPMPH Female 3.81 2.90 5.01 0.67
Hesketh2007 Male 0.83 0.77 0.90 0.73
Sub-total
D+L pooled ES 1.28 1.14 1.43 30.00
High
Kumar 2011 India Male 2009 Adults 2.00 1.20 3.33 0.54
Dall'Agnol 2011 Brazil1998 <15 1.00 0.56 1.78 0.50
Johnson 2009 U.S. 2001-2005 Adults 1.13 0.84 1.52 0.65
Virtanen 2007 Female CS 1.25 1.06 1.47 0.71
Virtanen 2007 Female 1-19 cig 1.23 1.05 1.44 0.71
Virtanen 2007 Female 20+ cig 1.58 1.05 2.38 0.60
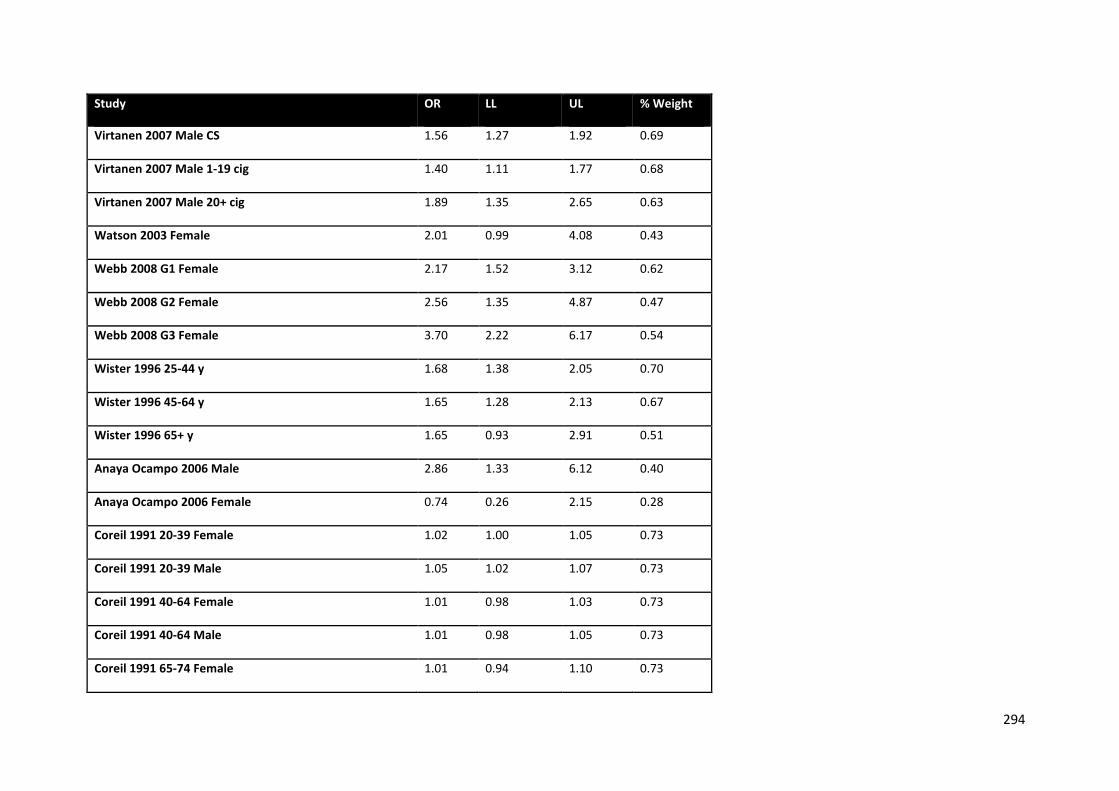
294
Study OR LL UL % Weight
Virtanen 2007 Male CS 1.56 1.27 1.92 0.69
Virtanen 2007 Male 1-19 cig 1.40 1.11 1.77 0.68
Virtanen 2007 Male 20+ cig 1.89 1.35 2.65 0.63
Watson 2003 Female 2.01 0.99 4.08 0.43
Webb 2008 G1 Female 2.17 1.52 3.12 0.62
Webb 2008 G2 Female 2.56 1.35 4.87 0.47
Webb 2008 G3 Female 3.70 2.22 6.17 0.54
Wister 1996 25-44 y 1.68 1.38 2.05 0.70
Wister 1996 45-64 y 1.65 1.28 2.13 0.67
Wister 1996 65+ y 1.65 0.93 2.91 0.51
Anaya Ocampo 2006 Male 2.86 1.33 6.12 0.40
Anaya Ocampo 2006 Female 0.74 0.26 2.15 0.28
Coreil 1991 20-39 Female 1.02 1.00 1.05 0.73
Coreil 1991 20-39 Male 1.05 1.02 1.07 0.73
Coreil 1991 40-64 Female 1.01 0.98 1.03 0.73
Coreil 1991 40-64 Male 1.01 0.98 1.05 0.73
Coreil 1991 65-74 Female 1.01 0.94 1.10 0.73
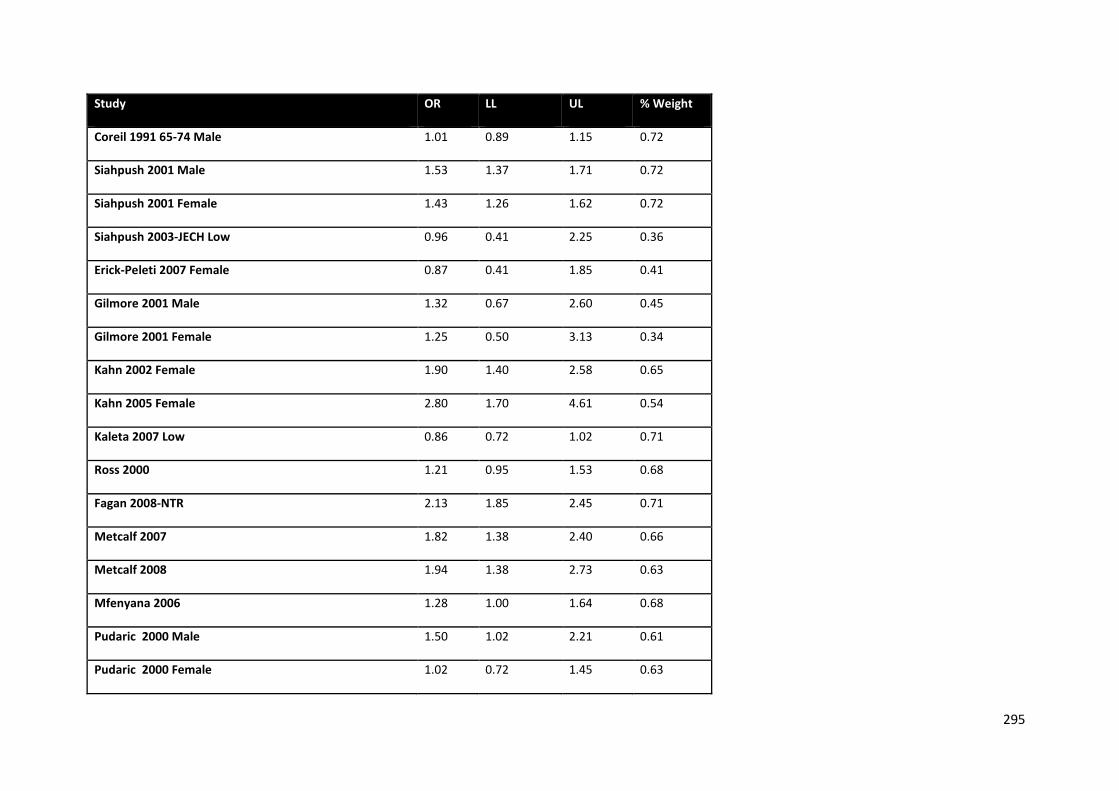
295
Study OR LL UL % Weight
Coreil 1991 65-74 Male 1.01 0.89 1.15 0.72
Siahpush 2001 Male 1.53 1.37 1.71 0.72
Siahpush 2001 Female 1.43 1.26 1.62 0.72
Siahpush 2003-JECH Low 0.96 0.41 2.25 0.36
Erick-Peleti 2007 Female 0.87 0.41 1.85 0.41
Gilmore 2001 Male 1.32 0.67 2.60 0.45
Gilmore 2001 Female 1.25 0.50 3.13 0.34
Kahn 2002 Female 1.90 1.40 2.58 0.65
Kahn 2005 Female 2.80 1.70 4.61 0.54
Kaleta 2007 Low 0.86 0.72 1.02 0.71
Ross 2000 1.21 0.95 1.53 0.68
Fagan 2008-NTR 2.13 1.85 2.45 0.71
Metcalf 2007 1.82 1.38 2.40 0.66
Metcalf 2008 1.94 1.38 2.73 0.63
Mfenyana 2006 1.28 1.00 1.64 0.68
Pudaric 2000 Male 1.50 1.02 2.21 0.61
Pudaric 2000 Female 1.02 0.72 1.45 0.63

296
Study OR LL UL % Weight
Moreira 1995 1.03 0.84 1.27 0.69
Silvestre Garcia 1990 Low 0.67 0.40 1.12 0.53
Sub-total
D+L pooled ES 1.32 1.25 1.40 25.45
Overall
D+L pooled ES 1.45 1.35 1.56 100.00
Test(s) of heterogeneity:
Heterogeneity Statistic
P I-squared**
Low 5962.93 0.000 98.80% Moderate 1333.21 0.000 96.40% High 401.16 0.000 89.80% Overall 13670.32 0.000 98.80%
** I-squared: the variation in OR attributable to heterogeneity Note: between group heterogeneity not calculated; only valid with inverse variance method Significance test(s) of OR=1 Low z= 7.68 p = 0.000 Moderate z= 4.28 p = 0.000 High z= 9.21 p = 0.000 Overall z= 10.03 p = 0.000
TABLE 32. SMOKING PREVALENCE BY INCOME: META-ANALYSIS OF LOW VS HIGH INCOME LEVEL BY RISK OF BIAS (ONLY ADULTS)
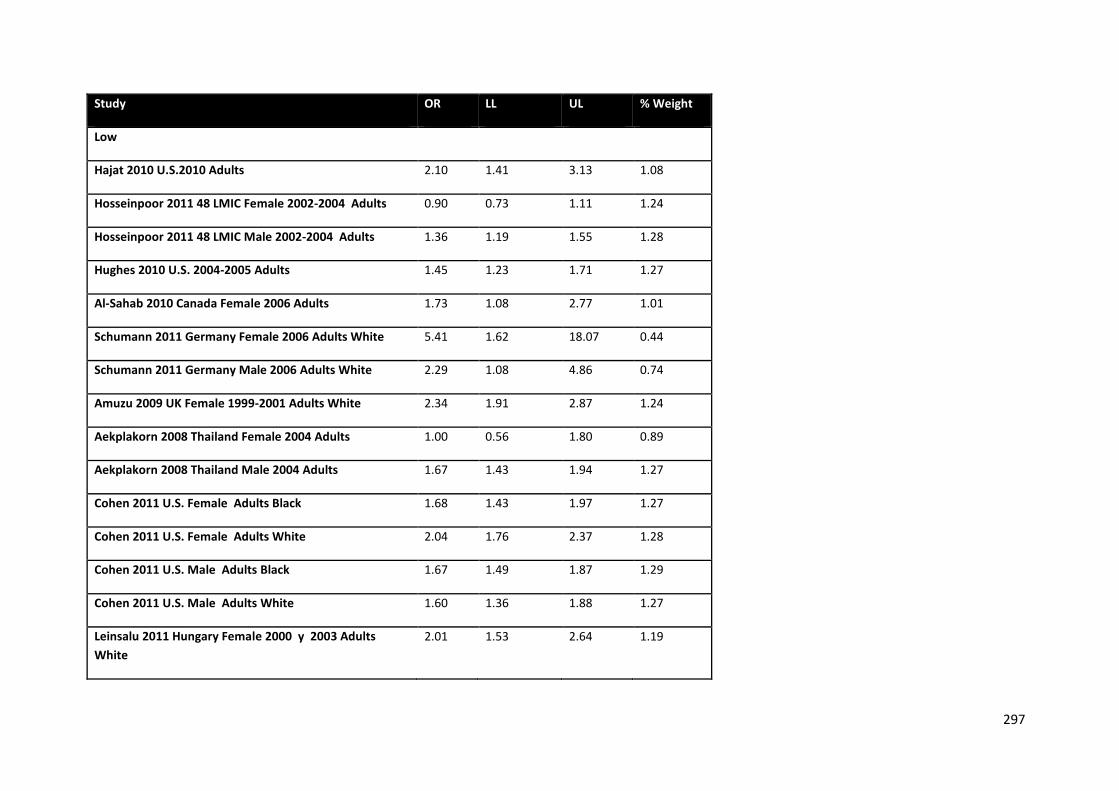
297
Study OR LL UL % Weight
Low
Hajat 2010 U.S.2010 Adults 2.10 1.41 3.13 1.08
Hosseinpoor 2011 48 LMIC Female 2002-2004 Adults 0.90 0.73 1.11 1.24
Hosseinpoor 2011 48 LMIC Male 2002-2004 Adults 1.36 1.19 1.55 1.28
Hughes 2010 U.S. 2004-2005 Adults 1.45 1.23 1.71 1.27
Al-Sahab 2010 Canada Female 2006 Adults 1.73 1.08 2.77 1.01
Schumann 2011 Germany Female 2006 Adults White 5.41 1.62 18.07 0.44
Schumann 2011 Germany Male 2006 Adults White 2.29 1.08 4.86 0.74
Amuzu 2009 UK Female 1999-2001 Adults White 2.34 1.91 2.87 1.24
Aekplakorn 2008 Thailand Female 2004 Adults 1.00 0.56 1.80 0.89
Aekplakorn 2008 Thailand Male 2004 Adults 1.67 1.43 1.94 1.27
Cohen 2011 U.S. Female Adults Black 1.68 1.43 1.97 1.27
Cohen 2011 U.S. Female Adults White 2.04 1.76 2.37 1.28
Cohen 2011 U.S. Male Adults Black 1.67 1.49 1.87 1.29
Cohen 2011 U.S. Male Adults White 1.60 1.36 1.88 1.27
Leinsalu 2011 Hungary Female 2000 y 2003 Adults White
2.01 1.53 2.64 1.19
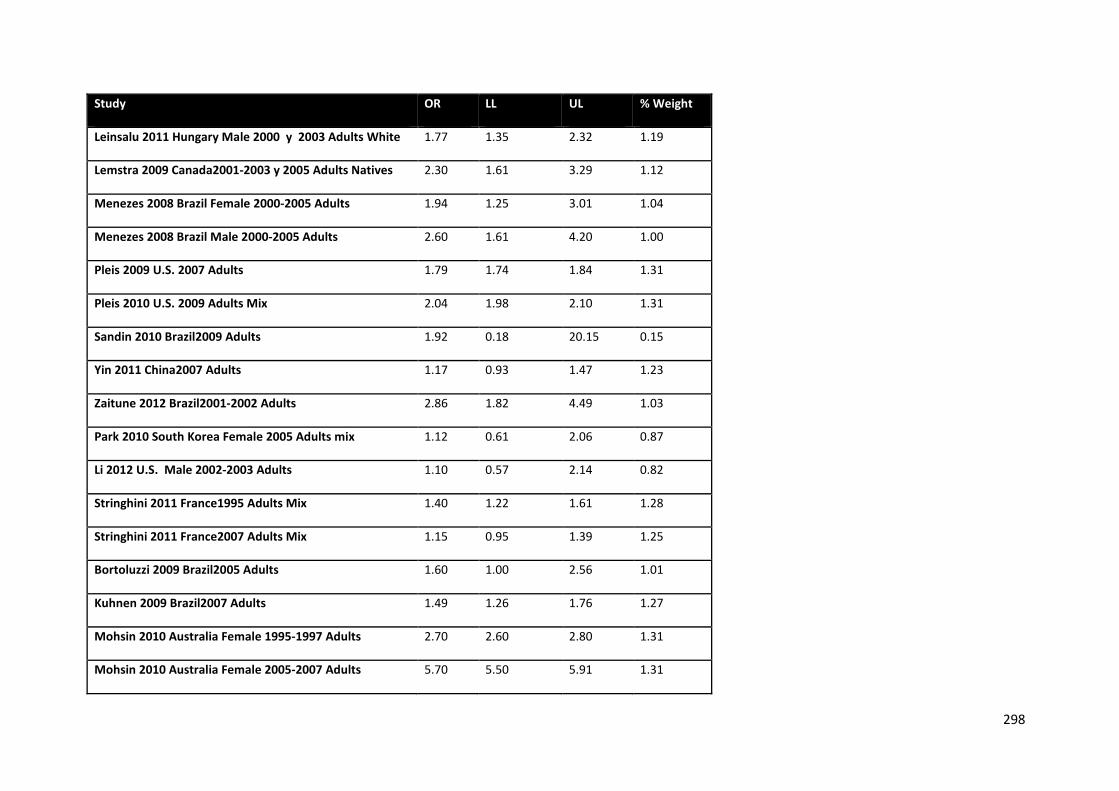
298
Study OR LL UL % Weight
Leinsalu 2011 Hungary Male 2000 y 2003 Adults White 1.77 1.35 2.32 1.19
Lemstra 2009 Canada2001-2003 y 2005 Adults Natives 2.30 1.61 3.29 1.12
Menezes 2008 Brazil Female 2000-2005 Adults 1.94 1.25 3.01 1.04
Menezes 2008 Brazil Male 2000-2005 Adults 2.60 1.61 4.20 1.00
Pleis 2009 U.S. 2007 Adults 1.79 1.74 1.84 1.31
Pleis 2010 U.S. 2009 Adults Mix 2.04 1.98 2.10 1.31
Sandin 2010 Brazil2009 Adults 1.92 0.18 20.15 0.15
Yin 2011 China2007 Adults 1.17 0.93 1.47 1.23
Zaitune 2012 Brazil2001-2002 Adults 2.86 1.82 4.49 1.03
Park 2010 South Korea Female 2005 Adults mix 1.12 0.61 2.06 0.87
Li 2012 U.S. Male 2002-2003 Adults 1.10 0.57 2.14 0.82
Stringhini 2011 France1995 Adults Mix 1.40 1.22 1.61 1.28
Stringhini 2011 France2007 Adults Mix 1.15 0.95 1.39 1.25
Bortoluzzi 2009 Brazil2005 Adults 1.60 1.00 2.56 1.01
Kuhnen 2009 Brazil2007 Adults 1.49 1.26 1.76 1.27
Mohsin 2010 Australia Female 1995-1997 Adults 2.70 2.60 2.80 1.31
Mohsin 2010 Australia Female 2005-2007 Adults 5.70 5.50 5.91 1.31
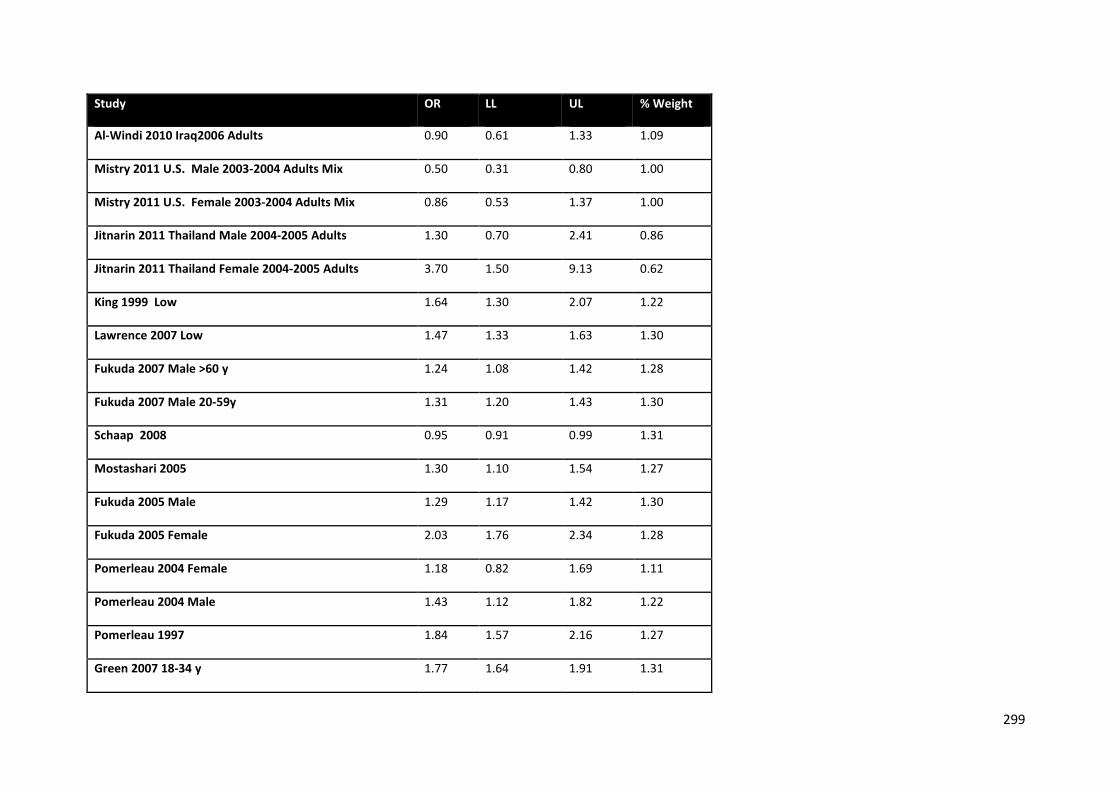
299
Study OR LL UL % Weight
Al-Windi 2010 Iraq2006 Adults 0.90 0.61 1.33 1.09
Mistry 2011 U.S. Male 2003-2004 Adults Mix 0.50 0.31 0.80 1.00
Mistry 2011 U.S. Female 2003-2004 Adults Mix 0.86 0.53 1.37 1.00
Jitnarin 2011 Thailand Male 2004-2005 Adults 1.30 0.70 2.41 0.86
Jitnarin 2011 Thailand Female 2004-2005 Adults 3.70 1.50 9.13 0.62
King 1999 Low 1.64 1.30 2.07 1.22
Lawrence 2007 Low 1.47 1.33 1.63 1.30
Fukuda 2007 Male >60 y 1.24 1.08 1.42 1.28
Fukuda 2007 Male 20-59y 1.31 1.20 1.43 1.30
Schaap 2008 0.95 0.91 0.99 1.31
Mostashari 2005 1.30 1.10 1.54 1.27
Fukuda 2005 Male 1.29 1.17 1.42 1.30
Fukuda 2005 Female 2.03 1.76 2.34 1.28
Pomerleau 2004 Female 1.18 0.82 1.69 1.11
Pomerleau 2004 Male 1.43 1.12 1.82 1.22
Pomerleau 1997 1.84 1.57 2.16 1.27
Green 2007 18-34 y 1.77 1.64 1.91 1.31
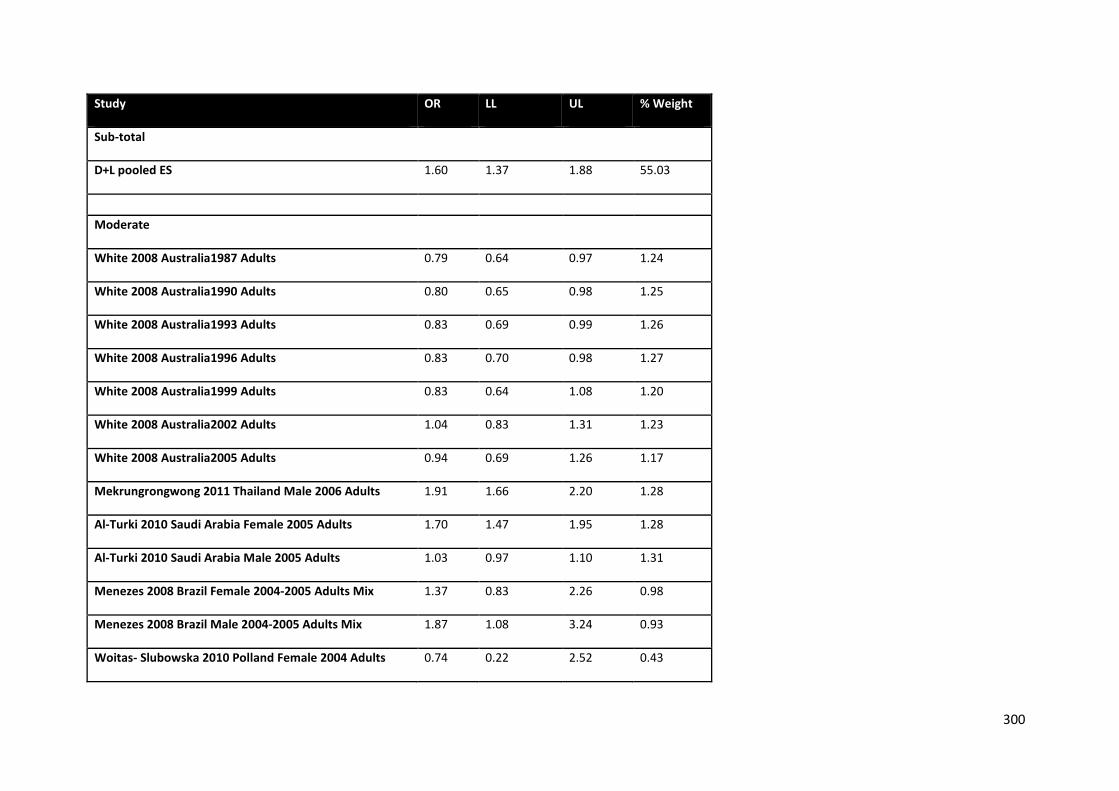
300
Study OR LL UL % Weight
Sub-total
D+L pooled ES 1.60 1.37 1.88 55.03
Moderate
White 2008 Australia1987 Adults 0.79 0.64 0.97 1.24
White 2008 Australia1990 Adults 0.80 0.65 0.98 1.25
White 2008 Australia1993 Adults 0.83 0.69 0.99 1.26
White 2008 Australia1996 Adults 0.83 0.70 0.98 1.27
White 2008 Australia1999 Adults 0.83 0.64 1.08 1.20
White 2008 Australia2002 Adults 1.04 0.83 1.31 1.23
White 2008 Australia2005 Adults 0.94 0.69 1.26 1.17
Mekrungrongwong 2011 Thailand Male 2006 Adults 1.91 1.66 2.20 1.28
Al-Turki 2010 Saudi Arabia Female 2005 Adults 1.70 1.47 1.95 1.28
Al-Turki 2010 Saudi Arabia Male 2005 Adults 1.03 0.97 1.10 1.31
Menezes 2008 Brazil Female 2004-2005 Adults Mix 1.37 0.83 2.26 0.98
Menezes 2008 Brazil Male 2004-2005 Adults Mix 1.87 1.08 3.24 0.93
Woitas- Slubowska 2010 Polland Female 2004 Adults 0.74 0.22 2.52 0.43
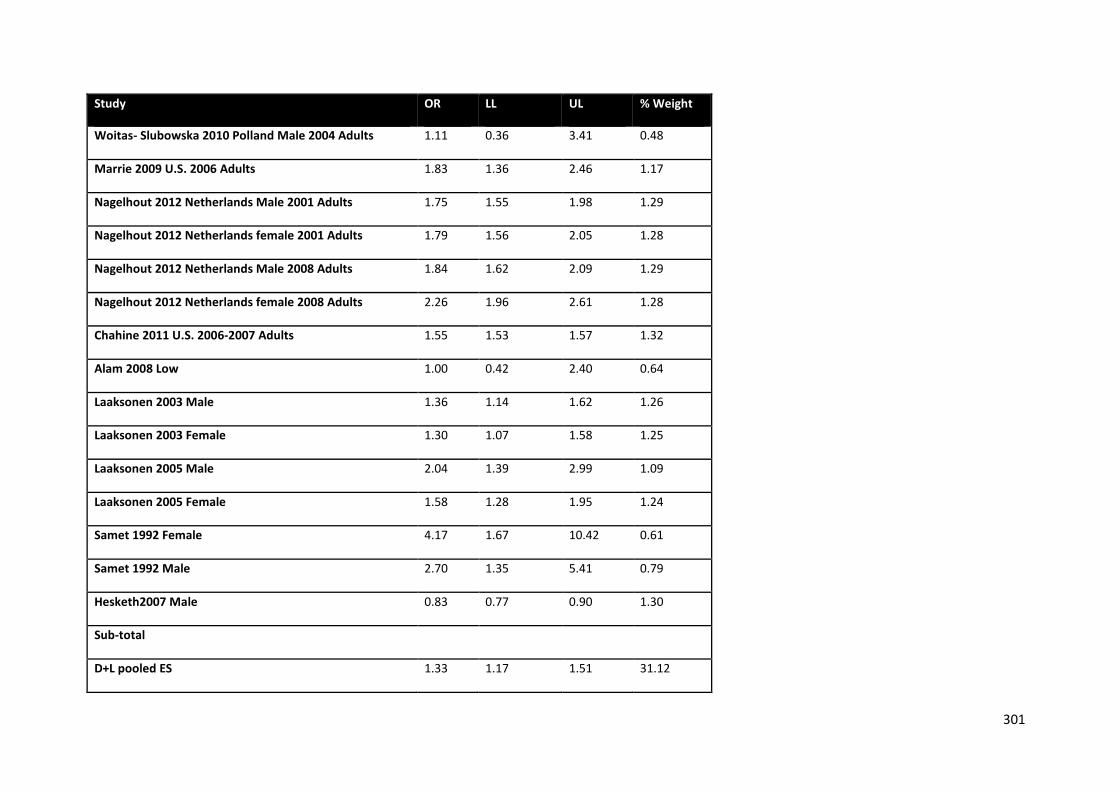
301
Study OR LL UL % Weight
Woitas- Slubowska 2010 Polland Male 2004 Adults 1.11 0.36 3.41 0.48
Marrie 2009 U.S. 2006 Adults 1.83 1.36 2.46 1.17
Nagelhout 2012 Netherlands Male 2001 Adults 1.75 1.55 1.98 1.29
Nagelhout 2012 Netherlands female 2001 Adults 1.79 1.56 2.05 1.28
Nagelhout 2012 Netherlands Male 2008 Adults 1.84 1.62 2.09 1.29
Nagelhout 2012 Netherlands female 2008 Adults 2.26 1.96 2.61 1.28
Chahine 2011 U.S. 2006-2007 Adults 1.55 1.53 1.57 1.32
Alam 2008 Low 1.00 0.42 2.40 0.64
Laaksonen 2003 Male 1.36 1.14 1.62 1.26
Laaksonen 2003 Female 1.30 1.07 1.58 1.25
Laaksonen 2005 Male 2.04 1.39 2.99 1.09
Laaksonen 2005 Female 1.58 1.28 1.95 1.24
Samet 1992 Female 4.17 1.67 10.42 0.61
Samet 1992 Male 2.70 1.35 5.41 0.79
Hesketh2007 Male 0.83 0.77 0.90 1.30
Sub-total
D+L pooled ES 1.33 1.17 1.51 31.12
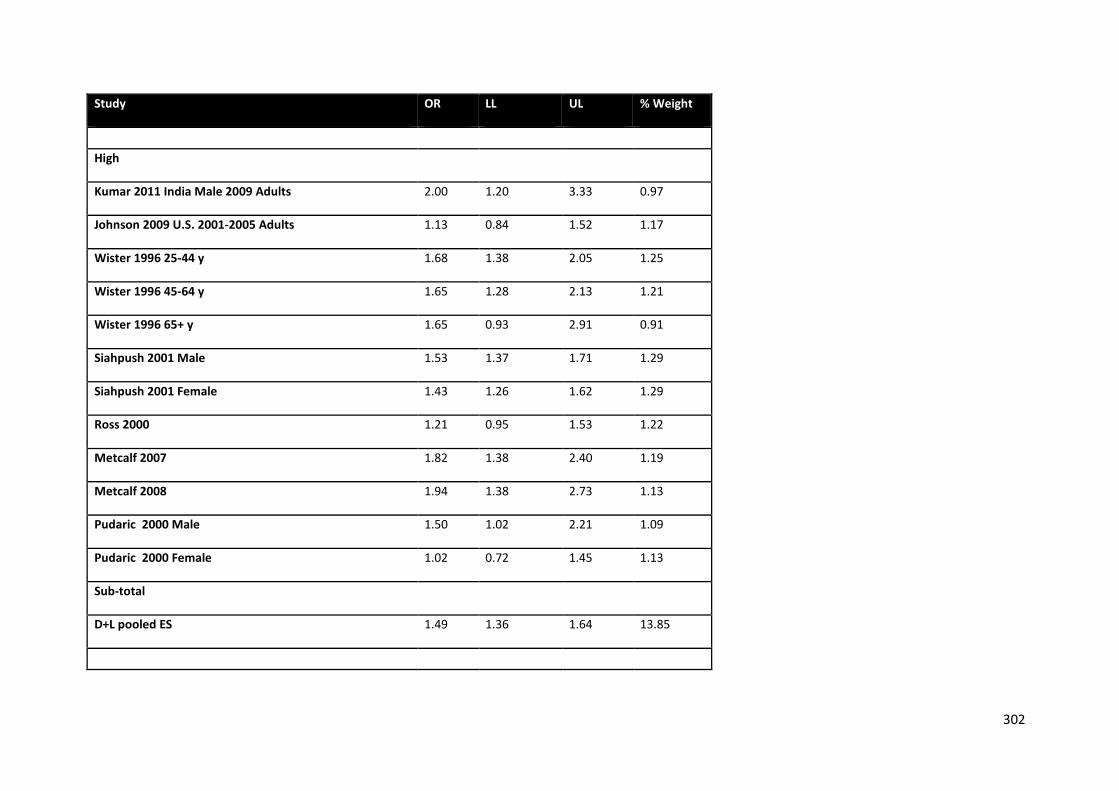
302
Study OR LL UL % Weight
High
Kumar 2011 India Male 2009 Adults 2.00 1.20 3.33 0.97
Johnson 2009 U.S. 2001-2005 Adults 1.13 0.84 1.52 1.17
Wister 1996 25-44 y 1.68 1.38 2.05 1.25
Wister 1996 45-64 y 1.65 1.28 2.13 1.21
Wister 1996 65+ y 1.65 0.93 2.91 0.91
Siahpush 2001 Male 1.53 1.37 1.71 1.29
Siahpush 2001 Female 1.43 1.26 1.62 1.29
Ross 2000 1.21 0.95 1.53 1.22
Metcalf 2007 1.82 1.38 2.40 1.19
Metcalf 2008 1.94 1.38 2.73 1.13
Pudaric 2000 Male 1.50 1.02 2.21 1.09
Pudaric 2000 Female 1.02 0.72 1.45 1.13
Sub-total
D+L pooled ES 1.49 1.36 1.64 13.85
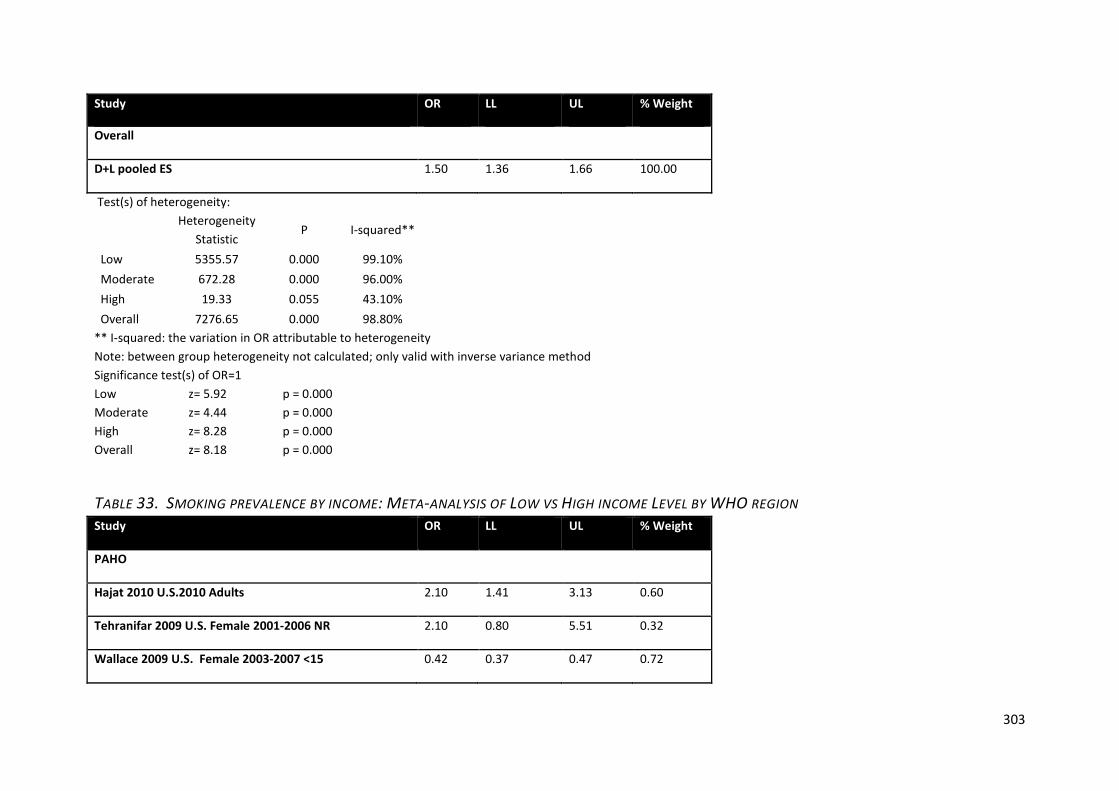
303
Study OR LL UL % Weight
Overall
D+L pooled ES 1.50 1.36 1.66 100.00
Test(s) of heterogeneity:
Heterogeneity Statistic
P I-squared**
Low 5355.57 0.000 99.10% Moderate 672.28 0.000 96.00% High 19.33 0.055 43.10% Overall 7276.65 0.000 98.80%
** I-squared: the variation in OR attributable to heterogeneity Note: between group heterogeneity not calculated; only valid with inverse variance method Significance test(s) of OR=1 Low z= 5.92 p = 0.000 Moderate z= 4.44 p = 0.000 High z= 8.28 p = 0.000 Overall z= 8.18 p = 0.000
TABLE 33. SMOKING PREVALENCE BY INCOME: META-ANALYSIS OF LOW VS HIGH INCOME LEVEL BY WHO REGION Study OR LL UL % Weight
PAHO
Hajat 2010 U.S.2010 Adults 2.10 1.41 3.13 0.60
Tehranifar 2009 U.S. Female 2001-2006 NR 2.10 0.80 5.51 0.32
Wallace 2009 U.S. Female 2003-2007 <15 0.42 0.37 0.47 0.72
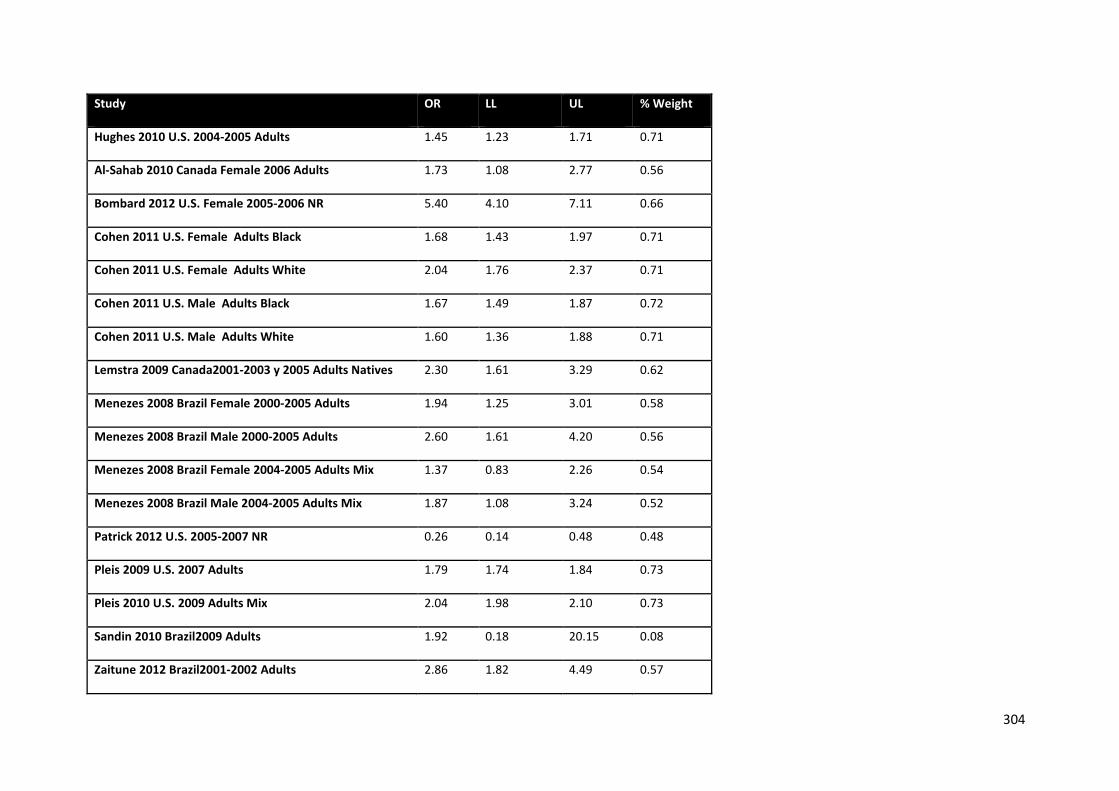
304
Study OR LL UL % Weight
Hughes 2010 U.S. 2004-2005 Adults 1.45 1.23 1.71 0.71
Al-Sahab 2010 Canada Female 2006 Adults 1.73 1.08 2.77 0.56
Bombard 2012 U.S. Female 2005-2006 NR 5.40 4.10 7.11 0.66
Cohen 2011 U.S. Female Adults Black 1.68 1.43 1.97 0.71
Cohen 2011 U.S. Female Adults White 2.04 1.76 2.37 0.71
Cohen 2011 U.S. Male Adults Black 1.67 1.49 1.87 0.72
Cohen 2011 U.S. Male Adults White 1.60 1.36 1.88 0.71
Lemstra 2009 Canada2001-2003 y 2005 Adults Natives 2.30 1.61 3.29 0.62
Menezes 2008 Brazil Female 2000-2005 Adults 1.94 1.25 3.01 0.58
Menezes 2008 Brazil Male 2000-2005 Adults 2.60 1.61 4.20 0.56
Menezes 2008 Brazil Female 2004-2005 Adults Mix 1.37 0.83 2.26 0.54
Menezes 2008 Brazil Male 2004-2005 Adults Mix 1.87 1.08 3.24 0.52
Patrick 2012 U.S. 2005-2007 NR 0.26 0.14 0.48 0.48
Pleis 2009 U.S. 2007 Adults 1.79 1.74 1.84 0.73
Pleis 2010 U.S. 2009 Adults Mix 2.04 1.98 2.10 0.73
Sandin 2010 Brazil2009 Adults 1.92 0.18 20.15 0.08
Zaitune 2012 Brazil2001-2002 Adults 2.86 1.82 4.49 0.57
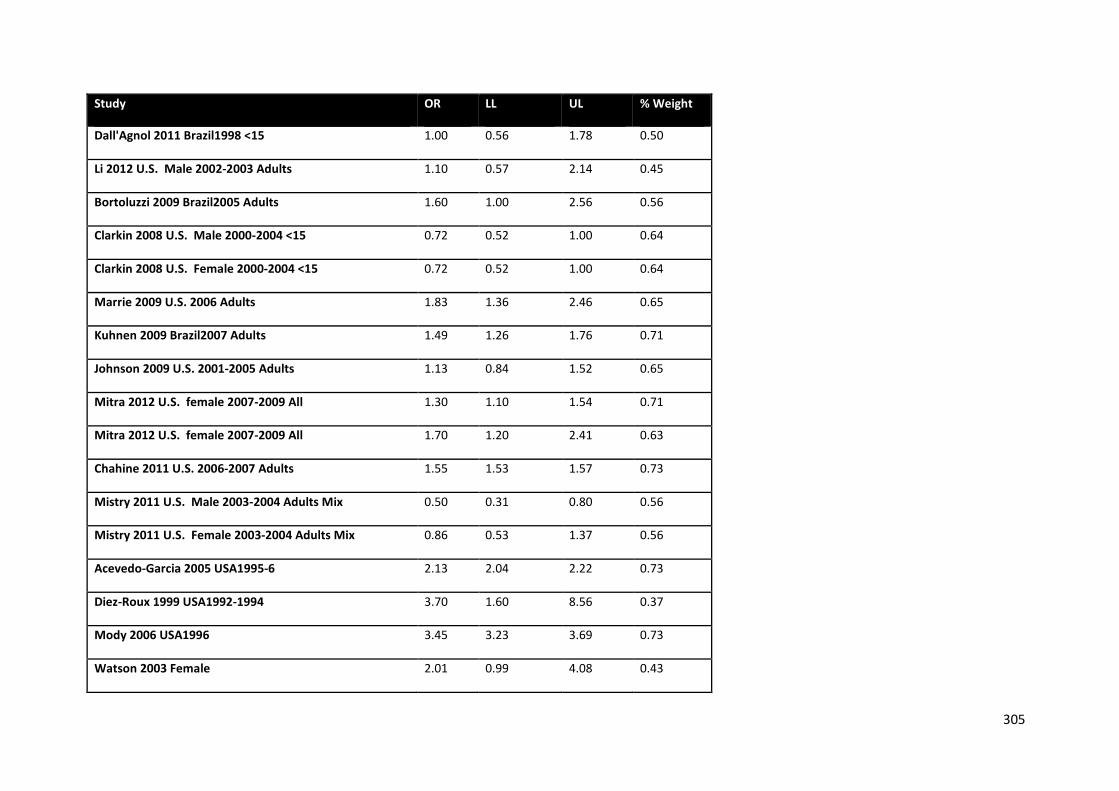
305
Study OR LL UL % Weight
Dall'Agnol 2011 Brazil1998 <15 1.00 0.56 1.78 0.50
Li 2012 U.S. Male 2002-2003 Adults 1.10 0.57 2.14 0.45
Bortoluzzi 2009 Brazil2005 Adults 1.60 1.00 2.56 0.56
Clarkin 2008 U.S. Male 2000-2004 <15 0.72 0.52 1.00 0.64
Clarkin 2008 U.S. Female 2000-2004 <15 0.72 0.52 1.00 0.64
Marrie 2009 U.S. 2006 Adults 1.83 1.36 2.46 0.65
Kuhnen 2009 Brazil2007 Adults 1.49 1.26 1.76 0.71
Johnson 2009 U.S. 2001-2005 Adults 1.13 0.84 1.52 0.65
Mitra 2012 U.S. female 2007-2009 All 1.30 1.10 1.54 0.71
Mitra 2012 U.S. female 2007-2009 All 1.70 1.20 2.41 0.63
Chahine 2011 U.S. 2006-2007 Adults 1.55 1.53 1.57 0.73
Mistry 2011 U.S. Male 2003-2004 Adults Mix 0.50 0.31 0.80 0.56
Mistry 2011 U.S. Female 2003-2004 Adults Mix 0.86 0.53 1.37 0.56
Acevedo-Garcia 2005 USA1995-6 2.13 2.04 2.22 0.73
Diez-Roux 1999 USA1992-1994 3.70 1.60 8.56 0.37
Mody 2006 USA1996 3.45 3.23 3.69 0.73
Watson 2003 Female 2.01 0.99 4.08 0.43

306
Study OR LL UL % Weight
Webb 2008 G1 Female 2.17 1.52 3.12 0.62
Webb 2008 G2 Female 2.56 1.35 4.87 0.47
Webb 2008 G3 Female 3.70 2.22 6.17 0.54
Wister 1996 25-44 y 1.68 1.38 2.05 0.70
Wister 1996 45-64 y 1.65 1.28 2.13 0.67
Wister 1996 65+ y 1.65 0.93 2.91 0.51
Anaya Ocampo 2006 Male 2.86 1.33 6.12 0.41
Anaya Ocampo 2006 Female 0.74 0.26 2.15 0.28
Coreil 1991 20-39 Female 1.02 1.00 1.05 0.73
Coreil 1991 20-39 Male 1.05 1.02 1.07 0.73
Coreil 1991 40-64 Female 1.01 0.98 1.03 0.73
Coreil 1991 40-64 Male 1.01 0.98 1.05 0.73
Coreil 1991 65-74 Female 1.01 0.94 1.10 0.73
Coreil 1991 65-74 Male 1.01 0.89 1.15 0.72
King 1999 Low 1.64 1.30 2.07 0.68
Lawrence 2007 Low 1.47 1.33 1.63 0.72
Shavers 2005 African Americans 1.54 1.28 1.85 0.70
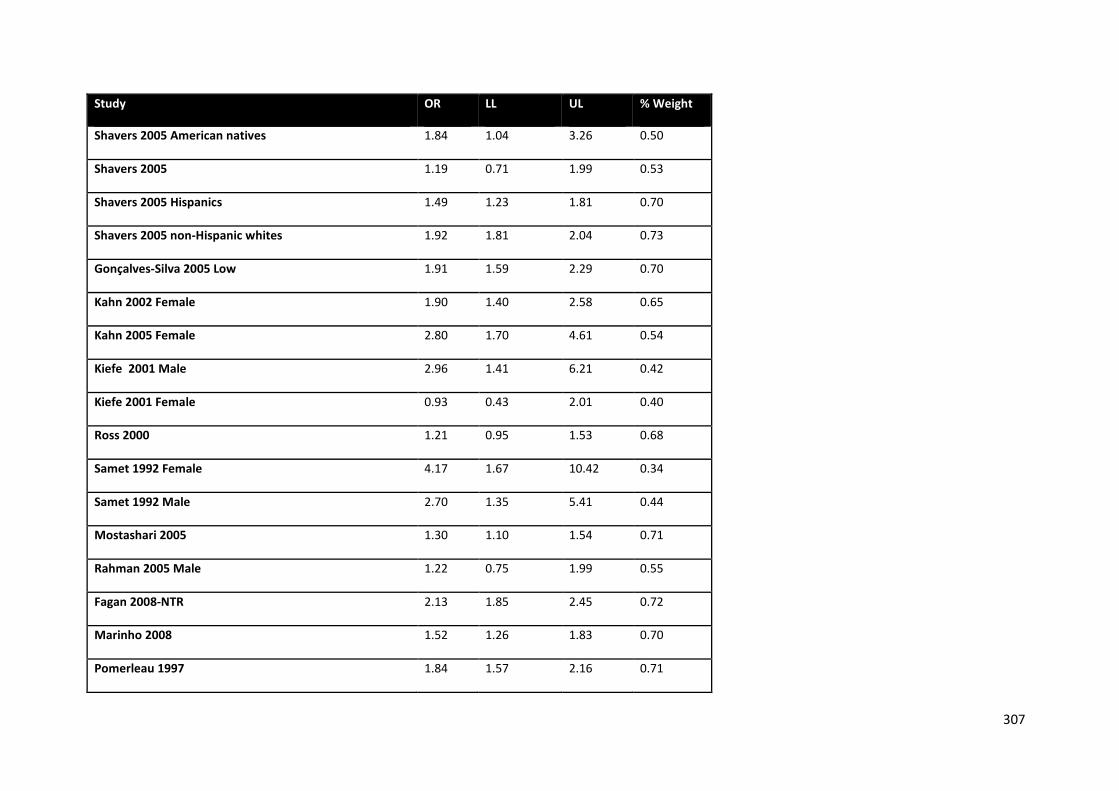
307
Study OR LL UL % Weight
Shavers 2005 American natives 1.84 1.04 3.26 0.50
Shavers 2005 1.19 0.71 1.99 0.53
Shavers 2005 Hispanics 1.49 1.23 1.81 0.70
Shavers 2005 non-Hispanic whites 1.92 1.81 2.04 0.73
Gonçalves-Silva 2005 Low 1.91 1.59 2.29 0.70
Kahn 2002 Female 1.90 1.40 2.58 0.65
Kahn 2005 Female 2.80 1.70 4.61 0.54
Kiefe 2001 Male 2.96 1.41 6.21 0.42
Kiefe 2001 Female 0.93 0.43 2.01 0.40
Ross 2000 1.21 0.95 1.53 0.68
Samet 1992 Female 4.17 1.67 10.42 0.34
Samet 1992 Male 2.70 1.35 5.41 0.44
Mostashari 2005 1.30 1.10 1.54 0.71
Rahman 2005 Male 1.22 0.75 1.99 0.55
Fagan 2008-NTR 2.13 1.85 2.45 0.72
Marinho 2008 1.52 1.26 1.83 0.70
Pomerleau 1997 1.84 1.57 2.16 0.71
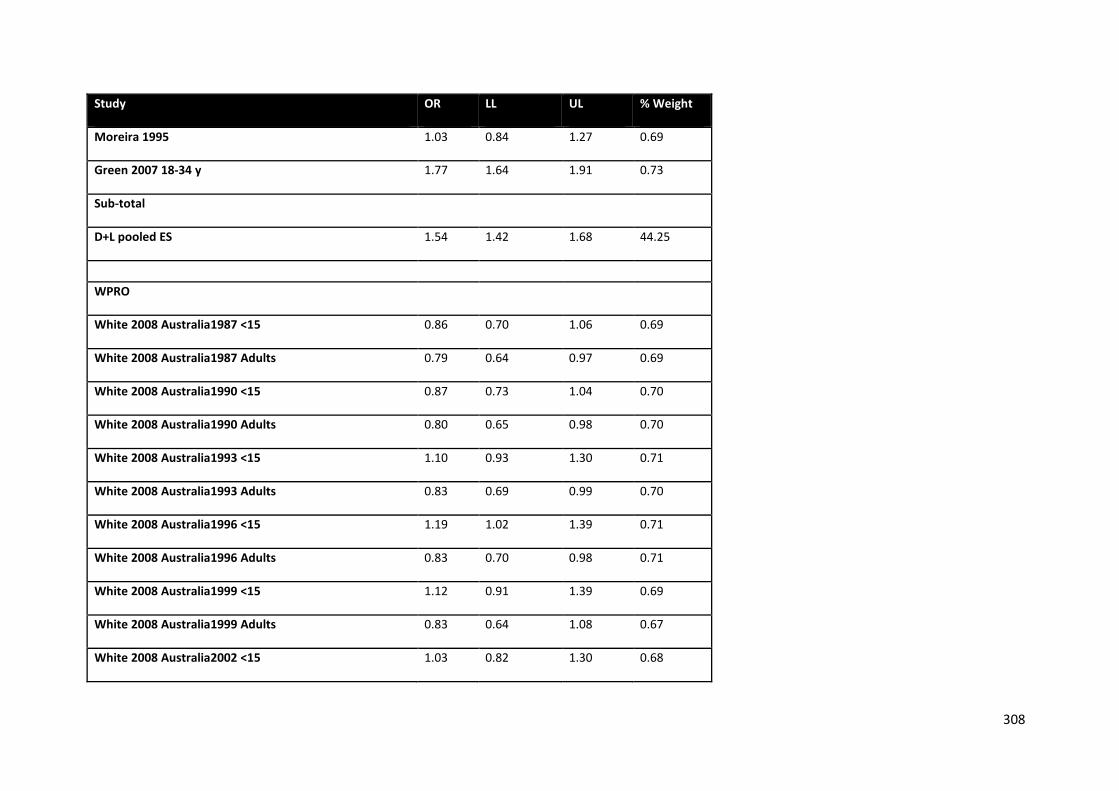
308
Study OR LL UL % Weight
Moreira 1995 1.03 0.84 1.27 0.69
Green 2007 18-34 y 1.77 1.64 1.91 0.73
Sub-total
D+L pooled ES 1.54 1.42 1.68 44.25
WPRO
White 2008 Australia1987 <15 0.86 0.70 1.06 0.69
White 2008 Australia1987 Adults 0.79 0.64 0.97 0.69
White 2008 Australia1990 <15 0.87 0.73 1.04 0.70
White 2008 Australia1990 Adults 0.80 0.65 0.98 0.70
White 2008 Australia1993 <15 1.10 0.93 1.30 0.71
White 2008 Australia1993 Adults 0.83 0.69 0.99 0.70
White 2008 Australia1996 <15 1.19 1.02 1.39 0.71
White 2008 Australia1996 Adults 0.83 0.70 0.98 0.71
White 2008 Australia1999 <15 1.12 0.91 1.39 0.69
White 2008 Australia1999 Adults 0.83 0.64 1.08 0.67
White 2008 Australia2002 <15 1.03 0.82 1.30 0.68
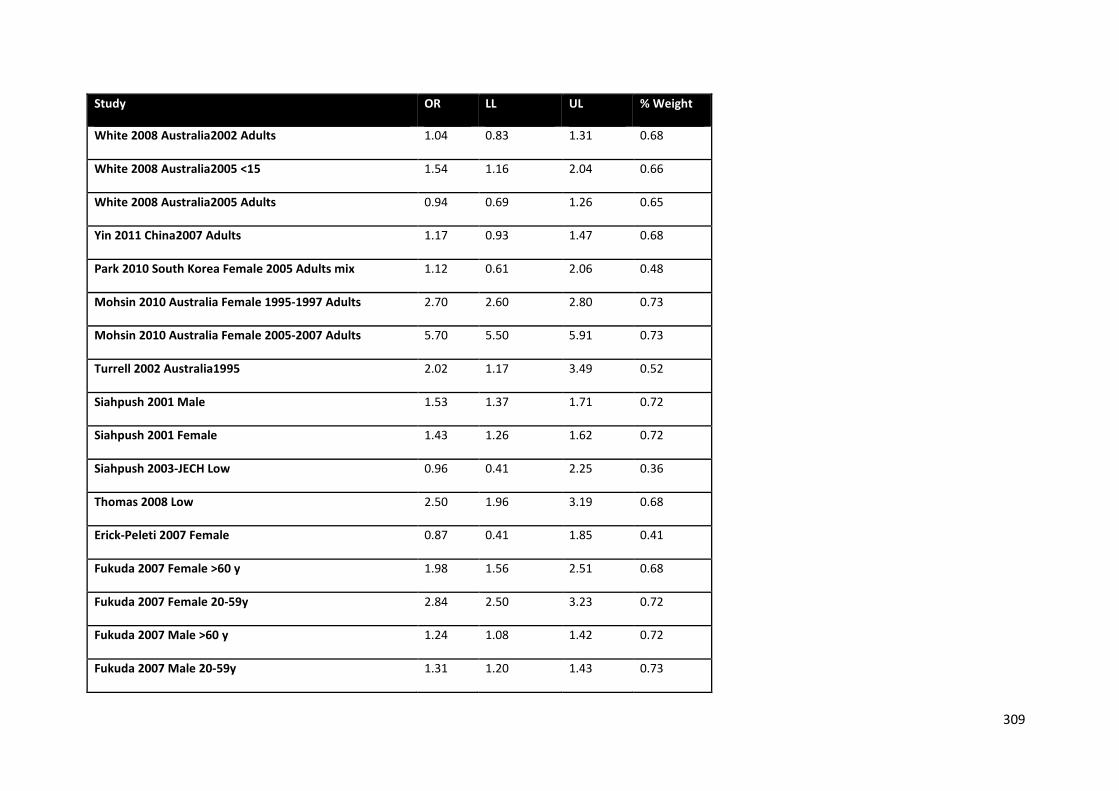
309
Study OR LL UL % Weight
White 2008 Australia2002 Adults 1.04 0.83 1.31 0.68
White 2008 Australia2005 <15 1.54 1.16 2.04 0.66
White 2008 Australia2005 Adults 0.94 0.69 1.26 0.65
Yin 2011 China2007 Adults 1.17 0.93 1.47 0.68
Park 2010 South Korea Female 2005 Adults mix 1.12 0.61 2.06 0.48
Mohsin 2010 Australia Female 1995-1997 Adults 2.70 2.60 2.80 0.73
Mohsin 2010 Australia Female 2005-2007 Adults 5.70 5.50 5.91 0.73
Turrell 2002 Australia1995 2.02 1.17 3.49 0.52
Siahpush 2001 Male 1.53 1.37 1.71 0.72
Siahpush 2001 Female 1.43 1.26 1.62 0.72
Siahpush 2003-JECH Low 0.96 0.41 2.25 0.36
Thomas 2008 Low 2.50 1.96 3.19 0.68
Erick-Peleti 2007 Female 0.87 0.41 1.85 0.41
Fukuda 2007 Female >60 y 1.98 1.56 2.51 0.68
Fukuda 2007 Female 20-59y 2.84 2.50 3.23 0.72
Fukuda 2007 Male >60 y 1.24 1.08 1.42 0.72
Fukuda 2007 Male 20-59y 1.31 1.20 1.43 0.73
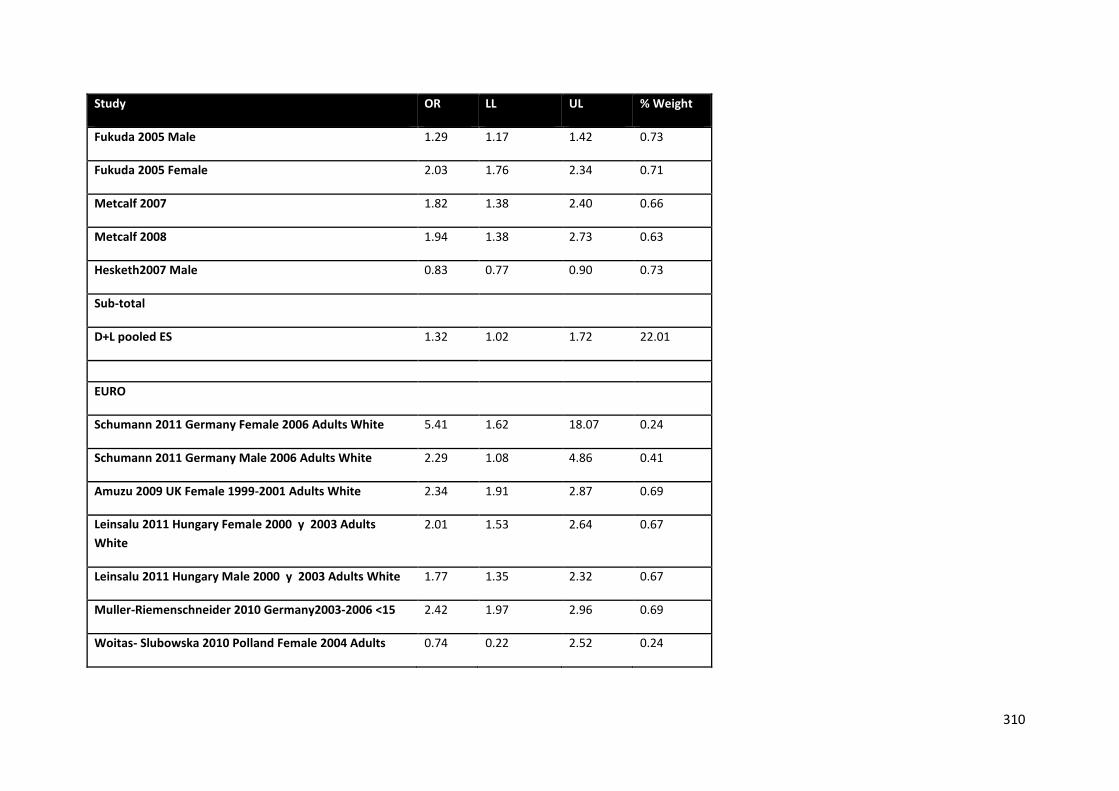
310
Study OR LL UL % Weight
Fukuda 2005 Male 1.29 1.17 1.42 0.73
Fukuda 2005 Female 2.03 1.76 2.34 0.71
Metcalf 2007 1.82 1.38 2.40 0.66
Metcalf 2008 1.94 1.38 2.73 0.63
Hesketh2007 Male 0.83 0.77 0.90 0.73
Sub-total
D+L pooled ES 1.32 1.02 1.72 22.01
EURO
Schumann 2011 Germany Female 2006 Adults White 5.41 1.62 18.07 0.24
Schumann 2011 Germany Male 2006 Adults White 2.29 1.08 4.86 0.41
Amuzu 2009 UK Female 1999-2001 Adults White 2.34 1.91 2.87 0.69
Leinsalu 2011 Hungary Female 2000 y 2003 Adults White
2.01 1.53 2.64 0.67
Leinsalu 2011 Hungary Male 2000 y 2003 Adults White 1.77 1.35 2.32 0.67
Muller-Riemenschneider 2010 Germany2003-2006 <15 2.42 1.97 2.96 0.69
Woitas- Slubowska 2010 Polland Female 2004 Adults 0.74 0.22 2.52 0.24
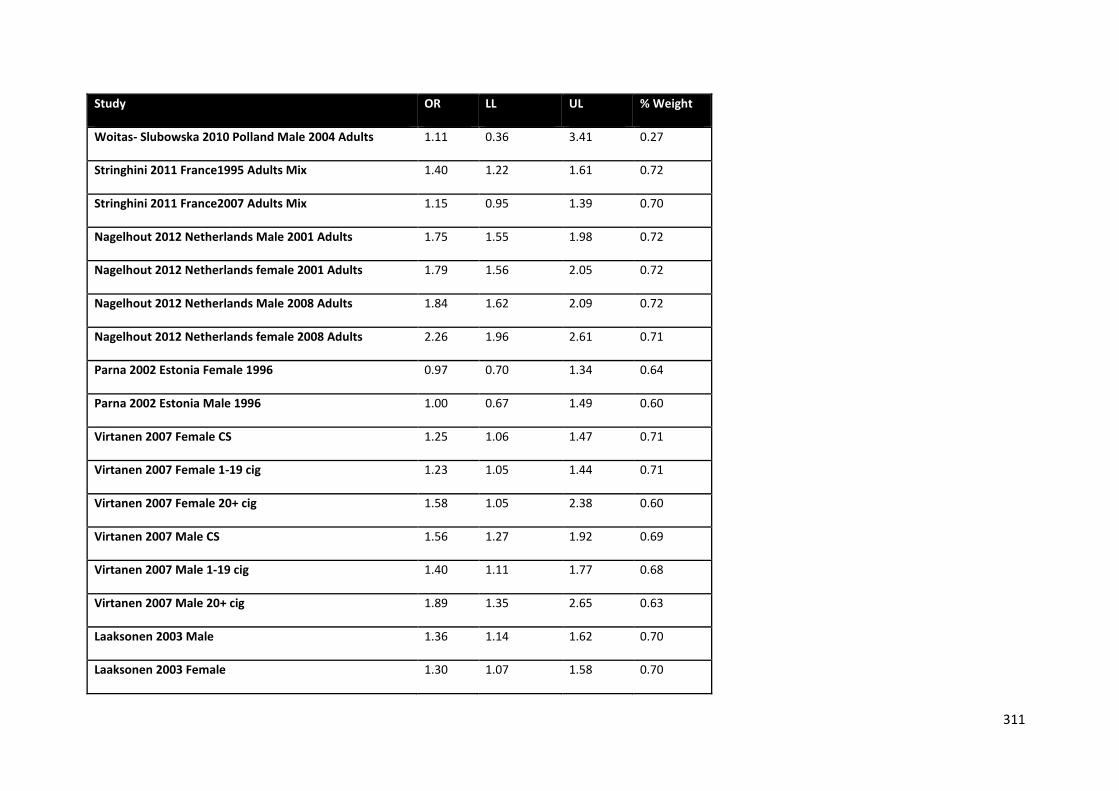
311
Study OR LL UL % Weight
Woitas- Slubowska 2010 Polland Male 2004 Adults 1.11 0.36 3.41 0.27
Stringhini 2011 France1995 Adults Mix 1.40 1.22 1.61 0.72
Stringhini 2011 France2007 Adults Mix 1.15 0.95 1.39 0.70
Nagelhout 2012 Netherlands Male 2001 Adults 1.75 1.55 1.98 0.72
Nagelhout 2012 Netherlands female 2001 Adults 1.79 1.56 2.05 0.72
Nagelhout 2012 Netherlands Male 2008 Adults 1.84 1.62 2.09 0.72
Nagelhout 2012 Netherlands female 2008 Adults 2.26 1.96 2.61 0.71
Parna 2002 Estonia Female 1996 0.97 0.70 1.34 0.64
Parna 2002 Estonia Male 1996 1.00 0.67 1.49 0.60
Virtanen 2007 Female CS 1.25 1.06 1.47 0.71
Virtanen 2007 Female 1-19 cig 1.23 1.05 1.44 0.71
Virtanen 2007 Female 20+ cig 1.58 1.05 2.38 0.60
Virtanen 2007 Male CS 1.56 1.27 1.92 0.69
Virtanen 2007 Male 1-19 cig 1.40 1.11 1.77 0.68
Virtanen 2007 Male 20+ cig 1.89 1.35 2.65 0.63
Laaksonen 2003 Male 1.36 1.14 1.62 0.70
Laaksonen 2003 Female 1.30 1.07 1.58 0.70
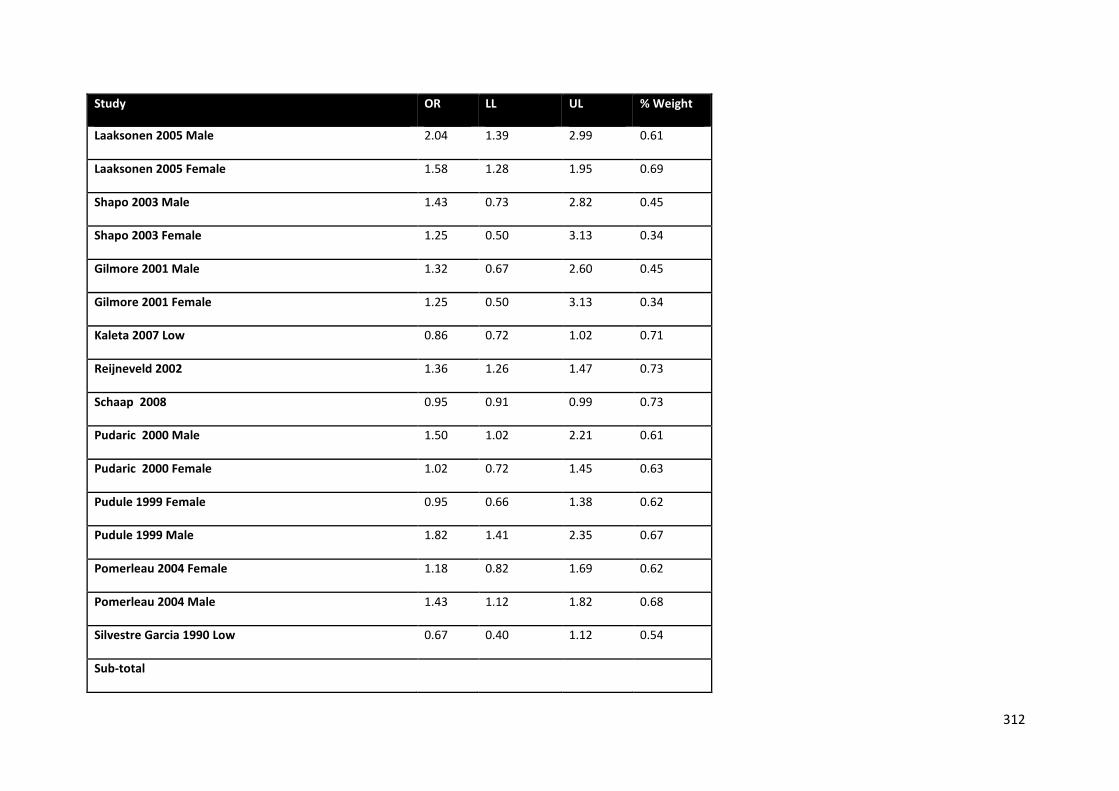
312
Study OR LL UL % Weight
Laaksonen 2005 Male 2.04 1.39 2.99 0.61
Laaksonen 2005 Female 1.58 1.28 1.95 0.69
Shapo 2003 Male 1.43 0.73 2.82 0.45
Shapo 2003 Female 1.25 0.50 3.13 0.34
Gilmore 2001 Male 1.32 0.67 2.60 0.45
Gilmore 2001 Female 1.25 0.50 3.13 0.34
Kaleta 2007 Low 0.86 0.72 1.02 0.71
Reijneveld 2002 1.36 1.26 1.47 0.73
Schaap 2008 0.95 0.91 0.99 0.73
Pudaric 2000 Male 1.50 1.02 2.21 0.61
Pudaric 2000 Female 1.02 0.72 1.45 0.63
Pudule 1999 Female 0.95 0.66 1.38 0.62
Pudule 1999 Male 1.82 1.41 2.35 0.67
Pomerleau 2004 Female 1.18 0.82 1.69 0.62
Pomerleau 2004 Male 1.43 1.12 1.82 0.68
Silvestre Garcia 1990 Low 0.67 0.40 1.12 0.54
Sub-total
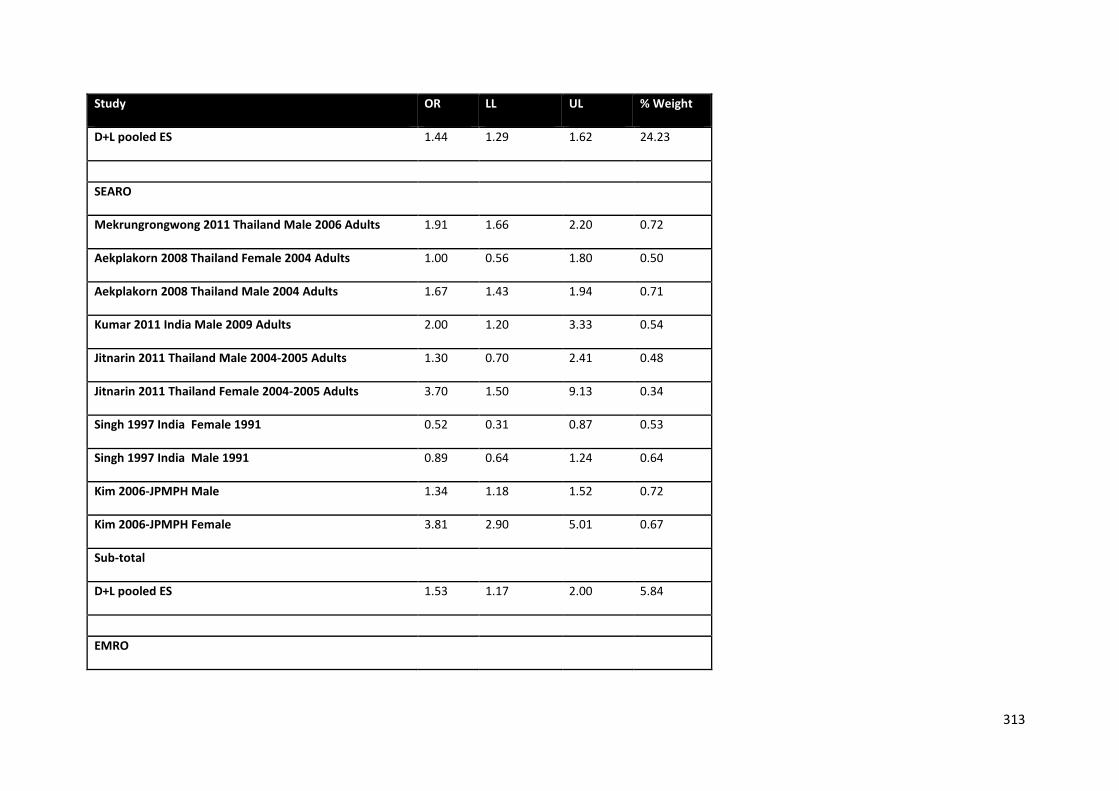
313
Study OR LL UL % Weight
D+L pooled ES 1.44 1.29 1.62 24.23
SEARO
Mekrungrongwong 2011 Thailand Male 2006 Adults 1.91 1.66 2.20 0.72
Aekplakorn 2008 Thailand Female 2004 Adults 1.00 0.56 1.80 0.50
Aekplakorn 2008 Thailand Male 2004 Adults 1.67 1.43 1.94 0.71
Kumar 2011 India Male 2009 Adults 2.00 1.20 3.33 0.54
Jitnarin 2011 Thailand Male 2004-2005 Adults 1.30 0.70 2.41 0.48
Jitnarin 2011 Thailand Female 2004-2005 Adults 3.70 1.50 9.13 0.34
Singh 1997 India Female 1991 0.52 0.31 0.87 0.53
Singh 1997 India Male 1991 0.89 0.64 1.24 0.64
Kim 2006-JPMPH Male 1.34 1.18 1.52 0.72
Kim 2006-JPMPH Female 3.81 2.90 5.01 0.67
Sub-total
D+L pooled ES 1.53 1.17 2.00 5.84
EMRO
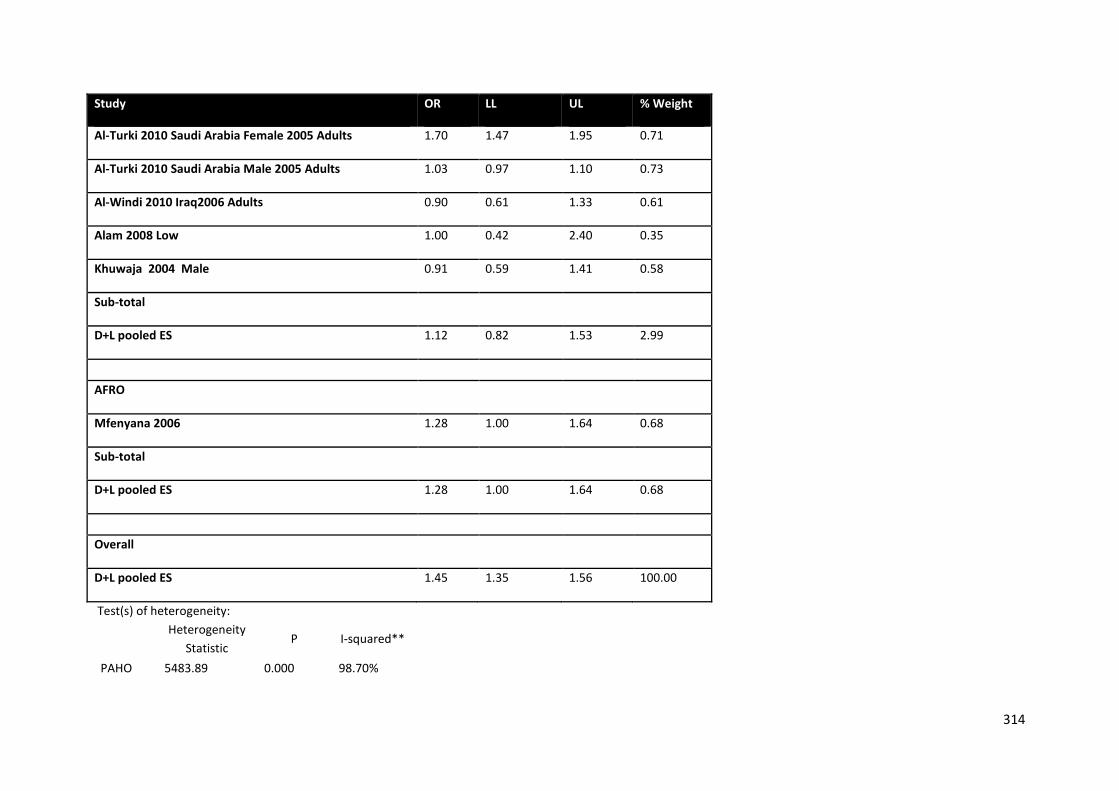
314
Study OR LL UL % Weight
Al-Turki 2010 Saudi Arabia Female 2005 Adults 1.70 1.47 1.95 0.71
Al-Turki 2010 Saudi Arabia Male 2005 Adults 1.03 0.97 1.10 0.73
Al-Windi 2010 Iraq2006 Adults 0.90 0.61 1.33 0.61
Alam 2008 Low 1.00 0.42 2.40 0.35
Khuwaja 2004 Male 0.91 0.59 1.41 0.58
Sub-total
D+L pooled ES 1.12 0.82 1.53 2.99
AFRO
Mfenyana 2006 1.28 1.00 1.64 0.68
Sub-total
D+L pooled ES 1.28 1.00 1.64 0.68
Overall
D+L pooled ES 1.45 1.35 1.56 100.00
Test(s) of heterogeneity:
Heterogeneity Statistic
P I-squared**
PAHO 5483.89 0.000 98.70%
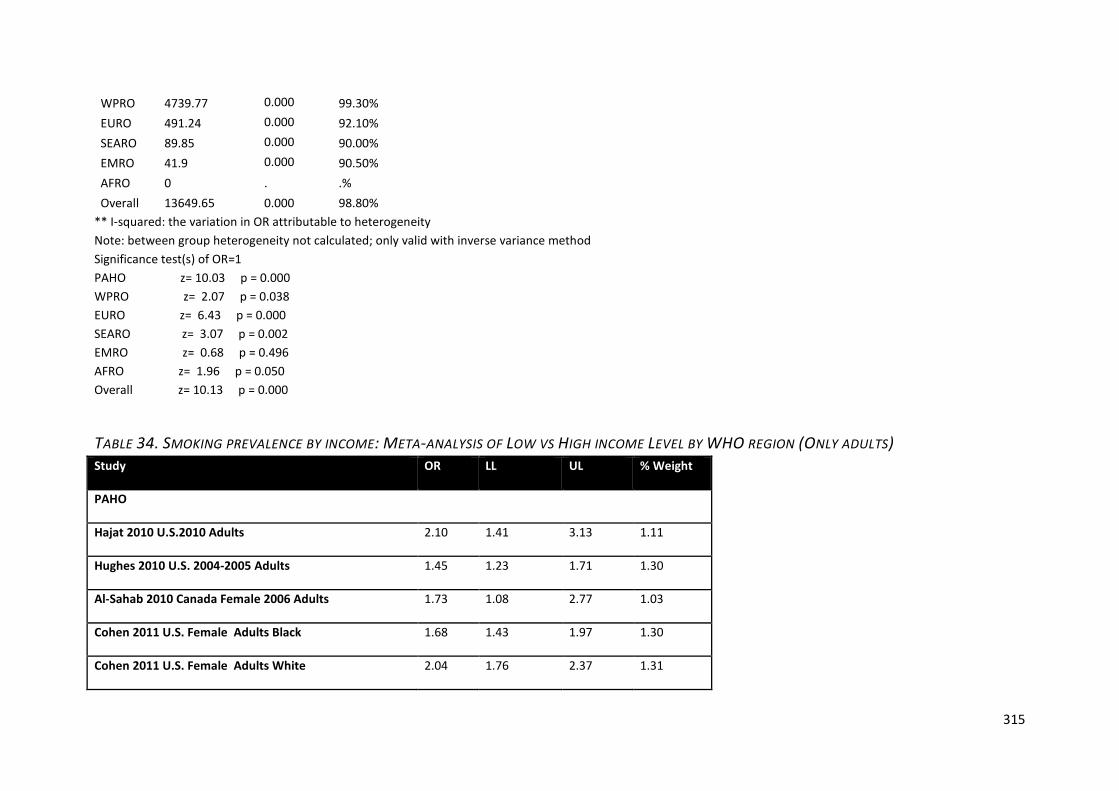
315
WPRO 4739.77 0.000 99.30% EURO 491.24 0.000 92.10% SEARO 89.85 0.000 90.00% EMRO 41.9 0.000 90.50% AFRO 0 . .% Overall 13649.65 0.000 98.80%
** I-squared: the variation in OR attributable to heterogeneity Note: between group heterogeneity not calculated; only valid with inverse variance method Significance test(s) of OR=1 PAHO z= 10.03 p = 0.000 WPRO z= 2.07 p = 0.038 EURO z= 6.43 p = 0.000 SEARO z= 3.07 p = 0.002 EMRO z= 0.68 p = 0.496 AFRO z= 1.96 p = 0.050 Overall z= 10.13 p = 0.000
TABLE 34. SMOKING PREVALENCE BY INCOME: META-ANALYSIS OF LOW VS HIGH INCOME LEVEL BY WHO REGION (ONLY ADULTS) Study OR LL UL % Weight
PAHO
Hajat 2010 U.S.2010 Adults 2.10 1.41 3.13 1.11
Hughes 2010 U.S. 2004-2005 Adults 1.45 1.23 1.71 1.30
Al-Sahab 2010 Canada Female 2006 Adults 1.73 1.08 2.77 1.03
Cohen 2011 U.S. Female Adults Black 1.68 1.43 1.97 1.30
Cohen 2011 U.S. Female Adults White 2.04 1.76 2.37 1.31
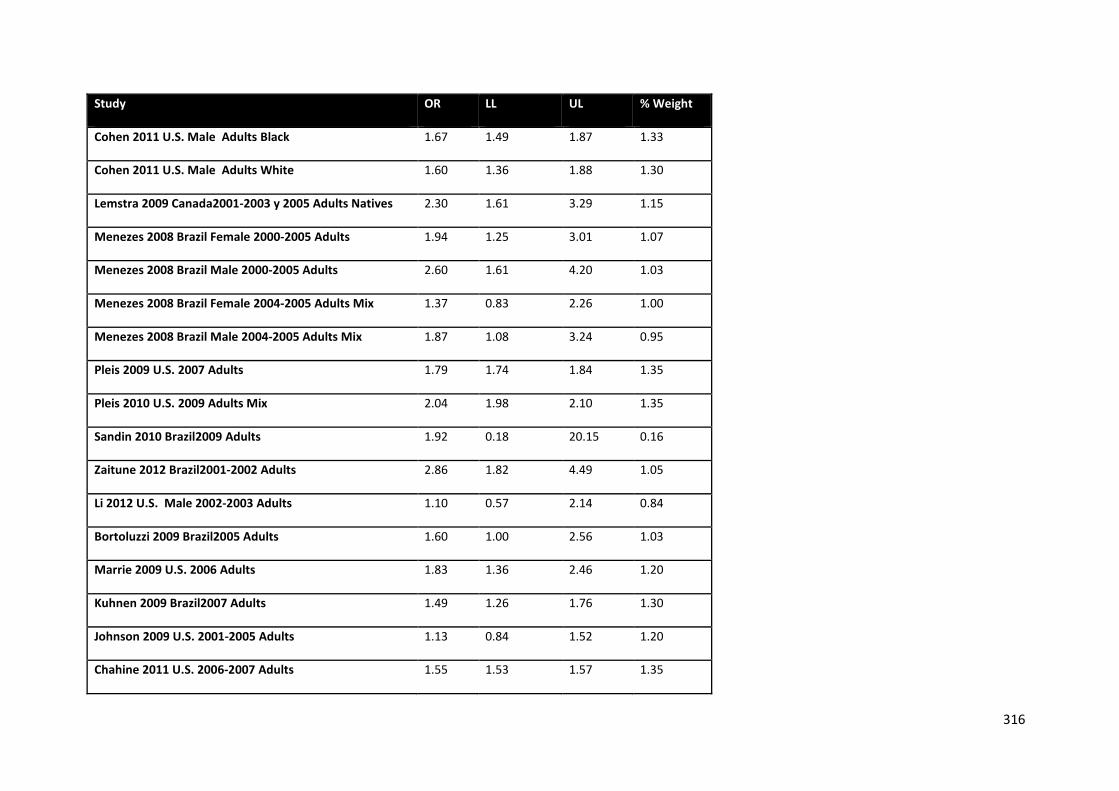
316
Study OR LL UL % Weight
Cohen 2011 U.S. Male Adults Black 1.67 1.49 1.87 1.33
Cohen 2011 U.S. Male Adults White 1.60 1.36 1.88 1.30
Lemstra 2009 Canada2001-2003 y 2005 Adults Natives 2.30 1.61 3.29 1.15
Menezes 2008 Brazil Female 2000-2005 Adults 1.94 1.25 3.01 1.07
Menezes 2008 Brazil Male 2000-2005 Adults 2.60 1.61 4.20 1.03
Menezes 2008 Brazil Female 2004-2005 Adults Mix 1.37 0.83 2.26 1.00
Menezes 2008 Brazil Male 2004-2005 Adults Mix 1.87 1.08 3.24 0.95
Pleis 2009 U.S. 2007 Adults 1.79 1.74 1.84 1.35
Pleis 2010 U.S. 2009 Adults Mix 2.04 1.98 2.10 1.35
Sandin 2010 Brazil2009 Adults 1.92 0.18 20.15 0.16
Zaitune 2012 Brazil2001-2002 Adults 2.86 1.82 4.49 1.05
Li 2012 U.S. Male 2002-2003 Adults 1.10 0.57 2.14 0.84
Bortoluzzi 2009 Brazil2005 Adults 1.60 1.00 2.56 1.03
Marrie 2009 U.S. 2006 Adults 1.83 1.36 2.46 1.20
Kuhnen 2009 Brazil2007 Adults 1.49 1.26 1.76 1.30
Johnson 2009 U.S. 2001-2005 Adults 1.13 0.84 1.52 1.20
Chahine 2011 U.S. 2006-2007 Adults 1.55 1.53 1.57 1.35

317
Study OR LL UL % Weight
Mistry 2011 U.S. Male 2003-2004 Adults Mix 0.50 0.31 0.80 1.03
Mistry 2011 U.S. Female 2003-2004 Adults Mix 0.86 0.53 1.37 1.03
Wister 1996 25-44 y 1.68 1.38 2.05 1.28
Wister 1996 45-64 y 1.65 1.28 2.13 1.24
Wister 1996 65+ y 1.65 0.93 2.91 0.93
King 1999 Low 1.64 1.30 2.07 1.26
Lawrence 2007 Low 1.47 1.33 1.63 1.33
Ross 2000 1.21 0.95 1.53 1.25
Samet 1992 Female 4.17 1.67 10.42 0.63
Samet 1992 Male 2.70 1.35 5.41 0.81
Mostashari 2005 1.30 1.10 1.54 1.30
Pomerleau 1997 1.84 1.57 2.16 1.30
Green 2007 18-34 y 1.77 1.64 1.91 1.34
Sub-total
D+L pooled ES 1.64 1.54 1.75 39.45
WPRO
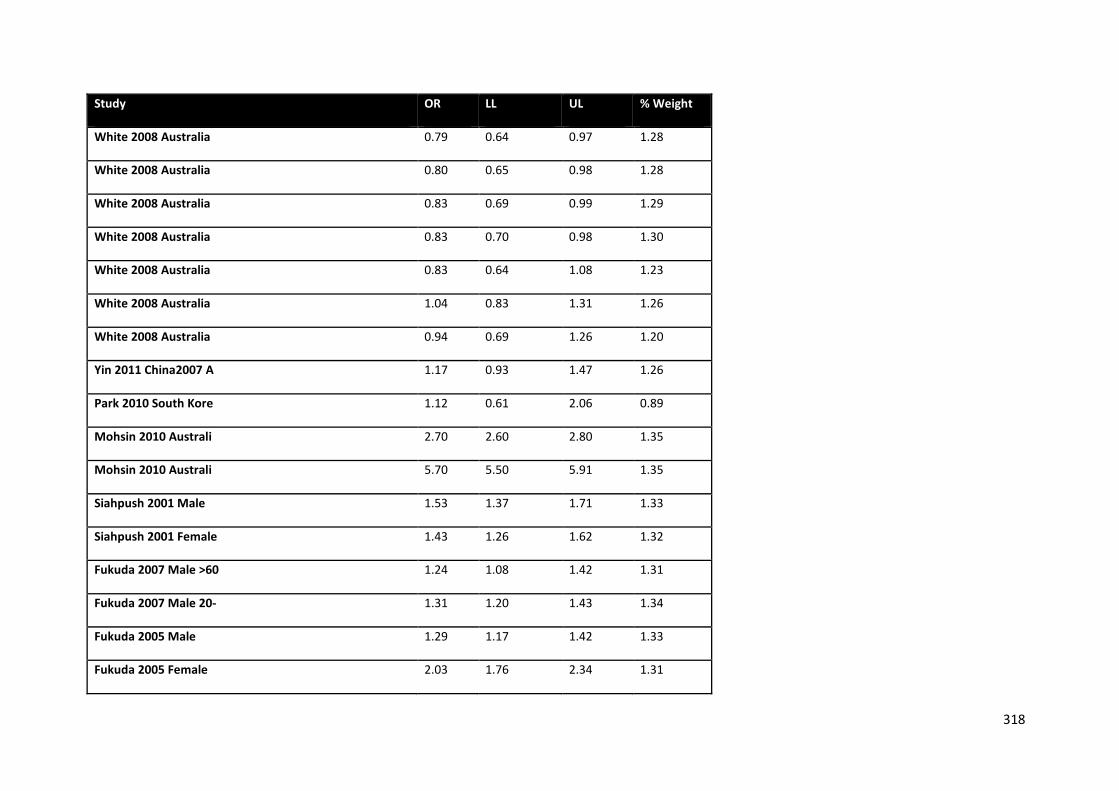
318
Study OR LL UL % Weight
White 2008 Australia 0.79 0.64 0.97 1.28
White 2008 Australia 0.80 0.65 0.98 1.28
White 2008 Australia 0.83 0.69 0.99 1.29
White 2008 Australia 0.83 0.70 0.98 1.30
White 2008 Australia 0.83 0.64 1.08 1.23
White 2008 Australia 1.04 0.83 1.31 1.26
White 2008 Australia 0.94 0.69 1.26 1.20
Yin 2011 China2007 A 1.17 0.93 1.47 1.26
Park 2010 South Kore 1.12 0.61 2.06 0.89
Mohsin 2010 Australi 2.70 2.60 2.80 1.35
Mohsin 2010 Australi 5.70 5.50 5.91 1.35
Siahpush 2001 Male 1.53 1.37 1.71 1.33
Siahpush 2001 Female 1.43 1.26 1.62 1.32
Fukuda 2007 Male >60 1.24 1.08 1.42 1.31
Fukuda 2007 Male 20- 1.31 1.20 1.43 1.34
Fukuda 2005 Male 1.29 1.17 1.42 1.33
Fukuda 2005 Female 2.03 1.76 2.34 1.31
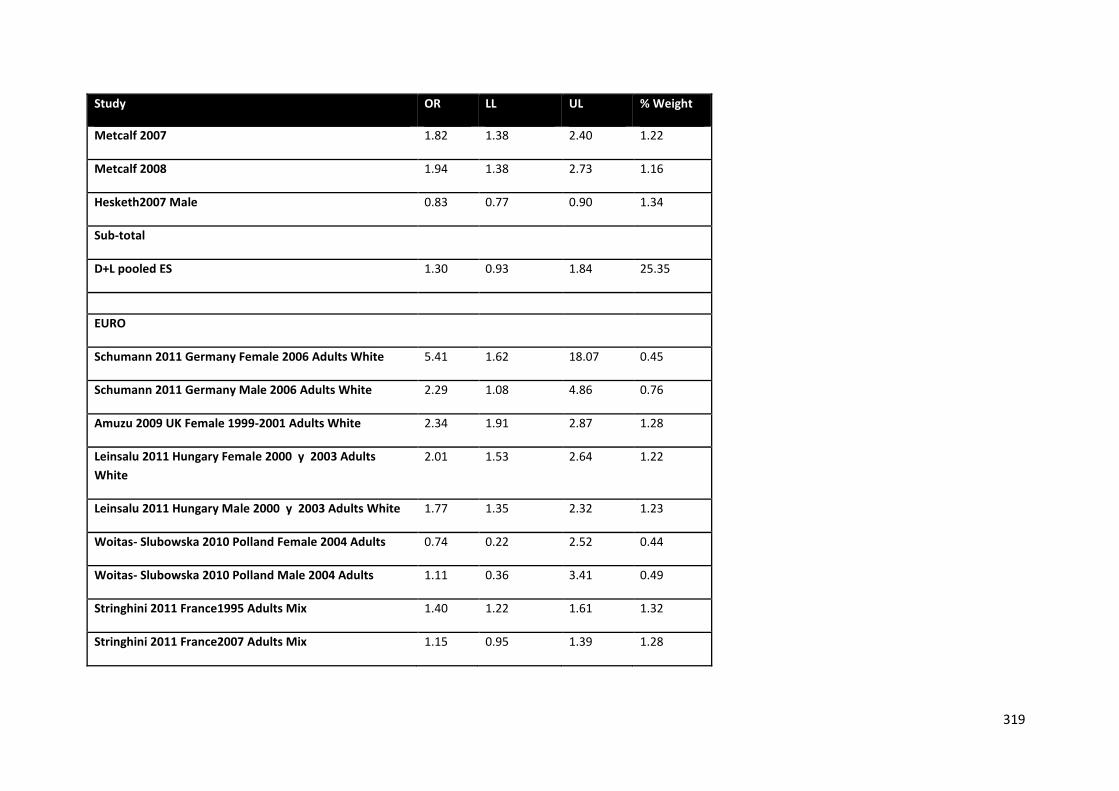
319
Study OR LL UL % Weight
Metcalf 2007 1.82 1.38 2.40 1.22
Metcalf 2008 1.94 1.38 2.73 1.16
Hesketh2007 Male 0.83 0.77 0.90 1.34
Sub-total
D+L pooled ES 1.30 0.93 1.84 25.35
EURO
Schumann 2011 Germany Female 2006 Adults White 5.41 1.62 18.07 0.45
Schumann 2011 Germany Male 2006 Adults White 2.29 1.08 4.86 0.76
Amuzu 2009 UK Female 1999-2001 Adults White 2.34 1.91 2.87 1.28
Leinsalu 2011 Hungary Female 2000 y 2003 Adults White
2.01 1.53 2.64 1.22
Leinsalu 2011 Hungary Male 2000 y 2003 Adults White 1.77 1.35 2.32 1.23
Woitas- Slubowska 2010 Polland Female 2004 Adults 0.74 0.22 2.52 0.44
Woitas- Slubowska 2010 Polland Male 2004 Adults 1.11 0.36 3.41 0.49
Stringhini 2011 France1995 Adults Mix 1.40 1.22 1.61 1.32
Stringhini 2011 France2007 Adults Mix 1.15 0.95 1.39 1.28
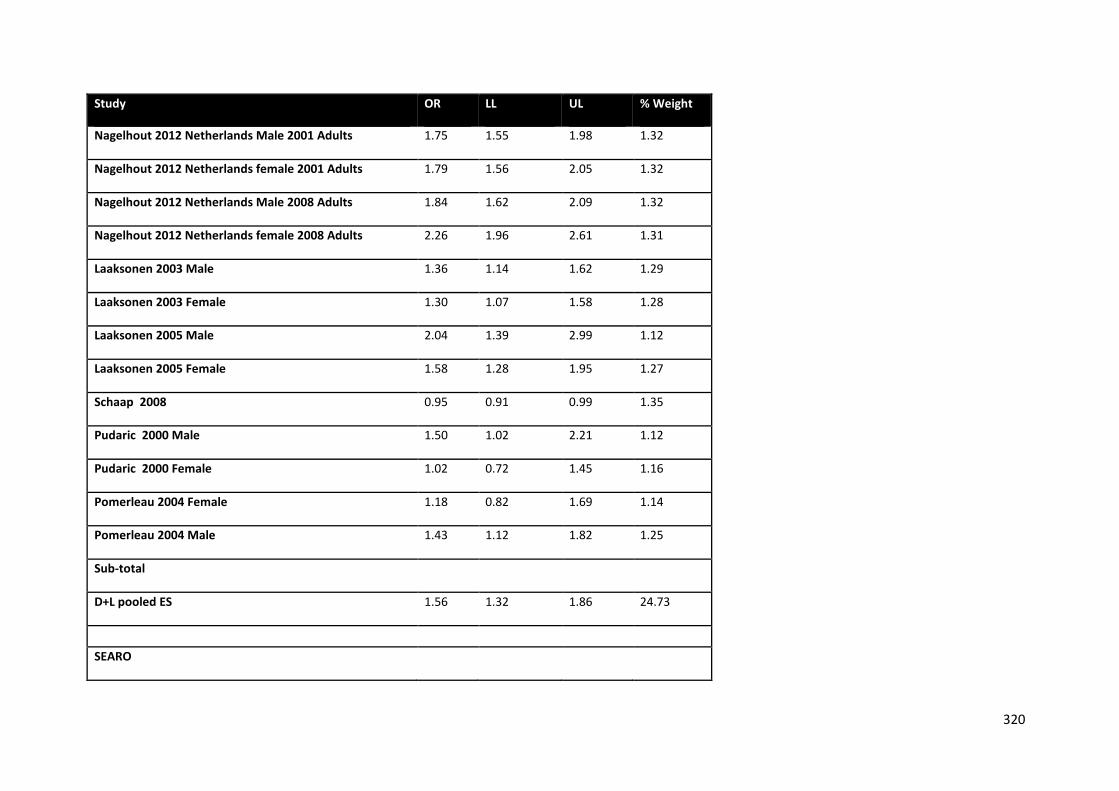
320
Study OR LL UL % Weight
Nagelhout 2012 Netherlands Male 2001 Adults 1.75 1.55 1.98 1.32
Nagelhout 2012 Netherlands female 2001 Adults 1.79 1.56 2.05 1.32
Nagelhout 2012 Netherlands Male 2008 Adults 1.84 1.62 2.09 1.32
Nagelhout 2012 Netherlands female 2008 Adults 2.26 1.96 2.61 1.31
Laaksonen 2003 Male 1.36 1.14 1.62 1.29
Laaksonen 2003 Female 1.30 1.07 1.58 1.28
Laaksonen 2005 Male 2.04 1.39 2.99 1.12
Laaksonen 2005 Female 1.58 1.28 1.95 1.27
Schaap 2008 0.95 0.91 0.99 1.35
Pudaric 2000 Male 1.50 1.02 2.21 1.12
Pudaric 2000 Female 1.02 0.72 1.45 1.16
Pomerleau 2004 Female 1.18 0.82 1.69 1.14
Pomerleau 2004 Male 1.43 1.12 1.82 1.25
Sub-total
D+L pooled ES 1.56 1.32 1.86 24.73
SEARO
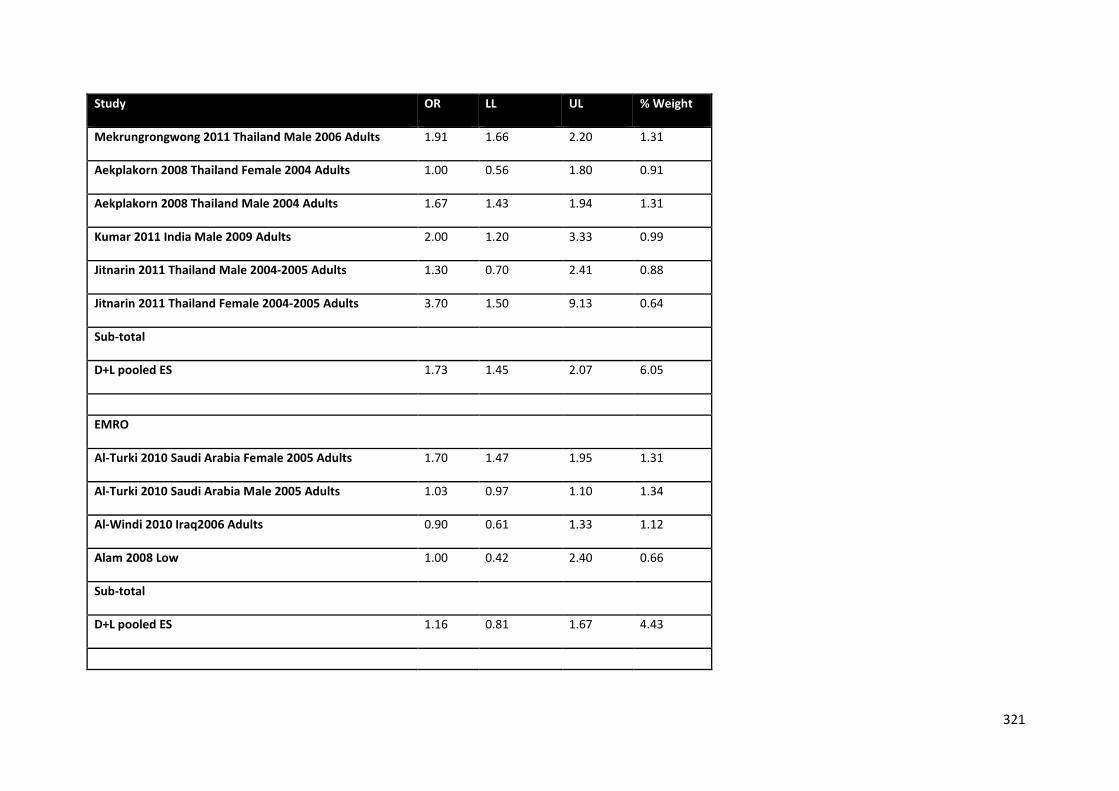
321
Study OR LL UL % Weight
Mekrungrongwong 2011 Thailand Male 2006 Adults 1.91 1.66 2.20 1.31
Aekplakorn 2008 Thailand Female 2004 Adults 1.00 0.56 1.80 0.91
Aekplakorn 2008 Thailand Male 2004 Adults 1.67 1.43 1.94 1.31
Kumar 2011 India Male 2009 Adults 2.00 1.20 3.33 0.99
Jitnarin 2011 Thailand Male 2004-2005 Adults 1.30 0.70 2.41 0.88
Jitnarin 2011 Thailand Female 2004-2005 Adults 3.70 1.50 9.13 0.64
Sub-total
D+L pooled ES 1.73 1.45 2.07 6.05
EMRO
Al-Turki 2010 Saudi Arabia Female 2005 Adults 1.70 1.47 1.95 1.31
Al-Turki 2010 Saudi Arabia Male 2005 Adults 1.03 0.97 1.10 1.34
Al-Windi 2010 Iraq2006 Adults 0.90 0.61 1.33 1.12
Alam 2008 Low 1.00 0.42 2.40 0.66
Sub-total
D+L pooled ES 1.16 0.81 1.67 4.43
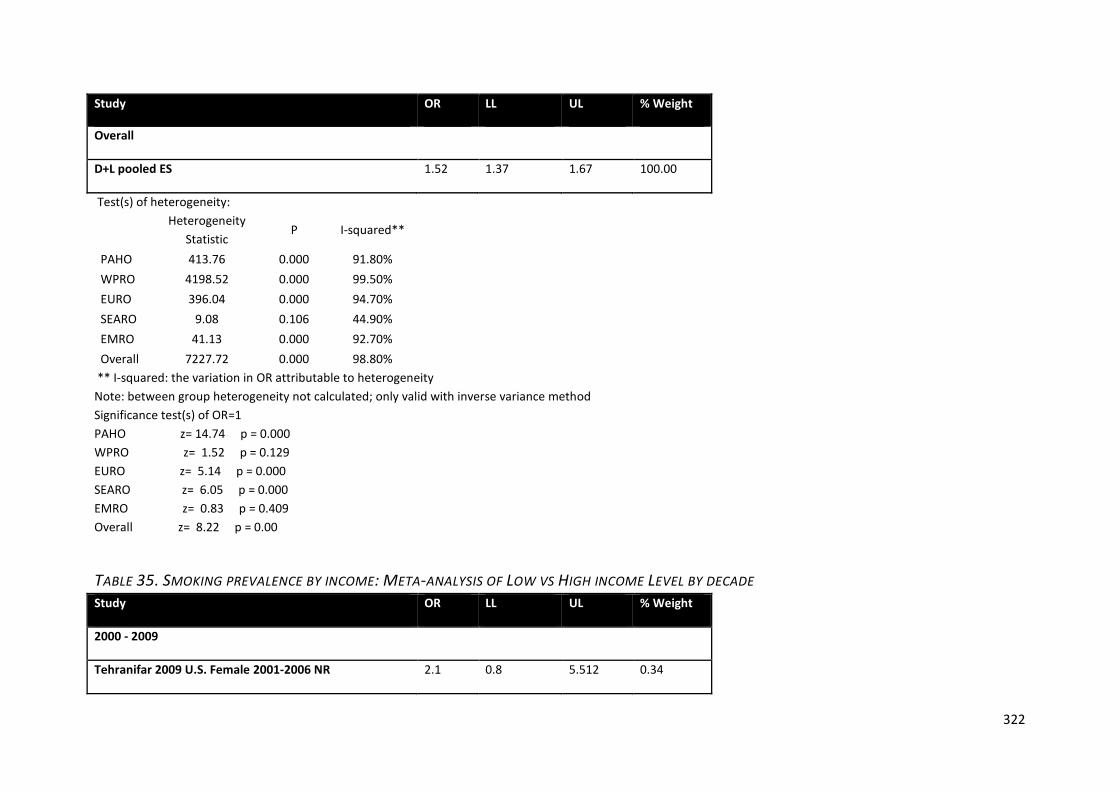
322
Study OR LL UL % Weight
Overall
D+L pooled ES 1.52 1.37 1.67 100.00
Test(s) of heterogeneity:
Heterogeneity Statistic
P I-squared**
PAHO 413.76 0.000 91.80% WPRO 4198.52 0.000 99.50% EURO 396.04 0.000 94.70% SEARO 9.08 0.106 44.90% EMRO 41.13 0.000 92.70% Overall 7227.72 0.000 98.80%
** I-squared: the variation in OR attributable to heterogeneity Note: between group heterogeneity not calculated; only valid with inverse variance method Significance test(s) of OR=1 PAHO z= 14.74 p = 0.000 WPRO z= 1.52 p = 0.129 EURO z= 5.14 p = 0.000 SEARO z= 6.05 p = 0.000 EMRO z= 0.83 p = 0.409 Overall z= 8.22 p = 0.00
TABLE 35. SMOKING PREVALENCE BY INCOME: META-ANALYSIS OF LOW VS HIGH INCOME LEVEL BY DECADE Study OR LL UL % Weight
2000 - 2009
Tehranifar 2009 U.S. Female 2001-2006 NR 2.1 0.8 5.512 0.34
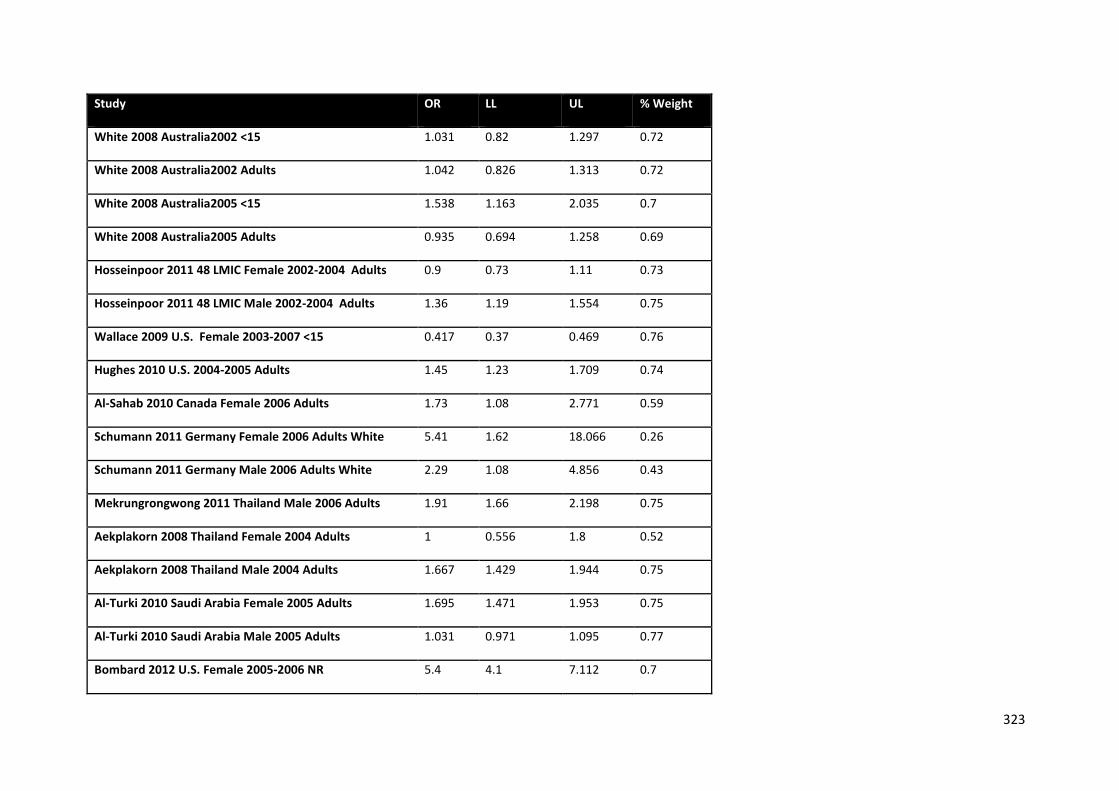
323
Study OR LL UL % Weight
White 2008 Australia2002 <15 1.031 0.82 1.297 0.72
White 2008 Australia2002 Adults 1.042 0.826 1.313 0.72
White 2008 Australia2005 <15 1.538 1.163 2.035 0.7
White 2008 Australia2005 Adults 0.935 0.694 1.258 0.69
Hosseinpoor 2011 48 LMIC Female 2002-2004 Adults 0.9 0.73 1.11 0.73
Hosseinpoor 2011 48 LMIC Male 2002-2004 Adults 1.36 1.19 1.554 0.75
Wallace 2009 U.S. Female 2003-2007 <15 0.417 0.37 0.469 0.76
Hughes 2010 U.S. 2004-2005 Adults 1.45 1.23 1.709 0.74
Al-Sahab 2010 Canada Female 2006 Adults 1.73 1.08 2.771 0.59
Schumann 2011 Germany Female 2006 Adults White 5.41 1.62 18.066 0.26
Schumann 2011 Germany Male 2006 Adults White 2.29 1.08 4.856 0.43
Mekrungrongwong 2011 Thailand Male 2006 Adults 1.91 1.66 2.198 0.75
Aekplakorn 2008 Thailand Female 2004 Adults 1 0.556 1.8 0.52
Aekplakorn 2008 Thailand Male 2004 Adults 1.667 1.429 1.944 0.75
Al-Turki 2010 Saudi Arabia Female 2005 Adults 1.695 1.471 1.953 0.75
Al-Turki 2010 Saudi Arabia Male 2005 Adults 1.031 0.971 1.095 0.77
Bombard 2012 U.S. Female 2005-2006 NR 5.4 4.1 7.112 0.7

324
Study OR LL UL % Weight
Kumar 2011 India Male 2009 Adults 2 1.2 3.333 0.57
Leinsalu 2011 Hungary Female 2000 y 2003 Adults White
2.01 1.53 2.641 0.7
Leinsalu 2011 Hungary Male 2000 y 2003 Adults White 1.77 1.35 2.321 0.7
Lemstra 2009 Canada2001-2003 y 2005 Adults Natives 2.3 1.61 3.286 0.66
Menezes 2008 Brazil Female 2000-2005 Adults 1.94 1.25 3.011 0.61
Menezes 2008 Brazil Male 2000-2005 Adults 2.6 1.61 4.199 0.59
Menezes 2008 Brazil Female 2004-2005 Adults Mix 1.37 0.83 2.261 0.57
Menezes 2008 Brazil Male 2004-2005 Adults Mix 1.87 1.08 3.238 0.54
Muller-Riemenschneider 2010 Germany2003-2006 <15 2.416 1.972 2.96 0.73
Patrick 2012 U.S. 2005-2007 NR 0.26 0.14 0.483 0.5
Pleis 2009 U.S. 2007 Adults 1.79 1.74 1.841 0.77
Pleis 2010 U.S. 2009 Adults Mix 2.036 1.977 2.097 0.77
Sandin 2010 Brazil2009 Adults 1.923 0.183 20.154 0.09
Woitas- Slubowska 2010 Polland Female 2004 Adults 0.741 0.218 2.518 0.25
Woitas- Slubowska 2010 Polland Male 2004 Adults 1.111 0.362 3.407 0.28
Yin 2011 China2007 Adults 1.17 0.93 1.472 0.72

325
Study OR LL UL % Weight
Zaitune 2012 Brazil2001-2002 Adults 2.857 1.818 4.49 0.6
Park 2010 South Korea Female 2005 Adults mix 1.12 0.61 2.056 0.51
Li 2012 U.S. Male 2002-2003 Adults 1.099 0.565 2.137 0.48
Stringhini 2011 France2007 Adults Mix 1.15 0.95 1.392 0.73
Bortoluzzi 2009 Brazil2005 Adults 1.6 1 2.56 0.59
Clarkin 2008 U.S. Male 2000-2004 <15 0.72 0.52 0.997 0.67
Clarkin 2008 U.S. Female 2000-2004 <15 0.72 0.52 0.997 0.67
Marrie 2009 U.S. 2006 Adults 1.83 1.36 2.462 0.69
Kuhnen 2009 Brazil2007 Adults 1.49 1.26 1.762 0.74
Johnson 2009 U.S. 2001-2005 Adults 1.13 0.84 1.52 0.69
Mitra 2012 U.S. female 2007-2009 All 1.3 1.1 1.536 0.74
Mitra 2012 U.S. female 2007-2009 All 1.7 1.2 2.408 0.66
Mohsin 2010 Australia Female 2005-2007 Adults 5.7 5.5 5.907 0.77
Nagelhout 2012 Netherlands Male 2001 Adults 1.75 1.55 1.976 0.76
Nagelhout 2012 Netherlands female 2001 Adults 1.79 1.56 2.054 0.75
Nagelhout 2012 Netherlands Male 2008 Adults 1.84 1.62 2.09 0.76
Nagelhout 2012 Netherlands female 2008 Adults 2.26 1.96 2.606 0.75
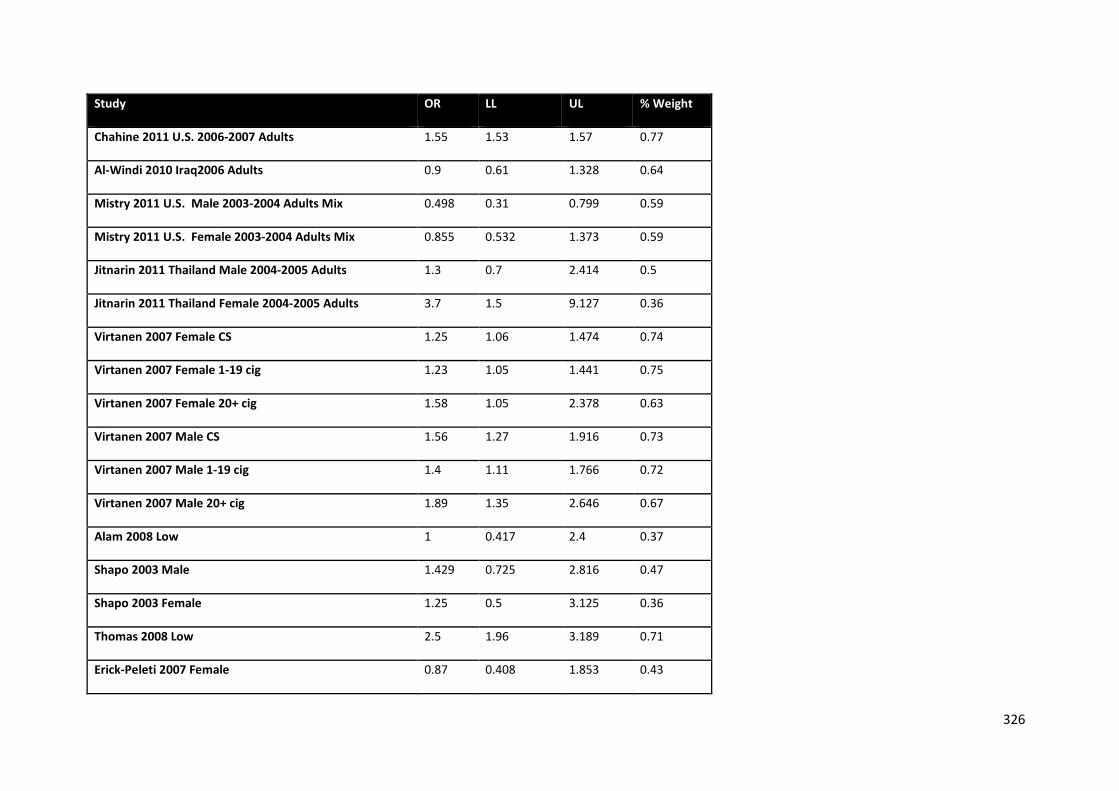
326
Study OR LL UL % Weight
Chahine 2011 U.S. 2006-2007 Adults 1.55 1.53 1.57 0.77
Al-Windi 2010 Iraq2006 Adults 0.9 0.61 1.328 0.64
Mistry 2011 U.S. Male 2003-2004 Adults Mix 0.498 0.31 0.799 0.59
Mistry 2011 U.S. Female 2003-2004 Adults Mix 0.855 0.532 1.373 0.59
Jitnarin 2011 Thailand Male 2004-2005 Adults 1.3 0.7 2.414 0.5
Jitnarin 2011 Thailand Female 2004-2005 Adults 3.7 1.5 9.127 0.36
Virtanen 2007 Female CS 1.25 1.06 1.474 0.74
Virtanen 2007 Female 1-19 cig 1.23 1.05 1.441 0.75
Virtanen 2007 Female 20+ cig 1.58 1.05 2.378 0.63
Virtanen 2007 Male CS 1.56 1.27 1.916 0.73
Virtanen 2007 Male 1-19 cig 1.4 1.11 1.766 0.72
Virtanen 2007 Male 20+ cig 1.89 1.35 2.646 0.67
Alam 2008 Low 1 0.417 2.4 0.37
Shapo 2003 Male 1.429 0.725 2.816 0.47
Shapo 2003 Female 1.25 0.5 3.125 0.36
Thomas 2008 Low 2.5 1.96 3.189 0.71
Erick-Peleti 2007 Female 0.87 0.408 1.853 0.43
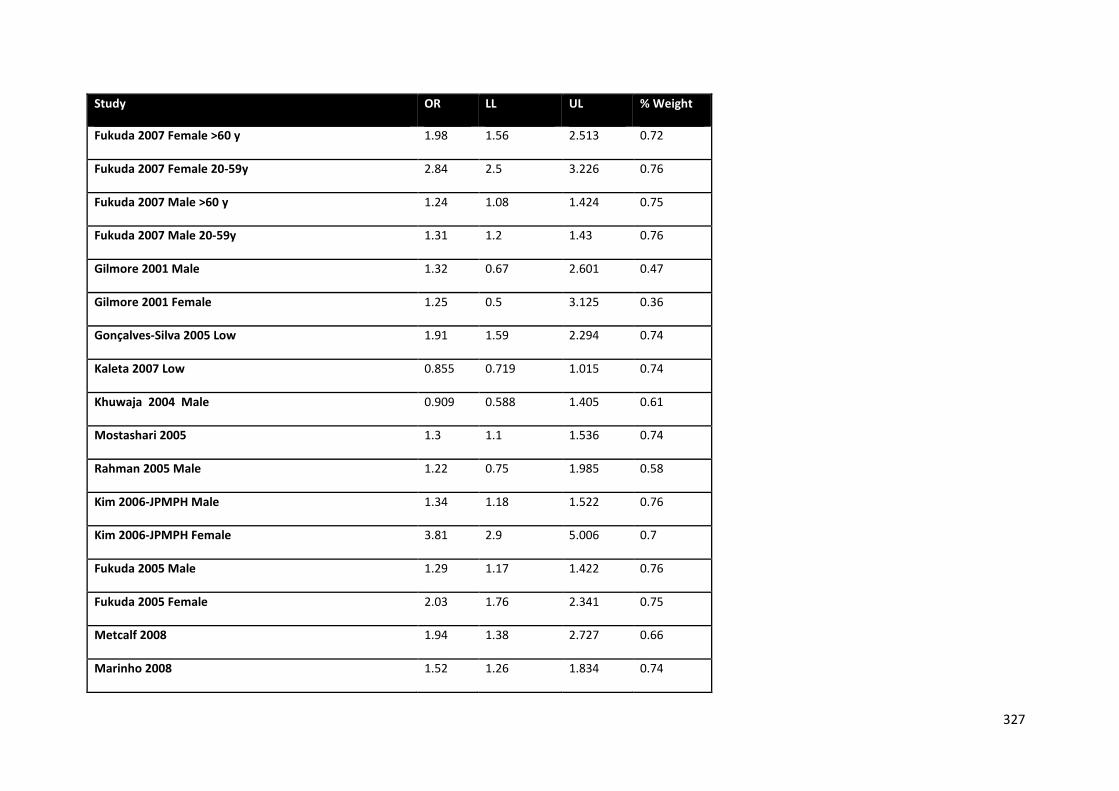
327
Study OR LL UL % Weight
Fukuda 2007 Female >60 y 1.98 1.56 2.513 0.72
Fukuda 2007 Female 20-59y 2.84 2.5 3.226 0.76
Fukuda 2007 Male >60 y 1.24 1.08 1.424 0.75
Fukuda 2007 Male 20-59y 1.31 1.2 1.43 0.76
Gilmore 2001 Male 1.32 0.67 2.601 0.47
Gilmore 2001 Female 1.25 0.5 3.125 0.36
Gonçalves-Silva 2005 Low 1.91 1.59 2.294 0.74
Kaleta 2007 Low 0.855 0.719 1.015 0.74
Khuwaja 2004 Male 0.909 0.588 1.405 0.61
Mostashari 2005 1.3 1.1 1.536 0.74
Rahman 2005 Male 1.22 0.75 1.985 0.58
Kim 2006-JPMPH Male 1.34 1.18 1.522 0.76
Kim 2006-JPMPH Female 3.81 2.9 5.006 0.7
Fukuda 2005 Male 1.29 1.17 1.422 0.76
Fukuda 2005 Female 2.03 1.76 2.341 0.75
Metcalf 2008 1.94 1.38 2.727 0.66
Marinho 2008 1.52 1.26 1.834 0.74
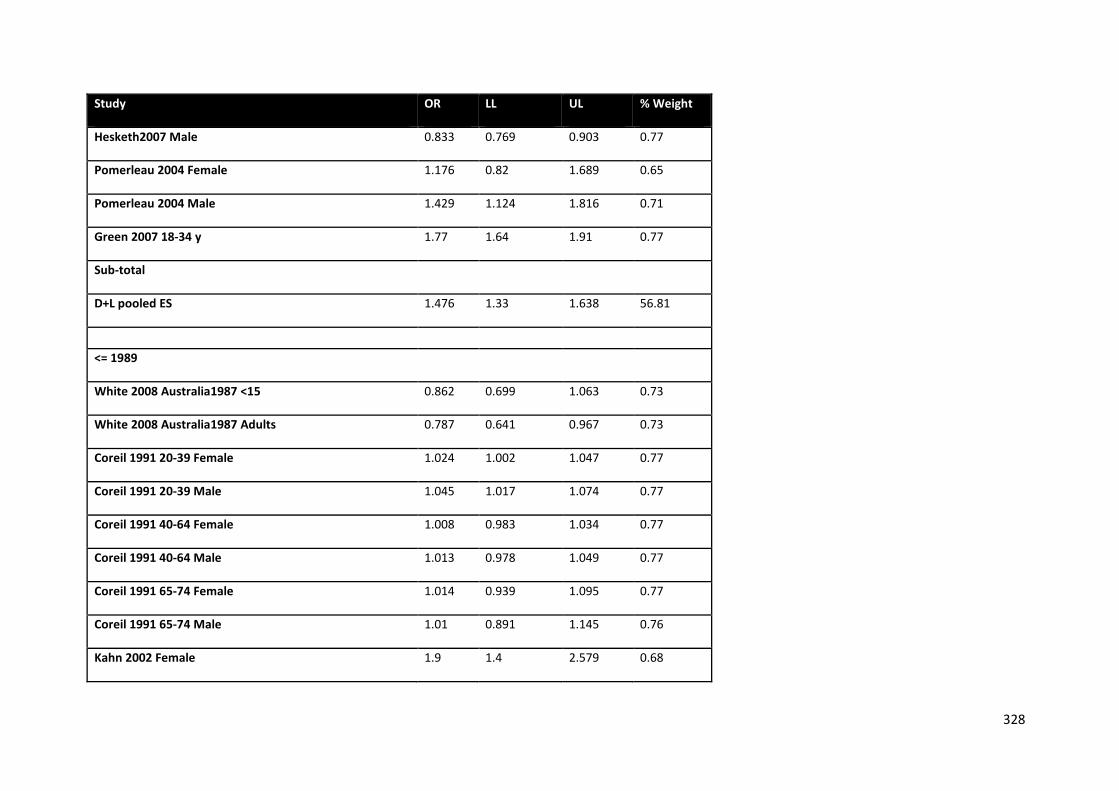
328
Study OR LL UL % Weight
Hesketh2007 Male 0.833 0.769 0.903 0.77
Pomerleau 2004 Female 1.176 0.82 1.689 0.65
Pomerleau 2004 Male 1.429 1.124 1.816 0.71
Green 2007 18-34 y 1.77 1.64 1.91 0.77
Sub-total
D+L pooled ES 1.476 1.33 1.638 56.81
<= 1989
White 2008 Australia1987 <15 0.862 0.699 1.063 0.73
White 2008 Australia1987 Adults 0.787 0.641 0.967 0.73
Coreil 1991 20-39 Female 1.024 1.002 1.047 0.77
Coreil 1991 20-39 Male 1.045 1.017 1.074 0.77
Coreil 1991 40-64 Female 1.008 0.983 1.034 0.77
Coreil 1991 40-64 Male 1.013 0.978 1.049 0.77
Coreil 1991 65-74 Female 1.014 0.939 1.095 0.77
Coreil 1991 65-74 Male 1.01 0.891 1.145 0.76
Kahn 2002 Female 1.9 1.4 2.579 0.68
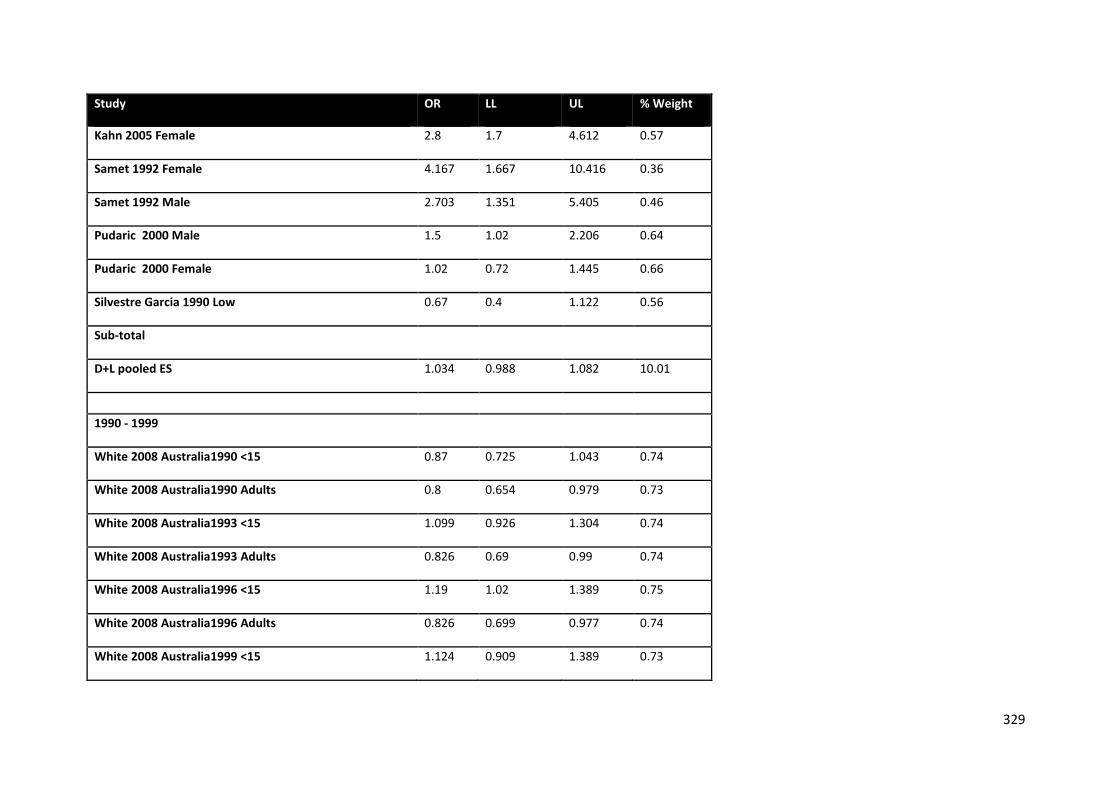
329
Study OR LL UL % Weight
Kahn 2005 Female 2.8 1.7 4.612 0.57
Samet 1992 Female 4.167 1.667 10.416 0.36
Samet 1992 Male 2.703 1.351 5.405 0.46
Pudaric 2000 Male 1.5 1.02 2.206 0.64
Pudaric 2000 Female 1.02 0.72 1.445 0.66
Silvestre Garcia 1990 Low 0.67 0.4 1.122 0.56
Sub-total
D+L pooled ES 1.034 0.988 1.082 10.01
1990 - 1999
White 2008 Australia1990 <15 0.87 0.725 1.043 0.74
White 2008 Australia1990 Adults 0.8 0.654 0.979 0.73
White 2008 Australia1993 <15 1.099 0.926 1.304 0.74
White 2008 Australia1993 Adults 0.826 0.69 0.99 0.74
White 2008 Australia1996 <15 1.19 1.02 1.389 0.75
White 2008 Australia1996 Adults 0.826 0.699 0.977 0.74
White 2008 Australia1999 <15 1.124 0.909 1.389 0.73
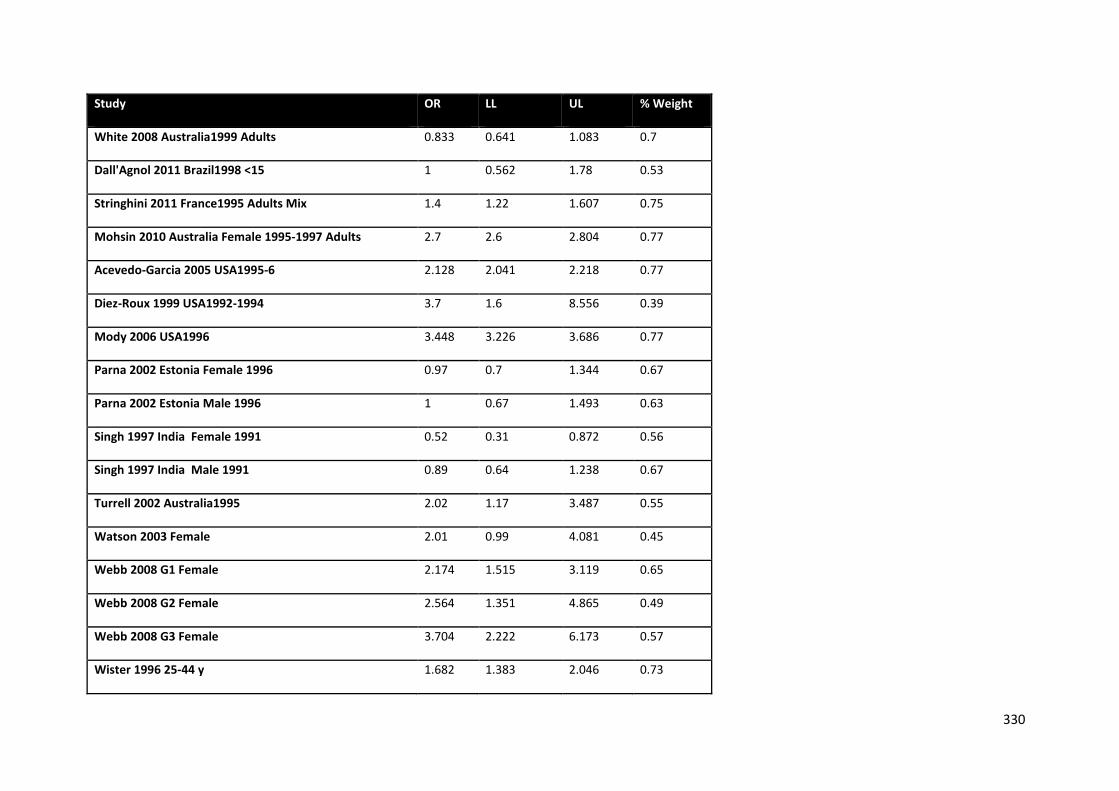
330
Study OR LL UL % Weight
White 2008 Australia1999 Adults 0.833 0.641 1.083 0.7
Dall'Agnol 2011 Brazil1998 <15 1 0.562 1.78 0.53
Stringhini 2011 France1995 Adults Mix 1.4 1.22 1.607 0.75
Mohsin 2010 Australia Female 1995-1997 Adults 2.7 2.6 2.804 0.77
Acevedo-Garcia 2005 USA1995-6 2.128 2.041 2.218 0.77
Diez-Roux 1999 USA1992-1994 3.7 1.6 8.556 0.39
Mody 2006 USA1996 3.448 3.226 3.686 0.77
Parna 2002 Estonia Female 1996 0.97 0.7 1.344 0.67
Parna 2002 Estonia Male 1996 1 0.67 1.493 0.63
Singh 1997 India Female 1991 0.52 0.31 0.872 0.56
Singh 1997 India Male 1991 0.89 0.64 1.238 0.67
Turrell 2002 Australia1995 2.02 1.17 3.487 0.55
Watson 2003 Female 2.01 0.99 4.081 0.45
Webb 2008 G1 Female 2.174 1.515 3.119 0.65
Webb 2008 G2 Female 2.564 1.351 4.865 0.49
Webb 2008 G3 Female 3.704 2.222 6.173 0.57
Wister 1996 25-44 y 1.682 1.383 2.046 0.73
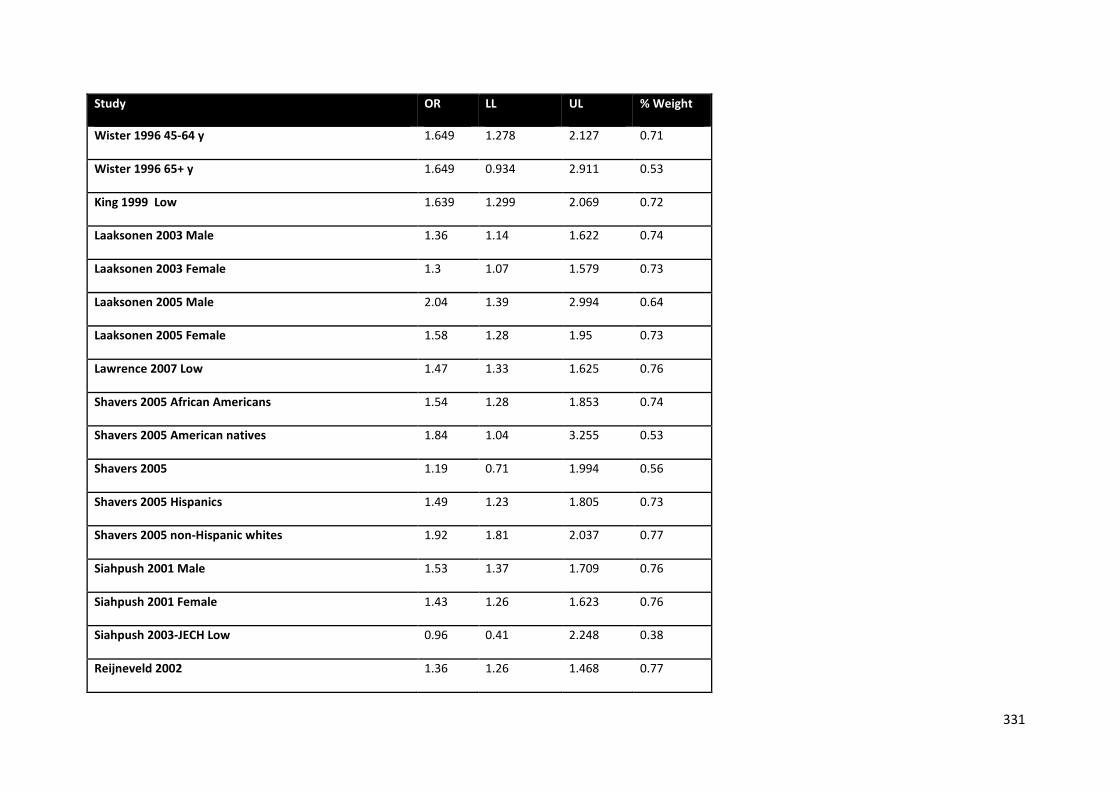
331
Study OR LL UL % Weight
Wister 1996 45-64 y 1.649 1.278 2.127 0.71
Wister 1996 65+ y 1.649 0.934 2.911 0.53
King 1999 Low 1.639 1.299 2.069 0.72
Laaksonen 2003 Male 1.36 1.14 1.622 0.74
Laaksonen 2003 Female 1.3 1.07 1.579 0.73
Laaksonen 2005 Male 2.04 1.39 2.994 0.64
Laaksonen 2005 Female 1.58 1.28 1.95 0.73
Lawrence 2007 Low 1.47 1.33 1.625 0.76
Shavers 2005 African Americans 1.54 1.28 1.853 0.74
Shavers 2005 American natives 1.84 1.04 3.255 0.53
Shavers 2005 1.19 0.71 1.994 0.56
Shavers 2005 Hispanics 1.49 1.23 1.805 0.73
Shavers 2005 non-Hispanic whites 1.92 1.81 2.037 0.77
Siahpush 2001 Male 1.53 1.37 1.709 0.76
Siahpush 2001 Female 1.43 1.26 1.623 0.76
Siahpush 2003-JECH Low 0.96 0.41 2.248 0.38
Reijneveld 2002 1.36 1.26 1.468 0.77
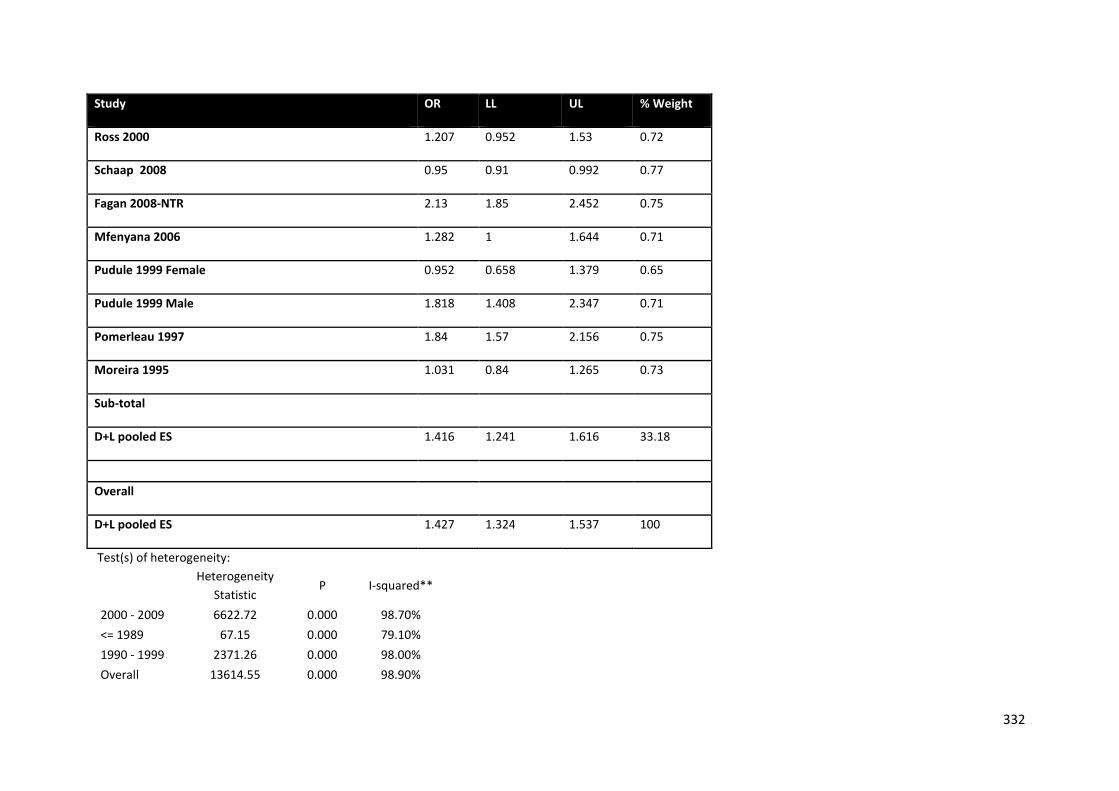
332
Study OR LL UL % Weight
Ross 2000 1.207 0.952 1.53 0.72
Schaap 2008 0.95 0.91 0.992 0.77
Fagan 2008-NTR 2.13 1.85 2.452 0.75
Mfenyana 2006 1.282 1 1.644 0.71
Pudule 1999 Female 0.952 0.658 1.379 0.65
Pudule 1999 Male 1.818 1.408 2.347 0.71
Pomerleau 1997 1.84 1.57 2.156 0.75
Moreira 1995 1.031 0.84 1.265 0.73
Sub-total
D+L pooled ES 1.416 1.241 1.616 33.18
Overall
D+L pooled ES 1.427 1.324 1.537 100
Test(s) of heterogeneity:
Heterogeneity Statistic
P I-squared**
2000 - 2009 6622.72 0.000 98.70% <= 1989 67.15 0.000 79.10% 1990 - 1999 2371.26 0.000 98.00% Overall 13614.55 0.000 98.90%
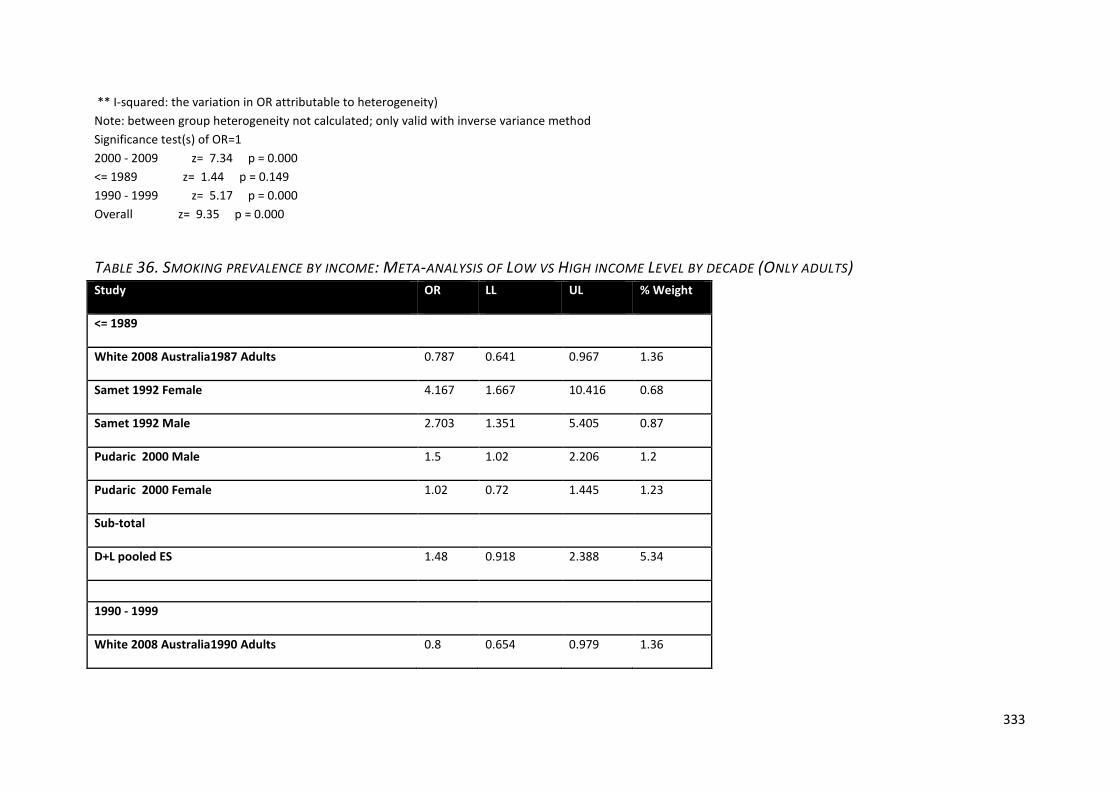
333
** I-squared: the variation in OR attributable to heterogeneity) Note: between group heterogeneity not calculated; only valid with inverse variance method Significance test(s) of OR=1 2000 - 2009 z= 7.34 p = 0.000 <= 1989 z= 1.44 p = 0.149 1990 - 1999 z= 5.17 p = 0.000 Overall z= 9.35 p = 0.000
TABLE 36. SMOKING PREVALENCE BY INCOME: META-ANALYSIS OF LOW VS HIGH INCOME LEVEL BY DECADE (ONLY ADULTS) Study OR LL UL % Weight
<= 1989
White 2008 Australia1987 Adults 0.787 0.641 0.967 1.36
Samet 1992 Female 4.167 1.667 10.416 0.68
Samet 1992 Male 2.703 1.351 5.405 0.87
Pudaric 2000 Male 1.5 1.02 2.206 1.2
Pudaric 2000 Female 1.02 0.72 1.445 1.23
Sub-total
D+L pooled ES 1.48 0.918 2.388 5.34
1990 - 1999
White 2008 Australia1990 Adults 0.8 0.654 0.979 1.36
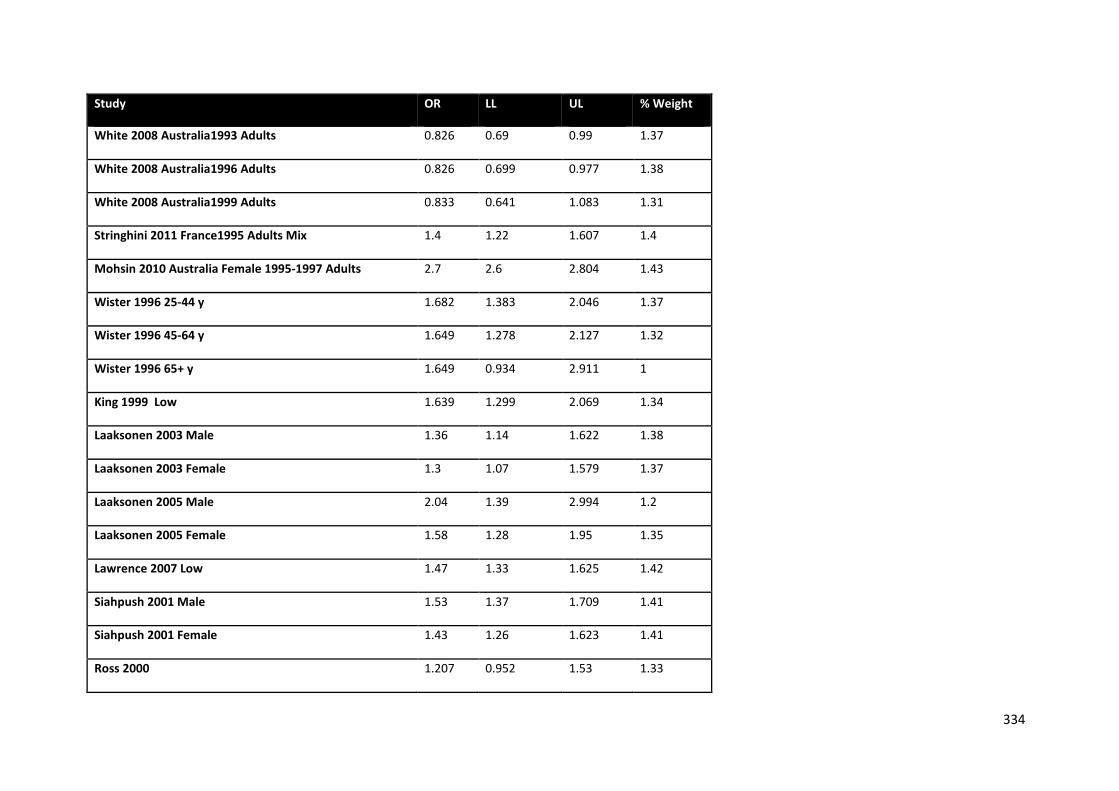
334
Study OR LL UL % Weight
White 2008 Australia1993 Adults 0.826 0.69 0.99 1.37
White 2008 Australia1996 Adults 0.826 0.699 0.977 1.38
White 2008 Australia1999 Adults 0.833 0.641 1.083 1.31
Stringhini 2011 France1995 Adults Mix 1.4 1.22 1.607 1.4
Mohsin 2010 Australia Female 1995-1997 Adults 2.7 2.6 2.804 1.43
Wister 1996 25-44 y 1.682 1.383 2.046 1.37
Wister 1996 45-64 y 1.649 1.278 2.127 1.32
Wister 1996 65+ y 1.649 0.934 2.911 1
King 1999 Low 1.639 1.299 2.069 1.34
Laaksonen 2003 Male 1.36 1.14 1.622 1.38
Laaksonen 2003 Female 1.3 1.07 1.579 1.37
Laaksonen 2005 Male 2.04 1.39 2.994 1.2
Laaksonen 2005 Female 1.58 1.28 1.95 1.35
Lawrence 2007 Low 1.47 1.33 1.625 1.42
Siahpush 2001 Male 1.53 1.37 1.709 1.41
Siahpush 2001 Female 1.43 1.26 1.623 1.41
Ross 2000 1.207 0.952 1.53 1.33
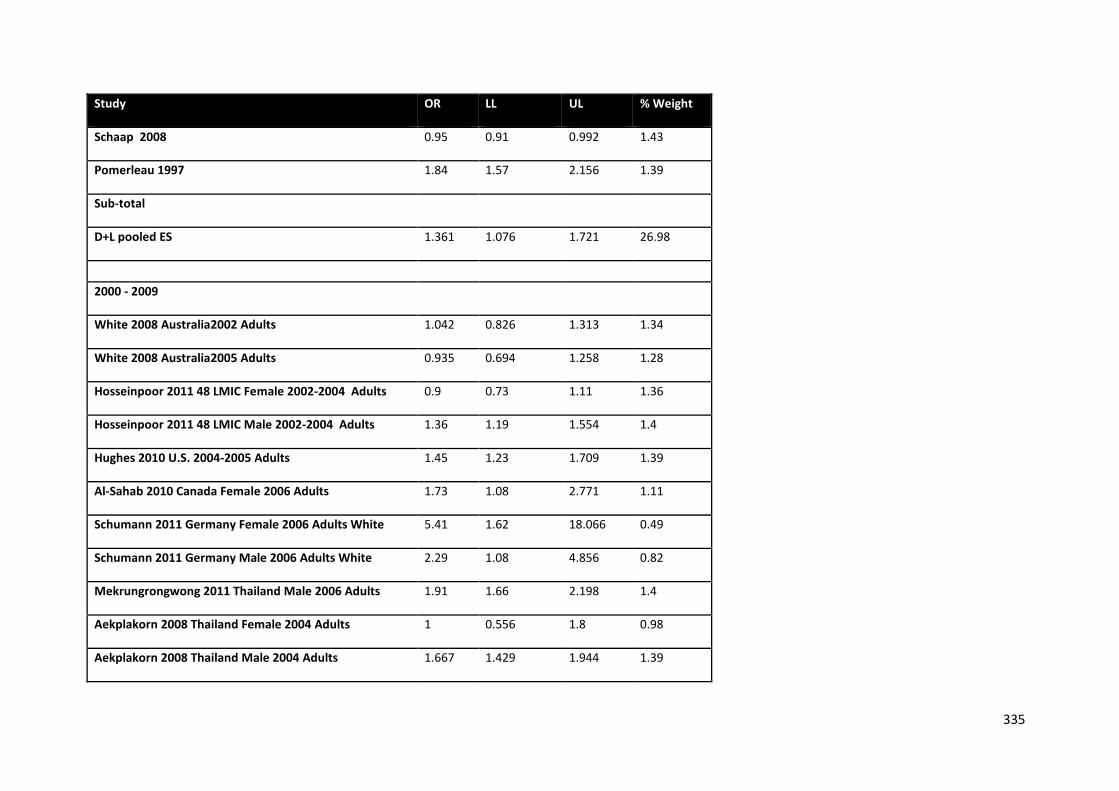
335
Study OR LL UL % Weight
Schaap 2008 0.95 0.91 0.992 1.43
Pomerleau 1997 1.84 1.57 2.156 1.39
Sub-total
D+L pooled ES 1.361 1.076 1.721 26.98
2000 - 2009
White 2008 Australia2002 Adults 1.042 0.826 1.313 1.34
White 2008 Australia2005 Adults 0.935 0.694 1.258 1.28
Hosseinpoor 2011 48 LMIC Female 2002-2004 Adults 0.9 0.73 1.11 1.36
Hosseinpoor 2011 48 LMIC Male 2002-2004 Adults 1.36 1.19 1.554 1.4
Hughes 2010 U.S. 2004-2005 Adults 1.45 1.23 1.709 1.39
Al-Sahab 2010 Canada Female 2006 Adults 1.73 1.08 2.771 1.11
Schumann 2011 Germany Female 2006 Adults White 5.41 1.62 18.066 0.49
Schumann 2011 Germany Male 2006 Adults White 2.29 1.08 4.856 0.82
Mekrungrongwong 2011 Thailand Male 2006 Adults 1.91 1.66 2.198 1.4
Aekplakorn 2008 Thailand Female 2004 Adults 1 0.556 1.8 0.98
Aekplakorn 2008 Thailand Male 2004 Adults 1.667 1.429 1.944 1.39
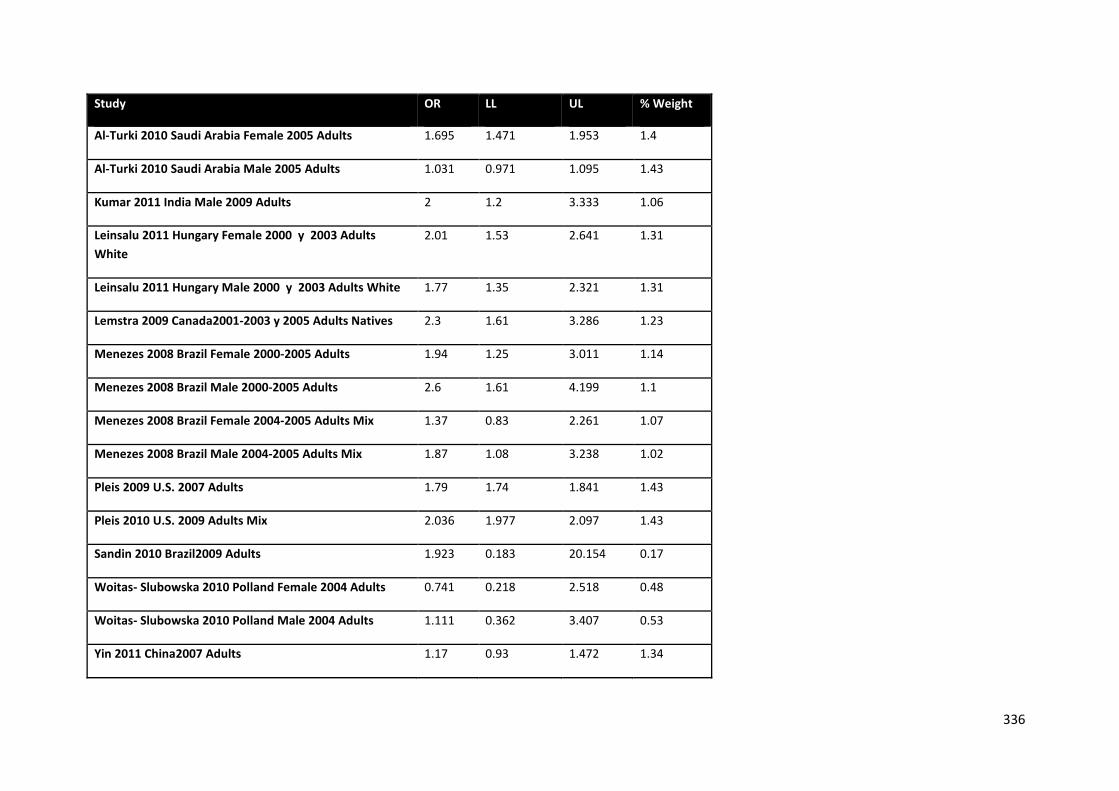
336
Study OR LL UL % Weight
Al-Turki 2010 Saudi Arabia Female 2005 Adults 1.695 1.471 1.953 1.4
Al-Turki 2010 Saudi Arabia Male 2005 Adults 1.031 0.971 1.095 1.43
Kumar 2011 India Male 2009 Adults 2 1.2 3.333 1.06
Leinsalu 2011 Hungary Female 2000 y 2003 Adults White
2.01 1.53 2.641 1.31
Leinsalu 2011 Hungary Male 2000 y 2003 Adults White 1.77 1.35 2.321 1.31
Lemstra 2009 Canada2001-2003 y 2005 Adults Natives 2.3 1.61 3.286 1.23
Menezes 2008 Brazil Female 2000-2005 Adults 1.94 1.25 3.011 1.14
Menezes 2008 Brazil Male 2000-2005 Adults 2.6 1.61 4.199 1.1
Menezes 2008 Brazil Female 2004-2005 Adults Mix 1.37 0.83 2.261 1.07
Menezes 2008 Brazil Male 2004-2005 Adults Mix 1.87 1.08 3.238 1.02
Pleis 2009 U.S. 2007 Adults 1.79 1.74 1.841 1.43
Pleis 2010 U.S. 2009 Adults Mix 2.036 1.977 2.097 1.43
Sandin 2010 Brazil2009 Adults 1.923 0.183 20.154 0.17
Woitas- Slubowska 2010 Polland Female 2004 Adults 0.741 0.218 2.518 0.48
Woitas- Slubowska 2010 Polland Male 2004 Adults 1.111 0.362 3.407 0.53
Yin 2011 China2007 Adults 1.17 0.93 1.472 1.34
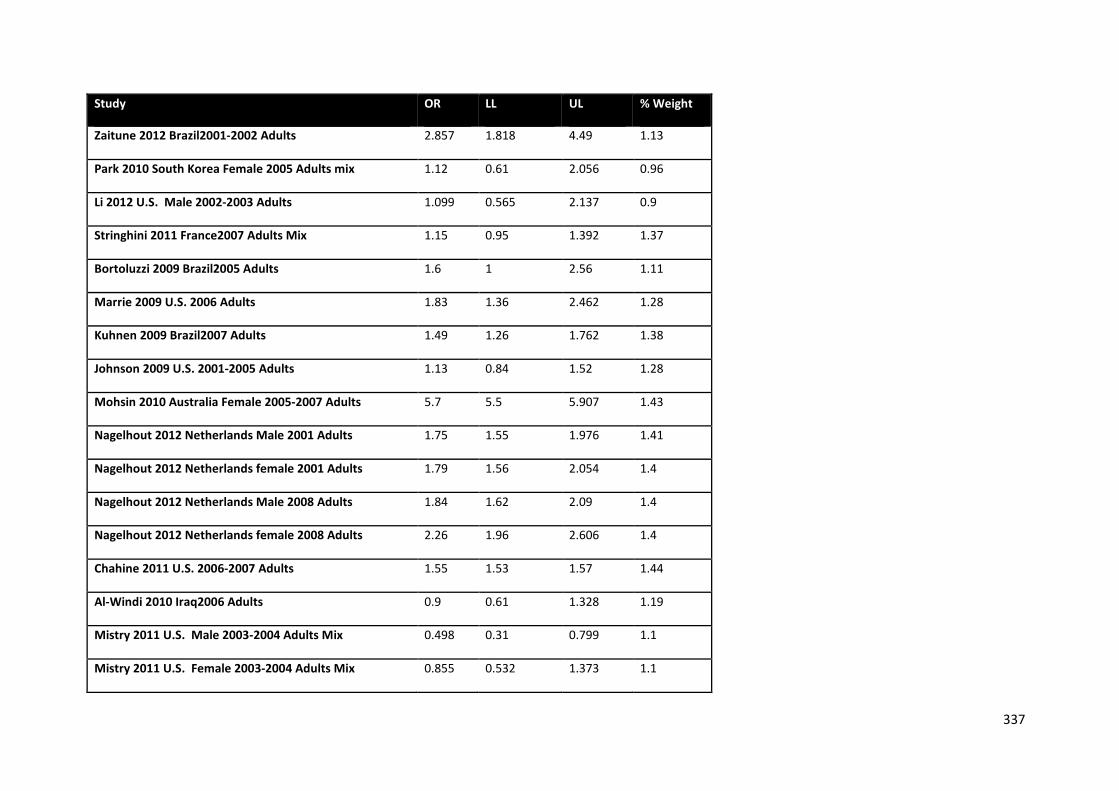
337
Study OR LL UL % Weight
Zaitune 2012 Brazil2001-2002 Adults 2.857 1.818 4.49 1.13
Park 2010 South Korea Female 2005 Adults mix 1.12 0.61 2.056 0.96
Li 2012 U.S. Male 2002-2003 Adults 1.099 0.565 2.137 0.9
Stringhini 2011 France2007 Adults Mix 1.15 0.95 1.392 1.37
Bortoluzzi 2009 Brazil2005 Adults 1.6 1 2.56 1.11
Marrie 2009 U.S. 2006 Adults 1.83 1.36 2.462 1.28
Kuhnen 2009 Brazil2007 Adults 1.49 1.26 1.762 1.38
Johnson 2009 U.S. 2001-2005 Adults 1.13 0.84 1.52 1.28
Mohsin 2010 Australia Female 2005-2007 Adults 5.7 5.5 5.907 1.43
Nagelhout 2012 Netherlands Male 2001 Adults 1.75 1.55 1.976 1.41
Nagelhout 2012 Netherlands female 2001 Adults 1.79 1.56 2.054 1.4
Nagelhout 2012 Netherlands Male 2008 Adults 1.84 1.62 2.09 1.4
Nagelhout 2012 Netherlands female 2008 Adults 2.26 1.96 2.606 1.4
Chahine 2011 U.S. 2006-2007 Adults 1.55 1.53 1.57 1.44
Al-Windi 2010 Iraq2006 Adults 0.9 0.61 1.328 1.19
Mistry 2011 U.S. Male 2003-2004 Adults Mix 0.498 0.31 0.799 1.1
Mistry 2011 U.S. Female 2003-2004 Adults Mix 0.855 0.532 1.373 1.1
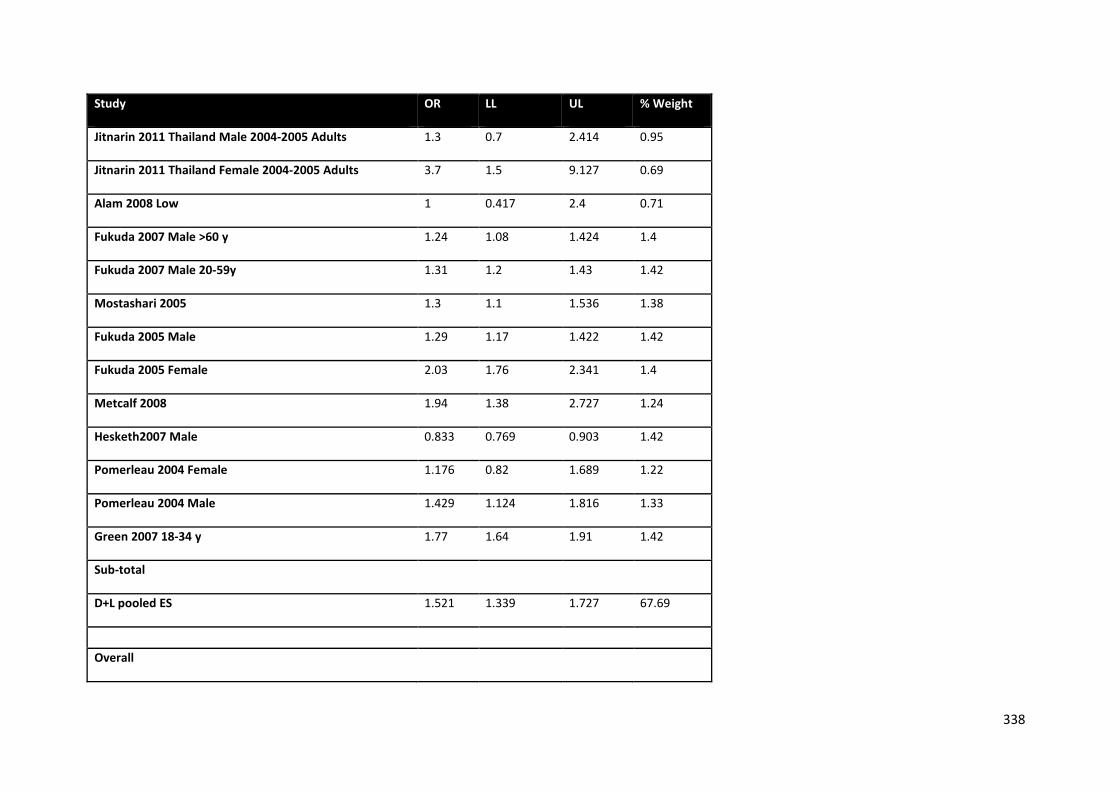
338
Study OR LL UL % Weight
Jitnarin 2011 Thailand Male 2004-2005 Adults 1.3 0.7 2.414 0.95
Jitnarin 2011 Thailand Female 2004-2005 Adults 3.7 1.5 9.127 0.69
Alam 2008 Low 1 0.417 2.4 0.71
Fukuda 2007 Male >60 y 1.24 1.08 1.424 1.4
Fukuda 2007 Male 20-59y 1.31 1.2 1.43 1.42
Mostashari 2005 1.3 1.1 1.536 1.38
Fukuda 2005 Male 1.29 1.17 1.422 1.42
Fukuda 2005 Female 2.03 1.76 2.341 1.4
Metcalf 2008 1.94 1.38 2.727 1.24
Hesketh2007 Male 0.833 0.769 0.903 1.42
Pomerleau 2004 Female 1.176 0.82 1.689 1.22
Pomerleau 2004 Male 1.429 1.124 1.816 1.33
Green 2007 18-34 y 1.77 1.64 1.91 1.42
Sub-total
D+L pooled ES 1.521 1.339 1.727 67.69
Overall
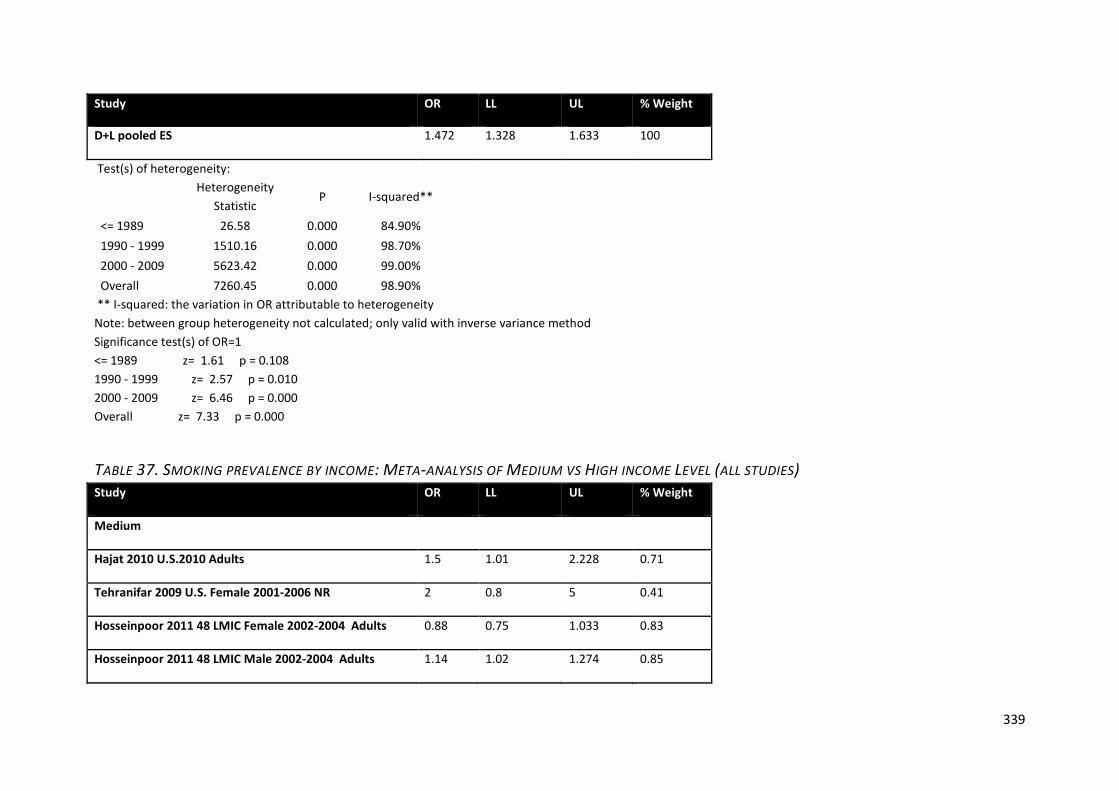
339
Study OR LL UL % Weight
D+L pooled ES 1.472 1.328 1.633 100
Test(s) of heterogeneity:
Heterogeneity Statistic
P I-squared**
<= 1989 26.58 0.000 84.90% 1990 - 1999 1510.16 0.000 98.70% 2000 - 2009 5623.42 0.000 99.00% Overall 7260.45 0.000 98.90%
** I-squared: the variation in OR attributable to heterogeneity Note: between group heterogeneity not calculated; only valid with inverse variance method Significance test(s) of OR=1 <= 1989 z= 1.61 p = 0.108 1990 - 1999 z= 2.57 p = 0.010 2000 - 2009 z= 6.46 p = 0.000 Overall z= 7.33 p = 0.000
TABLE 37. SMOKING PREVALENCE BY INCOME: META-ANALYSIS OF MEDIUM VS HIGH INCOME LEVEL (ALL STUDIES) Study OR LL UL % Weight
Medium
Hajat 2010 U.S.2010 Adults 1.5 1.01 2.228 0.71
Tehranifar 2009 U.S. Female 2001-2006 NR 2 0.8 5 0.41
Hosseinpoor 2011 48 LMIC Female 2002-2004 Adults 0.88 0.75 1.033 0.83
Hosseinpoor 2011 48 LMIC Male 2002-2004 Adults 1.14 1.02 1.274 0.85

340
Study OR LL UL % Weight
Schumann 2011 Germany Female 2006 Adults White 2.16 0.7 6.665 0.32
Schumann 2011 Germany Male 2006 Adults White 1.07 0.58 1.974 0.58
Mekrungrongwong 2011 Thailand Male 2006 Adults 1.23 1.08 1.401 0.84
Bombard 2012 U.S. Female 2005-2006 NR 2.6 2 3.38 0.79
Kumar 2011 India Male 2009 Adults 1.4 1.1 1.782 0.8
Leinsalu 2011 Hungary Female 2000 y 2003 Adults White
1.13 0.88 1.451 0.79
Leinsalu 2011 Hungary Male 2000 y 2003 Adults White 1.16 0.9 1.495 0.79
Lemstra 2009 Canada2001-2003 y 2005 Adults Natives 1.83 1.35 2.481 0.77
Menezes 2008 Brazil Female 2000-2005 Adults 1.21 0.76 1.926 0.67
Menezes 2008 Brazil Male 2000-2005 Adults 1.88 1.16 3.047 0.66
Menezes 2008 Brazil Female 2004-2005 Adults Mix 1.06 0.65 1.729 0.65
Menezes 2008 Brazil Male 2004-2005 Adults Mix 1.66 0.97 2.841 0.62
Muller-Riemenschneider 2010 Germany2003-2006 <15 1.631 1.361 1.955 0.82
Pleis 2009 U.S. 2007 Adults 1.5 1.46 1.541 0.86
Pleis 2010 U.S. 2009 Adults Mix 1.53 1.49 1.571 0.86
Yin 2011 China2007 Adults 0.88 0.69 1.122 0.8
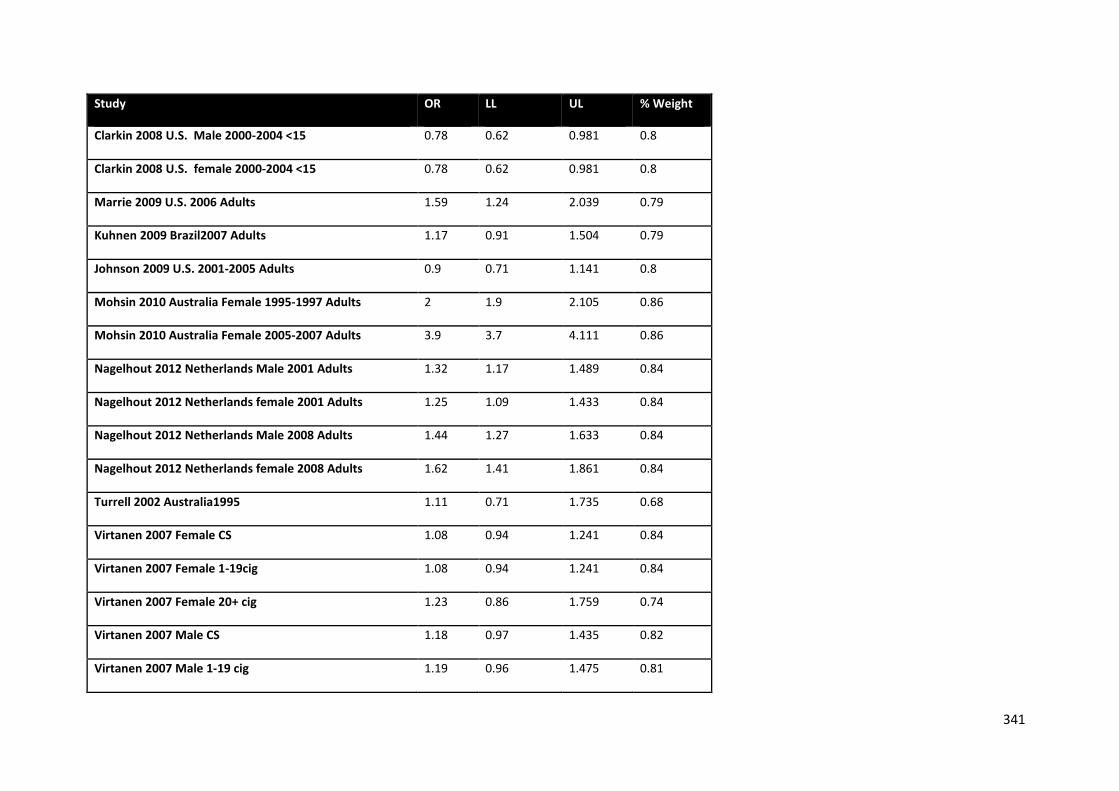
341
Study OR LL UL % Weight
Clarkin 2008 U.S. Male 2000-2004 <15 0.78 0.62 0.981 0.8
Clarkin 2008 U.S. female 2000-2004 <15 0.78 0.62 0.981 0.8
Marrie 2009 U.S. 2006 Adults 1.59 1.24 2.039 0.79
Kuhnen 2009 Brazil2007 Adults 1.17 0.91 1.504 0.79
Johnson 2009 U.S. 2001-2005 Adults 0.9 0.71 1.141 0.8
Mohsin 2010 Australia Female 1995-1997 Adults 2 1.9 2.105 0.86
Mohsin 2010 Australia Female 2005-2007 Adults 3.9 3.7 4.111 0.86
Nagelhout 2012 Netherlands Male 2001 Adults 1.32 1.17 1.489 0.84
Nagelhout 2012 Netherlands female 2001 Adults 1.25 1.09 1.433 0.84
Nagelhout 2012 Netherlands Male 2008 Adults 1.44 1.27 1.633 0.84
Nagelhout 2012 Netherlands female 2008 Adults 1.62 1.41 1.861 0.84
Turrell 2002 Australia1995 1.11 0.71 1.735 0.68
Virtanen 2007 Female CS 1.08 0.94 1.241 0.84
Virtanen 2007 Female 1-19cig 1.08 0.94 1.241 0.84
Virtanen 2007 Female 20+ cig 1.23 0.86 1.759 0.74
Virtanen 2007 Male CS 1.18 0.97 1.435 0.82
Virtanen 2007 Male 1-19 cig 1.19 0.96 1.475 0.81
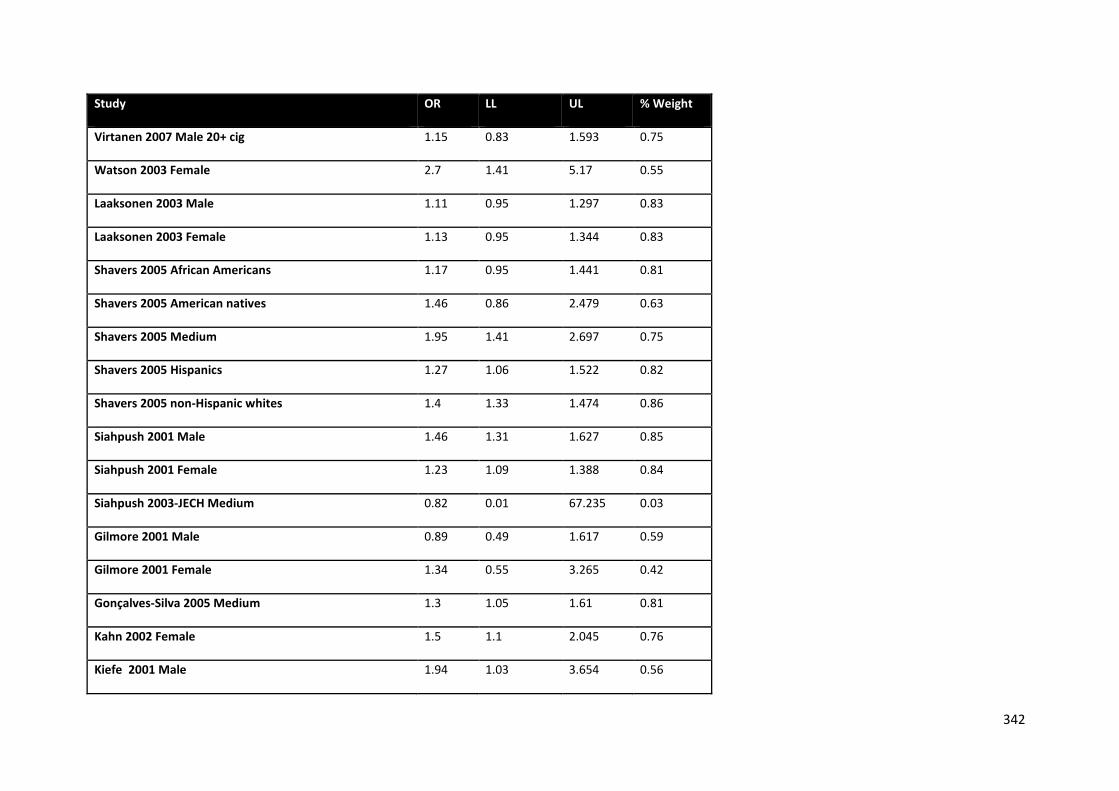
342
Study OR LL UL % Weight
Virtanen 2007 Male 20+ cig 1.15 0.83 1.593 0.75
Watson 2003 Female 2.7 1.41 5.17 0.55
Laaksonen 2003 Male 1.11 0.95 1.297 0.83
Laaksonen 2003 Female 1.13 0.95 1.344 0.83
Shavers 2005 African Americans 1.17 0.95 1.441 0.81
Shavers 2005 American natives 1.46 0.86 2.479 0.63
Shavers 2005 Medium 1.95 1.41 2.697 0.75
Shavers 2005 Hispanics 1.27 1.06 1.522 0.82
Shavers 2005 non-Hispanic whites 1.4 1.33 1.474 0.86
Siahpush 2001 Male 1.46 1.31 1.627 0.85
Siahpush 2001 Female 1.23 1.09 1.388 0.84
Siahpush 2003-JECH Medium 0.82 0.01 67.235 0.03
Gilmore 2001 Male 0.89 0.49 1.617 0.59
Gilmore 2001 Female 1.34 0.55 3.265 0.42
Gonçalves-Silva 2005 Medium 1.3 1.05 1.61 0.81
Kahn 2002 Female 1.5 1.1 2.045 0.76
Kiefe 2001 Male 1.94 1.03 3.654 0.56
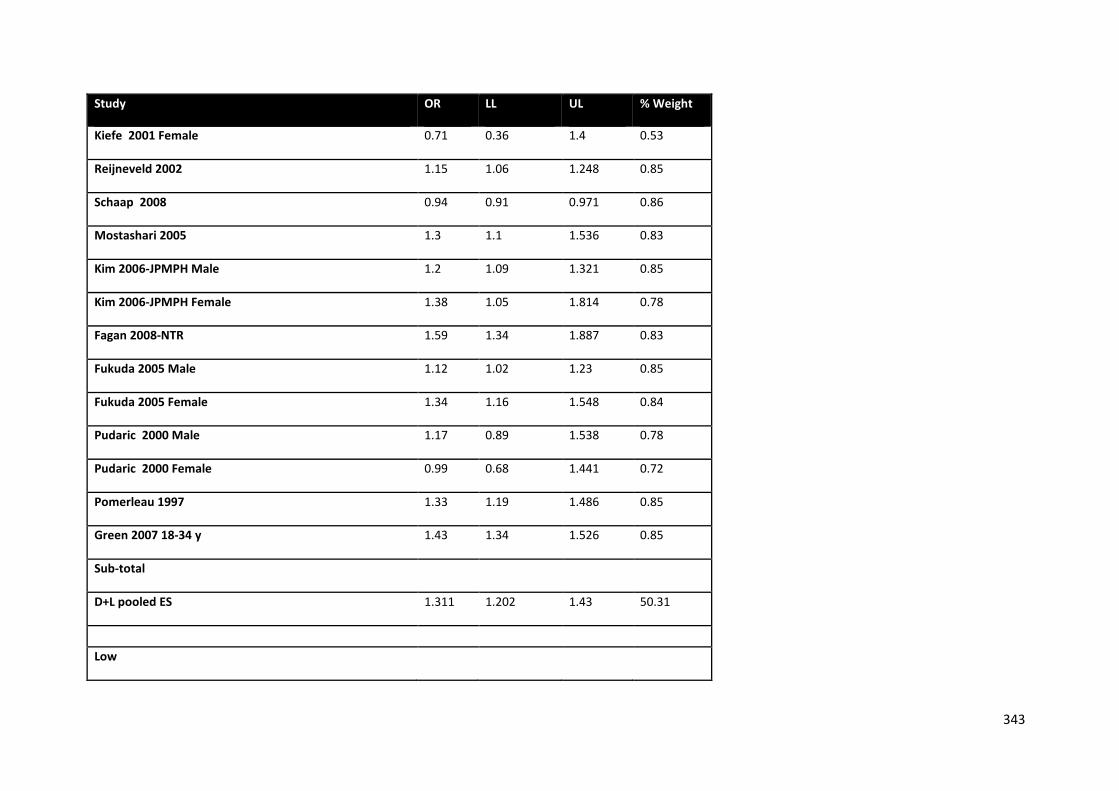
343
Study OR LL UL % Weight
Kiefe 2001 Female 0.71 0.36 1.4 0.53
Reijneveld 2002 1.15 1.06 1.248 0.85
Schaap 2008 0.94 0.91 0.971 0.86
Mostashari 2005 1.3 1.1 1.536 0.83
Kim 2006-JPMPH Male 1.2 1.09 1.321 0.85
Kim 2006-JPMPH Female 1.38 1.05 1.814 0.78
Fagan 2008-NTR 1.59 1.34 1.887 0.83
Fukuda 2005 Male 1.12 1.02 1.23 0.85
Fukuda 2005 Female 1.34 1.16 1.548 0.84
Pudaric 2000 Male 1.17 0.89 1.538 0.78
Pudaric 2000 Female 0.99 0.68 1.441 0.72
Pomerleau 1997 1.33 1.19 1.486 0.85
Green 2007 18-34 y 1.43 1.34 1.526 0.85
Sub-total
D+L pooled ES 1.311 1.202 1.43 50.31
Low
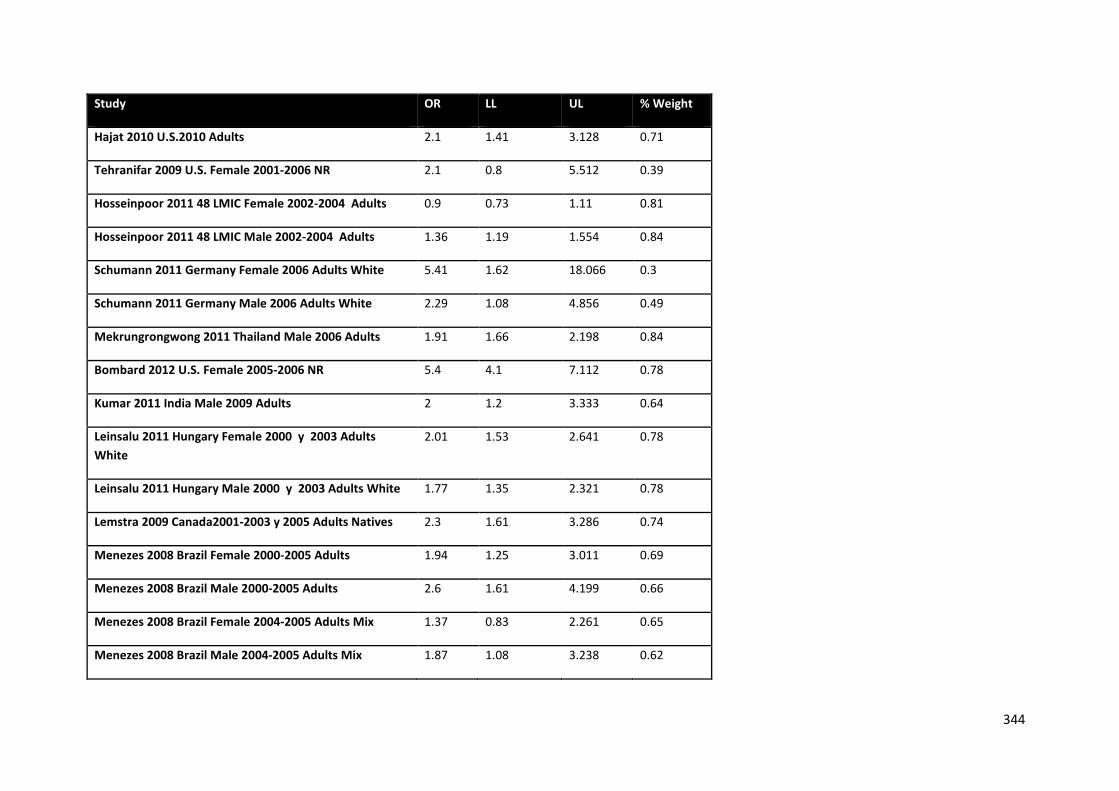
344
Study OR LL UL % Weight
Hajat 2010 U.S.2010 Adults 2.1 1.41 3.128 0.71
Tehranifar 2009 U.S. Female 2001-2006 NR 2.1 0.8 5.512 0.39
Hosseinpoor 2011 48 LMIC Female 2002-2004 Adults 0.9 0.73 1.11 0.81
Hosseinpoor 2011 48 LMIC Male 2002-2004 Adults 1.36 1.19 1.554 0.84
Schumann 2011 Germany Female 2006 Adults White 5.41 1.62 18.066 0.3
Schumann 2011 Germany Male 2006 Adults White 2.29 1.08 4.856 0.49
Mekrungrongwong 2011 Thailand Male 2006 Adults 1.91 1.66 2.198 0.84
Bombard 2012 U.S. Female 2005-2006 NR 5.4 4.1 7.112 0.78
Kumar 2011 India Male 2009 Adults 2 1.2 3.333 0.64
Leinsalu 2011 Hungary Female 2000 y 2003 Adults White
2.01 1.53 2.641 0.78
Leinsalu 2011 Hungary Male 2000 y 2003 Adults White 1.77 1.35 2.321 0.78
Lemstra 2009 Canada2001-2003 y 2005 Adults Natives 2.3 1.61 3.286 0.74
Menezes 2008 Brazil Female 2000-2005 Adults 1.94 1.25 3.011 0.69
Menezes 2008 Brazil Male 2000-2005 Adults 2.6 1.61 4.199 0.66
Menezes 2008 Brazil Female 2004-2005 Adults Mix 1.37 0.83 2.261 0.65
Menezes 2008 Brazil Male 2004-2005 Adults Mix 1.87 1.08 3.238 0.62
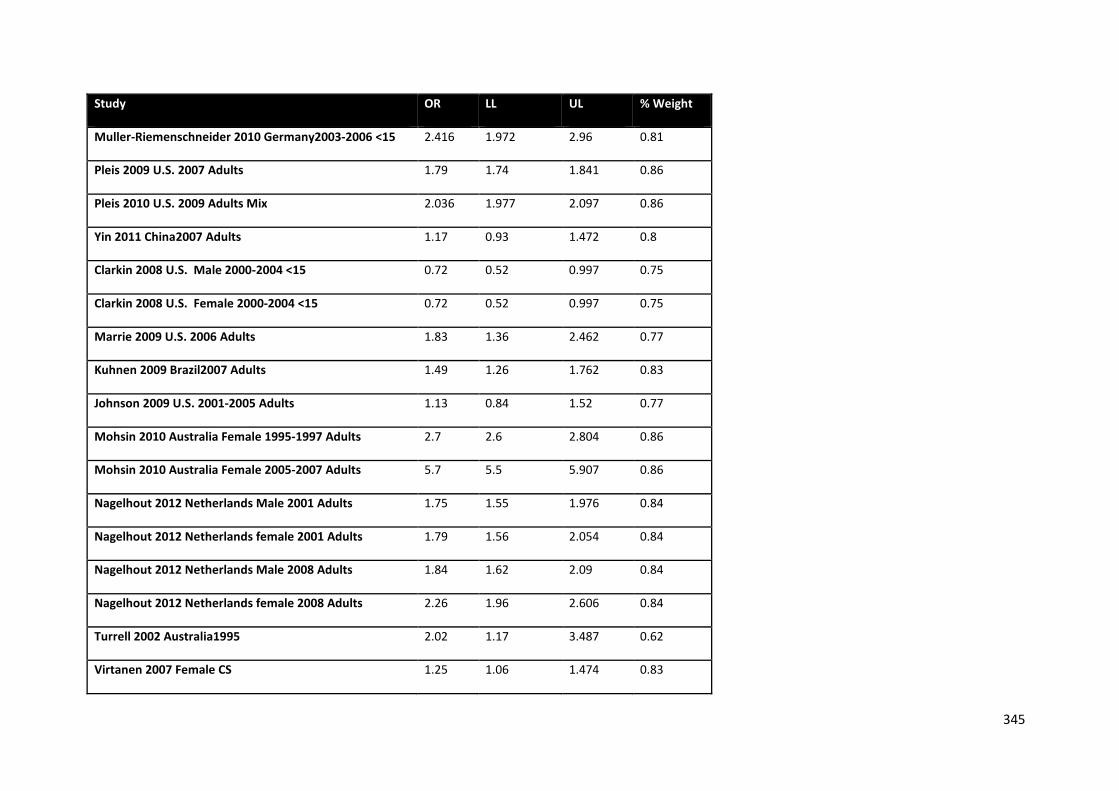
345
Study OR LL UL % Weight
Muller-Riemenschneider 2010 Germany2003-2006 <15 2.416 1.972 2.96 0.81
Pleis 2009 U.S. 2007 Adults 1.79 1.74 1.841 0.86
Pleis 2010 U.S. 2009 Adults Mix 2.036 1.977 2.097 0.86
Yin 2011 China2007 Adults 1.17 0.93 1.472 0.8
Clarkin 2008 U.S. Male 2000-2004 <15 0.72 0.52 0.997 0.75
Clarkin 2008 U.S. Female 2000-2004 <15 0.72 0.52 0.997 0.75
Marrie 2009 U.S. 2006 Adults 1.83 1.36 2.462 0.77
Kuhnen 2009 Brazil2007 Adults 1.49 1.26 1.762 0.83
Johnson 2009 U.S. 2001-2005 Adults 1.13 0.84 1.52 0.77
Mohsin 2010 Australia Female 1995-1997 Adults 2.7 2.6 2.804 0.86
Mohsin 2010 Australia Female 2005-2007 Adults 5.7 5.5 5.907 0.86
Nagelhout 2012 Netherlands Male 2001 Adults 1.75 1.55 1.976 0.84
Nagelhout 2012 Netherlands female 2001 Adults 1.79 1.56 2.054 0.84
Nagelhout 2012 Netherlands Male 2008 Adults 1.84 1.62 2.09 0.84
Nagelhout 2012 Netherlands female 2008 Adults 2.26 1.96 2.606 0.84
Turrell 2002 Australia1995 2.02 1.17 3.487 0.62
Virtanen 2007 Female CS 1.25 1.06 1.474 0.83
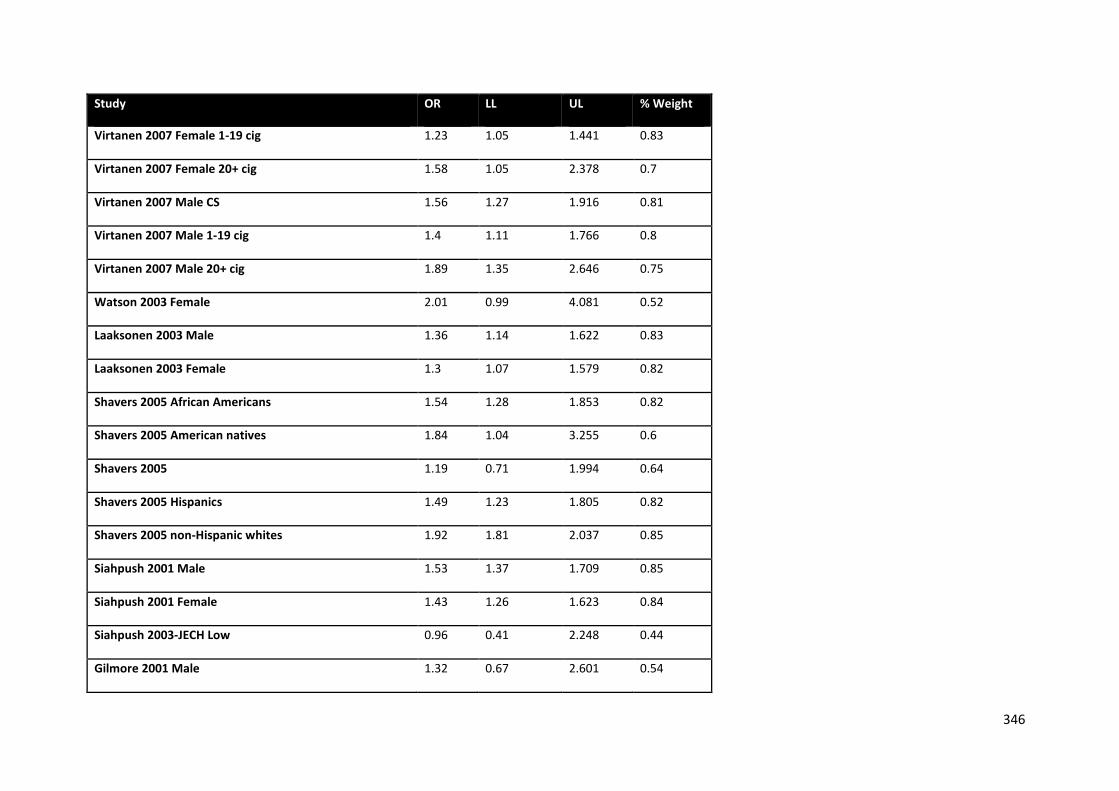
346
Study OR LL UL % Weight
Virtanen 2007 Female 1-19 cig 1.23 1.05 1.441 0.83
Virtanen 2007 Female 20+ cig 1.58 1.05 2.378 0.7
Virtanen 2007 Male CS 1.56 1.27 1.916 0.81
Virtanen 2007 Male 1-19 cig 1.4 1.11 1.766 0.8
Virtanen 2007 Male 20+ cig 1.89 1.35 2.646 0.75
Watson 2003 Female 2.01 0.99 4.081 0.52
Laaksonen 2003 Male 1.36 1.14 1.622 0.83
Laaksonen 2003 Female 1.3 1.07 1.579 0.82
Shavers 2005 African Americans 1.54 1.28 1.853 0.82
Shavers 2005 American natives 1.84 1.04 3.255 0.6
Shavers 2005 1.19 0.71 1.994 0.64
Shavers 2005 Hispanics 1.49 1.23 1.805 0.82
Shavers 2005 non-Hispanic whites 1.92 1.81 2.037 0.85
Siahpush 2001 Male 1.53 1.37 1.709 0.85
Siahpush 2001 Female 1.43 1.26 1.623 0.84
Siahpush 2003-JECH Low 0.96 0.41 2.248 0.44
Gilmore 2001 Male 1.32 0.67 2.601 0.54
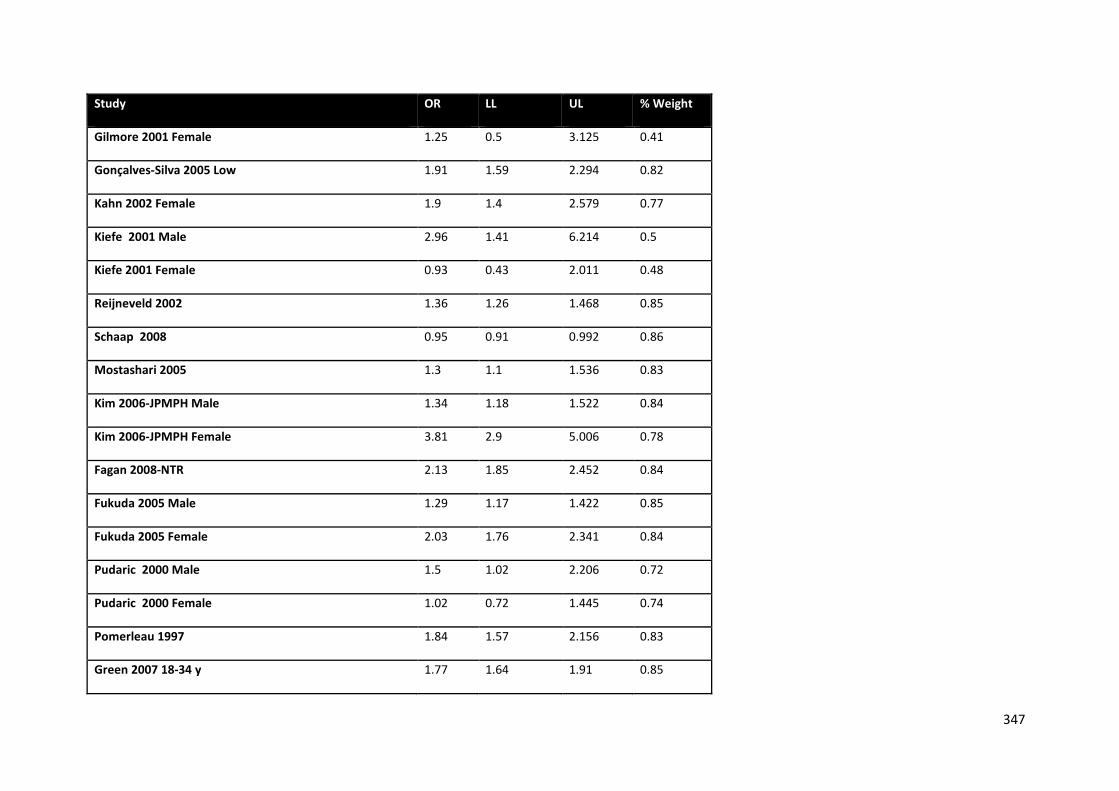
347
Study OR LL UL % Weight
Gilmore 2001 Female 1.25 0.5 3.125 0.41
Gonçalves-Silva 2005 Low 1.91 1.59 2.294 0.82
Kahn 2002 Female 1.9 1.4 2.579 0.77
Kiefe 2001 Male 2.96 1.41 6.214 0.5
Kiefe 2001 Female 0.93 0.43 2.011 0.48
Reijneveld 2002 1.36 1.26 1.468 0.85
Schaap 2008 0.95 0.91 0.992 0.86
Mostashari 2005 1.3 1.1 1.536 0.83
Kim 2006-JPMPH Male 1.34 1.18 1.522 0.84
Kim 2006-JPMPH Female 3.81 2.9 5.006 0.78
Fagan 2008-NTR 2.13 1.85 2.452 0.84
Fukuda 2005 Male 1.29 1.17 1.422 0.85
Fukuda 2005 Female 2.03 1.76 2.341 0.84
Pudaric 2000 Male 1.5 1.02 2.206 0.72
Pudaric 2000 Female 1.02 0.72 1.445 0.74
Pomerleau 1997 1.84 1.57 2.156 0.83
Green 2007 18-34 y 1.77 1.64 1.91 0.85
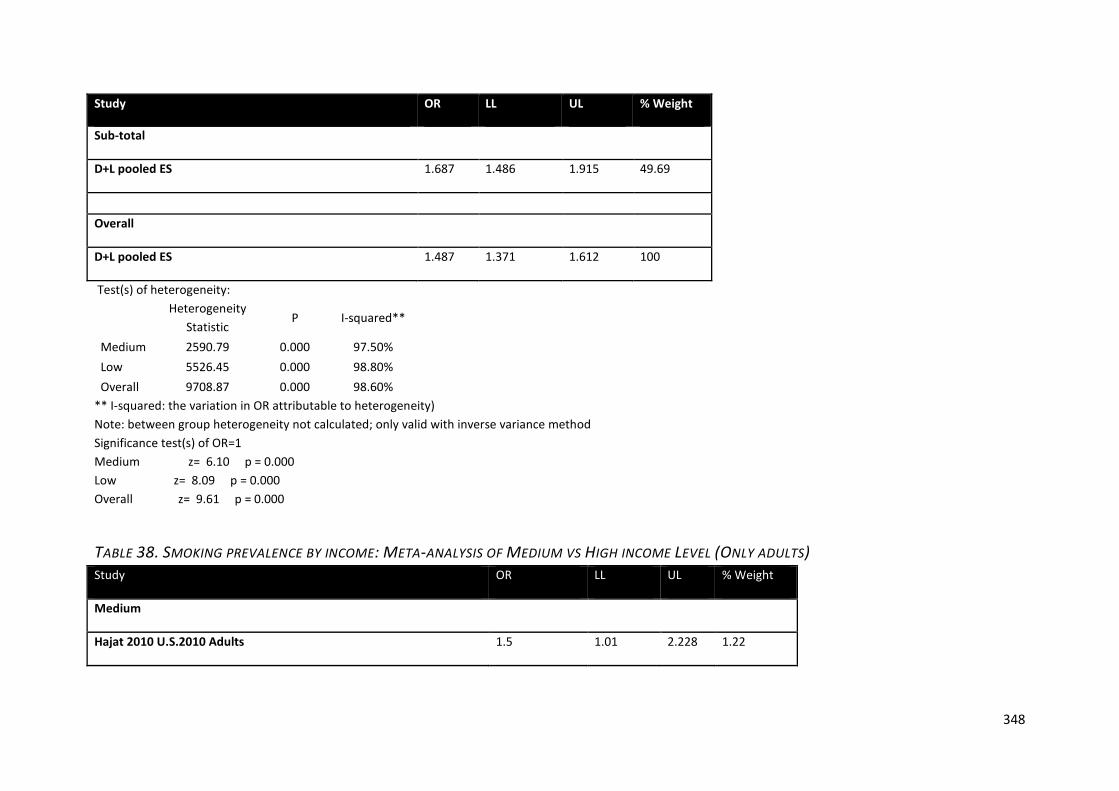
348
Study OR LL UL % Weight
Sub-total
D+L pooled ES 1.687 1.486 1.915 49.69
Overall
D+L pooled ES 1.487 1.371 1.612 100
Test(s) of heterogeneity:
Heterogeneity Statistic
P I-squared**
Medium 2590.79 0.000 97.50% Low 5526.45 0.000 98.80% Overall 9708.87 0.000 98.60%
** I-squared: the variation in OR attributable to heterogeneity) Note: between group heterogeneity not calculated; only valid with inverse variance method Significance test(s) of OR=1 Medium z= 6.10 p = 0.000 Low z= 8.09 p = 0.000 Overall z= 9.61 p = 0.000
TABLE 38. SMOKING PREVALENCE BY INCOME: META-ANALYSIS OF MEDIUM VS HIGH INCOME LEVEL (ONLY ADULTS) Study OR LL UL % Weight
Medium
Hajat 2010 U.S.2010 Adults 1.5 1.01 2.228 1.22
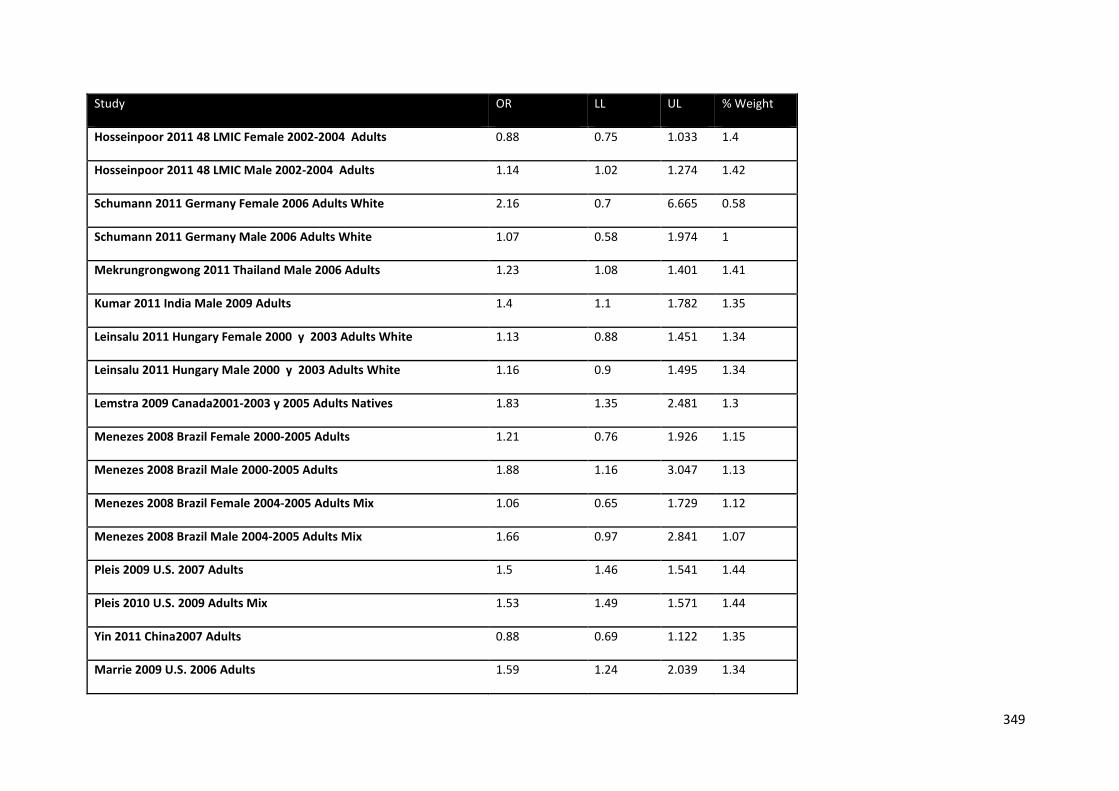
349
Study OR LL UL % Weight
Hosseinpoor 2011 48 LMIC Female 2002-2004 Adults 0.88 0.75 1.033 1.4
Hosseinpoor 2011 48 LMIC Male 2002-2004 Adults 1.14 1.02 1.274 1.42
Schumann 2011 Germany Female 2006 Adults White 2.16 0.7 6.665 0.58
Schumann 2011 Germany Male 2006 Adults White 1.07 0.58 1.974 1
Mekrungrongwong 2011 Thailand Male 2006 Adults 1.23 1.08 1.401 1.41
Kumar 2011 India Male 2009 Adults 1.4 1.1 1.782 1.35
Leinsalu 2011 Hungary Female 2000 y 2003 Adults White 1.13 0.88 1.451 1.34
Leinsalu 2011 Hungary Male 2000 y 2003 Adults White 1.16 0.9 1.495 1.34
Lemstra 2009 Canada2001-2003 y 2005 Adults Natives 1.83 1.35 2.481 1.3
Menezes 2008 Brazil Female 2000-2005 Adults 1.21 0.76 1.926 1.15
Menezes 2008 Brazil Male 2000-2005 Adults 1.88 1.16 3.047 1.13
Menezes 2008 Brazil Female 2004-2005 Adults Mix 1.06 0.65 1.729 1.12
Menezes 2008 Brazil Male 2004-2005 Adults Mix 1.66 0.97 2.841 1.07
Pleis 2009 U.S. 2007 Adults 1.5 1.46 1.541 1.44
Pleis 2010 U.S. 2009 Adults Mix 1.53 1.49 1.571 1.44
Yin 2011 China2007 Adults 0.88 0.69 1.122 1.35
Marrie 2009 U.S. 2006 Adults 1.59 1.24 2.039 1.34
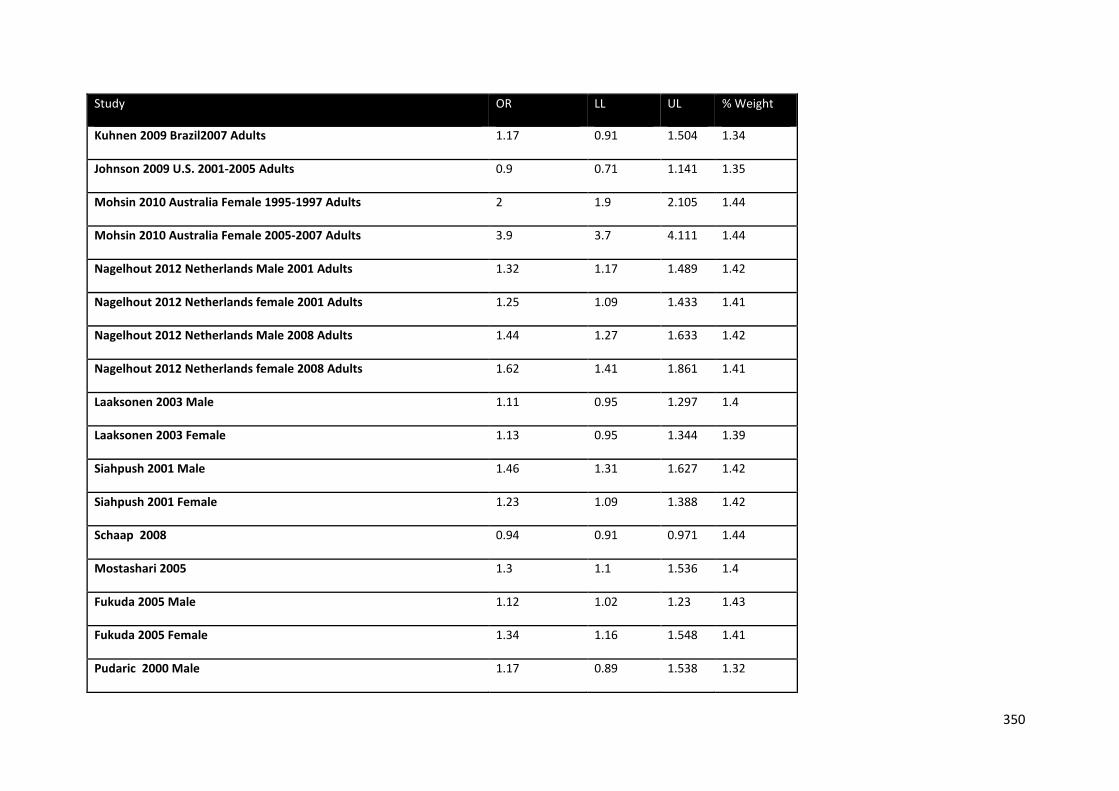
350
Study OR LL UL % Weight
Kuhnen 2009 Brazil2007 Adults 1.17 0.91 1.504 1.34
Johnson 2009 U.S. 2001-2005 Adults 0.9 0.71 1.141 1.35
Mohsin 2010 Australia Female 1995-1997 Adults 2 1.9 2.105 1.44
Mohsin 2010 Australia Female 2005-2007 Adults 3.9 3.7 4.111 1.44
Nagelhout 2012 Netherlands Male 2001 Adults 1.32 1.17 1.489 1.42
Nagelhout 2012 Netherlands female 2001 Adults 1.25 1.09 1.433 1.41
Nagelhout 2012 Netherlands Male 2008 Adults 1.44 1.27 1.633 1.42
Nagelhout 2012 Netherlands female 2008 Adults 1.62 1.41 1.861 1.41
Laaksonen 2003 Male 1.11 0.95 1.297 1.4
Laaksonen 2003 Female 1.13 0.95 1.344 1.39
Siahpush 2001 Male 1.46 1.31 1.627 1.42
Siahpush 2001 Female 1.23 1.09 1.388 1.42
Schaap 2008 0.94 0.91 0.971 1.44
Mostashari 2005 1.3 1.1 1.536 1.4
Fukuda 2005 Male 1.12 1.02 1.23 1.43
Fukuda 2005 Female 1.34 1.16 1.548 1.41
Pudaric 2000 Male 1.17 0.89 1.538 1.32
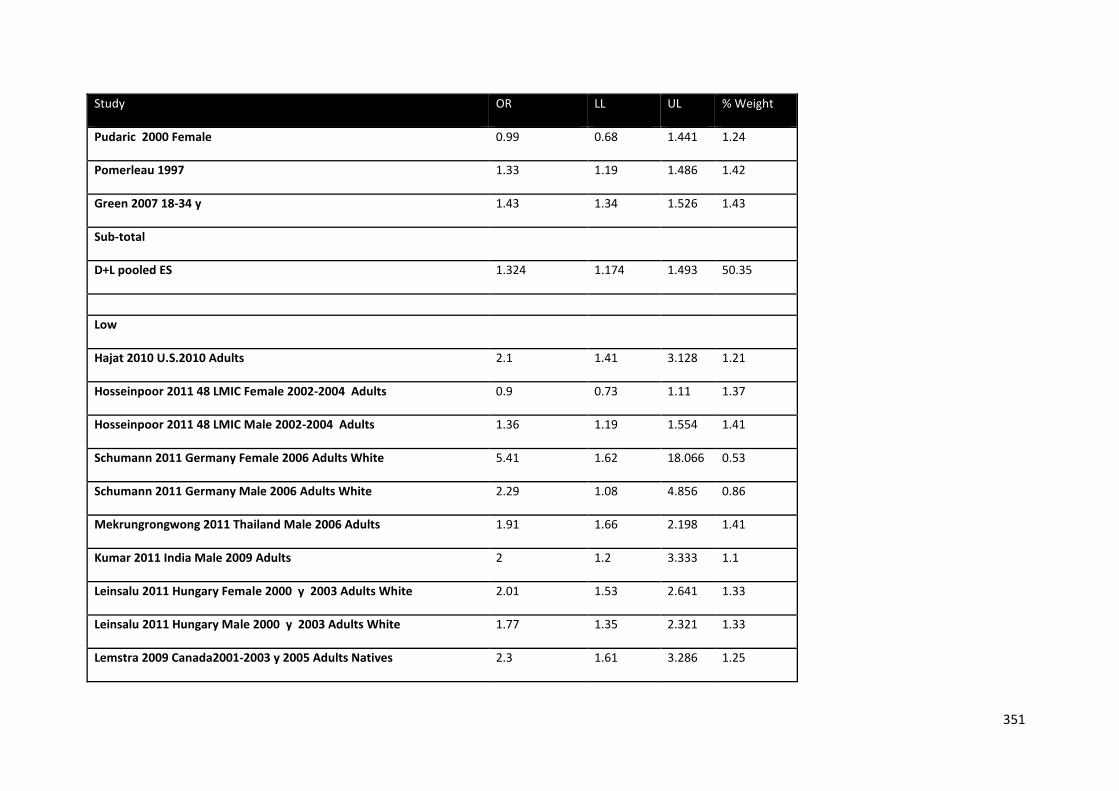
351
Study OR LL UL % Weight
Pudaric 2000 Female 0.99 0.68 1.441 1.24
Pomerleau 1997 1.33 1.19 1.486 1.42
Green 2007 18-34 y 1.43 1.34 1.526 1.43
Sub-total
D+L pooled ES 1.324 1.174 1.493 50.35
Low
Hajat 2010 U.S.2010 Adults 2.1 1.41 3.128 1.21
Hosseinpoor 2011 48 LMIC Female 2002-2004 Adults 0.9 0.73 1.11 1.37
Hosseinpoor 2011 48 LMIC Male 2002-2004 Adults 1.36 1.19 1.554 1.41
Schumann 2011 Germany Female 2006 Adults White 5.41 1.62 18.066 0.53
Schumann 2011 Germany Male 2006 Adults White 2.29 1.08 4.856 0.86
Mekrungrongwong 2011 Thailand Male 2006 Adults 1.91 1.66 2.198 1.41
Kumar 2011 India Male 2009 Adults 2 1.2 3.333 1.1
Leinsalu 2011 Hungary Female 2000 y 2003 Adults White 2.01 1.53 2.641 1.33
Leinsalu 2011 Hungary Male 2000 y 2003 Adults White 1.77 1.35 2.321 1.33
Lemstra 2009 Canada2001-2003 y 2005 Adults Natives 2.3 1.61 3.286 1.25
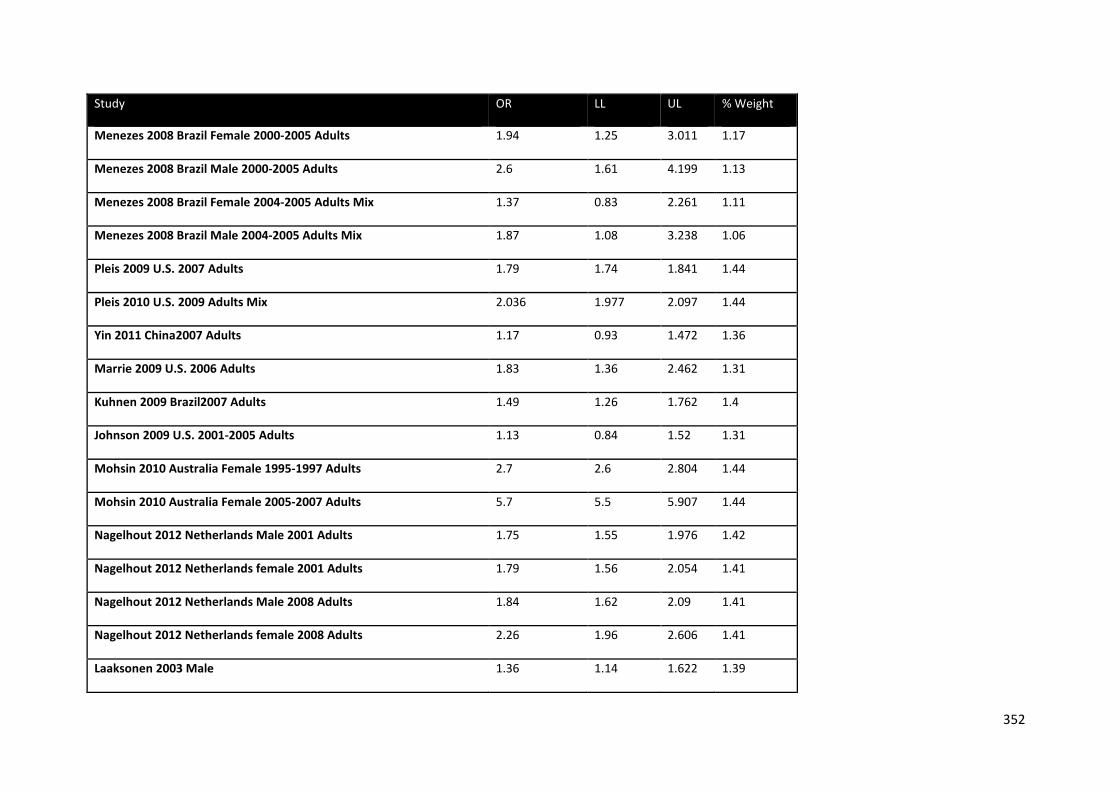
352
Study OR LL UL % Weight
Menezes 2008 Brazil Female 2000-2005 Adults 1.94 1.25 3.011 1.17
Menezes 2008 Brazil Male 2000-2005 Adults 2.6 1.61 4.199 1.13
Menezes 2008 Brazil Female 2004-2005 Adults Mix 1.37 0.83 2.261 1.11
Menezes 2008 Brazil Male 2004-2005 Adults Mix 1.87 1.08 3.238 1.06
Pleis 2009 U.S. 2007 Adults 1.79 1.74 1.841 1.44
Pleis 2010 U.S. 2009 Adults Mix 2.036 1.977 2.097 1.44
Yin 2011 China2007 Adults 1.17 0.93 1.472 1.36
Marrie 2009 U.S. 2006 Adults 1.83 1.36 2.462 1.31
Kuhnen 2009 Brazil2007 Adults 1.49 1.26 1.762 1.4
Johnson 2009 U.S. 2001-2005 Adults 1.13 0.84 1.52 1.31
Mohsin 2010 Australia Female 1995-1997 Adults 2.7 2.6 2.804 1.44
Mohsin 2010 Australia Female 2005-2007 Adults 5.7 5.5 5.907 1.44
Nagelhout 2012 Netherlands Male 2001 Adults 1.75 1.55 1.976 1.42
Nagelhout 2012 Netherlands female 2001 Adults 1.79 1.56 2.054 1.41
Nagelhout 2012 Netherlands Male 2008 Adults 1.84 1.62 2.09 1.41
Nagelhout 2012 Netherlands female 2008 Adults 2.26 1.96 2.606 1.41
Laaksonen 2003 Male 1.36 1.14 1.622 1.39

353
Study OR LL UL % Weight
Laaksonen 2003 Female 1.3 1.07 1.579 1.38
Siahpush 2001 Male 1.53 1.37 1.709 1.42
Siahpush 2001 Female 1.43 1.26 1.623 1.42
Schaap 2008 0.95 0.91 0.992 1.44
Mostashari 2005 1.3 1.1 1.536 1.4
Fukuda 2005 Male 1.29 1.17 1.422 1.43
Fukuda 2005 Female 2.03 1.76 2.341 1.41
Pudaric 2000 Male 1.5 1.02 2.206 1.23
Pudaric 2000 Female 1.02 0.72 1.445 1.26
Pomerleau 1997 1.84 1.57 2.156 1.4
Green 2007 18-34 y 1.77 1.64 1.91 1.43
Sub-total
D+L pooled ES 1.725 1.449 2.053 49.65
Overall
D+L pooled ES 1.508 1.351 1.684 100
Test(s) of heterogeneity:
Heterogeneity P I-squared**
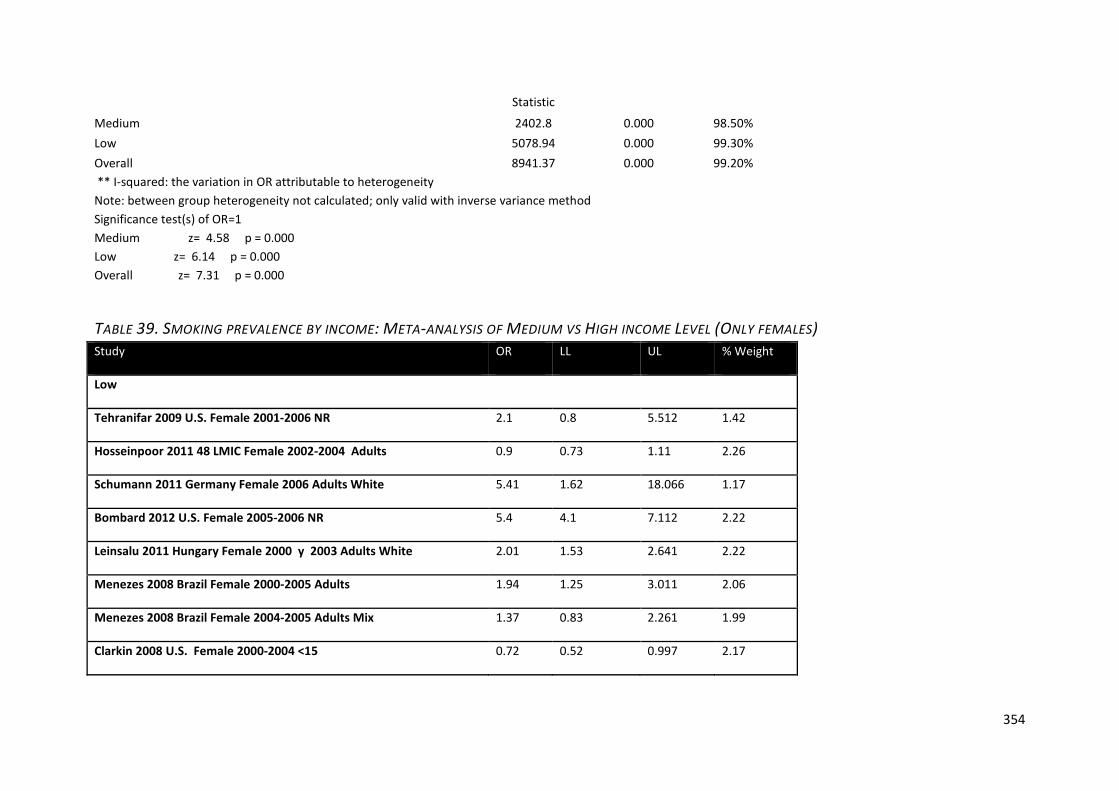
354
Statistic
Medium 2402.8 0.000 98.50% Low 5078.94 0.000 99.30% Overall 8941.37 0.000 99.20% ** I-squared: the variation in OR attributable to heterogeneity Note: between group heterogeneity not calculated; only valid with inverse variance method Significance test(s) of OR=1 Medium z= 4.58 p = 0.000 Low z= 6.14 p = 0.000 Overall z= 7.31 p = 0.000
TABLE 39. SMOKING PREVALENCE BY INCOME: META-ANALYSIS OF MEDIUM VS HIGH INCOME LEVEL (ONLY FEMALES) Study OR LL UL % Weight
Low
Tehranifar 2009 U.S. Female 2001-2006 NR 2.1 0.8 5.512 1.42
Hosseinpoor 2011 48 LMIC Female 2002-2004 Adults 0.9 0.73 1.11 2.26
Schumann 2011 Germany Female 2006 Adults White 5.41 1.62 18.066 1.17
Bombard 2012 U.S. Female 2005-2006 NR 5.4 4.1 7.112 2.22
Leinsalu 2011 Hungary Female 2000 y 2003 Adults White 2.01 1.53 2.641 2.22
Menezes 2008 Brazil Female 2000-2005 Adults 1.94 1.25 3.011 2.06
Menezes 2008 Brazil Female 2004-2005 Adults Mix 1.37 0.83 2.261 1.99
Clarkin 2008 U.S. Female 2000-2004 <15 0.72 0.52 0.997 2.17
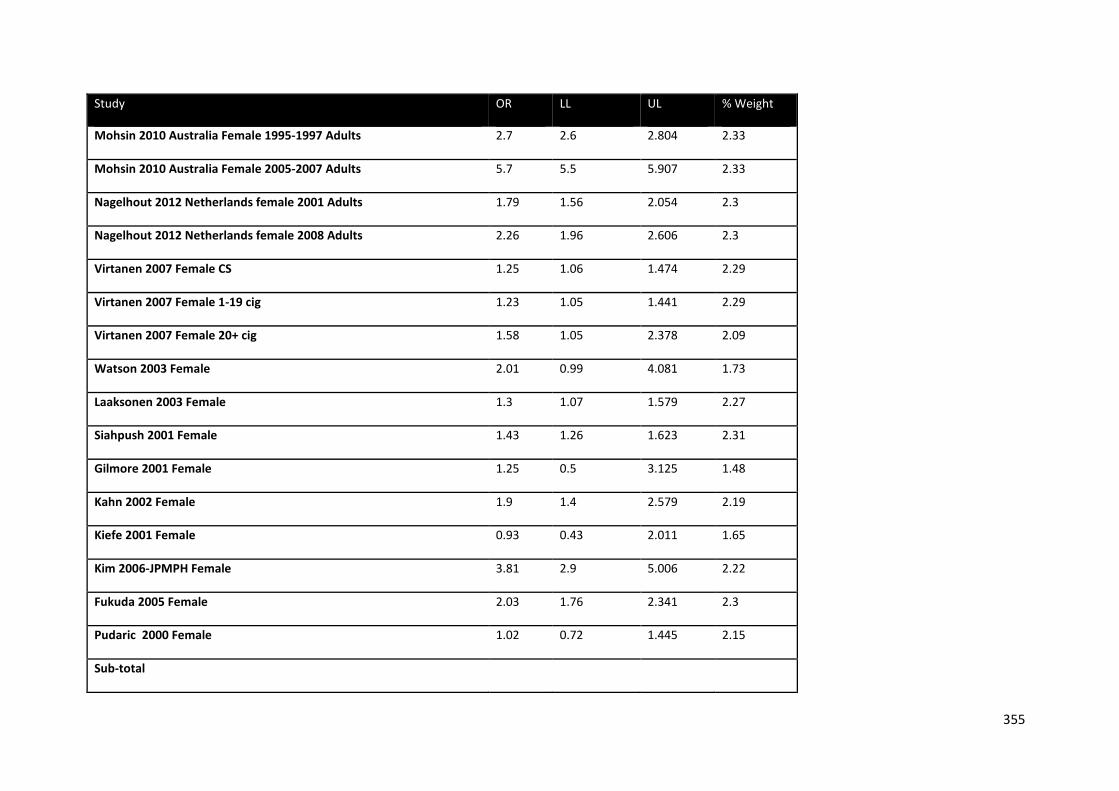
355
Study OR LL UL % Weight
Mohsin 2010 Australia Female 1995-1997 Adults 2.7 2.6 2.804 2.33
Mohsin 2010 Australia Female 2005-2007 Adults 5.7 5.5 5.907 2.33
Nagelhout 2012 Netherlands female 2001 Adults 1.79 1.56 2.054 2.3
Nagelhout 2012 Netherlands female 2008 Adults 2.26 1.96 2.606 2.3
Virtanen 2007 Female CS 1.25 1.06 1.474 2.29
Virtanen 2007 Female 1-19 cig 1.23 1.05 1.441 2.29
Virtanen 2007 Female 20+ cig 1.58 1.05 2.378 2.09
Watson 2003 Female 2.01 0.99 4.081 1.73
Laaksonen 2003 Female 1.3 1.07 1.579 2.27
Siahpush 2001 Female 1.43 1.26 1.623 2.31
Gilmore 2001 Female 1.25 0.5 3.125 1.48
Kahn 2002 Female 1.9 1.4 2.579 2.19
Kiefe 2001 Female 0.93 0.43 2.011 1.65
Kim 2006-JPMPH Female 3.81 2.9 5.006 2.22
Fukuda 2005 Female 2.03 1.76 2.341 2.3
Pudaric 2000 Female 1.02 0.72 1.445 2.15
Sub-total
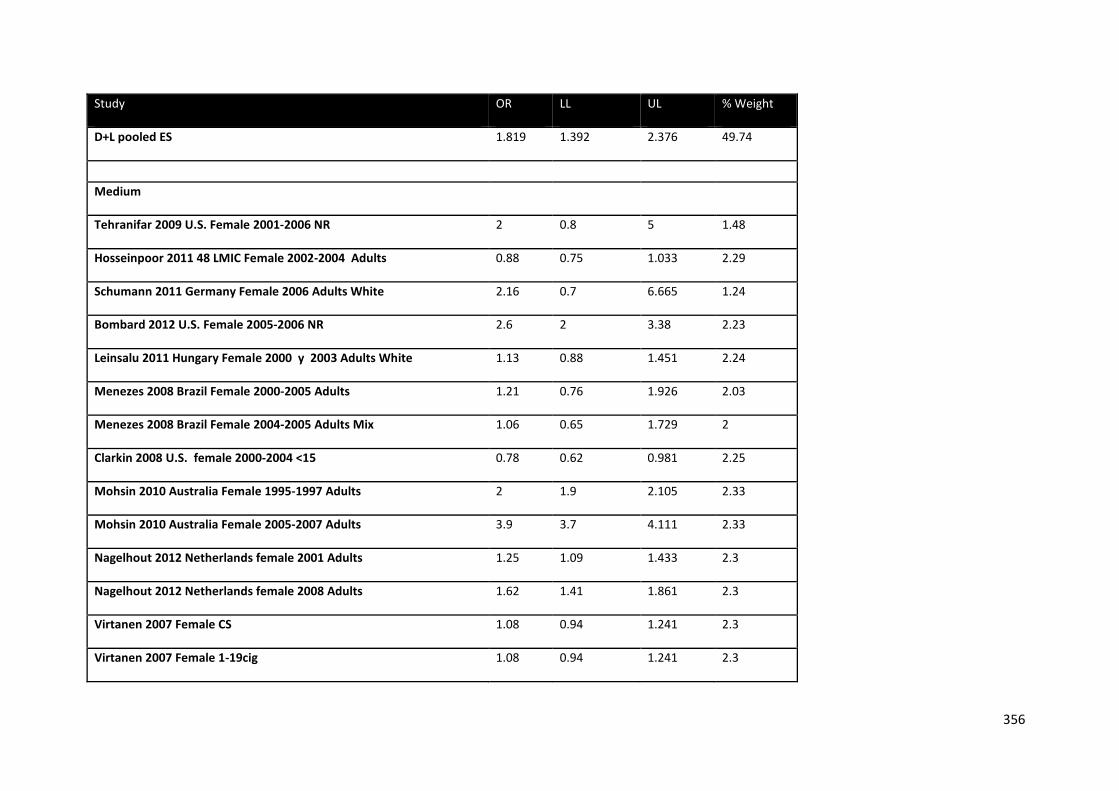
356
Study OR LL UL % Weight
D+L pooled ES 1.819 1.392 2.376 49.74
Medium
Tehranifar 2009 U.S. Female 2001-2006 NR 2 0.8 5 1.48
Hosseinpoor 2011 48 LMIC Female 2002-2004 Adults 0.88 0.75 1.033 2.29
Schumann 2011 Germany Female 2006 Adults White 2.16 0.7 6.665 1.24
Bombard 2012 U.S. Female 2005-2006 NR 2.6 2 3.38 2.23
Leinsalu 2011 Hungary Female 2000 y 2003 Adults White 1.13 0.88 1.451 2.24
Menezes 2008 Brazil Female 2000-2005 Adults 1.21 0.76 1.926 2.03
Menezes 2008 Brazil Female 2004-2005 Adults Mix 1.06 0.65 1.729 2
Clarkin 2008 U.S. female 2000-2004 <15 0.78 0.62 0.981 2.25
Mohsin 2010 Australia Female 1995-1997 Adults 2 1.9 2.105 2.33
Mohsin 2010 Australia Female 2005-2007 Adults 3.9 3.7 4.111 2.33
Nagelhout 2012 Netherlands female 2001 Adults 1.25 1.09 1.433 2.3
Nagelhout 2012 Netherlands female 2008 Adults 1.62 1.41 1.861 2.3
Virtanen 2007 Female CS 1.08 0.94 1.241 2.3
Virtanen 2007 Female 1-19cig 1.08 0.94 1.241 2.3
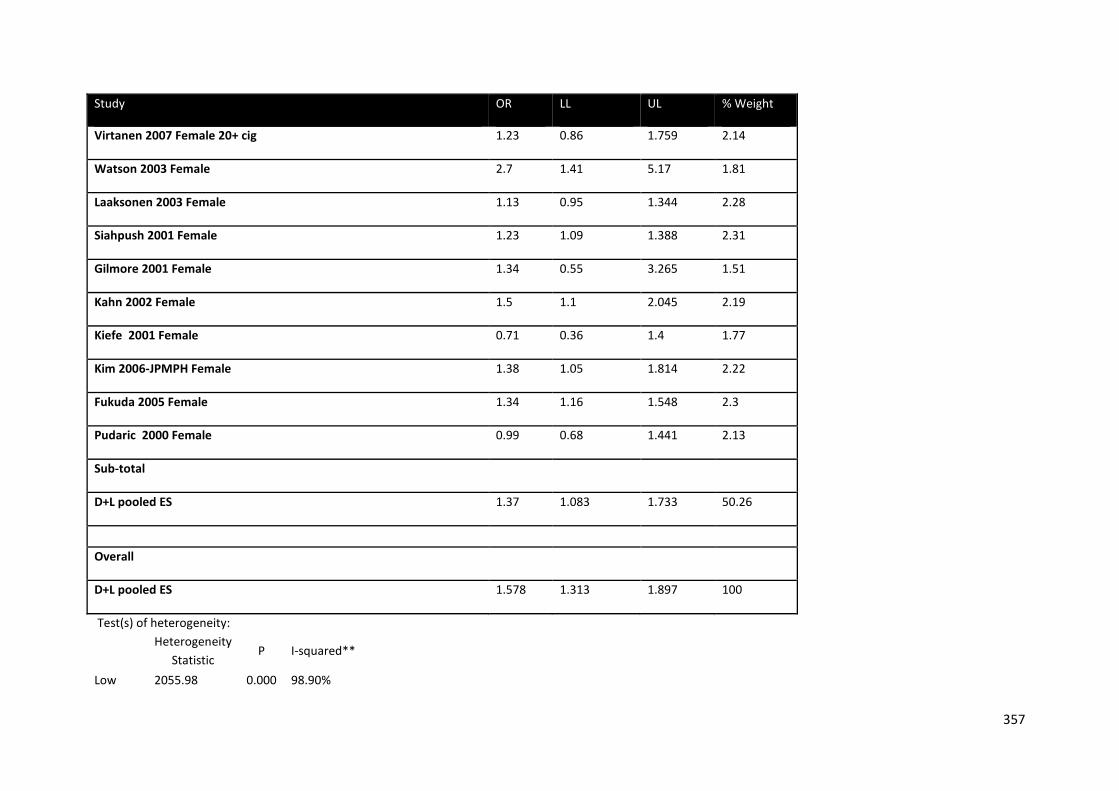
357
Study OR LL UL % Weight
Virtanen 2007 Female 20+ cig 1.23 0.86 1.759 2.14
Watson 2003 Female 2.7 1.41 5.17 1.81
Laaksonen 2003 Female 1.13 0.95 1.344 2.28
Siahpush 2001 Female 1.23 1.09 1.388 2.31
Gilmore 2001 Female 1.34 0.55 3.265 1.51
Kahn 2002 Female 1.5 1.1 2.045 2.19
Kiefe 2001 Female 0.71 0.36 1.4 1.77
Kim 2006-JPMPH Female 1.38 1.05 1.814 2.22
Fukuda 2005 Female 1.34 1.16 1.548 2.3
Pudaric 2000 Female 0.99 0.68 1.441 2.13
Sub-total
D+L pooled ES 1.37 1.083 1.733 50.26
Overall
D+L pooled ES 1.578 1.313 1.897 100
Test(s) of heterogeneity:
Heterogeneity Statistic
P I-squared**
Low 2055.98 0.000 98.90%
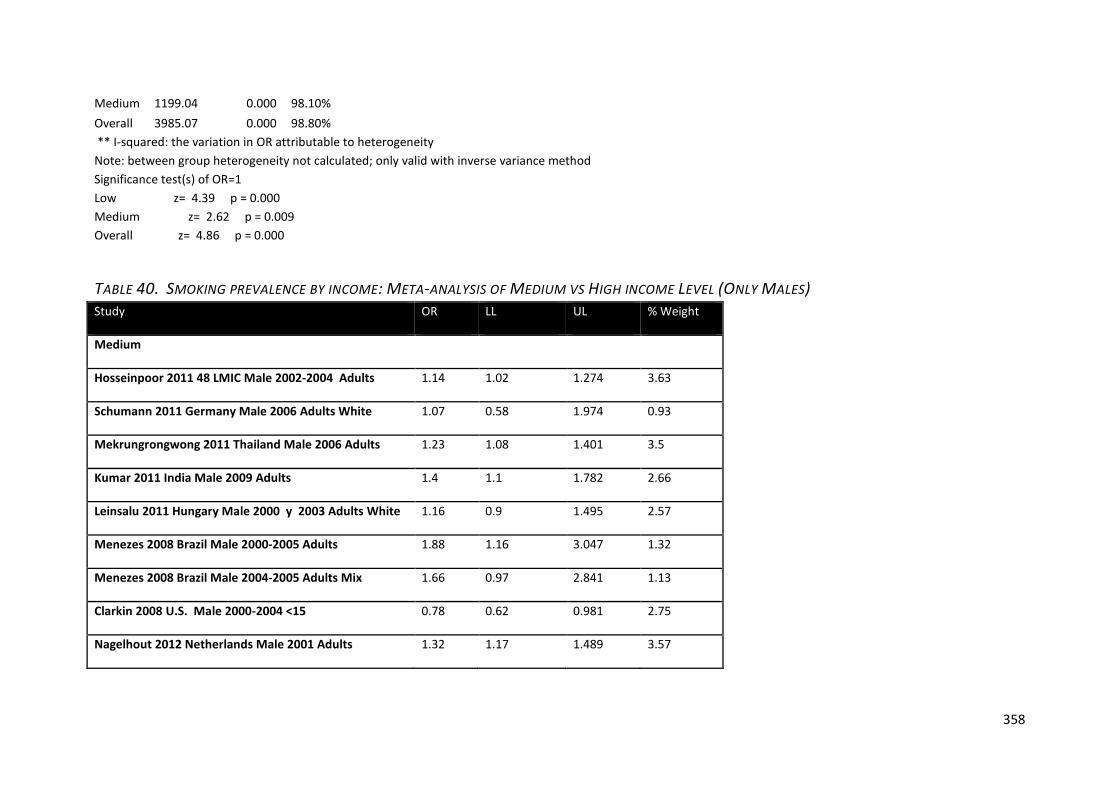
358
Medium 1199.04 0.000 98.10% Overall 3985.07 0.000 98.80% ** I-squared: the variation in OR attributable to heterogeneity Note: between group heterogeneity not calculated; only valid with inverse variance method Significance test(s) of OR=1 Low z= 4.39 p = 0.000 Medium z= 2.62 p = 0.009 Overall z= 4.86 p = 0.000
TABLE 40. SMOKING PREVALENCE BY INCOME: META-ANALYSIS OF MEDIUM VS HIGH INCOME LEVEL (ONLY MALES) Study OR LL UL % Weight
Medium
Hosseinpoor 2011 48 LMIC Male 2002-2004 Adults 1.14 1.02 1.274 3.63
Schumann 2011 Germany Male 2006 Adults White 1.07 0.58 1.974 0.93
Mekrungrongwong 2011 Thailand Male 2006 Adults 1.23 1.08 1.401 3.5
Kumar 2011 India Male 2009 Adults 1.4 1.1 1.782 2.66
Leinsalu 2011 Hungary Male 2000 y 2003 Adults White 1.16 0.9 1.495 2.57
Menezes 2008 Brazil Male 2000-2005 Adults 1.88 1.16 3.047 1.32
Menezes 2008 Brazil Male 2004-2005 Adults Mix 1.66 0.97 2.841 1.13
Clarkin 2008 U.S. Male 2000-2004 <15 0.78 0.62 0.981 2.75
Nagelhout 2012 Netherlands Male 2001 Adults 1.32 1.17 1.489 3.57
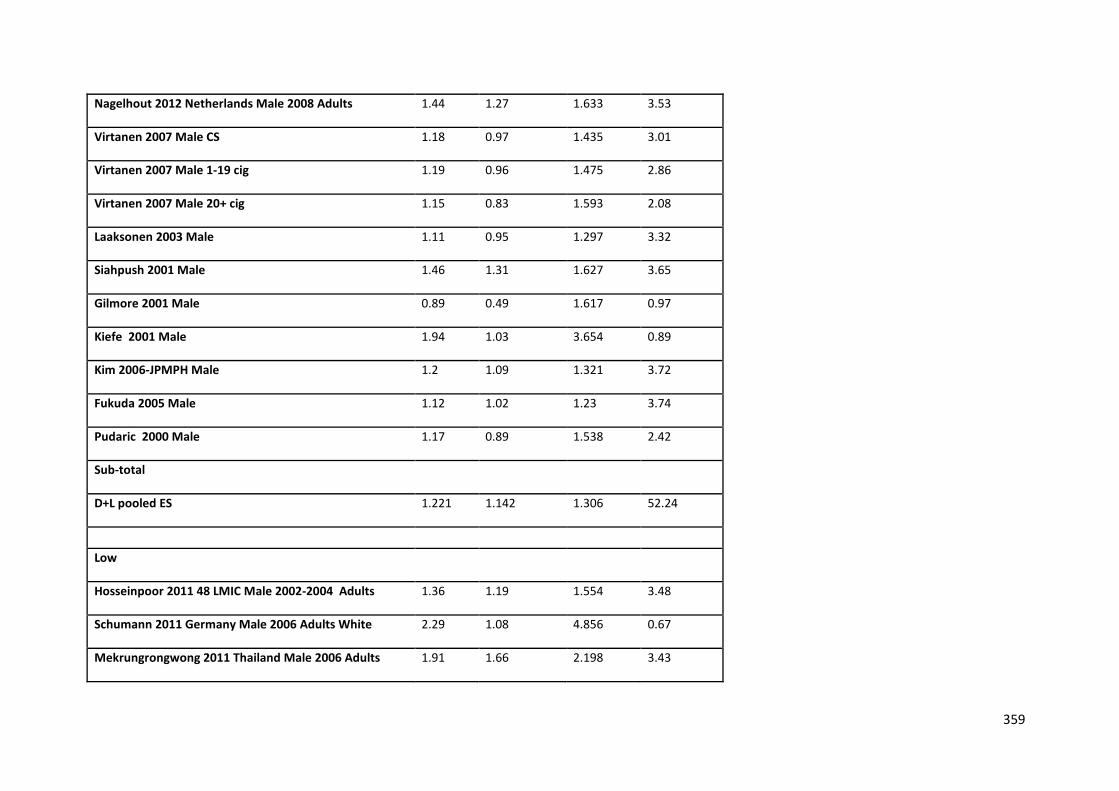
359
Nagelhout 2012 Netherlands Male 2008 Adults 1.44 1.27 1.633 3.53
Virtanen 2007 Male CS 1.18 0.97 1.435 3.01
Virtanen 2007 Male 1-19 cig 1.19 0.96 1.475 2.86
Virtanen 2007 Male 20+ cig 1.15 0.83 1.593 2.08
Laaksonen 2003 Male 1.11 0.95 1.297 3.32
Siahpush 2001 Male 1.46 1.31 1.627 3.65
Gilmore 2001 Male 0.89 0.49 1.617 0.97
Kiefe 2001 Male 1.94 1.03 3.654 0.89
Kim 2006-JPMPH Male 1.2 1.09 1.321 3.72
Fukuda 2005 Male 1.12 1.02 1.23 3.74
Pudaric 2000 Male 1.17 0.89 1.538 2.42
Sub-total
D+L pooled ES 1.221 1.142 1.306 52.24
Low
Hosseinpoor 2011 48 LMIC Male 2002-2004 Adults 1.36 1.19 1.554 3.48
Schumann 2011 Germany Male 2006 Adults White 2.29 1.08 4.856 0.67
Mekrungrongwong 2011 Thailand Male 2006 Adults 1.91 1.66 2.198 3.43
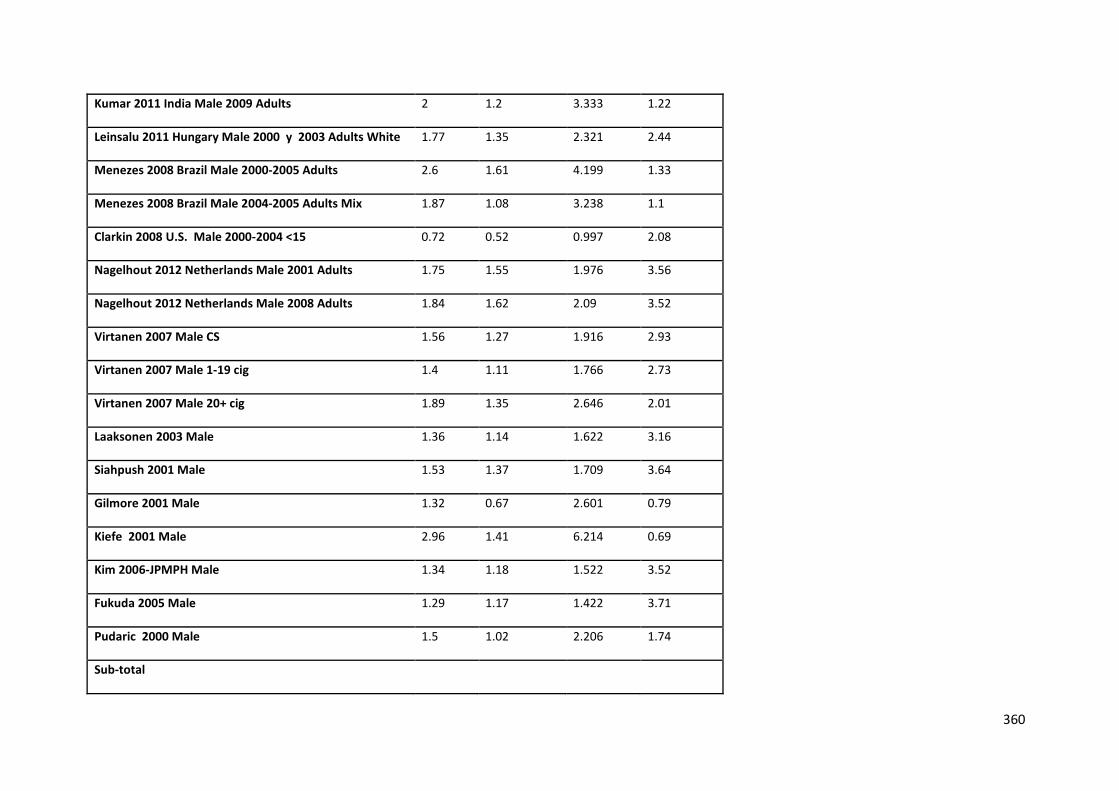
360
Kumar 2011 India Male 2009 Adults 2 1.2 3.333 1.22
Leinsalu 2011 Hungary Male 2000 y 2003 Adults White 1.77 1.35 2.321 2.44
Menezes 2008 Brazil Male 2000-2005 Adults 2.6 1.61 4.199 1.33
Menezes 2008 Brazil Male 2004-2005 Adults Mix 1.87 1.08 3.238 1.1
Clarkin 2008 U.S. Male 2000-2004 <15 0.72 0.52 0.997 2.08
Nagelhout 2012 Netherlands Male 2001 Adults 1.75 1.55 1.976 3.56
Nagelhout 2012 Netherlands Male 2008 Adults 1.84 1.62 2.09 3.52
Virtanen 2007 Male CS 1.56 1.27 1.916 2.93
Virtanen 2007 Male 1-19 cig 1.4 1.11 1.766 2.73
Virtanen 2007 Male 20+ cig 1.89 1.35 2.646 2.01
Laaksonen 2003 Male 1.36 1.14 1.622 3.16
Siahpush 2001 Male 1.53 1.37 1.709 3.64
Gilmore 2001 Male 1.32 0.67 2.601 0.79
Kiefe 2001 Male 2.96 1.41 6.214 0.69
Kim 2006-JPMPH Male 1.34 1.18 1.522 3.52
Fukuda 2005 Male 1.29 1.17 1.422 3.71
Pudaric 2000 Male 1.5 1.02 2.206 1.74
Sub-total
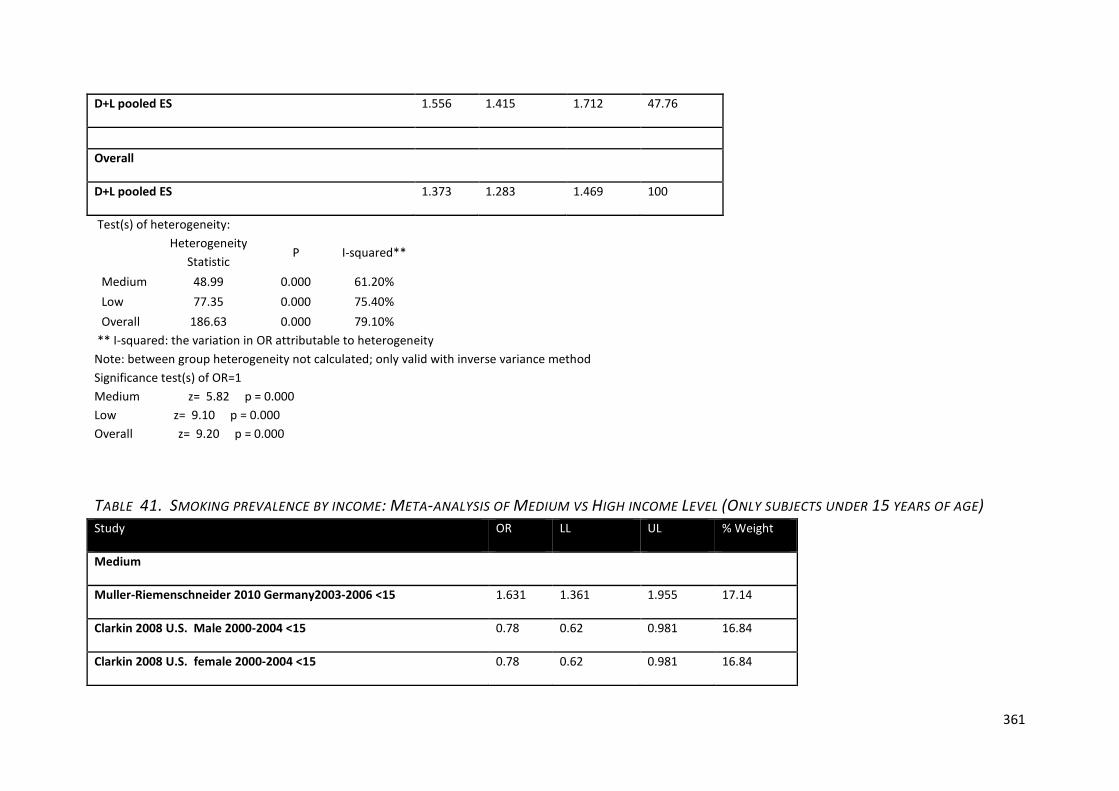
361
D+L pooled ES 1.556 1.415 1.712 47.76
Overall
D+L pooled ES 1.373 1.283 1.469 100
Test(s) of heterogeneity:
Heterogeneity Statistic
P I-squared**
Medium 48.99 0.000 61.20% Low 77.35 0.000 75.40% Overall 186.63 0.000 79.10%
** I-squared: the variation in OR attributable to heterogeneity Note: between group heterogeneity not calculated; only valid with inverse variance method Significance test(s) of OR=1 Medium z= 5.82 p = 0.000 Low z= 9.10 p = 0.000 Overall z= 9.20 p = 0.000
TABLE 41. SMOKING PREVALENCE BY INCOME: META-ANALYSIS OF MEDIUM VS HIGH INCOME LEVEL (ONLY SUBJECTS UNDER 15 YEARS OF AGE) Study OR LL UL % Weight
Medium
Muller-Riemenschneider 2010 Germany2003-2006 <15 1.631 1.361 1.955 17.14
Clarkin 2008 U.S. Male 2000-2004 <15 0.78 0.62 0.981 16.84
Clarkin 2008 U.S. female 2000-2004 <15 0.78 0.62 0.981 16.84
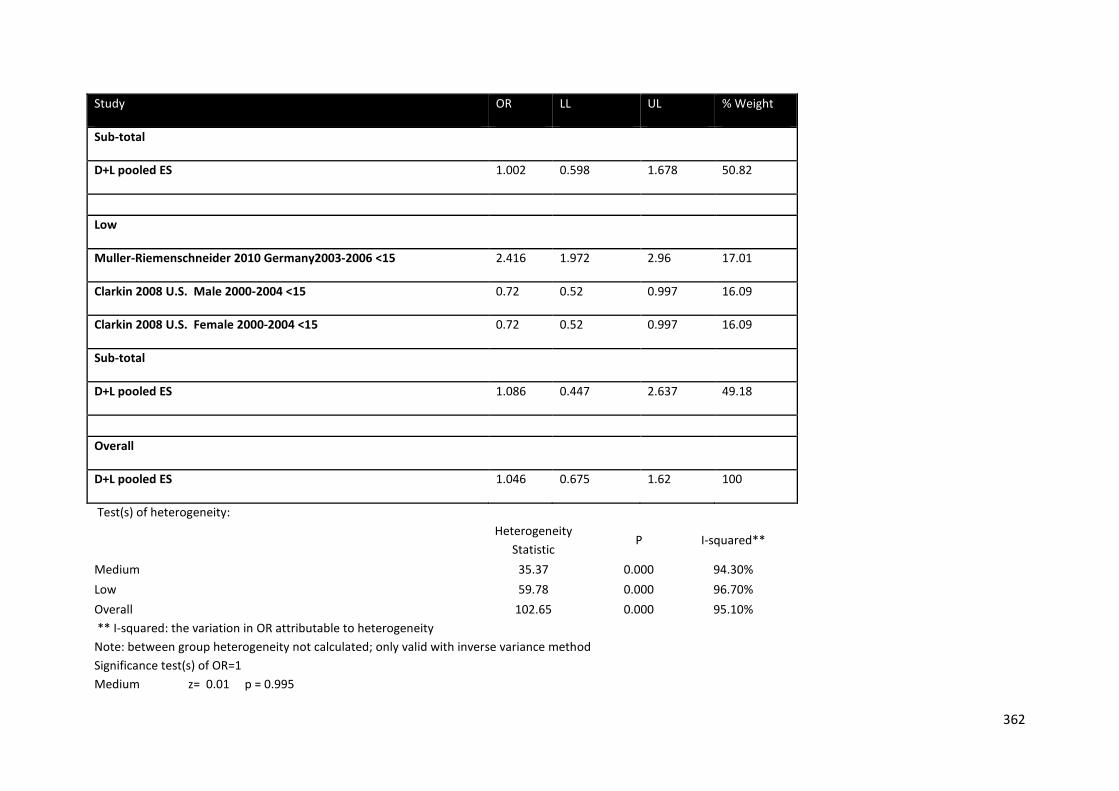
362
Study OR LL UL % Weight
Sub-total
D+L pooled ES 1.002 0.598 1.678 50.82
Low
Muller-Riemenschneider 2010 Germany2003-2006 <15 2.416 1.972 2.96 17.01
Clarkin 2008 U.S. Male 2000-2004 <15 0.72 0.52 0.997 16.09
Clarkin 2008 U.S. Female 2000-2004 <15 0.72 0.52 0.997 16.09
Sub-total
D+L pooled ES 1.086 0.447 2.637 49.18
Overall
D+L pooled ES 1.046 0.675 1.62 100
Test(s) of heterogeneity:
Heterogeneity Statistic
P I-squared**
Medium 35.37 0.000 94.30% Low 59.78 0.000 96.70% Overall 102.65 0.000 95.10% ** I-squared: the variation in OR attributable to heterogeneity Note: between group heterogeneity not calculated; only valid with inverse variance method Significance test(s) of OR=1 Medium z= 0.01 p = 0.995
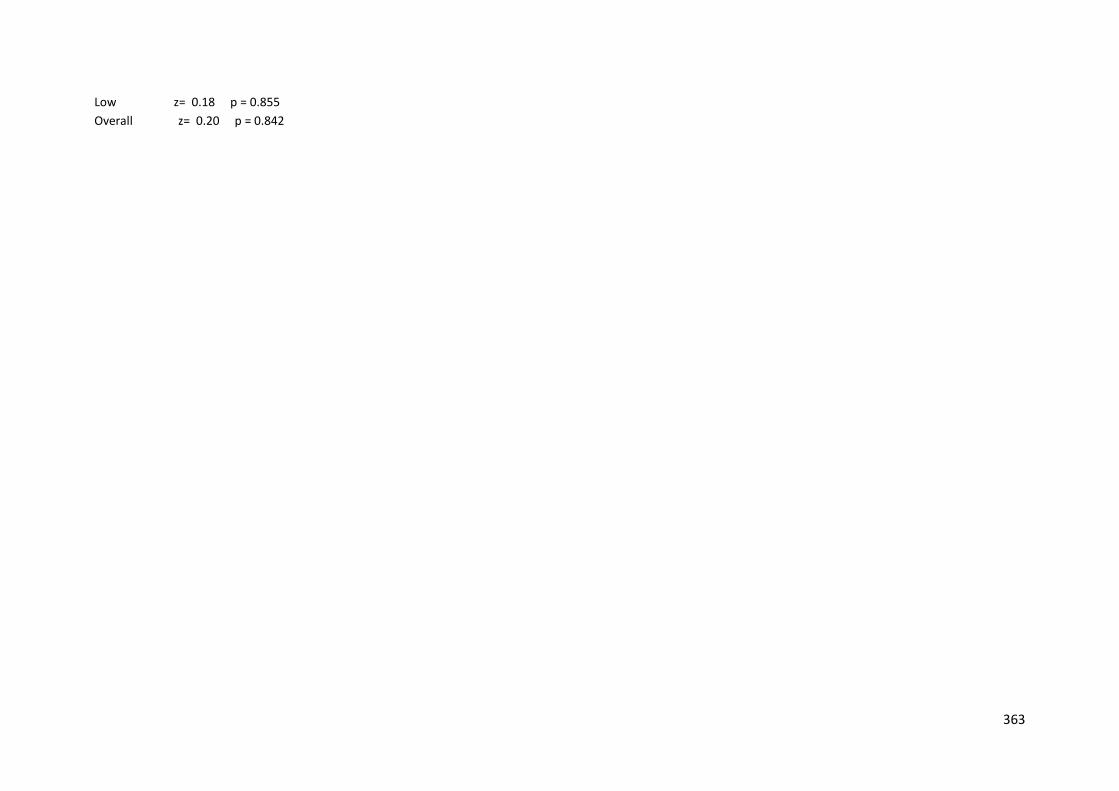
363
Low z= 0.18 p = 0.855 Overall z= 0.20 p = 0.842
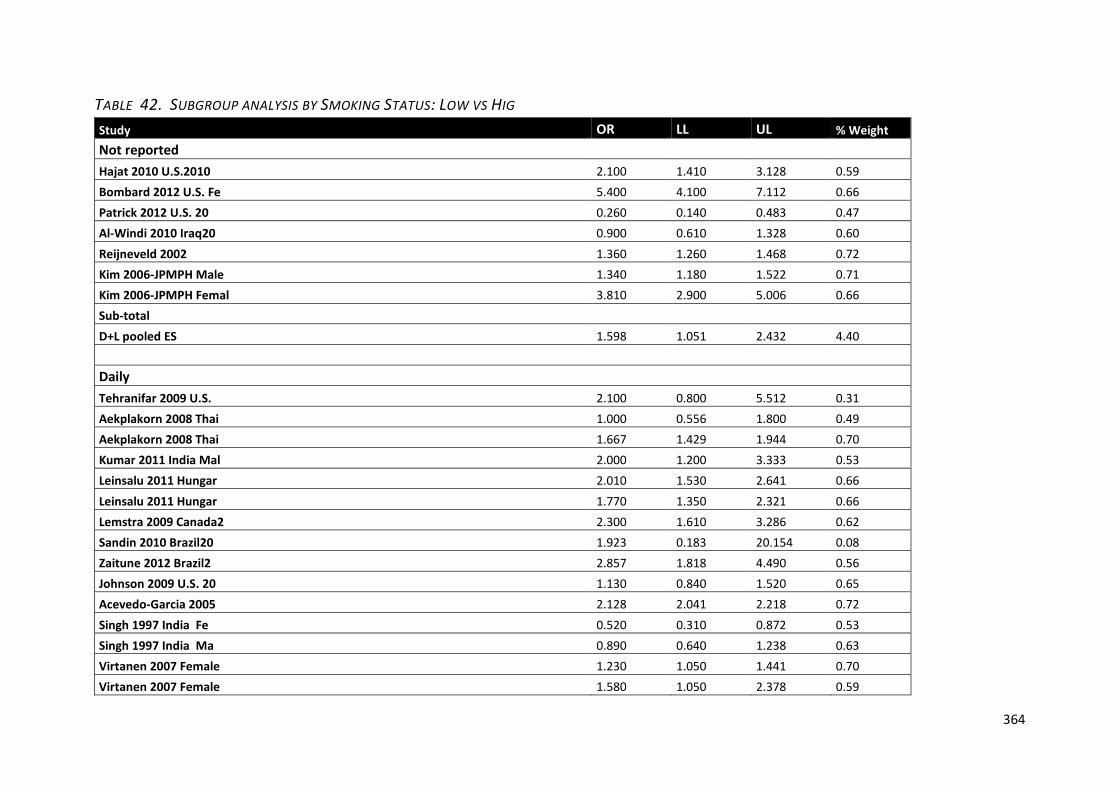
364
TABLE 42. SUBGROUP ANALYSIS BY SMOKING STATUS: LOW VS HIG Study OR LL UL % Weight Not reported
Hajat 2010 U.S.2010 2.100 1.410 3.128 0.59 Bombard 2012 U.S. Fe 5.400 4.100 7.112 0.66 Patrick 2012 U.S. 20 0.260 0.140 0.483 0.47 Al-Windi 2010 Iraq20 0.900 0.610 1.328 0.60 Reijneveld 2002 1.360 1.260 1.468 0.72 Kim 2006-JPMPH Male 1.340 1.180 1.522 0.71 Kim 2006-JPMPH Femal 3.810 2.900 5.006 0.66 Sub-total
D+L pooled ES 1.598 1.051 2.432 4.40
Daily Tehranifar 2009 U.S. 2.100 0.800 5.512 0.31
Aekplakorn 2008 Thai 1.000 0.556 1.800 0.49 Aekplakorn 2008 Thai 1.667 1.429 1.944 0.70 Kumar 2011 India Mal 2.000 1.200 3.333 0.53 Leinsalu 2011 Hungar 2.010 1.530 2.641 0.66 Leinsalu 2011 Hungar 1.770 1.350 2.321 0.66 Lemstra 2009 Canada2 2.300 1.610 3.286 0.62 Sandin 2010 Brazil20 1.923 0.183 20.154 0.08 Zaitune 2012 Brazil2 2.857 1.818 4.490 0.56 Johnson 2009 U.S. 20 1.130 0.840 1.520 0.65 Acevedo-Garcia 2005 2.128 2.041 2.218 0.72 Singh 1997 India Fe 0.520 0.310 0.872 0.53 Singh 1997 India Ma 0.890 0.640 1.238 0.63 Virtanen 2007 Female 1.230 1.050 1.441 0.70 Virtanen 2007 Female 1.580 1.050 2.378 0.59
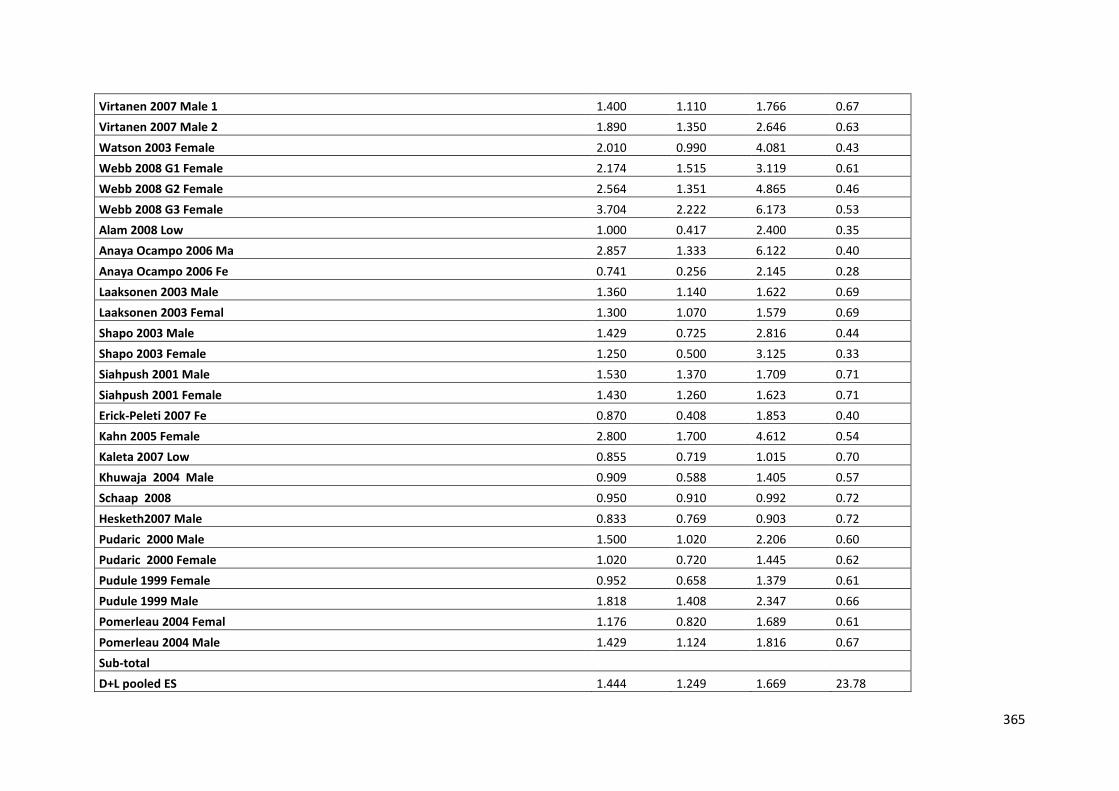
365
Virtanen 2007 Male 1 1.400 1.110 1.766 0.67 Virtanen 2007 Male 2 1.890 1.350 2.646 0.63 Watson 2003 Female 2.010 0.990 4.081 0.43 Webb 2008 G1 Female 2.174 1.515 3.119 0.61 Webb 2008 G2 Female 2.564 1.351 4.865 0.46 Webb 2008 G3 Female 3.704 2.222 6.173 0.53 Alam 2008 Low 1.000 0.417 2.400 0.35 Anaya Ocampo 2006 Ma 2.857 1.333 6.122 0.40 Anaya Ocampo 2006 Fe 0.741 0.256 2.145 0.28 Laaksonen 2003 Male 1.360 1.140 1.622 0.69 Laaksonen 2003 Femal 1.300 1.070 1.579 0.69 Shapo 2003 Male 1.429 0.725 2.816 0.44 Shapo 2003 Female 1.250 0.500 3.125 0.33 Siahpush 2001 Male 1.530 1.370 1.709 0.71 Siahpush 2001 Female 1.430 1.260 1.623 0.71 Erick-Peleti 2007 Fe 0.870 0.408 1.853 0.40 Kahn 2005 Female 2.800 1.700 4.612 0.54 Kaleta 2007 Low 0.855 0.719 1.015 0.70 Khuwaja 2004 Male 0.909 0.588 1.405 0.57 Schaap 2008 0.950 0.910 0.992 0.72 Hesketh2007 Male 0.833 0.769 0.903 0.72 Pudaric 2000 Male 1.500 1.020 2.206 0.60 Pudaric 2000 Female 1.020 0.720 1.445 0.62 Pudule 1999 Female 0.952 0.658 1.379 0.61 Pudule 1999 Male 1.818 1.408 2.347 0.66 Pomerleau 2004 Femal 1.176 0.820 1.689 0.61 Pomerleau 2004 Male 1.429 1.124 1.816 0.67 Sub-total
D+L pooled ES 1.444 1.249 1.669 23.78
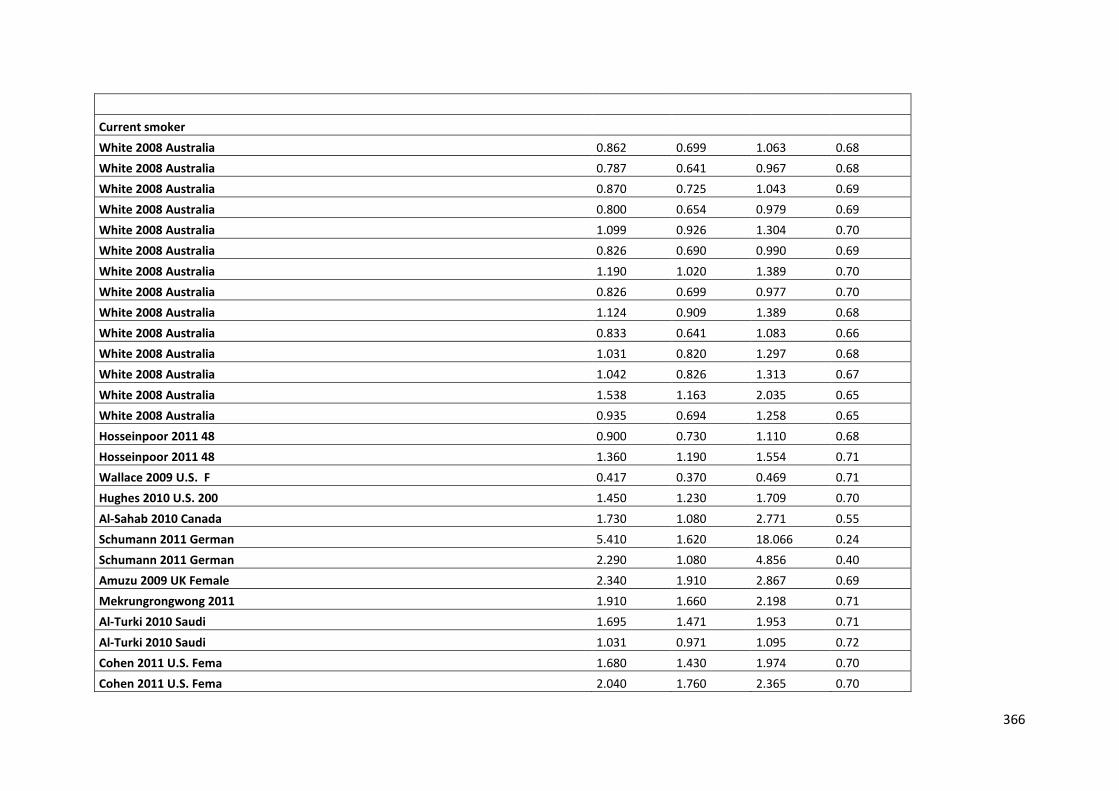
366
Current smoker White 2008 Australia 0.862 0.699 1.063 0.68
White 2008 Australia 0.787 0.641 0.967 0.68 White 2008 Australia 0.870 0.725 1.043 0.69 White 2008 Australia 0.800 0.654 0.979 0.69 White 2008 Australia 1.099 0.926 1.304 0.70 White 2008 Australia 0.826 0.690 0.990 0.69 White 2008 Australia 1.190 1.020 1.389 0.70 White 2008 Australia 0.826 0.699 0.977 0.70 White 2008 Australia 1.124 0.909 1.389 0.68 White 2008 Australia 0.833 0.641 1.083 0.66 White 2008 Australia 1.031 0.820 1.297 0.68 White 2008 Australia 1.042 0.826 1.313 0.67 White 2008 Australia 1.538 1.163 2.035 0.65 White 2008 Australia 0.935 0.694 1.258 0.65 Hosseinpoor 2011 48 0.900 0.730 1.110 0.68 Hosseinpoor 2011 48 1.360 1.190 1.554 0.71 Wallace 2009 U.S. F 0.417 0.370 0.469 0.71 Hughes 2010 U.S. 200 1.450 1.230 1.709 0.70 Al-Sahab 2010 Canada 1.730 1.080 2.771 0.55 Schumann 2011 German 5.410 1.620 18.066 0.24 Schumann 2011 German 2.290 1.080 4.856 0.40 Amuzu 2009 UK Female 2.340 1.910 2.867 0.69 Mekrungrongwong 2011 1.910 1.660 2.198 0.71 Al-Turki 2010 Saudi 1.695 1.471 1.953 0.71 Al-Turki 2010 Saudi 1.031 0.971 1.095 0.72 Cohen 2011 U.S. Fema 1.680 1.430 1.974 0.70 Cohen 2011 U.S. Fema 2.040 1.760 2.365 0.70
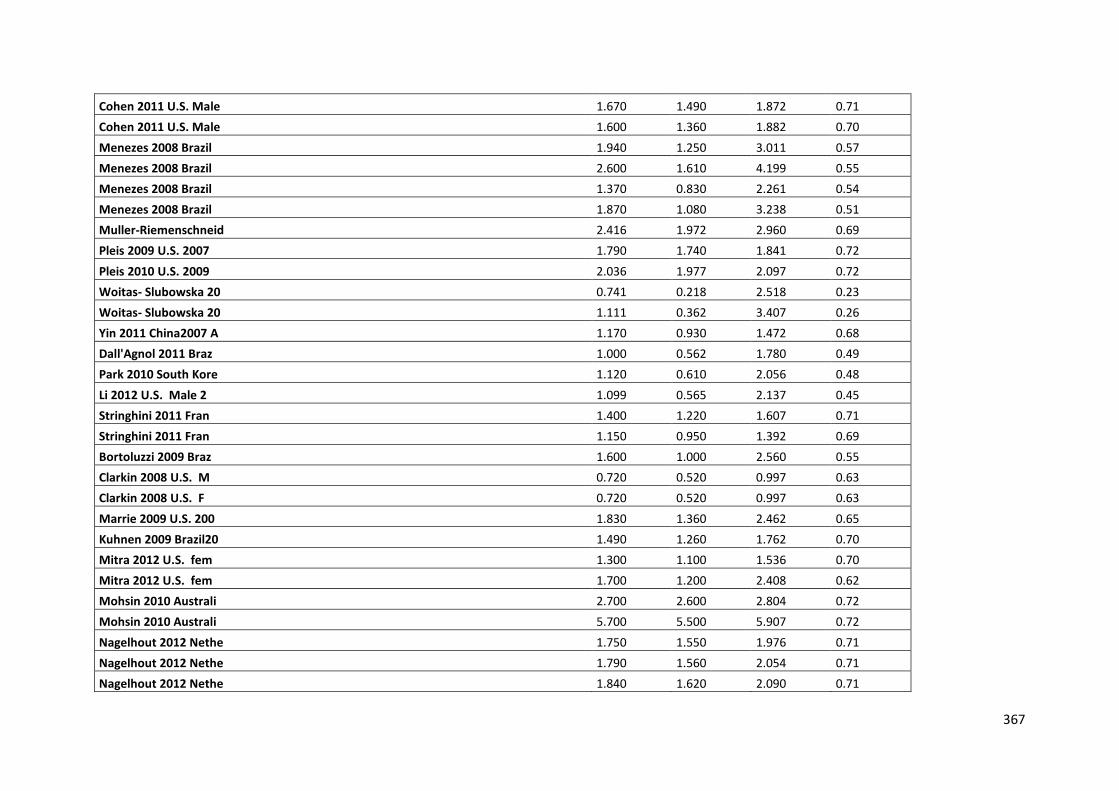
367
Cohen 2011 U.S. Male 1.670 1.490 1.872 0.71 Cohen 2011 U.S. Male 1.600 1.360 1.882 0.70 Menezes 2008 Brazil 1.940 1.250 3.011 0.57 Menezes 2008 Brazil 2.600 1.610 4.199 0.55 Menezes 2008 Brazil 1.370 0.830 2.261 0.54 Menezes 2008 Brazil 1.870 1.080 3.238 0.51 Muller-Riemenschneid 2.416 1.972 2.960 0.69 Pleis 2009 U.S. 2007 1.790 1.740 1.841 0.72 Pleis 2010 U.S. 2009 2.036 1.977 2.097 0.72 Woitas- Slubowska 20 0.741 0.218 2.518 0.23 Woitas- Slubowska 20 1.111 0.362 3.407 0.26 Yin 2011 China2007 A 1.170 0.930 1.472 0.68 Dall'Agnol 2011 Braz 1.000 0.562 1.780 0.49 Park 2010 South Kore 1.120 0.610 2.056 0.48 Li 2012 U.S. Male 2 1.099 0.565 2.137 0.45 Stringhini 2011 Fran 1.400 1.220 1.607 0.71 Stringhini 2011 Fran 1.150 0.950 1.392 0.69 Bortoluzzi 2009 Braz 1.600 1.000 2.560 0.55 Clarkin 2008 U.S. M 0.720 0.520 0.997 0.63 Clarkin 2008 U.S. F 0.720 0.520 0.997 0.63 Marrie 2009 U.S. 200 1.830 1.360 2.462 0.65 Kuhnen 2009 Brazil20 1.490 1.260 1.762 0.70 Mitra 2012 U.S. fem 1.300 1.100 1.536 0.70 Mitra 2012 U.S. fem 1.700 1.200 2.408 0.62 Mohsin 2010 Australi 2.700 2.600 2.804 0.72 Mohsin 2010 Australi 5.700 5.500 5.907 0.72 Nagelhout 2012 Nethe 1.750 1.550 1.976 0.71 Nagelhout 2012 Nethe 1.790 1.560 2.054 0.71 Nagelhout 2012 Nethe 1.840 1.620 2.090 0.71
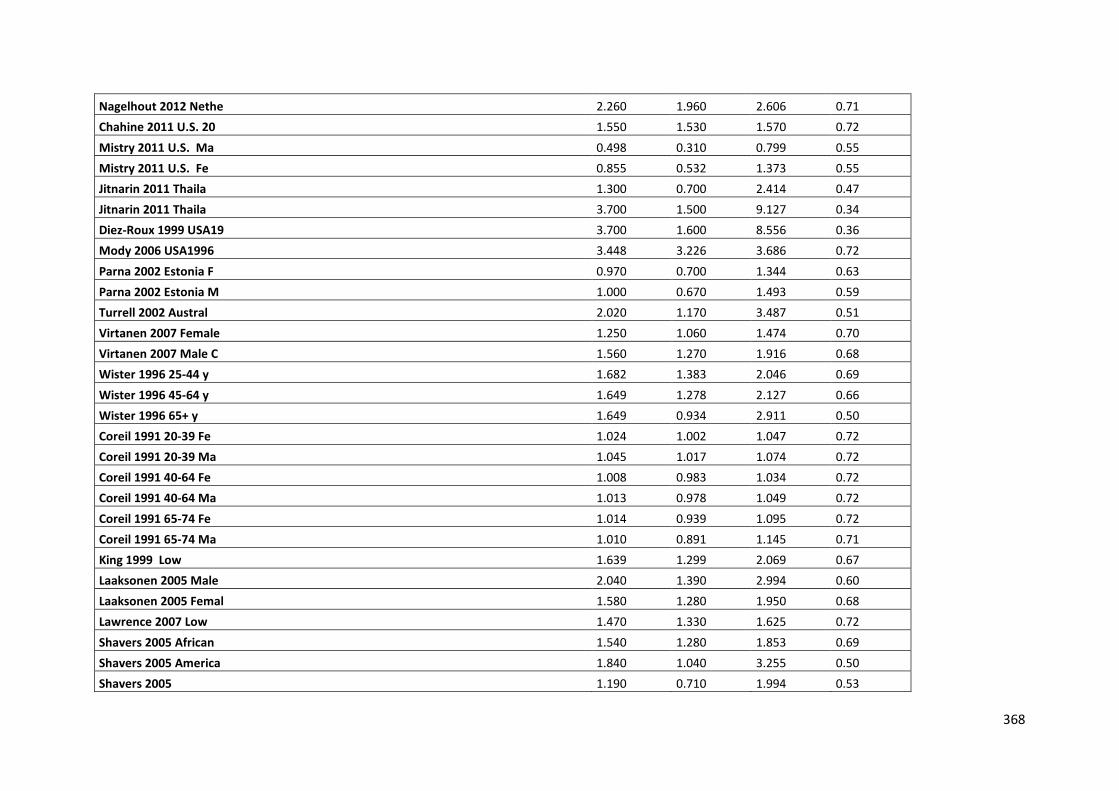
368
Nagelhout 2012 Nethe 2.260 1.960 2.606 0.71 Chahine 2011 U.S. 20 1.550 1.530 1.570 0.72 Mistry 2011 U.S. Ma 0.498 0.310 0.799 0.55 Mistry 2011 U.S. Fe 0.855 0.532 1.373 0.55 Jitnarin 2011 Thaila 1.300 0.700 2.414 0.47 Jitnarin 2011 Thaila 3.700 1.500 9.127 0.34 Diez-Roux 1999 USA19 3.700 1.600 8.556 0.36 Mody 2006 USA1996 3.448 3.226 3.686 0.72 Parna 2002 Estonia F 0.970 0.700 1.344 0.63 Parna 2002 Estonia M 1.000 0.670 1.493 0.59 Turrell 2002 Austral 2.020 1.170 3.487 0.51 Virtanen 2007 Female 1.250 1.060 1.474 0.70 Virtanen 2007 Male C 1.560 1.270 1.916 0.68 Wister 1996 25-44 y 1.682 1.383 2.046 0.69 Wister 1996 45-64 y 1.649 1.278 2.127 0.66 Wister 1996 65+ y 1.649 0.934 2.911 0.50 Coreil 1991 20-39 Fe 1.024 1.002 1.047 0.72 Coreil 1991 20-39 Ma 1.045 1.017 1.074 0.72 Coreil 1991 40-64 Fe 1.008 0.983 1.034 0.72 Coreil 1991 40-64 Ma 1.013 0.978 1.049 0.72 Coreil 1991 65-74 Fe 1.014 0.939 1.095 0.72 Coreil 1991 65-74 Ma 1.010 0.891 1.145 0.71 King 1999 Low 1.639 1.299 2.069 0.67 Laaksonen 2005 Male 2.040 1.390 2.994 0.60 Laaksonen 2005 Femal 1.580 1.280 1.950 0.68 Lawrence 2007 Low 1.470 1.330 1.625 0.72 Shavers 2005 African 1.540 1.280 1.853 0.69 Shavers 2005 America 1.840 1.040 3.255 0.50 Shavers 2005 1.190 0.710 1.994 0.53
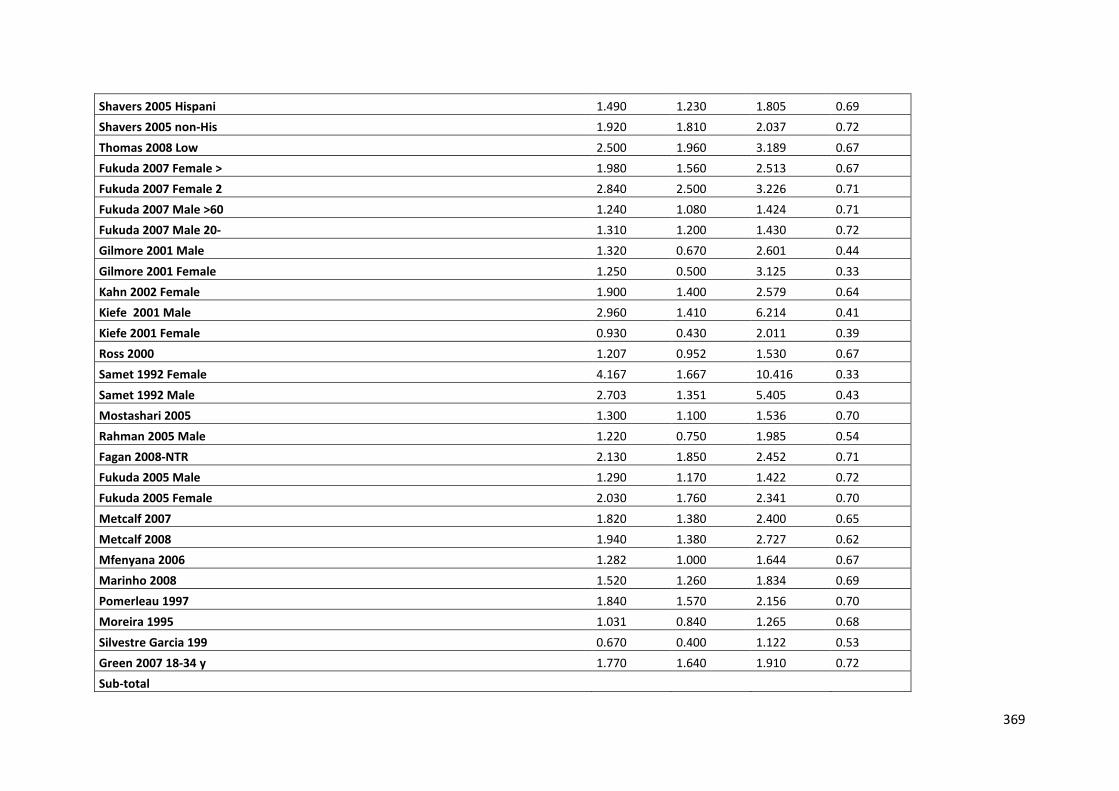
369
Shavers 2005 Hispani 1.490 1.230 1.805 0.69 Shavers 2005 non-His 1.920 1.810 2.037 0.72 Thomas 2008 Low 2.500 1.960 3.189 0.67 Fukuda 2007 Female > 1.980 1.560 2.513 0.67 Fukuda 2007 Female 2 2.840 2.500 3.226 0.71 Fukuda 2007 Male >60 1.240 1.080 1.424 0.71 Fukuda 2007 Male 20- 1.310 1.200 1.430 0.72 Gilmore 2001 Male 1.320 0.670 2.601 0.44 Gilmore 2001 Female 1.250 0.500 3.125 0.33 Kahn 2002 Female 1.900 1.400 2.579 0.64 Kiefe 2001 Male 2.960 1.410 6.214 0.41 Kiefe 2001 Female 0.930 0.430 2.011 0.39 Ross 2000 1.207 0.952 1.530 0.67 Samet 1992 Female 4.167 1.667 10.416 0.33 Samet 1992 Male 2.703 1.351 5.405 0.43 Mostashari 2005 1.300 1.100 1.536 0.70 Rahman 2005 Male 1.220 0.750 1.985 0.54 Fagan 2008-NTR 2.130 1.850 2.452 0.71 Fukuda 2005 Male 1.290 1.170 1.422 0.72 Fukuda 2005 Female 2.030 1.760 2.341 0.70 Metcalf 2007 1.820 1.380 2.400 0.65 Metcalf 2008 1.940 1.380 2.727 0.62 Mfenyana 2006 1.282 1.000 1.644 0.67 Marinho 2008 1.520 1.260 1.834 0.69 Pomerleau 1997 1.840 1.570 2.156 0.70 Moreira 1995 1.031 0.840 1.265 0.68 Silvestre Garcia 199 0.670 0.400 1.122 0.53 Green 2007 18-34 y 1.770 1.640 1.910 0.72 Sub-total
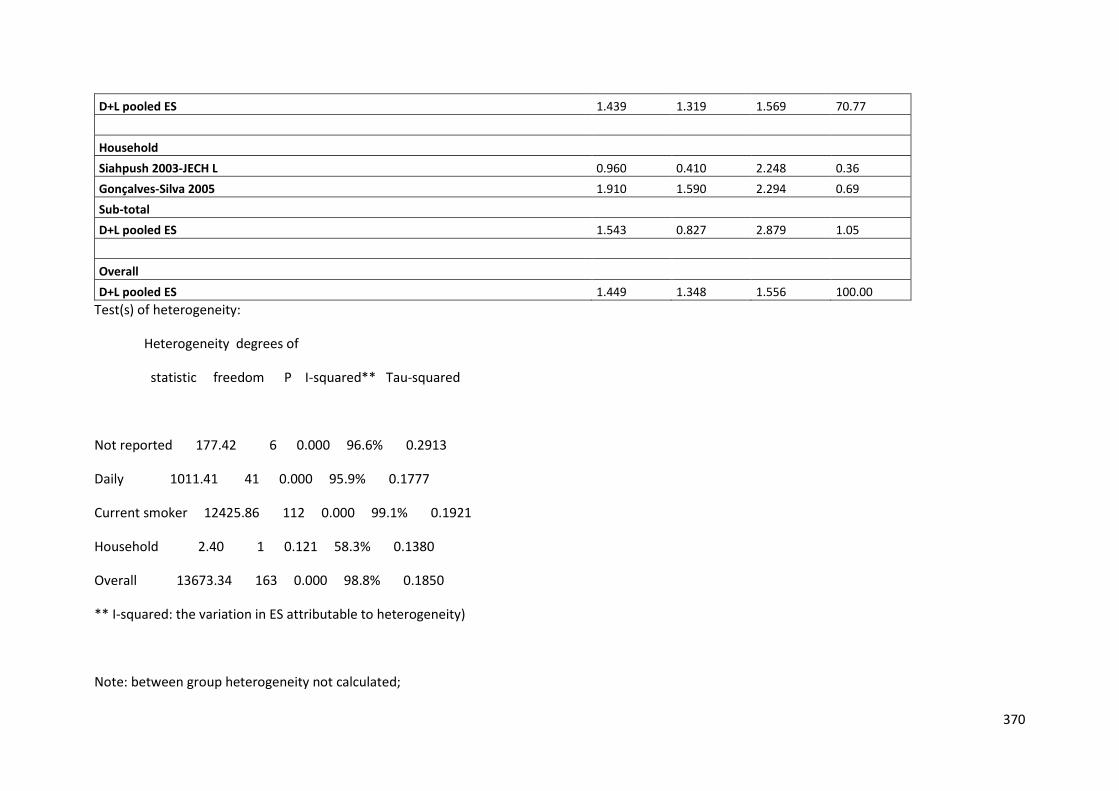
370
D+L pooled ES 1.439 1.319 1.569 70.77
Household Siahpush 2003-JECH L 0.960 0.410 2.248 0.36
Gonçalves-Silva 2005 1.910 1.590 2.294 0.69 Sub-total
D+L pooled ES 1.543 0.827 2.879 1.05
Overall D+L pooled ES 1.449 1.348 1.556 100.00
Test(s) of heterogeneity:
Heterogeneity degrees of
statistic freedom P I-squared** Tau-squared
Not reported 177.42 6 0.000 96.6% 0.2913
Daily 1011.41 41 0.000 95.9% 0.1777
Current smoker 12425.86 112 0.000 99.1% 0.1921
Household 2.40 1 0.121 58.3% 0.1380
Overall 13673.34 163 0.000 98.8% 0.1850
** I-squared: the variation in ES attributable to heterogeneity)
Note: between group heterogeneity not calculated;
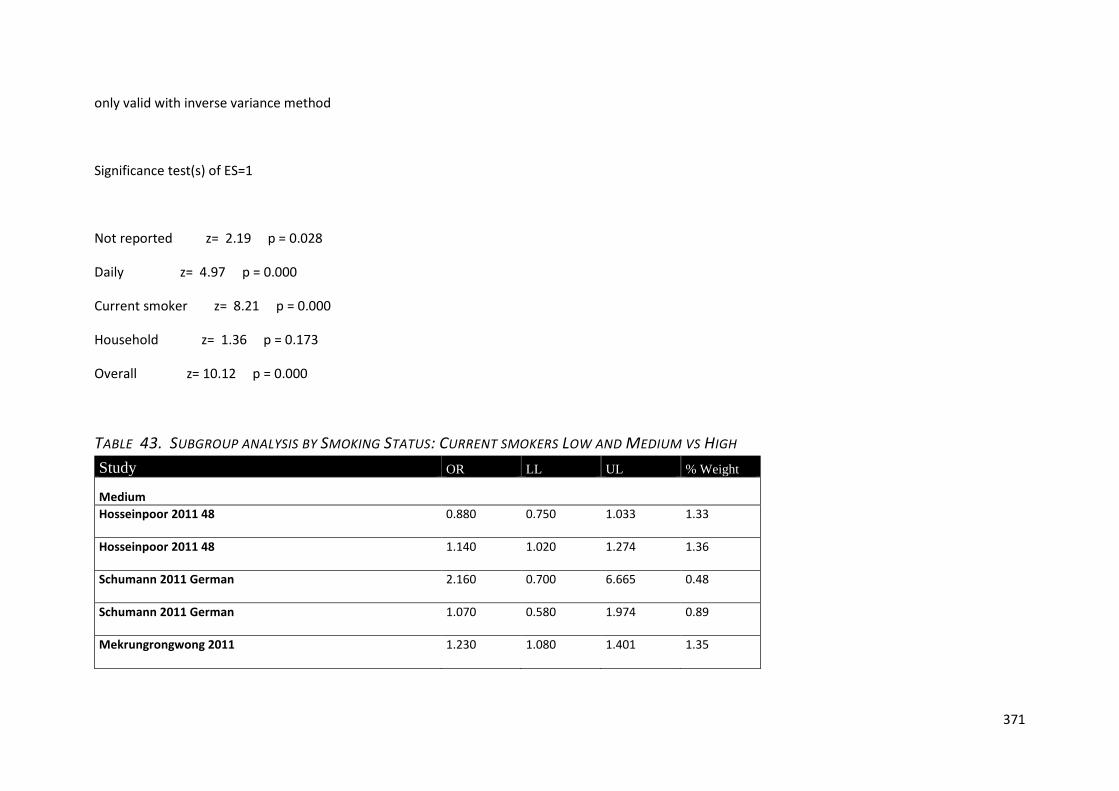
371
only valid with inverse variance method
Significance test(s) of ES=1
Not reported z= 2.19 p = 0.028
Daily z= 4.97 p = 0.000
Current smoker z= 8.21 p = 0.000
Household z= 1.36 p = 0.173
Overall z= 10.12 p = 0.000
TABLE 43. SUBGROUP ANALYSIS BY SMOKING STATUS: CURRENT SMOKERS LOW AND MEDIUM VS HIGH Study OR LL UL % Weight
Medium Hosseinpoor 2011 48 0.880 0.750 1.033 1.33
Hosseinpoor 2011 48 1.140 1.020 1.274 1.36
Schumann 2011 German 2.160 0.700 6.665 0.48
Schumann 2011 German 1.070 0.580 1.974 0.89
Mekrungrongwong 2011 1.230 1.080 1.401 1.35
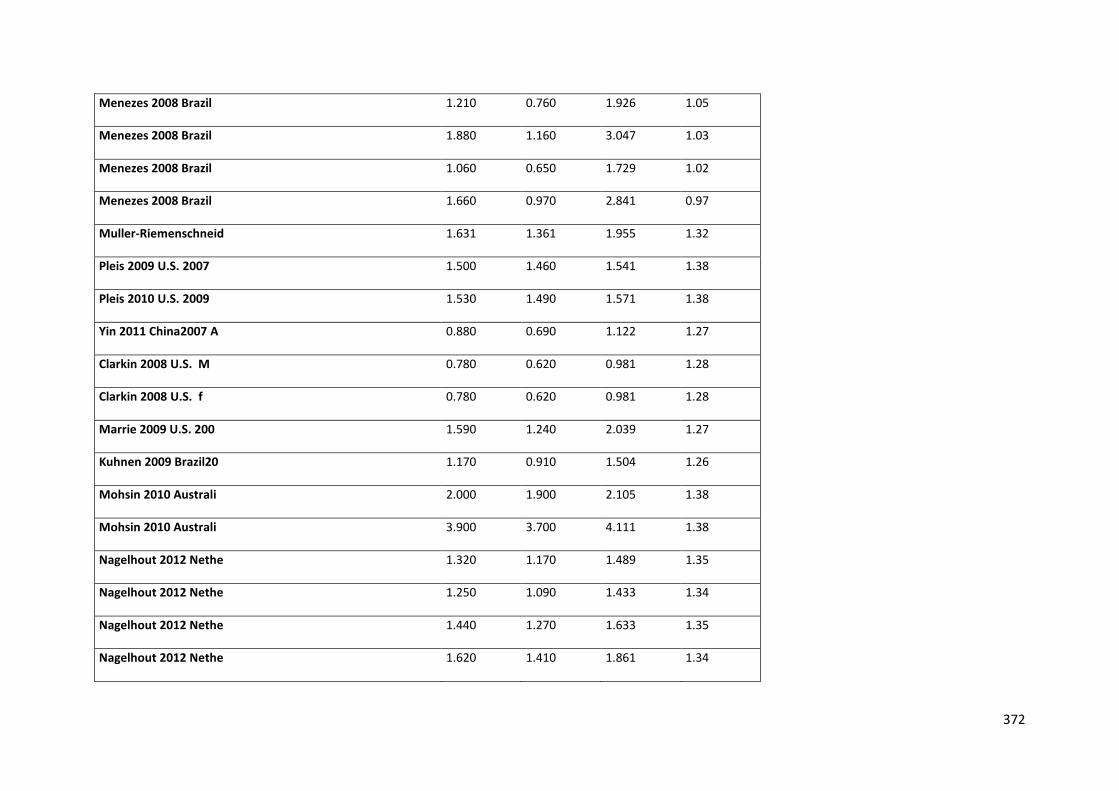
372
Menezes 2008 Brazil 1.210 0.760 1.926 1.05
Menezes 2008 Brazil 1.880 1.160 3.047 1.03
Menezes 2008 Brazil 1.060 0.650 1.729 1.02
Menezes 2008 Brazil 1.660 0.970 2.841 0.97
Muller-Riemenschneid 1.631 1.361 1.955 1.32
Pleis 2009 U.S. 2007 1.500 1.460 1.541 1.38
Pleis 2010 U.S. 2009 1.530 1.490 1.571 1.38
Yin 2011 China2007 A 0.880 0.690 1.122 1.27
Clarkin 2008 U.S. M 0.780 0.620 0.981 1.28
Clarkin 2008 U.S. f 0.780 0.620 0.981 1.28
Marrie 2009 U.S. 200 1.590 1.240 2.039 1.27
Kuhnen 2009 Brazil20 1.170 0.910 1.504 1.26
Mohsin 2010 Australi 2.000 1.900 2.105 1.38
Mohsin 2010 Australi 3.900 3.700 4.111 1.38
Nagelhout 2012 Nethe 1.320 1.170 1.489 1.35
Nagelhout 2012 Nethe 1.250 1.090 1.433 1.34
Nagelhout 2012 Nethe 1.440 1.270 1.633 1.35
Nagelhout 2012 Nethe 1.620 1.410 1.861 1.34
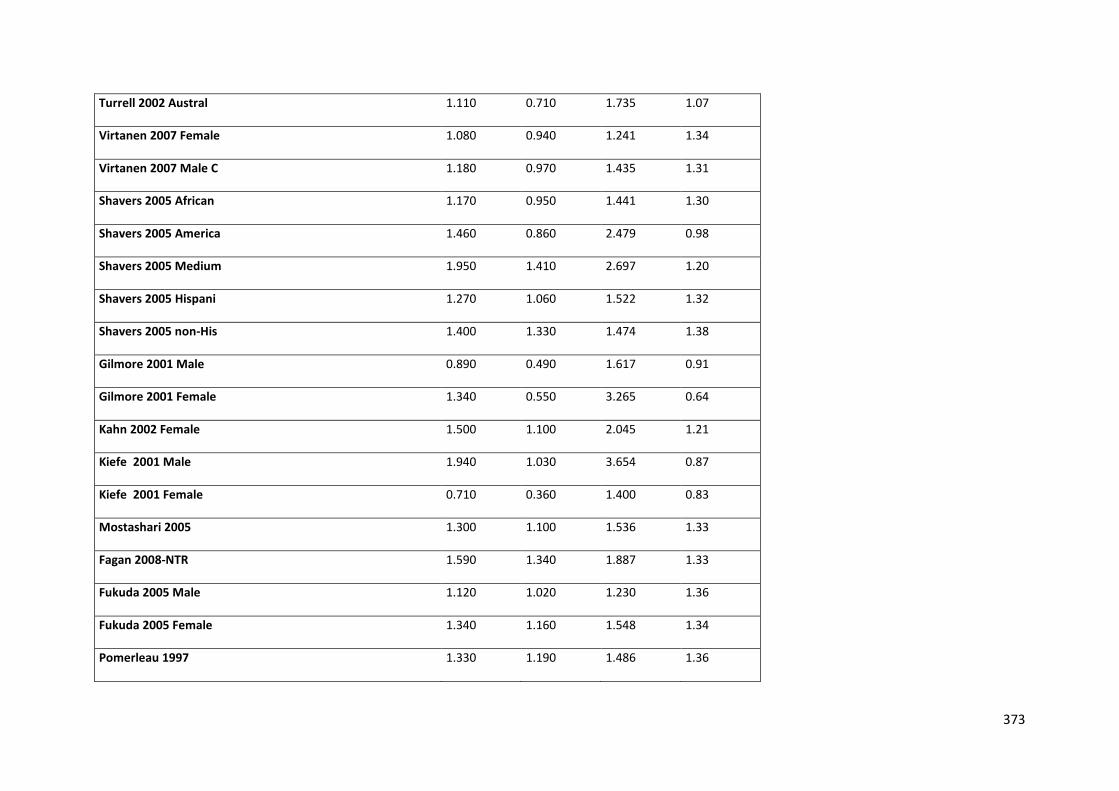
373
Turrell 2002 Austral 1.110 0.710 1.735 1.07
Virtanen 2007 Female 1.080 0.940 1.241 1.34
Virtanen 2007 Male C 1.180 0.970 1.435 1.31
Shavers 2005 African 1.170 0.950 1.441 1.30
Shavers 2005 America 1.460 0.860 2.479 0.98
Shavers 2005 Medium 1.950 1.410 2.697 1.20
Shavers 2005 Hispani 1.270 1.060 1.522 1.32
Shavers 2005 non-His 1.400 1.330 1.474 1.38
Gilmore 2001 Male 0.890 0.490 1.617 0.91
Gilmore 2001 Female 1.340 0.550 3.265 0.64
Kahn 2002 Female 1.500 1.100 2.045 1.21
Kiefe 2001 Male 1.940 1.030 3.654 0.87
Kiefe 2001 Female 0.710 0.360 1.400 0.83
Mostashari 2005 1.300 1.100 1.536 1.33
Fagan 2008-NTR 1.590 1.340 1.887 1.33
Fukuda 2005 Male 1.120 1.020 1.230 1.36
Fukuda 2005 Female 1.340 1.160 1.548 1.34
Pomerleau 1997 1.330 1.190 1.486 1.36
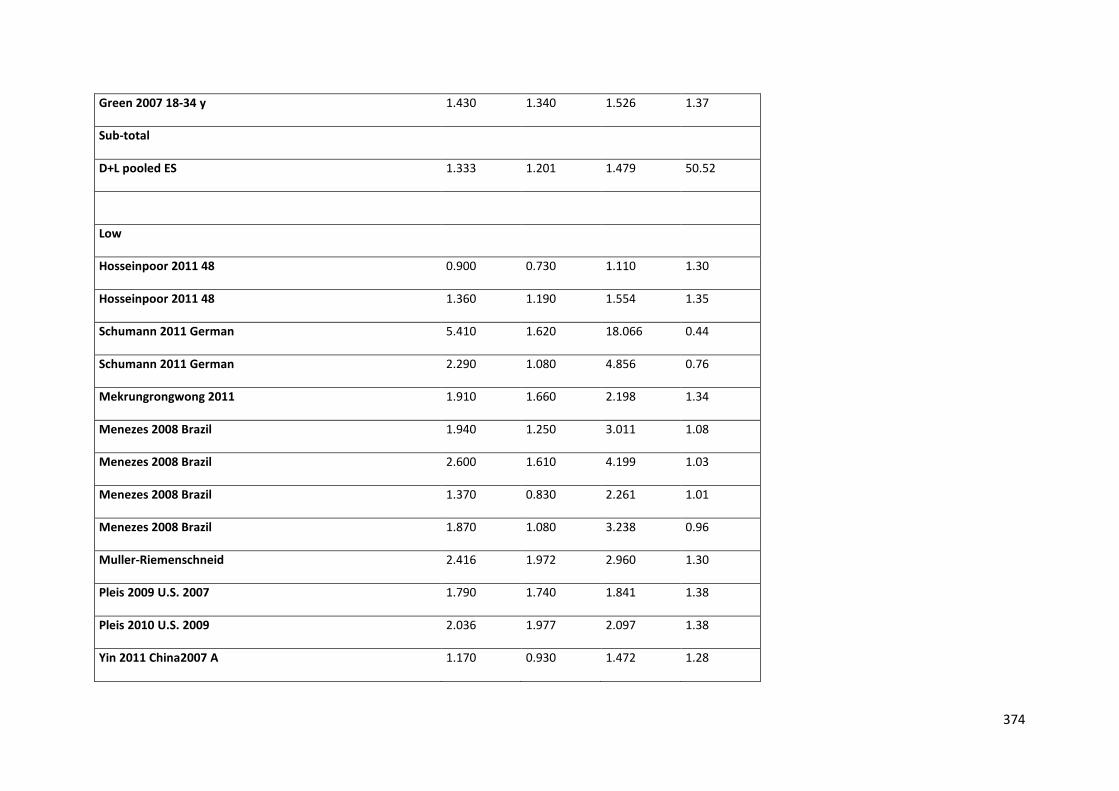
374
Green 2007 18-34 y 1.430 1.340 1.526 1.37
Sub-total
D+L pooled ES 1.333 1.201 1.479 50.52
Low
Hosseinpoor 2011 48 0.900 0.730 1.110 1.30
Hosseinpoor 2011 48 1.360 1.190 1.554 1.35
Schumann 2011 German 5.410 1.620 18.066 0.44
Schumann 2011 German 2.290 1.080 4.856 0.76
Mekrungrongwong 2011 1.910 1.660 2.198 1.34
Menezes 2008 Brazil 1.940 1.250 3.011 1.08
Menezes 2008 Brazil 2.600 1.610 4.199 1.03
Menezes 2008 Brazil 1.370 0.830 2.261 1.01
Menezes 2008 Brazil 1.870 1.080 3.238 0.96
Muller-Riemenschneid 2.416 1.972 2.960 1.30
Pleis 2009 U.S. 2007 1.790 1.740 1.841 1.38
Pleis 2010 U.S. 2009 2.036 1.977 2.097 1.38
Yin 2011 China2007 A 1.170 0.930 1.472 1.28
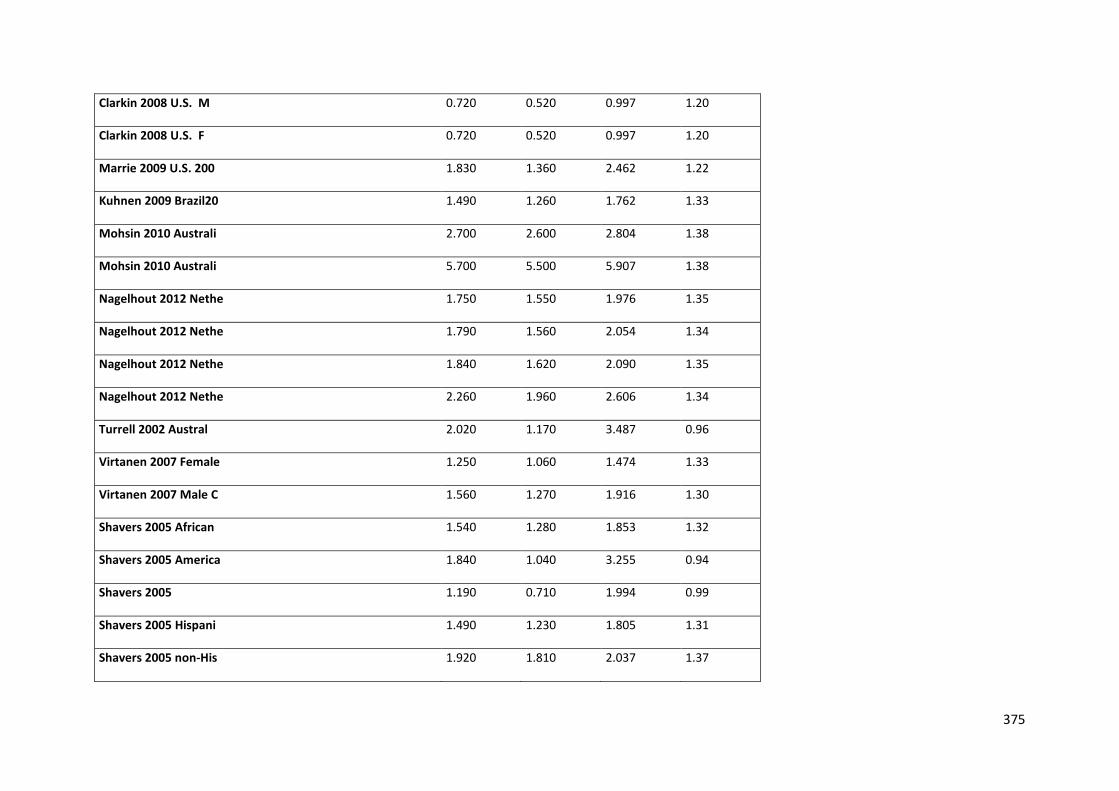
375
Clarkin 2008 U.S. M 0.720 0.520 0.997 1.20
Clarkin 2008 U.S. F 0.720 0.520 0.997 1.20
Marrie 2009 U.S. 200 1.830 1.360 2.462 1.22
Kuhnen 2009 Brazil20 1.490 1.260 1.762 1.33
Mohsin 2010 Australi 2.700 2.600 2.804 1.38
Mohsin 2010 Australi 5.700 5.500 5.907 1.38
Nagelhout 2012 Nethe 1.750 1.550 1.976 1.35
Nagelhout 2012 Nethe 1.790 1.560 2.054 1.34
Nagelhout 2012 Nethe 1.840 1.620 2.090 1.35
Nagelhout 2012 Nethe 2.260 1.960 2.606 1.34
Turrell 2002 Austral 2.020 1.170 3.487 0.96
Virtanen 2007 Female 1.250 1.060 1.474 1.33
Virtanen 2007 Male C 1.560 1.270 1.916 1.30
Shavers 2005 African 1.540 1.280 1.853 1.32
Shavers 2005 America 1.840 1.040 3.255 0.94
Shavers 2005 1.190 0.710 1.994 0.99
Shavers 2005 Hispani 1.490 1.230 1.805 1.31
Shavers 2005 non-His 1.920 1.810 2.037 1.37
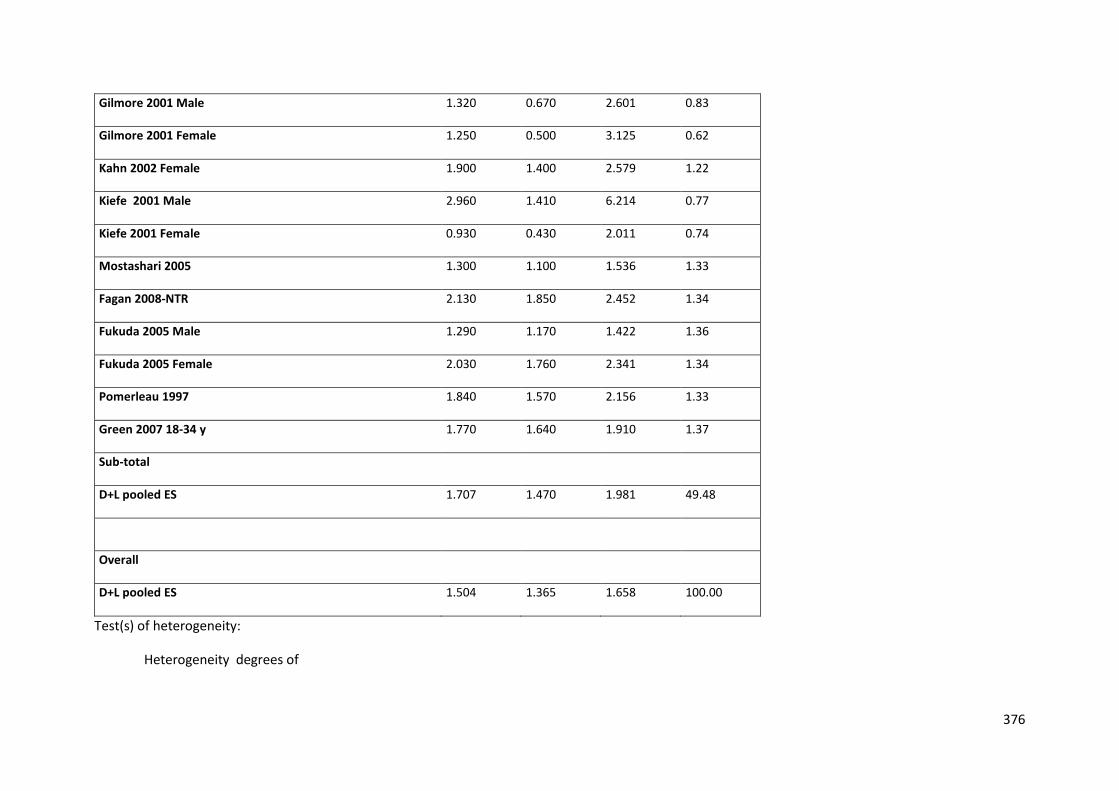
376
Gilmore 2001 Male 1.320 0.670 2.601 0.83
Gilmore 2001 Female 1.250 0.500 3.125 0.62
Kahn 2002 Female 1.900 1.400 2.579 1.22
Kiefe 2001 Male 2.960 1.410 6.214 0.77
Kiefe 2001 Female 0.930 0.430 2.011 0.74
Mostashari 2005 1.300 1.100 1.536 1.33
Fagan 2008-NTR 2.130 1.850 2.452 1.34
Fukuda 2005 Male 1.290 1.170 1.422 1.36
Fukuda 2005 Female 2.030 1.760 2.341 1.34
Pomerleau 1997 1.840 1.570 2.156 1.33
Green 2007 18-34 y 1.770 1.640 1.910 1.37
Sub-total
D+L pooled ES 1.707 1.470 1.981 49.48
Overall
D+L pooled ES 1.504 1.365 1.658 100.00
Test(s) of heterogeneity:
Heterogeneity degrees of
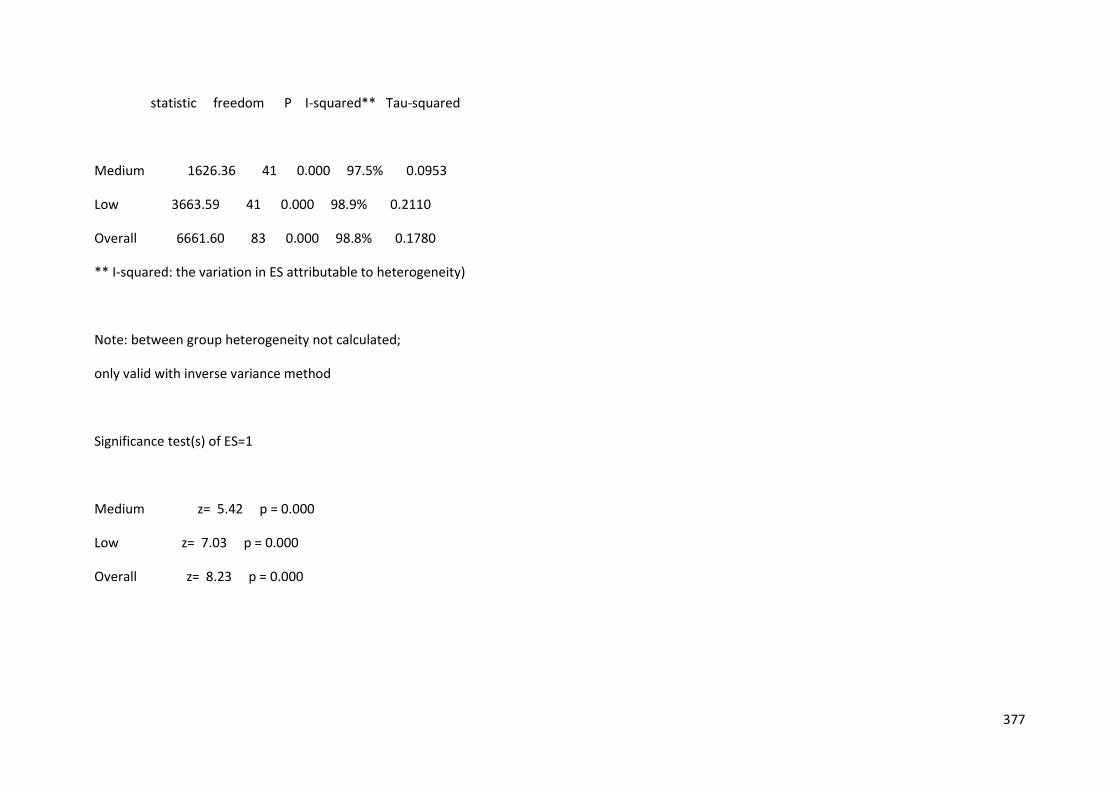
377
statistic freedom P I-squared** Tau-squared
Medium 1626.36 41 0.000 97.5% 0.0953
Low 3663.59 41 0.000 98.9% 0.2110
Overall 6661.60 83 0.000 98.8% 0.1780
** I-squared: the variation in ES attributable to heterogeneity)
Note: between group heterogeneity not calculated;
only valid with inverse variance method
Significance test(s) of ES=1
Medium z= 5.42 p = 0.000
Low z= 7.03 p = 0.000
Overall z= 8.23 p = 0.000
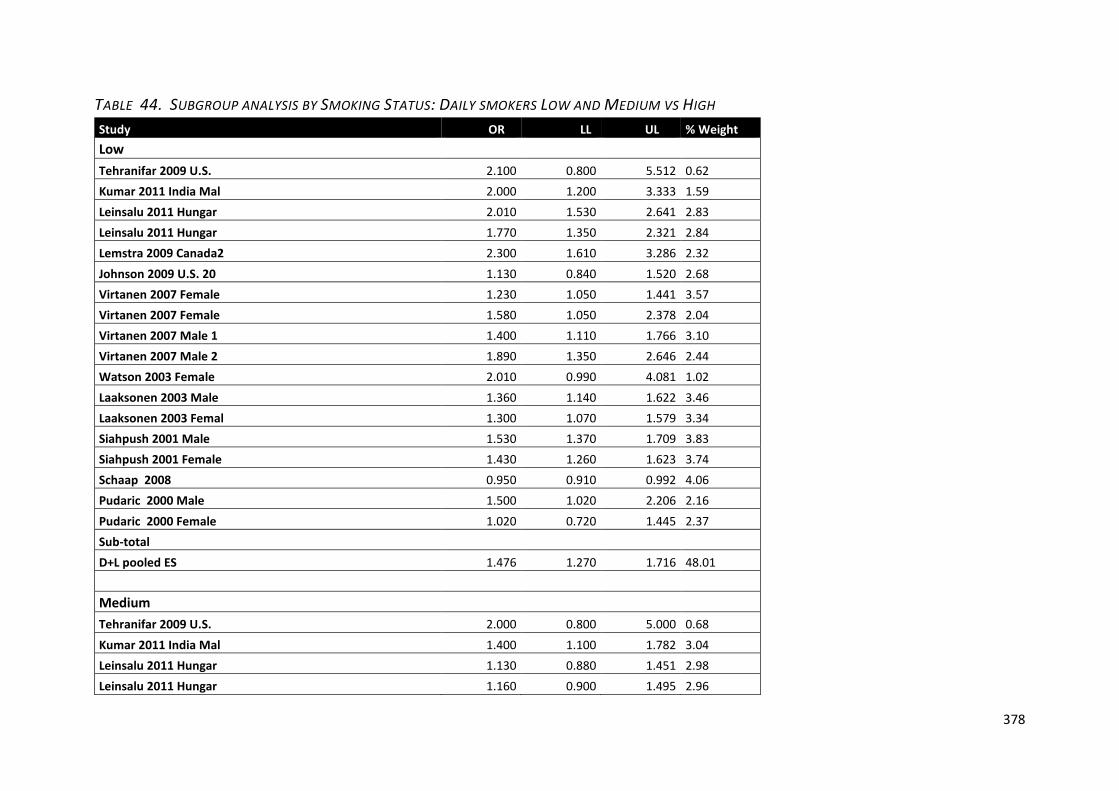
378
TABLE 44. SUBGROUP ANALYSIS BY SMOKING STATUS: DAILY SMOKERS LOW AND MEDIUM VS HIGH Study OR LL UL % Weight Low
Tehranifar 2009 U.S. 2.100 0.800 5.512 0.62 Kumar 2011 India Mal 2.000 1.200 3.333 1.59 Leinsalu 2011 Hungar 2.010 1.530 2.641 2.83 Leinsalu 2011 Hungar 1.770 1.350 2.321 2.84 Lemstra 2009 Canada2 2.300 1.610 3.286 2.32 Johnson 2009 U.S. 20 1.130 0.840 1.520 2.68 Virtanen 2007 Female 1.230 1.050 1.441 3.57 Virtanen 2007 Female 1.580 1.050 2.378 2.04 Virtanen 2007 Male 1 1.400 1.110 1.766 3.10 Virtanen 2007 Male 2 1.890 1.350 2.646 2.44 Watson 2003 Female 2.010 0.990 4.081 1.02 Laaksonen 2003 Male 1.360 1.140 1.622 3.46 Laaksonen 2003 Femal 1.300 1.070 1.579 3.34 Siahpush 2001 Male 1.530 1.370 1.709 3.83 Siahpush 2001 Female 1.430 1.260 1.623 3.74 Schaap 2008 0.950 0.910 0.992 4.06 Pudaric 2000 Male 1.500 1.020 2.206 2.16 Pudaric 2000 Female 1.020 0.720 1.445 2.37 Sub-total
D+L pooled ES 1.476 1.270 1.716 48.01
Medium Tehranifar 2009 U.S. 2.000 0.800 5.000 0.68
Kumar 2011 India Mal 1.400 1.100 1.782 3.04 Leinsalu 2011 Hungar 1.130 0.880 1.451 2.98 Leinsalu 2011 Hungar 1.160 0.900 1.495 2.96
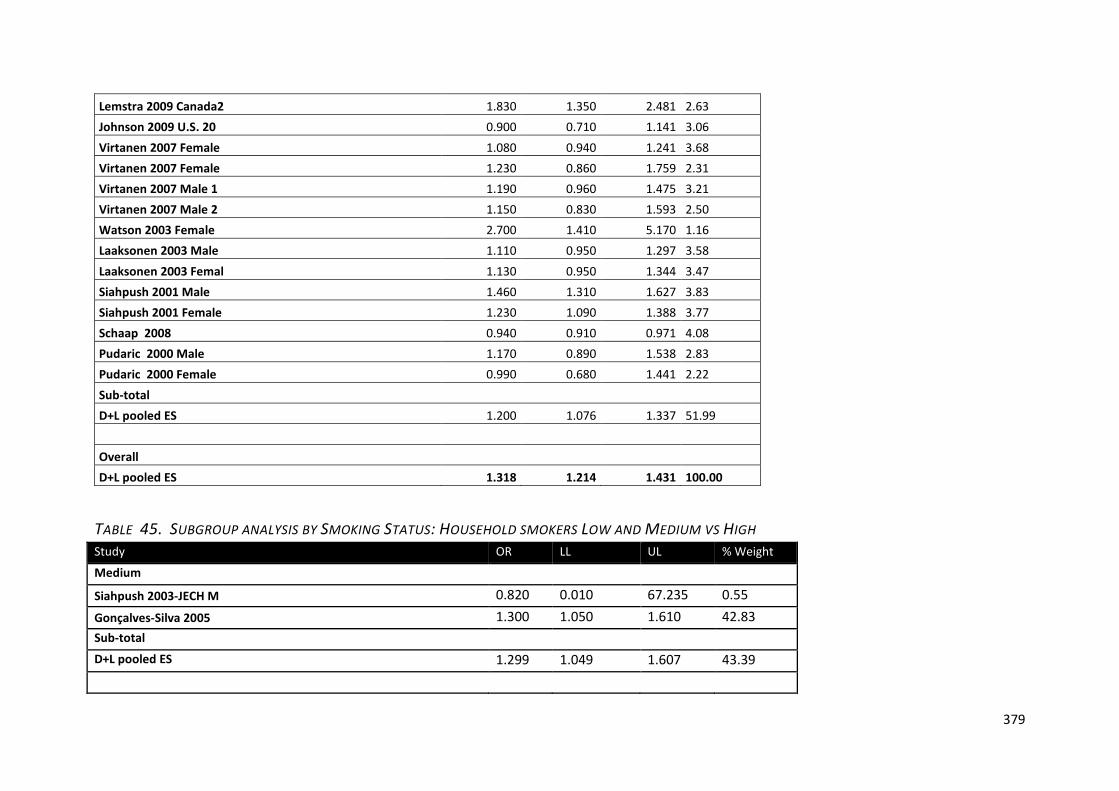
379
Lemstra 2009 Canada2 1.830 1.350 2.481 2.63 Johnson 2009 U.S. 20 0.900 0.710 1.141 3.06 Virtanen 2007 Female 1.080 0.940 1.241 3.68 Virtanen 2007 Female 1.230 0.860 1.759 2.31 Virtanen 2007 Male 1 1.190 0.960 1.475 3.21 Virtanen 2007 Male 2 1.150 0.830 1.593 2.50 Watson 2003 Female 2.700 1.410 5.170 1.16 Laaksonen 2003 Male 1.110 0.950 1.297 3.58 Laaksonen 2003 Femal 1.130 0.950 1.344 3.47 Siahpush 2001 Male 1.460 1.310 1.627 3.83 Siahpush 2001 Female 1.230 1.090 1.388 3.77 Schaap 2008 0.940 0.910 0.971 4.08 Pudaric 2000 Male 1.170 0.890 1.538 2.83 Pudaric 2000 Female 0.990 0.680 1.441 2.22 Sub-total
D+L pooled ES 1.200 1.076 1.337 51.99
Overall D+L pooled ES 1.318 1.214 1.431 100.00
TABLE 45. SUBGROUP ANALYSIS BY SMOKING STATUS: HOUSEHOLD SMOKERS LOW AND MEDIUM VS HIGH Study OR LL UL % Weight
Medium
Siahpush 2003-JECH M 0.820 0.010 67.235 0.55
Gonçalves-Silva 2005 1.300 1.050 1.610 42.83 Sub-total
D+L pooled ES 1.299 1.049 1.607 43.39
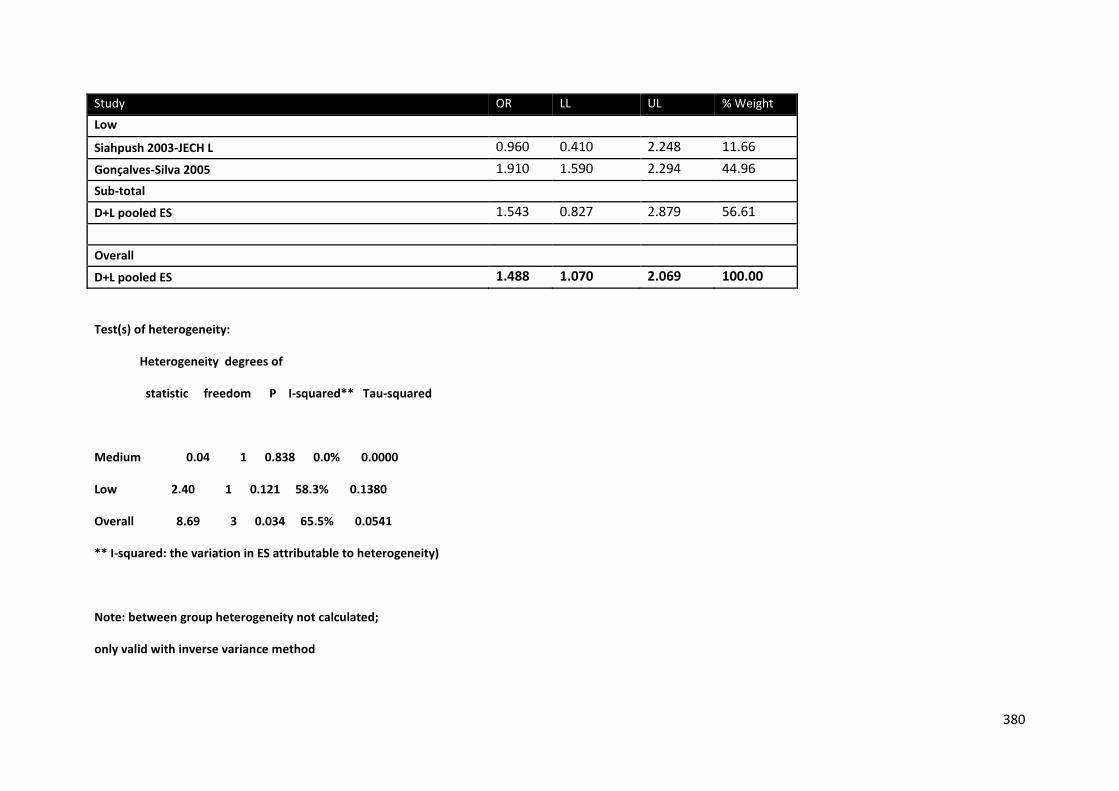
380
Study OR LL UL % Weight
Low
Siahpush 2003-JECH L 0.960 0.410 2.248 11.66 Gonçalves-Silva 2005 1.910 1.590 2.294 44.96 Sub-total
D+L pooled ES 1.543 0.827 2.879 56.61
Overall D+L pooled ES 1.488 1.070 2.069 100.00
Test(s) of heterogeneity:
Heterogeneity degrees of
statistic freedom P I-squared** Tau-squared
Medium 0.04 1 0.838 0.0% 0.0000
Low 2.40 1 0.121 58.3% 0.1380
Overall 8.69 3 0.034 65.5% 0.0541
** I-squared: the variation in ES attributable to heterogeneity)
Note: between group heterogeneity not calculated;
only valid with inverse variance method
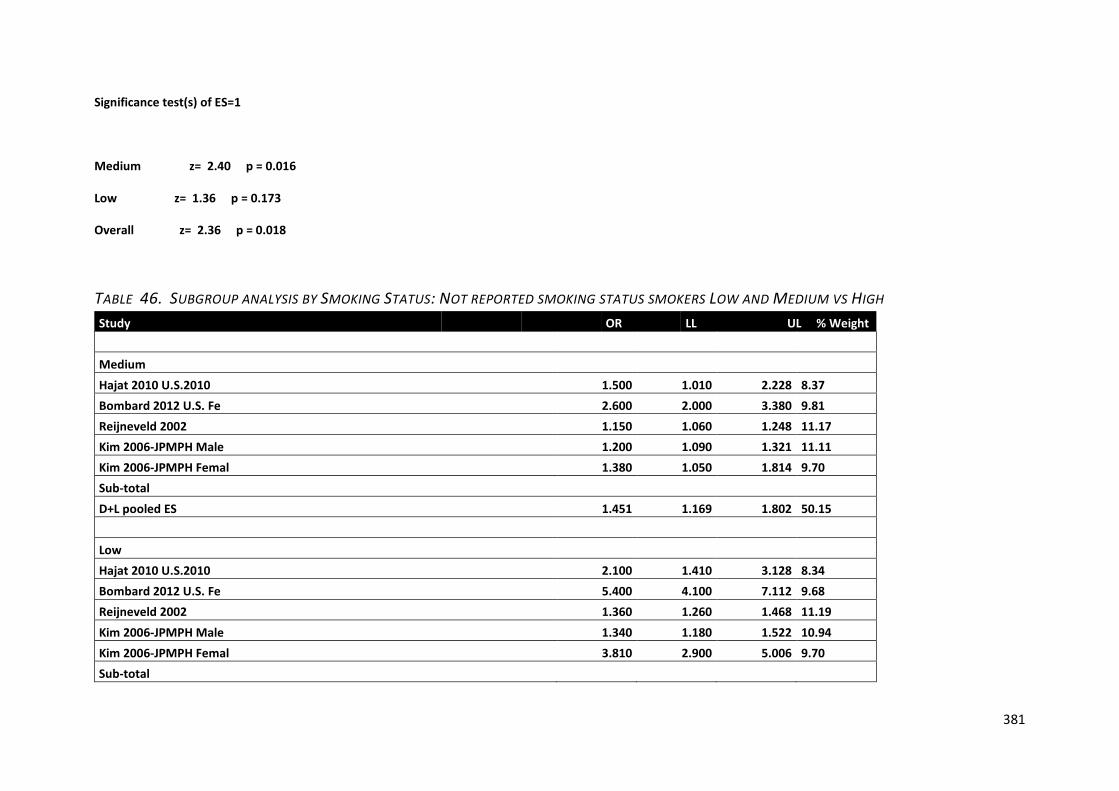
381
Significance test(s) of ES=1
Medium z= 2.40 p = 0.016
Low z= 1.36 p = 0.173
Overall z= 2.36 p = 0.018
TABLE 46. SUBGROUP ANALYSIS BY SMOKING STATUS: NOT REPORTED SMOKING STATUS SMOKERS LOW AND MEDIUM VS HIGH Study OR LL UL % Weight Medium
Hajat 2010 U.S.2010 1.500 1.010 2.228 8.37 Bombard 2012 U.S. Fe 2.600 2.000 3.380 9.81 Reijneveld 2002 1.150 1.060 1.248 11.17 Kim 2006-JPMPH Male 1.200 1.090 1.321 11.11 Kim 2006-JPMPH Femal 1.380 1.050 1.814 9.70 Sub-total
D+L pooled ES 1.451 1.169 1.802 50.15
Low Hajat 2010 U.S.2010 2.100 1.410 3.128 8.34
Bombard 2012 U.S. Fe 5.400 4.100 7.112 9.68 Reijneveld 2002 1.360 1.260 1.468 11.19 Kim 2006-JPMPH Male 1.340 1.180 1.522 10.94 Kim 2006-JPMPH Femal 3.810 2.900 5.006 9.70 Sub-total
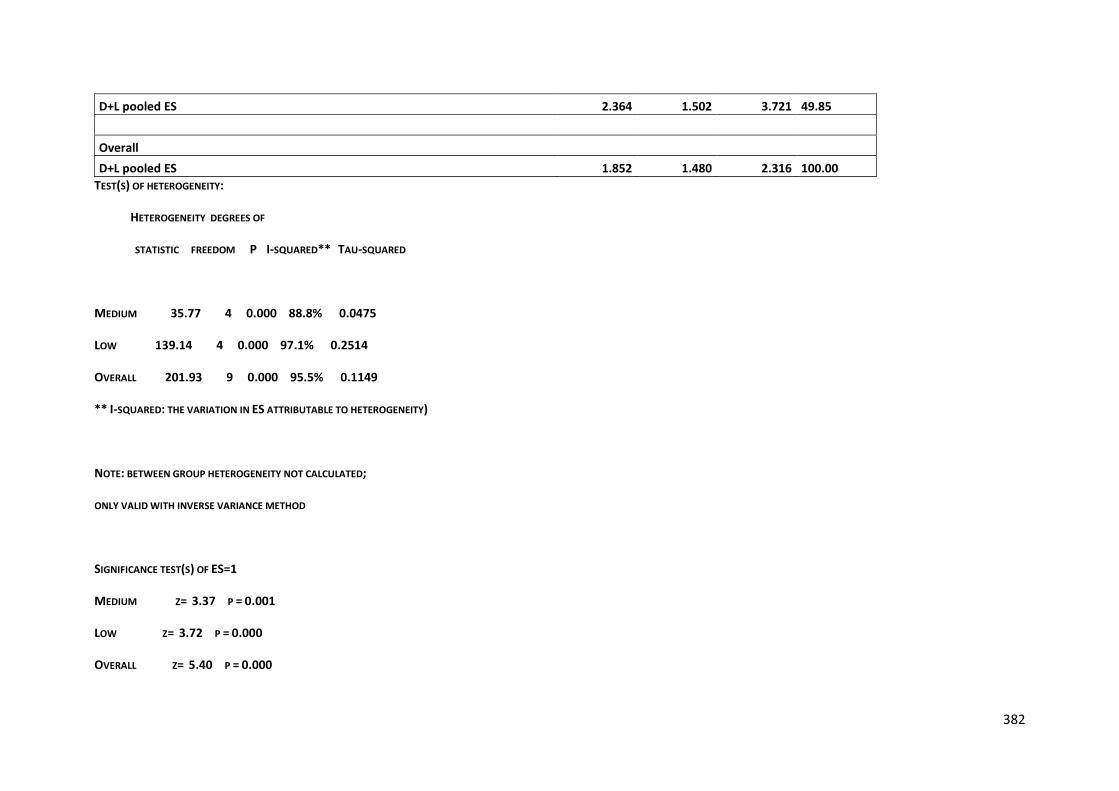
382
D+L pooled ES 2.364 1.502 3.721 49.85
Overall D+L pooled ES 1.852 1.480 2.316 100.00
TEST(S) OF HETEROGENEITY:
HETEROGENEITY DEGREES OF
STATISTIC FREEDOM P I-SQUARED** TAU-SQUARED
MEDIUM 35.77 4 0.000 88.8% 0.0475
LOW 139.14 4 0.000 97.1% 0.2514
OVERALL 201.93 9 0.000 95.5% 0.1149
** I-SQUARED: THE VARIATION IN ES ATTRIBUTABLE TO HETEROGENEITY)
NOTE: BETWEEN GROUP HETEROGENEITY NOT CALCULATED;
ONLY VALID WITH INVERSE VARIANCE METHOD
SIGNIFICANCE TEST(S) OF ES=1
MEDIUM Z= 3.37 P = 0.001
LOW Z= 3.72 P = 0.000
OVERALL Z= 5.40 P = 0.000
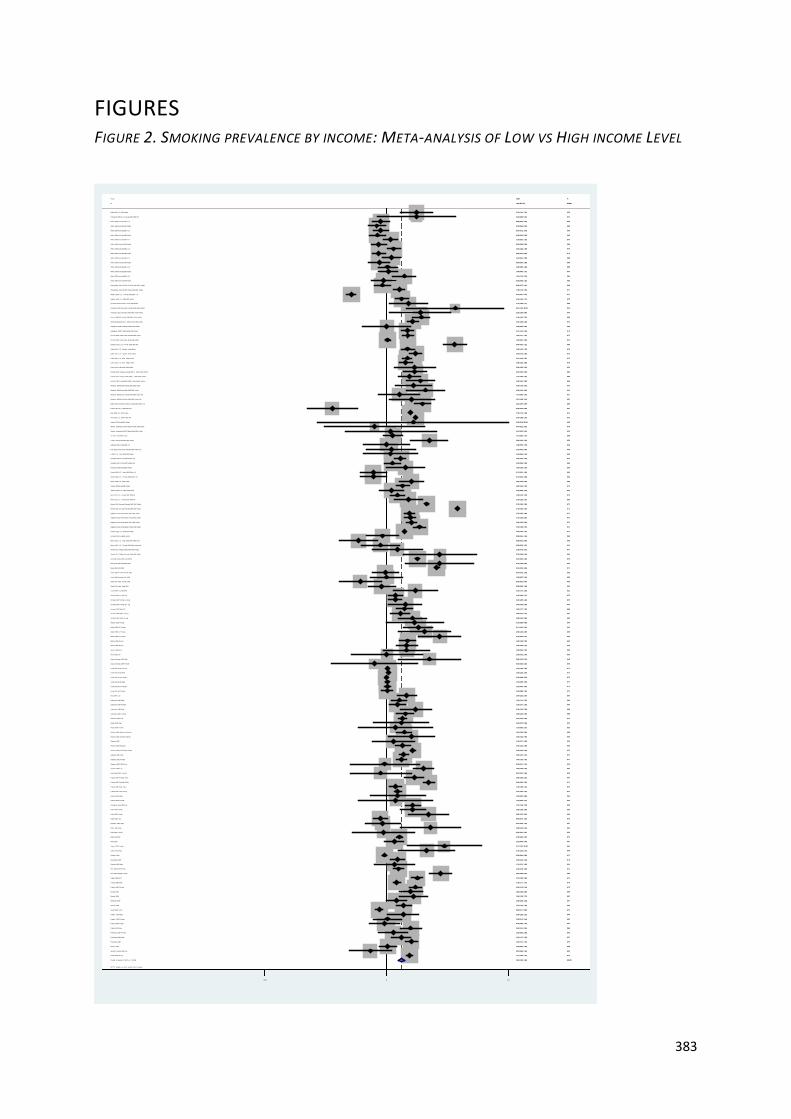
383
FIGURES FIGURE 2. SMOKING PREVALENCE BY INCOME: META-ANALYSIS OF LOW VS HIGH INCOME LEVEL
NOTE: Weights are from random effects analysis
Overall (I-squared = 98.8%, p = 0.000)
Clarkin 2008 U.S. Female 2000-2004 <15
Fagan 2008-NTR
Fukuda 2005 Male
Yin 2011 China2007 Adults
Hosseinpoor 2011 48 LMIC Female 2002-2004 Adults
Pudaric 2000 Female
Marinho 2008
Singh 1997 India Female 1991
Hesketh2007 Male
Sandin 2010 Brazil2009 Adults
Pudaric 2000 Male
Pudule 1999 Female
Nagelhout 2012 Netherlands Male 2001 Adults
Coreil 1991 20-39 Male
Kumar 2011 India Male 2009 Adults
Kim 2006-JPMPH Male
Fukuda 2007 Female 20-59y
White 2008 Australia1987 <15
Woitas- Slubowska 2010 Polland Female 2004 Adults
Mfenyana 2006
Stringhini 2011 France2007 Adults Mix
Pomerleau 1997
Nagelhout 2012 Netherlands female 2008 Adults
Shavers 2005 African Americans
Bortoluzzi 2009 Brazil2005 Adults
White 2008 Australia2002 Adults
Parna 2002 Estonia Male 1996
Mistry 2011 U.S. Male 2003-2004 Adults Mix
Cohen 2011 U.S. Female Adults Black
White 2008 Australia1996 <15
Jitnarin 2011 Thailand Male 2004-2005 Adults
Al-Turki 2010 Saudi Arabia Female 2005 Adults
Al-Sahab 2010 Canada Female 2006 Adults
White 2008 Australia1993 <15
Virtanen 2007 Male 20+ cig
Schaap 2008
Johnson 2009 U.S. 2001-2005 Adults
Park 2010 South Korea Female 2005 Adults mix
Leinsalu 2011 Hungary Female 2000 y 2003 Adults White
Mitra 2012 U.S. female 2007-2009 All
Khuwaja 2004 Male
Gilmore 2001 Male
Erick-Peleti 2007 Female
Lawrence 2007 Low
Siahpush 2003-JECH Low
White 2008 Australia1999 Adults
Siahpush 2001 Male
Lemstra 2009 Canada2001-2003 y 2005 Adults Natives
Ross 2000
Kiefe 2001 Female
Gilmore 2001 Female
Anaya Ocampo 2006 Male
Shapo 2003 Female
Shapo 2003 Male
Kahn 2002 Female
Laaksonen 2005 Female
Laaksonen 2003 Male
Marrie 2009 U.S. 2006 Adults
Parna 2002 Estonia Female 1996
King 1999 Low
Virtanen 2007 Male 1-19 cig
Mitra 2012 U.S. female 2007-2009 All
Tehranifar 2009 U.S. Female 2001-2006 NR
Study
Mekrungrongwong 2011 Thailand Male 2006 Adults
Schumann 2011 Germany Male 2006 Adults White
Coreil 1991 65-74 Male
Mostashari 2005
Alam 2008 Low
Wister 1996 65+ y
Anaya Ocampo 2006 Female
Wister 1996 25-44 y
Kuhnen 2009 Brazil2007 Adults
White 2008 Australia1993 Adults
Webb 2008 G1 Female
Hosseinpoor 2011 48 LMIC Male 2002-2004 Adults
Hughes 2010 U.S. 2004-2005 Adults
Menezes 2008 Brazil Male 2000-2005 Adults
Amuzu 2009 UK Female 1999-2001 Adults White
Fukuda 2007 Male 20-59y
ID
Coreil 1991 40-64 Female
Aekplakorn 2008 Thailand Female 2004 Adults
Pomerleau 2004 Male
Metcalf 2007
Fukuda 2007 Female >60 y
Laaksonen 2005 Male
Al-Windi 2010 Iraq2006 Adults
Reijneveld 2002
Kiefe 2001 Male
Siahpush 2001 Female
Samet 1992 Male
Moreira 1995
Clarkin 2008 U.S. Male 2000-2004 <15
Mody 2006 USA1996
Woitas- Slubowska 2010 Polland Male 2004 Adults
Rahman 2005 Male
Coreil 1991 65-74 Female
Nagelhout 2012 Netherlands female 2001 Adults
Jitnarin 2011 Thailand Female 2004-2005 Adults
Muller-Riemenschneider 2010 Germany2003-2006 <15
Mohsin 2010 Australia Female 1995-1997 Adults
Chahine 2011 U.S. 2006-2007 Adults
Watson 2003 Female
Shavers 2005 Hispanics
Leinsalu 2011 Hungary Male 2000 y 2003 Adults White
White 2008 Australia1990 Adults
White 2008 Australia1987 Adults
Virtanen 2007 Male CS
Gonçalves-Silva 2005 Low
Dall'Agnol 2011 Brazil1998 <15
Stringhini 2011 France1995 Adults Mix
Nagelhout 2012 Netherlands Male 2008 Adults
Diez-Roux 1999 USA1992-1994
Acevedo-Garcia 2005 USA1995-6
Zaitune 2012 Brazil2001-2002 Adults
Webb 2008 G2 Female
White 2008 Australia1996 Adults
Green 2007 18-34 y
Shavers 2005
Samet 1992 Female
Mistry 2011 U.S. Female 2003-2004 Adults Mix
Kahn 2005 Female
Virtanen 2007 Female 20+ cig
Menezes 2008 Brazil Male 2004-2005 Adults Mix
Wallace 2009 U.S. Female 2003-2007 <15
Pudule 1999 Male
White 2008 Australia2005 <15
Cohen 2011 U.S. Male Adults Black
Coreil 1991 40-64 Male
Fukuda 2005 Female
Pleis 2009 U.S. 2007 Adults
Cohen 2011 U.S. Male Adults White
Shavers 2005 non-Hispanic whites
Metcalf 2008
Coreil 1991 20-39 Female
Bombard 2012 U.S. Female 2005-2006 NR
White 2008 Australia2005 Adults
Singh 1997 India Male 1991
Menezes 2008 Brazil Female 2004-2005 Adults Mix
Turrell 2002 Australia1995
Pleis 2010 U.S. 2009 Adults Mix
Kim 2006-JPMPH Female
Al-Turki 2010 Saudi Arabia Male 2005 Adults
Fukuda 2007 Male >60 y
Virtanen 2007 Female 1-19 cig
Pomerleau 2004 Female
Silvestre Garcia 1990 Low
Hajat 2010 U.S.2010 Adults
Menezes 2008 Brazil Female 2000-2005 Adults
Wister 1996 45-64 y
Webb 2008 G3 Female
White 2008 Australia2002 <15
Thomas 2008 Low
White 2008 Australia1999 <15
Kaleta 2007 Low
Schumann 2011 Germany Female 2006 Adults White
Mohsin 2010 Australia Female 2005-2007 Adults
Shavers 2005 American natives
Li 2012 U.S. Male 2002-2003 Adults
White 2008 Australia1990 <15
Patrick 2012 U.S. 2005-2007 NR
Aekplakorn 2008 Thailand Male 2004 Adults
Cohen 2011 U.S. Female Adults White
Laaksonen 2003 Female
Virtanen 2007 Female CS
1.45 (1.35, 1.56)
0.72 (0.52, 1.00)
2.13 (1.85, 2.45)
1.29 (1.17, 1.42)
1.17 (0.93, 1.47)
0.90 (0.73, 1.11)
1.02 (0.72, 1.44)
1.52 (1.26, 1.83)
0.52 (0.31, 0.87)
0.83 (0.77, 0.90)
1.92 (0.18, 20.15)
1.50 (1.02, 2.21)
0.95 (0.66, 1.38)
1.75 (1.55, 1.98)
1.04 (1.02, 1.07)
2.00 (1.20, 3.33)
1.34 (1.18, 1.52)
2.84 (2.50, 3.23)
0.86 (0.70, 1.06)
0.74 (0.22, 2.52)
1.28 (1.00, 1.64)
1.15 (0.95, 1.39)
1.84 (1.57, 2.16)
2.26 (1.96, 2.61)
1.54 (1.28, 1.85)
1.60 (1.00, 2.56)
1.04 (0.83, 1.31)
1.00 (0.67, 1.49)
0.50 (0.31, 0.80)
1.68 (1.43, 1.97)
1.19 (1.02, 1.39)
1.30 (0.70, 2.41)
1.69 (1.47, 1.95)
1.73 (1.08, 2.77)
1.10 (0.93, 1.30)
1.89 (1.35, 2.65)
0.95 (0.91, 0.99)
1.13 (0.84, 1.52)
1.12 (0.61, 2.06)
2.01 (1.53, 2.64)
1.30 (1.10, 1.54)
0.91 (0.59, 1.40)
1.32 (0.67, 2.60)
0.87 (0.41, 1.85)
1.47 (1.33, 1.62)
0.96 (0.41, 2.25)
0.83 (0.64, 1.08)
1.53 (1.37, 1.71)
2.30 (1.61, 3.29)
1.21 (0.95, 1.53)
0.93 (0.43, 2.01)
1.25 (0.50, 3.12)
2.86 (1.33, 6.12)
1.25 (0.50, 3.12)
1.43 (0.72, 2.82)
1.90 (1.40, 2.58)
1.58 (1.28, 1.95)
1.36 (1.14, 1.62)
1.83 (1.36, 2.46)
0.97 (0.70, 1.34)
1.64 (1.30, 2.07)
1.40 (1.11, 1.77)
1.70 (1.20, 2.41)
2.10 (0.80, 5.51)
Odds
1.91 (1.66, 2.20)
2.29 (1.08, 4.86)
1.01 (0.89, 1.15)
1.30 (1.10, 1.54)
1.00 (0.42, 2.40)
1.65 (0.93, 2.91)
0.74 (0.26, 2.15)
1.68 (1.38, 2.05)
1.49 (1.26, 1.76)
0.83 (0.69, 0.99)
2.17 (1.52, 3.12)
1.36 (1.19, 1.55)
1.45 (1.23, 1.71)
2.60 (1.61, 4.20)
2.34 (1.91, 2.87)
1.31 (1.20, 1.43)
ratio (95% CI)
1.01 (0.98, 1.03)
1.00 (0.56, 1.80)
1.43 (1.12, 1.82)
1.82 (1.38, 2.40)
1.98 (1.56, 2.51)
2.04 (1.39, 2.99)
0.90 (0.61, 1.33)
1.36 (1.26, 1.47)
2.96 (1.41, 6.21)
1.43 (1.26, 1.62)
2.70 (1.35, 5.41)
1.03 (0.84, 1.26)
0.72 (0.52, 1.00)
3.45 (3.23, 3.69)
1.11 (0.36, 3.41)
1.22 (0.75, 1.98)
1.01 (0.94, 1.09)
1.79 (1.56, 2.05)
3.70 (1.50, 9.13)
2.42 (1.97, 2.96)
2.70 (2.60, 2.80)
1.55 (1.53, 1.57)
2.01 (0.99, 4.08)
1.49 (1.23, 1.80)
1.77 (1.35, 2.32)
0.80 (0.65, 0.98)
0.79 (0.64, 0.97)
1.56 (1.27, 1.92)
1.91 (1.59, 2.29)
1.00 (0.56, 1.78)
1.40 (1.22, 1.61)
1.84 (1.62, 2.09)
3.70 (1.60, 8.56)
2.13 (2.04, 2.22)
2.86 (1.82, 4.49)
2.56 (1.35, 4.87)
0.83 (0.70, 0.98)
1.77 (1.64, 1.91)
1.19 (0.71, 1.99)
4.17 (1.67, 10.42)
0.85 (0.53, 1.37)
2.80 (1.70, 4.61)
1.58 (1.05, 2.38)
1.87 (1.08, 3.24)
0.42 (0.37, 0.47)
1.82 (1.41, 2.35)
1.54 (1.16, 2.04)
1.67 (1.49, 1.87)
1.01 (0.98, 1.05)
2.03 (1.76, 2.34)
1.79 (1.74, 1.84)
1.60 (1.36, 1.88)
1.92 (1.81, 2.04)
1.94 (1.38, 2.73)
1.02 (1.00, 1.05)
5.40 (4.10, 7.11)
0.93 (0.69, 1.26)
0.89 (0.64, 1.24)
1.37 (0.83, 2.26)
2.02 (1.17, 3.49)
2.04 (1.98, 2.10)
3.81 (2.90, 5.01)
1.03 (0.97, 1.09)
1.24 (1.08, 1.42)
1.23 (1.05, 1.44)
1.18 (0.82, 1.69)
0.67 (0.40, 1.12)
2.10 (1.41, 3.13)
1.94 (1.25, 3.01)
1.65 (1.28, 2.13)
3.70 (2.22, 6.17)
1.03 (0.82, 1.30)
2.50 (1.96, 3.19)
1.12 (0.91, 1.39)
0.85 (0.72, 1.02)
5.41 (1.62, 18.07)
5.70 (5.50, 5.91)
1.84 (1.04, 3.26)
1.10 (0.56, 2.14)
0.87 (0.72, 1.04)
0.26 (0.14, 0.48)
1.67 (1.43, 1.94)
2.04 (1.76, 2.36)
1.30 (1.07, 1.58)
1.25 (1.06, 1.47)
100.00
0.63
0.71
0.72
0.68
0.68
0.62
0.69
0.53
0.72
0.08
0.60
0.61
0.71
0.72
0.53
0.71
0.71
0.68
0.23
0.67
0.69
0.70
0.71
0.69
0.55
0.67
0.59
0.55
0.70
0.70
0.47
0.71
0.55
0.70
0.63
0.72
0.65
0.48
0.66
0.70
0.57
0.44
0.40
0.72
0.36
0.66
0.71
0.62
0.67
0.39
0.33
0.40
0.33
0.44
0.64
0.68
0.69
0.65
0.63
0.67
0.67
0.62
0.31
%
0.71
0.40
0.71
0.70
0.35
0.50
0.28
0.69
0.70
0.69
0.61
0.71
0.70
0.55
0.69
0.72
Weight
0.72
0.49
0.67
0.65
0.67
0.60
0.60
0.72
0.41
0.71
0.43
0.68
0.63
0.72
0.26
0.54
0.72
0.71
0.34
0.69
0.72
0.72
0.43
0.69
0.66
0.69
0.68
0.68
0.69
0.49
0.71
0.71
0.36
0.72
0.56
0.46
0.70
0.72
0.53
0.33
0.55
0.54
0.59
0.51
0.71
0.66
0.65
0.71
0.72
0.70
0.72
0.70
0.72
0.62
0.72
0.66
0.65
0.63
0.54
0.51
0.72
0.66
0.72
0.71
0.70
0.61
0.53
0.59
0.57
0.66
0.53
0.68
0.67
0.68
0.70
0.24
0.72
0.50
0.45
0.69
0.47
0.70
0.70
0.69
0.70
1.0496 1 20.2
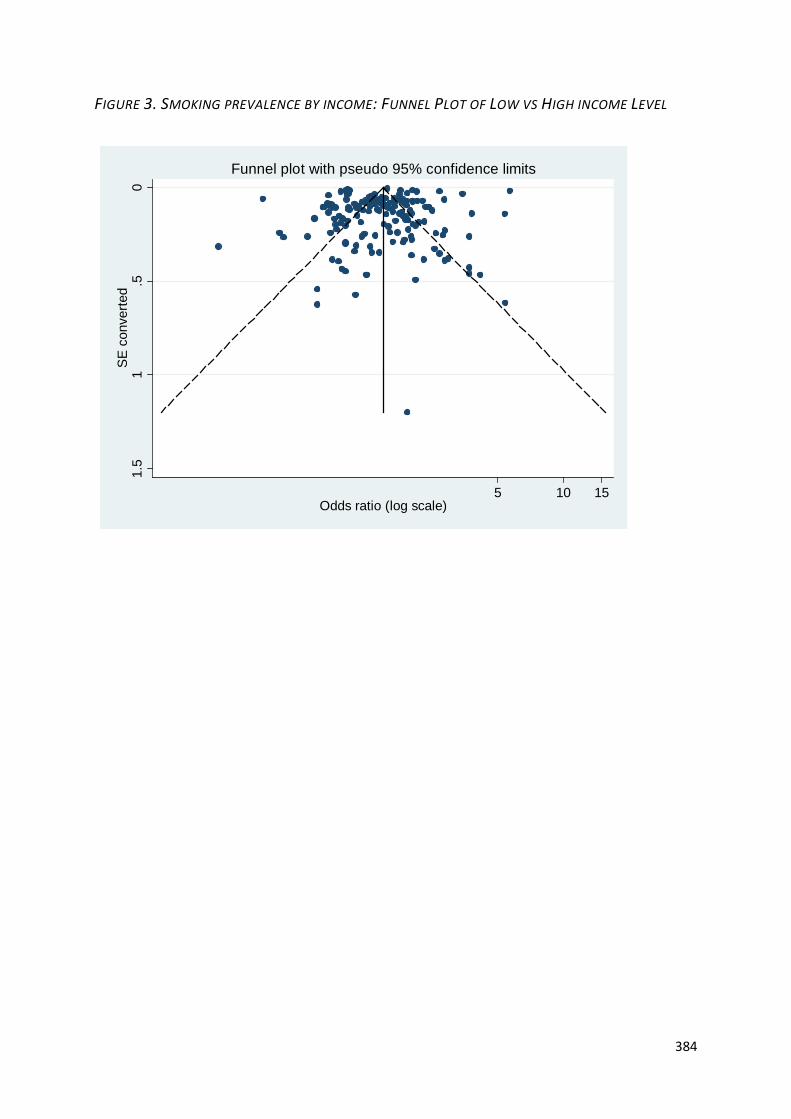
384
FIGURE 3. SMOKING PREVALENCE BY INCOME: FUNNEL PLOT OF LOW VS HIGH INCOME LEVEL
0.5
11.
5S
E c
onve
rted
5 10 15Odds ratio (log scale)
Funnel plot with pseudo 95% confidence limits
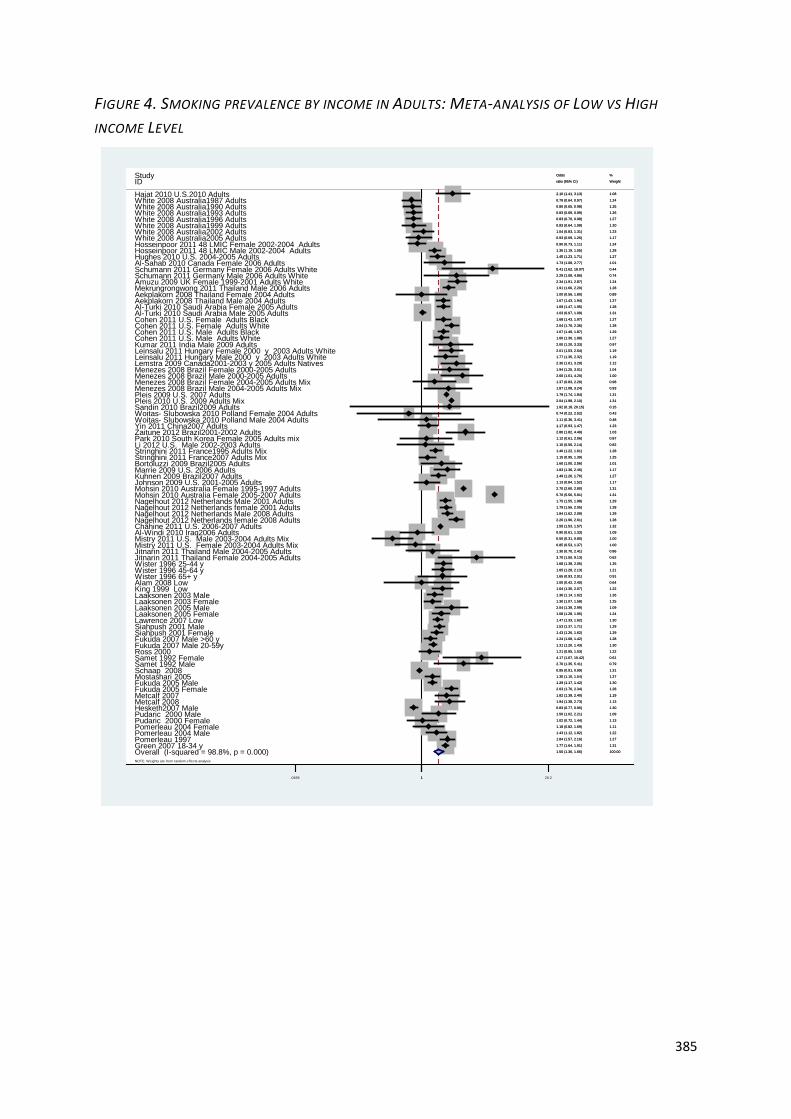
385
FIGURE 4. SMOKING PREVALENCE BY INCOME IN ADULTS: META-ANALYSIS OF LOW VS HIGH
INCOME LEVEL
NOTE: Weights are from random effects analysis
Overall (I-squared = 98.8%, p = 0.000)
Amuzu 2009 UK Female 1999-2001 Adults White
Mostashari 2005
Kuhnen 2009 Brazil2007 Adults
Mekrungrongwong 2011 Thailand Male 2006 Adults
Mohsin 2010 Australia Female 1995-1997 Adults
White 2008 Australia1987 Adults
King 1999 LowWister 1996 65+ y
Fukuda 2005 Female
Aekplakorn 2008 Thailand Female 2004 Adults
Ross 2000
Sandin 2010 Brazil2009 AdultsPleis 2010 U.S. 2009 Adults Mix
Green 2007 18-34 y
ID
Yin 2011 China2007 Adults
Pomerleau 1997Pomerleau 2004 Male
Metcalf 2007
Siahpush 2001 Female
Schaap 2008
Zaitune 2012 Brazil2001-2002 Adults
Cohen 2011 U.S. Male Adults Black
Li 2012 U.S. Male 2002-2003 Adults
Laaksonen 2003 Female
Pomerleau 2004 FemalePudaric 2000 Male
Bortoluzzi 2009 Brazil2005 Adults
Woitas- Slubowska 2010 Polland Male 2004 Adults
Hosseinpoor 2011 48 LMIC Male 2002-2004 Adults
Laaksonen 2003 Male
Menezes 2008 Brazil Female 2000-2005 Adults
Jitnarin 2011 Thailand Male 2004-2005 AdultsMistry 2011 U.S. Female 2003-2004 Adults Mix
Lawrence 2007 LowSiahpush 2001 Male
Chahine 2011 U.S. 2006-2007 Adults
Marrie 2009 U.S. 2006 Adults
Fukuda 2007 Male >60 y
Hosseinpoor 2011 48 LMIC Female 2002-2004 Adults
Cohen 2011 U.S. Female Adults White
Pudaric 2000 Female
Samet 1992 Male
Nagelhout 2012 Netherlands Male 2001 Adults
Menezes 2008 Brazil Female 2004-2005 Adults Mix
Wister 1996 25-44 y
Metcalf 2008
Nagelhout 2012 Netherlands Male 2008 Adults
Cohen 2011 U.S. Male Adults White
Laaksonen 2005 MaleLaaksonen 2005 Female
Lemstra 2009 Canada2001-2003 y 2005 Adults Natives
White 2008 Australia2002 Adults
Schumann 2011 Germany Male 2006 Adults White
Hajat 2010 U.S.2010 Adults
Mohsin 2010 Australia Female 2005-2007 Adults
Aekplakorn 2008 Thailand Male 2004 Adults
Fukuda 2007 Male 20-59y
Mistry 2011 U.S. Male 2003-2004 Adults Mix
Johnson 2009 U.S. 2001-2005 Adults
White 2008 Australia1999 Adults
Jitnarin 2011 Thailand Female 2004-2005 Adults
Stringhini 2011 France2007 Adults Mix
Leinsalu 2011 Hungary Female 2000 y 2003 Adults White
Pleis 2009 U.S. 2007 Adults
Park 2010 South Korea Female 2005 Adults mix
Al-Windi 2010 Iraq2006 Adults
Study
Hesketh2007 Male
Cohen 2011 U.S. Female Adults BlackAl-Turki 2010 Saudi Arabia Male 2005 Adults
Woitas- Slubowska 2010 Polland Female 2004 Adults
White 2008 Australia1993 Adults
White 2008 Australia2005 Adults
Leinsalu 2011 Hungary Male 2000 y 2003 Adults White
Al-Turki 2010 Saudi Arabia Female 2005 Adults
Samet 1992 Female
Schumann 2011 Germany Female 2006 Adults WhiteAl-Sahab 2010 Canada Female 2006 Adults
Kumar 2011 India Male 2009 Adults
Wister 1996 45-64 y
Menezes 2008 Brazil Male 2004-2005 Adults Mix
Nagelhout 2012 Netherlands female 2008 Adults
Hughes 2010 U.S. 2004-2005 Adults
Nagelhout 2012 Netherlands female 2001 Adults
White 2008 Australia1996 Adults
Stringhini 2011 France1995 Adults Mix
White 2008 Australia1990 Adults
Fukuda 2005 Male
Menezes 2008 Brazil Male 2000-2005 Adults
Alam 2008 Low
1.50 (1.36, 1.66)
2.34 (1.91, 2.87)
1.30 (1.10, 1.54)
1.49 (1.26, 1.76)
1.91 (1.66, 2.20)
2.70 (2.60, 2.80)
0.79 (0.64, 0.97)
1.64 (1.30, 2.07)
1.65 (0.93, 2.91)
2.03 (1.76, 2.34)
1.00 (0.56, 1.80)
1.21 (0.95, 1.53)
1.92 (0.18, 20.15)
2.04 (1.98, 2.10)
1.77 (1.64, 1.91)
ratio (95% CI)
1.17 (0.93, 1.47)
1.84 (1.57, 2.16)
1.43 (1.12, 1.82)
1.82 (1.38, 2.40)
1.43 (1.26, 1.62)
0.95 (0.91, 0.99)
2.86 (1.82, 4.49)
1.67 (1.49, 1.87)
1.10 (0.56, 2.14)
1.30 (1.07, 1.58)
1.18 (0.82, 1.69)
1.50 (1.02, 2.21)
1.60 (1.00, 2.56)
1.11 (0.36, 3.41)
1.36 (1.19, 1.55)
1.36 (1.14, 1.62)
1.94 (1.25, 3.01)
1.30 (0.70, 2.41)
0.85 (0.53, 1.37)
1.47 (1.33, 1.62)
1.53 (1.37, 1.71)
1.55 (1.53, 1.57)
1.83 (1.36, 2.46)
1.24 (1.08, 1.42)
0.90 (0.73, 1.11)
2.04 (1.76, 2.36)
1.02 (0.72, 1.44)
2.70 (1.35, 5.41)
1.75 (1.55, 1.98)
1.37 (0.83, 2.26)
1.68 (1.38, 2.05)
1.94 (1.38, 2.73)
1.84 (1.62, 2.09)
1.60 (1.36, 1.88)
2.04 (1.39, 2.99)
1.58 (1.28, 1.95)
2.30 (1.61, 3.29)
1.04 (0.83, 1.31)
2.29 (1.08, 4.86)
2.10 (1.41, 3.13)
5.70 (5.50, 5.91)
1.67 (1.43, 1.94)
1.31 (1.20, 1.43)
0.50 (0.31, 0.80)
1.13 (0.84, 1.52)
0.83 (0.64, 1.08)
3.70 (1.50, 9.13)
1.15 (0.95, 1.39)
2.01 (1.53, 2.64)
1.79 (1.74, 1.84)
1.12 (0.61, 2.06)
0.90 (0.61, 1.33)
Odds
0.83 (0.77, 0.90)
1.68 (1.43, 1.97)
1.03 (0.97, 1.09)
0.74 (0.22, 2.52)
0.83 (0.69, 0.99)
0.93 (0.69, 1.26)
1.77 (1.35, 2.32)
1.69 (1.47, 1.95)
4.17 (1.67, 10.42)
5.41 (1.62, 18.07)
1.73 (1.08, 2.77)
2.00 (1.20, 3.33)
1.65 (1.28, 2.13)
1.87 (1.08, 3.24)
2.26 (1.96, 2.61)
1.45 (1.23, 1.71)
1.79 (1.56, 2.05)
0.83 (0.70, 0.98)
1.40 (1.22, 1.61)
0.80 (0.65, 0.98)
1.29 (1.17, 1.42)
2.60 (1.61, 4.20)
1.00 (0.42, 2.40)
100.00
1.24
1.27
1.27
1.28
1.31
1.24
1.22
0.91
1.28
0.89
1.22
0.15
1.31
1.31
Weight
1.23
1.27
1.22
1.19
1.29
1.31
1.03
1.29
0.82
1.25
1.11
1.09
1.01
0.48
1.28
1.26
1.04
0.86
1.00
1.30
1.29
1.32
1.17
1.28
1.24
1.28
1.13
0.79
1.29
0.98
1.25
1.13
1.29
1.27
1.09
1.24
1.12
1.23
0.74
1.08
1.31
1.27
1.30
1.00
1.17
1.20
0.62
1.25
1.19
1.31
0.87
1.09
%
1.30
1.27
1.31
0.43
1.26
1.17
1.19
1.28
0.61
0.44
1.01
0.97
1.21
0.93
1.28
1.27
1.28
1.27
1.28
1.25
1.30
1.00
0.64
1.0496 1 20.2
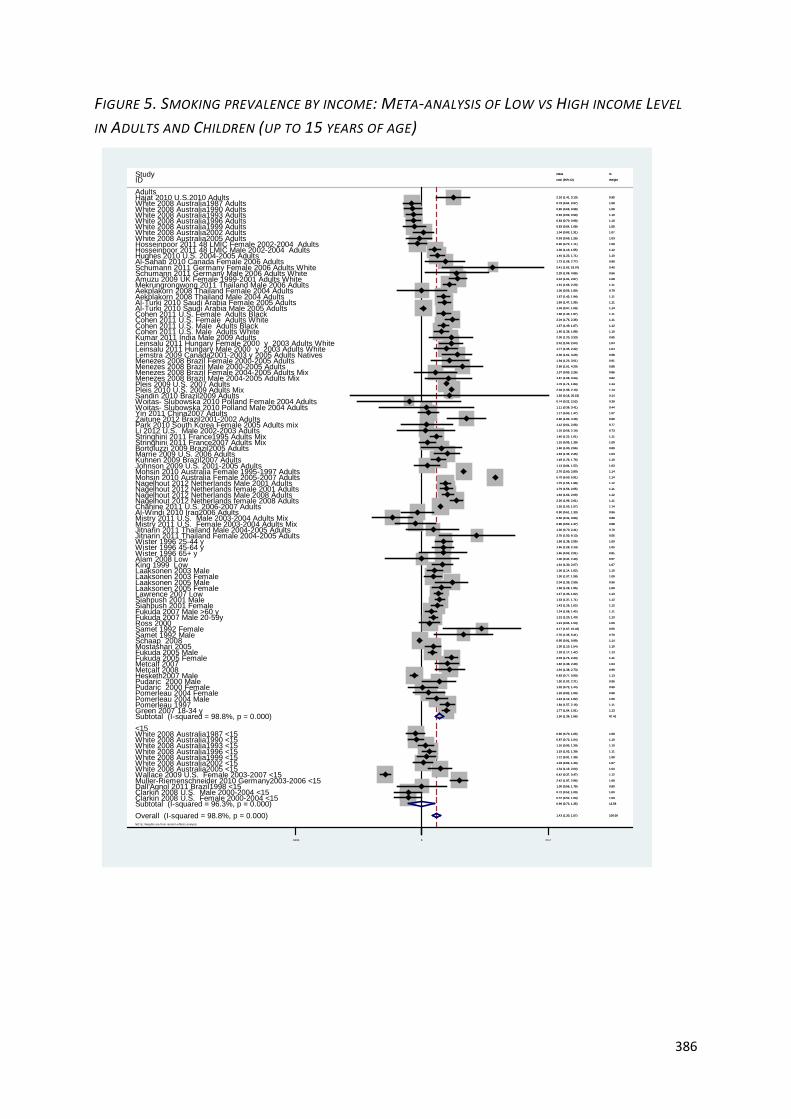
386
FIGURE 5. SMOKING PREVALENCE BY INCOME: META-ANALYSIS OF LOW VS HIGH INCOME LEVEL
IN ADULTS AND CHILDREN (UP TO 15 YEARS OF AGE)
NOTE: Weights are from random effects analysis
.
.
Overall (I-squared = 98.8%, p = 0.000)
Lemstra 2009 Canada2001-2003 y 2005 Adults Natives
Hughes 2010 U.S. 2004-2005 Adults
Pleis 2010 U.S. 2009 Adults Mix
Clarkin 2008 U.S. Male 2000-2004 <15
Nagelhout 2012 Netherlands female 2008 Adults
Sandin 2010 Brazil2009 Adults
Hesketh2007 Male
White 2008 Australia1996 <15
Metcalf 2007
Cohen 2011 U.S. Male Adults Black
Wister 1996 65+ y
Pudaric 2000 Male
Muller-Riemenschneider 2010 Germany2003-2006 <15
Mistry 2011 U.S. Female 2003-2004 Adults Mix
Mohsin 2010 Australia Female 2005-2007 Adults
Pomerleau 1997
Marrie 2009 U.S. 2006 Adults
Menezes 2008 Brazil Female 2004-2005 Adults Mix
Leinsalu 2011 Hungary Male 2000 y 2003 Adults White
White 2008 Australia1999 <15
Subtotal (I-squared = 96.3%, p = 0.000)
Al-Windi 2010 Iraq2006 Adults
Aekplakorn 2008 Thailand Female 2004 Adults
Pleis 2009 U.S. 2007 Adults
Al-Turki 2010 Saudi Arabia Female 2005 Adults
Green 2007 18-34 y
White 2008 Australia2005 <15Wallace 2009 U.S. Female 2003-2007 <15
Fukuda 2005 Female
Hajat 2010 U.S.2010 Adults
Hosseinpoor 2011 48 LMIC Female 2002-2004 Adults
Clarkin 2008 U.S. Female 2000-2004 <15
Al-Turki 2010 Saudi Arabia Male 2005 Adults
Mekrungrongwong 2011 Thailand Male 2006 Adults
Laaksonen 2005 Male
ID
White 2008 Australia1987 Adults
Mohsin 2010 Australia Female 1995-1997 Adults
Leinsalu 2011 Hungary Female 2000 y 2003 Adults White
White 2008 Australia2002 Adults
Cohen 2011 U.S. Female Adults Black
Nagelhout 2012 Netherlands Male 2008 Adults
Siahpush 2001 Male
Schumann 2011 Germany Female 2006 Adults White
<15
Pudaric 2000 Female
Hosseinpoor 2011 48 LMIC Male 2002-2004 Adults
Jitnarin 2011 Thailand Female 2004-2005 Adults
Chahine 2011 U.S. 2006-2007 Adults
Jitnarin 2011 Thailand Male 2004-2005 Adults
Schaap 2008
Wister 1996 45-64 y
Johnson 2009 U.S. 2001-2005 Adults
White 2008 Australia1993 <15
Yin 2011 China2007 Adults
Fukuda 2007 Male 20-59y
Samet 1992 Male
Pomerleau 2004 Female
Aekplakorn 2008 Thailand Male 2004 Adults
Bortoluzzi 2009 Brazil2005 AdultsKuhnen 2009 Brazil2007 Adults
White 2008 Australia1999 Adults
Park 2010 South Korea Female 2005 Adults mix
Pomerleau 2004 Male
White 2008 Australia2005 Adults
Laaksonen 2003 Male
Li 2012 U.S. Male 2002-2003 Adults
White 2008 Australia1987 <15
Stringhini 2011 France2007 Adults Mix
Schumann 2011 Germany Male 2006 Adults White
Fukuda 2005 Male
Ross 2000
Mistry 2011 U.S. Male 2003-2004 Adults Mix
Menezes 2008 Brazil Male 2004-2005 Adults Mix
Nagelhout 2012 Netherlands Male 2001 Adults
Siahpush 2001 Female
Woitas- Slubowska 2010 Polland Male 2004 Adults
Lawrence 2007 Low
Metcalf 2008
Nagelhout 2012 Netherlands female 2001 Adults
Kumar 2011 India Male 2009 Adults
Laaksonen 2003 Female
Stringhini 2011 France1995 Adults Mix
Cohen 2011 U.S. Female Adults White
White 2008 Australia2002 <15
Fukuda 2007 Male >60 y
King 1999 LowAlam 2008 Low
Mostashari 2005
Laaksonen 2005 Female
Amuzu 2009 UK Female 1999-2001 Adults White
White 2008 Australia1990 <15
Dall'Agnol 2011 Brazil1998 <15
Al-Sahab 2010 Canada Female 2006 Adults
Woitas- Slubowska 2010 Polland Female 2004 Adults
Wister 1996 25-44 y
Subtotal (I-squared = 98.8%, p = 0.000)
Menezes 2008 Brazil Male 2000-2005 Adults
Zaitune 2012 Brazil2001-2002 Adults
Menezes 2008 Brazil Female 2000-2005 Adults
White 2008 Australia1996 AdultsWhite 2008 Australia1993 AdultsWhite 2008 Australia1990 Adults
Cohen 2011 U.S. Male Adults White
Samet 1992 Female
Adults
Study
1.43 (1.30, 1.57)
2.30 (1.61, 3.29)
1.45 (1.23, 1.71)
2.04 (1.98, 2.10)
0.72 (0.52, 1.00)
2.26 (1.96, 2.61)
1.92 (0.18, 20.15)
0.83 (0.77, 0.90)
1.19 (1.02, 1.39)
1.82 (1.38, 2.40)
1.67 (1.49, 1.87)
1.65 (0.93, 2.91)
1.50 (1.02, 2.21)
2.42 (1.97, 2.96)
0.85 (0.53, 1.37)
5.70 (5.50, 5.91)
1.84 (1.57, 2.16)
1.83 (1.36, 2.46)
1.37 (0.83, 2.26)
1.77 (1.35, 2.32)
1.12 (0.91, 1.39)
0.99 (0.73, 1.35)
0.90 (0.61, 1.33)
1.00 (0.56, 1.80)
1.79 (1.74, 1.84)
1.69 (1.47, 1.95)
1.77 (1.64, 1.91)
1.54 (1.16, 2.04)
0.42 (0.37, 0.47)
2.03 (1.76, 2.34)
2.10 (1.41, 3.13)
0.90 (0.73, 1.11)
0.72 (0.52, 1.00)
1.03 (0.97, 1.09)
1.91 (1.66, 2.20)
2.04 (1.39, 2.99)
ratio (95% CI)
0.79 (0.64, 0.97)
2.70 (2.60, 2.80)
2.01 (1.53, 2.64)
1.04 (0.83, 1.31)
1.68 (1.43, 1.97)
1.84 (1.62, 2.09)
1.53 (1.37, 1.71)
5.41 (1.62, 18.07)
1.02 (0.72, 1.44)
1.36 (1.19, 1.55)
3.70 (1.50, 9.13)
1.55 (1.53, 1.57)
1.30 (0.70, 2.41)
0.95 (0.91, 0.99)
1.65 (1.28, 2.13)
1.13 (0.84, 1.52)
1.10 (0.93, 1.30)
1.17 (0.93, 1.47)
1.31 (1.20, 1.43)
2.70 (1.35, 5.41)
1.18 (0.82, 1.69)
1.67 (1.43, 1.94)
1.60 (1.00, 2.56)
1.49 (1.26, 1.76)
0.83 (0.64, 1.08)
1.12 (0.61, 2.06)
1.43 (1.12, 1.82)
0.93 (0.69, 1.26)
1.36 (1.14, 1.62)
1.10 (0.56, 2.14)
0.86 (0.70, 1.06)
1.15 (0.95, 1.39)
2.29 (1.08, 4.86)
1.29 (1.17, 1.42)
1.21 (0.95, 1.53)
0.50 (0.31, 0.80)
1.87 (1.08, 3.24)
1.75 (1.55, 1.98)
1.43 (1.26, 1.62)
1.11 (0.36, 3.41)
1.47 (1.33, 1.62)
1.94 (1.38, 2.73)
1.79 (1.56, 2.05)
2.00 (1.20, 3.33)
1.30 (1.07, 1.58)
1.40 (1.22, 1.61)
2.04 (1.76, 2.36)
1.03 (0.82, 1.30)
1.24 (1.08, 1.42)
1.64 (1.30, 2.07)
1.00 (0.42, 2.40)
1.30 (1.10, 1.54)
1.58 (1.28, 1.95)
2.34 (1.91, 2.87)
0.87 (0.72, 1.04)
1.00 (0.56, 1.78)
1.73 (1.08, 2.77)
0.74 (0.22, 2.52)
1.68 (1.38, 2.05)
1.50 (1.36, 1.66)
2.60 (1.61, 4.20)
2.86 (1.82, 4.49)
1.94 (1.25, 3.01)
0.83 (0.70, 0.98)
0.83 (0.69, 0.99)
0.80 (0.65, 0.98)
1.60 (1.36, 1.88)
4.17 (1.67, 10.42)
Odds
100.00
0.98
1.10
1.14
1.00
1.11
0.14
1.13
1.11
1.04
1.12
0.81
0.96
1.08
0.88
1.14
1.11
1.03
0.86
1.04
1.08
12.59
0.96
0.79
1.14
1.11
1.13
1.04
1.12
1.11
0.95
1.08
1.00
1.14
1.11
0.96
Weight
1.08
1.14
1.04
1.07
1.11
1.12
1.12
0.40
0.99
1.12
0.56
1.14
0.76
1.14
1.05
1.03
1.10
1.07
1.13
0.70
0.98
1.11
0.89
1.10
1.05
0.77
1.06
1.03
1.10
0.73
1.08
1.09
0.66
1.13
1.06
0.88
0.82
1.12
1.12
0.44
1.13
0.99
1.11
0.85
1.09
1.11
1.11
1.07
1.11
1.07
0.57
1.10
1.08
1.08
1.10
0.80
0.89
0.39
1.09
87.41
0.88
0.90
0.91
1.10
1.10
1.08
1.10
0.55
%
1.0496 1 20.2
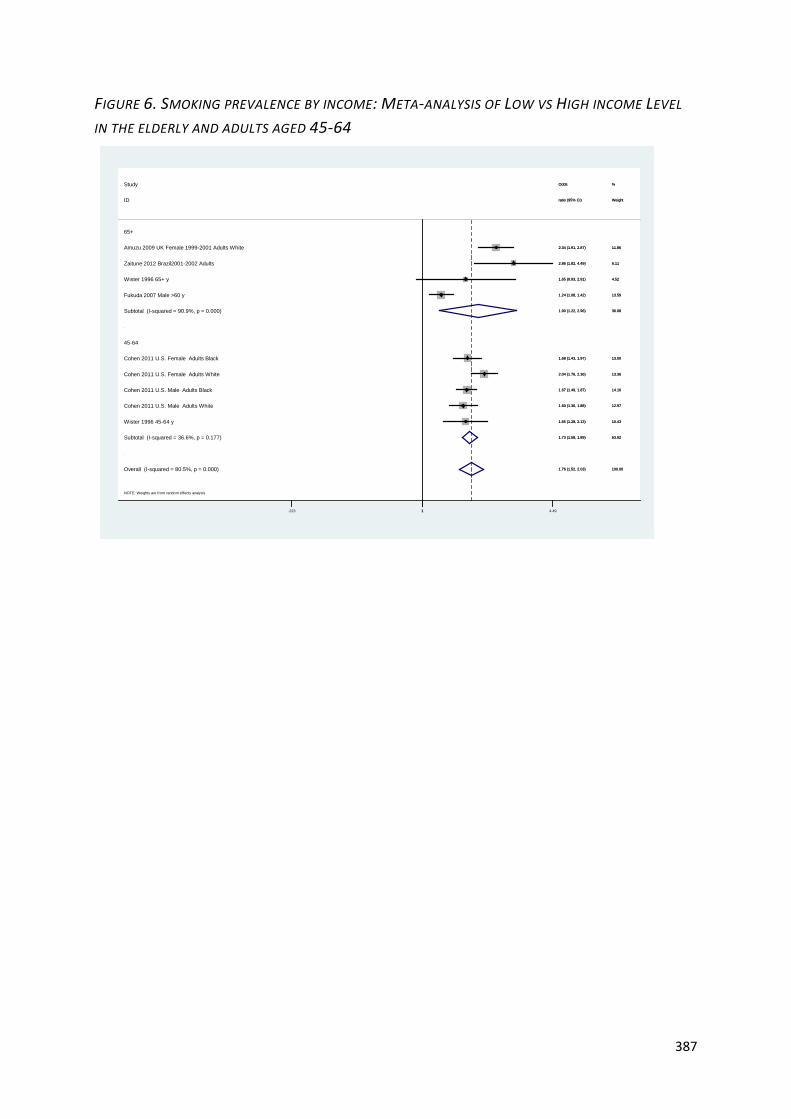
387
FIGURE 6. SMOKING PREVALENCE BY INCOME: META-ANALYSIS OF LOW VS HIGH INCOME LEVEL
IN THE ELDERLY AND ADULTS AGED 45-64
NOTE: Weights are from random effects analysis
.
.
Overall (I-squared = 80.5%, p = 0.000)
45-64
65+
Wister 1996 65+ y
Cohen 2011 U.S. Male Adults White
Cohen 2011 U.S. Female Adults White
Cohen 2011 U.S. Male Adults Black
Cohen 2011 U.S. Female Adults Black
Wister 1996 45-64 y
ID
Subtotal (I-squared = 90.9%, p = 0.000)
Subtotal (I-squared = 36.6%, p = 0.177)
Zaitune 2012 Brazil2001-2002 Adults
Amuzu 2009 UK Female 1999-2001 Adults White
Fukuda 2007 Male >60 y
Study
1.76 (1.52, 2.03)
1.65 (0.93, 2.91)
1.60 (1.36, 1.88)
2.04 (1.76, 2.36)
1.67 (1.49, 1.87)
1.68 (1.43, 1.97)
1.65 (1.28, 2.13)
ratio (95% CI)
1.90 (1.22, 2.96)
1.73 (1.58, 1.89)
2.86 (1.82, 4.49)
2.34 (1.91, 2.87)
1.24 (1.08, 1.42)
Odds
100.00
4.52
12.97
13.36
14.16
13.00
10.43
Weight
36.08
63.92
6.11
11.86
13.59
%
1.223 1 4.49
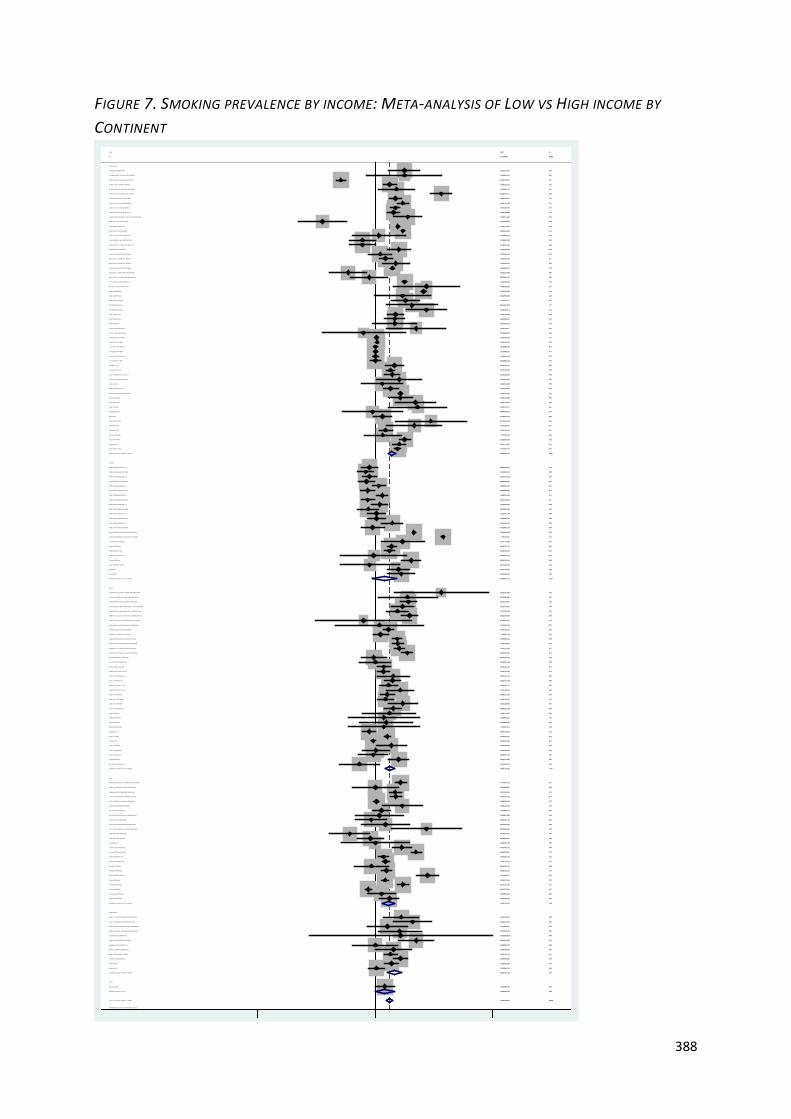
388
FIGURE 7. SMOKING PREVALENCE BY INCOME: META-ANALYSIS OF LOW VS HIGH INCOME BY
CONTINENT
NOTE: Weights are from random effects analysis
.
.
.
.
.
.
Overall (I-squared = 98.8%, p = 0.000)
White 2008 Australia1999 <15
Laaksonen 2003 Male
Pomerleau 1997
Marinho 2008
Green 2007 18-34 y
Al-Turki 2010 Saudi Arabia Female 2005 Adults
Thomas 2008 Low
Mohsin 2010 Australia Female 1995-1997 Adults
Gilmore 2001 Male
Pudule 1999 Male
Watson 2003 Female
Jitnarin 2011 Thailand Male 2004-2005 Adults
White 2008 Australia2005 <15
Virtanen 2007 Female 20+ cig
White 2008 Australia1990 <15
Moreira 1995
Fukuda 2007 Female >60 y
Al-Windi 2010 Iraq2006 Adults
Aekplakorn 2008 Thailand Female 2004 Adults
Fukuda 2007 Male 20-59y
Kim 2006-JPMPH Female
Subtotal (I-squared = .%, p = .)
Fukuda 2007 Male >60 y
Nagelhout 2012 Netherlands female 2008 Adults
Fukuda 2005 Female
Metcalf 2007
Mitra 2012 U.S. female 2007-2009 All
Menezes 2008 Brazil Female 2004-2005 Adults Mix
Virtanen 2007 Male CS
Coreil 1991 40-64 Female
South America
Fagan 2008-NTR
Wister 1996 25-44 y
Singh 1997 India Female 1991
Fukuda 2005 Male
Fukuda 2007 Female 20-59y
Dall'Agnol 2011 Brazil1998 <15
Subtotal (I-squared = 92.5%, p = 0.000)
Kuhnen 2009 Brazil2007 Adults
Europe
Metcalf 2008
White 2008 Australia1990 Adults
Shavers 2005
Rahman 2005 Male
Samet 1992 Male
Menezes 2008 Brazil Male 2004-2005 Adults Mix
Kaleta 2007 Low
Kim 2006-JPMPH Male
Singh 1997 India Male 1991
Wister 1996 45-64 y
Khuwaja 2004 Male
Turrell 2002 Australia1995
Laaksonen 2003 Female
Mody 2006 USA1996
Erick-Peleti 2007 Female
Coreil 1991 20-39 Female
Clarkin 2008 U.S. Female 2000-2004 <15
Wallace 2009 U.S. Female 2003-2007 <15
White 2008 Australia2005 Adults
Coreil 1991 65-74 Male
Gilmore 2001 Female
Laaksonen 2005 Female
Ross 2000
Mohsin 2010 Australia Female 2005-2007 Adults
Siahpush 2001 Male
Zaitune 2012 Brazil2001-2002 Adults
Kumar 2011 India Male 2009 Adults
Virtanen 2007 Female 1-19 cig
Shavers 2005 American natives
Al-Sahab 2010 Canada Female 2006 Adults
Pudule 1999 Female
Sandin 2010 Brazil2009 Adults
Virtanen 2007 Male 1-19 cig
Pomerleau 2004 Male
White 2008 Australia2002 <15
White 2008 Australia2002 Adults
Subtotal (I-squared = 69.4%, p = 0.000)
Woitas- Slubowska 2010 Polland Female 2004 Adults
Muller-Riemenschneider 2010 Germany2003-2006 <15
Anaya Ocampo 2006 Male
Amuzu 2009 UK Female 1999-2001 Adults White
Leinsalu 2011 Hungary Female 2000 y 2003 Adults White
Schumann 2011 Germany Male 2006 Adults White
Mitra 2012 U.S. female 2007-2009 All
ID
Africa
Oceania
Samet 1992 Female
Coreil 1991 40-64 Male
Pomerleau 2004 Female
Webb 2008 G3 Female
White 2008 Australia1993 <15
Bortoluzzi 2009 Brazil2005 Adults
Tehranifar 2009 U.S. Female 2001-2006 NR
Parna 2002 Estonia Male 1996
Mistry 2011 U.S. Male 2003-2004 Adults Mix
Hesketh2007 Male
Lawrence 2007 Low
Subtotal (I-squared = 95.2%, p = 0.000)
Leinsalu 2011 Hungary Male 2000 y 2003 Adults White
White 2008 Australia1999 Adults
White 2008 Australia1996 Adults
Al-Turki 2010 Saudi Arabia Male 2005 Adults
Kahn 2005 Female
Pleis 2009 U.S. 2007 Adults
White 2008 Australia1993 Adults
Parna 2002 Estonia Female 1996
King 1999 Low
White 2008 Australia1987 Adults
Virtanen 2007 Female CS
Webb 2008 G2 Female
Stringhini 2011 France2007 Adults Mix
Mekrungrongwong 2011 Thailand Male 2006 Adults
Menezes 2008 Brazil Female 2000-2005 Adults
Lemstra 2009 Canada2001-2003 y 2005 Adults Natives
Siahpush 2001 Female
Kiefe 2001 Male
Mostashari 2005
Shapo 2003 Female
Reijneveld 2002
Alam 2008 Low
Yin 2011 China2007 Adults
Nagelhout 2012 Netherlands Male 2008 Adults
Asia
White 2008 Australia1996 <15
Shavers 2005 non-Hispanic whites
Stringhini 2011 France1995 Adults Mix
Shavers 2005 African Americans
Schumann 2011 Germany Female 2006 Adults White
Pudaric 2000 Female
Anaya Ocampo 2006 Female
Aekplakorn 2008 Thailand Male 2004 Adults
Chahine 2011 U.S. 2006-2007 Adults
Schaap 2008
Laaksonen 2005 Male
Hajat 2010 U.S.2010 Adults
Menezes 2008 Brazil Male 2000-2005 Adults
Park 2010 South Korea Female 2005 Adults mix
Gonçalves-Silva 2005 Low
Nagelhout 2012 Netherlands female 2001 Adults
Kiefe 2001 Female
Cohen 2011 U.S. Male Adults White
Cohen 2011 U.S. Female Adults Black
Subtotal (I-squared = 98.9%, p = 0.000)
Nagelhout 2012 Netherlands Male 2001 Adults
Webb 2008 G1 Female
Shapo 2003 Male
Diez-Roux 1999 USA1992-1994
Kahn 2002 Female
Acevedo-Garcia 2005 USA1995-6
Mistry 2011 U.S. Female 2003-2004 Adults Mix
Coreil 1991 65-74 Female
Mfenyana 2006
Cohen 2011 U.S. Male Adults Black
White 2008 Australia1987 <15
Patrick 2012 U.S. 2005-2007 NR
Marrie 2009 U.S. 2006 Adults
Woitas- Slubowska 2010 Polland Male 2004 Adults
Coreil 1991 20-39 Male
Li 2012 U.S. Male 2002-2003 Adults
Pleis 2010 U.S. 2009 Adults Mix
Silvestre Garcia 1990 Low
Virtanen 2007 Male 20+ cig
Shavers 2005 Hispanics
Pudaric 2000 Male
Subtotal (I-squared = 99.3%, p = 0.000)
Hughes 2010 U.S. 2004-2005 Adults
Wister 1996 65+ y
Bombard 2012 U.S. Female 2005-2006 NR
Cohen 2011 U.S. Female Adults White
Siahpush 2003-JECH Low
Jitnarin 2011 Thailand Female 2004-2005 Adults
Clarkin 2008 U.S. Male 2000-2004 <15
Johnson 2009 U.S. 2001-2005 Adults
North America
Study
1.45 (1.35, 1.56)
1.12 (0.91, 1.39)
1.36 (1.14, 1.62)
1.84 (1.57, 2.16)
1.52 (1.26, 1.83)
1.77 (1.64, 1.91)
1.69 (1.47, 1.95)
2.50 (1.96, 3.19)
2.70 (2.60, 2.80)
1.32 (0.67, 2.60)
1.82 (1.41, 2.35)
2.01 (0.99, 4.08)
1.30 (0.70, 2.41)
1.54 (1.16, 2.04)
1.58 (1.05, 2.38)
0.87 (0.72, 1.04)
1.03 (0.84, 1.26)
1.98 (1.56, 2.51)
0.90 (0.61, 1.33)
1.00 (0.56, 1.80)
1.31 (1.20, 1.43)
3.81 (2.90, 5.01)
1.28 (1.00, 1.64)
1.24 (1.08, 1.42)
2.26 (1.96, 2.61)
2.03 (1.76, 2.34)
1.82 (1.38, 2.40)
1.30 (1.10, 1.54)
1.37 (0.83, 2.26)
1.56 (1.27, 1.92)
1.01 (0.98, 1.03)
2.13 (1.85, 2.45)
1.68 (1.38, 2.05)
0.52 (0.31, 0.87)
1.29 (1.17, 1.42)
2.84 (2.50, 3.23)
1.00 (0.56, 1.78)
1.45 (1.29, 1.63)
1.49 (1.26, 1.76)
1.94 (1.38, 2.73)
0.80 (0.65, 0.98)
1.19 (0.71, 1.99)
1.22 (0.75, 1.98)
2.70 (1.35, 5.41)
1.87 (1.08, 3.24)
0.85 (0.72, 1.02)
1.34 (1.18, 1.52)
0.89 (0.64, 1.24)
1.65 (1.28, 2.13)
0.91 (0.59, 1.40)
2.02 (1.17, 3.49)
1.30 (1.07, 1.58)
3.45 (3.23, 3.69)
0.87 (0.41, 1.85)
1.02 (1.00, 1.05)
0.72 (0.52, 1.00)
0.42 (0.37, 0.47)
0.93 (0.69, 1.26)
1.01 (0.89, 1.15)
1.25 (0.50, 3.12)
1.58 (1.28, 1.95)
1.21 (0.95, 1.53)
5.70 (5.50, 5.91)
1.53 (1.37, 1.71)
2.86 (1.82, 4.49)
2.00 (1.20, 3.33)
1.23 (1.05, 1.44)
1.84 (1.04, 3.26)
1.73 (1.08, 2.77)
0.95 (0.66, 1.38)
1.92 (0.18, 20.15)
1.40 (1.11, 1.77)
1.43 (1.12, 1.82)
1.03 (0.82, 1.30)
1.04 (0.83, 1.31)
1.63 (1.37, 1.94)
0.74 (0.22, 2.52)
2.42 (1.97, 2.96)
2.86 (1.33, 6.12)
2.34 (1.91, 2.87)
2.01 (1.53, 2.64)
2.29 (1.08, 4.86)
1.70 (1.20, 2.41)
ratio (95% CI)
4.17 (1.67, 10.42)
1.01 (0.98, 1.05)
1.18 (0.82, 1.69)
3.70 (2.22, 6.17)
1.10 (0.93, 1.30)
1.60 (1.00, 2.56)
2.10 (0.80, 5.51)
1.00 (0.67, 1.49)
0.50 (0.31, 0.80)
0.83 (0.77, 0.90)
1.47 (1.33, 1.62)
1.39 (1.20, 1.62)
1.77 (1.35, 2.32)
0.83 (0.64, 1.08)
0.83 (0.70, 0.98)
1.03 (0.97, 1.09)
2.80 (1.70, 4.61)
1.79 (1.74, 1.84)
0.83 (0.69, 0.99)
0.97 (0.70, 1.34)
1.64 (1.30, 2.07)
0.79 (0.64, 0.97)
1.25 (1.06, 1.47)
2.56 (1.35, 4.87)
1.15 (0.95, 1.39)
1.91 (1.66, 2.20)
1.94 (1.25, 3.01)
2.30 (1.61, 3.29)
1.43 (1.26, 1.62)
2.96 (1.41, 6.21)
1.30 (1.10, 1.54)
1.25 (0.50, 3.12)
1.36 (1.26, 1.47)
1.00 (0.42, 2.40)
1.17 (0.93, 1.47)
1.84 (1.62, 2.09)
1.19 (1.02, 1.39)
1.92 (1.81, 2.04)
1.40 (1.22, 1.61)
1.54 (1.28, 1.85)
5.41 (1.62, 18.07)
1.02 (0.72, 1.44)
0.74 (0.26, 2.15)
1.67 (1.43, 1.94)
1.55 (1.53, 1.57)
0.95 (0.91, 0.99)
2.04 (1.39, 2.99)
2.10 (1.41, 3.13)
2.60 (1.61, 4.20)
1.12 (0.61, 2.06)
1.91 (1.59, 2.29)
1.79 (1.56, 2.05)
0.93 (0.43, 2.01)
1.60 (1.36, 1.88)
1.68 (1.43, 1.97)
1.53 (1.39, 1.67)
1.75 (1.55, 1.98)
2.17 (1.52, 3.12)
1.43 (0.72, 2.82)
3.70 (1.60, 8.56)
1.90 (1.40, 2.58)
2.13 (2.04, 2.22)
0.85 (0.53, 1.37)
1.01 (0.94, 1.09)
1.28 (1.00, 1.64)
1.67 (1.49, 1.87)
0.86 (0.70, 1.06)
0.26 (0.14, 0.48)
1.83 (1.36, 2.46)
1.11 (0.36, 3.41)
1.04 (1.02, 1.07)
1.10 (0.56, 2.14)
2.04 (1.98, 2.10)
0.67 (0.40, 1.12)
1.89 (1.35, 2.65)
1.49 (1.23, 1.80)
1.50 (1.02, 2.21)
1.28 (0.93, 1.74)
1.45 (1.23, 1.71)
1.65 (0.93, 2.91)
5.40 (4.10, 7.11)
2.04 (1.76, 2.36)
0.96 (0.41, 2.25)
3.70 (1.50, 9.13)
0.72 (0.52, 1.00)
1.13 (0.84, 1.52)
Odds
100.00
0.69
0.70
0.71
0.70
0.73
0.71
0.68
0.73
0.45
0.67
0.43
0.48
0.66
0.60
0.70
0.69
0.68
0.61
0.50
0.73
0.67
0.68
0.72
0.71
0.71
0.66
0.71
0.54
0.69
0.73
0.72
0.70
0.53
0.73
0.72
0.50
22.93
0.71
0.63
0.70
0.53
0.55
0.44
0.52
0.71
0.72
0.64
0.67
0.58
0.52
0.70
0.73
0.41
0.73
0.64
0.72
0.65
0.72
0.34
0.69
0.68
0.73
0.72
0.57
0.54
0.71
0.50
0.56
0.62
0.08
0.68
0.68
0.68
0.68
6.72
0.24
0.69
0.41
0.69
0.67
0.41
0.63
Weight
0.34
0.73
0.62
0.54
0.71
0.56
0.32
0.60
0.56
0.73
0.72
16.31
0.67
0.67
0.71
0.73
0.54
0.73
0.70
0.64
0.68
0.69
0.71
0.47
0.70
0.72
0.58
0.62
0.72
0.42
0.71
0.34
0.73
0.35
0.68
0.72
0.71
0.73
0.72
0.70
0.24
0.63
0.28
0.71
0.73
0.73
0.61
0.60
0.56
0.48
0.70
0.72
0.40
0.71
0.71
37.53
0.72
0.62
0.45
0.37
0.65
0.73
0.56
0.73
0.68
0.72
0.69
0.48
0.65
0.27
0.73
0.45
0.73
0.54
0.63
0.70
0.61
15.83
0.71
0.51
0.66
0.71
0.36
0.34
0.64
0.65
%
10496 1 20 2
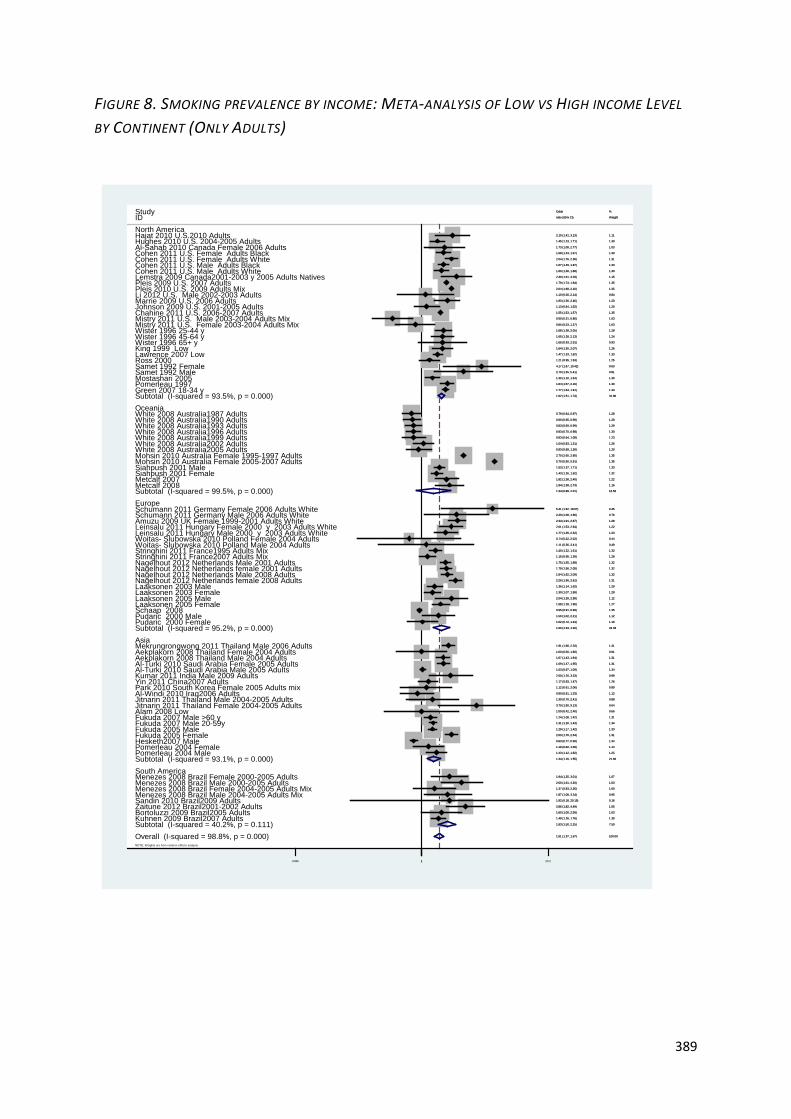
389
FIGURE 8. SMOKING PREVALENCE BY INCOME: META-ANALYSIS OF LOW VS HIGH INCOME LEVEL
BY CONTINENT (ONLY ADULTS)
NOTE: Weights are from random effects analysis
.
.
.
.
.
Overall (I-squared = 98.8%, p = 0.000)
Metcalf 2007
Kuhnen 2009 Brazil2007 Adults
Ross 2000
Schumann 2011 Germany Female 2006 Adults White
Laaksonen 2005 Female
Menezes 2008 Brazil Female 2004-2005 Adults Mix
White 2008 Australia1993 Adults
Aekplakorn 2008 Thailand Male 2004 Adults
White 2008 Australia1987 Adults
Mistry 2011 U.S. Male 2003-2004 Adults Mix
Yin 2011 China2007 Adults
Al-Turki 2010 Saudi Arabia Female 2005 Adults
South America
Zaitune 2012 Brazil2001-2002 Adults
Pomerleau 2004 Male
White 2008 Australia2002 Adults
Woitas- Slubowska 2010 Polland Male 2004 Adults
Kumar 2011 India Male 2009 Adults
Sandin 2010 Brazil2009 Adults
Fukuda 2005 Female
Chahine 2011 U.S. 2006-2007 Adults
Hajat 2010 U.S.2010 Adults
Stringhini 2011 France1995 Adults Mix
Mohsin 2010 Australia Female 2005-2007 Adults
Menezes 2008 Brazil Female 2000-2005 Adults
Schaap 2008
Li 2012 U.S. Male 2002-2003 Adults
Siahpush 2001 Male
Park 2010 South Korea Female 2005 Adults mix
Nagelhout 2012 Netherlands Male 2001 Adults
Al-Sahab 2010 Canada Female 2006 Adults
Wister 1996 45-64 y
Laaksonen 2005 Male
White 2008 Australia1996 Adults
Fukuda 2007 Male 20-59y
Nagelhout 2012 Netherlands Male 2008 Adults
Oceania
Mohsin 2010 Australia Female 1995-1997 Adults
Mostashari 2005
Subtotal (I-squared = 93.1%, p = 0.000)
Hughes 2010 U.S. 2004-2005 Adults
Amuzu 2009 UK Female 1999-2001 Adults WhiteSchumann 2011 Germany Male 2006 Adults White
Menezes 2008 Brazil Male 2004-2005 Adults Mix
Lawrence 2007 Low
White 2008 Australia2005 Adults
King 1999 Low
Green 2007 18-34 y
Leinsalu 2011 Hungary Female 2000 y 2003 Adults White
Pudaric 2000 Male
Stringhini 2011 France2007 Adults Mix
Aekplakorn 2008 Thailand Female 2004 Adults
ID
Subtotal (I-squared = 99.5%, p = 0.000)
Pleis 2009 U.S. 2007 Adults
Johnson 2009 U.S. 2001-2005 Adults
White 2008 Australia1990 Adults
Menezes 2008 Brazil Male 2000-2005 Adults
Laaksonen 2003 Male
Leinsalu 2011 Hungary Male 2000 y 2003 Adults White
Jitnarin 2011 Thailand Female 2004-2005 Adults
Metcalf 2008
Cohen 2011 U.S. Male Adults Black
Subtotal (I-squared = 40.2%, p = 0.111)
Alam 2008 Low
Lemstra 2009 Canada2001-2003 y 2005 Adults Natives
Siahpush 2001 Female
Nagelhout 2012 Netherlands female 2001 Adults
Mekrungrongwong 2011 Thailand Male 2006 Adults
Subtotal (I-squared = 93.5%, p = 0.000)
Wister 1996 25-44 y
Pomerleau 1997
Cohen 2011 U.S. Male Adults White
Samet 1992 Male
Europe
Fukuda 2007 Male >60 y
White 2008 Australia1999 Adults
Subtotal (I-squared = 95.2%, p = 0.000)
Wister 1996 65+ y
Jitnarin 2011 Thailand Male 2004-2005 Adults
Mistry 2011 U.S. Female 2003-2004 Adults Mix
Nagelhout 2012 Netherlands female 2008 Adults
Cohen 2011 U.S. Female Adults Black
Hesketh2007 MaleFukuda 2005 Male
Marrie 2009 U.S. 2006 Adults
Bortoluzzi 2009 Brazil2005 Adults
Al-Windi 2010 Iraq2006 Adults
Pomerleau 2004 Female
Cohen 2011 U.S. Female Adults White
Woitas- Slubowska 2010 Polland Female 2004 Adults
Pudaric 2000 Female
Pleis 2010 U.S. 2009 Adults Mix
North America
Asia
Samet 1992 Female
Laaksonen 2003 Female
Al-Turki 2010 Saudi Arabia Male 2005 Adults
Study
1.51 (1.37, 1.67)
1.82 (1.38, 2.40)
1.49 (1.26, 1.76)
1.21 (0.95, 1.53)
5.41 (1.62, 18.07)
1.58 (1.28, 1.95)
1.37 (0.83, 2.26)
0.83 (0.69, 0.99)
1.67 (1.43, 1.94)
0.79 (0.64, 0.97)
0.50 (0.31, 0.80)
1.17 (0.93, 1.47)
1.69 (1.47, 1.95)
2.86 (1.82, 4.49)
1.43 (1.12, 1.82)
1.04 (0.83, 1.31)
1.11 (0.36, 3.41)
2.00 (1.20, 3.33)
1.92 (0.18, 20.15)
2.03 (1.76, 2.34)
1.55 (1.53, 1.57)
2.10 (1.41, 3.13)
1.40 (1.22, 1.61)
5.70 (5.50, 5.91)
1.94 (1.25, 3.01)
0.95 (0.91, 0.99)
1.10 (0.56, 2.14)
1.53 (1.37, 1.71)
1.12 (0.61, 2.06)
1.75 (1.55, 1.98)
1.73 (1.08, 2.77)
1.65 (1.28, 2.13)
2.04 (1.39, 2.99)
0.83 (0.70, 0.98)
1.31 (1.20, 1.43)
1.84 (1.62, 2.09)
2.70 (2.60, 2.80)
1.30 (1.10, 1.54)
1.34 (1.16, 1.55)
1.45 (1.23, 1.71)
2.34 (1.91, 2.87)
2.29 (1.08, 4.86)
1.87 (1.08, 3.24)
1.47 (1.33, 1.62)
0.93 (0.69, 1.26)
1.64 (1.30, 2.07)
1.77 (1.64, 1.91)
2.01 (1.53, 2.64)
1.50 (1.02, 2.21)
1.15 (0.95, 1.39)
1.00 (0.56, 1.80)
ratio (95% CI)
1.34 (0.89, 2.01)
1.79 (1.74, 1.84)
1.13 (0.84, 1.52)
0.80 (0.65, 0.98)
2.60 (1.61, 4.20)
1.36 (1.14, 1.62)
1.77 (1.35, 2.32)
3.70 (1.50, 9.13)
1.94 (1.38, 2.73)
1.67 (1.49, 1.87)
1.83 (1.50, 2.25)
1.00 (0.42, 2.40)
2.30 (1.61, 3.29)
1.43 (1.26, 1.62)
1.79 (1.56, 2.05)
1.91 (1.66, 2.20)
1.62 (1.51, 1.74)
1.68 (1.38, 2.05)
1.84 (1.57, 2.16)
1.60 (1.36, 1.88)
2.70 (1.35, 5.41)
1.24 (1.08, 1.42)
0.83 (0.64, 1.08)
1.60 (1.33, 1.92)
1.65 (0.93, 2.91)
1.30 (0.70, 2.41)
0.85 (0.53, 1.37)
2.26 (1.96, 2.61)
1.68 (1.43, 1.97)
0.83 (0.77, 0.90)
1.29 (1.17, 1.42)
1.83 (1.36, 2.46)
1.60 (1.00, 2.56)
0.90 (0.61, 1.33)
1.18 (0.82, 1.69)
2.04 (1.76, 2.36)
0.74 (0.22, 2.52)
1.02 (0.72, 1.44)
2.04 (1.98, 2.10)
4.17 (1.67, 10.42)
1.30 (1.07, 1.58)
1.03 (0.97, 1.09)
Odds
100.00
1.22
1.30
1.25
0.45
1.27
1.00
1.29
1.31
1.28
1.03
1.26
1.31
1.05
1.25
1.26
0.49
0.99
0.16
1.31
1.35
1.11
1.32
1.35
1.07
1.35
0.84
1.33
0.89
1.32
1.03
1.24
1.12
1.30
1.34
1.32
1.35
1.30
21.66
1.30
1.28
0.76
0.95
1.33
1.20
1.26
1.34
1.22
1.12
1.28
0.91
Weight
16.56
1.35
1.20
1.28
1.03
1.29
1.23
0.64
1.16
1.33
7.59
0.66
1.15
1.32
1.32
1.31
31.86
1.28
1.30
1.30
0.81
1.31
1.23
22.33
0.93
0.88
1.03
1.31
1.30
1.34
1.33
1.20
1.03
1.12
1.14
1.31
0.44
1.16
1.35
0.63
1.28
1.34
%
1.0496 1 20.2
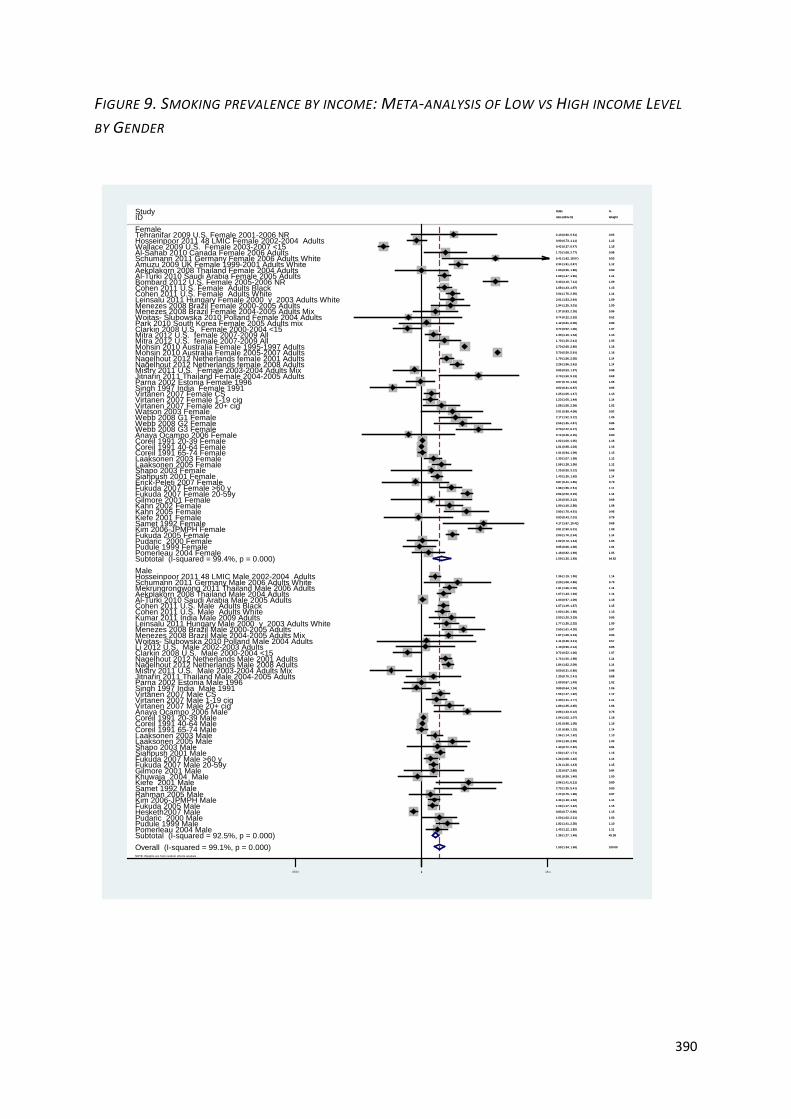
390
FIGURE 9. SMOKING PREVALENCE BY INCOME: META-ANALYSIS OF LOW VS HIGH INCOME LEVEL
BY GENDER
NOTE: Weights are from random effects analysis
.
.
Overall (I-squared = 99.1%, p = 0.000)
Samet 1992 Male
Gilmore 2001 Female
Female
Virtanen 2007 Male 20+ cig
Menezes 2008 Brazil Female 2000-2005 Adults
Siahpush 2001 Female
Hosseinpoor 2011 48 LMIC Male 2002-2004 Adults
Fukuda 2005 Female
Al-Turki 2010 Saudi Arabia Male 2005 Adults
Wallace 2009 U.S. Female 2003-2007 <15
Kim 2006-JPMPH Male
Coreil 1991 65-74 Female
Virtanen 2007 Female 20+ cig
Jitnarin 2011 Thailand Female 2004-2005 Adults
Coreil 1991 40-64 Male
Kahn 2002 Female
Schumann 2011 Germany Male 2006 Adults White
Hesketh2007 Male
Jitnarin 2011 Thailand Male 2004-2005 Adults
Park 2010 South Korea Female 2005 Adults mix
Virtanen 2007 Female 1-19 cig
Al-Turki 2010 Saudi Arabia Female 2005 Adults
Woitas- Slubowska 2010 Polland Female 2004 Adults
Singh 1997 India Male 1991Virtanen 2007 Male CS
Webb 2008 G1 Female
Nagelhout 2012 Netherlands Male 2008 Adults
Pudaric 2000 Female
Aekplakorn 2008 Thailand Female 2004 Adults
Cohen 2011 U.S. Male Adults White
Coreil 1991 65-74 MaleLaaksonen 2003 Male
Kiefe 2001 Female
Shapo 2003 Male
Hosseinpoor 2011 48 LMIC Female 2002-2004 Adults
Schumann 2011 Germany Female 2006 Adults White
Pudule 1999 Female
Amuzu 2009 UK Female 1999-2001 Adults White
Nagelhout 2012 Netherlands female 2008 Adults
Bombard 2012 U.S. Female 2005-2006 NR
Laaksonen 2005 Female
Cohen 2011 U.S. Female Adults White
Anaya Ocampo 2006 Male
Kahn 2005 Female
Fukuda 2007 Male 20-59y
Al-Sahab 2010 Canada Female 2006 Adults
Erick-Peleti 2007 Female
Pomerleau 2004 MalePudaric 2000 Male
Clarkin 2008 U.S. Male 2000-2004 <15
Fukuda 2005 Male
Tehranifar 2009 U.S. Female 2001-2006 NR
Fukuda 2007 Male >60 y
Subtotal (I-squared = 99.4%, p = 0.000)
Samet 1992 Female
Aekplakorn 2008 Thailand Male 2004 Adults
Li 2012 U.S. Male 2002-2003 Adults
Singh 1997 India Female 1991
Mohsin 2010 Australia Female 2005-2007 Adults
Parna 2002 Estonia Male 1996Mistry 2011 U.S. Male 2003-2004 Adults Mix
Watson 2003 Female
Pudule 1999 Male
Laaksonen 2005 Male
Mitra 2012 U.S. female 2007-2009 All
Menezes 2008 Brazil Male 2000-2005 Adults
Study
Shapo 2003 Female
Coreil 1991 20-39 Male
Virtanen 2007 Male 1-19 cig
Male
Coreil 1991 20-39 Female
Laaksonen 2003 Female
Nagelhout 2012 Netherlands Male 2001 Adults
Mistry 2011 U.S. Female 2003-2004 Adults Mix
Virtanen 2007 Female CS
Leinsalu 2011 Hungary Male 2000 y 2003 Adults White
Parna 2002 Estonia Female 1996
Anaya Ocampo 2006 FemaleCoreil 1991 40-64 Female
Cohen 2011 U.S. Male Adults Black
Nagelhout 2012 Netherlands female 2001 Adults
Siahpush 2001 Male
Webb 2008 G2 Female
ID
Mohsin 2010 Australia Female 1995-1997 Adults
Clarkin 2008 U.S. Female 2000-2004 <15
Subtotal (I-squared = 92.5%, p = 0.000)
Kim 2006-JPMPH Female
Menezes 2008 Brazil Female 2004-2005 Adults Mix
Woitas- Slubowska 2010 Polland Male 2004 Adults
Leinsalu 2011 Hungary Female 2000 y 2003 Adults White
Mekrungrongwong 2011 Thailand Male 2006 Adults
Cohen 2011 U.S. Female Adults Black
Fukuda 2007 Female >60 yFukuda 2007 Female 20-59y
Rahman 2005 Male
Gilmore 2001 Male
Pomerleau 2004 Female
Webb 2008 G3 Female
Kiefe 2001 MaleKhuwaja 2004 Male
Kumar 2011 India Male 2009 Adults
Mitra 2012 U.S. female 2007-2009 All
Menezes 2008 Brazil Male 2004-2005 Adults Mix
1.50 (1.34, 1.69)
2.70 (1.35, 5.41)
1.25 (0.50, 3.12)
1.89 (1.35, 2.65)
1.94 (1.25, 3.01)
1.43 (1.26, 1.62)
1.36 (1.19, 1.55)
2.03 (1.76, 2.34)
1.03 (0.97, 1.09)
0.42 (0.37, 0.47)
1.34 (1.18, 1.52)
1.01 (0.94, 1.09)
1.58 (1.05, 2.38)
3.70 (1.50, 9.13)
1.01 (0.98, 1.05)
1.90 (1.40, 2.58)
2.29 (1.08, 4.86)
0.83 (0.77, 0.90)
1.30 (0.70, 2.41)
1.12 (0.61, 2.06)
1.23 (1.05, 1.44)
1.69 (1.47, 1.95)
0.74 (0.22, 2.52)
0.89 (0.64, 1.24)
1.56 (1.27, 1.92)
2.17 (1.52, 3.12)
1.84 (1.62, 2.09)
1.02 (0.72, 1.44)
1.00 (0.56, 1.80)
1.60 (1.36, 1.88)
1.01 (0.89, 1.15)
1.36 (1.14, 1.62)
0.93 (0.43, 2.01)
1.43 (0.72, 2.82)
0.90 (0.73, 1.11)
5.41 (1.62, 18.07)
0.95 (0.66, 1.38)
2.34 (1.91, 2.87)
2.26 (1.96, 2.61)
5.40 (4.10, 7.11)
1.58 (1.28, 1.95)
2.04 (1.76, 2.36)
2.86 (1.33, 6.12)
2.80 (1.70, 4.61)
1.31 (1.20, 1.43)
1.73 (1.08, 2.77)
0.87 (0.41, 1.85)
1.43 (1.12, 1.82)
1.50 (1.02, 2.21)
0.72 (0.52, 1.00)
1.29 (1.17, 1.42)
2.10 (0.80, 5.51)
1.24 (1.08, 1.42)
1.59 (1.30, 1.93)
4.17 (1.67, 10.42)
1.67 (1.43, 1.94)
1.10 (0.56, 2.14)
0.52 (0.31, 0.87)
5.70 (5.50, 5.91)
1.00 (0.67, 1.49)
0.50 (0.31, 0.80)
2.01 (0.99, 4.08)
1.82 (1.41, 2.35)
2.04 (1.39, 2.99)
1.30 (1.10, 1.54)
2.60 (1.61, 4.20)
Odds
1.25 (0.50, 3.12)
1.04 (1.02, 1.07)
1.40 (1.11, 1.77)
1.02 (1.00, 1.05)
1.30 (1.07, 1.58)
1.75 (1.55, 1.98)
0.85 (0.53, 1.37)
1.25 (1.06, 1.47)
1.77 (1.35, 2.32)
0.97 (0.70, 1.34)
0.74 (0.26, 2.15)
1.01 (0.98, 1.03)
1.67 (1.49, 1.87)
1.79 (1.56, 2.05)
1.53 (1.37, 1.71)
2.56 (1.35, 4.87)
ratio (95% CI)
2.70 (2.60, 2.80)
0.72 (0.52, 1.00)
1.38 (1.27, 1.49)
3.81 (2.90, 5.01)
1.37 (0.83, 2.26)
1.11 (0.36, 3.41)
2.01 (1.53, 2.64)
1.91 (1.66, 2.20)
1.68 (1.43, 1.97)
1.98 (1.56, 2.51)
2.84 (2.50, 3.23)
1.22 (0.75, 1.98)
1.32 (0.67, 2.60)
1.18 (0.82, 1.69)
3.70 (2.22, 6.17)
2.96 (1.41, 6.21)
0.91 (0.59, 1.40)
2.00 (1.20, 3.33)
1.70 (1.20, 2.41)
1.87 (1.08, 3.24)
100.00
0.83
0.68
1.06
1.00
1.14
1.14
1.14
1.16
1.15
1.14
1.15
1.02
0.69
1.16
1.08
0.79
1.15
0.88
0.89
1.14
1.14
0.52
1.06
1.12
1.05
1.14
1.05
0.90
1.13
1.14
1.13
0.78
0.84
1.12
0.53
1.04
1.12
1.14
1.09
1.12
1.14
0.78
0.96
1.15
0.98
0.79
1.11
1.03
1.07
1.15
0.65
1.14
54.62
0.68
1.14
0.85
0.95
1.16
1.02
0.98
0.82
1.10
1.03
1.13
0.97
%
0.68
1.16
1.11
1.16
1.12
1.14
0.98
1.13
1.09
1.06
0.60
1.16
1.15
1.14
1.15
0.86
Weight
1.16
1.07
45.38
1.09
0.96
0.57
1.09
1.14
1.13
1.11
1.14
0.97
0.84
1.05
0.95
0.80
1.00
0.95
1.05
0.93
1.0554 1 18.1
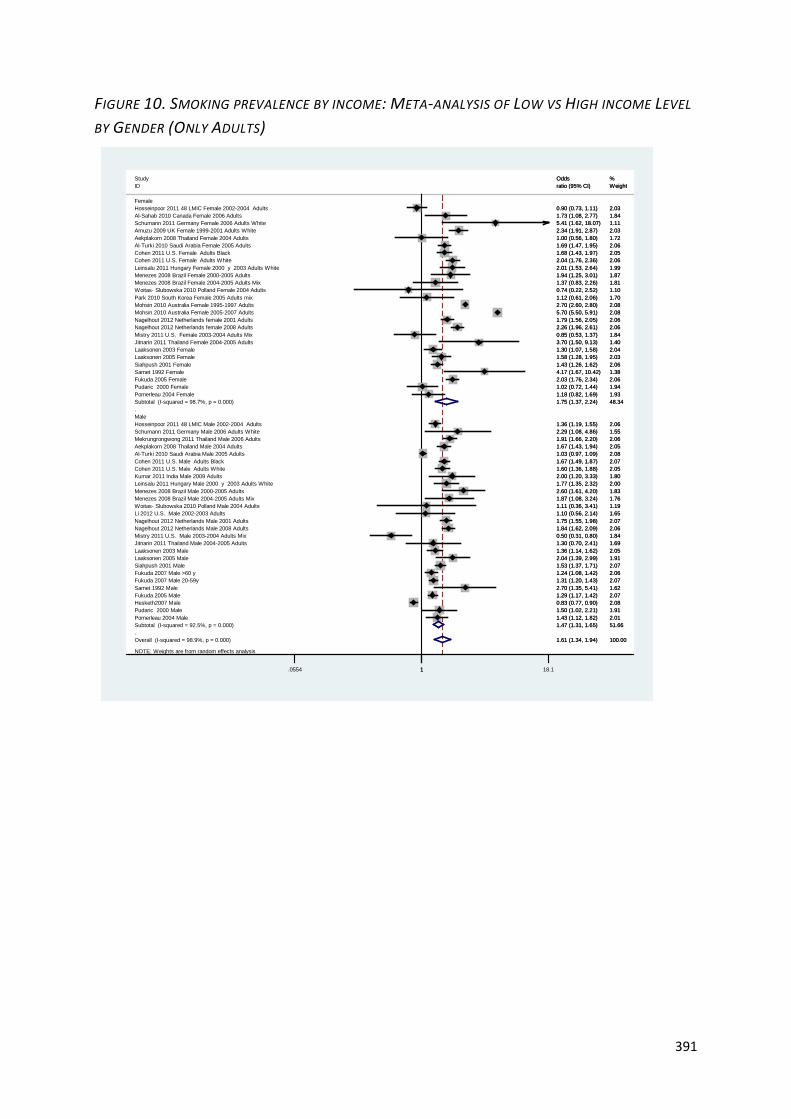
391
FIGURE 10. SMOKING PREVALENCE BY INCOME: META-ANALYSIS OF LOW VS HIGH INCOME LEVEL
BY GENDER (ONLY ADULTS)
NOTE: Weights are from random effects analysis
.
.Overall (I-squared = 98.9%, p = 0.000)
Woitas- Slubowska 2010 Polland Female 2004 Adults
Mistry 2011 U.S. Male 2003-2004 Adults Mix
Cohen 2011 U.S. Male Adults White
Nagelhout 2012 Netherlands female 2001 Adults
Laaksonen 2005 Male
Pomerleau 2004 Female
Study
Amuzu 2009 UK Female 1999-2001 Adults White
Samet 1992 Female
Park 2010 South Korea Female 2005 Adults mix
Al-Turki 2010 Saudi Arabia Male 2005 Adults
Fukuda 2007 Male 20-59yFukuda 2007 Male >60 y
Fukuda 2005 Male
Subtotal (I-squared = 98.7%, p = 0.000)
Hosseinpoor 2011 48 LMIC Female 2002-2004 Adults
Leinsalu 2011 Hungary Female 2000 y 2003 Adults White
Laaksonen 2003 Female
Hesketh2007 Male
Leinsalu 2011 Hungary Male 2000 y 2003 Adults White
Female
Male
Cohen 2011 U.S. Male Adults Black
Laaksonen 2003 Male
Mistry 2011 U.S. Female 2003-2004 Adults Mix
Menezes 2008 Brazil Female 2004-2005 Adults Mix
Cohen 2011 U.S. Female Adults Black
Siahpush 2001 Female
Hosseinpoor 2011 48 LMIC Male 2002-2004 AdultsSchumann 2011 Germany Male 2006 Adults White
Nagelhout 2012 Netherlands Male 2001 Adults
Pomerleau 2004 Male
Al-Turki 2010 Saudi Arabia Female 2005 Adults
Fukuda 2005 Female
Woitas- Slubowska 2010 Polland Male 2004 Adults
ID
Aekplakorn 2008 Thailand Male 2004 Adults
Pudaric 2000 Female
Jitnarin 2011 Thailand Female 2004-2005 Adults
Kumar 2011 India Male 2009 Adults
Menezes 2008 Brazil Male 2004-2005 Adults Mix
Cohen 2011 U.S. Female Adults White
Mohsin 2010 Australia Female 2005-2007 Adults
Nagelhout 2012 Netherlands female 2008 Adults
Menezes 2008 Brazil Male 2000-2005 Adults
Subtotal (I-squared = 92.5%, p = 0.000)
Siahpush 2001 Male
Jitnarin 2011 Thailand Male 2004-2005 Adults
Samet 1992 Male
Nagelhout 2012 Netherlands Male 2008 Adults
Mohsin 2010 Australia Female 1995-1997 Adults
Li 2012 U.S. Male 2002-2003 Adults
Mekrungrongwong 2011 Thailand Male 2006 Adults
Aekplakorn 2008 Thailand Female 2004 Adults
Schumann 2011 Germany Female 2006 Adults WhiteAl-Sahab 2010 Canada Female 2006 Adults
Laaksonen 2005 Female
Menezes 2008 Brazil Female 2000-2005 Adults
Pudaric 2000 Male
1.61 (1.34, 1.94)
0.74 (0.22, 2.52)
0.50 (0.31, 0.80)
1.60 (1.36, 1.88)
1.79 (1.56, 2.05)
2.04 (1.39, 2.99)
1.18 (0.82, 1.69)
Odds
2.34 (1.91, 2.87)
4.17 (1.67, 10.42)
1.12 (0.61, 2.06)
1.03 (0.97, 1.09)
1.31 (1.20, 1.43)1.24 (1.08, 1.42)
1.29 (1.17, 1.42)
1.75 (1.37, 2.24)
0.90 (0.73, 1.11)
2.01 (1.53, 2.64)
1.30 (1.07, 1.58)
0.83 (0.77, 0.90)
1.77 (1.35, 2.32)
1.67 (1.49, 1.87)
1.36 (1.14, 1.62)
0.85 (0.53, 1.37)
1.37 (0.83, 2.26)
1.68 (1.43, 1.97)
1.43 (1.26, 1.62)
1.36 (1.19, 1.55)2.29 (1.08, 4.86)
1.75 (1.55, 1.98)
1.43 (1.12, 1.82)
1.69 (1.47, 1.95)
2.03 (1.76, 2.34)
1.11 (0.36, 3.41)
ratio (95% CI)
1.67 (1.43, 1.94)
1.02 (0.72, 1.44)
3.70 (1.50, 9.13)
2.00 (1.20, 3.33)
1.87 (1.08, 3.24)
2.04 (1.76, 2.36)
5.70 (5.50, 5.91)
2.26 (1.96, 2.61)
2.60 (1.61, 4.20)
1.47 (1.31, 1.65)
1.53 (1.37, 1.71)
1.30 (0.70, 2.41)
2.70 (1.35, 5.41)
1.84 (1.62, 2.09)
2.70 (2.60, 2.80)
1.10 (0.56, 2.14)
1.91 (1.66, 2.20)
1.00 (0.56, 1.80)
5.41 (1.62, 18.07)1.73 (1.08, 2.77)
1.58 (1.28, 1.95)
1.94 (1.25, 3.01)
1.50 (1.02, 2.21)
100.00
1.10
1.84
2.05
2.06
1.91
1.93
%
2.03
1.38
1.70
2.08
2.072.06
2.07
48.34
2.03
1.99
2.04
2.08
2.00
2.07
2.05
1.84
1.81
2.05
2.06
2.061.55
2.07
2.01
2.06
2.06
1.19
Weight
2.05
1.94
1.40
1.80
1.76
2.06
2.08
2.06
1.83
51.66
2.07
1.69
1.62
2.06
2.08
1.65
2.06
1.72
1.111.84
2.03
1.87
1.91
1.0554 1 18.1
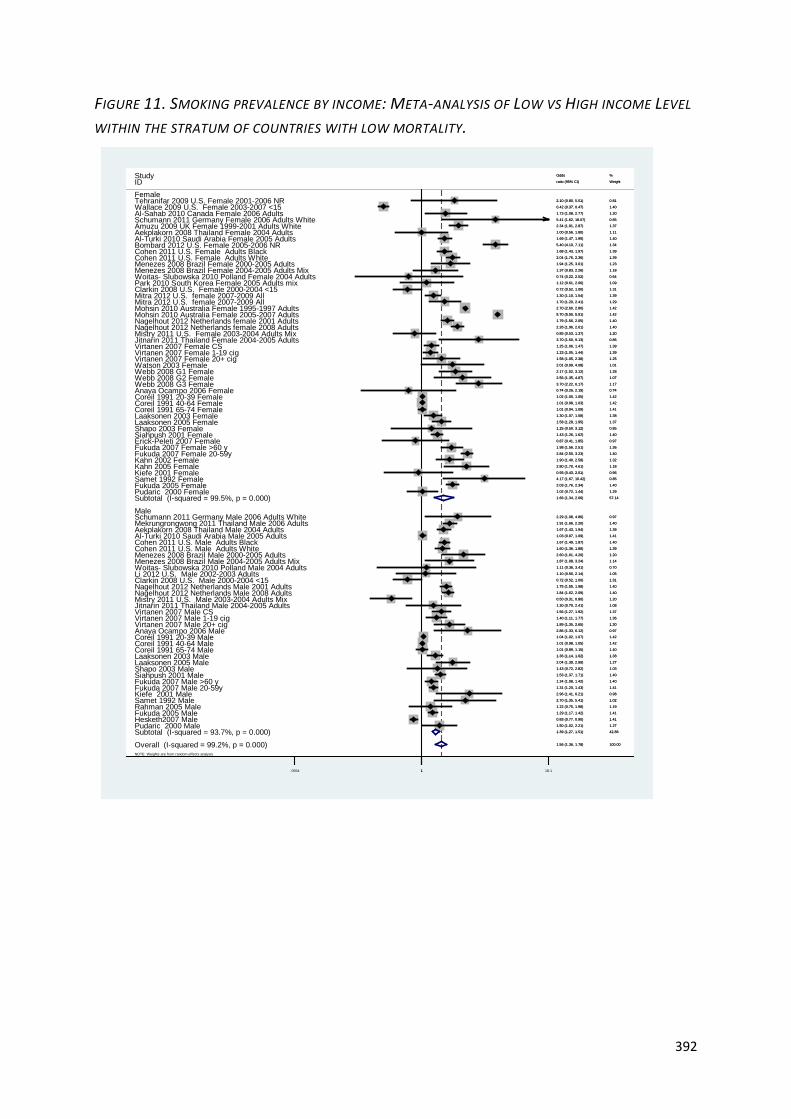
392
FIGURE 11. SMOKING PREVALENCE BY INCOME: META-ANALYSIS OF LOW VS HIGH INCOME LEVEL
WITHIN THE STRATUM OF COUNTRIES WITH LOW MORTALITY.
NOTE: Weights are from random effects analysis
.
.
Overall (I-squared = 99.2%, p = 0.000)
Siahpush 2001 Male
Nagelhout 2012 Netherlands Male 2001 Adults
Hesketh2007 Male
Coreil 1991 40-64 Male
Al-Turki 2010 Saudi Arabia Female 2005 Adults
Al-Turki 2010 Saudi Arabia Male 2005 AdultsCohen 2011 U.S. Male Adults BlackCohen 2011 U.S. Male Adults WhiteMenezes 2008 Brazil Male 2000-2005 Adults
Kiefe 2001 Female
Laaksonen 2005 Female
Pudaric 2000 Male
Aekplakorn 2008 Thailand Female 2004 Adults
Mistry 2011 U.S. Male 2003-2004 Adults Mix
Clarkin 2008 U.S. Male 2000-2004 <15
Erick-Peleti 2007 Female
Nagelhout 2012 Netherlands female 2001 Adults
Woitas- Slubowska 2010 Polland Male 2004 Adults
Schumann 2011 Germany Male 2006 Adults White
Subtotal (I-squared = 93.7%, p = 0.000)
Amuzu 2009 UK Female 1999-2001 Adults White
Laaksonen 2003 Female
Jitnarin 2011 Thailand Female 2004-2005 Adults
Clarkin 2008 U.S. Female 2000-2004 <15
Menezes 2008 Brazil Male 2004-2005 Adults Mix
Mitra 2012 U.S. female 2007-2009 All
Virtanen 2007 Female 20+ cig
Mekrungrongwong 2011 Thailand Male 2006 Adults
Samet 1992 Male
Wallace 2009 U.S. Female 2003-2007 <15
Kiefe 2001 Male
Fukuda 2007 Female >60 y
Fukuda 2007 Male >60 y
Fukuda 2007 Female 20-59y
Menezes 2008 Brazil Female 2000-2005 Adults
Jitnarin 2011 Thailand Male 2004-2005 Adults
Laaksonen 2005 Male
Shapo 2003 Female
Kahn 2002 Female
Fukuda 2007 Male 20-59y
Nagelhout 2012 Netherlands Male 2008 Adults
Siahpush 2001 Female
Menezes 2008 Brazil Female 2004-2005 Adults Mix
Fukuda 2005 Female
Virtanen 2007 Female CSVirtanen 2007 Female 1-19 cig
Al-Sahab 2010 Canada Female 2006 Adults
Mitra 2012 U.S. female 2007-2009 All
Li 2012 U.S. Male 2002-2003 Adults
Pudaric 2000 Female
Fukuda 2005 Male
Anaya Ocampo 2006 Female
Shapo 2003 Male
Coreil 1991 20-39 Male
Coreil 1991 20-39 Female
Virtanen 2007 Male 20+ cig
Webb 2008 G2 FemaleWebb 2008 G3 Female
Watson 2003 Female
Female
Cohen 2011 U.S. Female Adults White
Laaksonen 2003 Male
Male
Mistry 2011 U.S. Female 2003-2004 Adults Mix
Samet 1992 Female
Bombard 2012 U.S. Female 2005-2006 NR
Webb 2008 G1 Female
Virtanen 2007 Male 1-19 cig
Rahman 2005 Male
Subtotal (I-squared = 99.5%, p = 0.000)
Coreil 1991 65-74 Male
Park 2010 South Korea Female 2005 Adults mixWoitas- Slubowska 2010 Polland Female 2004 Adults
Kahn 2005 Female
Mohsin 2010 Australia Female 2005-2007 Adults
Coreil 1991 40-64 Female
Study
Schumann 2011 Germany Female 2006 Adults White
Aekplakorn 2008 Thailand Male 2004 Adults
ID
Anaya Ocampo 2006 Male
Mohsin 2010 Australia Female 1995-1997 Adults
Virtanen 2007 Male CS
Coreil 1991 65-74 Female
Tehranifar 2009 U.S. Female 2001-2006 NR
Nagelhout 2012 Netherlands female 2008 Adults
Cohen 2011 U.S. Female Adults Black
1.56 (1.36, 1.78)
1.53 (1.37, 1.71)
1.75 (1.55, 1.98)
0.83 (0.77, 0.90)
1.01 (0.98, 1.05)
1.69 (1.47, 1.95)
1.03 (0.97, 1.09)
1.67 (1.49, 1.87)
1.60 (1.36, 1.88)
2.60 (1.61, 4.20)
0.93 (0.43, 2.01)
1.58 (1.28, 1.95)
1.50 (1.02, 2.21)
1.00 (0.56, 1.80)
0.50 (0.31, 0.80)
0.72 (0.52, 1.00)
0.87 (0.41, 1.85)
1.79 (1.56, 2.05)
1.11 (0.36, 3.41)
2.29 (1.08, 4.86)
1.39 (1.27, 1.51)
2.34 (1.91, 2.87)
1.30 (1.07, 1.58)
3.70 (1.50, 9.13)
0.72 (0.52, 1.00)
1.87 (1.08, 3.24)
1.30 (1.10, 1.54)
1.58 (1.05, 2.38)
1.91 (1.66, 2.20)
2.70 (1.35, 5.41)
0.42 (0.37, 0.47)
2.96 (1.41, 6.21)
1.98 (1.56, 2.51)
1.24 (1.08, 1.42)
2.84 (2.50, 3.23)
1.94 (1.25, 3.01)
1.30 (0.70, 2.41)
2.04 (1.39, 2.99)
1.25 (0.50, 3.12)
1.90 (1.40, 2.58)
1.31 (1.20, 1.43)
1.84 (1.62, 2.09)
1.43 (1.26, 1.62)
1.37 (0.83, 2.26)
2.03 (1.76, 2.34)
1.25 (1.06, 1.47)
1.23 (1.05, 1.44)
1.73 (1.08, 2.77)
1.70 (1.20, 2.41)
1.10 (0.56, 2.14)
1.02 (0.72, 1.44)
1.29 (1.17, 1.42)
0.74 (0.26, 2.15)
1.43 (0.72, 2.82)
1.04 (1.02, 1.07)
1.02 (1.00, 1.05)
1.89 (1.35, 2.65)
2.56 (1.35, 4.87)
3.70 (2.22, 6.17)
2.01 (0.99, 4.08)
2.04 (1.76, 2.36)
1.36 (1.14, 1.62)
0.85 (0.53, 1.37)
4.17 (1.67, 10.42)
5.40 (4.10, 7.11)
2.17 (1.52, 3.12)
1.40 (1.11, 1.77)
1.22 (0.75, 1.98)
1.66 (1.34, 2.06)
1.01 (0.89, 1.15)
1.12 (0.61, 2.06)
0.74 (0.22, 2.52)
2.80 (1.70, 4.61)
5.70 (5.50, 5.91)
1.01 (0.98, 1.03)
Odds
5.41 (1.62, 18.07)
1.67 (1.43, 1.94)
ratio (95% CI)
2.86 (1.33, 6.12)
2.70 (2.60, 2.80)
1.56 (1.27, 1.92)
1.01 (0.94, 1.09)
2.10 (0.80, 5.51)
2.26 (1.96, 2.61)
1.68 (1.43, 1.97)
100.00
1.40
1.40
1.41
1.42
1.40
1.41
1.40
1.39
1.20
0.96
1.37
1.27
1.11
1.20
1.31
0.97
1.40
0.70
0.97
42.86
1.37
1.38
0.86
1.31
1.14
1.39
1.25
1.40
1.02
1.40
0.98
1.36
1.40
1.40
1.23
1.08
1.27
0.85
1.32
1.41
1.40
1.40
1.18
1.40
1.39
1.39
1.20
1.29
1.05
1.29
1.41
0.74
1.03
1.42
1.42
1.30
1.07
1.17
1.01
1.39
1.38
1.20
0.85
1.34
1.28
1.36
1.19
57.14
1.40
1.09
0.64
1.18
1.42
1.42
%
0.65
1.39
Weight
0.97
1.42
1.37
1.41
0.81
1.40
1.39
1.0554 1 18.1
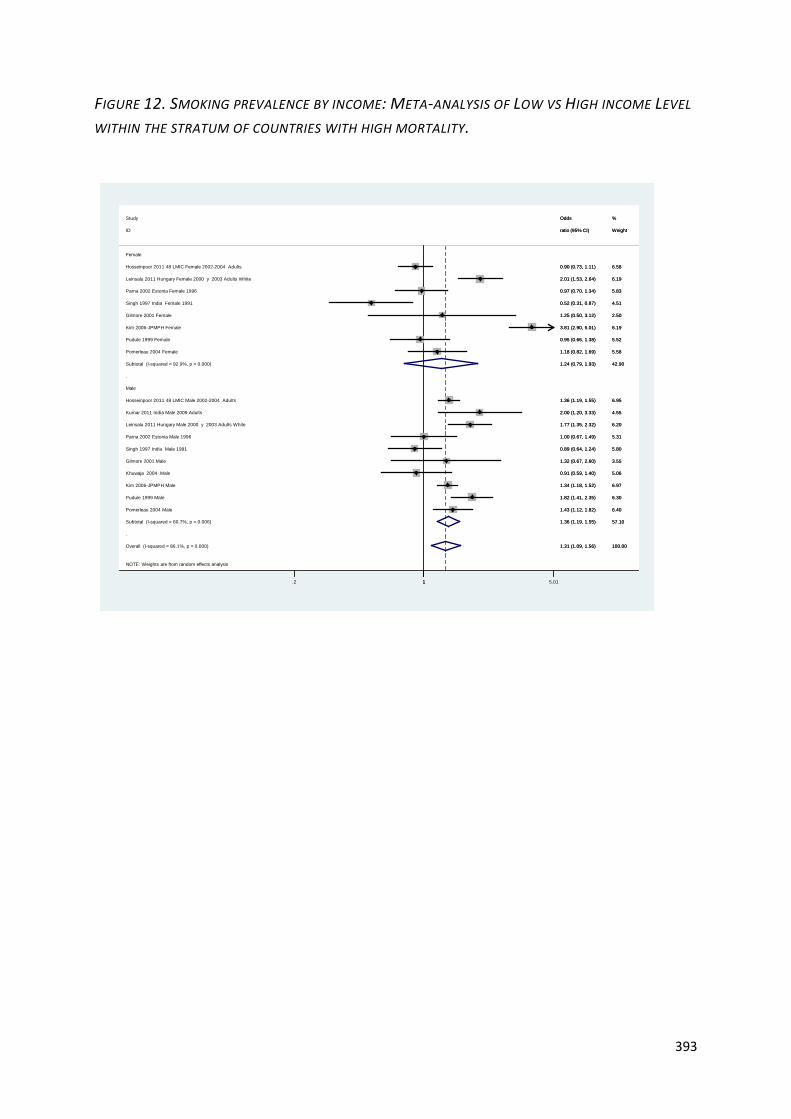
393
FIGURE 12. SMOKING PREVALENCE BY INCOME: META-ANALYSIS OF LOW VS HIGH INCOME LEVEL
WITHIN THE STRATUM OF COUNTRIES WITH HIGH MORTALITY.
NOTE: Weights are from random effects analysis
.
.
Overall (I-squared = 86.1%, p = 0.000)
Male
ID
Singh 1997 India Male 1991
Parna 2002 Estonia Female 1996
Pudule 1999 Male
Leinsalu 2011 Hungary Male 2000 y 2003 Adults White
Kumar 2011 India Male 2009 Adults
Singh 1997 India Female 1991
Hosseinpoor 2011 48 LMIC Female 2002-2004 Adults
Pomerleau 2004 Female
Pudule 1999 Female
Pomerleau 2004 Male
Leinsalu 2011 Hungary Female 2000 y 2003 Adults White
Hosseinpoor 2011 48 LMIC Male 2002-2004 Adults
Parna 2002 Estonia Male 1996
Subtotal (I-squared = 60.7%, p = 0.006)
Khuwaja 2004 Male
Kim 2006-JPMPH Female
Gilmore 2001 Female
Study
Subtotal (I-squared = 92.9%, p = 0.000)
Kim 2006-JPMPH Male
Female
Gilmore 2001 Male
1.31 (1.09, 1.56)
ratio (95% CI)
0.89 (0.64, 1.24)
0.97 (0.70, 1.34)
1.82 (1.41, 2.35)
1.77 (1.35, 2.32)
2.00 (1.20, 3.33)
0.52 (0.31, 0.87)
0.90 (0.73, 1.11)
1.18 (0.82, 1.69)
0.95 (0.66, 1.38)
1.43 (1.12, 1.82)
2.01 (1.53, 2.64)
1.36 (1.19, 1.55)
1.00 (0.67, 1.49)
1.36 (1.19, 1.55)
0.91 (0.59, 1.40)
3.81 (2.90, 5.01)
1.25 (0.50, 3.12)
Odds
1.24 (0.79, 1.93)
1.34 (1.18, 1.52)
1.32 (0.67, 2.60)
100.00
Weight
5.80
5.83
6.30
6.20
4.55
4.51
6.58
5.58
5.52
6.40
6.19
6.95
5.31
57.10
5.06
6.19
2.50
%
42.90
6.97
3.55
1.2 1 5.01
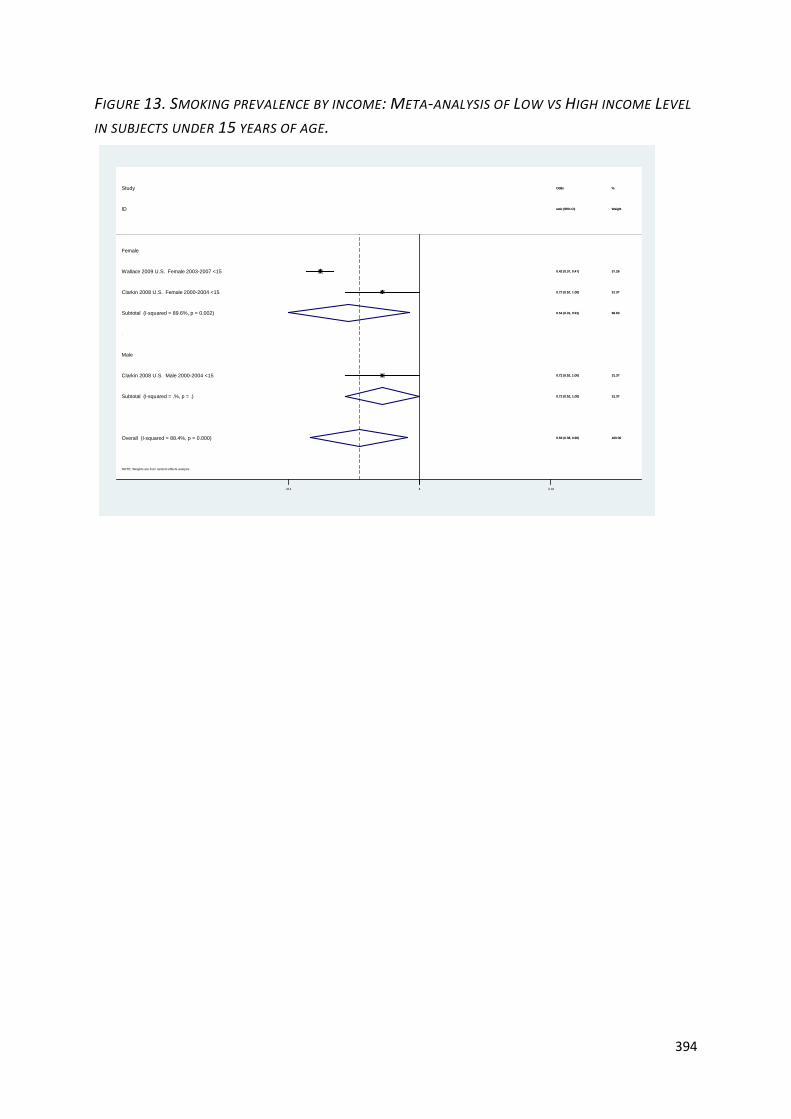
394
FIGURE 13. SMOKING PREVALENCE BY INCOME: META-ANALYSIS OF LOW VS HIGH INCOME LEVEL
IN SUBJECTS UNDER 15 YEARS OF AGE.
NOTE: Weights are from random effects analysis
.
.
Overall (I-squared = 88.4%, p = 0.000)
ID
Subtotal (I-squared = 89.6%, p = 0.002)
Male
Wallace 2009 U.S. Female 2003-2007 <15
Clarkin 2008 U.S. Male 2000-2004 <15
Clarkin 2008 U.S. Female 2000-2004 <15
Study
Female
Subtotal (I-squared = .%, p = .)
0.59 (0.38, 0.90)
ratio (95% CI)
0.54 (0.31, 0.91)
0.42 (0.37, 0.47)
0.72 (0.52, 1.00)
0.72 (0.52, 1.00)
Odds
0.72 (0.52, 1.00)
100.00
Weight
68.63
37.26
31.37
31.37
%
31.37
0.59 (0.38, 0.90)
ratio (95% CI)
0.54 (0.31, 0.91)
0.42 (0.37, 0.47)
0.72 (0.52, 1.00)
0.72 (0.52, 1.00)
Odds
0.72 (0.52, 1.00)
100.00
Weight
68.63
37.26
31.37
31.37
%
31.37
1.314 1 3.18

395
FIGURE 14. SMOKING PREVALENCE BY INCOME: META-ANALYSIS OF LOW VS HIGH INCOME LEVEL
BY STRATUM OF COUNTRY MORTALITY
NOTE: Weights are from random effects analysis
.
.
Overall (I-squared = 98.8%, p = 0.000)
White 2008 Australia1999 <15
Siahpush 2001 Female
Mfenyana 2006
Kiefe 2001 Male
Mitra 2012 U.S. female 2007-2009 All
Coreil 1991 20-39 Female
Al-Turki 2010 Saudi Arabia Female 2005 Adults
Khuwaja 2004 Male
Siahpush 2003-JECH Low
Amuzu 2009 UK Female 1999-2001 Adults White
Virtanen 2007 Male 1-19 cig
Webb 2008 G3 Female
Stringhini 2011 France2007 Adults Mix
Webb 2008 G2 Female
Al-Turki 2010 Saudi Arabia Male 2005 Adults
Nagelhout 2012 Netherlands Male 2008 Adults
Subtotal (I-squared = 99.0%, p = 0.000)
Parna 2002 Estonia Male 1996
Thomas 2008 Low
Moreira 1995
Leinsalu 2011 Hungary Male 2000 y 2003 Adults White
Bombard 2012 U.S. Female 2005-2006 NR
Metcalf 2007
Turrell 2002 Australia1995
Al-Windi 2010 Iraq2006 Adults
Erick-Peleti 2007 Female
Leinsalu 2011 Hungary Female 2000 y 2003 Adults White
Hosseinpoor 2011 48 LMIC Female 2002-2004 Adults
ID
Mody 2006 USA1996
Laaksonen 2003 Female
Pudaric 2000 Female
Pudaric 2000 Male
Shavers 2005 American natives
Hesketh2007 Male
Shapo 2003 Male
Aekplakorn 2008 Thailand Female 2004 Adults
Mohsin 2010 Australia Female 2005-2007 Adults
Low (Stratum A+B)
Reijneveld 2002
Schumann 2011 Germany Male 2006 Adults White
Fukuda 2007 Female >60 y
Gonçalves-Silva 2005 Low
Samet 1992 Female
Shavers 2005 Hispanics
Marrie 2009 U.S. 2006 Adults
Kahn 2002 Female
Pomerleau 1997
Fukuda 2007 Male >60 y
Virtanen 2007 Female CS
Kahn 2005 Female
White 2008 Australia2002 <15
Watson 2003 Female
White 2008 Australia1993 Adults
Kiefe 2001 Female
Laaksonen 2005 Female
Anaya Ocampo 2006 Male
White 2008 Australia1996 Adults
Fukuda 2005 Male
Shavers 2005 non-Hispanic whites
Al-Sahab 2010 Canada Female 2006 Adults
Virtanen 2007 Female 20+ cig
Zaitune 2012 Brazil2001-2002 Adults
White 2008 Australia1996 <15
Siahpush 2001 Male
Menezes 2008 Brazil Female 2004-2005 Adults Mix
Shavers 2005 African Americans
White 2008 Australia1990 <15
Hosseinpoor 2011 48 LMIC Male 2002-2004 Adults
Li 2012 U.S. Male 2002-2003 Adults
Alam 2008 Low
Marinho 2008
Laaksonen 2005 Male
Singh 1997 India Female 1991
Park 2010 South Korea Female 2005 Adults mix
Coreil 1991 65-74 Male
Mistry 2011 U.S. Male 2003-2004 Adults Mix
White 2008 Australia2002 Adults
Rahman 2005 Male
High: (Stratum C+D+E)
Cohen 2011 U.S. Female Adults Black
Anaya Ocampo 2006 Female
Singh 1997 India Male 1991
Johnson 2009 U.S. 2001-2005 Adults
Green 2007 18-34 y
White 2008 Australia1999 Adults
Lawrence 2007 Low
Metcalf 2008
Mitra 2012 U.S. female 2007-2009 All
Kim 2006-JPMPH Female
Virtanen 2007 Male 20+ cig
White 2008 Australia1993 <15
Stringhini 2011 France1995 Adults Mix
Coreil 1991 40-64 Female
White 2008 Australia2005 <15
Aekplakorn 2008 Thailand Male 2004 Adults
Chahine 2011 U.S. 2006-2007 Adults
Tehranifar 2009 U.S. Female 2001-2006 NR
Woitas- Slubowska 2010 Polland Male 2004 Adults
White 2008 Australia1987 <15
Jitnarin 2011 Thailand Female 2004-2005 Adults
Wister 1996 45-64 y
Kim 2006-JPMPH Male
Patrick 2012 U.S. 2005-2007 NR
Laaksonen 2003 Male
Menezes 2008 Brazil Male 2004-2005 Adults Mix
Mostashari 2005
Fukuda 2007 Female 20-59y
Cohen 2011 U.S. Male Adults White
Menezes 2008 Brazil Male 2000-2005 Adults
Pudule 1999 Female
White 2008 Australia1987 Adults
Pomerleau 2004 Female
Muller-Riemenschneider 2010 Germany2003-2006 <15
Clarkin 2008 U.S. Female 2000-2004 <15
Hajat 2010 U.S.2010 Adults
Fukuda 2007 Male 20-59y
Clarkin 2008 U.S. Male 2000-2004 <15
Bortoluzzi 2009 Brazil2005 Adults
Acevedo-Garcia 2005 USA1995-6
Virtanen 2007 Male CS
Sandin 2010 Brazil2009 Adults
King 1999 Low
Kuhnen 2009 Brazil2007 Adults
Cohen 2011 U.S. Male Adults Black
Silvestre Garcia 1990 Low
Pleis 2009 U.S. 2007 Adults
Woitas- Slubowska 2010 Polland Female 2004 Adults
Schumann 2011 Germany Female 2006 Adults White
White 2008 Australia1990 Adults
Schaap 2008
Nagelhout 2012 Netherlands Male 2001 Adults
Mekrungrongwong 2011 Thailand Male 2006 Adults
White 2008 Australia2005 Adults
Kumar 2011 India Male 2009 Adults
Gilmore 2001 Female
Pleis 2010 U.S. 2009 Adults Mix
Coreil 1991 65-74 Female
Shavers 2005
Cohen 2011 U.S. Female Adults White
Wister 1996 65+ y
Ross 2000
Jitnarin 2011 Thailand Male 2004-2005 Adults
Samet 1992 Male
Nagelhout 2012 Netherlands female 2008 Adults
Subtotal (I-squared = 84.2%, p = 0.000)
Fukuda 2005 Female
Coreil 1991 20-39 Male
Pudule 1999 Male
Mistry 2011 U.S. Female 2003-2004 Adults Mix
Yin 2011 China2007 Adults
Hughes 2010 U.S. 2004-2005 Adults
Wallace 2009 U.S. Female 2003-2007 <15
Webb 2008 G1 Female
Virtanen 2007 Female 1-19 cig
Mohsin 2010 Australia Female 1995-1997 Adults
Coreil 1991 40-64 Male
Dall'Agnol 2011 Brazil1998 <15
Menezes 2008 Brazil Female 2000-2005 Adults
Diez-Roux 1999 USA1992-1994
Gilmore 2001 Male
Lemstra 2009 Canada2001-2003 y 2005 Adults Natives
Nagelhout 2012 Netherlands female 2001 Adults
Kaleta 2007 Low
Pomerleau 2004 Male
Shapo 2003 Female
Wister 1996 25-44 y
Fagan 2008-NTR
Parna 2002 Estonia Female 1996
Study
1.45 (1.35, 1.56)
1.12 (0.91, 1.39)
1.43 (1.26, 1.62)
1.28 (1.00, 1.64)
2.96 (1.41, 6.21)
1.70 (1.20, 2.41)
1.02 (1.00, 1.05)
1.69 (1.47, 1.95)
0.91 (0.59, 1.40)
0.96 (0.41, 2.25)
2.34 (1.91, 2.87)
1.40 (1.11, 1.77)
3.70 (2.22, 6.17)
1.15 (0.95, 1.39)
2.56 (1.35, 4.87)
1.03 (0.97, 1.09)
1.84 (1.62, 2.09)
1.48 (1.37, 1.59)
1.00 (0.67, 1.49)
2.50 (1.96, 3.19)
1.03 (0.84, 1.26)
1.77 (1.35, 2.32)
5.40 (4.10, 7.11)
1.82 (1.38, 2.40)
2.02 (1.17, 3.49)
0.90 (0.61, 1.33)
0.87 (0.41, 1.85)
2.01 (1.53, 2.64)
0.90 (0.73, 1.11)
ratio (95% CI)
3.45 (3.23, 3.69)
1.30 (1.07, 1.58)
1.02 (0.72, 1.44)
1.50 (1.02, 2.21)
1.84 (1.04, 3.26)
0.83 (0.77, 0.90)
1.43 (0.72, 2.82)
1.00 (0.56, 1.80)
5.70 (5.50, 5.91)
1.36 (1.26, 1.47)
2.29 (1.08, 4.86)
1.98 (1.56, 2.51)
1.91 (1.59, 2.29)
4.17 (1.67, 10.42)
1.49 (1.23, 1.80)
1.83 (1.36, 2.46)
1.90 (1.40, 2.58)
1.84 (1.57, 2.16)
1.24 (1.08, 1.42)
1.25 (1.06, 1.47)
2.80 (1.70, 4.61)
1.03 (0.82, 1.30)
2.01 (0.99, 4.08)
0.83 (0.69, 0.99)
0.93 (0.43, 2.01)
1.58 (1.28, 1.95)
2.86 (1.33, 6.12)
0.83 (0.70, 0.98)
1.29 (1.17, 1.42)
1.92 (1.81, 2.04)
1.73 (1.08, 2.77)
1.58 (1.05, 2.38)
2.86 (1.82, 4.49)
1.19 (1.02, 1.39)
1.53 (1.37, 1.71)
1.37 (0.83, 2.26)
1.54 (1.28, 1.85)
0.87 (0.72, 1.04)
1.36 (1.19, 1.55)
1.10 (0.56, 2.14)
1.00 (0.42, 2.40)
1.52 (1.26, 1.83)
2.04 (1.39, 2.99)
0.52 (0.31, 0.87)
1.12 (0.61, 2.06)
1.01 (0.89, 1.15)
0.50 (0.31, 0.80)
1.04 (0.83, 1.31)
1.22 (0.75, 1.98)
1.68 (1.43, 1.97)
0.74 (0.26, 2.15)
0.89 (0.64, 1.24)
1.13 (0.84, 1.52)
1.77 (1.64, 1.91)
0.83 (0.64, 1.08)
1.47 (1.33, 1.62)
1.94 (1.38, 2.73)
1.30 (1.10, 1.54)
3.81 (2.90, 5.01)
1.89 (1.35, 2.65)
1.10 (0.93, 1.30)
1.40 (1.22, 1.61)
1.01 (0.98, 1.03)
1.54 (1.16, 2.04)
1.67 (1.43, 1.94)
1.55 (1.53, 1.57)
2.10 (0.80, 5.51)
1.11 (0.36, 3.41)
0.86 (0.70, 1.06)
3.70 (1.50, 9.13)
1.65 (1.28, 2.13)
1.34 (1.18, 1.52)
0.26 (0.14, 0.48)
1.36 (1.14, 1.62)
1.87 (1.08, 3.24)
1.30 (1.10, 1.54)
2.84 (2.50, 3.23)
1.60 (1.36, 1.88)
2.60 (1.61, 4.20)
0.95 (0.66, 1.38)
0.79 (0.64, 0.97)
1.18 (0.82, 1.69)
2.42 (1.97, 2.96)
0.72 (0.52, 1.00)
2.10 (1.41, 3.13)
1.31 (1.20, 1.43)
0.72 (0.52, 1.00)
1.60 (1.00, 2.56)
2.13 (2.04, 2.22)
1.56 (1.27, 1.92)
1.92 (0.18, 20.15)
1.64 (1.30, 2.07)
1.49 (1.26, 1.76)
1.67 (1.49, 1.87)
0.67 (0.40, 1.12)
1.79 (1.74, 1.84)
0.74 (0.22, 2.52)
5.41 (1.62, 18.07)
0.80 (0.65, 0.98)
0.95 (0.91, 0.99)
1.75 (1.55, 1.98)
1.91 (1.66, 2.20)
0.93 (0.69, 1.26)
2.00 (1.20, 3.33)
1.25 (0.50, 3.12)
2.04 (1.98, 2.10)
1.01 (0.94, 1.09)
1.19 (0.71, 1.99)
2.04 (1.76, 2.36)
1.65 (0.93, 2.91)
1.21 (0.95, 1.53)
1.30 (0.70, 2.41)
2.70 (1.35, 5.41)
2.26 (1.96, 2.61)
1.28 (1.09, 1.50)
2.03 (1.76, 2.34)
1.04 (1.02, 1.07)
1.82 (1.41, 2.35)
0.85 (0.53, 1.37)
1.17 (0.93, 1.47)
1.45 (1.23, 1.71)
0.42 (0.37, 0.47)
2.17 (1.52, 3.12)
1.23 (1.05, 1.44)
2.70 (2.60, 2.80)
1.01 (0.98, 1.05)
1.00 (0.56, 1.78)
1.94 (1.25, 3.01)
3.70 (1.60, 8.56)
1.32 (0.67, 2.60)
2.30 (1.61, 3.29)
1.79 (1.56, 2.05)
0.85 (0.72, 1.02)
1.43 (1.12, 1.82)
1.25 (0.50, 3.12)
1.68 (1.38, 2.05)
2.13 (1.85, 2.45)
0.97 (0.70, 1.34)
Odds
100.00
0.68
0.71
0.67
0.41
0.62
0.72
0.71
0.57
0.36
0.69
0.67
0.53
0.69
0.46
0.72
0.71
87.51
0.59
0.67
0.68
0.66
0.66
0.65
0.51
0.60
0.40
0.66
0.68
Weight
0.72
0.69
0.62
0.60
0.50
0.72
0.44
0.49
0.72
0.72
0.40
0.67
0.69
0.33
0.69
0.65
0.64
0.70
0.71
0.70
0.54
0.68
0.43
0.69
0.39
0.68
0.40
0.70
0.72
0.72
0.55
0.59
0.56
0.70
0.71
0.54
0.69
0.69
0.71
0.45
0.35
0.69
0.60
0.53
0.48
0.71
0.55
0.67
0.54
0.70
0.28
0.63
0.65
0.72
0.66
0.72
0.62
0.70
0.66
0.63
0.70
0.71
0.72
0.65
0.70
0.72
0.31
0.26
0.68
0.34
0.66
0.71
0.47
0.69
0.51
0.70
0.71
0.70
0.55
0.61
0.68
0.61
0.69
0.63
0.59
0.72
0.63
0.55
0.72
0.68
0.08
0.67
0.70
0.71
0.53
0.72
0.23
0.24
0.69
0.72
0.71
0.71
0.65
0.53
0.33
0.72
0.72
0.53
0.70
0.50
0.67
0.47
0.43
0.71
12.49
0.70
0.72
0.66
0.55
0.68
0.70
0.71
0.61
0.70
0.72
0.72
0.49
0.57
0.36
0.44
0.62
0.71
0.70
0.67
0.33
0.69
0.71
0.63
%
1.0496 1 20.2
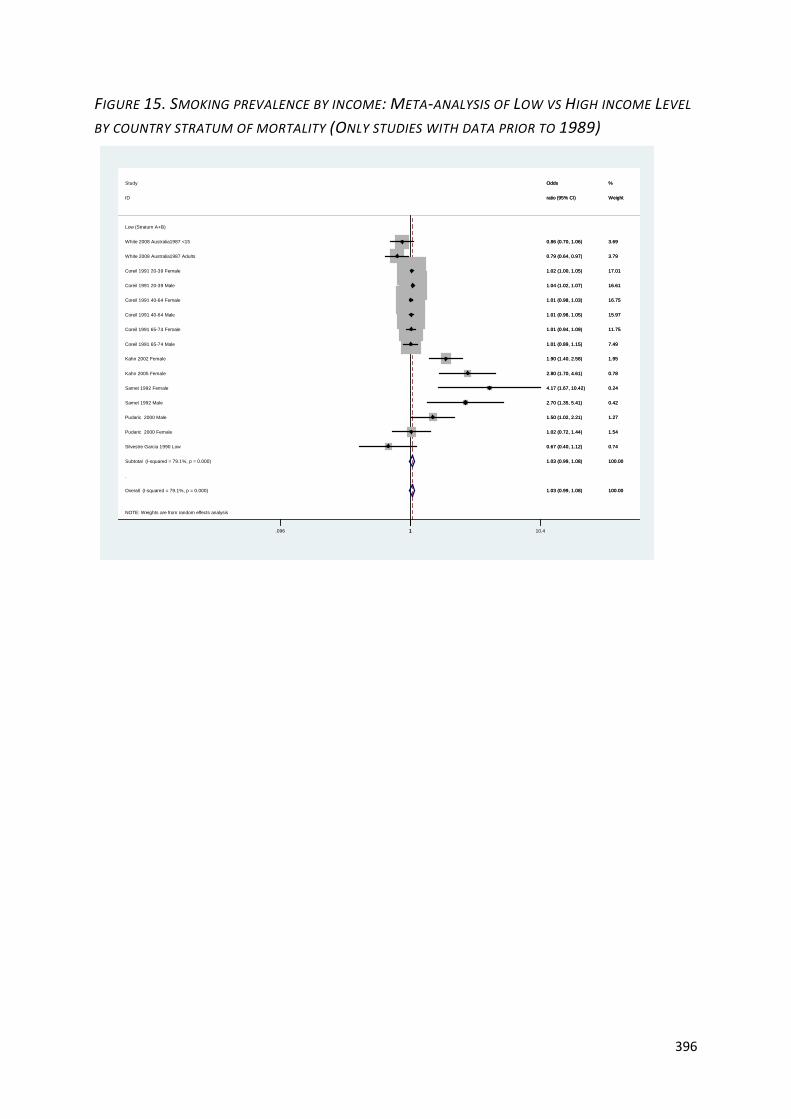
396
FIGURE 15. SMOKING PREVALENCE BY INCOME: META-ANALYSIS OF LOW VS HIGH INCOME LEVEL
BY COUNTRY STRATUM OF MORTALITY (ONLY STUDIES WITH DATA PRIOR TO 1989)
NOTE: Weights are from random effects analysis
.
Overall (I-squared = 79.1%, p = 0.000)
Kahn 2002 Female
Samet 1992 Female
Coreil 1991 20-39 Female
Pudaric 2000 Female
Subtotal (I-squared = 79.1%, p = 0.000)
Study
Kahn 2005 Female
ID
Coreil 1991 20-39 Male
Coreil 1991 40-64 Male
Coreil 1991 65-74 Female
Pudaric 2000 Male
Coreil 1991 40-64 Female
White 2008 Australia1987 <15
White 2008 Australia1987 Adults
Coreil 1991 65-74 Male
Samet 1992 Male
Low (Stratum A+B)
Silvestre Garcia 1990 Low
1.03 (0.99, 1.08)
1.90 (1.40, 2.58)
4.17 (1.67, 10.42)
1.02 (1.00, 1.05)
1.02 (0.72, 1.44)
1.03 (0.99, 1.08)
Odds
2.80 (1.70, 4.61)
ratio (95% CI)
1.04 (1.02, 1.07)
1.01 (0.98, 1.05)
1.01 (0.94, 1.09)
1.50 (1.02, 2.21)
1.01 (0.98, 1.03)
0.86 (0.70, 1.06)
0.79 (0.64, 0.97)
1.01 (0.89, 1.15)
2.70 (1.35, 5.41)
0.67 (0.40, 1.12)
100.00
1.95
0.24
17.01
1.54
100.00
%
0.78
Weight
16.61
15.97
11.75
1.27
16.75
3.69
3.79
7.49
0.42
0.74
1.03 (0.99, 1.08)
1.90 (1.40, 2.58)
4.17 (1.67, 10.42)
1.02 (1.00, 1.05)
1.02 (0.72, 1.44)
1.03 (0.99, 1.08)
Odds
2.80 (1.70, 4.61)
ratio (95% CI)
1.04 (1.02, 1.07)
1.01 (0.98, 1.05)
1.01 (0.94, 1.09)
1.50 (1.02, 2.21)
1.01 (0.98, 1.03)
0.86 (0.70, 1.06)
0.79 (0.64, 0.97)
1.01 (0.89, 1.15)
2.70 (1.35, 5.41)
0.67 (0.40, 1.12)
100.00
1.95
0.24
17.01
1.54
100.00
%
0.78
Weight
16.61
15.97
11.75
1.27
16.75
3.69
3.79
7.49
0.42
0.74
1.096 1 10.4
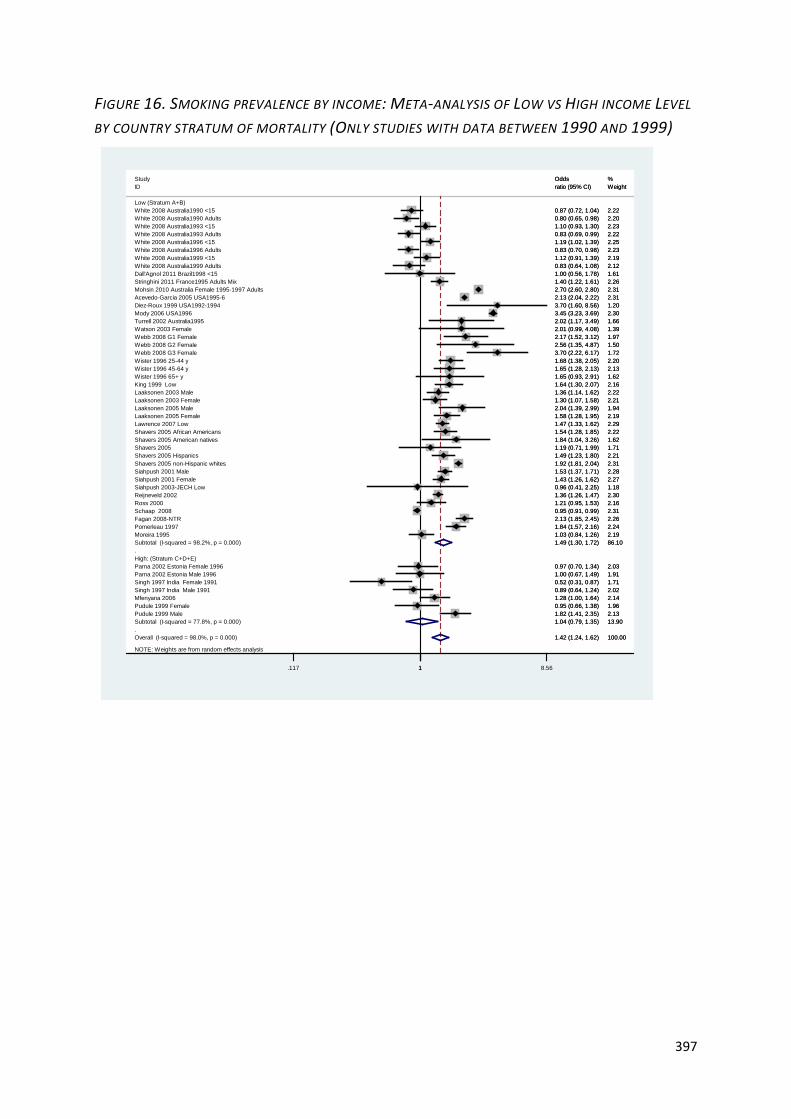
397
FIGURE 16. SMOKING PREVALENCE BY INCOME: META-ANALYSIS OF LOW VS HIGH INCOME LEVEL
BY COUNTRY STRATUM OF MORTALITY (ONLY STUDIES WITH DATA BETWEEN 1990 AND 1999)
NOTE: Weights are from random effects analysis
.
.
Overall (I-squared = 98.0%, p = 0.000)
Ross 2000
Mody 2006 USA1996
Mfenyana 2006
White 2008 Australia1993 Adults
Singh 1997 India Male 1991
Pudule 1999 Female
Shavers 2005 American natives
Shavers 2005 non-Hispanic whites
King 1999 Low
Parna 2002 Estonia Female 1996
White 2008 Australia1990 Adults
Siahpush 2001 Male
Pomerleau 1997
White 2008 Australia1996 Adults
Webb 2008 G1 Female
Shavers 2005
Fagan 2008-NTR
High: (Stratum C+D+E)
Low (Stratum A+B)
Wister 1996 45-64 yWister 1996 25-44 y
Singh 1997 India Female 1991
Webb 2008 G3 Female
White 2008 Australia1993 <15
Siahpush 2003-JECH LowSiahpush 2001 Female
Moreira 1995
Lawrence 2007 Low
ID
Dall'Agnol 2011 Brazil1998 <15
Wister 1996 65+ y
Subtotal (I-squared = 77.8%, p = 0.000)
Webb 2008 G2 Female
Laaksonen 2003 Female
White 2008 Australia1999 Adults
Mohsin 2010 Australia Female 1995-1997 Adults
Laaksonen 2005 MaleLaaksonen 2005 Female
Watson 2003 Female
Subtotal (I-squared = 98.2%, p = 0.000)
Laaksonen 2003 Male
Diez-Roux 1999 USA1992-1994
Stringhini 2011 France1995 Adults Mix
Pudule 1999 Male
Turrell 2002 Australia1995
Acevedo-Garcia 2005 USA1995-6
Parna 2002 Estonia Male 1996
White 2008 Australia1999 <15
Shavers 2005 African Americans
Reijneveld 2002
White 2008 Australia1996 <15
Shavers 2005 Hispanics
White 2008 Australia1990 <15
Schaap 2008
Study
1.42 (1.24, 1.62)
1.21 (0.95, 1.53)
3.45 (3.23, 3.69)
1.28 (1.00, 1.64)
0.83 (0.69, 0.99)
0.89 (0.64, 1.24)
0.95 (0.66, 1.38)
1.84 (1.04, 3.26)
1.92 (1.81, 2.04)
1.64 (1.30, 2.07)
0.97 (0.70, 1.34)
0.80 (0.65, 0.98)
1.53 (1.37, 1.71)
1.84 (1.57, 2.16)
0.83 (0.70, 0.98)
2.17 (1.52, 3.12)
1.19 (0.71, 1.99)
2.13 (1.85, 2.45)
1.65 (1.28, 2.13)1.68 (1.38, 2.05)
0.52 (0.31, 0.87)
3.70 (2.22, 6.17)
1.10 (0.93, 1.30)
0.96 (0.41, 2.25)1.43 (1.26, 1.62)
1.03 (0.84, 1.26)
1.47 (1.33, 1.62)
ratio (95% CI)
1.00 (0.56, 1.78)
1.65 (0.93, 2.91)
1.04 (0.79, 1.35)
2.56 (1.35, 4.87)
1.30 (1.07, 1.58)
0.83 (0.64, 1.08)
2.70 (2.60, 2.80)
2.04 (1.39, 2.99)1.58 (1.28, 1.95)
2.01 (0.99, 4.08)
1.49 (1.30, 1.72)
1.36 (1.14, 1.62)
3.70 (1.60, 8.56)
1.40 (1.22, 1.61)
1.82 (1.41, 2.35)
2.02 (1.17, 3.49)
2.13 (2.04, 2.22)
1.00 (0.67, 1.49)
1.12 (0.91, 1.39)
1.54 (1.28, 1.85)
1.36 (1.26, 1.47)
1.19 (1.02, 1.39)
1.49 (1.23, 1.80)
0.87 (0.72, 1.04)
0.95 (0.91, 0.99)
Odds
100.00
2.16
2.30
2.14
2.22
2.02
1.96
1.62
2.31
2.16
2.03
2.20
2.28
2.24
2.23
1.97
1.71
2.26
2.132.20
1.71
1.72
2.23
1.182.27
2.19
2.29
Weight
1.61
1.62
13.90
1.50
2.21
2.12
2.31
1.942.19
1.39
86.10
2.22
1.20
2.26
2.13
1.66
2.31
1.91
2.19
2.22
2.30
2.25
2.21
2.22
2.31
%
1.117 1 8.56
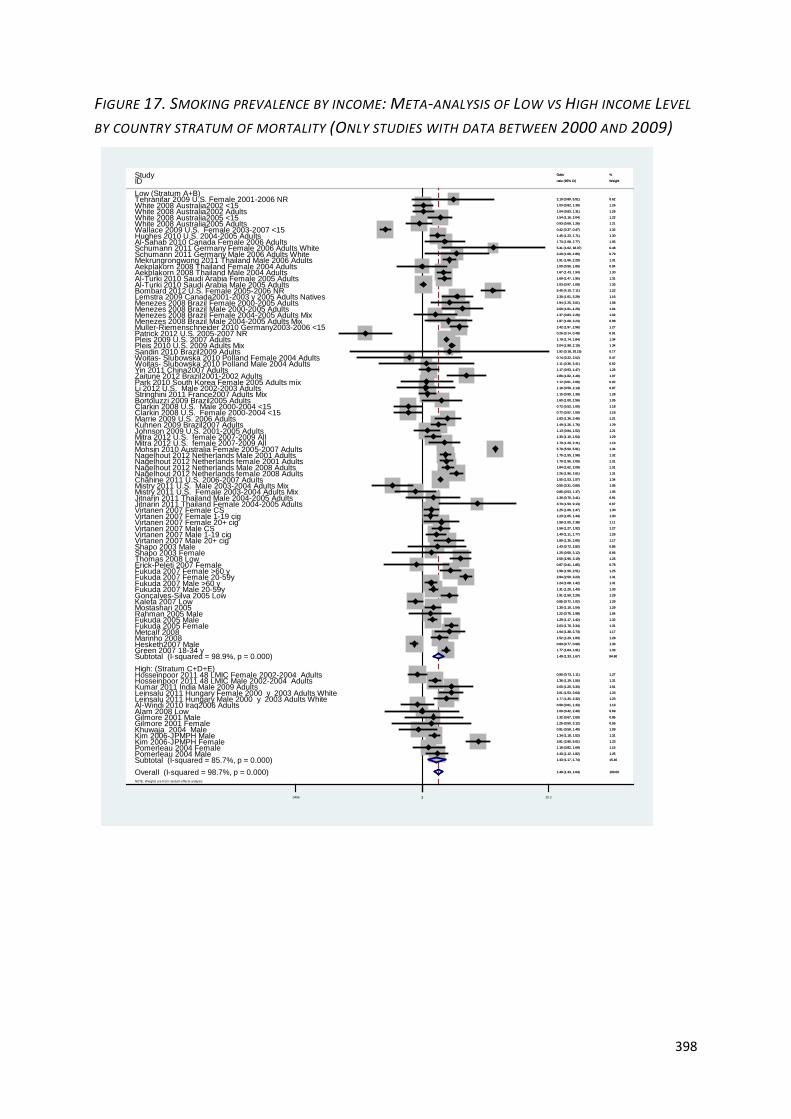
398
FIGURE 17. SMOKING PREVALENCE BY INCOME: META-ANALYSIS OF LOW VS HIGH INCOME LEVEL
BY COUNTRY STRATUM OF MORTALITY (ONLY STUDIES WITH DATA BETWEEN 2000 AND 2009)
NOTE: Weights are from random effects analysis
.
.
Overall (I-squared = 98.7%, p = 0.000)
Clarkin 2008 U.S. Male 2000-2004 <15
Pleis 2009 U.S. 2007 Adults
Marrie 2009 U.S. 2006 Adults
Mekrungrongwong 2011 Thailand Male 2006 Adults
Virtanen 2007 Female 1-19 cig
Erick-Peleti 2007 Female
Mistry 2011 U.S. Female 2003-2004 Adults Mix
Gilmore 2001 FemaleGilmore 2001 Male
Menezes 2008 Brazil Male 2004-2005 Adults Mix
Aekplakorn 2008 Thailand Male 2004 Adults
Al-Windi 2010 Iraq2006 Adults
Menezes 2008 Brazil Female 2000-2005 Adults
Sandin 2010 Brazil2009 Adults
Virtanen 2007 Male CS
Patrick 2012 U.S. 2005-2007 NR
Fukuda 2005 Male
Leinsalu 2011 Hungary Female 2000 y 2003 Adults White
Subtotal (I-squared = 98.9%, p = 0.000)
Fukuda 2007 Female 20-59y
Mitra 2012 U.S. female 2007-2009 All
Shapo 2003 Male
Pleis 2010 U.S. 2009 Adults Mix
Fukuda 2007 Female >60 y
Hughes 2010 U.S. 2004-2005 Adults
White 2008 Australia2005 <15
Muller-Riemenschneider 2010 Germany2003-2006 <15
White 2008 Australia2002 Adults
Mistry 2011 U.S. Male 2003-2004 Adults Mix
Green 2007 18-34 y
Johnson 2009 U.S. 2001-2005 Adults
Subtotal (I-squared = 85.7%, p = 0.000)
Bombard 2012 U.S. Female 2005-2006 NR
Menezes 2008 Brazil Male 2000-2005 Adults
Thomas 2008 LowShapo 2003 Female
Li 2012 U.S. Male 2002-2003 Adults
Virtanen 2007 Male 20+ cig
Hosseinpoor 2011 48 LMIC Male 2002-2004 Adults
Jitnarin 2011 Thailand Male 2004-2005 Adults
Rahman 2005 Male
Fukuda 2007 Male >60 y
Leinsalu 2011 Hungary Male 2000 y 2003 Adults White
Kim 2006-JPMPH Female
High: (Stratum C+D+E)
Kuhnen 2009 Brazil2007 Adults
White 2008 Australia2002 <15
Hosseinpoor 2011 48 LMIC Female 2002-2004 Adults
Clarkin 2008 U.S. Female 2000-2004 <15
Woitas- Slubowska 2010 Polland Male 2004 Adults
Al-Turki 2010 Saudi Arabia Male 2005 Adults
Virtanen 2007 Female 20+ cig
Mitra 2012 U.S. female 2007-2009 All
Al-Sahab 2010 Canada Female 2006 Adults
Al-Turki 2010 Saudi Arabia Female 2005 AdultsAekplakorn 2008 Thailand Female 2004 Adults
Bortoluzzi 2009 Brazil2005 Adults
Nagelhout 2012 Netherlands Male 2008 AdultsNagelhout 2012 Netherlands Male 2001 Adults
Khuwaja 2004 Male
Stringhini 2011 France2007 Adults Mix
Nagelhout 2012 Netherlands female 2008 Adults
Jitnarin 2011 Thailand Female 2004-2005 Adults
Zaitune 2012 Brazil2001-2002 AdultsYin 2011 China2007 Adults
Tehranifar 2009 U.S. Female 2001-2006 NR
Alam 2008 Low
Mostashari 2005
Schumann 2011 Germany Male 2006 Adults White
Pomerleau 2004 Female
Virtanen 2007 Male 1-19 cig
Metcalf 2008
Fukuda 2007 Male 20-59y
Menezes 2008 Brazil Female 2004-2005 Adults Mix
Marinho 2008
Virtanen 2007 Female CS
Lemstra 2009 Canada2001-2003 y 2005 Adults Natives
Chahine 2011 U.S. 2006-2007 Adults
Schumann 2011 Germany Female 2006 Adults White
Kaleta 2007 Low
Pomerleau 2004 Male
Mohsin 2010 Australia Female 2005-2007 Adults
Hesketh2007 Male
ID
Kim 2006-JPMPH Male
Kumar 2011 India Male 2009 Adults
Wallace 2009 U.S. Female 2003-2007 <15
Gonçalves-Silva 2005 Low
White 2008 Australia2005 Adults
Woitas- Slubowska 2010 Polland Female 2004 Adults
Fukuda 2005 Female
Park 2010 South Korea Female 2005 Adults mix
Nagelhout 2012 Netherlands female 2001 Adults
Low (Stratum A+B)
Study
1.48 (1.33, 1.64)
0.72 (0.52, 1.00)
1.79 (1.74, 1.84)
1.83 (1.36, 2.46)
1.91 (1.66, 2.20)
1.23 (1.05, 1.44)
0.87 (0.41, 1.85)
0.85 (0.53, 1.37)
1.25 (0.50, 3.12)
1.32 (0.67, 2.60)
1.87 (1.08, 3.24)
1.67 (1.43, 1.94)
0.90 (0.61, 1.33)
1.94 (1.25, 3.01)
1.92 (0.18, 20.15)
1.56 (1.27, 1.92)
0.26 (0.14, 0.48)
1.29 (1.17, 1.42)
2.01 (1.53, 2.64)
1.49 (1.33, 1.67)
2.84 (2.50, 3.23)
1.30 (1.10, 1.54)
1.43 (0.72, 2.82)
2.04 (1.98, 2.10)
1.98 (1.56, 2.51)
1.45 (1.23, 1.71)
1.54 (1.16, 2.04)
2.42 (1.97, 2.96)
1.04 (0.83, 1.31)
0.50 (0.31, 0.80)
1.77 (1.64, 1.91)
1.13 (0.84, 1.52)
1.43 (1.17, 1.74)
5.40 (4.10, 7.11)
2.60 (1.61, 4.20)
2.50 (1.96, 3.19)
1.25 (0.50, 3.12)
1.10 (0.56, 2.14)
1.89 (1.35, 2.65)
1.36 (1.19, 1.55)
1.30 (0.70, 2.41)
1.22 (0.75, 1.98)
1.24 (1.08, 1.42)
1.77 (1.35, 2.32)
3.81 (2.90, 5.01)
1.49 (1.26, 1.76)
1.03 (0.82, 1.30)
0.90 (0.73, 1.11)
0.72 (0.52, 1.00)
1.11 (0.36, 3.41)
1.03 (0.97, 1.09)
1.58 (1.05, 2.38)
1.70 (1.20, 2.41)
1.73 (1.08, 2.77)
1.69 (1.47, 1.95)
1.00 (0.56, 1.80)
1.60 (1.00, 2.56)
1.84 (1.62, 2.09)
1.75 (1.55, 1.98)
0.91 (0.59, 1.40)
1.15 (0.95, 1.39)
2.26 (1.96, 2.61)
3.70 (1.50, 9.13)
2.86 (1.82, 4.49)
1.17 (0.93, 1.47)
2.10 (0.80, 5.51)
1.00 (0.42, 2.40)
1.30 (1.10, 1.54)
2.29 (1.08, 4.86)
1.18 (0.82, 1.69)
1.40 (1.11, 1.77)
1.94 (1.38, 2.73)
1.31 (1.20, 1.43)
1.37 (0.83, 2.26)
1.52 (1.26, 1.83)
1.25 (1.06, 1.47)
2.30 (1.61, 3.29)
1.55 (1.53, 1.57)
5.41 (1.62, 18.07)
0.85 (0.72, 1.02)
1.43 (1.12, 1.82)
5.70 (5.50, 5.91)
0.83 (0.77, 0.90)
ratio (95% CI)
1.34 (1.18, 1.52)
2.00 (1.20, 3.33)
0.42 (0.37, 0.47)
1.91 (1.59, 2.29)
0.93 (0.69, 1.26)
0.74 (0.22, 2.52)
2.03 (1.76, 2.34)
1.12 (0.61, 2.06)
1.79 (1.56, 2.05)
Odds
100.00
1.18
1.34
1.21
1.31
1.30
0.78
1.05
0.66
0.85
0.98
1.30
1.13
1.08
0.17
1.27
0.91
1.32
1.23
84.60
1.31
1.29
0.85
1.34
1.25
1.30
1.22
1.27
1.26
1.05
1.33
1.21
15.40
1.22
1.04
1.25
0.66
0.87
1.17
1.31
0.91
1.04
1.31
1.23
1.23
1.29
1.26
1.27
1.18
0.52
1.33
1.11
1.16
1.05
1.31
0.94
1.05
1.31
1.32
1.09
1.28
1.31
0.67
1.07
1.26
0.62
0.69
1.29
0.79
1.15
1.26
1.17
1.33
1.02
1.28
1.30
1.16
1.34
0.48
1.29
1.25
1.34
1.33
Weight
1.31
1.01
1.32
1.29
1.21
0.47
1.31
0.92
1.31
%
1.0496 1 20.2
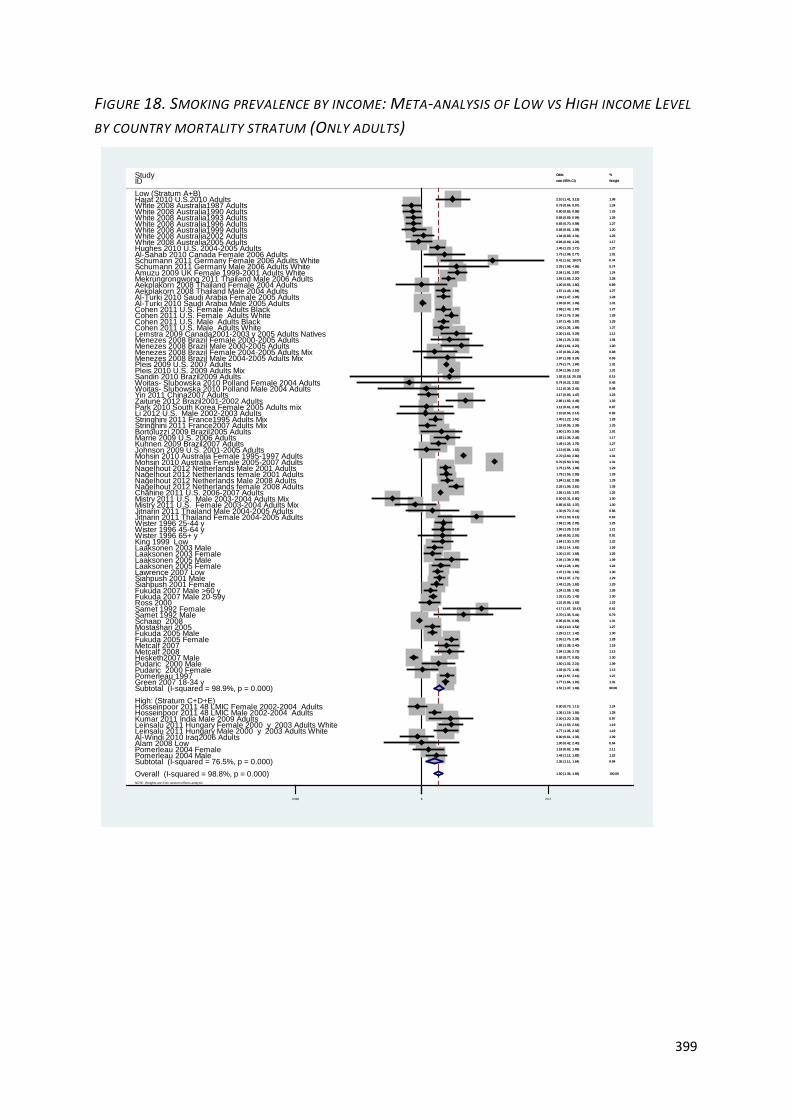
399
FIGURE 18. SMOKING PREVALENCE BY INCOME: META-ANALYSIS OF LOW VS HIGH INCOME LEVEL
BY COUNTRY MORTALITY STRATUM (ONLY ADULTS)
NOTE: Weights are from random effects analysis
.
.
Overall (I-squared = 98.8%, p = 0.000)
Wister 1996 25-44 y
Park 2010 South Korea Female 2005 Adults mix
Menezes 2008 Brazil Female 2000-2005 Adults
Aekplakorn 2008 Thailand Male 2004 Adults
Mohsin 2010 Australia Female 1995-1997 Adults
Mistry 2011 U.S. Male 2003-2004 Adults Mix
Nagelhout 2012 Netherlands Male 2001 Adults
Li 2012 U.S. Male 2002-2003 Adults
Chahine 2011 U.S. 2006-2007 Adults
Fukuda 2007 Male >60 y
Woitas- Slubowska 2010 Polland Female 2004 Adults
High: (Stratum C+D+E)
Zaitune 2012 Brazil2001-2002 Adults
Schumann 2011 Germany Male 2006 Adults White
Metcalf 2008
Mekrungrongwong 2011 Thailand Male 2006 Adults
Al-Turki 2010 Saudi Arabia Female 2005 Adults
White 2008 Australia2002 Adults
Hesketh2007 Male
White 2008 Australia1993 Adults
Aekplakorn 2008 Thailand Female 2004 Adults
White 2008 Australia1996 AdultsWhite 2008 Australia1999 Adults
Mostashari 2005
Pudaric 2000 Female
Schaap 2008
Laaksonen 2005 Male
Fukuda 2005 Female
Pomerleau 2004 Female
Metcalf 2007
Leinsalu 2011 Hungary Female 2000 y 2003 Adults White
Jitnarin 2011 Thailand Female 2004-2005 Adults
Cohen 2011 U.S. Male Adults Black
Nagelhout 2012 Netherlands Male 2008 Adults
Al-Windi 2010 Iraq2006 Adults
Siahpush 2001 Male
Alam 2008 Low
Stringhini 2011 France1995 Adults Mix
Laaksonen 2003 Female
White 2008 Australia2005 Adults
Laaksonen 2005 Female
Fukuda 2007 Male 20-59y
Kuhnen 2009 Brazil2007 Adults
Jitnarin 2011 Thailand Male 2004-2005 AdultsMistry 2011 U.S. Female 2003-2004 Adults Mix
Al-Turki 2010 Saudi Arabia Male 2005 Adults
Johnson 2009 U.S. 2001-2005 Adults
Siahpush 2001 Female
Cohen 2011 U.S. Male Adults White
Wister 1996 45-64 y
Pleis 2009 U.S. 2007 Adults
Green 2007 18-34 y
Yin 2011 China2007 Adults
Pleis 2010 U.S. 2009 Adults Mix
Marrie 2009 U.S. 2006 Adults
ID
Ross 2000
Laaksonen 2003 Male
Pomerleau 1997
Mohsin 2010 Australia Female 2005-2007 Adults
Subtotal (I-squared = 76.5%, p = 0.000)
Bortoluzzi 2009 Brazil2005 Adults
Nagelhout 2012 Netherlands female 2001 Adults
Hosseinpoor 2011 48 LMIC Male 2002-2004 Adults
Leinsalu 2011 Hungary Male 2000 y 2003 Adults White
White 2008 Australia1990 Adults
Samet 1992 Female
Menezes 2008 Brazil Female 2004-2005 Adults MixMenezes 2008 Brazil Male 2004-2005 Adults MixMenezes 2008 Brazil Male 2000-2005 Adults
Wister 1996 65+ y
Lemstra 2009 Canada2001-2003 y 2005 Adults Natives
Subtotal (I-squared = 98.9%, p = 0.000)
Nagelhout 2012 Netherlands female 2008 Adults
Cohen 2011 U.S. Female Adults WhiteCohen 2011 U.S. Female Adults Black
Hosseinpoor 2011 48 LMIC Female 2002-2004 AdultsKumar 2011 India Male 2009 Adults
King 1999 Low
Pudaric 2000 Male
Samet 1992 Male
Low (Stratum A+B)
Fukuda 2005 Male
Lawrence 2007 Low
Schumann 2011 Germany Female 2006 Adults WhiteHughes 2010 U.S. 2004-2005 Adults
Pomerleau 2004 Male
Study
Al-Sahab 2010 Canada Female 2006 Adults
Woitas- Slubowska 2010 Polland Male 2004 Adults
White 2008 Australia1987 Adults
Sandin 2010 Brazil2009 Adults
Hajat 2010 U.S.2010 Adults
Amuzu 2009 UK Female 1999-2001 Adults White
Stringhini 2011 France2007 Adults Mix
1.50 (1.36, 1.66)
1.68 (1.38, 2.05)
1.12 (0.61, 2.06)
1.94 (1.25, 3.01)
1.67 (1.43, 1.94)
2.70 (2.60, 2.80)
0.50 (0.31, 0.80)
1.75 (1.55, 1.98)
1.10 (0.56, 2.14)
1.55 (1.53, 1.57)
1.24 (1.08, 1.42)
0.74 (0.22, 2.52)
2.86 (1.82, 4.49)
2.29 (1.08, 4.86)
1.94 (1.38, 2.73)
1.91 (1.66, 2.20)
1.69 (1.47, 1.95)
1.04 (0.83, 1.31)
0.83 (0.77, 0.90)
0.83 (0.69, 0.99)
1.00 (0.56, 1.80)
0.83 (0.70, 0.98)
0.83 (0.64, 1.08)
1.30 (1.10, 1.54)
1.02 (0.72, 1.44)
0.95 (0.91, 0.99)
2.04 (1.39, 2.99)
2.03 (1.76, 2.34)
1.18 (0.82, 1.69)
1.82 (1.38, 2.40)
2.01 (1.53, 2.64)
3.70 (1.50, 9.13)
1.67 (1.49, 1.87)
1.84 (1.62, 2.09)
0.90 (0.61, 1.33)
1.53 (1.37, 1.71)
1.00 (0.42, 2.40)
1.40 (1.22, 1.61)
1.30 (1.07, 1.58)
0.93 (0.69, 1.26)
1.58 (1.28, 1.95)
1.31 (1.20, 1.43)
1.49 (1.26, 1.76)
1.30 (0.70, 2.41)
0.85 (0.53, 1.37)
1.03 (0.97, 1.09)
1.13 (0.84, 1.52)
1.43 (1.26, 1.62)
1.60 (1.36, 1.88)
1.65 (1.28, 2.13)
1.79 (1.74, 1.84)
1.77 (1.64, 1.91)
1.17 (0.93, 1.47)
2.04 (1.98, 2.10)
1.83 (1.36, 2.46)
ratio (95% CI)
1.21 (0.95, 1.53)
1.36 (1.14, 1.62)
1.84 (1.57, 2.16)
5.70 (5.50, 5.91)
1.35 (1.11, 1.64)
1.60 (1.00, 2.56)
1.79 (1.56, 2.05)
1.36 (1.19, 1.55)
1.77 (1.35, 2.32)
0.80 (0.65, 0.98)
4.17 (1.67, 10.42)
1.37 (0.83, 2.26)
1.87 (1.08, 3.24)
2.60 (1.61, 4.20)
1.65 (0.93, 2.91)
2.30 (1.61, 3.29)
1.52 (1.37, 1.69)
2.26 (1.96, 2.61)
2.04 (1.76, 2.36)
1.68 (1.43, 1.97)
0.90 (0.73, 1.11)
2.00 (1.20, 3.33)
1.64 (1.30, 2.07)
1.50 (1.02, 2.21)
2.70 (1.35, 5.41)
1.29 (1.17, 1.42)
1.47 (1.33, 1.62)
5.41 (1.62, 18.07)
1.45 (1.23, 1.71)
1.43 (1.12, 1.82)
Odds
1.73 (1.08, 2.77)
1.11 (0.36, 3.41)
0.79 (0.64, 0.97)
1.92 (0.18, 20.15)
2.10 (1.41, 3.13)
2.34 (1.91, 2.87)
1.15 (0.95, 1.39)
100.00
1.25
0.87
1.04
1.27
1.31
1.00
1.29
0.82
1.32
1.28
0.43
1.03
0.74
1.13
1.28
1.28
1.23
1.30
1.26
0.89
1.27
1.20
1.27
1.13
1.31
1.09
1.28
1.11
1.19
1.19
0.62
1.29
1.29
1.09
1.29
0.64
1.28
1.25
1.17
1.24
1.30
1.27
0.86
1.00
1.31
1.17
1.29
1.27
1.21
1.31
1.31
1.23
1.31
1.17
Weight
1.22
1.26
1.27
1.31
9.94
1.01
1.28
1.28
1.19
1.25
0.61
0.98
0.93
1.00
0.91
1.12
90.06
1.28
1.28
1.27
1.24
0.97
1.22
1.09
0.79
1.30
1.30
0.44
1.27
1.22
%
1.01
0.48
1.24
0.15
1.08
1.24
1.25
1.0496 1 20.2
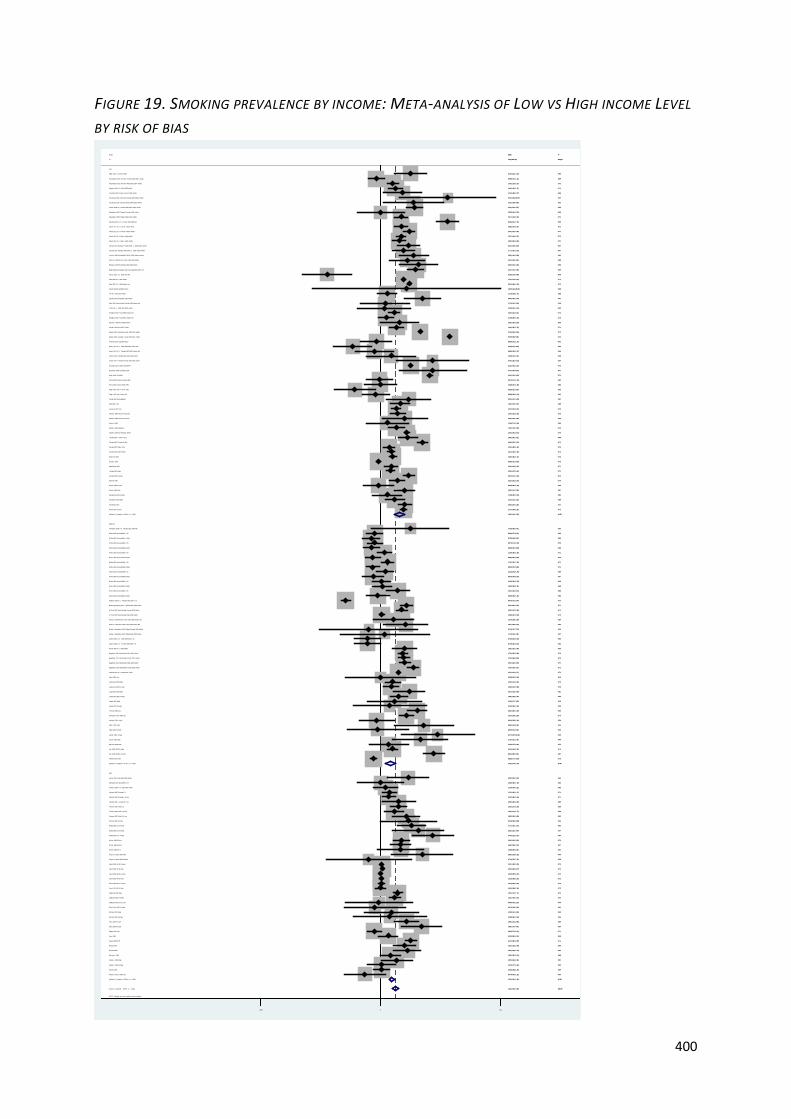
400
FIGURE 19. SMOKING PREVALENCE BY INCOME: META-ANALYSIS OF LOW VS HIGH INCOME LEVEL
BY RISK OF BIAS
NOTE: Weights are from random effects analysis
.
.
.
Overall (I-squared = 98.8%, p = 0.000)
Al-Windi 2010 Iraq2006 Adults
Laaksonen 2005 Male
Leinsalu 2011 Hungary Female 2000 y 2003 Adults White
Coreil 1991 40-64 Male
Schaap 2008
Mfenyana 2006
Lawrence 2007 Low
Subtotal (I-squared = 98.8%, p = 0.000)
Alam 2008 Low
Mistry 2011 U.S. Female 2003-2004 Adults Mix
Pudaric 2000 Male
Zaitune 2012 Brazil2001-2002 Adults
Kim 2006-JPMPH Male
Samet 1992 Female
Fagan 2008-NTR
Subtotal (I-squared = 96.4%, p = 0.000)
White 2008 Australia1993 Adults
High
Woitas- Slubowska 2010 Polland Male 2004 Adults
Dall'Agnol 2011 Brazil1998 <15
Johnson 2009 U.S. 2001-2005 Adults
Nagelhout 2012 Netherlands Male 2008 Adults
Virtanen 2007 Female 1-19 cig
Virtanen 2007 Female 20+ cig
Webb 2008 G3 Female
Siahpush 2001 Male
Fukuda 2007 Female >60 y
Coreil 1991 20-39 Male
Webb 2008 G1 Female
Clarkin 2008 U.S. Female 2000-2004 <15
Mistry 2011 U.S. Male 2003-2004 Adults Mix
Mohsin 2010 Australia Female 2005-2007 Adults
Virtanen 2007 Male 20+ cig
Fukuda 2007 Female 20-59y
Al-Turki 2010 Saudi Arabia Male 2005 Adults
White 2008 Australia1987 Adults
Coreil 1991 20-39 Female
Pudaric 2000 Female
Singh 1997 India Female 1991
Patrick 2012 U.S. 2005-2007 NR
Shavers 2005 African Americans
Coreil 1991 65-74 Male
Coreil 1991 40-64 Female
Siahpush 2001 Female
Shavers 2005 Hispanics
Nagelhout 2012 Netherlands Male 2001 Adults
Gilmore 2001 Male
Shapo 2003 Female
Gonçalves-Silva 2005 Low
Pudule 1999 Female
White 2008 Australia1996 Adults
Ross 2000
Coreil 1991 65-74 Female
Green 2007 18-34 y
Metcalf 2008
Metcalf 2007
Schumann 2011 Germany Female 2006 Adults White
Parna 2002 Estonia Female 1996
Parna 2002 Estonia Male 1996
Subtotal (I-squared = 89.8%, p = 0.000)
Rahman 2005 Male
Menezes 2008 Brazil Male 2000-2005 Adults
Kim 2006-JPMPH Female
Laaksonen 2003 Male
Tehranifar 2009 U.S. Female 2001-2006 NR
Li 2012 U.S. Male 2002-2003 Adults
Virtanen 2007 Female CS
ID
Hosseinpoor 2011 48 LMIC Male 2002-2004 Adults
Cohen 2011 U.S. Female Adults White
Mody 2006 USA1996
Chahine 2011 U.S. 2006-2007 Adults
Fukuda 2007 Male 20-59y
White 2008 Australia1993 <15
Moderate
Wister 1996 25-44 y
White 2008 Australia2005 Adults
Kiefe 2001 Male
Al-Turki 2010 Saudi Arabia Female 2005 Adults
Acevedo-Garcia 2005 USA1995-6
Stringhini 2011 France2007 Adults Mix
Mekrungrongwong 2011 Thailand Male 2006 Adults
Fukuda 2005 Male
Hesketh2007 Male
White 2008 Australia2002 <15
White 2008 Australia1996 <15
White 2008 Australia1999 <15
Woitas- Slubowska 2010 Polland Female 2004 Adults
Mostashari 2005
Erick-Peleti 2007 Female
White 2008 Australia1999 Adults
Shavers 2005 non-Hispanic whites
Cohen 2011 U.S. Female Adults Black
Turrell 2002 Australia1995
Menezes 2008 Brazil Female 2004-2005 Adults Mix
Kuhnen 2009 Brazil2007 Adults
Nagelhout 2012 Netherlands female 2001 Adults
Siahpush 2003-JECH Low
Moreira 1995
Kumar 2011 India Male 2009 Adults
Pomerleau 1997
Nagelhout 2012 Netherlands female 2008 Adults
Diez-Roux 1999 USA1992-1994
Pudule 1999 Male
Kaleta 2007 Low
Aekplakorn 2008 Thailand Male 2004 Adults
Anaya Ocampo 2006 Male
White 2008 Australia2002 Adults
Bombard 2012 U.S. Female 2005-2006 NR
Reijneveld 2002
Stringhini 2011 France1995 Adults Mix
Fukuda 2007 Male >60 y
Wister 1996 65+ y
Khuwaja 2004 Male
Mohsin 2010 Australia Female 1995-1997 Adults
Pomerleau 2004 Male
Laaksonen 2005 Female
Samet 1992 Male
Schumann 2011 Germany Male 2006 Adults White
Kahn 2002 Female
Gilmore 2001 Female
Shavers 2005
Singh 1997 India Male 1991
Watson 2003 Female
Anaya Ocampo 2006 Female
Lemstra 2009 Canada2001-2003 y 2005 Adults Natives
White 2008 Australia1987 <15
Menezes 2008 Brazil Female 2000-2005 Adults
Kahn 2005 Female
Kiefe 2001 Female
Laaksonen 2003 Female
Park 2010 South Korea Female 2005 Adults mix
Virtanen 2007 Male 1-19 cig
Pomerleau 2004 Female
Clarkin 2008 U.S. Male 2000-2004 <15
Marrie 2009 U.S. 2006 Adults
Bortoluzzi 2009 Brazil2005 Adults
Silvestre Garcia 1990 Low
Jitnarin 2011 Thailand Male 2004-2005 Adults
Wister 1996 45-64 y
Virtanen 2007 Male CS
White 2008 Australia1990 <15
Yin 2011 China2007 Adults
Wallace 2009 U.S. Female 2003-2007 <15
Hosseinpoor 2011 48 LMIC Female 2002-2004 Adults
Webb 2008 G2 Female
Shavers 2005 American natives
Muller-Riemenschneider 2010 Germany2003-2006 <15
Jitnarin 2011 Thailand Female 2004-2005 Adults
Leinsalu 2011 Hungary Male 2000 y 2003 Adults White
Low
White 2008 Australia2005 <15
Pleis 2009 U.S. 2007 Adults
Cohen 2011 U.S. Male Adults White
Cohen 2011 U.S. Male Adults Black
White 2008 Australia1990 Adults
Marinho 2008
Thomas 2008 Low
Fukuda 2005 Female
Aekplakorn 2008 Thailand Female 2004 Adults
Amuzu 2009 UK Female 1999-2001 Adults White
Sandin 2010 Brazil2009 Adults
Shapo 2003 Male
Menezes 2008 Brazil Male 2004-2005 Adults Mix
Hughes 2010 U.S. 2004-2005 Adults
Al-Sahab 2010 Canada Female 2006 Adults
Pleis 2010 U.S. 2009 Adults Mix
Hajat 2010 U.S.2010 Adults
King 1999 Low
Study
1.45 (1.35, 1.56)
0.90 (0.61, 1.33)
2.04 (1.39, 2.99)
2.01 (1.53, 2.64)
1.01 (0.98, 1.05)
0.95 (0.91, 0.99)
1.28 (1.00, 1.64)
1.47 (1.33, 1.62)
1.60 (1.42, 1.80)
1.00 (0.42, 2.40)
0.85 (0.53, 1.37)
1.50 (1.02, 2.21)
2.86 (1.82, 4.49)
1.34 (1.18, 1.52)
4.17 (1.67, 10.42)
2.13 (1.85, 2.45)
1.28 (1.14, 1.43)
0.83 (0.69, 0.99)
1.11 (0.36, 3.41)
1.00 (0.56, 1.78)
1.13 (0.84, 1.52)
1.84 (1.62, 2.09)
1.23 (1.05, 1.44)
1.58 (1.05, 2.38)
3.70 (2.22, 6.17)
1.53 (1.37, 1.71)
1.98 (1.56, 2.51)
1.04 (1.02, 1.07)
2.17 (1.52, 3.12)
0.72 (0.52, 1.00)
0.50 (0.31, 0.80)
5.70 (5.50, 5.91)
1.89 (1.35, 2.65)
2.84 (2.50, 3.23)
1.03 (0.97, 1.09)
0.79 (0.64, 0.97)
1.02 (1.00, 1.05)
1.02 (0.72, 1.44)
0.52 (0.31, 0.87)
0.26 (0.14, 0.48)
1.54 (1.28, 1.85)
1.01 (0.89, 1.15)
1.01 (0.98, 1.03)
1.43 (1.26, 1.62)
1.49 (1.23, 1.80)
1.75 (1.55, 1.98)
1.32 (0.67, 2.60)
1.25 (0.50, 3.12)
1.91 (1.59, 2.29)
0.95 (0.66, 1.38)
0.83 (0.70, 0.98)
1.21 (0.95, 1.53)
1.01 (0.94, 1.09)
1.77 (1.64, 1.91)
1.94 (1.38, 2.73)
1.82 (1.38, 2.40)
5.41 (1.62, 18.07)
0.97 (0.70, 1.34)
1.00 (0.67, 1.49)
1.32 (1.25, 1.40)
1.22 (0.75, 1.98)
2.60 (1.61, 4.20)
3.81 (2.90, 5.01)
1.36 (1.14, 1.62)
2.10 (0.80, 5.51)
1.10 (0.56, 2.14)
1.25 (1.06, 1.47)
ratio (95% CI)
1.36 (1.19, 1.55)
2.04 (1.76, 2.36)
3.45 (3.23, 3.69)
1.55 (1.53, 1.57)
1.31 (1.20, 1.43)
1.10 (0.93, 1.30)
1.68 (1.38, 2.05)
0.93 (0.69, 1.26)
2.96 (1.41, 6.21)
1.69 (1.47, 1.95)
2.13 (2.04, 2.22)
1.15 (0.95, 1.39)
1.91 (1.66, 2.20)
1.29 (1.17, 1.42)
0.83 (0.77, 0.90)
1.03 (0.82, 1.30)
1.19 (1.02, 1.39)
1.12 (0.91, 1.39)
0.74 (0.22, 2.52)
1.30 (1.10, 1.54)
0.87 (0.41, 1.85)
0.83 (0.64, 1.08)
1.92 (1.81, 2.04)
1.68 (1.43, 1.97)
2.02 (1.17, 3.49)
1.37 (0.83, 2.26)
1.49 (1.26, 1.76)
1.79 (1.56, 2.05)
0.96 (0.41, 2.25)
1.03 (0.84, 1.26)
2.00 (1.20, 3.33)
1.84 (1.57, 2.16)
2.26 (1.96, 2.61)
3.70 (1.60, 8.56)
1.82 (1.41, 2.35)
0.85 (0.72, 1.02)
1.67 (1.43, 1.94)
2.86 (1.33, 6.12)
1.04 (0.83, 1.31)
5.40 (4.10, 7.11)
1.36 (1.26, 1.47)
1.40 (1.22, 1.61)
1.24 (1.08, 1.42)
1.65 (0.93, 2.91)
0.91 (0.59, 1.40)
2.70 (2.60, 2.80)
1.43 (1.12, 1.82)
1.58 (1.28, 1.95)
2.70 (1.35, 5.41)
2.29 (1.08, 4.86)
1.90 (1.40, 2.58)
1.25 (0.50, 3.12)
1.19 (0.71, 1.99)
0.89 (0.64, 1.24)
2.01 (0.99, 4.08)
0.74 (0.26, 2.15)
2.30 (1.61, 3.29)
0.86 (0.70, 1.06)
1.94 (1.25, 3.01)
2.80 (1.70, 4.61)
0.93 (0.43, 2.01)
1.30 (1.07, 1.58)
1.12 (0.61, 2.06)
1.40 (1.11, 1.77)
1.18 (0.82, 1.69)
0.72 (0.52, 1.00)
1.83 (1.36, 2.46)
1.60 (1.00, 2.56)
0.67 (0.40, 1.12)
1.30 (0.70, 2.41)
1.65 (1.28, 2.13)
1.56 (1.27, 1.92)
0.87 (0.72, 1.04)
1.17 (0.93, 1.47)
0.42 (0.37, 0.47)
0.90 (0.73, 1.11)
2.56 (1.35, 4.87)
1.84 (1.04, 3.26)
2.42 (1.97, 2.96)
3.70 (1.50, 9.13)
1.77 (1.35, 2.32)
1.54 (1.16, 2.04)
1.79 (1.74, 1.84)
1.60 (1.36, 1.88)
1.67 (1.49, 1.87)
0.80 (0.65, 0.98)
1.52 (1.26, 1.83)
2.50 (1.96, 3.19)
2.03 (1.76, 2.34)
1.00 (0.56, 1.80)
2.34 (1.91, 2.87)
1.92 (0.18, 20.15)
1.43 (0.72, 2.82)
1.87 (1.08, 3.24)
1.45 (1.23, 1.71)
1.73 (1.08, 2.77)
2.04 (1.98, 2.10)
2.10 (1.41, 3.13)
1.64 (1.30, 2.07)
Odds
100.00
0.61
0.61
0.67
0.73
0.73
0.68
0.72
44.55
0.35
0.56
0.61
0.57
0.72
0.34
0.71
30.00
0.70
0.27
0.50
0.65
0.72
0.71
0.60
0.54
0.72
0.68
0.73
0.62
0.64
0.56
0.73
0.63
0.72
0.73
0.69
0.73
0.63
0.53
0.48
0.70
0.72
0.73
0.72
0.70
0.72
0.45
0.34
0.70
0.62
0.71
0.68
0.73
0.73
0.63
0.66
0.24
0.64
0.60
25.45
0.55
0.56
0.67
0.70
0.32
0.45
0.71
Weight
0.72
0.71
0.73
0.73
0.73
0.71
0.70
0.65
0.41
0.71
0.73
0.70
0.71
0.72
0.73
0.68
0.71
0.69
0.24
0.71
0.41
0.67
0.73
0.71
0.52
0.54
0.71
0.72
0.36
0.69
0.54
0.71
0.71
0.37
0.67
0.71
0.71
0.40
0.68
0.66
0.73
0.72
0.72
0.51
0.58
0.73
0.68
0.69
0.44
0.41
0.65
0.34
0.53
0.64
0.43
0.28
0.62
0.69
0.58
0.54
0.40
0.70
0.48
0.68
0.62
0.64
0.65
0.56
0.53
0.48
0.67
0.69
0.70
0.68
0.72
0.69
0.47
0.50
0.69
0.34
0.67
0.66
0.73
0.71
0.72
0.69
0.70
0.68
0.71
0.49
0.69
0.08
0.45
0.52
0.71
0.56
0.73
0.60
0.68
%
1.0496 1 20.2
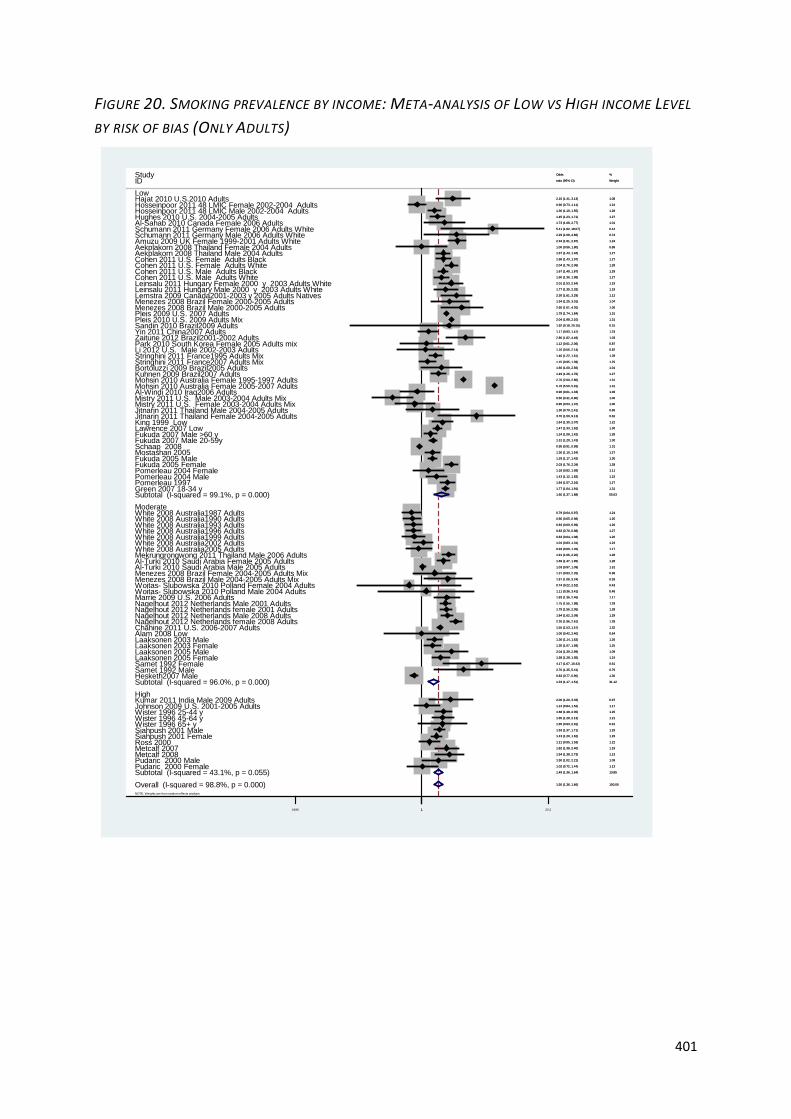
401
FIGURE 20. SMOKING PREVALENCE BY INCOME: META-ANALYSIS OF LOW VS HIGH INCOME LEVEL
BY RISK OF BIAS (ONLY ADULTS)
NOTE: Weights are from random effects analysis
.
.
.
Overall (I-squared = 98.8%, p = 0.000)
Fukuda 2005 Male
White 2008 Australia2005 Adults
Hughes 2010 U.S. 2004-2005 Adults
Samet 1992 Female
Mekrungrongwong 2011 Thailand Male 2006 Adults
Cohen 2011 U.S. Male Adults White
Stringhini 2011 France2007 Adults Mix
Mostashari 2005
Nagelhout 2012 Netherlands Male 2008 Adults
Schumann 2011 Germany Male 2006 Adults White
White 2008 Australia1996 Adults
Kuhnen 2009 Brazil2007 Adults
Mistry 2011 U.S. Female 2003-2004 Adults Mix
Wister 1996 65+ y
Hesketh2007 Male
Alam 2008 Low
Lawrence 2007 Low
ID
Cohen 2011 U.S. Female Adults Black
Jitnarin 2011 Thailand Male 2004-2005 Adults
Woitas- Slubowska 2010 Polland Female 2004 Adults
Menezes 2008 Brazil Female 2000-2005 Adults
Laaksonen 2005 Female
Ross 2000
Marrie 2009 U.S. 2006 Adults
Chahine 2011 U.S. 2006-2007 Adults
Fukuda 2005 Female
Nagelhout 2012 Netherlands female 2001 Adults
Metcalf 2008
Stringhini 2011 France1995 Adults Mix
Mohsin 2010 Australia Female 2005-2007 Adults
High
Metcalf 2007
Menezes 2008 Brazil Male 2004-2005 Adults Mix
Study
Schumann 2011 Germany Female 2006 Adults White
Aekplakorn 2008 Thailand Male 2004 Adults
Al-Turki 2010 Saudi Arabia Female 2005 Adults
White 2008 Australia1990 Adults
White 2008 Australia2002 AdultsWhite 2008 Australia1999 Adults
Al-Windi 2010 Iraq2006 Adults
Menezes 2008 Brazil Female 2004-2005 Adults Mix
Schaap 2008
Subtotal (I-squared = 43.1%, p = 0.055)
Park 2010 South Korea Female 2005 Adults mix
Mistry 2011 U.S. Male 2003-2004 Adults Mix
Lemstra 2009 Canada2001-2003 y 2005 Adults Natives
Bortoluzzi 2009 Brazil2005 Adults
Laaksonen 2003 Male
Pudaric 2000 Female
Siahpush 2001 Female
Pomerleau 1997
Cohen 2011 U.S. Female Adults White
Menezes 2008 Brazil Male 2000-2005 Adults
Kumar 2011 India Male 2009 Adults
Fukuda 2007 Male 20-59y
Hajat 2010 U.S.2010 Adults
Pudaric 2000 Male
Wister 1996 25-44 y
Pomerleau 2004 Female
Hosseinpoor 2011 48 LMIC Male 2002-2004 Adults
King 1999 Low
Laaksonen 2005 Male
Moderate
Mohsin 2010 Australia Female 1995-1997 Adults
Hosseinpoor 2011 48 LMIC Female 2002-2004 Adults
Al-Sahab 2010 Canada Female 2006 Adults
Siahpush 2001 Male
Samet 1992 Male
White 2008 Australia1987 Adults
Yin 2011 China2007 Adults
Johnson 2009 U.S. 2001-2005 Adults
Al-Turki 2010 Saudi Arabia Male 2005 Adults
White 2008 Australia1993 Adults
Laaksonen 2003 Female
Leinsalu 2011 Hungary Female 2000 y 2003 Adults White
Nagelhout 2012 Netherlands Male 2001 AdultsWoitas- Slubowska 2010 Polland Male 2004 Adults
Leinsalu 2011 Hungary Male 2000 y 2003 Adults White
Aekplakorn 2008 Thailand Female 2004 Adults
Pleis 2010 U.S. 2009 Adults Mix
Cohen 2011 U.S. Male Adults Black
Nagelhout 2012 Netherlands female 2008 Adults
Zaitune 2012 Brazil2001-2002 Adults
Jitnarin 2011 Thailand Female 2004-2005 Adults
Sandin 2010 Brazil2009 Adults
Amuzu 2009 UK Female 1999-2001 Adults White
Wister 1996 45-64 y
Fukuda 2007 Male >60 y
Subtotal (I-squared = 99.1%, p = 0.000)Green 2007 18-34 y
Pleis 2009 U.S. 2007 Adults
Subtotal (I-squared = 96.0%, p = 0.000)
Pomerleau 2004 Male
Low
Li 2012 U.S. Male 2002-2003 Adults
1.50 (1.36, 1.66)
1.29 (1.17, 1.42)
0.93 (0.69, 1.26)
1.45 (1.23, 1.71)
4.17 (1.67, 10.42)
1.91 (1.66, 2.20)
1.60 (1.36, 1.88)
1.15 (0.95, 1.39)
1.30 (1.10, 1.54)
1.84 (1.62, 2.09)
2.29 (1.08, 4.86)
0.83 (0.70, 0.98)
1.49 (1.26, 1.76)
0.85 (0.53, 1.37)
1.65 (0.93, 2.91)
0.83 (0.77, 0.90)
1.00 (0.42, 2.40)
1.47 (1.33, 1.62)
ratio (95% CI)
1.68 (1.43, 1.97)
1.30 (0.70, 2.41)
0.74 (0.22, 2.52)
1.94 (1.25, 3.01)
1.58 (1.28, 1.95)
1.21 (0.95, 1.53)
1.83 (1.36, 2.46)
1.55 (1.53, 1.57)
2.03 (1.76, 2.34)
1.79 (1.56, 2.05)
1.94 (1.38, 2.73)
1.40 (1.22, 1.61)
5.70 (5.50, 5.91)
1.82 (1.38, 2.40)
1.87 (1.08, 3.24)
Odds
5.41 (1.62, 18.07)
1.67 (1.43, 1.94)
1.69 (1.47, 1.95)
0.80 (0.65, 0.98)
1.04 (0.83, 1.31)
0.83 (0.64, 1.08)
0.90 (0.61, 1.33)
1.37 (0.83, 2.26)
0.95 (0.91, 0.99)
1.49 (1.36, 1.64)
1.12 (0.61, 2.06)
0.50 (0.31, 0.80)
2.30 (1.61, 3.29)
1.60 (1.00, 2.56)
1.36 (1.14, 1.62)
1.02 (0.72, 1.44)
1.43 (1.26, 1.62)
1.84 (1.57, 2.16)
2.04 (1.76, 2.36)
2.60 (1.61, 4.20)
2.00 (1.20, 3.33)
1.31 (1.20, 1.43)
2.10 (1.41, 3.13)
1.50 (1.02, 2.21)
1.68 (1.38, 2.05)
1.18 (0.82, 1.69)
1.36 (1.19, 1.55)
1.64 (1.30, 2.07)
2.04 (1.39, 2.99)
2.70 (2.60, 2.80)
0.90 (0.73, 1.11)
1.73 (1.08, 2.77)
1.53 (1.37, 1.71)
2.70 (1.35, 5.41)
0.79 (0.64, 0.97)
1.17 (0.93, 1.47)
1.13 (0.84, 1.52)
1.03 (0.97, 1.09)
0.83 (0.69, 0.99)
1.30 (1.07, 1.58)
2.01 (1.53, 2.64)
1.75 (1.55, 1.98)
1.11 (0.36, 3.41)
1.77 (1.35, 2.32)
1.00 (0.56, 1.80)
2.04 (1.98, 2.10)
1.67 (1.49, 1.87)
2.26 (1.96, 2.61)
2.86 (1.82, 4.49)
3.70 (1.50, 9.13)
1.92 (0.18, 20.15)
2.34 (1.91, 2.87)
1.65 (1.28, 2.13)
1.24 (1.08, 1.42)
1.60 (1.37, 1.88)
1.77 (1.64, 1.91)
1.79 (1.74, 1.84)
1.33 (1.17, 1.51)
1.43 (1.12, 1.82)
1.10 (0.56, 2.14)
100.00
1.30
1.17
1.27
0.61
1.28
1.27
1.25
1.27
1.29
0.74
1.27
1.27
1.00
0.91
1.30
0.64
1.30
Weight
1.27
0.86
0.43
1.04
1.24
1.22
1.17
1.32
1.28
1.28
1.13
1.28
1.31
1.19
0.93
%
0.44
1.27
1.28
1.25
1.23
1.20
1.09
0.98
1.31
13.85
0.87
1.00
1.12
1.01
1.26
1.13
1.29
1.27
1.28
1.00
0.97
1.30
1.08
1.09
1.25
1.11
1.28
1.22
1.09
1.31
1.24
1.01
1.29
0.79
1.24
1.23
1.17
1.31
1.26
1.25
1.19
1.29
0.48
1.19
0.89
1.31
1.29
1.28
1.03
0.62
0.15
1.24
1.21
1.28
55.03
1.31
1.31
31.12
1.22
0.82
1.0496 1 20.2
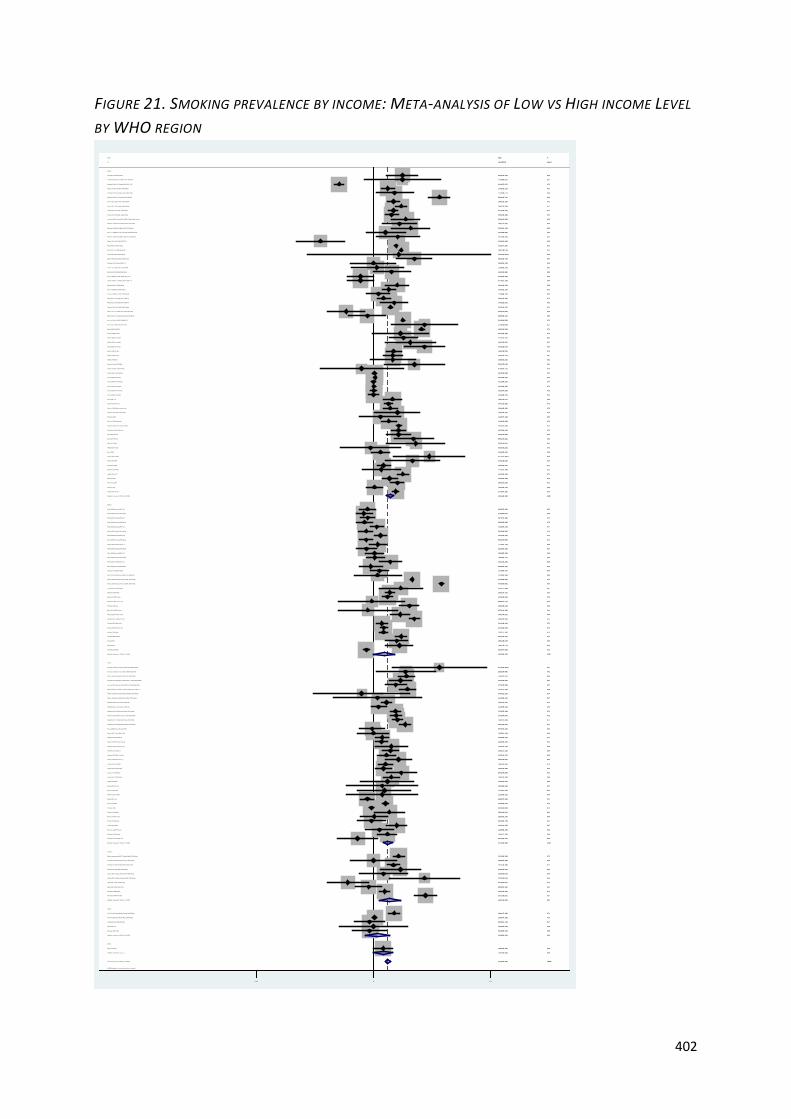
402
FIGURE 21. SMOKING PREVALENCE BY INCOME: META-ANALYSIS OF LOW VS HIGH INCOME LEVEL
BY WHO REGION
NOTE: Weights are from random effects analysis
.
.
.
.
.
.
Overall (I-squared = 98.8%, p = 0.000)
Virtanen 2007 Male CS
Jitnarin 2011 Thailand Male 2004-2005 Adults
Nagelhout 2012 Netherlands female 2008 Adults
Singh 1997 India Female 1991
White 2008 Australia1990 <15
Siahpush 2003-JECH Low
Kuhnen 2009 Brazil2007 Adults
Subtotal (I-squared = 90.0%, p = 0.000)
Metcalf 2008
Schumann 2011 Germany Female 2006 Adults White
Laaksonen 2005 Male
Virtanen 2007 Male 1-19 cig
Anaya Ocampo 2006 Female
Khuwaja 2004 Male
Wister 1996 25-44 y
Amuzu 2009 UK Female 1999-2001 Adults White
Leinsalu 2011 Hungary Male 2000 y 2003 Adults White
Webb 2008 G3 Female
SEARO
Kumar 2011 India Male 2009 Adults
Li 2012 U.S. Male 2002-2003 Adults
Sandin 2010 Brazil2009 Adults
Subtotal (I-squared = .%, p = .)
Al-Turki 2010 Saudi Arabia Male 2005 Adults
Mekrungrongwong 2011 Thailand Male 2006 Adults
Fukuda 2007 Female >60 y
Virtanen 2007 Male 20+ cig
Mostashari 2005
White 2008 Australia1990 Adults
Webb 2008 G1 Female
Singh 1997 India Male 1991
Menezes 2008 Brazil Female 2004-2005 Adults Mix
Pudule 1999 Female
Pudaric 2000 Female
Laaksonen 2005 Female
Schaap 2008
Samet 1992 Female
Shavers 2005
Dall'Agnol 2011 Brazil1998 <15
Gilmore 2001 Male
Clarkin 2008 U.S. Female 2000-2004 <15
Shapo 2003 Male
WPRO
White 2008 Australia1999 <15
Leinsalu 2011 Hungary Female 2000 y 2003 Adults White
Bortoluzzi 2009 Brazil2005 Adults
Menezes 2008 Brazil Male 2000-2005 Adults
White 2008 Australia1999 Adults
Al-Turki 2010 Saudi Arabia Female 2005 Adults
Study
Virtanen 2007 Female 1-19 cig
Subtotal (I-squared = 98.7%, p = 0.000)
Moreira 1995
Parna 2002 Estonia Female 1996
Subtotal (I-squared = 99.3%, p = 0.000)
Nagelhout 2012 Netherlands Male 2008 Adults
Mfenyana 2006
Tehranifar 2009 U.S. Female 2001-2006 NR
Virtanen 2007 Female CS
Cohen 2011 U.S. Male Adults White
Stringhini 2011 France2007 Adults Mix
Coreil 1991 20-39 Female
Muller-Riemenschneider 2010 Germany2003-2006 <15
Laaksonen 2003 Female
Menezes 2008 Brazil Female 2000-2005 Adults
Silvestre Garcia 1990 Low
Gonçalves-Silva 2005 Low
EURO
White 2008 Australia1987 <15
Johnson 2009 U.S. 2001-2005 Adults
Cohen 2011 U.S. Female Adults White
Wister 1996 65+ y
White 2008 Australia1996 Adults
Fukuda 2005 Female
Nagelhout 2012 Netherlands female 2001 Adults
Al-Windi 2010 Iraq2006 Adults
Pomerleau 2004 Female
Fukuda 2007 Female 20-59y
Menezes 2008 Brazil Male 2004-2005 Adults Mix
Erick-Peleti 2007 Female
Thomas 2008 Low
King 1999 Low
Marrie 2009 U.S. 2006 Adults
Fukuda 2007 Male >60 y
Kim 2006-JPMPH Female
Mohsin 2010 Australia Female 2005-2007 Adults
Marinho 2008
Siahpush 2001 Female
Wister 1996 45-64 y
Nagelhout 2012 Netherlands Male 2001 Adults
Pleis 2009 U.S. 2007 Adults
Fukuda 2007 Male 20-59y
Coreil 1991 65-74 Female
Laaksonen 2003 Male
Woitas- Slubowska 2010 Polland Male 2004 Adults
Pudule 1999 Male
EMRO
Watson 2003 Female
Chahine 2011 U.S. 2006-2007 Adults
Zaitune 2012 Brazil2001-2002 Adults
Aekplakorn 2008 Thailand Male 2004 Adults
Schumann 2011 Germany Male 2006 Adults White
Mistry 2011 U.S. Male 2003-2004 Adults Mix
Metcalf 2007
Webb 2008 G2 Female
Pomerleau 2004 Male
Fukuda 2005 Male
Mohsin 2010 Australia Female 1995-1997 Adults
Acevedo-Garcia 2005 USA1995-6
Diez-Roux 1999 USA1992-1994
Turrell 2002 Australia1995
Cohen 2011 U.S. Female Adults Black
Samet 1992 Male
Jitnarin 2011 Thailand Female 2004-2005 Adults
Fagan 2008-NTR
Anaya Ocampo 2006 Male
Kahn 2002 Female
Parna 2002 Estonia Male 1996
Shavers 2005 non-Hispanic whites
Al-Sahab 2010 Canada Female 2006 Adults
White 2008 Australia2002 Adults
White 2008 Australia2002 <15
Subtotal (I-squared = 92.1%, p = 0.000)
Aekplakorn 2008 Thailand Female 2004 Adults
White 2008 Australia1993 Adults
Coreil 1991 65-74 Male
Hajat 2010 U.S.2010 Adults
Coreil 1991 40-64 Male
Coreil 1991 40-64 Female
Coreil 1991 20-39 Male
Shavers 2005 American natives
Hughes 2010 U.S. 2004-2005 Adults
Wallace 2009 U.S. Female 2003-2007 <15
Hesketh2007 Male
Stringhini 2011 France1995 Adults Mix
Shavers 2005 African Americans
Rahman 2005 Male
Ross 2000
White 2008 Australia1993 <15
Kahn 2005 Female
White 2008 Australia2005 Adults
Woitas- Slubowska 2010 Polland Female 2004 Adults
Shavers 2005 Hispanics
Kaleta 2007 Low
Lemstra 2009 Canada2001-2003 y 2005 Adults Natives
Mistry 2011 U.S. Female 2003-2004 Adults Mix
White 2008 Australia1987 Adults
White 2008 Australia1996 <15
Kiefe 2001 Female
Shapo 2003 Female
Mitra 2012 U.S. female 2007-2009 All
PAHO
Cohen 2011 U.S. Male Adults Black
Mody 2006 USA1996
AFRO
Gilmore 2001 Female
Pleis 2010 U.S. 2009 Adults Mix
Park 2010 South Korea Female 2005 Adults mix
Patrick 2012 U.S. 2005-2007 NR
Siahpush 2001 Male
Clarkin 2008 U.S. Male 2000-2004 <15
Green 2007 18-34 y
Pomerleau 1997
ID
Kiefe 2001 Male
Pudaric 2000 Male
Subtotal (I-squared = 90.5%, p = 0.000)
Kim 2006-JPMPH Male
White 2008 Australia2005 <15
Alam 2008 Low
Lawrence 2007 Low
Yin 2011 China2007 Adults
Reijneveld 2002
Bombard 2012 U.S. Female 2005-2006 NR
Mitra 2012 U.S. female 2007-2009 All
Virtanen 2007 Female 20+ cig
1.45 (1.35, 1.56)
1.56 (1.27, 1.92)
1.30 (0.70, 2.41)
2.26 (1.96, 2.61)
0.52 (0.31, 0.87)
0.87 (0.72, 1.04)
0.96 (0.41, 2.25)
1.49 (1.26, 1.76)
1.52 (1.16, 2.00)
1.94 (1.38, 2.73)
5.41 (1.62, 18.07)
2.04 (1.39, 2.99)
1.40 (1.11, 1.77)
0.74 (0.26, 2.15)
0.91 (0.59, 1.40)
1.68 (1.38, 2.05)
2.34 (1.91, 2.87)
1.77 (1.35, 2.32)
3.70 (2.22, 6.17)
2.00 (1.20, 3.33)
1.10 (0.56, 2.14)
1.92 (0.18, 20.15)
1.28 (1.00, 1.64)
1.03 (0.97, 1.09)
1.91 (1.66, 2.20)
1.98 (1.56, 2.51)
1.89 (1.35, 2.65)
1.30 (1.10, 1.54)
0.80 (0.65, 0.98)
2.17 (1.52, 3.12)
0.89 (0.64, 1.24)
1.37 (0.83, 2.26)
0.95 (0.66, 1.38)
1.02 (0.72, 1.44)
1.58 (1.28, 1.95)
0.95 (0.91, 0.99)
4.17 (1.67, 10.42)
1.19 (0.71, 1.99)
1.00 (0.56, 1.78)
1.32 (0.67, 2.60)
0.72 (0.52, 1.00)
1.43 (0.72, 2.82)
1.12 (0.91, 1.39)
2.01 (1.53, 2.64)
1.60 (1.00, 2.56)
2.60 (1.61, 4.20)
0.83 (0.64, 1.08)
1.69 (1.47, 1.95)
Odds
1.23 (1.05, 1.44)
1.54 (1.42, 1.68)
1.03 (0.84, 1.26)
0.97 (0.70, 1.34)
1.32 (1.02, 1.71)
1.84 (1.62, 2.09)
1.28 (1.00, 1.64)
2.10 (0.80, 5.51)
1.25 (1.06, 1.47)
1.60 (1.36, 1.88)
1.15 (0.95, 1.39)
1.02 (1.00, 1.05)
2.42 (1.97, 2.96)
1.30 (1.07, 1.58)
1.94 (1.25, 3.01)
0.67 (0.40, 1.12)
1.91 (1.59, 2.29)
0.86 (0.70, 1.06)
1.13 (0.84, 1.52)
2.04 (1.76, 2.36)
1.65 (0.93, 2.91)
0.83 (0.70, 0.98)
2.03 (1.76, 2.34)
1.79 (1.56, 2.05)
0.90 (0.61, 1.33)
1.18 (0.82, 1.69)
2.84 (2.50, 3.23)
1.87 (1.08, 3.24)
0.87 (0.41, 1.85)
2.50 (1.96, 3.19)
1.64 (1.30, 2.07)
1.83 (1.36, 2.46)
1.24 (1.08, 1.42)
3.81 (2.90, 5.01)
5.70 (5.50, 5.91)
1.52 (1.26, 1.83)
1.43 (1.26, 1.62)
1.65 (1.28, 2.13)
1.75 (1.55, 1.98)
1.79 (1.74, 1.84)
1.31 (1.20, 1.43)
1.01 (0.94, 1.09)
1.36 (1.14, 1.62)
1.11 (0.36, 3.41)
1.82 (1.41, 2.35)
2.01 (0.99, 4.08)
1.55 (1.53, 1.57)
2.86 (1.82, 4.49)
1.67 (1.43, 1.94)
2.29 (1.08, 4.86)
0.50 (0.31, 0.80)
1.82 (1.38, 2.40)
2.56 (1.35, 4.87)
1.43 (1.12, 1.82)
1.29 (1.17, 1.42)
2.70 (2.60, 2.80)
2.13 (2.04, 2.22)
3.70 (1.60, 8.56)
2.02 (1.17, 3.49)
1.68 (1.43, 1.97)
2.70 (1.35, 5.41)
3.70 (1.50, 9.13)
2.13 (1.85, 2.45)
2.86 (1.33, 6.12)
1.90 (1.40, 2.58)
1.00 (0.67, 1.49)
1.92 (1.81, 2.04)
1.73 (1.08, 2.77)
1.04 (0.83, 1.31)
1.03 (0.82, 1.30)
1.44 (1.29, 1.62)
1.00 (0.56, 1.80)
0.83 (0.69, 0.99)
1.01 (0.89, 1.15)
2.10 (1.41, 3.13)
1.01 (0.98, 1.05)
1.01 (0.98, 1.03)
1.04 (1.02, 1.07)
1.84 (1.04, 3.26)
1.45 (1.23, 1.71)
0.42 (0.37, 0.47)
0.83 (0.77, 0.90)
1.40 (1.22, 1.61)
1.54 (1.28, 1.85)
1.22 (0.75, 1.98)
1.21 (0.95, 1.53)
1.10 (0.93, 1.30)
2.80 (1.70, 4.61)
0.93 (0.69, 1.26)
0.74 (0.22, 2.52)
1.49 (1.23, 1.80)
0.85 (0.72, 1.02)
2.30 (1.61, 3.29)
0.85 (0.53, 1.37)
0.79 (0.64, 0.97)
1.19 (1.02, 1.39)
0.93 (0.43, 2.01)
1.25 (0.50, 3.12)
1.30 (1.10, 1.54)
1.67 (1.49, 1.87)
3.45 (3.23, 3.69)
1.25 (0.50, 3.12)
2.04 (1.98, 2.10)
1.12 (0.61, 2.06)
0.26 (0.14, 0.48)
1.53 (1.37, 1.71)
0.72 (0.52, 1.00)
1.77 (1.64, 1.91)
1.84 (1.57, 2.16)
ratio (95% CI)
2.96 (1.41, 6.21)
1.50 (1.02, 2.21)
1.12 (0.81, 1.53)
1.34 (1.18, 1.52)
1.54 (1.16, 2.04)
1.00 (0.42, 2.40)
1.47 (1.33, 1.62)
1.17 (0.93, 1.47)
1.36 (1.26, 1.47)
5.40 (4.10, 7.11)
1.70 (1.20, 2.41)
1.58 (1.05, 2.38)
100.00
0.69
0.48
0.71
0.53
0.70
0.36
0.71
5.84
0.63
0.24
0.61
0.68
0.28
0.58
0.70
0.69
0.67
0.54
0.54
0.45
0.08
0.68
0.73
0.72
0.68
0.63
0.71
0.70
0.62
0.64
0.54
0.62
0.63
0.69
0.73
0.34
0.53
0.50
0.45
0.64
0.45
0.69
0.67
0.56
0.56
0.67
0.71
%
0.71
44.25
0.69
0.64
22.01
0.72
0.68
0.32
0.71
0.71
0.70
0.73
0.69
0.70
0.58
0.54
0.70
0.69
0.65
0.71
0.51
0.71
0.71
0.72
0.61
0.62
0.72
0.52
0.41
0.68
0.68
0.65
0.72
0.67
0.73
0.70
0.72
0.67
0.72
0.73
0.73
0.73
0.70
0.27
0.67
0.43
0.73
0.57
0.71
0.41
0.56
0.66
0.47
0.68
0.73
0.73
0.73
0.37
0.52
0.71
0.44
0.34
0.72
0.41
0.65
0.60
0.73
0.56
0.68
0.68
24.23
0.50
0.70
0.72
0.60
0.73
0.73
0.73
0.50
0.71
0.72
0.73
0.72
0.70
0.55
0.68
0.71
0.54
0.65
0.24
0.70
0.71
0.62
0.56
0.69
0.71
0.40
0.34
0.71
0.72
0.73
0.34
0.73
0.48
0.48
0.72
0.64
0.73
0.71
Weight
0.42
0.61
2.99
0.72
0.66
0.35
0.72
0.68
0.73
0.66
0.63
0.60
1.0496 1 20.2
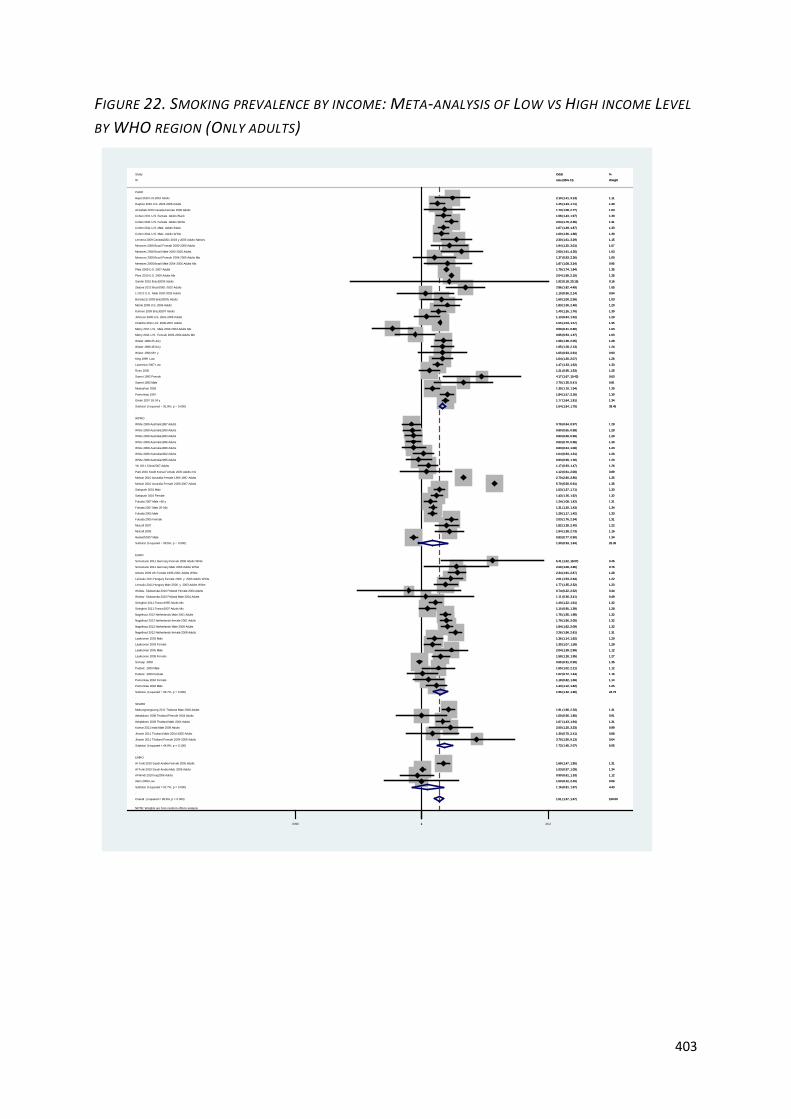
403
FIGURE 22. SMOKING PREVALENCE BY INCOME: META-ANALYSIS OF LOW VS HIGH INCOME LEVEL
BY WHO REGION (ONLY ADULTS)
NOTE: Weights are from random effects analysis
.
.
.
.
.
Overall (I-squared = 98.8%, p = 0.000)
Aekplakorn 2008 Thailand Female 2004 Adults
Menezes 2008 Brazil Male 2000-2005 Adults
Mostashari 2005
Jitnarin 2011 Thailand Male 2004-2005 Adults
Fukuda 2005 Male
Metcalf 2008
Sandin 2010 Brazil2009 Adults
Menezes 2008 Brazil Female 2000-2005 Adults
Al-Turki 2010 Saudi Arabia Male 2005 Adults
Schumann 2011 Germany Female 2006 Adults White
Alam 2008 Low
SEARO
Subtotal (I-squared = 94.7%, p = 0.000)
Subtotal (I-squared = 92.7%, p = 0.000)
Woitas- Slubowska 2010 Polland Female 2004 Adults
White 2008 Australia1993 Adults
Schumann 2011 Germany Male 2006 Adults White
Schaap 2008
Kumar 2011 India Male 2009 Adults
Cohen 2011 U.S. Male Adults Black
Metcalf 2007
White 2008 Australia1987 Adults
Aekplakorn 2008 Thailand Male 2004 Adults
Pudaric 2000 Female
Subtotal (I-squared = 44.9%, p = 0.106)
Hesketh2007 Male
Nagelhout 2012 Netherlands female 2008 Adults
Yin 2011 China2007 Adults
Leinsalu 2011 Hungary Female 2000 y 2003 Adults White
Al-Windi 2010 Iraq2006 Adults
Stringhini 2011 France2007 Adults Mix
Pudaric 2000 Male
Laaksonen 2003 Male
Zaitune 2012 Brazil2001-2002 Adults
Park 2010 South Korea Female 2005 Adults mix
ID
Leinsalu 2011 Hungary Male 2000 y 2003 Adults White
Nagelhout 2012 Netherlands female 2001 Adults
Mistry 2011 U.S. Male 2003-2004 Adults Mix
Pomerleau 2004 Male
Nagelhout 2012 Netherlands Male 2008 Adults
Pleis 2010 U.S. 2009 Adults Mix
Fukuda 2005 Female
Mistry 2011 U.S. Female 2003-2004 Adults Mix
Woitas- Slubowska 2010 Polland Male 2004 Adults
Menezes 2008 Brazil Male 2004-2005 Adults Mix
Green 2007 18-34 y
Wister 1996 25-44 y
Amuzu 2009 UK Female 1999-2001 Adults White
Fukuda 2007 Male 20-59y
EURO
Siahpush 2001 Female
Fukuda 2007 Male >60 y
Pleis 2009 U.S. 2007 Adults
Mohsin 2010 Australia Female 1995-1997 Adults
Al-Turki 2010 Saudi Arabia Female 2005 Adults
Laaksonen 2003 Female
Mekrungrongwong 2011 Thailand Male 2006 Adults
White 2008 Australia1999 Adults
White 2008 Australia1990 Adults
Subtotal (I-squared = 99.5%, p = 0.000)
Johnson 2009 U.S. 2001-2005 Adults
Jitnarin 2011 Thailand Female 2004-2005 Adults
Marrie 2009 U.S. 2006 Adults
Bortoluzzi 2009 Brazil2005 Adults
Mohsin 2010 Australia Female 2005-2007 Adults
King 1999 Low
Hughes 2010 U.S. 2004-2005 Adults
WPRO
Cohen 2011 U.S. Male Adults White
Ross 2000
Lawrence 2007 Low
Laaksonen 2005 Male
Laaksonen 2005 Female
Wister 1996 45-64 y
Cohen 2011 U.S. Female Adults Black
Chahine 2011 U.S. 2006-2007 Adults
Wister 1996 65+ y
Pomerleau 1997
Kuhnen 2009 Brazil2007 Adults
Menezes 2008 Brazil Female 2004-2005 Adults Mix
Lemstra 2009 Canada2001-2003 y 2005 Adults Natives
White 2008 Australia1996 Adults
Samet 1992 Male
Siahpush 2001 Male
White 2008 Australia2005 Adults
Samet 1992 Female
Subtotal (I-squared = 91.8%, p = 0.000)
Pomerleau 2004 Female
Li 2012 U.S. Male 2002-2003 Adults
Stringhini 2011 France1995 Adults Mix
Nagelhout 2012 Netherlands Male 2001 Adults
Cohen 2011 U.S. Female Adults White
White 2008 Australia2002 Adults
Al-Sahab 2010 Canada Female 2006 Adults
EMRO
Hajat 2010 U.S.2010 Adults
PAHO
Study
1.51 (1.37, 1.67)
1.00 (0.56, 1.80)
2.60 (1.61, 4.20)
1.30 (1.10, 1.54)
1.30 (0.70, 2.41)
1.29 (1.17, 1.42)
1.94 (1.38, 2.73)
1.92 (0.18, 20.15)
1.94 (1.25, 3.01)
1.03 (0.97, 1.09)
5.41 (1.62, 18.07)
1.00 (0.42, 2.40)
1.56 (1.32, 1.86)
1.16 (0.81, 1.67)
0.74 (0.22, 2.52)
0.83 (0.69, 0.99)
2.29 (1.08, 4.86)
0.95 (0.91, 0.99)
2.00 (1.20, 3.33)
1.67 (1.49, 1.87)
1.82 (1.38, 2.40)
0.79 (0.64, 0.97)
1.67 (1.43, 1.94)
1.02 (0.72, 1.44)
1.73 (1.45, 2.07)
0.83 (0.77, 0.90)
2.26 (1.96, 2.61)
1.17 (0.93, 1.47)
2.01 (1.53, 2.64)
0.90 (0.61, 1.33)
1.15 (0.95, 1.39)
1.50 (1.02, 2.21)
1.36 (1.14, 1.62)
2.86 (1.82, 4.49)
1.12 (0.61, 2.06)
ratio (95% CI)
1.77 (1.35, 2.32)
1.79 (1.56, 2.05)
0.50 (0.31, 0.80)
1.43 (1.12, 1.82)
1.84 (1.62, 2.09)
2.04 (1.98, 2.10)
2.03 (1.76, 2.34)
0.85 (0.53, 1.37)
1.11 (0.36, 3.41)
1.87 (1.08, 3.24)
1.77 (1.64, 1.91)
1.68 (1.38, 2.05)
2.34 (1.91, 2.87)
1.31 (1.20, 1.43)
1.43 (1.26, 1.62)
1.24 (1.08, 1.42)
1.79 (1.74, 1.84)
2.70 (2.60, 2.80)
1.69 (1.47, 1.95)
1.30 (1.07, 1.58)
1.91 (1.66, 2.20)
0.83 (0.64, 1.08)
0.80 (0.65, 0.98)
1.30 (0.93, 1.84)
1.13 (0.84, 1.52)
3.70 (1.50, 9.13)
1.83 (1.36, 2.46)
1.60 (1.00, 2.56)
5.70 (5.50, 5.91)
1.64 (1.30, 2.07)
1.45 (1.23, 1.71)
1.60 (1.36, 1.88)
1.21 (0.95, 1.53)
1.47 (1.33, 1.62)
2.04 (1.39, 2.99)
1.58 (1.28, 1.95)
1.65 (1.28, 2.13)
1.68 (1.43, 1.97)
1.55 (1.53, 1.57)
1.65 (0.93, 2.91)
1.84 (1.57, 2.16)
1.49 (1.26, 1.76)
1.37 (0.83, 2.26)
2.30 (1.61, 3.29)
0.83 (0.70, 0.98)
2.70 (1.35, 5.41)
1.53 (1.37, 1.71)
0.93 (0.69, 1.26)
4.17 (1.67, 10.42)
1.64 (1.54, 1.75)
1.18 (0.82, 1.69)
1.10 (0.56, 2.14)
1.40 (1.22, 1.61)
1.75 (1.55, 1.98)
2.04 (1.76, 2.36)
1.04 (0.83, 1.31)
1.73 (1.08, 2.77)
2.10 (1.41, 3.13)
Odds
100.00
0.91
1.03
1.30
0.88
1.33
1.16
0.16
1.07
1.34
0.45
0.66
24.73
4.43
0.44
1.29
0.76
1.35
0.99
1.33
1.22
1.28
1.31
1.16
6.05
1.34
1.31
1.26
1.22
1.12
1.28
1.12
1.29
1.05
0.89
Weight
1.23
1.32
1.03
1.25
1.32
1.35
1.31
1.03
0.49
0.95
1.34
1.28
1.28
1.34
1.32
1.31
1.35
1.35
1.31
1.28
1.31
1.23
1.28
25.35
1.20
0.64
1.20
1.03
1.35
1.26
1.30
1.30
1.25
1.33
1.12
1.27
1.24
1.30
1.35
0.93
1.30
1.30
1.00
1.15
1.30
0.81
1.33
1.20
0.63
39.45
1.14
0.84
1.32
1.32
1.31
1.26
1.03
1.11
%
1.0496 1 20.2
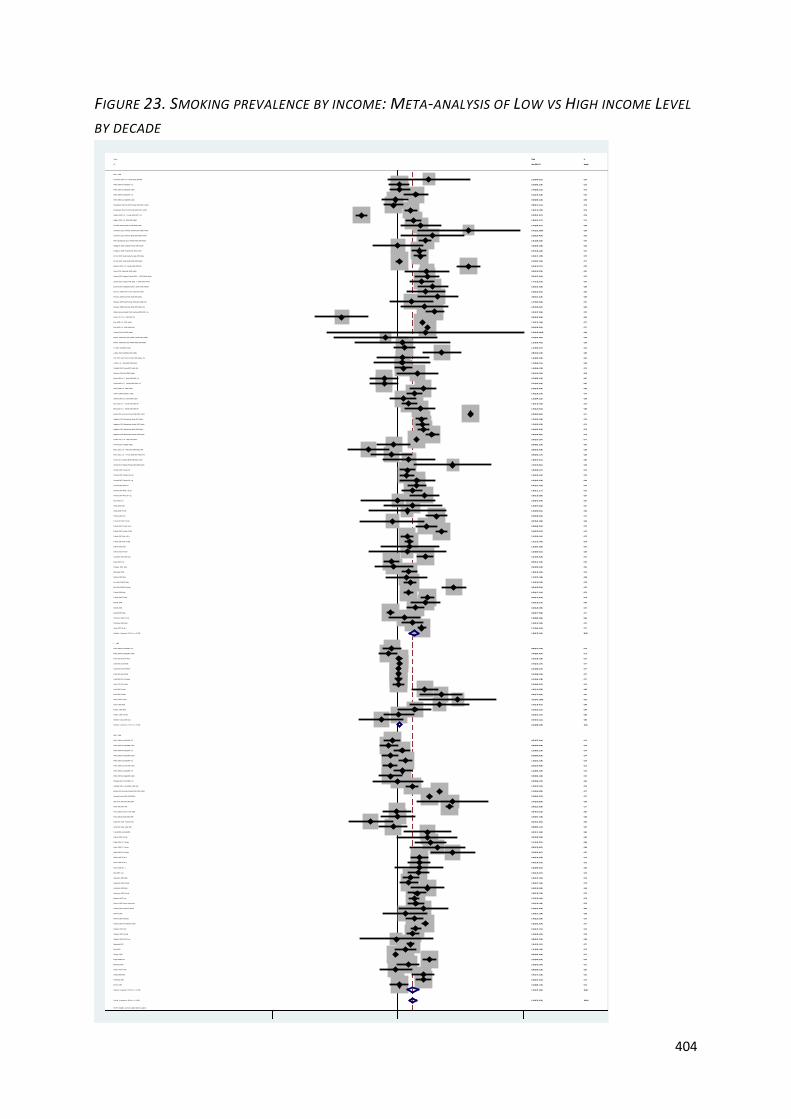
404
FIGURE 23. SMOKING PREVALENCE BY INCOME: META-ANALYSIS OF LOW VS HIGH INCOME LEVEL
BY DECADE
NOTE: Weights are from random effects analysis
.
.
.
Overall (I-squared = 98.9%, p = 0.000)
Tehranifar 2009 U.S. Female 2001-2006 NR
Hosseinpoor 2011 48 LMIC Male 2002-2004 Adults
Shavers 2005
Kahn 2002 Female
Reijneveld 2002
Mitra 2012 U.S. female 2007-2009 All
Webb 2008 G2 Female
Shavers 2005 non-Hispanic whites
King 1999 Low
Singh 1997 India Female 1991
Subtotal (I-squared = 79.1%, p = 0.000)
1990 - 1999
Siahpush 2001 Male
Al-Sahab 2010 Canada Female 2006 Adults
Fagan 2008-NTR
Kumar 2011 India Male 2009 Adults
Mohsin 2010 Australia Female 1995-1997 Adults
Coreil 1991 65-74 Male
Virtanen 2007 Female 1-19 cig
Thomas 2008 Low
Nagelhout 2012 Netherlands Male 2008 Adults
Stringhini 2011 France1995 Adults Mix
Schumann 2011 Germany Female 2006 Adults White
Pudaric 2000 Male
Shavers 2005 American natives
Mody 2006 USA1996
Coreil 1991 65-74 Female
Subtotal (I-squared = 98.7%, p = 0.000)
Virtanen 2007 Male 20+ cig
Mistry 2011 U.S. Male 2003-2004 Adults Mix
Park 2010 South Korea Female 2005 Adults mix
Laaksonen 2003 Female
Jitnarin 2011 Thailand Female 2004-2005 Adults
Pudule 1999 Male
Wister 1996 25-44 y
Coreil 1991 40-64 Male
Clarkin 2008 U.S. Female 2000-2004 <15
Bortoluzzi 2009 Brazil2005 Adults
ID
Watson 2003 Female
Wister 1996 65+ y
Mistry 2011 U.S. Female 2003-2004 Adults Mix
Samet 1992 Male
White 2008 Australia1996 Adults
White 2008 Australia1987 Adults
Nagelhout 2012 Netherlands female 2008 Adults
White 2008 Australia1993 <15
Laaksonen 2005 Female
Leinsalu 2011 Hungary Male 2000 y 2003 Adults White
Menezes 2008 Brazil Male 2004-2005 Adults Mix
White 2008 Australia1987 <15
Pudule 1999 Female
Coreil 1991 20-39 Male
Virtanen 2007 Female CS
Turrell 2002 Australia1995
Clarkin 2008 U.S. Male 2000-2004 <15
Fukuda 2007 Male >60 y
Woitas- Slubowska 2010 Polland Female 2004 Adults
White 2008 Australia1993 Adults
Mitra 2012 U.S. female 2007-2009 All
Schaap 2008
Erick-Peleti 2007 Female
Li 2012 U.S. Male 2002-2003 Adults
Gilmore 2001 Male
Lemstra 2009 Canada2001-2003 y 2005 Adults Natives
Gilmore 2001 Female
Kahn 2005 Female
Nagelhout 2012 Netherlands Male 2001 Adults
Fukuda 2007 Female 20-59y
Webb 2008 G1 Female
Bombard 2012 U.S. Female 2005-2006 NR
Fukuda 2005 Male
Pudaric 2000 Female
Green 2007 18-34 y
Wister 1996 45-64 y
Singh 1997 India Male 1991
Shavers 2005 Hispanics
Al-Turki 2010 Saudi Arabia Male 2005 Adults
Fukuda 2005 Female
Woitas- Slubowska 2010 Polland Male 2004 Adults
Kim 2006-JPMPH Female
Kim 2006-JPMPH Male
Pomerleau 1997
Mostashari 2005
Rahman 2005 Male
Shapo 2003 Female
White 2008 Australia2002 Adults
Shavers 2005 African Americans
Chahine 2011 U.S. 2006-2007 Adults
Study
Laaksonen 2003 Male
Pleis 2009 U.S. 2007 Adults
Marrie 2009 U.S. 2006 Adults
White 2008 Australia1996 <15
Hesketh2007 Male
Pomerleau 2004 Male
Patrick 2012 U.S. 2005-2007 NR
Parna 2002 Estonia Female 1996
Virtanen 2007 Female 20+ cig
White 2008 Australia1990 <15
Gonçalves-Silva 2005 Low
Siahpush 2003-JECH Low
Coreil 1991 40-64 Female
Jitnarin 2011 Thailand Male 2004-2005 Adults
Virtanen 2007 Male CS
Yin 2011 China2007 Adults
Lawrence 2007 Low
Moreira 1995
Samet 1992 Female
Silvestre Garcia 1990 Low
Pleis 2010 U.S. 2009 Adults Mix
White 2008 Australia1990 Adults
Fukuda 2007 Female >60 y
Coreil 1991 20-39 Female
Laaksonen 2005 Male
Siahpush 2001 Female
Aekplakorn 2008 Thailand Male 2004 Adults
Al-Turki 2010 Saudi Arabia Female 2005 Adults
Marinho 2008
White 2008 Australia1999 Adults
Alam 2008 Low
Dall'Agnol 2011 Brazil1998 <15
Diez-Roux 1999 USA1992-1994
Aekplakorn 2008 Thailand Female 2004 Adults
Zaitune 2012 Brazil2001-2002 Adults
Subtotal (I-squared = 98.0%, p = 0.000)
Stringhini 2011 France2007 Adults Mix
Parna 2002 Estonia Male 1996
Sandin 2010 Brazil2009 Adults
Nagelhout 2012 Netherlands female 2001 Adults
Mohsin 2010 Australia Female 2005-2007 Adults
Al-Windi 2010 Iraq2006 Adults
Muller-Riemenschneider 2010 Germany2003-2006 <15
Kuhnen 2009 Brazil2007 Adults
Pomerleau 2004 Female
Menezes 2008 Brazil Male 2000-2005 Adults
Wallace 2009 U.S. Female 2003-2007 <15
Menezes 2008 Brazil Female 2000-2005 Adults
Webb 2008 G3 Female
Leinsalu 2011 Hungary Female 2000 y 2003 Adults White
White 2008 Australia2002 <15
White 2008 Australia2005 <15
Shapo 2003 Male
Menezes 2008 Brazil Female 2004-2005 Adults Mix
Schumann 2011 Germany Male 2006 Adults White
Metcalf 2008
Mekrungrongwong 2011 Thailand Male 2006 Adults
Mfenyana 2006
Kaleta 2007 Low
White 2008 Australia1999 <15
Hughes 2010 U.S. 2004-2005 Adults
Johnson 2009 U.S. 2001-2005 Adults
<= 1989
Hosseinpoor 2011 48 LMIC Female 2002-2004 Adults
White 2008 Australia2005 Adults
Khuwaja 2004 Male
Acevedo-Garcia 2005 USA1995-6
Fukuda 2007 Male 20-59y
Ross 2000
2000 - 2009
Virtanen 2007 Male 1-19 cig
1.43 (1.32, 1.54)
2.10 (0.80, 5.51)
1.36 (1.19, 1.55)
1.19 (0.71, 1.99)
1.90 (1.40, 2.58)
1.36 (1.26, 1.47)
1.30 (1.10, 1.54)
2.56 (1.35, 4.87)
1.92 (1.81, 2.04)
1.64 (1.30, 2.07)
0.52 (0.31, 0.87)
1.03 (0.99, 1.08)
1.53 (1.37, 1.71)
1.73 (1.08, 2.77)
2.13 (1.85, 2.45)
2.00 (1.20, 3.33)
2.70 (2.60, 2.80)
1.01 (0.89, 1.15)
1.23 (1.05, 1.44)
2.50 (1.96, 3.19)
1.84 (1.62, 2.09)
1.40 (1.22, 1.61)
5.41 (1.62, 18.07)
1.50 (1.02, 2.21)
1.84 (1.04, 3.26)
3.45 (3.23, 3.69)
1.01 (0.94, 1.09)
1.48 (1.33, 1.64)
1.89 (1.35, 2.65)
0.50 (0.31, 0.80)
1.12 (0.61, 2.06)
1.30 (1.07, 1.58)
3.70 (1.50, 9.13)
1.82 (1.41, 2.35)
1.68 (1.38, 2.05)
1.01 (0.98, 1.05)
0.72 (0.52, 1.00)
1.60 (1.00, 2.56)
ratio (95% CI)
2.01 (0.99, 4.08)
1.65 (0.93, 2.91)
0.85 (0.53, 1.37)
2.70 (1.35, 5.41)
0.83 (0.70, 0.98)
0.79 (0.64, 0.97)
2.26 (1.96, 2.61)
1.10 (0.93, 1.30)
1.58 (1.28, 1.95)
1.77 (1.35, 2.32)
1.87 (1.08, 3.24)
0.86 (0.70, 1.06)
0.95 (0.66, 1.38)
1.04 (1.02, 1.07)
1.25 (1.06, 1.47)
2.02 (1.17, 3.49)
0.72 (0.52, 1.00)
1.24 (1.08, 1.42)
0.74 (0.22, 2.52)
0.83 (0.69, 0.99)
1.70 (1.20, 2.41)
0.95 (0.91, 0.99)
0.87 (0.41, 1.85)
1.10 (0.56, 2.14)
1.32 (0.67, 2.60)
2.30 (1.61, 3.29)
1.25 (0.50, 3.12)
2.80 (1.70, 4.61)
1.75 (1.55, 1.98)
2.84 (2.50, 3.23)
2.17 (1.52, 3.12)
5.40 (4.10, 7.11)
1.29 (1.17, 1.42)
1.02 (0.72, 1.44)
1.77 (1.64, 1.91)
1.65 (1.28, 2.13)
0.89 (0.64, 1.24)
1.49 (1.23, 1.80)
1.03 (0.97, 1.09)
2.03 (1.76, 2.34)
1.11 (0.36, 3.41)
3.81 (2.90, 5.01)
1.34 (1.18, 1.52)
1.84 (1.57, 2.16)
1.30 (1.10, 1.54)
1.22 (0.75, 1.98)
1.25 (0.50, 3.12)
1.04 (0.83, 1.31)
1.54 (1.28, 1.85)
1.55 (1.53, 1.57)
Odds
1.36 (1.14, 1.62)
1.79 (1.74, 1.84)
1.83 (1.36, 2.46)
1.19 (1.02, 1.39)
0.83 (0.77, 0.90)
1.43 (1.12, 1.82)
0.26 (0.14, 0.48)
0.97 (0.70, 1.34)
1.58 (1.05, 2.38)
0.87 (0.72, 1.04)
1.91 (1.59, 2.29)
0.96 (0.41, 2.25)
1.01 (0.98, 1.03)
1.30 (0.70, 2.41)
1.56 (1.27, 1.92)
1.17 (0.93, 1.47)
1.47 (1.33, 1.62)
1.03 (0.84, 1.26)
4.17 (1.67, 10.42)
0.67 (0.40, 1.12)
2.04 (1.98, 2.10)
0.80 (0.65, 0.98)
1.98 (1.56, 2.51)
1.02 (1.00, 1.05)
2.04 (1.39, 2.99)
1.43 (1.26, 1.62)
1.67 (1.43, 1.94)
1.69 (1.47, 1.95)
1.52 (1.26, 1.83)
0.83 (0.64, 1.08)
1.00 (0.42, 2.40)
1.00 (0.56, 1.78)
3.70 (1.60, 8.56)
1.00 (0.56, 1.80)
2.86 (1.82, 4.49)
1.42 (1.24, 1.62)
1.15 (0.95, 1.39)
1.00 (0.67, 1.49)
1.92 (0.18, 20.15)
1.79 (1.56, 2.05)
5.70 (5.50, 5.91)
0.90 (0.61, 1.33)
2.42 (1.97, 2.96)
1.49 (1.26, 1.76)
1.18 (0.82, 1.69)
2.60 (1.61, 4.20)
0.42 (0.37, 0.47)
1.94 (1.25, 3.01)
3.70 (2.22, 6.17)
2.01 (1.53, 2.64)
1.03 (0.82, 1.30)
1.54 (1.16, 2.04)
1.43 (0.72, 2.82)
1.37 (0.83, 2.26)
2.29 (1.08, 4.86)
1.94 (1.38, 2.73)
1.91 (1.66, 2.20)
1.28 (1.00, 1.64)
0.85 (0.72, 1.02)
1.12 (0.91, 1.39)
1.45 (1.23, 1.71)
1.13 (0.84, 1.52)
0.90 (0.73, 1.11)
0.93 (0.69, 1.26)
0.91 (0.59, 1.40)
2.13 (2.04, 2.22)
1.31 (1.20, 1.43)
1.21 (0.95, 1.53)
1.40 (1.11, 1.77)
100.00
0.34
0.75
0.56
0.68
0.77
0.74
0.49
0.77
0.72
0.56
10.01
0.76
0.59
0.75
0.57
0.77
0.76
0.75
0.71
0.76
0.75
0.26
0.64
0.53
0.77
0.77
56.81
0.67
0.59
0.51
0.73
0.36
0.71
0.73
0.77
0.67
0.59
Weight
0.45
0.53
0.59
0.46
0.74
0.73
0.75
0.74
0.73
0.70
0.54
0.73
0.65
0.77
0.74
0.55
0.67
0.75
0.25
0.74
0.66
0.77
0.43
0.48
0.47
0.66
0.36
0.57
0.76
0.76
0.65
0.70
0.76
0.66
0.77
0.71
0.67
0.73
0.77
0.75
0.28
0.70
0.76
0.75
0.74
0.58
0.36
0.72
0.74
0.77
%
0.74
0.77
0.69
0.75
0.77
0.71
0.50
0.67
0.63
0.74
0.74
0.38
0.77
0.50
0.73
0.72
0.76
0.73
0.36
0.56
0.77
0.73
0.72
0.77
0.64
0.76
0.75
0.75
0.74
0.70
0.37
0.53
0.39
0.52
0.60
33.18
0.73
0.63
0.09
0.75
0.77
0.64
0.73
0.74
0.65
0.59
0.76
0.61
0.57
0.70
0.72
0.70
0.47
0.57
0.43
0.66
0.75
0.71
0.74
0.73
0.74
0.69
0.73
0.69
0.61
0.77
0.76
0.72
0.72
10496 1 20 2
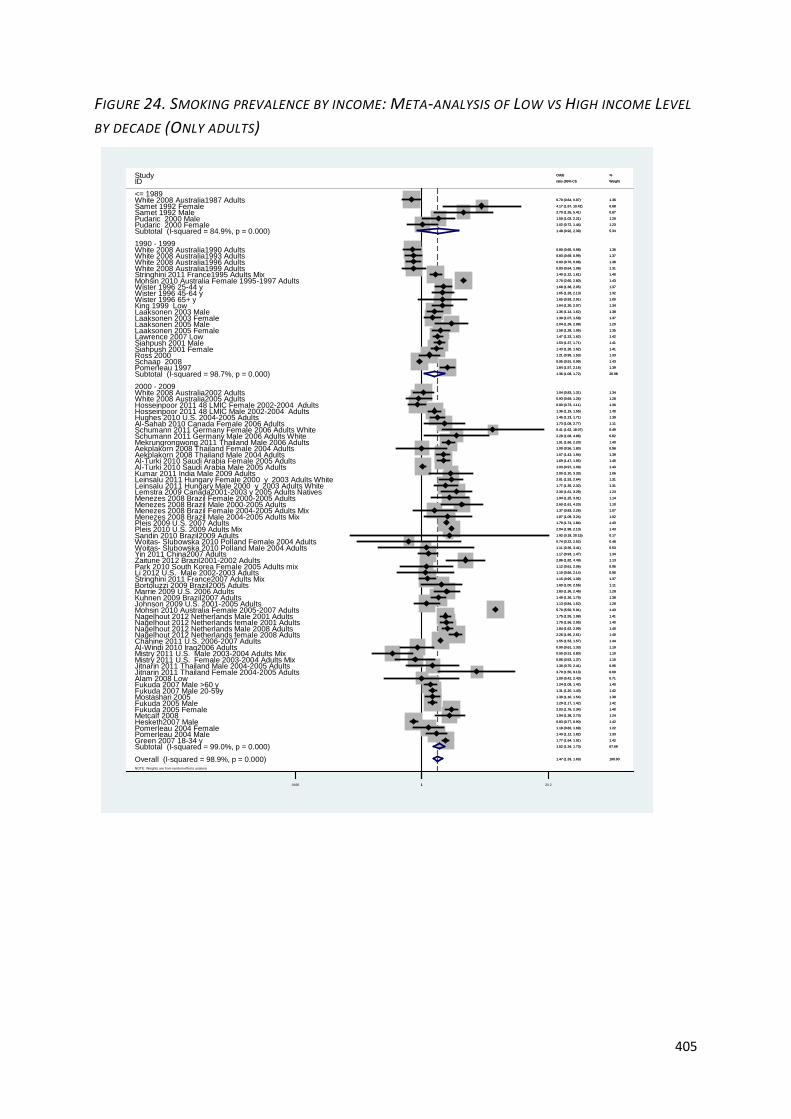
405
FIGURE 24. SMOKING PREVALENCE BY INCOME: META-ANALYSIS OF LOW VS HIGH INCOME LEVEL
BY DECADE (ONLY ADULTS)
NOTE: Weights are from random effects analysis
.
.
.
Overall (I-squared = 98.9%, p = 0.000)
ID
2000 - 2009
Hosseinpoor 2011 48 LMIC Male 2002-2004 Adults
Green 2007 18-34 yPomerleau 2004 MalePomerleau 2004 Female
Stringhini 2011 France1995 Adults Mix
Mistry 2011 U.S. Female 2003-2004 Adults Mix
Fukuda 2005 MaleMostashari 2005
Pomerleau 1997
Bortoluzzi 2009 Brazil2005 Adults
Johnson 2009 U.S. 2001-2005 Adults
White 2008 Australia1993 Adults
Aekplakorn 2008 Thailand Female 2004 Adults
Wister 1996 25-44 y
Nagelhout 2012 Netherlands female 2001 Adults
King 1999 Low
Laaksonen 2005 Male
Hughes 2010 U.S. 2004-2005 Adults
Leinsalu 2011 Hungary Male 2000 y 2003 Adults White
Woitas- Slubowska 2010 Polland Female 2004 Adults
White 2008 Australia2002 Adults
Mistry 2011 U.S. Male 2003-2004 Adults Mix
Study
Kuhnen 2009 Brazil2007 Adults
Siahpush 2001 Female
White 2008 Australia1990 Adults
Marrie 2009 U.S. 2006 Adults
Menezes 2008 Brazil Male 2004-2005 Adults Mix
Hosseinpoor 2011 48 LMIC Female 2002-2004 Adults
Laaksonen 2003 Male
Fukuda 2007 Male 20-59y
Menezes 2008 Brazil Female 2000-2005 Adults
Chahine 2011 U.S. 2006-2007 Adults
Jitnarin 2011 Thailand Male 2004-2005 Adults
Pudaric 2000 Female
Lemstra 2009 Canada2001-2003 y 2005 Adults Natives
Kumar 2011 India Male 2009 Adults
Al-Sahab 2010 Canada Female 2006 Adults
Nagelhout 2012 Netherlands Male 2001 Adults
Sandin 2010 Brazil2009 Adults
Wister 1996 45-64 y
Samet 1992 FemaleSamet 1992 Male
White 2008 Australia1999 Adults
Nagelhout 2012 Netherlands female 2008 Adults
Lawrence 2007 LowSiahpush 2001 Male
Al-Windi 2010 Iraq2006 Adults
Alam 2008 Low
Fukuda 2005 Female
Al-Turki 2010 Saudi Arabia Female 2005 Adults
Woitas- Slubowska 2010 Polland Male 2004 Adults
1990 - 1999
Pleis 2010 U.S. 2009 Adults Mix
Leinsalu 2011 Hungary Female 2000 y 2003 Adults White
Pudaric 2000 MaleSubtotal (I-squared = 84.9%, p = 0.000)
Ross 2000
Zaitune 2012 Brazil2001-2002 AdultsLi 2012 U.S. Male 2002-2003 Adults
Nagelhout 2012 Netherlands Male 2008 Adults
Stringhini 2011 France2007 Adults Mix
Schumann 2011 Germany Male 2006 Adults WhiteSchumann 2011 Germany Female 2006 Adults White
Subtotal (I-squared = 98.7%, p = 0.000)
White 2008 Australia1987 Adults
Laaksonen 2003 Female
Mekrungrongwong 2011 Thailand Male 2006 Adults
Menezes 2008 Brazil Male 2000-2005 Adults
Wister 1996 65+ y
White 2008 Australia2005 Adults
Laaksonen 2005 Female
Mohsin 2010 Australia Female 1995-1997 Adults
Pleis 2009 U.S. 2007 Adults
Metcalf 2008
White 2008 Australia1996 Adults
Jitnarin 2011 Thailand Female 2004-2005 Adults
Schaap 2008
Hesketh2007 Male
Mohsin 2010 Australia Female 2005-2007 Adults
Park 2010 South Korea Female 2005 Adults mixYin 2011 China2007 Adults
Aekplakorn 2008 Thailand Male 2004 Adults
Menezes 2008 Brazil Female 2004-2005 Adults Mix
Fukuda 2007 Male >60 y
Al-Turki 2010 Saudi Arabia Male 2005 Adults
<= 1989
Subtotal (I-squared = 99.0%, p = 0.000)1.47 (1.33, 1.63)
ratio (95% CI)
1.36 (1.19, 1.55)
1.77 (1.64, 1.91)
1.43 (1.12, 1.82)
1.18 (0.82, 1.69)
1.40 (1.22, 1.61)
0.85 (0.53, 1.37)
1.29 (1.17, 1.42)
1.30 (1.10, 1.54)
1.84 (1.57, 2.16)
1.60 (1.00, 2.56)
1.13 (0.84, 1.52)
0.83 (0.69, 0.99)
1.00 (0.56, 1.80)
1.68 (1.38, 2.05)
1.79 (1.56, 2.05)
1.64 (1.30, 2.07)
2.04 (1.39, 2.99)
1.45 (1.23, 1.71)
1.77 (1.35, 2.32)
0.74 (0.22, 2.52)
1.04 (0.83, 1.31)
0.50 (0.31, 0.80)
Odds
1.49 (1.26, 1.76)
1.43 (1.26, 1.62)
0.80 (0.65, 0.98)
1.83 (1.36, 2.46)
1.87 (1.08, 3.24)
0.90 (0.73, 1.11)
1.36 (1.14, 1.62)
1.31 (1.20, 1.43)
1.94 (1.25, 3.01)
1.55 (1.53, 1.57)
1.30 (0.70, 2.41)
1.02 (0.72, 1.44)
2.30 (1.61, 3.29)
2.00 (1.20, 3.33)
1.73 (1.08, 2.77)
1.75 (1.55, 1.98)
1.92 (0.18, 20.15)
1.65 (1.28, 2.13)
4.17 (1.67, 10.42)
2.70 (1.35, 5.41)
0.83 (0.64, 1.08)
2.26 (1.96, 2.61)
1.47 (1.33, 1.62)
1.53 (1.37, 1.71)
0.90 (0.61, 1.33)
1.00 (0.42, 2.40)
2.03 (1.76, 2.34)
1.69 (1.47, 1.95)
1.11 (0.36, 3.41)
2.04 (1.98, 2.10)
2.01 (1.53, 2.64)
1.50 (1.02, 2.21)
1.48 (0.92, 2.39)
1.21 (0.95, 1.53)
2.86 (1.82, 4.49)
1.10 (0.56, 2.14)
1.84 (1.62, 2.09)
1.15 (0.95, 1.39)
2.29 (1.08, 4.86)
5.41 (1.62, 18.07)
1.36 (1.08, 1.72)
0.79 (0.64, 0.97)
1.30 (1.07, 1.58)
1.91 (1.66, 2.20)
2.60 (1.61, 4.20)
1.65 (0.93, 2.91)
0.93 (0.69, 1.26)
1.58 (1.28, 1.95)
2.70 (2.60, 2.80)
1.79 (1.74, 1.84)
1.94 (1.38, 2.73)
0.83 (0.70, 0.98)
3.70 (1.50, 9.13)
0.95 (0.91, 0.99)
0.83 (0.77, 0.90)
5.70 (5.50, 5.91)
1.12 (0.61, 2.06)
1.17 (0.93, 1.47)
1.67 (1.43, 1.94)
1.37 (0.83, 2.26)
1.24 (1.08, 1.42)
1.03 (0.97, 1.09)
1.52 (1.34, 1.73)
100.00
Weight
1.40
1.42
1.33
1.22
1.40
1.10
1.42
1.38
1.39
1.11
1.28
1.37
0.98
1.37
1.40
1.34
1.20
1.39
1.31
0.48
1.34
1.10
%
1.38
1.41
1.36
1.28
1.02
1.36
1.38
1.42
1.14
1.44
0.95
1.23
1.23
1.06
1.11
1.41
0.17
1.32
0.68
0.87
1.31
1.40
1.42
1.41
1.19
0.71
1.40
1.40
0.53
1.43
1.31
1.20
5.34
1.33
1.13
0.90
1.40
1.37
0.82
0.49
26.98
1.36
1.37
1.40
1.10
1.00
1.28
1.35
1.43
1.43
1.24
1.38
0.69
1.43
1.42
1.43
0.96
1.34
1.39
1.07
1.40
1.43
67.69
1.47 (1.33, 1.63)
ratio (95% CI)
1.36 (1.19, 1.55)
1.77 (1.64, 1.91)
1.43 (1.12, 1.82)
1.18 (0.82, 1.69)
1.40 (1.22, 1.61)
0.85 (0.53, 1.37)
1.29 (1.17, 1.42)
1.30 (1.10, 1.54)
1.84 (1.57, 2.16)
1.60 (1.00, 2.56)
1.13 (0.84, 1.52)
0.83 (0.69, 0.99)
1.00 (0.56, 1.80)
1.68 (1.38, 2.05)
1.79 (1.56, 2.05)
1.64 (1.30, 2.07)
2.04 (1.39, 2.99)
1.45 (1.23, 1.71)
1.77 (1.35, 2.32)
0.74 (0.22, 2.52)
1.04 (0.83, 1.31)
0.50 (0.31, 0.80)
Odds
1.49 (1.26, 1.76)
1.43 (1.26, 1.62)
0.80 (0.65, 0.98)
1.83 (1.36, 2.46)
1.87 (1.08, 3.24)
0.90 (0.73, 1.11)
1.36 (1.14, 1.62)
1.31 (1.20, 1.43)
1.94 (1.25, 3.01)
1.55 (1.53, 1.57)
1.30 (0.70, 2.41)
1.02 (0.72, 1.44)
2.30 (1.61, 3.29)
2.00 (1.20, 3.33)
1.73 (1.08, 2.77)
1.75 (1.55, 1.98)
1.92 (0.18, 20.15)
1.65 (1.28, 2.13)
4.17 (1.67, 10.42)
2.70 (1.35, 5.41)
0.83 (0.64, 1.08)
2.26 (1.96, 2.61)
1.47 (1.33, 1.62)
1.53 (1.37, 1.71)
0.90 (0.61, 1.33)
1.00 (0.42, 2.40)
2.03 (1.76, 2.34)
1.69 (1.47, 1.95)
1.11 (0.36, 3.41)
2.04 (1.98, 2.10)
2.01 (1.53, 2.64)
1.50 (1.02, 2.21)
1.48 (0.92, 2.39)
1.21 (0.95, 1.53)
2.86 (1.82, 4.49)
1.10 (0.56, 2.14)
1.84 (1.62, 2.09)
1.15 (0.95, 1.39)
2.29 (1.08, 4.86)
5.41 (1.62, 18.07)
1.36 (1.08, 1.72)
0.79 (0.64, 0.97)
1.30 (1.07, 1.58)
1.91 (1.66, 2.20)
2.60 (1.61, 4.20)
1.65 (0.93, 2.91)
0.93 (0.69, 1.26)
1.58 (1.28, 1.95)
2.70 (2.60, 2.80)
1.79 (1.74, 1.84)
1.94 (1.38, 2.73)
0.83 (0.70, 0.98)
3.70 (1.50, 9.13)
0.95 (0.91, 0.99)
0.83 (0.77, 0.90)
5.70 (5.50, 5.91)
1.12 (0.61, 2.06)
1.17 (0.93, 1.47)
1.67 (1.43, 1.94)
1.37 (0.83, 2.26)
1.24 (1.08, 1.42)
1.03 (0.97, 1.09)
1.52 (1.34, 1.73)
100.00
Weight
1.40
1.42
1.33
1.22
1.40
1.10
1.42
1.38
1.39
1.11
1.28
1.37
0.98
1.37
1.40
1.34
1.20
1.39
1.31
0.48
1.34
1.10
%
1.38
1.41
1.36
1.28
1.02
1.36
1.38
1.42
1.14
1.44
0.95
1.23
1.23
1.06
1.11
1.41
0.17
1.32
0.68
0.87
1.31
1.40
1.42
1.41
1.19
0.71
1.40
1.40
0.53
1.43
1.31
1.20
5.34
1.33
1.13
0.90
1.40
1.37
0.82
0.49
26.98
1.36
1.37
1.40
1.10
1.00
1.28
1.35
1.43
1.43
1.24
1.38
0.69
1.43
1.42
1.43
0.96
1.34
1.39
1.07
1.40
1.43
67.69
1.0496 1 20.2
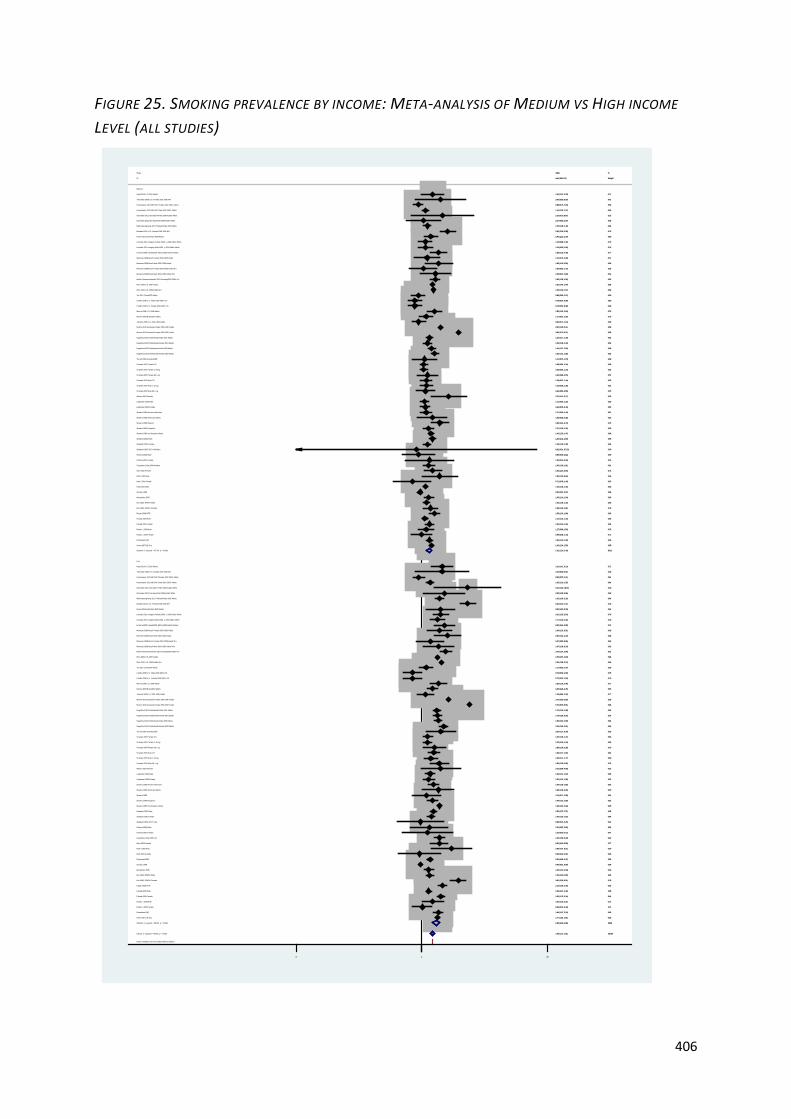
406
FIGURE 25. SMOKING PREVALENCE BY INCOME: META-ANALYSIS OF MEDIUM VS HIGH INCOME
LEVEL (ALL STUDIES)
NOTE: Weights are from random effects analysis
.
.
Overall (I-squared = 98.6%, p = 0.000)
Bombard 2012 U.S. Female 2005-2006 NR
Gilmore 2001 Male
Pudaric 2000 Female
Kim 2006-JPMPH Female
Gilmore 2001 Female
Yin 2011 China2007 Adults
Schaap 2008
Gonçalves-Silva 2005 Low
Laaksonen 2003 Female
Kim 2006-JPMPH Male
Siahpush 2001 Female
Pleis 2010 U.S. 2009 Adults Mix
Menezes 2008 Brazil Male 2004-2005 Adults Mix
Mohsin 2010 Australia Female 2005-2007 Adults
Kiefe 2001 Female
Virtanen 2007 Female 1-19cig
Nagelhout 2012 Netherlands Male 2001 Adults
Kiefe 2001 Male
Leinsalu 2011 Hungary Female 2000 y 2003 Adults White
Fagan 2008-NTR
Shavers 2005 American natives
Shavers 2005 non-Hispanic whites
Virtanen 2007 Male 20+ cig
Nagelhout 2012 Netherlands female 2008 Adults
Kahn 2002 Female
Fukuda 2005 Female
Lemstra 2009 Canada2001-2003 y 2005 Adults Natives
Pleis 2010 U.S. 2009 Adults Mix
Schumann 2011 Germany Female 2006 Adults White
Siahpush 2001 Male
Nagelhout 2012 Netherlands female 2001 Adults
Hajat 2010 U.S.2010 Adults
Bombard 2012 U.S. Female 2005-2006 NR
Shavers 2005 Hispanics
Virtanen 2007 Male 1-19 cig
Fagan 2008-NTR
Subtotal (I-squared = 97.5%, p = 0.000)
Yin 2011 China2007 Adults
Virtanen 2007 Male CS
Menezes 2008 Brazil Female 2000-2005 Adults
Nagelhout 2012 Netherlands female 2008 Adults
Pleis 2009 U.S. 2007 Adults
Subtotal (I-squared = 98.8%, p = 0.000)
Nagelhout 2012 Netherlands Male 2001 Adults
Nagelhout 2012 Netherlands female 2001 Adults
Mekrungrongwong 2011 Thailand Male 2006 Adults
Marrie 2009 U.S. 2006 Adults
Marrie 2009 U.S. 2006 Adults
Hosseinpoor 2011 48 LMIC Female 2002-2004 Adults
Muller-Riemenschneider 2010 Germany2003-2006 <15
Clarkin 2008 U.S. Male 2000-2004 <15
Menezes 2008 Brazil Female 2004-2005 Adults Mix
Virtanen 2007 Male 20+ cig
Pleis 2009 U.S. 2007 Adults
Kahn 2002 Female
Shavers 2005 Medium
Virtanen 2007 Female 20+ cig
Clarkin 2008 U.S. Female 2000-2004 <15
Shavers 2005 American natives
Watson 2003 Female
Schumann 2011 Germany Male 2006 Adults White
Hosseinpoor 2011 48 LMIC Female 2002-2004 Adults
Reijneveld 2002
Gilmore 2001 Male
Pudaric 2000 Female
Fukuda 2005 Male
Virtanen 2007 Female 20+ cig
Kim 2006-JPMPH Female
Hosseinpoor 2011 48 LMIC Male 2002-2004 Adults
Tehranifar 2009 U.S. Female 2001-2006 NR
Mostashari 2005
Johnson 2009 U.S. 2001-2005 Adults
Kumar 2011 India Male 2009 Adults
Virtanen 2007 Female CS
Johnson 2009 U.S. 2001-2005 Adults
Shavers 2005 African Americans
Lemstra 2009 Canada2001-2003 y 2005 Adults Natives
Fukuda 2005 Female
Laaksonen 2003 Female
Reijneveld 2002
Shavers 2005 Hispanics
Kim 2006-JPMPH Male
Leinsalu 2011 Hungary Female 2000 y 2003 Adults White
Mekrungrongwong 2011 Thailand Male 2006 Adults
Mohsin 2010 Australia Female 1995-1997 Adults
Schumann 2011 Germany Male 2006 Adults White
Gilmore 2001 Female
Siahpush 2001 Female
Virtanen 2007 Male 1-19 cig
Low
Menezes 2008 Brazil Male 2000-2005 Adults
Menezes 2008 Brazil Male 2004-2005 Adults Mix
Nagelhout 2012 Netherlands Male 2008 Adults
Menezes 2008 Brazil Female 2004-2005 Adults Mix
Pomerleau 1997
Menezes 2008 Brazil Female 2000-2005 Adults
Clarkin 2008 U.S. Male 2000-2004 <15
Kiefe 2001 Female
Shavers 2005 non-Hispanic whites
Pudaric 2000 Male
Kiefe 2001 Male
Laaksonen 2003 Male
ID
Muller-Riemenschneider 2010 Germany2003-2006 <15
Virtanen 2007 Female CS
Hosseinpoor 2011 48 LMIC Male 2002-2004 Adults
Leinsalu 2011 Hungary Male 2000 y 2003 Adults White
Siahpush 2001 Male
Shavers 2005 African Americans
Turrell 2002 Australia1995
Laaksonen 2003 Male
Fukuda 2005 Male
Mohsin 2010 Australia Female 2005-2007 Adults
Mohsin 2010 Australia Female 1995-1997 Adults
Pomerleau 1997
Leinsalu 2011 Hungary Male 2000 y 2003 Adults White
Study
Clarkin 2008 U.S. female 2000-2004 <15
Green 2007 18-34 y
Siahpush 2003-JECH Low
Siahpush 2003-JECH Medium
Watson 2003 Female
Mostashari 2005
Kumar 2011 India Male 2009 Adults
Schaap 2008
Menezes 2008 Brazil Male 2000-2005 Adults
Pudaric 2000 Male
Shavers 2005
Green 2007 18-34 y
Virtanen 2007 Male CS
Schumann 2011 Germany Female 2006 Adults White
Turrell 2002 Australia1995
Nagelhout 2012 Netherlands Male 2008 Adults
Gonçalves-Silva 2005 Medium
Kuhnen 2009 Brazil2007 Adults
Virtanen 2007 Female 1-19 cig
Tehranifar 2009 U.S. Female 2001-2006 NR
Hajat 2010 U.S.2010 Adults
Medium
Kuhnen 2009 Brazil2007 Adults
1.49 (1.37, 1.61)
2.60 (2.00, 3.38)
0.89 (0.49, 1.62)
1.02 (0.72, 1.44)
3.81 (2.90, 5.01)
1.34 (0.55, 3.26)
1.17 (0.93, 1.47)
0.95 (0.91, 0.99)
1.91 (1.59, 2.29)
1.30 (1.07, 1.58)
1.34 (1.18, 1.52)
1.43 (1.26, 1.62)
1.53 (1.49, 1.57)
1.87 (1.08, 3.24)
5.70 (5.50, 5.91)
0.71 (0.36, 1.40)
1.08 (0.94, 1.24)
1.32 (1.17, 1.49)
1.94 (1.03, 3.65)
2.01 (1.53, 2.64)
2.13 (1.85, 2.45)
1.84 (1.04, 3.26)
1.92 (1.81, 2.04)
1.89 (1.35, 2.65)
1.62 (1.41, 1.86)
1.50 (1.10, 2.05)
2.03 (1.76, 2.34)
1.83 (1.35, 2.48)
2.04 (1.98, 2.10)
5.41 (1.62, 18.07)
1.53 (1.37, 1.71)
1.79 (1.56, 2.05)
2.10 (1.41, 3.13)
5.40 (4.10, 7.11)
1.27 (1.06, 1.52)
1.40 (1.11, 1.77)
1.59 (1.34, 1.89)
1.31 (1.20, 1.43)
0.88 (0.69, 1.12)
1.18 (0.97, 1.44)
1.94 (1.25, 3.01)
2.26 (1.96, 2.61)
1.50 (1.46, 1.54)
1.69 (1.49, 1.92)
1.75 (1.55, 1.98)
1.25 (1.09, 1.43)
1.23 (1.08, 1.40)
1.83 (1.36, 2.46)
1.59 (1.24, 2.04)
0.90 (0.73, 1.11)
2.42 (1.97, 2.96)
0.72 (0.52, 1.00)
1.37 (0.83, 2.26)
1.15 (0.83, 1.59)
1.79 (1.74, 1.84)
1.90 (1.40, 2.58)
1.95 (1.41, 2.70)
1.23 (0.86, 1.76)
0.72 (0.52, 1.00)
1.46 (0.86, 2.48)
2.70 (1.41, 5.17)
1.07 (0.58, 1.97)
0.88 (0.75, 1.03)
1.36 (1.26, 1.47)
1.32 (0.67, 2.60)
0.99 (0.68, 1.44)
1.12 (1.02, 1.23)
1.58 (1.05, 2.38)
1.38 (1.05, 1.81)
1.36 (1.19, 1.55)
2.10 (0.80, 5.51)
1.30 (1.10, 1.54)
0.90 (0.71, 1.14)
1.40 (1.10, 1.78)
1.08 (0.94, 1.24)
1.13 (0.84, 1.52)
1.54 (1.28, 1.85)
2.30 (1.61, 3.29)
1.34 (1.16, 1.55)
1.13 (0.95, 1.34)
1.15 (1.06, 1.25)
1.49 (1.23, 1.80)
1.20 (1.09, 1.32)
1.13 (0.88, 1.45)
1.91 (1.66, 2.20)
2.70 (2.60, 2.80)
2.29 (1.08, 4.86)
1.25 (0.50, 3.12)
1.23 (1.09, 1.39)
1.19 (0.96, 1.48)
2.60 (1.61, 4.20)
1.66 (0.97, 2.84)
1.44 (1.27, 1.63)
1.06 (0.65, 1.73)
1.84 (1.57, 2.16)
1.21 (0.76, 1.93)
0.78 (0.62, 0.98)
0.93 (0.43, 2.01)
1.40 (1.33, 1.47)
1.50 (1.02, 2.21)
2.96 (1.41, 6.21)
1.11 (0.95, 1.30)
ratio (95% CI)
1.63 (1.36, 1.95)
1.25 (1.06, 1.47)
1.14 (1.02, 1.27)
1.77 (1.35, 2.32)
1.46 (1.31, 1.63)
1.17 (0.95, 1.44)
2.02 (1.17, 3.49)
1.36 (1.14, 1.62)
1.29 (1.17, 1.42)
3.90 (3.70, 4.11)
2.00 (1.90, 2.11)
1.33 (1.19, 1.49)
1.16 (0.90, 1.50)
Odds
0.78 (0.62, 0.98)
1.77 (1.64, 1.91)
0.96 (0.41, 2.25)
0.82 (0.01, 67.23)
2.01 (0.99, 4.08)
1.30 (1.10, 1.54)
2.00 (1.20, 3.33)
0.94 (0.91, 0.97)
1.88 (1.16, 3.05)
1.17 (0.89, 1.54)
1.19 (0.71, 1.99)
1.43 (1.34, 1.53)
1.56 (1.27, 1.92)
2.16 (0.70, 6.67)
1.11 (0.71, 1.74)
1.84 (1.62, 2.09)
1.30 (1.05, 1.61)
1.49 (1.26, 1.76)
1.23 (1.05, 1.44)
2.00 (0.80, 5.00)
1.50 (1.01, 2.23)
1.17 (0.91, 1.50)
100.00
0.79
0.59
0.74
0.78
0.42
0.80
0.86
0.82
0.82
0.84
0.84
0.86
0.62
0.86
0.53
0.84
0.84
0.56
0.78
0.84
0.60
0.85
0.75
0.84
0.76
0.84
0.77
0.86
0.30
0.85
0.84
0.71
0.78
0.82
0.80
0.83
50.31
0.80
0.82
0.69
0.84
0.86
49.69
0.84
0.84
0.84
0.77
0.79
0.81
0.81
0.75
0.65
0.75
0.86
0.77
0.75
0.74
0.75
0.63
0.55
0.58
0.83
0.85
0.54
0.72
0.85
0.70
0.78
0.84
0.39
0.83
0.80
0.80
0.84
0.77
0.82
0.74
0.84
0.83
0.85
0.82
0.85
0.79
0.84
0.86
0.49
0.41
0.84
0.81
0.66
0.62
0.84
0.65
0.83
0.67
0.80
0.48
0.86
0.72
0.50
0.83
Weight
0.82
0.83
0.85
0.78
0.85
0.81
0.62
0.83
0.85
0.86
0.86
0.85
0.79
%
0.80
0.85
0.44
0.03
0.52
0.83
0.64
0.86
0.66
0.78
0.64
0.85
0.81
0.32
0.68
0.84
0.81
0.83
0.83
0.41
0.71
0.79
1.01 1 100
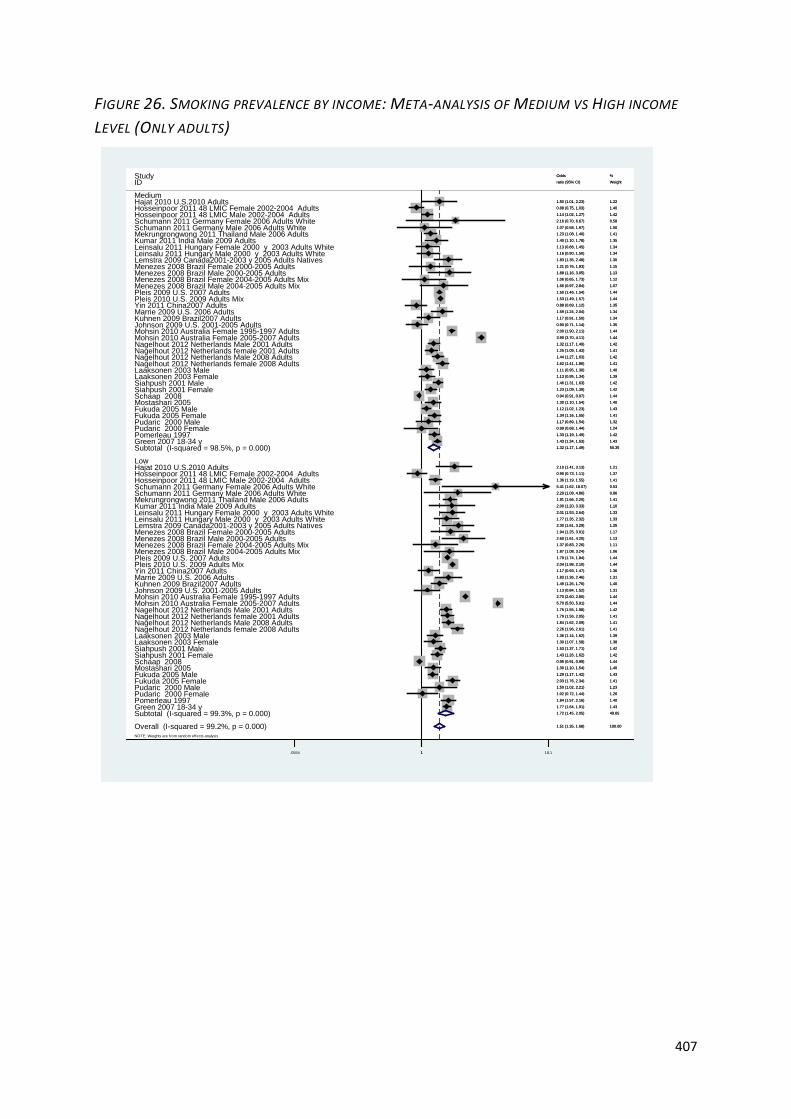
407
FIGURE 26. SMOKING PREVALENCE BY INCOME: META-ANALYSIS OF MEDIUM VS HIGH INCOME
LEVEL (ONLY ADULTS)
NOTE: Weights are from random effects analysis
.
.
Overall (I-squared = 99.2%, p = 0.000)
Green 2007 18-34 y
Pudaric 2000 Female
Mohsin 2010 Australia Female 1995-1997 Adults
Pudaric 2000 Male
Schumann 2011 Germany Female 2006 Adults White
Nagelhout 2012 Netherlands Male 2001 Adults
Mostashari 2005
Nagelhout 2012 Netherlands Male 2008 Adults
Marrie 2009 U.S. 2006 Adults
Nagelhout 2012 Netherlands female 2001 Adults
Nagelhout 2012 Netherlands female 2001 Adults
Siahpush 2001 Female
Lemstra 2009 Canada2001-2003 y 2005 Adults Natives
Pudaric 2000 Male
Nagelhout 2012 Netherlands female 2008 Adults
Pleis 2009 U.S. 2007 Adults
Pleis 2010 U.S. 2009 Adults Mix
Marrie 2009 U.S. 2006 Adults
Laaksonen 2003 Female
Mohsin 2010 Australia Female 1995-1997 Adults
Siahpush 2001 Male
Fukuda 2005 Female
Menezes 2008 Brazil Female 2004-2005 Adults Mix
Yin 2011 China2007 Adults
Leinsalu 2011 Hungary Female 2000 y 2003 Adults White
Schumann 2011 Germany Male 2006 Adults White
Fukuda 2005 Female
Pleis 2010 U.S. 2009 Adults Mix
Green 2007 18-34 y
Siahpush 2001 Male
Menezes 2008 Brazil Male 2004-2005 Adults Mix
Yin 2011 China2007 Adults
Leinsalu 2011 Hungary Male 2000 y 2003 Adults White
Menezes 2008 Brazil Female 2004-2005 Adults Mix
Mekrungrongwong 2011 Thailand Male 2006 Adults
Siahpush 2001 Female
Menezes 2008 Brazil Male 2000-2005 Adults
Hosseinpoor 2011 48 LMIC Male 2002-2004 Adults
Mekrungrongwong 2011 Thailand Male 2006 Adults
Menezes 2008 Brazil Male 2004-2005 Adults Mix
Low
Schumann 2011 Germany Male 2006 Adults White
Johnson 2009 U.S. 2001-2005 Adults
Hajat 2010 U.S.2010 Adults
Kuhnen 2009 Brazil2007 Adults
Johnson 2009 U.S. 2001-2005 Adults
ID
Menezes 2008 Brazil Female 2000-2005 Adults
Hosseinpoor 2011 48 LMIC Female 2002-2004 Adults
Schaap 2008
Laaksonen 2003 Male
Mohsin 2010 Australia Female 2005-2007 Adults
Laaksonen 2003 Female
Mostashari 2005
Pomerleau 1997
Kumar 2011 India Male 2009 Adults
Hosseinpoor 2011 48 LMIC Female 2002-2004 Adults
Kuhnen 2009 Brazil2007 Adults
Mohsin 2010 Australia Female 2005-2007 Adults
Schaap 2008
Hajat 2010 U.S.2010 Adults
Nagelhout 2012 Netherlands Male 2008 Adults
Hosseinpoor 2011 48 LMIC Male 2002-2004 Adults
Nagelhout 2012 Netherlands female 2008 Adults
Kumar 2011 India Male 2009 Adults
Subtotal (I-squared = 98.5%, p = 0.000)
Menezes 2008 Brazil Female 2000-2005 Adults
Leinsalu 2011 Hungary Male 2000 y 2003 Adults White
Fukuda 2005 Male
Subtotal (I-squared = 99.3%, p = 0.000)
Pomerleau 1997
Leinsalu 2011 Hungary Female 2000 y 2003 Adults White
Laaksonen 2003 Male
Lemstra 2009 Canada2001-2003 y 2005 Adults Natives
Menezes 2008 Brazil Male 2000-2005 Adults
Pudaric 2000 Female
Schumann 2011 Germany Female 2006 Adults White
Medium
Pleis 2009 U.S. 2007 Adults
Fukuda 2005 Male
Nagelhout 2012 Netherlands Male 2001 Adults
Study
1.51 (1.35, 1.68)
1.77 (1.64, 1.91)
1.02 (0.72, 1.44)
2.70 (2.60, 2.80)
1.50 (1.02, 2.21)
5.41 (1.62, 18.07)
1.75 (1.55, 1.98)
1.30 (1.10, 1.54)
1.84 (1.62, 2.09)
1.83 (1.36, 2.46)
1.25 (1.09, 1.43)
1.79 (1.56, 2.05)
1.43 (1.26, 1.62)
2.30 (1.61, 3.29)
1.17 (0.89, 1.54)
2.26 (1.96, 2.61)
1.50 (1.46, 1.54)
2.04 (1.98, 2.10)
1.59 (1.24, 2.04)
1.30 (1.07, 1.58)
2.00 (1.90, 2.11)
1.53 (1.37, 1.71)
1.34 (1.16, 1.55)
1.06 (0.65, 1.73)
1.17 (0.93, 1.47)
2.01 (1.53, 2.64)
2.29 (1.08, 4.86)
2.03 (1.76, 2.34)
1.53 (1.49, 1.57)
1.43 (1.34, 1.53)
1.46 (1.31, 1.63)
1.66 (0.97, 2.84)
0.88 (0.69, 1.12)
1.77 (1.35, 2.32)
1.37 (0.83, 2.26)
1.91 (1.66, 2.20)
1.23 (1.09, 1.39)
1.88 (1.16, 3.05)
1.36 (1.19, 1.55)
1.23 (1.08, 1.40)
1.87 (1.08, 3.24)
1.07 (0.58, 1.97)
0.90 (0.71, 1.14)
1.50 (1.01, 2.23)
1.17 (0.91, 1.50)
1.13 (0.84, 1.52)
ratio (95% CI)
1.21 (0.76, 1.93)
0.88 (0.75, 1.03)
0.94 (0.91, 0.97)
1.36 (1.14, 1.62)
5.70 (5.50, 5.91)
1.13 (0.95, 1.34)
1.30 (1.10, 1.54)
1.84 (1.57, 2.16)
1.40 (1.10, 1.78)
0.90 (0.73, 1.11)
1.49 (1.26, 1.76)
3.90 (3.70, 4.11)
0.95 (0.91, 0.99)
2.10 (1.41, 3.13)
1.44 (1.27, 1.63)
1.14 (1.02, 1.27)
1.62 (1.41, 1.86)
2.00 (1.20, 3.33)
1.32 (1.17, 1.49)
1.94 (1.25, 3.01)
1.16 (0.90, 1.50)
1.12 (1.02, 1.23)
1.72 (1.45, 2.05)
1.33 (1.19, 1.49)
1.13 (0.88, 1.45)
1.11 (0.95, 1.30)
1.83 (1.35, 2.48)
2.60 (1.61, 4.20)
0.99 (0.68, 1.44)
2.16 (0.70, 6.67)
1.79 (1.74, 1.84)
1.29 (1.17, 1.42)
1.32 (1.17, 1.49)
Odds
100.00
1.43
1.26
1.44
1.23
0.53
1.42
1.40
1.41
1.31
1.41
1.41
1.42
1.25
1.32
1.41
1.44
1.44
1.34
1.38
1.44
1.42
1.41
1.12
1.36
1.33
0.86
1.41
1.44
1.43
1.42
1.07
1.35
1.33
1.11
1.41
1.42
1.13
1.41
1.41
1.06
1.00
1.35
1.22
1.34
1.31
Weight
1.15
1.40
1.44
1.39
1.44
1.39
1.40
1.40
1.35
1.37
1.40
1.44
1.44
1.21
1.42
1.42
1.41
1.10
50.35
1.17
1.34
1.43
49.65
1.42
1.34
1.40
1.30
1.13
1.24
0.58
1.44
1.43
1.42
%
1.0554 1 18.1
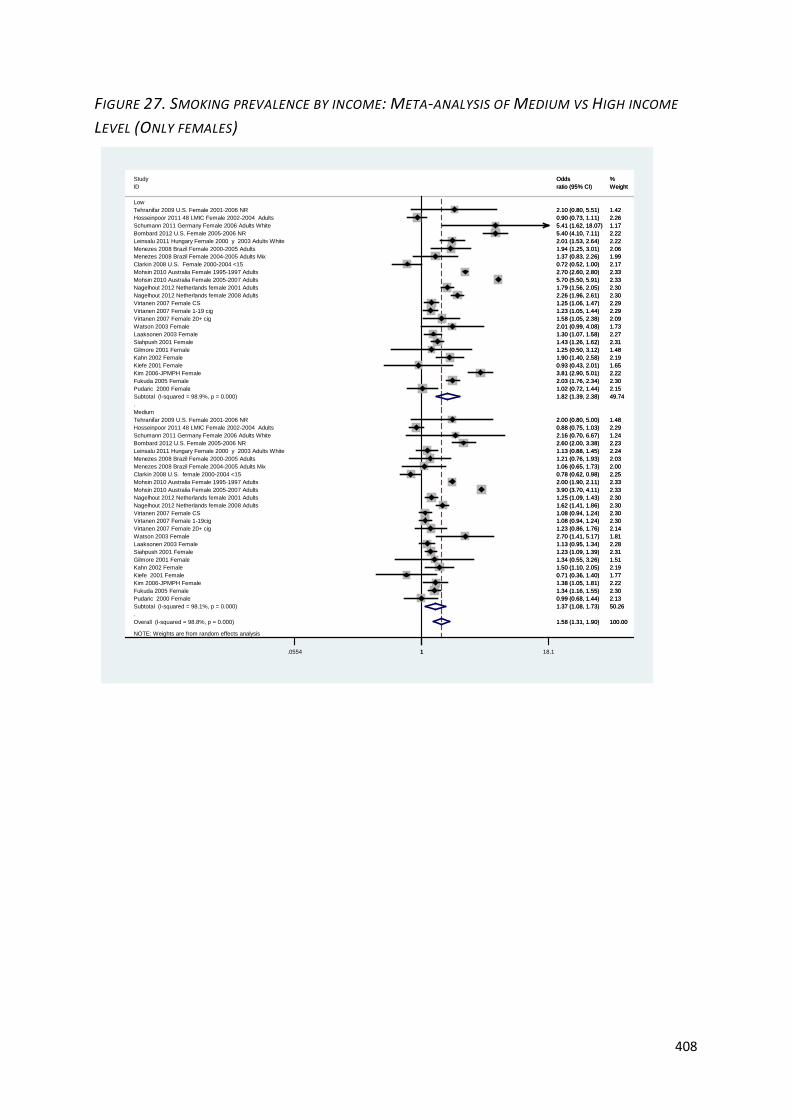
408
FIGURE 27. SMOKING PREVALENCE BY INCOME: META-ANALYSIS OF MEDIUM VS HIGH INCOME
LEVEL (ONLY FEMALES)
NOTE: Weights are from random effects analysis
.
.
Overall (I-squared = 98.8%, p = 0.000)
Menezes 2008 Brazil Female 2004-2005 Adults Mix
Virtanen 2007 Female 20+ cig
Menezes 2008 Brazil Female 2000-2005 AdultsMenezes 2008 Brazil Female 2004-2005 Adults Mix
Kiefe 2001 Female
Hosseinpoor 2011 48 LMIC Female 2002-2004 Adults
Fukuda 2005 Female
Virtanen 2007 Female 1-19cig
Gilmore 2001 FemaleSiahpush 2001 Female
Laaksonen 2003 Female
Mohsin 2010 Australia Female 2005-2007 Adults
Kim 2006-JPMPH Female
Leinsalu 2011 Hungary Female 2000 y 2003 Adults White
Virtanen 2007 Female 1-19 cig
Clarkin 2008 U.S. female 2000-2004 <15
Kim 2006-JPMPH Female
Mohsin 2010 Australia Female 1995-1997 Adults
Laaksonen 2003 Female
Gilmore 2001 Female
Virtanen 2007 Female 20+ cig
Watson 2003 Female
Siahpush 2001 Female
Nagelhout 2012 Netherlands female 2001 Adults
Nagelhout 2012 Netherlands female 2001 Adults
Kahn 2002 Female
Medium
Hosseinpoor 2011 48 LMIC Female 2002-2004 Adults
Bombard 2012 U.S. Female 2005-2006 NR
Fukuda 2005 Female
Schumann 2011 Germany Female 2006 Adults White
Kiefe 2001 Female
Kahn 2002 Female
Subtotal (I-squared = 98.1%, p = 0.000)
ID
Menezes 2008 Brazil Female 2000-2005 Adults
Subtotal (I-squared = 98.9%, p = 0.000)Pudaric 2000 Female
Study
Virtanen 2007 Female CS
Clarkin 2008 U.S. Female 2000-2004 <15
Nagelhout 2012 Netherlands female 2008 Adults
Nagelhout 2012 Netherlands female 2008 Adults
Tehranifar 2009 U.S. Female 2001-2006 NR
Mohsin 2010 Australia Female 2005-2007 Adults
Mohsin 2010 Australia Female 1995-1997 Adults
Watson 2003 Female
Virtanen 2007 Female CS
Leinsalu 2011 Hungary Female 2000 y 2003 Adults White
Pudaric 2000 Female
Schumann 2011 Germany Female 2006 Adults White
Tehranifar 2009 U.S. Female 2001-2006 NRLow
Bombard 2012 U.S. Female 2005-2006 NR
1.58 (1.31, 1.90)
1.37 (0.83, 2.26)
1.58 (1.05, 2.38)
1.21 (0.76, 1.93)1.06 (0.65, 1.73)
0.71 (0.36, 1.40)
0.88 (0.75, 1.03)
1.34 (1.16, 1.55)
1.08 (0.94, 1.24)
1.34 (0.55, 3.26)1.23 (1.09, 1.39)
1.30 (1.07, 1.58)
5.70 (5.50, 5.91)
3.81 (2.90, 5.01)
2.01 (1.53, 2.64)
1.23 (1.05, 1.44)
0.78 (0.62, 0.98)
1.38 (1.05, 1.81)
2.00 (1.90, 2.11)
1.13 (0.95, 1.34)
1.25 (0.50, 3.12)
1.23 (0.86, 1.76)
2.01 (0.99, 4.08)
1.43 (1.26, 1.62)
1.25 (1.09, 1.43)
1.79 (1.56, 2.05)
1.90 (1.40, 2.58)
0.90 (0.73, 1.11)
2.60 (2.00, 3.38)
2.03 (1.76, 2.34)
5.41 (1.62, 18.07)
0.93 (0.43, 2.01)
1.50 (1.10, 2.05)
1.37 (1.08, 1.73)
ratio (95% CI)
1.94 (1.25, 3.01)
1.82 (1.39, 2.38)1.02 (0.72, 1.44)
Odds
1.25 (1.06, 1.47)
0.72 (0.52, 1.00)
1.62 (1.41, 1.86)
2.26 (1.96, 2.61)
2.00 (0.80, 5.00)
3.90 (3.70, 4.11)
2.70 (2.60, 2.80)
2.70 (1.41, 5.17)
1.08 (0.94, 1.24)
1.13 (0.88, 1.45)
0.99 (0.68, 1.44)
2.16 (0.70, 6.67)
2.10 (0.80, 5.51)
5.40 (4.10, 7.11)
100.00
1.99
2.09
2.032.00
1.77
2.29
2.30
2.30
1.512.31
2.27
2.33
2.22
2.22
2.29
2.25
2.22
2.33
2.28
1.48
2.14
1.73
2.31
2.30
2.30
2.19
2.26
2.23
2.30
1.17
1.65
2.19
50.26
Weight
2.06
49.742.15
%
2.29
2.17
2.30
2.30
1.48
2.33
2.33
1.81
2.30
2.24
2.13
1.24
1.42
2.22
1.0554 1 18.1
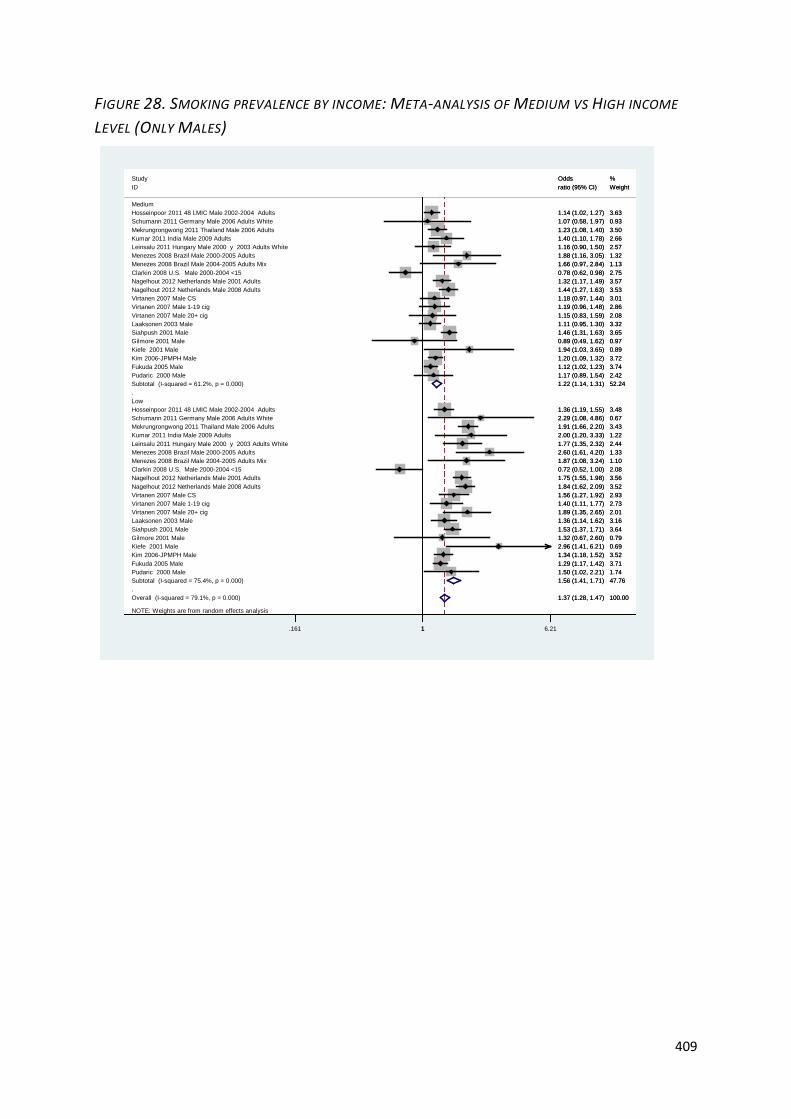
409
FIGURE 28. SMOKING PREVALENCE BY INCOME: META-ANALYSIS OF MEDIUM VS HIGH INCOME
LEVEL (ONLY MALES)
NOTE: Weights are from random effects analysis
.
.Overall (I-squared = 79.1%, p = 0.000)
Menezes 2008 Brazil Male 2000-2005 Adults
Virtanen 2007 Male 20+ cig
Clarkin 2008 U.S. Male 2000-2004 <15Nagelhout 2012 Netherlands Male 2001 Adults
Low
Schumann 2011 Germany Male 2006 Adults White
Gilmore 2001 Male
Fukuda 2005 Male
Clarkin 2008 U.S. Male 2000-2004 <15
Virtanen 2007 Male 1-19 cig
Laaksonen 2003 Male
Nagelhout 2012 Netherlands Male 2001 Adults
Hosseinpoor 2011 48 LMIC Male 2002-2004 Adults
Leinsalu 2011 Hungary Male 2000 y 2003 Adults White
Subtotal (I-squared = 75.4%, p = 0.000)
Fukuda 2005 Male
Menezes 2008 Brazil Male 2000-2005 Adults
ID
Nagelhout 2012 Netherlands Male 2008 Adults
Mekrungrongwong 2011 Thailand Male 2006 Adults
Kiefe 2001 Male
Nagelhout 2012 Netherlands Male 2008 AdultsVirtanen 2007 Male CS
Menezes 2008 Brazil Male 2004-2005 Adults Mix
Subtotal (I-squared = 61.2%, p = 0.000)
Schumann 2011 Germany Male 2006 Adults White
Kumar 2011 India Male 2009 Adults
Siahpush 2001 Male
Kumar 2011 India Male 2009 Adults
Study
Virtanen 2007 Male CS
Siahpush 2001 Male
Virtanen 2007 Male 20+ cig
Menezes 2008 Brazil Male 2004-2005 Adults Mix
Pudaric 2000 Male
Pudaric 2000 Male
Kiefe 2001 MaleKim 2006-JPMPH Male
Gilmore 2001 Male
Virtanen 2007 Male 1-19 cig
Leinsalu 2011 Hungary Male 2000 y 2003 Adults White
Mekrungrongwong 2011 Thailand Male 2006 Adults
Laaksonen 2003 Male
Hosseinpoor 2011 48 LMIC Male 2002-2004 AdultsMedium
Kim 2006-JPMPH Male
1.37 (1.28, 1.47)
2.60 (1.61, 4.20)
1.15 (0.83, 1.59)
0.72 (0.52, 1.00)1.75 (1.55, 1.98)
1.07 (0.58, 1.97)
1.32 (0.67, 2.60)
1.12 (1.02, 1.23)
0.78 (0.62, 0.98)
1.19 (0.96, 1.48)
1.36 (1.14, 1.62)
1.32 (1.17, 1.49)
1.36 (1.19, 1.55)
1.16 (0.90, 1.50)
1.56 (1.41, 1.71)
1.29 (1.17, 1.42)
1.88 (1.16, 3.05)
ratio (95% CI)
1.84 (1.62, 2.09)
1.91 (1.66, 2.20)
2.96 (1.41, 6.21)
1.44 (1.27, 1.63)1.18 (0.97, 1.44)
1.66 (0.97, 2.84)
1.22 (1.14, 1.31)
2.29 (1.08, 4.86)
2.00 (1.20, 3.33)
1.53 (1.37, 1.71)
1.40 (1.10, 1.78)
Odds
1.56 (1.27, 1.92)
1.46 (1.31, 1.63)
1.89 (1.35, 2.65)
1.87 (1.08, 3.24)
1.17 (0.89, 1.54)
1.50 (1.02, 2.21)
1.94 (1.03, 3.65)1.20 (1.09, 1.32)
0.89 (0.49, 1.62)
1.40 (1.11, 1.77)
1.77 (1.35, 2.32)
1.23 (1.08, 1.40)
1.11 (0.95, 1.30)
1.14 (1.02, 1.27)
1.34 (1.18, 1.52)
100.00
1.33
2.08
2.083.56
0.93
0.79
3.74
2.75
2.86
3.16
3.57
3.48
2.57
47.76
3.71
1.32
Weight
3.52
3.43
0.69
3.533.01
1.13
52.24
0.67
1.22
3.64
2.66
%
2.93
3.65
2.01
1.10
2.42
1.74
0.893.72
0.97
2.73
2.44
3.50
3.32
3.63
3.52
1.161 1 6.21
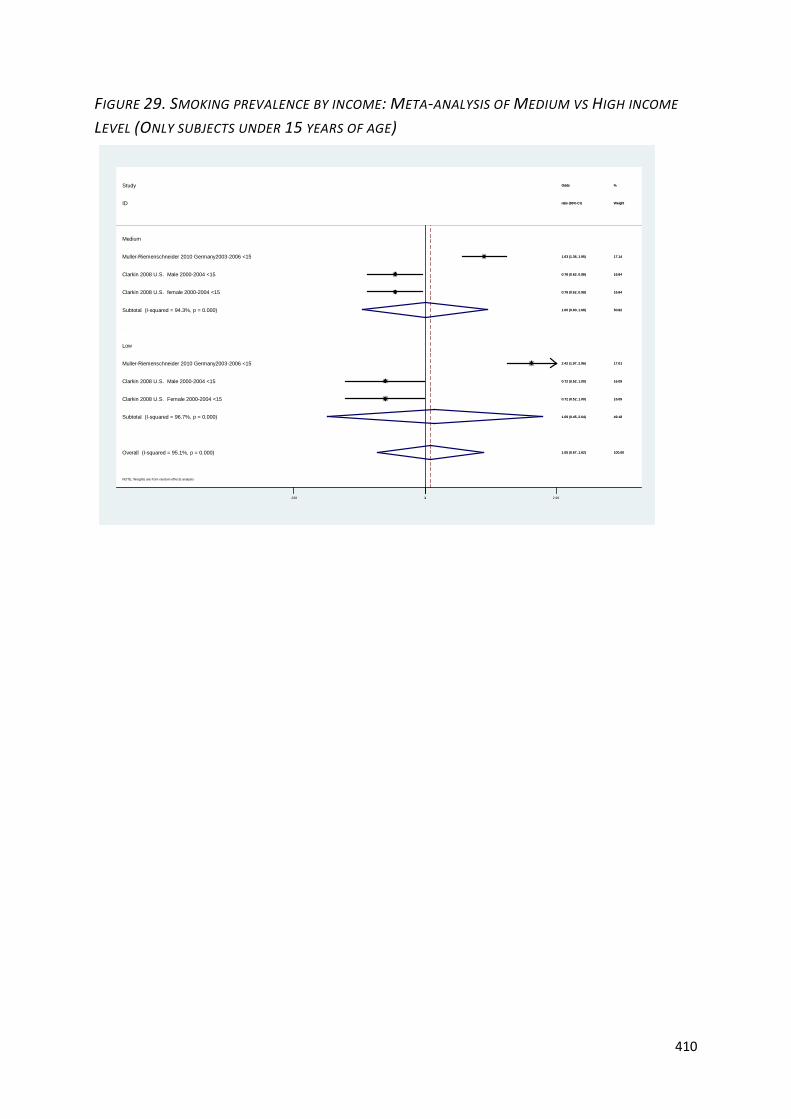
410
FIGURE 29. SMOKING PREVALENCE BY INCOME: META-ANALYSIS OF MEDIUM VS HIGH INCOME
LEVEL (ONLY SUBJECTS UNDER 15 YEARS OF AGE)
NOTE: Weights are from random effects analysis
.
.
Overall (I-squared = 95.1%, p = 0.000)
Clarkin 2008 U.S. Male 2000-2004 <15
Clarkin 2008 U.S. Male 2000-2004 <15
Muller-Riemenschneider 2010 Germany2003-2006 <15
Muller-Riemenschneider 2010 Germany2003-2006 <15
Low
Medium
Subtotal (I-squared = 94.3%, p = 0.000)
Clarkin 2008 U.S. female 2000-2004 <15
Clarkin 2008 U.S. Female 2000-2004 <15
ID
Subtotal (I-squared = 96.7%, p = 0.000)
Study
1.05 (0.67, 1.62)
0.72 (0.52, 1.00)
0.78 (0.62, 0.98)
1.63 (1.36, 1.95)
2.42 (1.97, 2.96)
1.00 (0.60, 1.68)
0.78 (0.62, 0.98)
0.72 (0.52, 1.00)
ratio (95% CI)
1.09 (0.45, 2.64)
Odds
100.00
16.09
16.84
17.14
17.01
50.82
16.84
16.09
Weight
49.18
%
1.05 (0.67, 1.62)
0.72 (0.52, 1.00)
0.78 (0.62, 0.98)
1.63 (1.36, 1.95)
2.42 (1.97, 2.96)
1.00 (0.60, 1.68)
0.78 (0.62, 0.98)
0.72 (0.52, 1.00)
ratio (95% CI)
1.09 (0.45, 2.64)
Odds
100.00
16.09
16.84
17.14
17.01
50.82
16.84
16.09
Weight
49.18
%
1.338 1 2.96
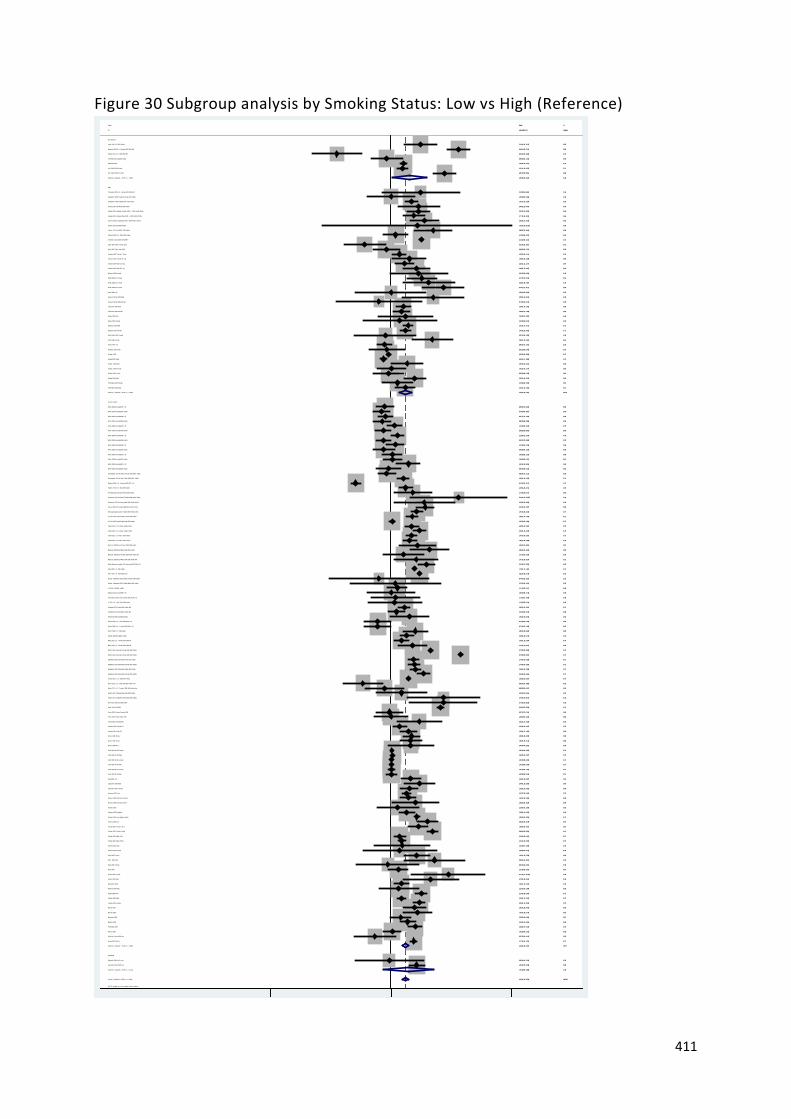
411
Figure 30 Subgroup analysis by Smoking Status: Low vs High (Reference)
NOTE: Weights are from random effects analysis
.
.
.
.
Overall (I-squared = 98.8%, p = 0.000)
Mody 2006 USA1996
Anaya Ocampo 2006 Male
Mistry 2011 U.S. Male 2003-2004 Adults Mix
Subtotal (I-squared = 58.3%, p = 0.121)
Green 2007 18-34 y
Kumar 2011 India Male 2009 Adults
Household
Subtotal (I-squared = 99.1%, p = 0.000)
Jitnarin 2011 Thailand Female 2004-2005 Adults
Kuhnen 2009 Brazil2007 Adults
White 2008 Australia1987 <15
Turrell 2002 Australia1995
Erick-Peleti 2007 Female
White 2008 Australia1990 <15
Fukuda 2007 Female 20-59y
White 2008 Australia2002 Adults
Parna 2002 Estonia Male 1996
Fukuda 2005 Male
Fagan 2008-NTR
Pudaric 2000 Female
ID
Cohen 2011 U.S. Female Adults White
Gilmore 2001 Female
Current smoker
Study
White 2008 Australia1990 Adults
White 2008 Australia1996 Adults
Schaap 2008
Ross 2000
Virtanen 2007 Female 1-19 cig
Kiefe 2001 Male
Metcalf 2008
Alam 2008 Low
Shavers 2005 non-Hispanic whites
Amuzu 2009 UK Female 1999-2001 Adults White
Thomas 2008 Low
Fukuda 2005 Female
Bortoluzzi 2009 Brazil2005 Adults
Pomerleau 2004 Female
Laaksonen 2005 Female
Laaksonen 2005 Male
Pudaric 2000 Male
Coreil 1991 20-39 Male
Silvestre Garcia 1990 Low
Shavers 2005 American natives
Coreil 1991 40-64 Female
Menezes 2008 Brazil Female 2000-2005 Adults
Fukuda 2007 Male 20-59y
Hosseinpoor 2011 48 LMIC Male 2002-2004 Adults
Menezes 2008 Brazil Male 2004-2005 Adults Mix
Kim 2006-JPMPH Male
Virtanen 2007 Male CS
Siahpush 2003-JECH Low
Marrie 2009 U.S. 2006 Adults
Virtanen 2007 Male 20+ cig
Parna 2002 Estonia Female 1996
Kaleta 2007 Low
White 2008 Australia2005 Adults
Al-Windi 2010 Iraq2006 Adults
Woitas- Slubowska 2010 Polland Female 2004 Adults
Wister 1996 65+ y
White 2008 Australia1999 Adults
Virtanen 2007 Female 20+ cig
Park 2010 South Korea Female 2005 Adults mix
Wister 1996 25-44 y
Leinsalu 2011 Hungary Female 2000 y 2003 Adults White
Pleis 2009 U.S. 2007 Adults
Mohsin 2010 Australia Female 1995-1997 Adults
Mitra 2012 U.S. female 2007-2009 All
Patrick 2012 U.S. 2005-2007 NR
Pleis 2010 U.S. 2009 Adults Mix
Siahpush 2001 Male
Reijneveld 2002
Clarkin 2008 U.S. Male 2000-2004 <15
White 2008 Australia2002 <15
Virtanen 2007 Female CS
Stringhini 2011 France2007 Adults Mix
Li 2012 U.S. Male 2002-2003 Adults
Aekplakorn 2008 Thailand Male 2004 Adults
Dall'Agnol 2011 Brazil1998 <15
Webb 2008 G2 Female
Woitas- Slubowska 2010 Polland Male 2004 Adults
Mistry 2011 U.S. Female 2003-2004 Adults Mix
Coreil 1991 65-74 Female
Singh 1997 India Female 1991
Khuwaja 2004 Male
Wallace 2009 U.S. Female 2003-2007 <15
Menezes 2008 Brazil Female 2004-2005 Adults Mix
Menezes 2008 Brazil Male 2000-2005 Adults
Virtanen 2007 Male 1-19 cig
Siahpush 2001 Female
Cohen 2011 U.S. Male Adults Black
Singh 1997 India Male 1991
Cohen 2011 U.S. Female Adults Black
Not reported
Al-Turki 2010 Saudi Arabia Female 2005 Adults
Webb 2008 G3 Female
Mohsin 2010 Australia Female 2005-2007 Adults
Al-Sahab 2010 Canada Female 2006 Adults
Nagelhout 2012 Netherlands female 2008 Adults
White 2008 Australia1993 Adults
White 2008 Australia1987 Adults
Lawrence 2007 Low
Gilmore 2001 Male
Bombard 2012 U.S. Female 2005-2006 NR
Subtotal (I-squared = 95.9%, p = 0.000)
White 2008 Australia2005 <15
Webb 2008 G1 Female
Pomerleau 1997
Mekrungrongwong 2011 Thailand Male 2006 Adults
White 2008 Australia1999 <15
Diez-Roux 1999 USA1992-1994
Schumann 2011 Germany Male 2006 Adults White
White 2008 Australia1993 <15
Lemstra 2009 Canada2001-2003 y 2005 Adults Natives
Johnson 2009 U.S. 2001-2005 Adults
Chahine 2011 U.S. 2006-2007 Adults
Hajat 2010 U.S.2010 Adults
Schumann 2011 Germany Female 2006 Adults White
Samet 1992 Female
Nagelhout 2012 Netherlands Male 2008 Adults
Daily
Shavers 2005
Pudule 1999 Female
Kahn 2002 Female
Al-Turki 2010 Saudi Arabia Male 2005 Adults
Jitnarin 2011 Thailand Male 2004-2005 Adults
Watson 2003 Female
Mitra 2012 U.S. female 2007-2009 All
Coreil 1991 40-64 Male
Moreira 1995
Kahn 2005 Female
Acevedo-Garcia 2005 USA1995-6
Yin 2011 China2007 Adults
King 1999 Low
Shapo 2003 Female
Coreil 1991 65-74 Male
Laaksonen 2003 Female
Laaksonen 2003 Male
Metcalf 2007
Coreil 1991 20-39 Female
Hosseinpoor 2011 48 LMIC Female 2002-2004 Adults
Fukuda 2007 Male >60 y
Gonçalves-Silva 2005 Low
Shavers 2005 African Americans
Pomerleau 2004 Male
Wister 1996 45-64 y
Leinsalu 2011 Hungary Male 2000 y 2003 Adults White
Shapo 2003 Male
White 2008 Australia1996 <15
Samet 1992 Male
Mfenyana 2006
Subtotal (I-squared = 96.6%, p = 0.000)
Zaitune 2012 Brazil2001-2002 Adults
Pudule 1999 Male
Sandin 2010 Brazil2009 Adults
Rahman 2005 Male
Nagelhout 2012 Netherlands female 2001 Adults
Nagelhout 2012 Netherlands Male 2001 Adults
Hughes 2010 U.S. 2004-2005 Adults
Clarkin 2008 U.S. Female 2000-2004 <15
Aekplakorn 2008 Thailand Female 2004 Adults
Tehranifar 2009 U.S. Female 2001-2006 NR
Hesketh2007 Male
Fukuda 2007 Female >60 y
Marinho 2008
Kim 2006-JPMPH Female
Muller-Riemenschneider 2010 Germany2003-2006 <15
Kiefe 2001 Female
Cohen 2011 U.S. Male Adults White
Shavers 2005 Hispanics
Mostashari 2005
Anaya Ocampo 2006 Female
Stringhini 2011 France1995 Adults Mix
1.45 (1.35, 1.56)
3.45 (3.23, 3.69)
2.86 (1.33, 6.12)
0.50 (0.31, 0.80)
1.54 (0.83, 2.88)
1.77 (1.64, 1.91)
2.00 (1.20, 3.33)
1.44 (1.32, 1.57)
3.70 (1.50, 9.13)
1.49 (1.26, 1.76)
0.86 (0.70, 1.06)
2.02 (1.17, 3.49)
0.87 (0.41, 1.85)
0.87 (0.72, 1.04)
2.84 (2.50, 3.23)
1.04 (0.83, 1.31)
1.00 (0.67, 1.49)
1.29 (1.17, 1.42)
2.13 (1.85, 2.45)
1.02 (0.72, 1.44)
ratio (95% CI)
2.04 (1.76, 2.36)
1.25 (0.50, 3.12)
Odds
0.80 (0.65, 0.98)
0.83 (0.70, 0.98)
0.95 (0.91, 0.99)
1.21 (0.95, 1.53)
1.23 (1.05, 1.44)
2.96 (1.41, 6.21)
1.94 (1.38, 2.73)
1.00 (0.42, 2.40)
1.92 (1.81, 2.04)
2.34 (1.91, 2.87)
2.50 (1.96, 3.19)
2.03 (1.76, 2.34)
1.60 (1.00, 2.56)
1.18 (0.82, 1.69)
1.58 (1.28, 1.95)
2.04 (1.39, 2.99)
1.50 (1.02, 2.21)
1.04 (1.02, 1.07)
0.67 (0.40, 1.12)
1.84 (1.04, 3.26)
1.01 (0.98, 1.03)
1.94 (1.25, 3.01)
1.31 (1.20, 1.43)
1.36 (1.19, 1.55)
1.87 (1.08, 3.24)
1.34 (1.18, 1.52)
1.56 (1.27, 1.92)
0.96 (0.41, 2.25)
1.83 (1.36, 2.46)
1.89 (1.35, 2.65)
0.97 (0.70, 1.34)
0.85 (0.72, 1.02)
0.93 (0.69, 1.26)
0.90 (0.61, 1.33)
0.74 (0.22, 2.52)
1.65 (0.93, 2.91)
0.83 (0.64, 1.08)
1.58 (1.05, 2.38)
1.12 (0.61, 2.06)
1.68 (1.38, 2.05)
2.01 (1.53, 2.64)
1.79 (1.74, 1.84)
2.70 (2.60, 2.80)
1.70 (1.20, 2.41)
0.26 (0.14, 0.48)
2.04 (1.98, 2.10)
1.53 (1.37, 1.71)
1.36 (1.26, 1.47)
0.72 (0.52, 1.00)
1.03 (0.82, 1.30)
1.25 (1.06, 1.47)
1.15 (0.95, 1.39)
1.10 (0.56, 2.14)
1.67 (1.43, 1.94)
1.00 (0.56, 1.78)
2.56 (1.35, 4.87)
1.11 (0.36, 3.41)
0.85 (0.53, 1.37)
1.01 (0.94, 1.09)
0.52 (0.31, 0.87)
0.91 (0.59, 1.40)
0.42 (0.37, 0.47)
1.37 (0.83, 2.26)
2.60 (1.61, 4.20)
1.40 (1.11, 1.77)
1.43 (1.26, 1.62)
1.67 (1.49, 1.87)
0.89 (0.64, 1.24)
1.68 (1.43, 1.97)
1.69 (1.47, 1.95)
3.70 (2.22, 6.17)
5.70 (5.50, 5.91)
1.73 (1.08, 2.77)
2.26 (1.96, 2.61)
0.83 (0.69, 0.99)
0.79 (0.64, 0.97)
1.47 (1.33, 1.62)
1.32 (0.67, 2.60)
5.40 (4.10, 7.11)
1.44 (1.25, 1.67)
1.54 (1.16, 2.04)
2.17 (1.52, 3.12)
1.84 (1.57, 2.16)
1.91 (1.66, 2.20)
1.12 (0.91, 1.39)
3.70 (1.60, 8.56)
2.29 (1.08, 4.86)
1.10 (0.93, 1.30)
2.30 (1.61, 3.29)
1.13 (0.84, 1.52)
1.55 (1.53, 1.57)
2.10 (1.41, 3.13)
5.41 (1.62, 18.07)
4.17 (1.67, 10.42)
1.84 (1.62, 2.09)
1.19 (0.71, 1.99)
0.95 (0.66, 1.38)
1.90 (1.40, 2.58)
1.03 (0.97, 1.09)
1.30 (0.70, 2.41)
2.01 (0.99, 4.08)
1.30 (1.10, 1.54)
1.01 (0.98, 1.05)
1.03 (0.84, 1.26)
2.80 (1.70, 4.61)
2.13 (2.04, 2.22)
1.17 (0.93, 1.47)
1.64 (1.30, 2.07)
1.25 (0.50, 3.12)
1.01 (0.89, 1.15)
1.30 (1.07, 1.58)
1.36 (1.14, 1.62)
1.82 (1.38, 2.40)
1.02 (1.00, 1.05)
0.90 (0.73, 1.11)
1.24 (1.08, 1.42)
1.91 (1.59, 2.29)
1.54 (1.28, 1.85)
1.43 (1.12, 1.82)
1.65 (1.28, 2.13)
1.77 (1.35, 2.32)
1.43 (0.72, 2.82)
1.19 (1.02, 1.39)
2.70 (1.35, 5.41)
1.28 (1.00, 1.64)
1.60 (1.05, 2.43)
2.86 (1.82, 4.49)
1.82 (1.41, 2.35)
1.92 (0.18, 20.15)
1.22 (0.75, 1.98)
1.79 (1.56, 2.05)
1.75 (1.55, 1.98)
1.45 (1.23, 1.71)
0.72 (0.52, 1.00)
1.00 (0.56, 1.80)
2.10 (0.80, 5.51)
0.83 (0.77, 0.90)
1.98 (1.56, 2.51)
1.52 (1.26, 1.83)
3.81 (2.90, 5.01)
2.42 (1.97, 2.96)
0.93 (0.43, 2.01)
1.60 (1.36, 1.88)
1.49 (1.23, 1.80)
1.30 (1.10, 1.54)
0.74 (0.26, 2.15)
1.40 (1.22, 1.61)
100.00
0.72
0.40
0.55
1.05
0.72
0.53
70.77
0.34
0.70
0.68
0.51
0.40
0.69
0.71
0.67
0.59
0.72
0.71
0.62
Weight
0.70
0.33
%
0.69
0.70
0.72
0.67
0.70
0.41
0.62
0.35
0.72
0.69
0.67
0.70
0.55
0.61
0.68
0.60
0.60
0.72
0.53
0.50
0.72
0.57
0.72
0.71
0.51
0.71
0.68
0.36
0.65
0.63
0.63
0.70
0.65
0.60
0.23
0.50
0.66
0.59
0.48
0.69
0.66
0.72
0.72
0.62
0.47
0.72
0.71
0.72
0.63
0.68
0.70
0.69
0.45
0.70
0.49
0.46
0.26
0.55
0.72
0.53
0.57
0.71
0.54
0.55
0.67
0.71
0.71
0.63
0.70
0.71
0.53
0.72
0.55
0.71
0.69
0.68
0.72
0.44
0.66
23.78
0.65
0.61
0.70
0.71
0.68
0.36
0.40
0.70
0.62
0.65
0.72
0.59
0.24
0.33
0.71
0.53
0.61
0.64
0.72
0.47
0.43
0.70
0.72
0.68
0.54
0.72
0.68
0.67
0.33
0.71
0.69
0.69
0.65
0.72
0.68
0.71
0.69
0.69
0.67
0.66
0.66
0.44
0.70
0.43
0.67
4.40
0.56
0.66
0.08
0.54
0.71
0.71
0.70
0.63
0.49
0.31
0.72
0.67
0.69
0.66
0.69
0.39
0.70
0.69
0.70
0.28
0.71
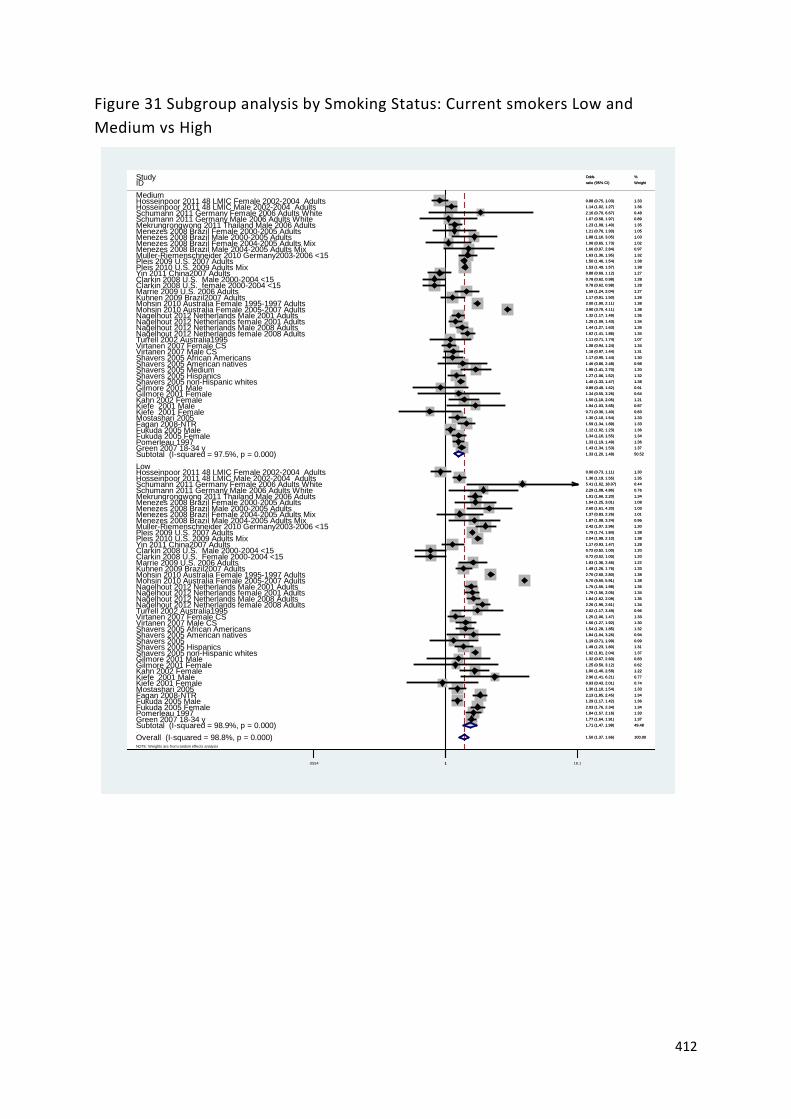
412
Figure 31 Subgroup analysis by Smoking Status: Current smokers Low and Medium vs High
NOTE: Weights are from random effects analysis
.
.
Overall (I-squared = 98.8%, p = 0.000)
Pleis 2010 U.S. 2009 Adults Mix
Kiefe 2001 Female
Pomerleau 1997
Shavers 2005 African Americans
Muller-Riemenschneider 2010 Germany2003-2006 <15
Menezes 2008 Brazil Female 2000-2005 Adults
Virtanen 2007 Female CS
Nagelhout 2012 Netherlands Male 2001 Adults
Pleis 2009 U.S. 2007 Adults
Fagan 2008-NTR
Shavers 2005 non-Hispanic whites
Medium
Hosseinpoor 2011 48 LMIC Female 2002-2004 Adults
Mekrungrongwong 2011 Thailand Male 2006 Adults
Mostashari 2005
Kuhnen 2009 Brazil2007 Adults
Nagelhout 2012 Netherlands female 2008 Adults
Shavers 2005 American natives
Nagelhout 2012 Netherlands Male 2008 Adults
Low
Fukuda 2005 Female
Schumann 2011 Germany Male 2006 Adults White
Yin 2011 China2007 Adults
Schumann 2011 Germany Female 2006 Adults White
Nagelhout 2012 Netherlands female 2001 Adults
Menezes 2008 Brazil Female 2000-2005 Adults
Kiefe 2001 Male
Green 2007 18-34 y
Menezes 2008 Brazil Female 2004-2005 Adults Mix
Pleis 2010 U.S. 2009 Adults Mix
Schumann 2011 Germany Male 2006 Adults White
Pomerleau 1997
Yin 2011 China2007 AdultsClarkin 2008 U.S. Male 2000-2004 <15Clarkin 2008 U.S. Female 2000-2004 <15
Subtotal (I-squared = 98.9%, p = 0.000)
Menezes 2008 Brazil Female 2004-2005 Adults Mix
Virtanen 2007 Male CSShavers 2005 African Americans
Kuhnen 2009 Brazil2007 Adults
Kahn 2002 Female
Menezes 2008 Brazil Male 2000-2005 Adults
Schumann 2011 Germany Female 2006 Adults White
Menezes 2008 Brazil Male 2000-2005 Adults
ID
Muller-Riemenschneider 2010 Germany2003-2006 <15
Shavers 2005 non-Hispanic whites
Clarkin 2008 U.S. Male 2000-2004 <15
Fukuda 2005 Male
Shavers 2005 American nativesShavers 2005 Medium
Hosseinpoor 2011 48 LMIC Female 2002-2004 Adults
Mostashari 2005
Hosseinpoor 2011 48 LMIC Male 2002-2004 Adults
Mekrungrongwong 2011 Thailand Male 2006 Adults
Mohsin 2010 Australia Female 2005-2007 Adults
Menezes 2008 Brazil Male 2004-2005 Adults Mix
Gilmore 2001 MaleGilmore 2001 Female
Pleis 2009 U.S. 2007 Adults
Nagelhout 2012 Netherlands Male 2001 Adults
Subtotal (I-squared = 97.5%, p = 0.000)Green 2007 18-34 y
Kiefe 2001 Female
Turrell 2002 Australia1995
Mohsin 2010 Australia Female 1995-1997 Adults
Turrell 2002 Australia1995
Fukuda 2005 MaleFagan 2008-NTR
Gilmore 2001 FemaleGilmore 2001 Male
Mohsin 2010 Australia Female 1995-1997 AdultsMohsin 2010 Australia Female 2005-2007 Adults
Menezes 2008 Brazil Male 2004-2005 Adults Mix
Nagelhout 2012 Netherlands Male 2008 Adults
Virtanen 2007 Male CS
Shavers 2005 Hispanics
Marrie 2009 U.S. 2006 Adults
Kiefe 2001 Male
Nagelhout 2012 Netherlands female 2008 Adults
Virtanen 2007 Female CS
Marrie 2009 U.S. 2006 Adults
Kahn 2002 Female
Shavers 2005
Nagelhout 2012 Netherlands female 2001 Adults
Shavers 2005 Hispanics
Hosseinpoor 2011 48 LMIC Male 2002-2004 Adults
Clarkin 2008 U.S. female 2000-2004 <15
Fukuda 2005 Female
Study
1.50 (1.37, 1.66)
1.53 (1.49, 1.57)
0.93 (0.43, 2.01)
1.33 (1.19, 1.49)
1.17 (0.95, 1.44)
1.63 (1.36, 1.95)
1.21 (0.76, 1.93)
1.25 (1.06, 1.47)
1.32 (1.17, 1.49)
1.79 (1.74, 1.84)
1.59 (1.34, 1.89)
1.92 (1.81, 2.04)
0.90 (0.73, 1.11)
1.23 (1.08, 1.40)
1.30 (1.10, 1.54)
1.49 (1.26, 1.76)
1.62 (1.41, 1.86)
1.84 (1.04, 3.26)
1.44 (1.27, 1.63)
2.03 (1.76, 2.34)
2.29 (1.08, 4.86)
0.88 (0.69, 1.12)
2.16 (0.70, 6.67)
1.79 (1.56, 2.05)
1.94 (1.25, 3.01)
2.96 (1.41, 6.21)
1.77 (1.64, 1.91)
1.06 (0.65, 1.73)
2.04 (1.98, 2.10)
1.07 (0.58, 1.97)
1.84 (1.57, 2.16)
1.17 (0.93, 1.47)0.72 (0.52, 1.00)0.72 (0.52, 1.00)
1.71 (1.47, 1.98)
1.37 (0.83, 2.26)
1.56 (1.27, 1.92)1.54 (1.28, 1.85)
1.17 (0.91, 1.50)
1.50 (1.10, 2.05)
2.60 (1.61, 4.20)
5.41 (1.62, 18.07)
1.88 (1.16, 3.05)
ratio (95% CI)
2.42 (1.97, 2.96)
1.40 (1.33, 1.47)
0.78 (0.62, 0.98)
1.12 (1.02, 1.23)
1.46 (0.86, 2.48)1.95 (1.41, 2.70)
0.88 (0.75, 1.03)
1.30 (1.10, 1.54)
1.36 (1.19, 1.55)
1.91 (1.66, 2.20)
5.70 (5.50, 5.91)
1.66 (0.97, 2.84)
0.89 (0.49, 1.62)1.34 (0.55, 3.26)
1.50 (1.46, 1.54)
1.75 (1.55, 1.98)
1.33 (1.20, 1.48)1.43 (1.34, 1.53)
0.71 (0.36, 1.40)
2.02 (1.17, 3.49)
2.70 (2.60, 2.80)
1.11 (0.71, 1.74)
1.29 (1.17, 1.42)2.13 (1.85, 2.45)
1.25 (0.50, 3.12)1.32 (0.67, 2.60)
2.00 (1.90, 2.11)3.90 (3.70, 4.11)
1.87 (1.08, 3.24)
1.84 (1.62, 2.09)
1.18 (0.97, 1.44)
1.27 (1.06, 1.52)
1.83 (1.36, 2.46)
1.94 (1.03, 3.65)
2.26 (1.96, 2.61)
1.08 (0.94, 1.24)
1.59 (1.24, 2.04)
1.90 (1.40, 2.58)
1.19 (0.71, 1.99)
1.25 (1.09, 1.43)
1.49 (1.23, 1.80)
1.14 (1.02, 1.27)
0.78 (0.62, 0.98)
1.34 (1.16, 1.55)
Odds
100.00
1.38
0.74
1.36
1.30
1.32
1.05
1.33
1.35
1.38
1.33
1.37
1.30
1.35
1.33
1.33
1.34
0.94
1.35
1.34
0.76
1.27
0.48
1.34
1.08
0.77
1.37
1.02
1.38
0.89
1.33
1.281.201.20
49.48
1.01
1.301.32
1.26
1.21
1.03
0.44
1.03
Weight
1.30
1.38
1.28
1.36
0.981.20
1.33
1.33
1.35
1.34
1.38
0.97
0.910.64
1.38
1.35
50.521.37
0.83
0.96
1.38
1.07
1.361.34
0.620.83
1.381.38
0.96
1.35
1.31
1.32
1.22
0.87
1.34
1.34
1.27
1.22
0.99
1.34
1.31
1.36
1.28
1.34
%
1.0554 1 18.1
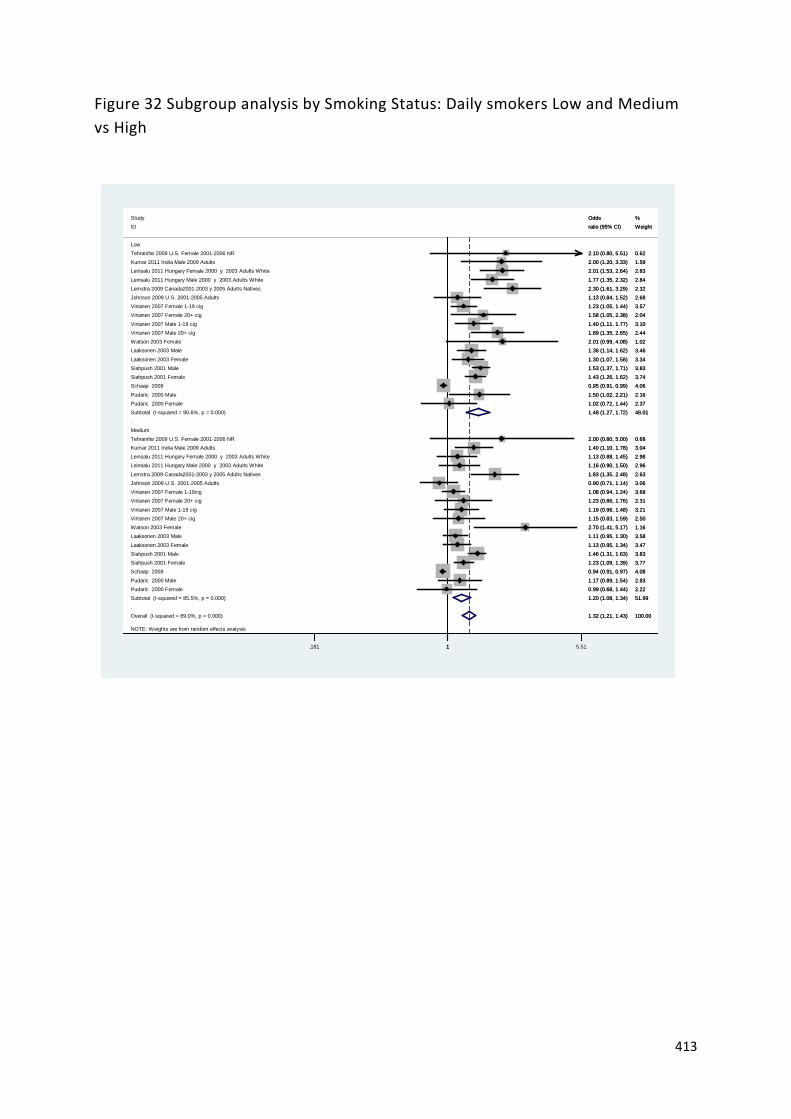
413
Figure 32 Subgroup analysis by Smoking Status: Daily smokers Low and Medium vs High
NOTE: Weights are from random effects analysis
.
.
Overall (I-squared = 89.0%, p = 0.000)
Virtanen 2007 Female 20+ cig
Siahpush 2001 Male
Johnson 2009 U.S. 2001-2005 Adults
Virtanen 2007 Male 20+ cig
Leinsalu 2011 Hungary Female 2000 y 2003 Adults White
Siahpush 2001 Male
Pudaric 2000 Female
Leinsalu 2011 Hungary Male 2000 y 2003 Adults White
Laaksonen 2003 Female
Virtanen 2007 Female 20+ cig
Siahpush 2001 Female
Laaksonen 2003 Male
Subtotal (I-squared = 85.5%, p = 0.000)
Virtanen 2007 Male 20+ cig
Lemstra 2009 Canada2001-2003 y 2005 Adults Natives
ID
Virtanen 2007 Female 1-19cig
Leinsalu 2011 Hungary Female 2000 y 2003 Adults White
Pudaric 2000 Male
Schaap 2008
Leinsalu 2011 Hungary Male 2000 y 2003 Adults White
Tehranifar 2009 U.S. Female 2001-2006 NR
Pudaric 2000 Male
Study
Tehranifar 2009 U.S. Female 2001-2006 NR
Watson 2003 Female
Siahpush 2001 Female
Lemstra 2009 Canada2001-2003 y 2005 Adults Natives
Subtotal (I-squared = 90.6%, p = 0.000)
Virtanen 2007 Male 1-19 cig
Johnson 2009 U.S. 2001-2005 Adults
Kumar 2011 India Male 2009 Adults
Virtanen 2007 Male 1-19 cig
Pudaric 2000 Female
Laaksonen 2003 Female
Laaksonen 2003 Male
Low
Kumar 2011 India Male 2009 Adults
Watson 2003 Female
Virtanen 2007 Female 1-19 cig
Medium
Schaap 2008
1.32 (1.21, 1.43)
1.23 (0.86, 1.76)
1.53 (1.37, 1.71)
0.90 (0.71, 1.14)
1.15 (0.83, 1.59)
2.01 (1.53, 2.64)
1.46 (1.31, 1.63)
0.99 (0.68, 1.44)
1.77 (1.35, 2.32)
1.13 (0.95, 1.34)
1.58 (1.05, 2.38)
1.23 (1.09, 1.39)
1.36 (1.14, 1.62)
1.20 (1.08, 1.34)
1.89 (1.35, 2.65)
1.83 (1.35, 2.48)
ratio (95% CI)
1.08 (0.94, 1.24)
1.13 (0.88, 1.45)
1.50 (1.02, 2.21)
0.95 (0.91, 0.99)
1.16 (0.90, 1.50)
2.00 (0.80, 5.00)
1.17 (0.89, 1.54)
Odds
2.10 (0.80, 5.51)
2.70 (1.41, 5.17)
1.43 (1.26, 1.62)
2.30 (1.61, 3.29)
1.48 (1.27, 1.72)
1.19 (0.96, 1.48)
1.13 (0.84, 1.52)
1.40 (1.10, 1.78)
1.40 (1.11, 1.77)
1.02 (0.72, 1.44)
1.30 (1.07, 1.58)
1.11 (0.95, 1.30)
2.00 (1.20, 3.33)
2.01 (0.99, 4.08)
1.23 (1.05, 1.44)
0.94 (0.91, 0.97)
100.00
2.31
3.83
3.06
2.50
2.83
3.83
2.22
2.84
3.47
2.04
3.77
3.46
51.99
2.44
2.63
Weight
3.68
2.98
2.16
4.06
2.96
0.68
2.83
%
0.62
1.16
3.74
2.32
48.01
3.21
2.68
3.04
3.10
2.37
3.34
3.58
1.59
1.02
3.57
4.08
1.181 1 5.51
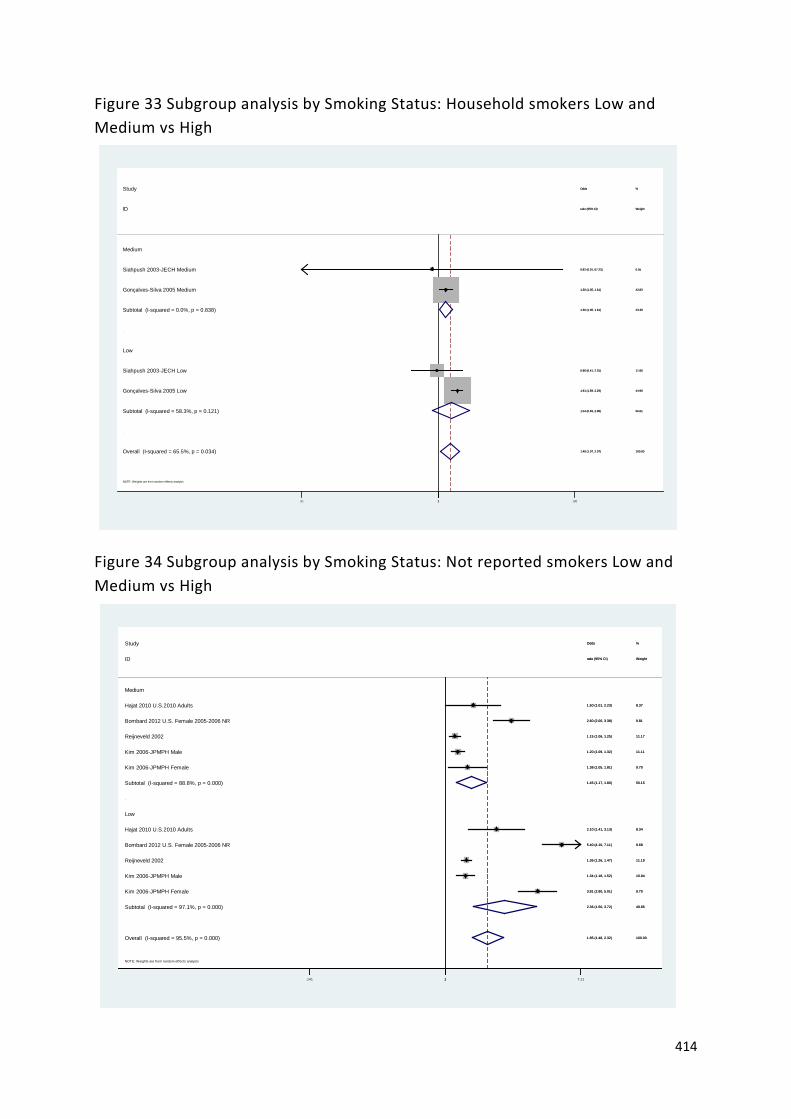
414
Figure 33 Subgroup analysis by Smoking Status: Household smokers Low and Medium vs High
Figure 34 Subgroup analysis by Smoking Status: Not reported smokers Low and Medium vs High
NOTE: Weights are from random effects analysis
.
.
Overall (I-squared = 65.5%, p = 0.034)
ID
Subtotal (I-squared = 0.0%, p = 0.838)
Gonçalves-Silva 2005 Low
Gonçalves-Silva 2005 Medium
Study
Subtotal (I-squared = 58.3%, p = 0.121)
Siahpush 2003-JECH Low
Siahpush 2003-JECH Medium
Low
Medium
1.49 (1.07, 2.07)
ratio (95% CI)
1.30 (1.05, 1.61)
1.91 (1.59, 2.29)
1.30 (1.05, 1.61)
Odds
1.54 (0.83, 2.88)
0.96 (0.41, 2.25)
0.82 (0.01, 67.23)
100.00
Weight
43.39
44.96
42.83
%
56.61
11.66
0.55
1.49 (1.07, 2.07)
ratio (95% CI)
1.30 (1.05, 1.61)
1.91 (1.59, 2.29)
1.30 (1.05, 1.61)
Odds
1.54 (0.83, 2.88)
0.96 (0.41, 2.25)
0.82 (0.01, 67.23)
100.00
Weight
43.39
44.96
42.83
%
56.61
11.66
0.55
1.01 1 100
NOTE: Weights are from random effects analysis
.
.
Overall (I-squared = 95.5%, p = 0.000)
Hajat 2010 U.S.2010 Adults
Reijneveld 2002
Kim 2006-JPMPH Female
Bombard 2012 U.S. Female 2005-2006 NR
Bombard 2012 U.S. Female 2005-2006 NR
ID
Kim 2006-JPMPH Male
Medium
Kim 2006-JPMPH Male
Subtotal (I-squared = 88.8%, p = 0.000)
Hajat 2010 U.S.2010 Adults
Subtotal (I-squared = 97.1%, p = 0.000)
Kim 2006-JPMPH Female
Study
Low
Reijneveld 2002
1.85 (1.48, 2.32)
2.10 (1.41, 3.13)
1.15 (1.06, 1.25)
3.81 (2.90, 5.01)
2.60 (2.00, 3.38)
5.40 (4.10, 7.11)
ratio (95% CI)
1.34 (1.18, 1.52)
1.20 (1.09, 1.32)
1.45 (1.17, 1.80)
1.50 (1.01, 2.23)
2.36 (1.50, 3.72)
1.38 (1.05, 1.81)
Odds
1.36 (1.26, 1.47)
100.00
8.34
11.17
9.70
9.81
9.68
Weight
10.94
11.11
50.15
8.37
49.85
9.70
%
11.19
1.141 1 7.11
Related Documents