Academy of Accounting and Financial Studies Journal Volume 22, Issue 2, 2018 1 1528-2635-22-2-188 SYNERGIZING DIGITAL-BASED TECHNOLOGY AND MANAGEMENT IN WATER BALANCE CALCULATION AS DECISION SUPPORT SYSTEM FOR RIVER BASIN MANAGEMENT-STUDY AT UPPER CITARUM WATERSHED IN BANDUNG GREATER AREA Ahmad Heryawan, Universitas Padjadjaran Ina Primiana, Universitas Padjadjaran Martha Fani Cahyandito, Universitas Padjadjaran Erie Febrianr, Universitas Padjadjaran ABSTRACT Most of the water needs for households and industries in Bandung Greater Area (including agriculture, plantation, fishery) is supplied by Upper Citarum Watershed. Water balance analysis is absolutely necessary to respond to water needs that continues to increase simultaneously and to avoid water scarcity as well. Water balance analysis is very important to help the government to organize and plan water allocation for the fulfillment of households and industry needs. The study is conducted in the Upper Citarum Watershed that crosses the City of Bandung, Regency of Bandung, Regency of West Bandung, Regency of Sumedang and City of Cimahi, in 2016. The combination of calculation by manual and with DSS-Ribasim method is applied to attain the water balance value. The results exhibits that the DSS-Ribasim calculation shows the Q 80 mainstay discharge which means that the water requirement for household, city and industry is fulfilled well. Nevertheless, the water requirement for drinking water company (PDAM) in Regency of West Bandung, is only fulfilled by 55.7%. Meanwhile, the result of manual calculation shows that there is no shortage of water supply in general, but there is a deficit for PDAM in Upper Citarum Watershed which influences water supply for the City of Bandung, Regency of Bandung, Regency of West Bandung and City of Cimahi. The synergy of these calculation is expected to give an important contribution for the governments in Bandung Greater Area to improve their public sector performance management in organizing water allocation and avoiding water scarcity. Keyword: Digital-Based Technology, Water Value, Water Balance, Upper Citarum Watershed, Bandung Greater Area. INTRODUCTION Water covers 70% earth’s surface, but fresh water that is necessary for human life and industrial use, is just 2.5% and two-thirds of that is in the form of glacier. This small amount of fresh water causes about 1.1 billion people worldwide lack access to water and 2.7 billion people find water scarce for at least one month of the year (WWF, 2017). According to JP Morgan (2008) and 2030 Water Resource Group (2009) research, there is water scarcity that have major impact on public and private sectors. The 2030 Group concludes that by 2030, assuming an

Welcome message from author
This document is posted to help you gain knowledge. Please leave a comment to let me know what you think about it! Share it to your friends and learn new things together.
Transcript
Academy of Accounting and Financial Studies Journal Volume 22, Issue 2, 2018
1 1528-2635-22-2-188
SYNERGIZING DIGITAL-BASED TECHNOLOGY AND
MANAGEMENT IN WATER BALANCE CALCULATION
AS DECISION SUPPORT SYSTEM FOR RIVER BASIN
MANAGEMENT-STUDY AT UPPER CITARUM
WATERSHED IN BANDUNG GREATER AREA
Ahmad Heryawan, Universitas Padjadjaran
Ina Primiana, Universitas Padjadjaran
Martha Fani Cahyandito, Universitas Padjadjaran
Erie Febrianr, Universitas Padjadjaran
ABSTRACT
Most of the water needs for households and industries in Bandung Greater Area
(including agriculture, plantation, fishery) is supplied by Upper Citarum Watershed. Water
balance analysis is absolutely necessary to respond to water needs that continues to increase
simultaneously and to avoid water scarcity as well. Water balance analysis is very important to
help the government to organize and plan water allocation for the fulfillment of households and
industry needs. The study is conducted in the Upper Citarum Watershed that crosses the City of
Bandung, Regency of Bandung, Regency of West Bandung, Regency of Sumedang and City of
Cimahi, in 2016. The combination of calculation by manual and with DSS-Ribasim method is
applied to attain the water balance value. The results exhibits that the DSS-Ribasim calculation
shows the Q80 mainstay discharge which means that the water requirement for household, city
and industry is fulfilled well. Nevertheless, the water requirement for drinking water company
(PDAM) in Regency of West Bandung, is only fulfilled by 55.7%. Meanwhile, the result of
manual calculation shows that there is no shortage of water supply in general, but there is a
deficit for PDAM in Upper Citarum Watershed which influences water supply for the City of
Bandung, Regency of Bandung, Regency of West Bandung and City of Cimahi. The synergy of
these calculation is expected to give an important contribution for the governments in Bandung
Greater Area to improve their public sector performance management in organizing water
allocation and avoiding water scarcity.
Keyword: Digital-Based Technology, Water Value, Water Balance, Upper Citarum Watershed,
Bandung Greater Area.
INTRODUCTION
Water covers 70% earth’s surface, but fresh water that is necessary for human life and
industrial use, is just 2.5% and two-thirds of that is in the form of glacier. This small amount of
fresh water causes about 1.1 billion people worldwide lack access to water and 2.7 billion people
find water scarce for at least one month of the year (WWF, 2017). According to JP Morgan
(2008) and 2030 Water Resource Group (2009) research, there is water scarcity that have major
impact on public and private sectors. The 2030 Group concludes that by 2030, assuming an
Academy of Accounting and Financial Studies Journal Volume 22, Issue 2, 2018
2 1528-2635-22-2-188
average annual growth of 2%, if no efficiency gains are realized, there will be 2.800 billion m3
water shortage that affect domestic, industrial and agriculture needs.
As the population and industry grow, the demand of water continues to increase. Cities
cannot be sustainable without ensuring reliable access to safe drinking water and adequate
sanitation. World Water Assessment Programme (2009) mentions that almost all major cities in
the world face the crisis of water in 2010. Yamashita (2012) states that the increase of water
demand for industrial and domestic needs in Tokyo caused the government developed
waterworks from surface water in remote areas. Nevertheless, according to Alimah and Putro
(2014), the use of Citarum Watershed is dominated by households.
Upper Citarum Watershed which is part of Citarum watershed, covers Bandung city,
Bandung Regency, West Bandung Regency, Sumedang Regency and Cimahi city where these
areas are dominated by residential, agricultural and industrial areas. In this study, these areas
called Bandung Greater Area. Bandung Greater Area community are highly depending on upper
Citarum watershed and most of the water necessity is supplied from Citarum Watershed.
Unfortunately, there has never been any research on water balance that calculate how much
water supplied by Citarum Watershed to fulfil domestic, industrial and agriculture demand in
Bandung Greater Area.
Therefore, in order to maintain the sustainability of water fulfillment for domestic,
industrial and agriculture needs, this study is needed to calculate the need and availability. The
result of this study can support government policy in terms of planning and managing water
allocation for community needs in Bandung Greater Area. The water balance analysis can be
used as a basis analysis to develop policy for Citarum Watershed to prevent water scarcity
problem and the fulfillment of water supply for Bandung Greater Area.
LITERATURE REVIEW
Water Scarcity
Physical Water Scarcity
Water scarcity refers to the volumetric abundance or lack thereof, of water supply. This is
typically calculated as a ratio of human water consumption to available water supply in a given
area. Water scarcity is a physical, objective reality that can be measured consistently across
regions and over time (Schulte, 2014). Water scarcity involves water shortage, water stress or
deficits and water crisis. The relatively new concept of water stress is difficulty in obtaining
sources of fresh water for use during a period of time; it may result in further depletion and
deterioration of available water resources. Water shortages may be caused by climate change,
such as altered weather-patterns (including droughts or floods), increased pollution and increased
human demand and overuse of water (WWF, 2013). The term water crisis labels a situation
where the available potable, unpolluted water within a region is less than that region's demand
(Hinrichsen, 2008). Two converging phenomena drive water scarcity: Growing freshwater use
and depletion of usable freshwater resources (Chance, 2011).
Water scarcity can be resulted by two mechanisms: (1) Physical (absolute) water scarcity
and (2) Economic water scarcity. Physical water scarcity results from inadequate natural water
resources to supply a region's demand and economic water scarcity results from poor
management of the sufficient available water resources. According to the United Nations
Development Programme, the latter is found more often to be the cause of countries or regions

Academy of Accounting and Financial Studies Journal Volume 22, Issue 2, 2018
3 1528-2635-22-2-188
experiencing water scarcity, as most countries or regions have enough water to meet household,
industrial, agricultural and environmental needs, but lack the means to provide it in an accessible
manner.
Economic Water Scarcity
Many countries and governments aim to reduce water scarcity. The UN recognizes the
importance of reducing the number of people without sustainable access to clean water and
sanitation. The Millennium Development Goals within the United Nations Millennium
Declaration aimed by 2015 to "halve the proportion of people who are unable to reach or to
afford safe drinking water". Around one fifth of the world's population currently live in regions
affected by physical water scarcity, where there is inadequate water resources to meet a country's
or regional demand, including the water needed to fulfil the demand of ecosystems to function
effectively. Arid regions frequently suffer from physical water scarcity. It also occurs where
water seems abundant but where resources are over-committed, such as when there is over
development of hydraulic infrastructure for irrigation. Symptoms of physical water scarcity
include environmental degradation and declining groundwater as well as other forms of
exploitation or overuse.
Economic water scarcity is caused by a lack of investment in infrastructure or technology
to draw water from rivers, aquifers or other water sources or insufficient human capacity to
satisfy the demand for water. One quarter of the world's population is affected by economic
water scarcity. Economic water scarcity includes a lack of infrastructure, causing the people
without reliable access to water to have to travel long distances to fetch water, that is often
contaminated from rivers for domestic and agricultural uses.
Water Balance
Water balance will explain about the relation between inflow and outflow of water in
certain area for a given period of water circulation. Water balance is the difference between the
amount of water available (on the surface) and the water needed in a given period of time. Water
balance can also refer to the ways in which an organism maintains water in dry or hot conditions.
It is often discussed in reference to plants or arthropods, which have a variety of water retention
mechanisms, including a lipid waxy coating that has limited permeability. This water
requirement can be considered as DMI requirement (domestic, municipal and industrial). The
simplest from of water balance equation is as follows:
P=Q+E+/-∆S (1)
P: Precipitation
Q: Runoff
E: Evaporation
∆S: The storage in the soil, aquifers or reservoirs
In water balance analysis, it is often useful to divide water flows into ‘green’ and ‘blue’
water. ‘Blue’ water is the surface and groundwater that is available for irrigation urban and
industrial use and environmental flows. ‘Green’ water is water that has been stored in the soil
Academy of Accounting and Financial Studies Journal Volume 22, Issue 2, 2018
4 1528-2635-22-2-188
and that evaporates into the atmosphere. The source of ‘green’ water is rainfall or ‘blue’ water
has been used for irrigation.
Water balance analysis can be used to: (1) Assess the current status and trends in water
resource availability in an area over a specific period of time and (2) Strengthen water
management decision-making, by assessing and improving the validity of visions, scenarios and
strategies. Water balance estimates are often presented as being precise. In fact, there is always
uncertainly, arising from inadequate data capture networks, measurement errors and the complex
spatial and temporal heterogeneity that characterises hydrological processes. Consequently,
uncertainty analysis is an important part of water balance estimation as is quality control of
information before used.
When the data sources are imprecise, it is often possible to omit components that do not
affect changes. For example, it is possible to omit storage from an annual water balance if year-
on-year storage changes (such as reservoirs) are negligible. Some common problems that occur
when water balance estimations are made include:
1. Temporal and spatial boundaries are not defined;
2. The quality of input data is poor;
3. Double counting of water flows when water flows within an area added to water flow exiting area;
4. Inappropriate extrapolation of field level information to a larger scale. Many hydrological relationships are
scale dependent (e.g. runoff as a proportion of rainfall is almost always higher at smaller spatial and temporal
scales);
5. Intuition (often based on popular myths) is used rather than good quality information;
6. The storage term(s) of the water balance is omitted;
7. Political or other pressures result in unreliable estimates that have been manipulated.
METHODOLOGY
Time and Location of Research
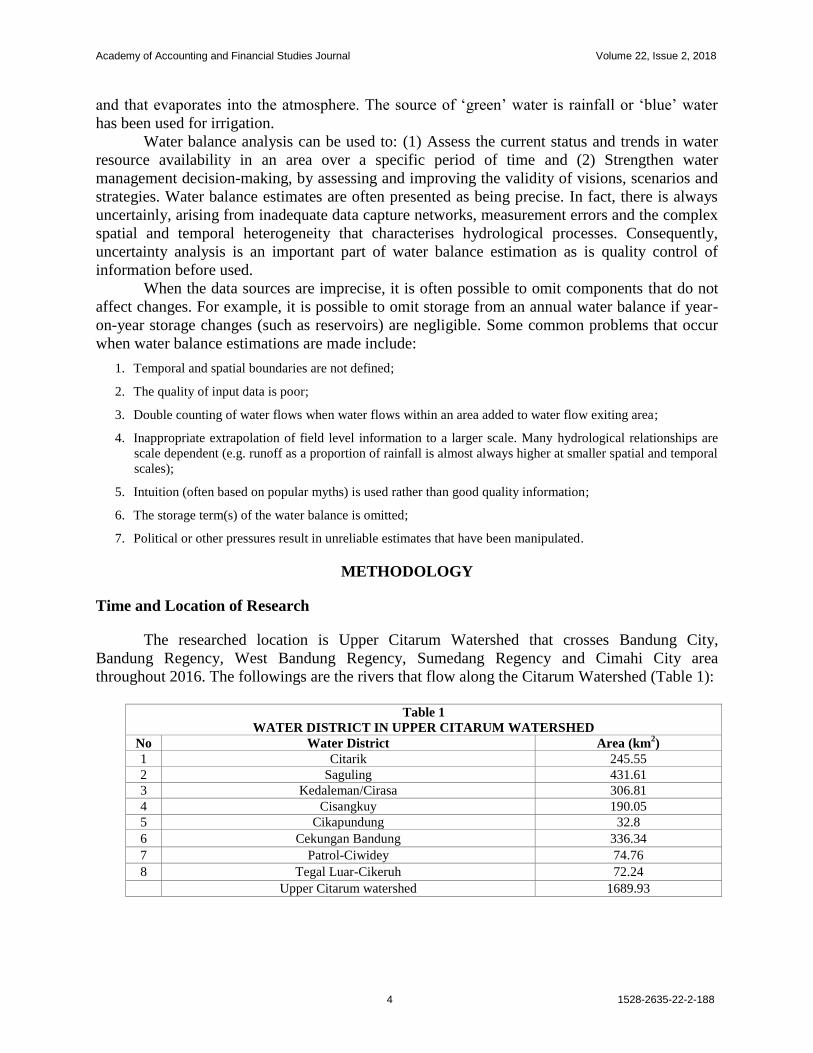
The researched location is Upper Citarum Watershed that crosses Bandung City,
Bandung Regency, West Bandung Regency, Sumedang Regency and Cimahi City area
throughout 2016. The followings are the rivers that flow along the Citarum Watershed (Table 1):
Table 1
WATER DISTRICT IN UPPER CITARUM WATERSHED
No Water District Area (km2)
1 Citarik 245.55
2 Saguling 431.61
3 Kedaleman/Cirasa 306.81
4 Cisangkuy 190.05
5 Cikapundung 32.8
6 Cekungan Bandung 336.34
7 Patrol-Ciwidey 74.76
8 Tegal Luar-Cikeruh 72.24
Upper Citarum watershed 1689.93

Academy of Accounting and Financial Studies Journal Volume 22, Issue 2, 2018
5 1528-2635-22-2-188
Source and Technique of Data Collection
Data collection techniques in this study is related to the tools or instruments to obtain
data. Data are collected based facts according to the type of data used. The primary data are
collected by performing interview and field observation while the secondary data are collected
by analysing various sources, especially data from Balai Besar Wilayah Sungai (BBWS) Citarum
(Figure 1).
FIGURE 1
RESEARCHED LOCATION (JICA, 2010)
Water Allocation Simulation
The water allocation simulation model can answer the question that often arise in the
development of water resources such as:
1. Alternative and potential evaluation of water resource development:
a. How to develop water supply and irrigation networks without causing water shortage and harm other
water users in an area with fluctuation water availability like Citarum watershed.
b. Conflict of interest possibility between water users (for irrigation, hydropower plant, raw water and
others) that may happen in the future.
c. Comparison of hydropower plant and water discharge potential with or without reservoir.
2. Waterworks development and management assessment:
a. Determining reservoir development effectiveness to fulfill water needs in various sectors;
b. Determining the reservoir dimension that meet water demand.
This simulation model should be able to calculate and simulate the unique and important
characteristics of Citarum Watershed, especially the availability of water, water requirements,

Academy of Accounting and Financial Studies Journal Volume 22, Issue 2, 2018
6 1528-2635-22-2-188
the operation of the water system and the alternative solution and also provide easy data entry
and well-presented output with alternative solutions that are easily evaluated. In this simulation,
there are two important things, they are the condition of the water system stated in the water
system scheme and planned alternative water resources development.
Water System Scheme
This scheme is developed to give the picture about hydrological water system, complete
with water structures and its carrier. The water system scheme consists of nodes represent water
resource, water requirement and infrastructure and branches represent river, canal, tunnel or pipe.
The nodes consist of three types, which are:
1. Ordinary node as an element in the water system that does not control the water flow. These nodes can be
either an inflow node, terminal node, confluence node, run-of-river node, dummy node or district drainage
node.
2. Activity node as water requirement node can be either public water supply node, low flow node, irrigation
node, fishpond node, district extraction node or loss flow node.
3. Control node as irrigation structure that control water system, can be either a reservoir or dam.
Water District
To illustrate the scheme properly, delineation is conducted for watershed and water
districts. Water district is the smallest natural area that bounded by water infrastructure in river
or natural boundary such as stream, which is then used to illustrate the area of the scheme for this
study. This water district represents:
1. The smallest hydrological unit that covers water demand and supply
2. Have the same capabilities with watershed to response rain and flow
3. A complementary unit in managing and balancing water resource
The division of water district size is based on the detail of the region that needed to be
analyzed and the location of water infrastructure and water supply on the river. Each water
district has certain characteristic which can generally classified into three parts: (1) Upper water
district; (2) middle water district; (3) lower water district. Upper water district acts as water
catchment area and water reservoir and needs to be protected. As inflow node, the analysis also
considering rain run-off relationship. The middle water district area is more complex because it
is the production and utilization area, characterized by the existence of agriculture, raw water
production and so on. The lower water district area is the utilization, disposal, irrigation,
fishpond and urban areas that have water allocation issues, estuary coastal management and
seawater intrusion.
Water Balance Calculation
The water balance calculation and analysis of the Upper Citarum Watershed are done
with digital-based technology and management, which are: (1) DSS-Ribasim by provide
complex data inputs from water availability and demand fluctuation in each water system
location and (2) Calculating the amount of water discharge inflow and outflow on each river or
Academy of Accounting and Financial Studies Journal Volume 22, Issue 2, 2018
7 1528-2635-22-2-188
channel in the scheme with Microsoft Excel using average data as input. The manual calculation
result will then enrich the result from DSS-Ribasim and give different perspective.
DSS-Ribasim
Decision making on water management policy at the national, river basin or polder level
is a complex matter. A policy maker or river basin authority may want to reduce flood risk or
improve water quality. The decision on what to do is ultimatedly political, but in order to make
well founded decisions, information on the water system is required. The decision makers may
not be water managers or many different disciplines are required or they may want to involve
other stakeholders. In all these cases information needs to be shared and needs to be processed in
such as way that the information facilitates the decision making process. A tool that makes this
possible is a Decision Support System or DSS (TU Delft).
Decision Support System River Basin Simulation (DSS-Ribasim) is a decision support
system on water resource management. DSS-Ribasim is a generic model to simulate water
districts behavior under various hydrological conditions, water demands and existing water
infrastructures (Giupponi, 2011). This tool is a comprehensive, integrated and flexible simulator
that connects the hydrological input from certain location and various water activities. This
model was inspired by the MITSIM in United States and developed by Delft University of
Technology in Netherland since 1985. This model has been used in more than 20 countries in the
world. This study used various hydrological conditions such as wet, normal and dry conditions
throughout the year to calculate and analyze water balance and impact of the strategy to improve
water availability.
Manual Calculation
The results of the water balance calculation are shown separately and sequentially from
Upper Citarum to Lower Citarum river followed by its streams. Manual calculation used average
water discharge Q80 and Q95 inflow and outflow on each river or channel in the scheme. The
amout of water discharge are calculated with Microsoft Excel.
RESULTS
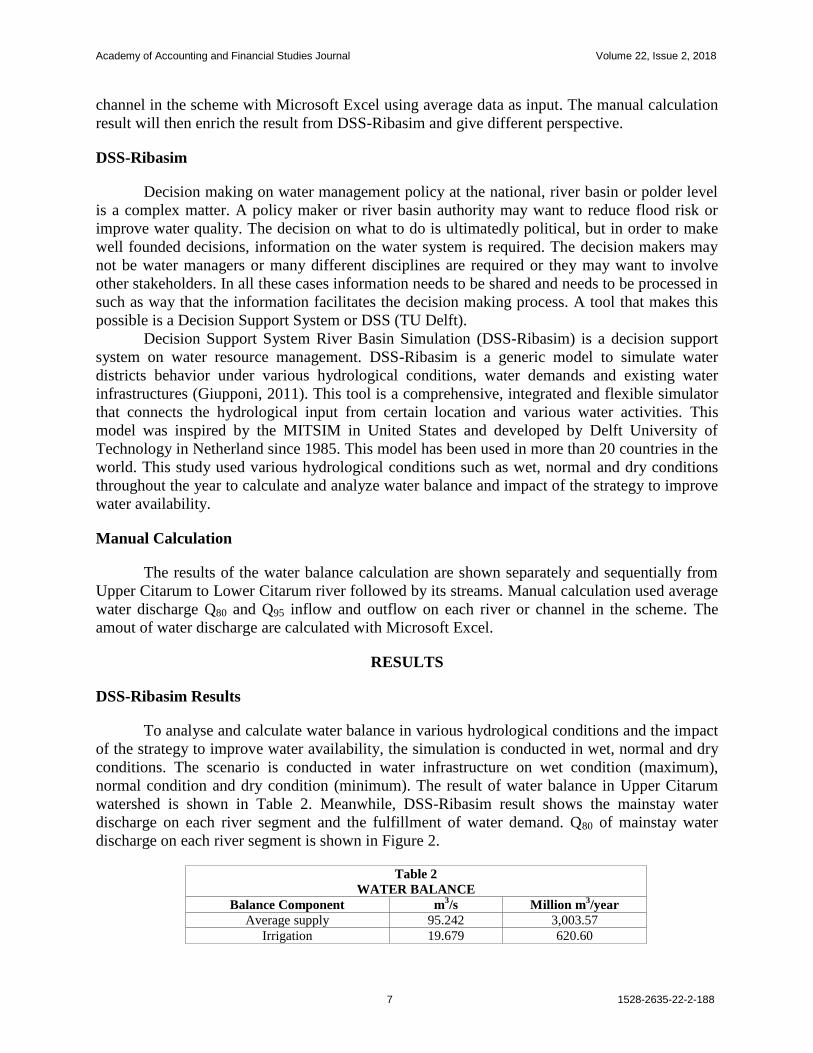
DSS-Ribasim Results
To analyse and calculate water balance in various hydrological conditions and the impact
of the strategy to improve water availability, the simulation is conducted in wet, normal and dry
conditions. The scenario is conducted in water infrastructure on wet condition (maximum),
normal condition and dry condition (minimum). The result of water balance in Upper Citarum
watershed is shown in Table 2. Meanwhile, DSS-Ribasim result shows the mainstay water
discharge on each river segment and the fulfillment of water demand. Q80 of mainstay water
discharge on each river segment is shown in Figure 2.
Table 2
WATER BALANCE
Balance Component m3/s Million m
3/year
Average supply 95.242 3,003.57
Irrigation 19.679 620.60

Academy of Accounting and Financial Studies Journal Volume 22, Issue 2, 2018
8 1528-2635-22-2-188
Table 2
WATER BALANCE
Domestic, municipal, industrial 2.935 92.26
River treatment 10.98 346.26
Remainder (surplus) 61.649 1,944.16
In general, the water balance shows surplus in rainy season (October-May) with about
65%, but there is deficit of water supply in dry season (June-September) and the river treatment
is difficult to realize. PDAM Bandung (municipal water treatment) relies on Cisangkuy river and
experiences water shortage, so it is necessary to get supply from Cilaki river and Cibatarua river.
DSS-Ribasim using Q80 mainstay water discharge results show the fulfillment percentage of
domestic, municipal and industrial (DMI) demand as follows.
FIGURE 2
AVERAGE WATER DISCHARGE IN UPPER CITARUM WATERSHED (BP DAS
CITARUM-CILIWUNG, 2009)
Table 3
FULFILLMENT OF WATER DEMAND FOR DMI
No. Water Demand Demand (m3/s) Deficit (m
3/s)
Fulfillment (%)
Volume(m3) Time (s)
1 PDAM Bandung city 4 m3/s 4.005 0.000 100 100
2 PDAM Bandung city 1.6 m3/s 1.602 0.802 50 50
3 PDAM Bandung city 0.1 m3/s 0.100 0.000 100 100
4 PDAM Bandung Regency 3.5 m3/s 3.505 2.061 41 33
5 PDAM Bandung Regency 0.5 m3/s 0.501 0.000 100 100
6 PDAM Bandung Regency 0.2 m3/s 0.200 0.000 100 100
7 PDAM Cimahi city 0.4 m3/s 0.401 0.038 91 33
8 PDAM West Bandung Regency 0.3 m3/s 0.300 0.133 56 0
9 Industry 16 m3/s 16.022 0.000 100 100
10 PT Panafil (Industry) 70 l/s 0.070 0.000 100 100

Academy of Accounting and Financial Studies Journal Volume 22, Issue 2, 2018
9 1528-2635-22-2-188
Table 3
FULFILLMENT OF WATER DEMAND FOR DMI
11 Banjaran Pameungpeuk (Industry) 106 l/s 0.106 0.000 100 100
12 Saguling 4 m3/s 4.005 0.000 100 100
Total 31.718 3.034 90.4 81.1
The Table 3 shows that in general all DMI water demand can be fulfilled except for
PDAM West Bandung Regency which only 56% fulfilled because of the limited water discharge
from Cimeta river as main source. It is necessary to get additional supply from Cimahi river.
PDAM Bandung city also experienced a considerable water shortage, but it can be solved by
constructing Sentosa water reservoir and inter basin transfer from Cilaki and Cibatarua river. The
result of water demand fulfillment for irrigation area is shown in Table 4. This table shows that
in general most of irrigation area water demand is fulfilled except in Sudiplak, Malang and
Lagadar and Mandalasari irrigation area. It should be considered that some of these irrigation
area lands have been transformed into settlements area.
Table 4
FULFILLMENT OF WATER DEMAND FOR IRRIGATION AREA
No. Water Demand Demand (m3/s) Deficit (m
3/s)
Fulfillment (%)
Volume (m3) Time (s)
1 Ciherang 2,460 ha 2,93 0 100 100
2 Wanir 2,098 ha 2.42 0.72 70.4 50
3 Wangisagara 1,697 ha 1.96 0.92 53.2 16.7
4 Cirasea 3,052 ha 3.52 0.89 74.6 50
5 Ciyasana 1,189 ha 1.37 1.06 22.4 0
6 Lembang 191 ha 0.22 0.08 63.2 50
7 Cikareumbi 63 ha 0.07 0.03 63 50
8 Ciregol 115 ha 0.13 0.05 63.2 50
9 Sukasari 232 ha 0.27 0.27 0 0
10 Panyocokan 476 ha 0.55 0.09 83.9 75
11 Depok 580 ha 0.67 0.67 0 0
12 Panundaan 232 ha 0.27 0.04 83.9 75
13 Leuwikuya 2,573 ha 2.96 1.28 56.7 16.7
14 Soreang 1,120 ha 1.29 0.61 52.9 16.7
15 BBkan Jampang 449 ha 0.52 0.08 83.9 75
16 Rancabuaya 763 ha 0.88 0.14 84 75
17 Kiangroke 63 ha 0.07 0.00 100 100
18 Cibatubeureum 70 ha 0.08 0.00 100 100
19 Panyadap 1,079 ha 1.24 0.70 43.6 8.3
20 Rancakasumba 430 ha 0.50 0.10 80.6 66.7
21 Cangkuang 403 ha 0.46 0.15 67.5 50
22 Cicalengka 267 ha 0.31 0.11 63.3 50
23 Mandalasari 1.159 ha 1.34 1.34 0 0
24 Muncang 152 ha 0.18 0.18 0 0
25 Kujangsari 147 ha 0.17 0.17 0 0
26 Cibeunying Ciateul 149 ha 0.17 0.17 0 0
27 Cijanggel 391 ha 0.45 0.02 95.6 75
28 Bongkok 170 ha 0.20 0.00 98.5 83.3
29 Malang dan Lagadar 750 ha 0.86 0.68 21.1 8.3
30 Nanjung 360 ha 0.42 0.27 35.4 0
31 Sudiplak 210 ha 0.24 0.19 21.1 0
32 Sukapura dan Buahbatu 287 ha 0.33 0.33 0 0
33 Ranjeng 150 ha 0.17 0.15 11 8.3

Academy of Accounting and Financial Studies Journal Volume 22, Issue 2, 2018
10 1528-2635-22-2-188
Table 4
FULFILLMENT OF WATER DEMAND FOR IRRIGATION AREA
34 Rancalili 398 ha 0.46 0.41 10.9 8.3
35 Cikalong 145 ha 0.17 0.00 100 100
Total 27.73 11.89 57.1 38.8
Manual Calculation Results
The results of the water balance calculation using Microsoft Excel are shown separately
and sequentially from Upper Citarum to Lower Citarum river followed by its streams.
Cisarea River
Cirasea river has Q80 with 2.25 m3/s and Q95 with 1.58 m
3/s, it has 2 streams orde 3 which
are Cikoneng and Cigarugag rivers with respectively Q80 with 1.90 m3/s and 0.89 m
3/s and Q95
with 1.32 m3/s and 0.68 m
3/s. It supplies water for Cirasea irrigation area and PDAM Bandung
Regency. There is also Cibodas water reservoir that has the capacity of 317.96 m3. Figure 3
shows the example of manual calculation result for Cisarea river.
FIGURE 3
CISAREA RIVER SCHEME (BP DAS CITARUM-CILIWUNG, 2009)
Citarik River
Citarik river has Q80 with 2.25 m3/s and Q95 with 1.58 m
3/s, it has 3 streams orde 3 which
are Cimulu, Cikaloge and Cimanggung rivers that supply water for Cangkuang, Cicalengka,
Mandalasari, Ciyasana and Panyadap irrigation area and PDAM Bandung Regency. There is also
one reservoir namely Citarik reservoir.

Academy of Accounting and Financial Studies Journal Volume 22, Issue 2, 2018
11 1528-2635-22-2-188
Cikeruh River
Cikeruh river has Q80 with 0.54 m3/s and Q95 with 0.39 m
3/s, it has 5 streams orde 3
which are Cibanjaran, Cinambo, Cipariuk, Cibeusi and Cisaranten rivers that supply water for
Sukasari, Muncang and Depok irrigation area and PDAM Bandung Regency.
Cipamokolan, Cidurian and Cicadas River
Cipamokolan river has Q80 with 0.85 m3/s and Q95 with 0.63 m
3/s, Cidurian river has Q80
with 2.16 m3/s and Q95 with 1.6 m
3/s and Cicadas river has Q80 with 1.24 m
3/s and Q95 with 0.93
m3/s that supply water for Ranjeng, Rancacili, Buahbatu and Kujangsari irrigation area.
Cikapundung River
Cikapundung river has Q80 with 2.25 m3/s and Q95 with 1.95 m
3/s, it has 2 streams orde 3
which are Cikapundung Kolot and Kali Gemuruh rivers that supply water for Cikareumbi,
Lembang and Ciregol irrigation area, PLTA Tirtawening and PDAM Bandung city. There is also
one reservoir namely Cikapundung reservoir.
Cisangkuy River
Cisangkuy river has Q80 with 6.36 m3/s and Q95 with 4.06 m
3/s, it has 8 streams orde 3
which are Cinyiruan, Cisarua, Cikalong, Cilaki, Cigeureuh and Citalugtug rivers that supply
water for Cikalong, COS Gantung, Cilaki, Cibatu Bereum, Cimedal, Ciherang, Kiangroke
irrigation area, PLTA Plengan, PLTA Cikalong, PLTA Lamajan, PDAM Bandung Regency and
PDAM Bandung city. There is also two reservoir namely Sentosa and Cibintinu reservoir.
Cigondewah and Cibolerang River
Cigondewah river has Q80 with 3.79 m3/s and Q95 with 2.99 m
3/s and Cibolerang river has
Q80 with 0.47 m3/s and Q95 with 0.4 m
3/s that supply water for Soreang irrigation area while
Cibintinu river work as outlet for that irrigation area.
Ciwidey River
Ciwidey river has Q80 with 3.61 m3/s and Q95 with 3.01 m
3/s, it has 3 streams orde 3
which are Ciinjuk, Cikawung and Cibodas rivers that supply water for Babakan Jampang,
Rancabuaya, Panundaan, Leuwikuya and Soreang irrigation area and PDAM Bandung Regency.
There is also one reservoir namely Ciwidey reservoir.
Cibeureum River
Cibeureum river has Q80 with 0.29 m3/s and Q95 with 0.27 m
3/s that supply water for
Nanjung and Sudiplak irrigation area while Citarum river work as outlet for that irrigation area.

Academy of Accounting and Financial Studies Journal Volume 22, Issue 2, 2018
12 1528-2635-22-2-188
Cimahi River
Cimahi river has Q80 with 0.52 m3/s and Q95 with 0.49 m
3/s, it has 1 streams orde 3 which
is Cimeta river that supply water for Cijanggel, Bongkok, Malang and Lagadar irrigation area
and PDAM West Bandung Regency. There is also two reservoir namely Sukawana and Cimeta
reservoir.
DISCUSSION
Citarum Watershed is the biggest watershed in West Java and plays an important role in
supplying water for West Java and Jakarta. Citarum has 269 km length and area of 6.614 km2 or
about 22% of West Java area. Citarum watershed is divided into three parts which are Upper
Citarum watershed, Middle Citarum watershed and Lower Citarum watershed (BBWS Citarum,
2010). The rainfall intensity in Upper Citarum watershed is strongly influenced by the
topography. The annual rainfall varies from 1,966 to 2,600 mm. The rainy season start from
November to April and the rainfall intensity can reach 300 mm. Based on Schmidt-Fergusson’s
Climate Classification, Citarum watershed climate classification is C and Am (tropical monsoon)
according to Köppen Climate Classification System and B2 according to Olderman
Classification (BPDAS, 2009). The benefits of the Upper Citarum watershed for society and
industry are:
Support Water Security
Communities and industries use water from Citarum for daily use and agricultural such as
paddy fields, vegetables and so on. The industries use water in production and cooling process.
There are 484 industries and 75% of them are textile industry that require a lot of water.
Support Energy Security
Citarum watershed is the source of three largest reservoirs in West Java which are
Saguling reservoir with volume of 982 million m3, Cirata reservoir volume of with 2,165 million
m3 and Jatiluhur with volume of 3,000 million m
3. Those reservoirs and the other reservoirs
produce 1,400 MW for PLTA (hydropower plant) which supplies electricity for Java and Bali
(Fulazzaky, 2014).
Support Food Security
Water from Citarum watershed is utilized to support food security by irrigating
agricultural area (especially around Pantura) through irrigation canal with total about 300,000
hectares. Citarum watershed also a source of raw water with 5,5 billion m3/year for large cities
such as Bandung and Jakarta and other area around Citarum watershed (Parikesit et al., 2005).
Agricultural, Technical and Vocational Education
Water from Citarum watershed is not only essential for agriculture, but also can be used
as a media to educate people on technical and vocational activities. At the end, this will have an
impact on poverty alleviation and rural development, which finally resulted on sustainable
economic development (Chamel & Hartl, 2011; MoFED, 2006).
Academy of Accounting and Financial Studies Journal Volume 22, Issue 2, 2018
13 1528-2635-22-2-188
As an addition, technological advancements which are implemented in the Citarum
watershed can spur economic development in West Java industry and agriculture. The
technological progress can cause the lowering of the cost of production. Moreover, by improving
the efficiency with which existing products are produced, new technologies can open up the
possibility of increasing output and, assuming that markets are available, taking advantage of
previously unexploited increasing returns to scale (The World Bank, 2008).
Upper Citarum Watershed has 26,022 ha critical area which encounter degradation of
water resources conservation function. The other issues happened in Upper Citarum watershed is
floods caused by:
1. Forest conversion that remove natural forest to meet other land needs, such as plantations and agriculture.
2. Unplanned development of settlements area on forestland.
3. Uncontrolled cropping pattern.
4. Groundwater exploitation that also caused land subsidence.
5. Water pollution from domestic, industrial and agriculture waste.
6. Erosion in Upper Citarum watershed that increase sedimentation in middle and lower area.
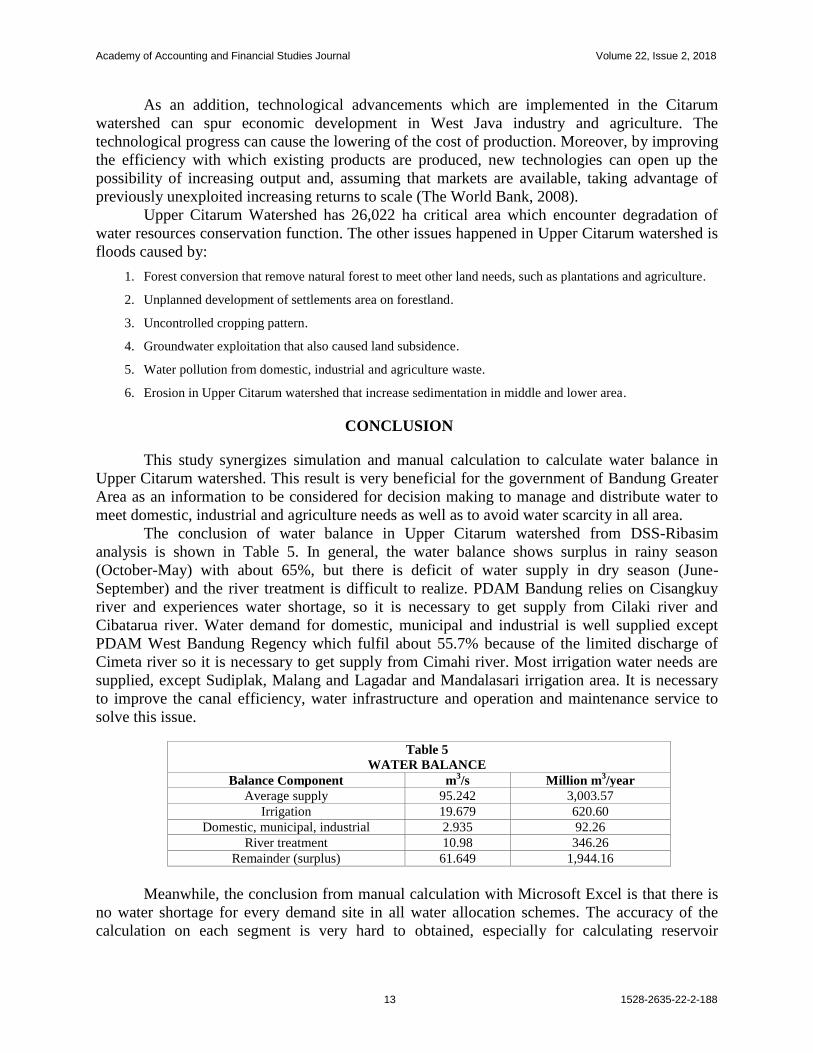
CONCLUSION
This study synergizes simulation and manual calculation to calculate water balance in
Upper Citarum watershed. This result is very beneficial for the government of Bandung Greater
Area as an information to be considered for decision making to manage and distribute water to
meet domestic, industrial and agriculture needs as well as to avoid water scarcity in all area.
The conclusion of water balance in Upper Citarum watershed from DSS-Ribasim
analysis is shown in Table 5. In general, the water balance shows surplus in rainy season
(October-May) with about 65%, but there is deficit of water supply in dry season (June-
September) and the river treatment is difficult to realize. PDAM Bandung relies on Cisangkuy
river and experiences water shortage, so it is necessary to get supply from Cilaki river and
Cibatarua river. Water demand for domestic, municipal and industrial is well supplied except
PDAM West Bandung Regency which fulfil about 55.7% because of the limited discharge of
Cimeta river so it is necessary to get supply from Cimahi river. Most irrigation water needs are
supplied, except Sudiplak, Malang and Lagadar and Mandalasari irrigation area. It is necessary
to improve the canal efficiency, water infrastructure and operation and maintenance service to
solve this issue.
Table 5
WATER BALANCE
Balance Component m3/s Million m
3/year
Average supply 95.242 3,003.57
Irrigation 19.679 620.60
Domestic, municipal, industrial 2.935 92.26
River treatment 10.98 346.26
Remainder (surplus) 61.649 1,944.16
Meanwhile, the conclusion from manual calculation with Microsoft Excel is that there is
no water shortage for every demand site in all water allocation schemes. The accuracy of the
calculation on each segment is very hard to obtained, especially for calculating reservoir
Academy of Accounting and Financial Studies Journal Volume 22, Issue 2, 2018
14 1528-2635-22-2-188
performance in the scheme while it should involve the influence of the elevation and volume
curves and also the reservoir gate operation which is very difficult to calculate manually. Water
discharge and water demand fluctuation in irrigation area as input in water allocation scheme are
also cannot be applied in this method. The water inflow and outflow are 60% and 40%
sequentially and the water usage is 1 litre/second/ha with the assumption of relatively fixed
irrigation development and 3 times a year cropping pattern. In this current condition on PDAM
in Upper Citarum watershed, there is deficit in Bandung city (-11.19 m3/s), Bandung Regency (-
4.37 m3/s), West Bandung Regency (-1.56 m
3/s) and Cimahi city (-4.12 m
3/s). Those demands
are served by PDAM in Sukawana, Ciwidey, Cisangkuy, Citarum, Cisarea, Cikeruh, Citarik,
Cikapundung, Cimeta and Saguling.
RECOMMENDATION
The research results serve an essential contribution for the government in Bandung
Greater Area (the government of City of Bandung, Regency of Bandung, Regency of West
Bandung and City of Cimahi) to improve the public sector performance management by which
the agency of development planning, spatial planning, environmental service, water resources
and other related agencies from each city and regency government cooperate and coordinate each
other to organize water allocation for the fulfillment of households and industry needs and to
avoide water scarcity in the Bandung Greater Area as well. In order to do that, the government in
Bandung Greater Area needs to: (1) Build water infrastructure due to the water balance deficit in
dry season and reduce or even solves water shortage in some PDAMs and (2) build drainage
canal due to the water balance surplus for up to 65% in rainy season. Moreover, the research
result can also be used as a basis for the government to prevent flood and distribute water for
irrigation equally.
Finally, it should be remembered that Citarum not only has significance in water supply
(physical entity) for industry, household and agriculture, but it must also be understood that
Citarum has a major role as a socio-cultural tool, such as education and recreation media.
Therefore, the Agency of Environmental Service and the Agency of Water Resources should also
cooperate with the Agency of Tourism and the Agency of Education in managing the Citarum.
REFERENCES
Alimah, I. & Putro, H.P.H. (2014). Barat (Thesis), Program Studi Magister Perencanaan Wilayah dan Kota, Sekolah
Arsitektur, Perencanaan, dan Pengembangan Kebijakan/SAPPK Institut Teknologi Bandung.
Balai Besar Wilayah Sungai Citarum/BBWS Citarum. (2010). Mencapai Sungai Citarum yang Lebih Baik Melalui
Upaya Pengelolaan Sumber Daya Air Terpadu. Citarum Fact Sheet.
Balai Pengelolaan Daerah Aliran Sungai Citarum-Ciliwung/BP DAS Citarum-Ciliwung. (2009). Rencana
Pengelolaan DAS Citarum Terpadu. Buku 1: Laporan Utama. Bogor: BP DAS Citarum-Ciliwung.
Chamel, J. & Hartl, M. (2011). Technical and vocational skills for poverty alleviation. International Fund for
Agricultural Development, Rome.
Balai Besar Wilayah Sungai Citarum. (2010). Mencapai Sungai Citarum yang Lebih Baik Melalui Upaya
Pengelolaan Sumber Daya Air Terpadu. Citarum Fact Sheet.
Balai Pengelolaan Daerah Aliran Sungai Citarum-Ciliwung. (2009). Rencana Pengelolaan DAS Citarum Terpadu.
Buku 1: Laporan Utama. Bogor: BP DAS Citarum-Ciliwung.
Chance, C. (2011). Tackling Water Scarcity-Water Trading Concepts and Possibilities. Available at:
https://onlineservices.cliffordchance.com/online/freeDownload.action?key=OBWIbFgNhLNomwBl%2B33
QzdFhRQAhp8D%2BxrIGReI2crGqLnALtlyZe1xF4Ji70%2FjPATHh9lO3Pijp%0D%0A5mt12P8Wnx03
DzsaBGwsIB3EVF8XihbSpJa3xHNE7tFeHpEbaeIf&attachmentsize=275830

Academy of Accounting and Financial Studies Journal Volume 22, Issue 2, 2018
15 1528-2635-22-2-188
Delft University of Technology. (2017). Decision Support System. Available at:
http://www.citg.tudelft.nl/?id=20304&L=1
Fulazzaky, M. (2014). Challenges of integrated water resources management in Indonesia. Water, 6(7), 2000-2020.
Giupponi, C., Mysiak, J., Depietri, Y. & Tamaro, M. (2011). Decision support systems for water resources
management: Current state and guidelines for tool development. In Decision Support for Water Framework
Directive Implementation; Vanrolleghem, P.A., Ed.; IWA Publishing: London, UK, 107-202.
Hinrichsen, D. (2008). Freshwater: Lifeblood of the planet. People and Planet Net, Available at:
http://www.peopleandtheplanet.com/index.html@lid=26385§ion=38&topic=44.html [Accessed 20 Apr
2017].
Ministry of Finance and Economic Development/MoFED. (2006). Ethiopia: Building on progress-A plan for
accelerated and sustained development to end poverty. Ministry of Finance and Economic Development for
the African Development Bank, Addis Abba.
Morgan, J.P. (2008). Watching water: A guide to evaluating corporate risks in a thirsty world. Available at:
http://pdf.wri.org/jpmorgan_watching_water.pdf
Parikesit., Salim, H., Triharyanto, E., Gunawan, B., Sunardi., Abdoellah, O. & Ohtsuka, R. (2005). Multi-source
water pollution in the upper Citarum watershed, Indonesia, with special reference to its spatiotemporal
variation. Journal of Environmental Sciences: An International Journal of Environmental Physiology and
Toxicology, 12(3), 121-131.
Schulte, P. (2014). Defining water scarcity, water stress and water risk: It’s not just semantics. Available at:
http://pacinst.org/water-definitions
The World Bank. (2008). Global economic prospects: Technology diffusion in developing world. World Bank
Report, Washington DC.
World Water Assessment Programme. (2009). UN World Water Development Report 3: Water in a Changing
World. Available at: http://www.un.org/waterforlifedecade/water_cities.shtml
World Widelife Fund. (2013). Water scarcity. Threats. Available at: https://www.worldwildlife.org/threats/water-
scarcity
Yamashita, A. (2013). History of urban water use in Tokyo: Focusing on surface water and groundwater as water
sources. Journal of Geography (Chigaku Zasshi), 122(6), 1039-1055.
2030 Water Resource Group. (2009). Charting our water future: Economic frameworks to inform decision-making.
Available at:
https://www.mckinsey.com/~/media/mckinsey/dotcom/client_service/sustainability/pdfs/charting%20our%
20water%20future/charting_our_water_future_full_report_.ashx [Accessed 20 Apr. 2017].
Related Documents