Synchronous Changes in Sediment Transport and Provenance at the Iceland‐Faroe Ridge Linked to Millennial Climate Variability From 55 to 6 ka BP M. Mirzaloo 1 , D. Nürnberg 1 , M. Kienast 2 , and H. J. L. van der Lubbe 3 1 Ocean Circulation and Climate Dynamics, GEOMAR Helmholtz Centre for Ocean Research Kiel, Kiel, Germany, 2 Department of Oceanography, Dalhousie University, Halifax, Nova Scotia, Canada, 3 Department of Geology and Geochemistry, Faculty of Science, Vrije Universiteit Amsterdam, Amsterdam, the Netherlands Abstract Unique marine sediment cores retrieved from the southwestern slope of the Iceland‐Faroe Ridge (IFR), close to the main axis of the Iceland‐Scotland Overflow Water (ISOW), revealed prominent sedimentary cycles reflecting near‐bottom current dynamics, sediment transport, and deposition, coincident with Dansgaard‐Oeschger cycles and deglacial perturbations of the Atlantic Meridional Overturning Circulation. The transition between Greenland Stadials (GSs) and Greenland Interstadials (GIs) follows a distinct, recurring sedimentation pattern. Basaltic (Ti‐rich) silts were transported from local volcanic sources by strong bottom currents and deposited during GIs comparable to modern ocean circulation. Finer‐grained felsic (K‐rich) sediments were deposited during GSs, when Iceland‐Scotland Overflow was weak. Possible felsic source areas include British‐Ireland and/or Fennoscandian shelf areas. A cyclic sawtooth pattern of bottom current strength is characterized by gradual intensification during GIs followed by a sharp decline toward GSs as is documented at core sites along the flank of Reykjanes Ridge. The cores north of the Faroe Channel instead document the opposite pattern. This suggests that the near‐bottom currents along the Reykjanes Ridge are strongly controlled by the flow cascading over the IFR. Heinrich‐(like) HS‐1 and HS‐2, are characterized by the deposition of very fine felsic sediments pointing to weakened bottom currents. Distinct coarse‐grained intervals of ice‐rafted debris are absent from the sediment records, although pebble‐ and gravel‐sized ice‐rafted debris is irregularly distributed throughout the fine sediment matrix. Near‐bottom currents are considered to have a major control on the lithogenic sediment deposition southwest of the IFR and further downstream. Plain Language Summary The northward flow of warm North Atlantic water into the Nordic Seas and the southward return of cold and dense overflow water toward the Atlantic basin drive the Atlantic Meridional Overturning Circulation, which is a significant component in the Earth's climate system. Reconstructions of past Atlantic Meridional Overturning Circulation variations are pivotal to our knowledge of the climate response to rapid warming both in the past and the future. The Iceland‐ Scotland Ridge is an important gateway for southward‐directed Iceland‐Scotland Overflow Water. Unique marine sedimentary archives from the southwestern slope of the Iceland‐Faroe Ridge close to the main axis of Iceland‐Scotland Overflow Water were systematically studied for their grain size distributions and chemical composition in order to reconstruct near‐bottom circulation dynamics during rapid cooling and warming phases in the northern Atlantic basin. The records reveal marked changes in particle size and provenance, which are clearly related to near‐bottom current speed and hence overflow over the Iceland‐Scotland Ridge coincident with major abrupt climate change events. 1. Introduction The Atlantic Meridional Ocean Circulation is a vital component of Earth's climate system, transporting tropical warm and saline surface water masses toward the northern North Atlantic Ocean and thus contributes to a relatively mild climate in northwest Europe (Rahmstorf, 2002). North Atlantic surface water cools along its transit and sinks in the Nordic Seas, before returning as cold and dense overflow water contributing to North Atlantic Deep Water (NADW; Figure 1). An estimated ~6 Sv (1 Sv = 10 6 m 3 /s; Hansen & Østerhus, 2000) flow across the shallow volcanic ridge between Greenland and ©2019. American Geophysical Union. All Rights Reserved. RESEARCH ARTICLE 10.1029/2019GC008298 Key Points: • Marine sediment cores from the southwest Iceland‐Faroe Ridge reveal prominent sedimentary cycles due to Iceland‐Scotland Overflow dynamics • Variations in grain‐size distributions and provenance are tightly coupled following Dansgaard‐Oeschger cycles over the last 55‐6 ka BP • Current‐controlled sediment deposition reflects the cumulative effect of overflow cascading over the ridge and through the Faroe Channels Supporting Information: • Supporting Information S1 Correspondence to: M. Mirzaloo, [email protected] Citation: Mirzaloo, M., Nürnberg, D., Kienast, M., & van der Lubbe, H. J. L. (2019). Synchronous changes in sediment transport and provenance at the Iceland‐Faroe Ridge linked to millennial climate variability from 55 to 6 ka BP. Geochemistry, Geophysics, Geosystems, 20, 4184–4201. https://doi. org/10.1029/2019GC008298 Received 28 FEB 2019 Accepted 25 JUL 2019 Accepted article online 30 JUL 2019 Published online 21 AUG 2019 MIRZALOO ET AL. 4184

Welcome message from author
This document is posted to help you gain knowledge. Please leave a comment to let me know what you think about it! Share it to your friends and learn new things together.
Transcript
Synchronous Changes in Sediment Transport andProvenance at the Iceland‐Faroe Ridge Linkedto Millennial Climate VariabilityFrom 55 to 6 ka BPM. Mirzaloo1 , D. Nürnberg1 , M. Kienast2 , and H. J. L. van der Lubbe3
1Ocean Circulation and Climate Dynamics, GEOMAR Helmholtz Centre for Ocean Research Kiel, Kiel, Germany,2Department of Oceanography, Dalhousie University, Halifax, Nova Scotia, Canada, 3Department of Geology andGeochemistry, Faculty of Science, Vrije Universiteit Amsterdam, Amsterdam, the Netherlands
Abstract Unique marine sediment cores retrieved from the southwestern slope of the Iceland‐FaroeRidge (IFR), close to the main axis of the Iceland‐Scotland Overflow Water (ISOW), revealed prominentsedimentary cycles reflecting near‐bottom current dynamics, sediment transport, and deposition,coincident with Dansgaard‐Oeschger cycles and deglacial perturbations of the Atlantic MeridionalOverturning Circulation. The transition between Greenland Stadials (GSs) and Greenland Interstadials(GIs) follows a distinct, recurring sedimentation pattern. Basaltic (Ti‐rich) silts were transported fromlocal volcanic sources by strong bottom currents and deposited during GIs comparable to modern oceancirculation. Finer‐grained felsic (K‐rich) sediments were deposited during GSs, when Iceland‐ScotlandOverflow was weak. Possible felsic source areas include British‐Ireland and/or Fennoscandian shelf areas. Acyclic sawtooth pattern of bottom current strength is characterized by gradual intensification during GIsfollowed by a sharp decline toward GSs as is documented at core sites along the flank of Reykjanes Ridge.The cores north of the Faroe Channel instead document the opposite pattern. This suggests that thenear‐bottom currents along the Reykjanes Ridge are strongly controlled by the flow cascading over the IFR.Heinrich‐(like) HS‐1 and HS‐2, are characterized by the deposition of very fine felsic sediments pointingto weakened bottom currents. Distinct coarse‐grained intervals of ice‐rafted debris are absent from thesediment records, although pebble‐ and gravel‐sized ice‐rafted debris is irregularly distributed throughoutthe fine sediment matrix. Near‐bottom currents are considered to have a major control on the lithogenicsediment deposition southwest of the IFR and further downstream.
Plain Language Summary The northward flow of warm North Atlantic water into the NordicSeas and the southward return of cold and dense overflow water toward the Atlantic basin drive theAtlantic Meridional Overturning Circulation, which is a significant component in the Earth's climatesystem. Reconstructions of past Atlantic Meridional Overturning Circulation variations are pivotal toour knowledge of the climate response to rapid warming both in the past and the future. The Iceland‐Scotland Ridge is an important gateway for southward‐directed Iceland‐Scotland Overflow Water. Uniquemarine sedimentary archives from the southwestern slope of the Iceland‐Faroe Ridge close to the mainaxis of Iceland‐Scotland Overflow Water were systematically studied for their grain size distributions andchemical composition in order to reconstruct near‐bottom circulation dynamics during rapid coolingand warming phases in the northern Atlantic basin. The records reveal marked changes in particle size andprovenance, which are clearly related to near‐bottom current speed and hence overflow over theIceland‐Scotland Ridge coincident with major abrupt climate change events.
1. Introduction
The Atlantic Meridional Ocean Circulation is a vital component of Earth's climate system, transportingtropical warm and saline surface water masses toward the northern North Atlantic Ocean and thuscontributes to a relatively mild climate in northwest Europe (Rahmstorf, 2002). North Atlantic surfacewater cools along its transit and sinks in the Nordic Seas, before returning as cold and dense overflowwater contributing to North Atlantic Deep Water (NADW; Figure 1). An estimated ~6 Sv (1 Sv = 106
m3/s; Hansen & Østerhus, 2000) flow across the shallow volcanic ridge between Greenland and©2019. American Geophysical Union.All Rights Reserved.
RESEARCH ARTICLE10.1029/2019GC008298
Key Points:• Marine sediment cores from the
southwest Iceland‐Faroe Ridgereveal prominent sedimentary cyclesdue to Iceland‐Scotland Overflowdynamics
• Variations in grain‐size distributionsand provenance are tightly coupledfollowing Dansgaard‐Oeschgercycles over the last 55‐6 ka BP
• Current‐controlled sedimentdeposition reflects the cumulativeeffect of overflow cascading over theridge and through the FaroeChannels
Supporting Information:• Supporting Information S1
Correspondence to:M. Mirzaloo,[email protected]
Citation:Mirzaloo, M., Nürnberg, D., Kienast, M.,& van der Lubbe, H. J. L. (2019).Synchronous changes in sedimenttransport and provenance at theIceland‐Faroe Ridge linked tomillennial climate variability from 55 to6 ka BP. Geochemistry, Geophysics,Geosystems, 20, 4184–4201. https://doi.org/10.1029/2019GC008298
Received 28 FEB 2019Accepted 25 JUL 2019Accepted article online 30 JUL 2019Published online 21 AUG 2019
MIRZALOO ET AL. 4184
Scotland, of which only Iceland and the Faroe Islands emerge above sea level. About half of this returnflow (~3 Sv) is routed as Iceland‐Scotland Overflow Water (ISOW; Figure 1; Hansen & Østerhus, 2000).This northern limb of the Atlantic Meridional Ocean Circulation has been shown to be intrinsicallylinked with climate change, shifting its mode of operation frequently during the last glacial period in pacewith Greenland Stadials (GSs) and Interstadials (GIs; i.e., Dansgaard‐Oeschger [D‐O] oscillations; Dokkenet al., 2013). Changes in the flow of ISOW have also been observed in concert with more recent, interann-ual and decadal changes in the North Atlantic Oscillation (Boessenkool et al., 2007). A better understand-ing of the dynamics of the ISOW in relation to (paleo)climate variability is therefore critically important.
High‐resolution atmospheric temperature records derived from Greenland ice cores display distinct D‐Ooscillations, which are characterized by abrupt warming at the onsets of GIs and gradual cooling towardthe GS conditions (North Greenland Ice Core Project, NGRIP). These comparable events are also documen-ted in Antarctic ice cores, although the warming phases are more gradual, less pronounced, and not entirelysynchronous with D‐O events in Greenland ice cores (Veres et al., 2013). Many paleoproxy records fromNorth Atlantic sediment cores also mimic D‐O variability (Ezat et al., 2014; Kissel, 2005; McCave & Hall,2006; Rasmussen, Thomsen, Weering, & Labeyrie 1996; Rasmussen et al., 1998). Marine sediments thatare currently under the pathway of ISOW are likely ideal candidates to reconstruct past changes in the varia-bility of near‐bottom circulation patterns and current velocities along the Iceland‐Faroe Ridge (IFR), includ-ing the thick and extensive deposits (i.e., contourites), which afford a high temporal resolution (Rebescoet al., 2014).
The lithogenic sediment composition monitored by bulk Ti/K ratio and magnetic susceptibility (MS) in sedi-ment cores from northeast of the Faroe Islands varies in close agreement with the D‐O oscillations in theGreenland ice cores (Ballini et al., 2006; Hoff et al., 2016; Richter et al., 2006). These records are interpretedto reflect variable sediment provenance in response to either changes in relative contribution of different
Figure 1. Bathymetric chart of the study area showing the location of studied core sites (red dots) P457‐905 (62°41.13′N14°21.15′W, 1,610‐m water depth), P457‐909 (62°50.20′N 12°59.47′W, 755‐m water depth) and the modern oceaniccirculation pattern. Black dots indicate adjacent cores, which are discussed in this study. Red arrows mark the surfacecirculation of the warm and salty North Atlantic Current (NAC) and the Irminger Current (IC). Dashed yellow arrowsdenote deep currents carrying Iceland‐Scotland Overflow Water (ISOW) and Norwegian Sea Deep Water (NSDW).Dashed light blue arrows show the relatively cold and fresh surface to subsurface East Icelandic Current (EIC). Purpledashed lines show Southern Source Water (SSW). The black lines indicate the present Polar Front (PF), whichrepresents the transition between Polar and Arctic waters, and the Arctic Front (AF). Dashed white lines outline theextension of continental British Ireland Ice Sheet (BIIS) and Norwegian Ice sheet during the LGM. Major ice streams:Bara Fan Ice Stream (BFIS), Minch Ice Stream (MNIS), and Norwegian Channel Ice Stream (NCIS) (Scourse et al.,2009). To the right, the bathymetric map (modified from Hansen & Østerhus, 2000; Ostmann et al., 2014) with contoursin meters and a blue shaded area <500 m of the Iceland‐Faroe Ridge (IFR), the Faroe‐Shetland Channel, and FaroeBank Channel provides information on the modern near‐bottom currents (yellow arrows) and according transport rates(in Sverdrups; 1 Sv = 106 m3/s). Red dots indicate the locations of sediment cores 909 and 905.
10.1029/2019GC008298Geochemistry, Geophysics, Geosystems
MIRZALOO ET AL. 4185
sources or varying modes of sediment transport deposition, with local volcanic (Ti‐rich, high MS) sedimentsdominant during warm GIs and distal felsic sources (K‐rich, lowMS) more prevalent during cold (Heinrich)stadials (Hoff et al., 2016; Richter et al., 2006). Changes in lithogenic grain size distributions have also beenused to reconstruct past changes in near‐bottom currents across the Icelandic Basin (Ballini et al., 2006;Jonkers et al., 2009; McCave & Andrews, 2019; Prins et al., 2001; Snowball & Moros, 2003; Thornalley,Blaschek, et al., 2013). So far, sediment cores from the IFR have not been systematically investigated for theirsediment grain size distributions and provenances in relation to near‐bottom current activity, and sedimenttransport and deposition.
We analyzed the lithogenic grain size composition of two sediment cores (P457‐905 and ‐909) from thesouthwestern flank of the IFR, north of the main ice‐rafted debris (IRD) belt and near the main pathwayof ISOW (Werner & Nürnberg, 2014). Complemented by high‐resolution records of X‐ray fluorescence(XRF) bulk chemistry, weighed coarse bulk fraction (>63 μm), and the isotopic composition of benthic for-aminifera shells, these records address near‐bottom current and overflow dynamics on glacial to deglacialtimescales at centennial to decadal resolution.
2. Modern Oceanographic and Climatic Settings
Overall, ~3 Sv of ISOW flow from the Nordic Seas into the Atlantic Ocean via the IFR, Faroe‐ShetlandChannel (FSC) and Faroe‐Bank Channel (FBC; Figure 1). Approximately 1 Sv is transported via depressionsof the shallow IFR with minima of ~300‐ to 500‐m water depth (m wd; Dorn & Werner, 1993). About 1.7 Svflow through the deep (~1,000‐mwd) FSC, of which ~1.5 Sv is directed westward through the FBC (Hansen& Østerhus, 2000). Bottom currents through the FBC together with overflow waters from the shallow IFRform a high‐energy near‐bottom contour current at water depths between ~600 and 1,000 m along the south-western flank of the IFR (Dorn & Werner, 1993; Kuijpers & Nielsen, 2016; Kuijpers et al., 1998; Kuijperset al., 2002). The presence of contour current‐induced sand bedforms indicates occasionally very highnear‐bottom flow velocities with maxima of ~90 cm/s, which likely mark the main axis of ISOW (Dorn &Werner, 1993; Kuijpers et al., 1998).
Float measurements between ~1,500 and 1,000‐mwd reveal average speeds of 21 cm/s along the SW flank ofthe IFR (Beaird et al., 2013), in agreement with flow speeds of 20–30 cm/s measured closer to the FBC(Hansen & Meincke, 1979). Approaching the Icelandic continental shelf, the contour current is deflectedin a southwesterly direction (Figure 1). Further to the southwest, flow is reduced to 13 to 21 cm/s at~2,000–2,300‐m wd (McCave et al., 2017). Hereafter, ISOW flows parallel to the axis of Reykjanes Ridge at~1,200–1,800‐m wd, where it interacts with Labrador Sea Water and continues its way to the westernIcelandic basin via the Charlie‐Gibbs Fracture Zone, contributing to NADW (Bower et al., 2017).
The overflow is driven by the vertically integrated pressure gradient at both sides of the Greenland‐ScotlandRidge. It is controlled by differences in the density of the water masses as well as sea surface heights that arein turn related to the formation of dense, cold water masses, atmospheric circulation, and sea ice dynamics(Østerhus et al., 2001). The seasonal sea ice extent coincides with the Polar Front, which is the S‐N boundarybetween the sea ice‐covered Polar water and seasonally sea ice‐free Arctic water. The Polar Front is at pre-sent situated northeast of Iceland; however, it shifts in concert with the Arctic front at (inter)annual as wellas longer timescales (Hoff et al., 2016).
3. Material and Methods3.1. Sediment Cores
The gravity cores P457‐909 (62°50.20′N 12°59.47′W, 755‐m wd, 758‐cm core length, hereafter referred to as909) and P457‐905 (62°41.13′N 14°21.15′W, 1,610‐m wd, 887‐cm core length, hereafter referred to as 905)were retrieved from the southwestern flank of the IFR and south of the Icelandic shelf during the summer2013 R/V POSEIDONCruise P457 (Figure 1). The shallower core 909 was recovered from a thick levee cover-ing the southwestern flank of the IFR, whereas the deeper core 905 was taken further down‐slope (Werner &Nürnberg, 2014). Both cores display alternating intervals of (grayish) brown mud, and dark olive gray sandymud to blackish gray volcanic muddy sands. The sediments are bioturbated to aminor extent with a few bur-rows up to 1 cm in diameter causing the occasionally mottled appearance of the sediments. Gravel (>4 mm)
10.1029/2019GC008298Geochemistry, Geophysics, Geosystems
MIRZALOO ET AL. 4186
and pebbles up to 8 cm are irregularly embedded in the fine‐grained sediment matrix of both cores (Figure S1in the supporting information). These clasts are derived as IRD and are dominantly composed of volcanicrocks with some rare occurrences of metamorphic, igneous rocks, and detrital carbonate. Complementarybox cores reveal that only 7 and 10 cm of the topmost sediment including the sediment‐water interfaceare unrecovered by the gravity cores 905 and 909, respectively. Since samples have been only taken fromthe gravity cores 905 and 909, core depths refer to the gravity sediment cores only.
3.2. Sample Preparation
The cores were split lengthwise into two halves; one half was subsampled into 1‐cm‐thick slices. The sedi-ment samples were weighed before and after freeze drying to determine the water content. Approximately4–5 g of the dried samples were processed for the grain size measurements. The rest of the bulk sedimentsample was freeze dried and weighed prior to wet sieving at 63 μm using a fine water spray. The coarse frac-tion >63 μmwas dried in an oven at 40 °C and weighed to determine the percentage of bulk fraction >63 μmcontaining detrital and biogenic components. The coarse fraction was subsequently split by dry sieving intothree size fractions: 63–125, 125–250, and >250 μm. Different foraminifera species were then selected andprocessed for stable isotope measurement.
3.3. XRF Core Scanning
XRF core scanning provides rapid, nondestructive and high‐resolution records of element contents of mar-ine bulk sediments (Richter et al., 2006; Weltje & Tjallingii, 2008). XRF core scanning was carried out on thesurfaces of the archive halve using an Avaatech XRF core scanner at the Department of Marine ClimateResearch, Institute of Geosciences, Kiel University (Germany). The sediment surface was carefully cleanedand covered with SPEXCerti Ultralene® foil to avoid contamination of the instrument sensor and desiccationof the sediment surfaces. The reproducibility was monitored by analyzing in‐house XRF standards beforeand after each measuring session and compared to the long‐term record. Qualitative XRF measurementsexpressed in counts per seconds were taken every 1 cm for 10 s, with a generator setting of 10 kV for the rela-tively light elements Fe, Al, Si, S, Cl, Ca, K, Mn, and Ti, whereas the heavier elements (Br, Rb, Sr, and Zr)were measured at 30 kV. Ratios of elemental intensities (e.g., Ti/K, Zr/Rb, Ca/Fe, and Ca/Sr) are expressedon a logarithmic scale, since they are linearly related to their concentrations and can be reversibly scaled(e.g.,Richter et al., 2006; Weltje & Tjallingii, 2008). The high‐resolution records of the XRF ratios allowedfor stratigraphic linkages between cores 905 and 909 as well as to the other cores in the region, and δ18Orecord of Greenland NGRIP ice core (Figure 2).
3.4. Grain Size Analysis
The lithogenic fraction of samples was isolated prior to grain size analysis by removing the organic matter,carbonate and biogenic silica (e.g., diatom frustules) using H2O2 (30%), HCl (0.5%), and NaOH, respectively(cf. Jonkers et al., 2015). The lithogenic grain size volume distributions were measured using a SympatecHELOS/KR laser diffraction particle‐size analyzer at a wide size range (57 classes between 0.12 and 2,000μm) at the Laboratory for Sediment Analysis, the Vrije Universiteit (Amsterdam, the Netherlands). Beforeanalyzing, the samples were passed through a sieve with a mesh size of 2 mm. Overall, grain size distribu-tions were determined on 299 samples (core 909; n = 143, core 905; n = 156), preselected on the basis ofthe XRF log (Zr/Rb) and log (Ti/K) records of both cores to cover the full range in lithogenic particle com-position. Grain size samples were also taken from volcanic ash layers at 176.5 cm in core 909 and at 359.5and 360.5 cm in core 905. Seventeen samples were randomly measured in duplicate (Figure 3c) to determinethe reproducibility of the grain size measurements, which yield a mean coefficient of determination (r2) bet-ter than 0.95 with a lower reproducibility for the less abundant grain size classes >354 μm.
3.5. Grain Size End‐Member Modeling
End‐member modeling of the grain size distributions allows for the decomposition into the statistically evi-dent subpopulations, which are characteristic for different modes of sediment transport and deposition(Prins et al., 2002; Prins & Weltje, 1999). Accompanying grain size determination of the sand fractionis important to examine the possible IRD contribution to the overall grain size distributions (Hoffmannet al., 2019; McCave & Hall, 2006; Prins et al., 2002). The grain size data set was separated into statisticallysignificant end‐members using the Analysize program in Matlab (Paterson & Heslop, 2015). This approachhas been shown to reliably determine grain size end‐members (Van Hateren et al., 2018) and has been
10.1029/2019GC008298Geochemistry, Geophysics, Geosystems
MIRZALOO ET AL. 4187
applied to other marine sediment cores from the region to reconstruct changes in bottom current speed andIRD input (Hoffmann et al., 2019; Jonkers et al., 2009, 2015; Prins et al., 2002).
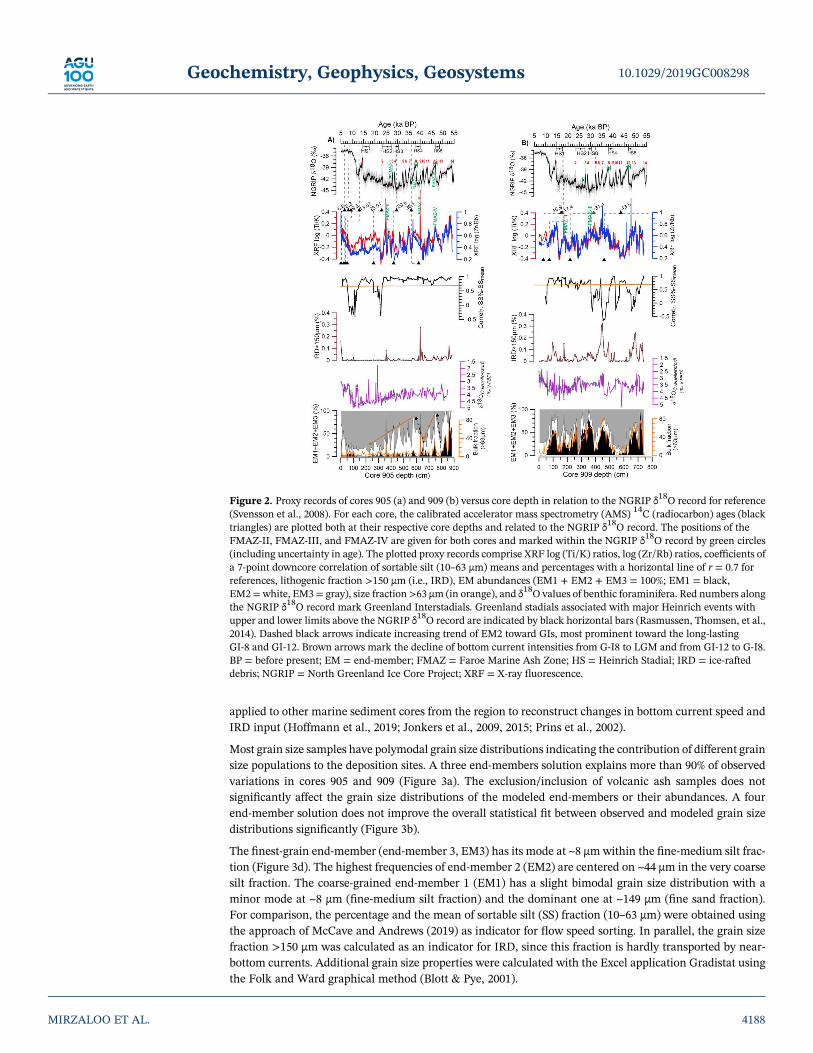
Most grain size samples have polymodal grain size distributions indicating the contribution of different grainsize populations to the deposition sites. A three end‐members solution explains more than 90% of observedvariations in cores 905 and 909 (Figure 3a). The exclusion/inclusion of volcanic ash samples does notsignificantly affect the grain size distributions of the modeled end‐members or their abundances. A fourend‐member solution does not improve the overall statistical fit between observed and modeled grain sizedistributions significantly (Figure 3b).
The finest‐grain end‐member (end‐member 3, EM3) has its mode at ~8 μmwithin the fine‐medium silt frac-tion (Figure 3d). The highest frequencies of end‐member 2 (EM2) are centered on ~44 μm in the very coarsesilt fraction. The coarse‐grained end‐member 1 (EM1) has a slight bimodal grain size distribution with aminor mode at ~8 μm (fine‐medium silt fraction) and the dominant one at ~149 μm (fine sand fraction).For comparison, the percentage and the mean of sortable silt (SS) fraction (10–63 μm) were obtained usingthe approach of McCave and Andrews (2019) as indicator for flow speed sorting. In parallel, the grain sizefraction >150 μm was calculated as an indicator for IRD, since this fraction is hardly transported by near‐bottom currents. Additional grain size properties were calculated with the Excel application Gradistat usingthe Folk and Ward graphical method (Blott & Pye, 2001).
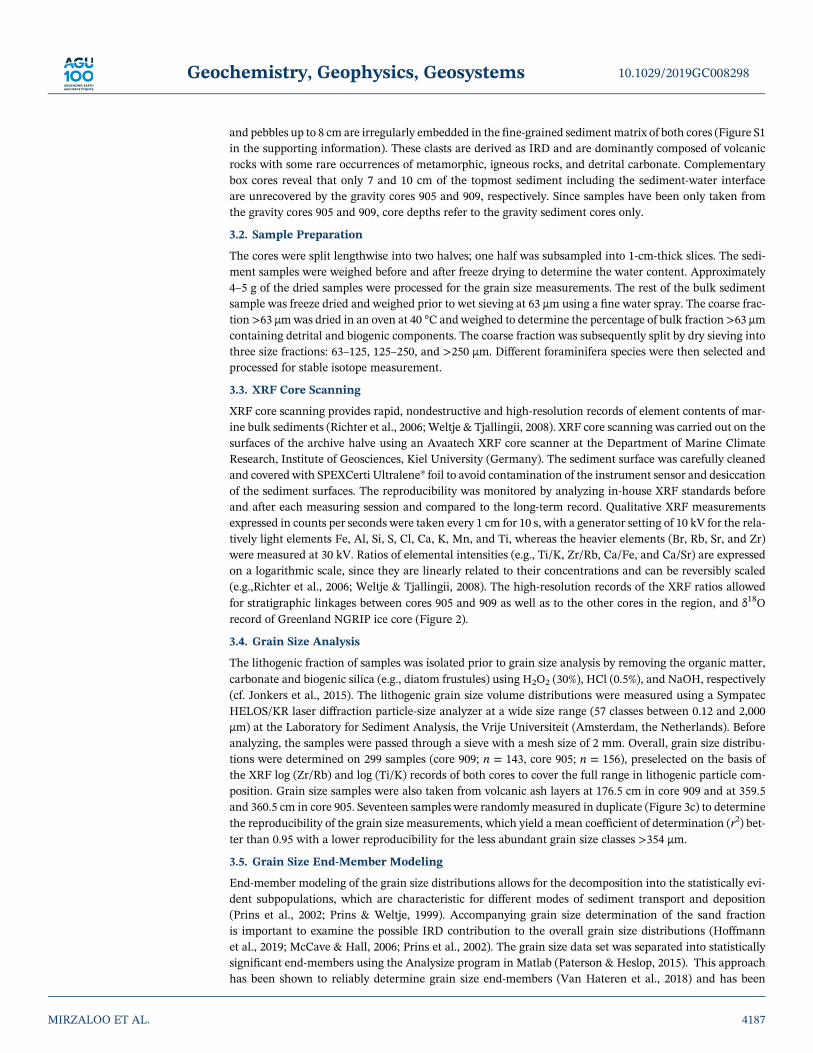
Figure 2. Proxy records of cores 905 (a) and 909 (b) versus core depth in relation to the NGRIP δ18O record for reference(Svensson et al., 2008). For each core, the calibrated accelerator mass spectrometry (AMS) 14C (radiocarbon) ages (blacktriangles) are plotted both at their respective core depths and related to the NGRIP δ18O record. The positions of theFMAZ‐II, FMAZ‐III, and FMAZ‐IV are given for both cores and marked within the NGRIP δ18O record by green circles(including uncertainty in age). The plotted proxy records comprise XRF log (Ti/K) ratios, log (Zr/Rb) ratios, coefficients ofa 7‐point downcore correlation of sortable silt (10–63 μm) means and percentages with a horizontal line of r = 0.7 forreferences, lithogenic fraction >150 μm (i.e., IRD), EM abundances (EM1 + EM2 + EM3 = 100%; EM1 = black,EM2 =white, EM3 = gray), size fraction >63 μm (in orange), and δ18O values of benthic foraminifera. Red numbers alongthe NGRIP δ18O record mark Greenland Interstadials. Greenland stadials associated with major Heinrich events withupper and lower limits above the NGRIP δ18O record are indicated by black horizontal bars (Rasmussen, Thomsen, et al.,2014). Dashed black arrows indicate increasing trend of EM2 toward GIs, most prominent toward the long‐lastingGI‐8 and GI‐12. Brown arrows mark the decline of bottom current intensities from G‐I8 to LGM and from GI‐12 to G‐I8.BP = before present; EM = end‐member; FMAZ = Faroe Marine Ash Zone; HS = Heinrich Stadial; IRD = ice‐rafteddebris; NGRIP = North Greenland Ice Core Project; XRF = X‐ray fluorescence.
10.1029/2019GC008298Geochemistry, Geophysics, Geosystems
MIRZALOO ET AL. 4188
3.6. Stable Isotope Analysis
Calcitic tests of the epifaunal foraminiferal species Cibicidoides wuellerstorfiwere selected from the >250‐μmsize fraction for stable oxygen and carbon isotope analyses (δ18O and δ13C). To examine the provenance ofdetrital carbonates, subsamples of seven individual detrital carbonate grains were measured in duplicatefor their δ18O and δ13C values (Figure S2 and Table S3). The δ18O and δ13C measurements were performedon a Thermo Fisher ScientificMAT 253mass spectrometer equipped with an automated CARBOKiel IV car-bonate preparation device at GEOMAR, Helmholtz Centre for Ocean Research Kiel, Ocean Circulation andClimate Dynamics (Germany). The δ18O and δ13C values were calibrated against the NBS‐19 (NationalBureau of Standards) standard and reported in per mil relative to the Vienna Peedee Belemnite scale. Thelong‐term external reproducibility was monitored by an in‐house Bremen Solnhofen Limestone standardwith an analytical precision of ±0.03‰ for δ13C and ±0.06‰ for δ18O.
3.7. Radiocarbon Dating
Twelve accelerator mass spectrometry radiocarbon (AMS 14C) ages were determined from mixtures ofplanktonic foraminifera (Globigerina bulloides and Neogloboquadrina pachyderma [sinistral]; >250‐μm sizefraction) at Beta Analytic Inc., Miami, Florida (USA). The conventional radiocarbon ages have been cor-rected for the total isotopic fractionation effects and were calibrated following the mathematical approachof Talma and Vogel (1993) and theMARINE13 database (Reimer et al., 2013) using a global marine reservoirage of 400 years with a local reservoir correction of ΔR = 45 ± 5 years (http://calib.org/marine/). The cali-brated AMS 14C ages are reported as radiocarbon dates before present (BP; Table 1).
Figure 3. End‐member (EM) modeling of grain size distributions for sediment cores 905 and 909. (a) Median coefficientsof determinations between the observed and modeled grain size distributions are given for 2 to 10 EM solutions. Thethree EM solutions used in this study explain about 96% of the observed grain size variations. (b) Coefficients of deter-mination for each grain size class (EMs) that were used to determine the optimal number of end‐members. The three EMsolution yields much higher coefficients of determination for each of the grain size classes compared to a two‐EM solution,whereas a four‐EM only slightly improves the statistical fit. (c) Replicate grain size measurements were randomly per-formed on 13 samples of core 905 and four samples of core 909, which provide a mean coefficient of determination (r2) of~0.97 (d) The grain size distributions of modeled EMs are shown, whereby the finest (EM3), medium (EM2), and coarse(EM1) EMs are plotted in blue, black, and red, respectively, together with their dominant modes.
10.1029/2019GC008298Geochemistry, Geophysics, Geosystems
MIRZALOO ET AL. 4189
4. Results4.1. Chronostratigraphy of the Sediment Cores4.1.1. AMS 14C AgesThe uppermost sediments of gravity core 905 (1‐ to 2‐cm core depth) yield a calibrated AMS 14C age of 6,673+ 30 years BP, whereas gravity core 909 provide an age of 16,991 + 50 years BP at 30‐ to 31‐cm core depth. A14C dead sample (extremely low 14C activity, Beta lab's internal AMS limits) indicates that core 909 sedi-ments below 460.5‐cm core depth are definitely older than 43.5 ka BP. In core 905, AMS 14C dates range from6,673 to 36,138 years BP. The AMS 14C dates (Table 1) reveal coherent age‐depth relationships for both cores905 and 909 (Figures 2 and 4). Regional 14C surface reservoir ages could deviate considerably from the globalmarine reservoir age with a maximum of ~1,500–2,000 years during Heinrich Events (Olsen et al., 2014;Voelker et al., 2000). The relatively low number of 14C ages in combination with a few distinct regionaltephra layers with a known age does not allow us to decipher the effect of local marine reservoir ages onour core chronologies, which is also beyond the scope of this study.4.1.2. TephrostratigraphyComplementary to AMS 14C ages, the tephrostratigraphy provides direct linkages between regional marinerecords and Greenland ice cores (Abbott & Davies, 2012; Davies et al., 2010). In cores 905 and 909, volcanicashes that appear as distinct, patchy, and bioturbated intervals can be linked to regionally widespread ashfalls from Icelandic and Faroe Island volcanoes, which is confirmed by comparative geochemical analyzes
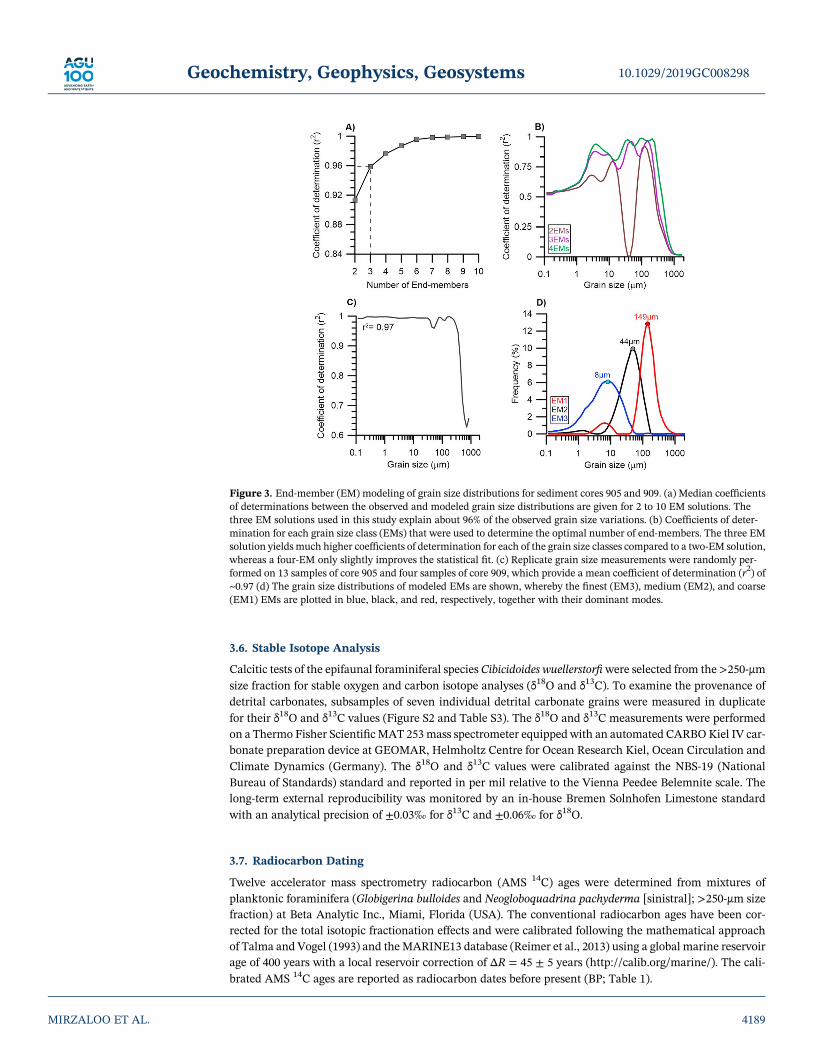
Table 1Accelerator Mass Spectrometry 14C Ages Measured on Mixtures of Planktonic Foraminifera Globigerina bulloides andNeogloboquadrina pachyderma (Sinistral)
CoreMean
depth (cm)Sample ID(Beta Lab) Conventional 14C age (years BP) Median calibrated 14C age (2σ; years BP)
P457‐905 1.5 439866 6,270 + 30 6,673 + 33P457‐905 24.5 429027 7,960 + 30 8,388 + 33P457‐905 35.5 439867 8,900 + 40 9,502 + 50P457‐905 50.5 409855 11,630 + 40 13,076 + 64P457‐905 260.5 409856 19,570 + 70 23,013 + 80P457‐905 420.5 409857 25,980 + 120 29,612 + 132P457‐905 618.5 429028 32,670 + 230 36,138 + 198P457‐909 30.5 409858 14,430 + 50 16,991 + 84P457‐909 73.5 429029 14,770 + 50 17,488 + 68P457‐909 220.5 409859 28,190 + 150 31,445 + 100P457‐909 460.5 409860 >43,500
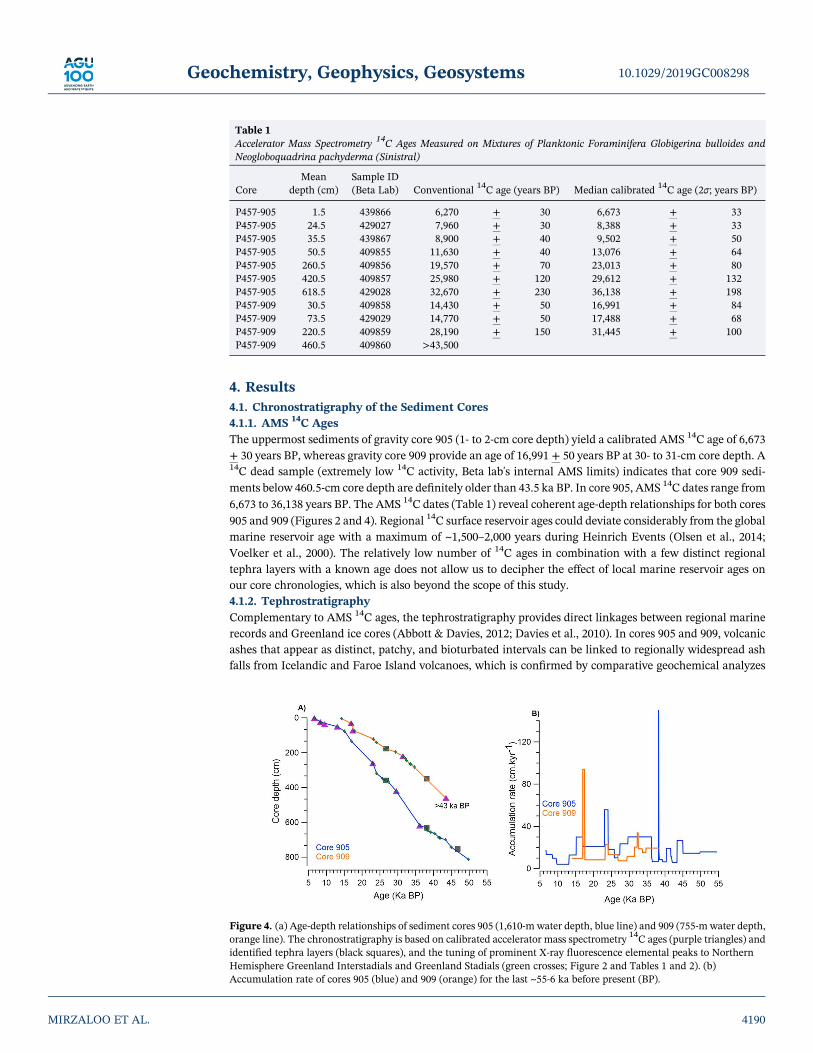
Figure 4. (a) Age‐depth relationships of sediment cores 905 (1,610‐mwater depth, blue line) and 909 (755‐mwater depth,orange line). The chronostratigraphy is based on calibrated accelerator mass spectrometry 14C ages (purple triangles) andidentified tephra layers (black squares), and the tuning of prominent X‐ray fluorescence elemental peaks to NorthernHemisphere Greenland Interstadials and Greenland Stadials (green crosses; Figure 2 and Tables 1 and 2). (b)Accumulation rate of cores 905 (blue) and 909 (orange) for the last ~55‐6 ka before present (BP).
10.1029/2019GC008298Geochemistry, Geophysics, Geosystems
MIRZALOO ET AL. 4190
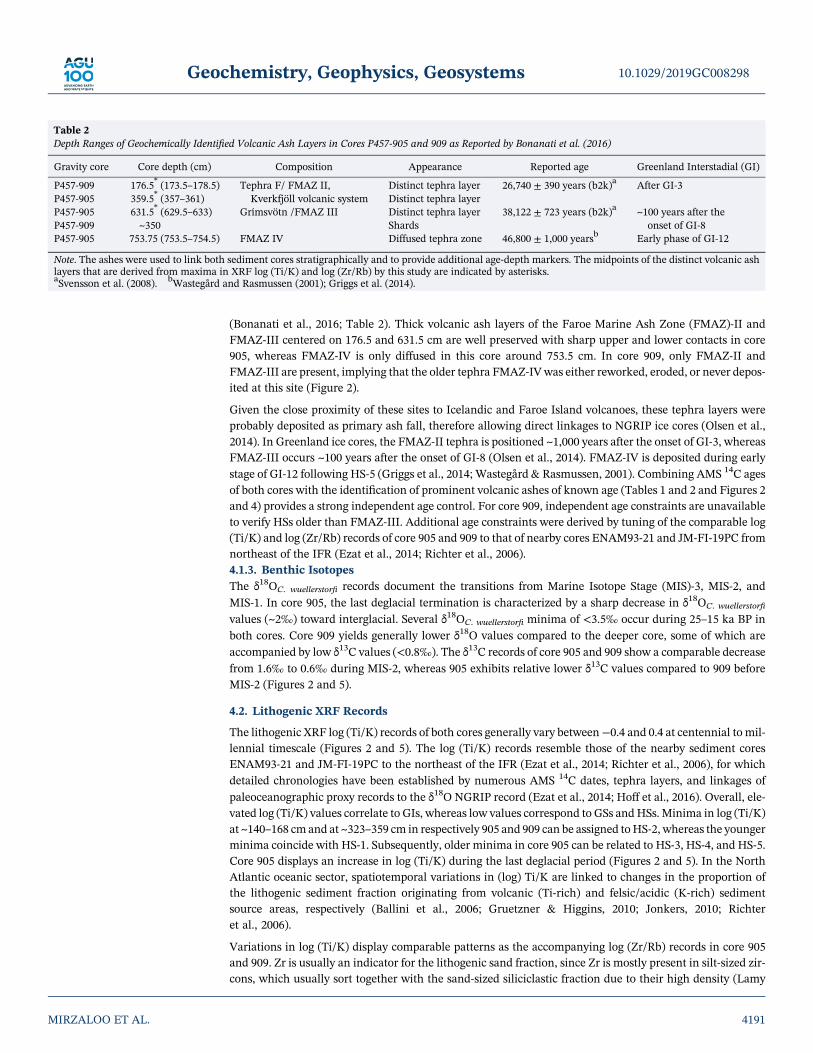
(Bonanati et al., 2016; Table 2). Thick volcanic ash layers of the Faroe Marine Ash Zone (FMAZ)‐II andFMAZ‐III centered on 176.5 and 631.5 cm are well preserved with sharp upper and lower contacts in core905, whereas FMAZ‐IV is only diffused in this core around 753.5 cm. In core 909, only FMAZ‐II andFMAZ‐III are present, implying that the older tephra FMAZ‐IV was either reworked, eroded, or never depos-ited at this site (Figure 2).
Given the close proximity of these sites to Icelandic and Faroe Island volcanoes, these tephra layers wereprobably deposited as primary ash fall, therefore allowing direct linkages to NGRIP ice cores (Olsen et al.,2014). In Greenland ice cores, the FMAZ‐II tephra is positioned ~1,000 years after the onset of GI‐3, whereasFMAZ‐III occurs ~100 years after the onset of GI‐8 (Olsen et al., 2014). FMAZ‐IV is deposited during earlystage of GI‐12 following HS‐5 (Griggs et al., 2014; Wastegård & Rasmussen, 2001). Combining AMS 14C agesof both cores with the identification of prominent volcanic ashes of known age (Tables 1 and 2 and Figures 2and 4) provides a strong independent age control. For core 909, independent age constraints are unavailableto verify HSs older than FMAZ‐III. Additional age constraints were derived by tuning of the comparable log(Ti/K) and log (Zr/Rb) records of core 905 and 909 to that of nearby cores ENAM93‐21 and JM‐FI‐19PC fromnortheast of the IFR (Ezat et al., 2014; Richter et al., 2006).4.1.3. Benthic IsotopesThe δ18OC. wuellerstorfi records document the transitions from Marine Isotope Stage (MIS)‐3, MIS‐2, andMIS‐1. In core 905, the last deglacial termination is characterized by a sharp decrease in δ18OC. wuellerstorfi
values (~2‰) toward interglacial. Several δ18OC. wuellerstorfi minima of <3.5‰ occur during 25–15 ka BP inboth cores. Core 909 yields generally lower δ18O values compared to the deeper core, some of which areaccompanied by low δ13C values (<0.8‰). The δ13C records of core 905 and 909 show a comparable decreasefrom 1.6‰ to 0.6‰ during MIS‐2, whereas 905 exhibits relative lower δ13C values compared to 909 beforeMIS‐2 (Figures 2 and 5).
4.2. Lithogenic XRF Records
The lithogenic XRF log (Ti/K) records of both cores generally vary between−0.4 and 0.4 at centennial to mil-lennial timescale (Figures 2 and 5). The log (Ti/K) records resemble those of the nearby sediment coresENAM93‐21 and JM‐FI‐19PC to the northeast of the IFR (Ezat et al., 2014; Richter et al., 2006), for whichdetailed chronologies have been established by numerous AMS 14C dates, tephra layers, and linkages ofpaleoceanographic proxy records to the δ18O NGRIP record (Ezat et al., 2014; Hoff et al., 2016). Overall, ele-vated log (Ti/K) values correlate to GIs, whereas low values correspond to GSs andHSs. Minima in log (Ti/K)at ~140–168 cm and at ~323–359 cm in respectively 905 and 909 can be assigned toHS‐2, whereas the youngerminima coincide with HS‐1. Subsequently, older minima in core 905 can be related to HS‐3, HS‐4, and HS‐5.Core 905 displays an increase in log (Ti/K) during the last deglacial period (Figures 2 and 5). In the NorthAtlantic oceanic sector, spatiotemporal variations in (log) Ti/K are linked to changes in the proportion ofthe lithogenic sediment fraction originating from volcanic (Ti‐rich) and felsic/acidic (K‐rich) sedimentsource areas, respectively (Ballini et al., 2006; Gruetzner & Higgins, 2010; Jonkers, 2010; Richteret al., 2006).
Variations in log (Ti/K) display comparable patterns as the accompanying log (Zr/Rb) records in core 905and 909. Zr is usually an indicator for the lithogenic sand fraction, since Zr is mostly present in silt‐sized zir-cons, which usually sort together with the sand‐sized siliciclastic fraction due to their high density (Lamy
Table 2Depth Ranges of Geochemically Identified Volcanic Ash Layers in Cores P457‐905 and 909 as Reported by Bonanati et al. (2016)
Gravity core Core depth (cm) Composition Appearance Reported age Greenland Interstadial (GI)
P457‐909 176.5* (173.5–178.5) Tephra F/ FMAZ II,Kverkfjöll volcanic system
Distinct tephra layer 26,740 ± 390 years (b2k)a After GI‐3P457‐905 359.5* (357–361) Distinct tephra layerP457‐905 631.5* (629.5–633) Grímsvötn /FMAZ III Distinct tephra layer 38,122 ± 723 years (b2k)a ~100 years after the
onset of GI‐8P457‐909 ~350 ShardsP457‐905 753.75 (753.5–754.5) FMAZ IV Diffused tephra zone 46,800 ± 1,000 yearsb Early phase of GI‐12
Note. The ashes were used to link both sediment cores stratigraphically and to provide additional age‐depth markers. The midpoints of the distinct volcanic ashlayers that are derived from maxima in XRF log (Ti/K) and log (Zr/Rb) by this study are indicated by asterisks.aSvensson et al. (2008). bWastegård and Rasmussen (2001); Griggs et al. (2014).
10.1029/2019GC008298Geochemistry, Geophysics, Geosystems
MIRZALOO ET AL. 4191
et al., 2015), whereas Rb often replaces K in clay minerals from felsicsources (Schneider et al., 1997). Relatively high log (Zr/Rb) values thatare recorded between HS‐2 and HS‐1 in shallow core 909 marks coarse‐grained sediment deposition compared to 905. On the other hand, max-ima in log (Ti/K; >0.4) and log (Zr/Rb; >0.7) correspond to the distincttephra layers of FMAZ‐II (905 and 909) and FMAZ‐III (905).
4.3. Lithogenic End‐Member Abundances
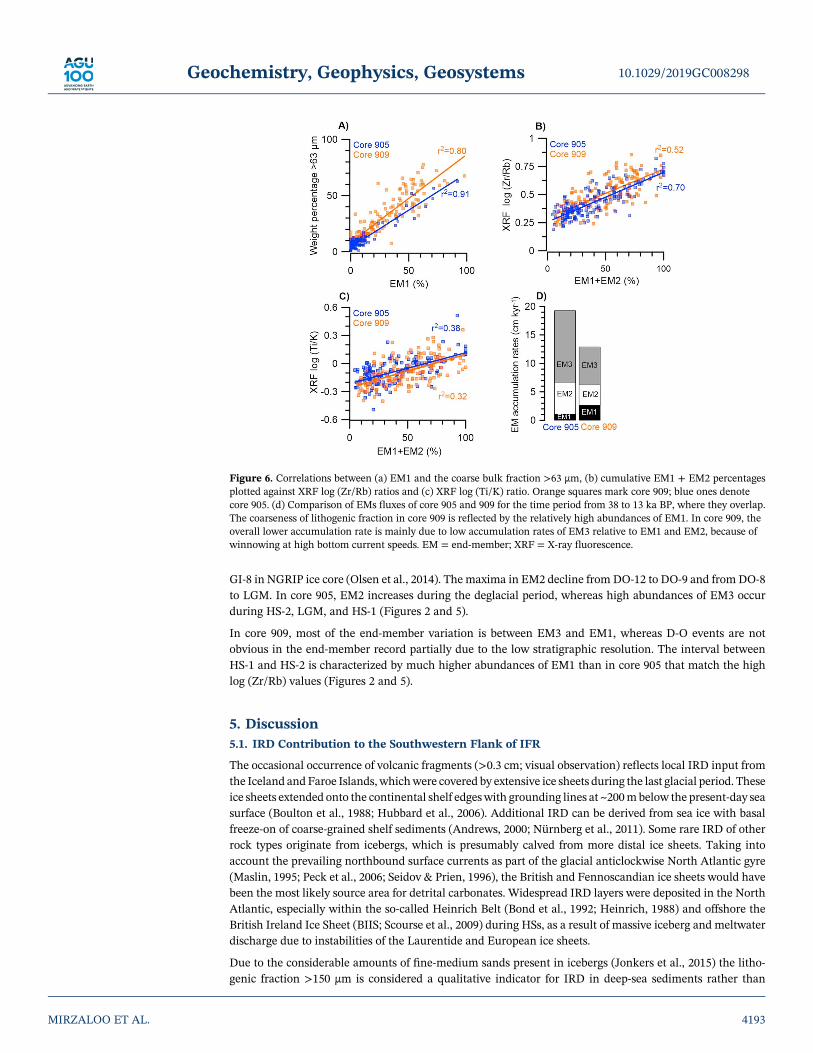
The accumulation rates of the three end‐members were estimated assum-ing linear accumulation rates for both cores for the timespan between 38and 13 ka BP (Figure 6). Considerably lower accumulation rates of the fin-est end‐member EM3 occurred at the shallow core site 909 than at thedeep site 905, while the cumulative accumulation rates of EM1 andEM2 are proportional at both sites.4.3.1. Coarse‐Grained Sediment (EM1)In core 905, the abundances of the coarsest end‐member EM1 are gener-ally low (<10%) except at the core top, the bottom part, and within theFMAZ‐II and FMAZ‐III layers. Maxima in EM1 are tentatively linked toGI‐13 and GI‐14 in core 905, whereas the abundances of EM1 show slightvariability during MIS‐3 with maxima up to 15%, generally lagging max-ima of the intermediate end‐member EM2. During the Last GlacialMaximum (LGM), EM1 is virtually absent in the lithogenic record, while3% EM1 on average is present during HS‐1 as well as in the core top of 905(Figure 5). In core 909, EM1 is dominant with high abundances betweenHS‐1 and HS‐2, which are both characterized by low amounts of EM1(<15%). The distinct FMAZ‐II layers yield EM1 abundances over 50%.
For both cores, variations in the abundance of the coarse‐grained end‐member (EM1) agree remarkably well with the percentages of the bulkfraction >63 μm (Figures 2 and 6), which is attributed to the low CaCO3
content of marine sediments, typically <10% in this region (Ballini et al.,2006). Slight deviations between percentages of the lithogenic EM1 andbulk fraction >63 μmmight be partly due to the occurrence of detrital car-bonates. Detrital fragments of carbonate rock (<1 cm) that occasionallyoccur in both cores yield average δ18O values of –1.51‰ (±0.06; 1 SD)and δ13C values of 2.03‰ (±0.03; 1 SD) for core 905 (n= 14, two measure-ments for each sample), which are within the isotopic ranges of carbonatebedrock from South England, Denmark, and North Sea (Scholle et al.,1974, 1983; Figure S2 and Table S3). Like Ca, Sr is mainly present inmarine carbonates; therefore, high log (Ca/Sr) ratios are indicative offine‐grained detrital carbonates, which are derived as IRD from Britishand Fennoscandian ice sheets (cf. Hodell et al., 2010, 2008). High XRFlog (Ca/Sr) ratio >1.1 occur at about 8.3, 13.3, 18.3, and 28.6 ka BP andat the base of core 905. It has to be noted, in this respect, that small andsparsely distributed detrital carbonates may have not been detected byXRF scanning.4.3.2. Fine‐Grained Sediment (EM2 and EM3)In core 905, most of the end‐member variations are due to changes in theadmixture of EM2 and EM3, showing a clear sawtooth pattern reflectingD‐O oscillations (Figures 2 and 5). The end‐members reveal gradual coar-sening from GSs to GIs, which is sharply terminated by fine‐graineddeposition during HSs. The sawtooth pattern is most obvious for D‐Oevents 12 and 8 in core 905. The onset of D‐O event 8 is constrained bythe presence of FMAZ‐III, which occurs ~100 years after the onset of
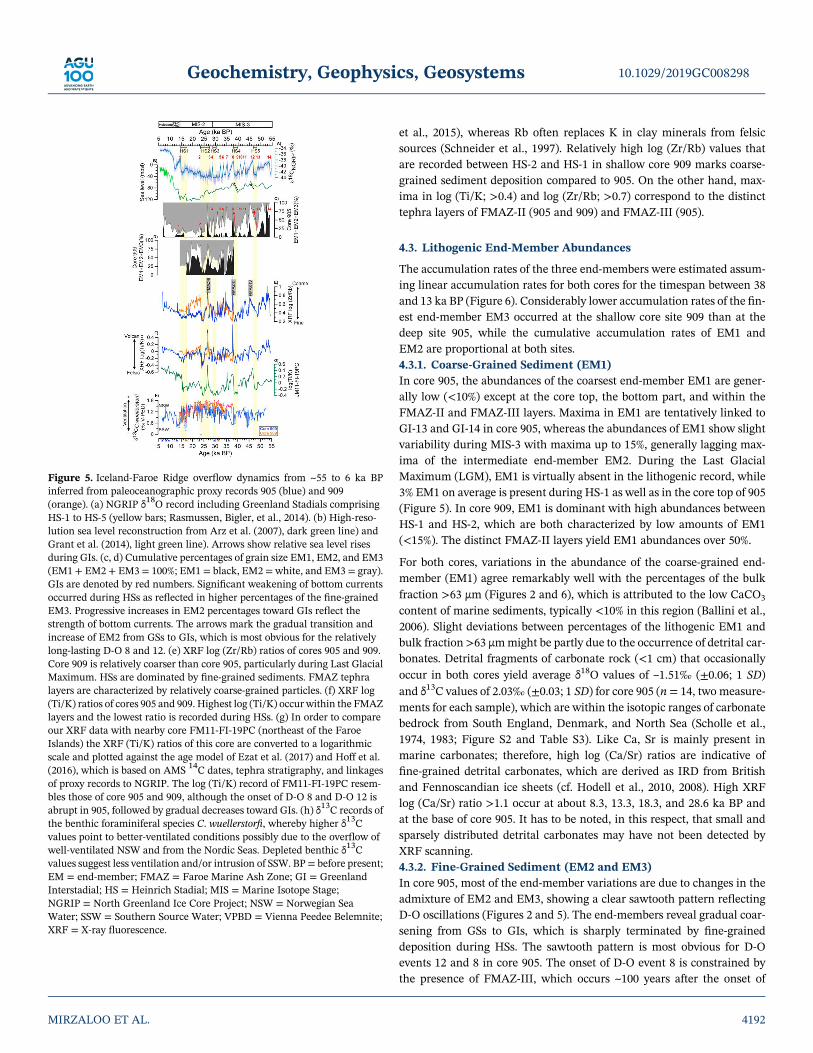
Figure 5. Iceland‐Faroe Ridge overflow dynamics from ~55 to 6 ka BPinferred from paleoceanographic proxy records 905 (blue) and 909(orange). (a) NGRIP δ18O record including Greenland Stadials comprisingHS‐1 to HS‐5 (yellow bars; Rasmussen, Bigler, et al., 2014). (b) High‐reso-lution sea level reconstruction from Arz et al. (2007), dark green line) andGrant et al. (2014), light green line). Arrows show relative sea level risesduring GIs. (c, d) Cumulative percentages of grain size EM1, EM2, and EM3(EM1 + EM2 + EM3 = 100%; EM1 = black, EM2 = white, and EM3 = gray).GIs are denoted by red numbers. Significant weakening of bottom currentsoccurred during HSs as reflected in higher percentages of the fine‐grainedEM3. Progressive increases in EM2 percentages toward GIs reflect thestrength of bottom currents. The arrows mark the gradual transition andincrease of EM2 from GSs to GIs, which is most obvious for the relativelylong‐lasting D‐O 8 and 12. (e) XRF log (Zr/Rb) ratios of cores 905 and 909.Core 909 is relatively coarser than core 905, particularly during Last GlacialMaximum. HSs are dominated by fine‐grained sediments. FMAZ tephralayers are characterized by relatively coarse‐grained particles. (f) XRF log(Ti/K) ratios of cores 905 and 909. Highest log (Ti/K) occur within the FMAZlayers and the lowest ratio is recorded during HSs. (g) In order to compareour XRF data with nearby core FM11‐FI‐19PC (northeast of the FaroeIslands) the XRF (Ti/K) ratios of this core are converted to a logarithmicscale and plotted against the age model of Ezat et al. (2017) and Hoff et al.(2016), which is based on AMS 14C dates, tephra stratigraphy, and linkagesof proxy records to NGRIP. The log (Ti/K) record of FM11‐FI‐19PC resem-bles those of core 905 and 909, although the onset of D‐O 8 and D‐O 12 isabrupt in 905, followed by gradual decreases toward GIs. (h) δ13C records ofthe benthic foraminiferal species C. wuellerstorfi, whereby higher δ13Cvalues point to better‐ventilated conditions possibly due to the overflow ofwell‐ventilated NSW and from the Nordic Seas. Depleted benthic δ13Cvalues suggest less ventilation and/or intrusion of SSW. BP = before present;EM = end‐member; FMAZ = Faroe Marine Ash Zone; GI = GreenlandInterstadial; HS = Heinrich Stadial; MIS = Marine Isotope Stage;NGRIP = North Greenland Ice Core Project; NSW = Norwegian SeaWater; SSW = Southern Source Water; VPBD = Vienna Peedee Belemnite;XRF = X‐ray fluorescence.
10.1029/2019GC008298Geochemistry, Geophysics, Geosystems
MIRZALOO ET AL. 4192
GI‐8 in NGRIP ice core (Olsen et al., 2014). The maxima in EM2 decline from DO‐12 to DO‐9 and fromDO‐8to LGM. In core 905, EM2 increases during the deglacial period, whereas high abundances of EM3 occurduring HS‐2, LGM, and HS‐1 (Figures 2 and 5).
In core 909, most of the end‐member variation is between EM3 and EM1, whereas D‐O events are notobvious in the end‐member record partially due to the low stratigraphic resolution. The interval betweenHS‐1 and HS‐2 is characterized by much higher abundances of EM1 than in core 905 that match the highlog (Zr/Rb) values (Figures 2 and 5).
5. Discussion5.1. IRD Contribution to the Southwestern Flank of IFR
The occasional occurrence of volcanic fragments (>0.3 cm; visual observation) reflects local IRD input fromthe Iceland and Faroe Islands, whichwere covered by extensive ice sheets during the last glacial period. Theseice sheets extended onto the continental shelf edgeswith grounding lines at ~200mbelow the present‐day seasurface (Boulton et al., 1988; Hubbard et al., 2006). Additional IRD can be derived from sea ice with basalfreeze‐on of coarse‐grained shelf sediments (Andrews, 2000; Nürnberg et al., 2011). Some rare IRD of otherrock types originate from icebergs, which is presumably calved from more distal ice sheets. Taking intoaccount the prevailing northbound surface currents as part of the glacial anticlockwise North Atlantic gyre(Maslin, 1995; Peck et al., 2006; Seidov & Prien, 1996), the British and Fennoscandian ice sheets would havebeen the most likely source area for detrital carbonates. Widespread IRD layers were deposited in the NorthAtlantic, especially within the so‐called Heinrich Belt (Bond et al., 1992; Heinrich, 1988) and offshore theBritish Ireland Ice Sheet (BIIS; Scourse et al., 2009) during HSs, as a result of massive iceberg and meltwaterdischarge due to instabilities of the Laurentide and European ice sheets.
Due to the considerable amounts of fine‐medium sands present in icebergs (Jonkers et al., 2015) the litho-genic fraction >150 μm is considered a qualitative indicator for IRD in deep‐sea sediments rather than
Figure 6. Correlations between (a) EM1 and the coarse bulk fraction >63 μm, (b) cumulative EM1 + EM2 percentagesplotted against XRF log (Zr/Rb) ratios and (c) XRF log (Ti/K) ratio. Orange squares mark core 909; blue ones denotecore 905. (d) Comparison of EMs fluxes of core 905 and 909 for the time period from 38 to 13 ka BP, where they overlap.The coarseness of lithogenic fraction in core 909 is reflected by the relatively high abundances of EM1. In core 909, theoverall lower accumulation rate is mainly due to low accumulation rates of EM3 relative to EM1 and EM2, because ofwinnowing at high bottom current speeds. EM = end‐member; XRF = X‐ray fluorescence.
10.1029/2019GC008298Geochemistry, Geophysics, Geosystems
MIRZALOO ET AL. 4193
rarer gravel and pebbles (e.g.,Rasmussen et al., 1998). Ice rafting events would therefore increase the abun-dance of coarse‐grained EM1 in cores 905 and 909. However, the EM1 records from the southwestern flankof the IFR do not reveal systematic IRD increases during HSs. The lack of IRD in cores 905 and 909 can beexplained by their geographic position, outside the main path of iceberg discharge in the North Atlantic dur-ing HSs (Bond et al., 1992; Heinrich, 1988). Moreover, the contemporaneous massive iceberg release in theNordic Seas did not generate widespread IRD deposits during HSs, since the icebergs were relatively sedi-ment barren (Dowdeswell et al., 1999). Moreover, the shallow depth of the nearby IFR during glacial sea‐level low stands could have hampered the passage of icebergs as is indicated by extensive plough marks atthe IFR (Dorn & Werner, 1993; Masson et al., 2004; Puteanus & Werner, 1990). Finally, an extended seaice cover around the IFR would have slowed down melting of icebergs (Hoff et al., 2016). The absence ofcoarse‐grained IRD in our cores agrees with the grain size minima in core ODP 984, retrieved from theReykjanes Ridge near the southwest coast of Iceland (Praetorius et al., 2008). Since the influence of IRDon the grain size distribution seems to be inconsequential for these coring sites, other transport mechanismswould have exerted a major control on the EM1 deposition.
5.2. Aeolian Sediment Input
Given the proximity to Iceland, coring sites 905 and 909 might have received coarse‐grained volcanic parti-cles (50–100 μm), which have been reported to travel more than 2,000 km during severe storms (Navrátilet al., 2013). Today, aeolian dust deposition rates of 50 to 500 g·m−2·year−1 have been inferred for offshoreareas near the southern coast of Iceland, which decline to much lower rates of 2–5 g·m−2·year−1 close to ourcoring sites (Arnalds et al., 2014, 2016). This is volumetrically small compared to the past accumulation ratesat these core sites (Figure 4). Today, aeolian input southeast offshore Iceland is high due to the exposure oflarge sand plains by the current glacier retreat and prevailing southerly winds compared to the last glacialperiod, when large parts of Iceland and Faroe Islands were covered by ice sheets (Hubbard et al., 2006;Nørgaard‐Pedersen et al., 2003). However, under rising eustatic sea levels and/or increasing currentstrength, glacial, aeolian, and riverine deposits could have been redistributed by near‐bottom currents togreater water depths.
5.3. Near‐Bottom Current Transport
Unlike most other deep‐sea coring sites, where bottom currents are rarely capable of transporting consider-able amounts of clastic sands (McCave & Hall, 2006), the IFR sites are situated at relatively shallow waterdepths and close to the present‐day main flow axis of ISOW as indicated by the modern large‐scale sandycontourite bedforms (Dorn & Werner, 1993). With increasing particle size, sediments become less proneto reworking and are therefore deposited close to their source areas. It has been postulated that thecoarse‐grained sediments of present‐day contourite bedforms have been derived from upstream source areasrich in IRD (Dorn & Werner, 1993). In turn, high abundances of EM1 can therefore be indicative of pastmaxima in bottom current speeds, whereby finer‐grainedmaterial is transported and deposited progressivelydownstream at lower current speeds. Small portions of EM3 that are present in intervals dominated by EM1are probably deposited as interstitial mud in between the coarse sediment particles (McCave & Hall, 2006).The slightly higher accumulation rate of EM1 at core site 909 (Figure 6) can most likely be explained by theproximity to coarse‐grained sediment sources and elevated bottom current speeds at the shallowerwater depths.
The intermediate EM2 has its mode in the noncohesive very coarse silt fraction (44 μm), which is usuallysubject to selective sediment transport and deposition by bottom currents (cf. SSs; McCave & Hall, 2006).In contrast, EM3 is dominated by the cohesive sediment fraction (<10 μm) that settled from suspension asaggregates at the seafloor. At turbulent flow, these aggregates fall apart and are transported further down-stream (McCave & Hall, 2006). As a consequence, the accumulation of fines is suppressed under relativelystrong bottom current conditions (Manighetti & McCave, 1995; McCave & Hall, 2006). Relatively high por-tions of EM3 therefore mark calm depositional conditions and weaker bottom currents having a lower abil-ity to transport the coarser grained fraction (i.e., EM2). Significant correlations between means andpercentage of SSs (10–63 μm) indicate that the majority of the silt fraction was current sorted for both cores(cf. McCave & Andrews, 2019) and were not readily affected by input of IRD (Figure 7). Interestingly, someintervals that show weak correlations between both silt parameters coincide with HSs, which is mostobvious for core 905 (Figures 2 and 7). This suggests that during HSs, the near‐bottom currents were too
10.1029/2019GC008298Geochemistry, Geophysics, Geosystems
MIRZALOO ET AL. 4194
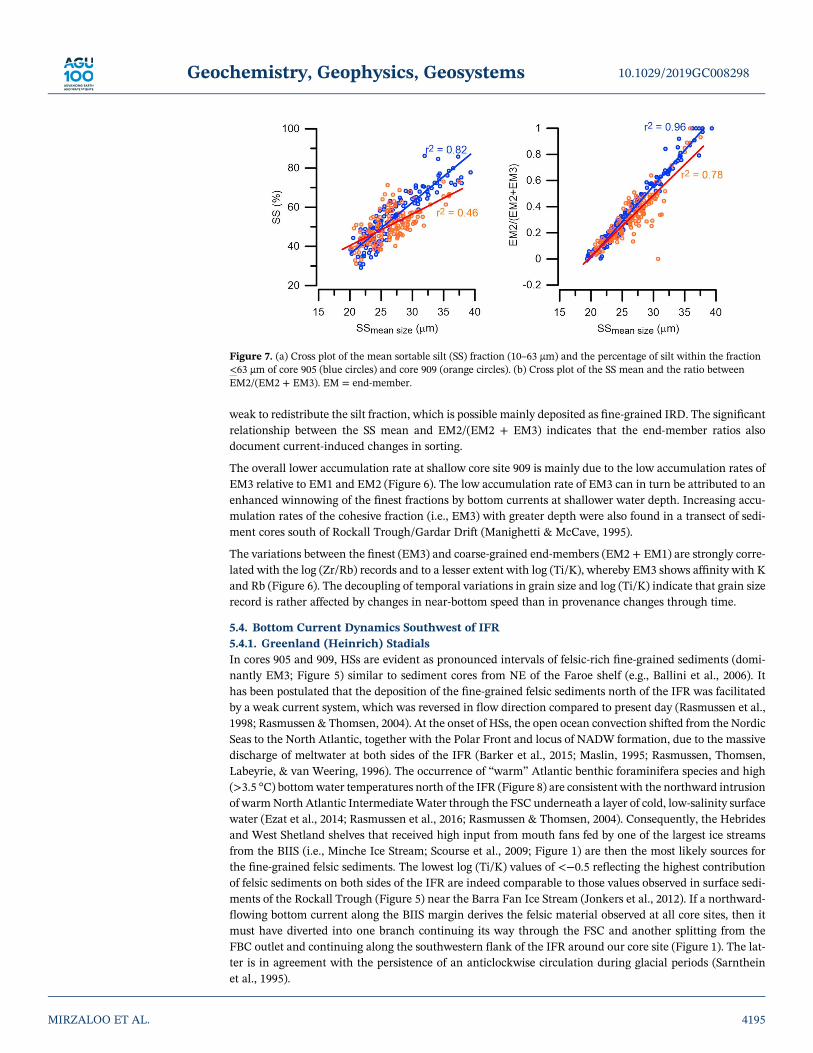
weak to redistribute the silt fraction, which is possible mainly deposited as fine‐grained IRD. The significantrelationship between the SS mean and EM2/(EM2 + EM3) indicates that the end‐member ratios alsodocument current‐induced changes in sorting.
The overall lower accumulation rate at shallow core site 909 is mainly due to the low accumulation rates ofEM3 relative to EM1 and EM2 (Figure 6). The low accumulation rate of EM3 can in turn be attributed to anenhanced winnowing of the finest fractions by bottom currents at shallower water depth. Increasing accu-mulation rates of the cohesive fraction (i.e., EM3) with greater depth were also found in a transect of sedi-ment cores south of Rockall Trough/Gardar Drift (Manighetti & McCave, 1995).
The variations between the finest (EM3) and coarse‐grained end‐members (EM2 + EM1) are strongly corre-lated with the log (Zr/Rb) records and to a lesser extent with log (Ti/K), whereby EM3 shows affinity with Kand Rb (Figure 6). The decoupling of temporal variations in grain size and log (Ti/K) indicate that grain sizerecord is rather affected by changes in near‐bottom speed than in provenance changes through time.
5.4. Bottom Current Dynamics Southwest of IFR5.4.1. Greenland (Heinrich) StadialsIn cores 905 and 909, HSs are evident as pronounced intervals of felsic‐rich fine‐grained sediments (domi-nantly EM3; Figure 5) similar to sediment cores from NE of the Faroe shelf (e.g., Ballini et al., 2006). Ithas been postulated that the deposition of the fine‐grained felsic sediments north of the IFR was facilitatedby a weak current system, which was reversed in flow direction compared to present day (Rasmussen et al.,1998; Rasmussen & Thomsen, 2004). At the onset of HSs, the open ocean convection shifted from the NordicSeas to the North Atlantic, together with the Polar Front and locus of NADW formation, due to the massivedischarge of meltwater at both sides of the IFR (Barker et al., 2015; Maslin, 1995; Rasmussen, Thomsen,Labeyrie, & van Weering, 1996). The occurrence of “warm” Atlantic benthic foraminifera species and high(>3.5 °C) bottomwater temperatures north of the IFR (Figure 8) are consistent with the northward intrusionof warmNorth Atlantic Intermediate Water through the FSC underneath a layer of cold, low‐salinity surfacewater (Ezat et al., 2014; Rasmussen et al., 2016; Rasmussen & Thomsen, 2004). Consequently, the Hebridesand West Shetland shelves that received high input from mouth fans fed by one of the largest ice streamsfrom the BIIS (i.e., Minche Ice Stream; Scourse et al., 2009; Figure 1) are then the most likely sources forthe fine‐grained felsic sediments. The lowest log (Ti/K) values of <−0.5 reflecting the highest contributionof felsic sediments on both sides of the IFR are indeed comparable to those values observed in surface sedi-ments of the Rockall Trough (Figure 5) near the Barra Fan Ice Stream (Jonkers et al., 2012). If a northward‐flowing bottom current along the BIIS margin derives the felsic material observed at all core sites, then itmust have diverted into one branch continuing its way through the FSC and another splitting from theFBC outlet and continuing along the southwestern flank of the IFR around our core site (Figure 1). The lat-ter is in agreement with the persistence of an anticlockwise circulation during glacial periods (Sarntheinet al., 1995).
Figure 7. (a) Cross plot of the mean sortable silt (SS) fraction (10–63 μm) and the percentage of silt within the fraction<63 μm of core 905 (blue circles) and core 909 (orange circles). (b) Cross plot of the SS mean and the ratio betweenEM2/(EM2 + EM3). EM = end‐member.
10.1029/2019GC008298Geochemistry, Geophysics, Geosystems
MIRZALOO ET AL. 4195
Depleted benthic δ18O values near the IFR suggest the persistence of con-vection during HSs, probably by local brine injection due to sea ice forma-tion (Vidal et al., 1998). Additionally, the δ13C values of benthicforaminifera indicate that core sites 905 and 909 were generally bathedin well‐ventilated waters (Figure 8). These observations leave the possibi-lity that the local convection of low‐salinity, cold surface waters main-tained a weak overflow across the Iceland‐Scotland Ridge during HSs,which also selectively transported fine‐grained felsic sediments fromnorthern felsic sources. A potential source area is the nearby North SeaFan that is fed by the Norwegian Channel Ice Stream, one of the majordrainages of the Scandinavian Ice Sheet (Hughes et al., 2016; Pattonet al., 2017; Scourse et al., 2009). Under such a scenario, the observedwarming of the deeper water masses north of the IFR can be explainedby heat trapping under the low‐salinity and cold surface waters duringHeinrich events (Dokken et al., 2013). However, this scenario also invokesa limited transport of volcanic sediments from the IFR, which can beattributed to the coarseness of Ti‐rich volcanic sediments relative to theweak bottom current strength and/or a restricted flow across the crestof IFR.5.4.2. GIsDue to warming and the northward shift of the Polar Front at theonset of GIs, the open ocean convection and the locus of deep‐waterformation most likely shifted north of the IFR, which led to a strongsouthward overflow across the IFR comparable to today (Keigwinet al., 1991; Rasmussen et al., 2016). The increasing strength of thenear‐bottom currents enhanced the transport of relatively coarse‐grained Ti‐rich sediments from the IFR volcanic source area(Figures 5 and 6). The progressively rising eustatic sea level (Arz et al.,2007; Grant et al., 2014) further increased the bottom current‐drivensediment transport across the IFR in addition to flow through theFaroe Channels (FSC and FBC; Figure 5).
The sedimentary records ENAM93‐21 and JM11‐FI‐19PC retrieved northof the FSC (Figure 1) reveal abrupt increases in volcanic sediment deposi-tion followed by gradual decreases toward the HS (Ezat et al., 2017; Hoffet al., 2016; Richter et al., 2006). This change in sedimentary provenanceis coeval with the temperature evolution documented in Greenland icecores. In contrast, cores 905 and 909 from the southwestern flank of theIFR recorded the opposite pattern: a gradual increase in volcanic sedi-ments during GIs declined by the felsic fine‐grained sediment depositionduring HSs (Figures 2 and 5). This discrepancy most likely reflects thecumulative effect of (1) near‐bottom currents through the FaroeChannels and (2) overflow cascading over the IFR at the core sites 905and 909, while ENAM93‐21 and JM11‐FI‐19PC cores are exclusivelyaffected by water masses entering the Faroe Channels.
As the bottom current signal recorded in ENAM93‐21 and JM11‐FI‐19PC appears to be a more directresponse of warming and subsequent increasing convection, sites 905 and 909 experienced both anincreased overflow across the ridge crest under the eustatic sea level rise and through the FaroeChannels. As a consequence, GIs sea level rise allowed widening the IFR gateway and the transportof relatively coarse‐grained volcanic sediments. The progressively rising sea level likely promoted denseNordic Sea waters to cross the IFR amplifying the D‐O oscillations as recorded in log (Ti/K) records ofcore 905. The enhanced downstream sediment transport from IFR volcanic sources during GIs led tohigh log (Ti/K) ratios, MS, and smectite content at downstream core sites in the Icelandic Basin(Ballini et al., 2006; Kissel, 2005; Kissel et al., 1999). Additionally, the vertical shift of the main flow
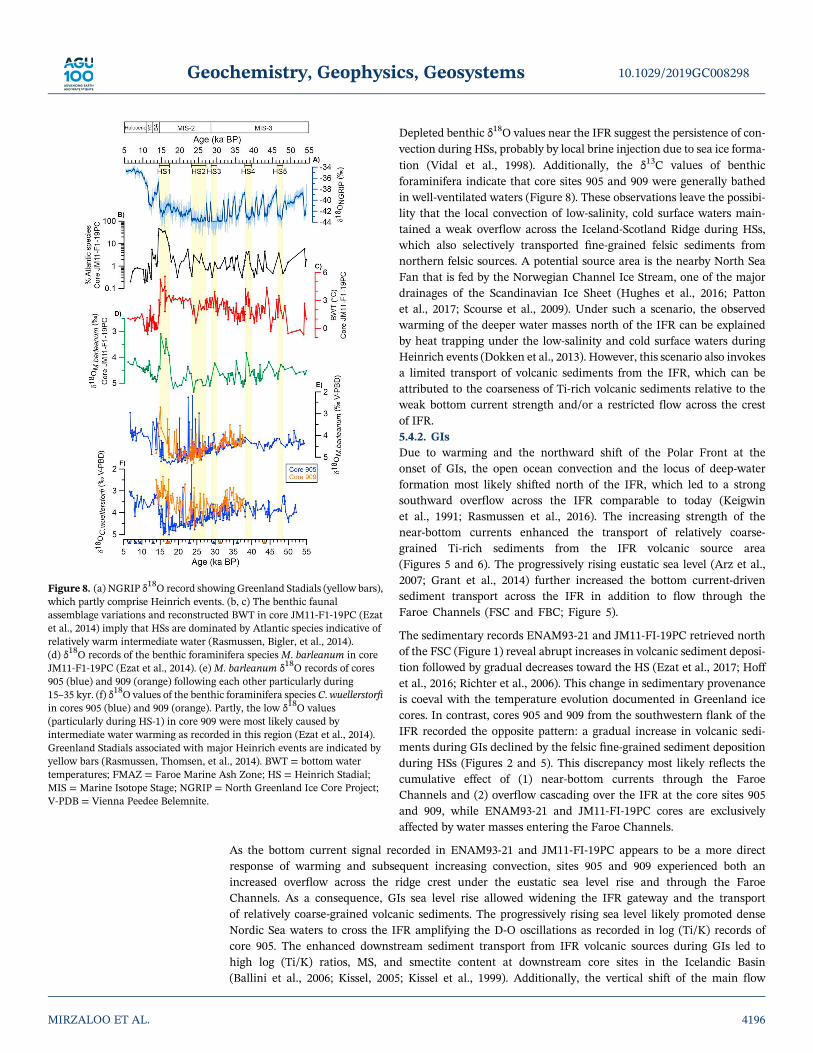
Figure 8. (a) NGRIP δ18O record showing Greenland Stadials (yellow bars),which partly comprise Heinrich events. (b, c) The benthic faunalassemblage variations and reconstructed BWT in core JM11‐F1‐19PC (Ezatet al., 2014) imply that HSs are dominated by Atlantic species indicative ofrelatively warm intermediate water (Rasmussen, Bigler, et al., 2014).(d) δ18O records of the benthic foraminifera species M. barleanum in coreJM11‐F1‐19PC (Ezat et al., 2014). (e) M. barleanum δ18O records of cores905 (blue) and 909 (orange) following each other particularly during15–35 kyr. (f) δ18O values of the benthic foraminifera species C. wuellerstorfiin cores 905 (blue) and 909 (orange). Partly, the low δ18O values(particularly during HS‐1) in core 909 were most likely caused byintermediate water warming as recorded in this region (Ezat et al., 2014).Greenland Stadials associated with major Heinrich events are indicated byyellow bars (Rasmussen, Thomsen, et al., 2014). BWT = bottom watertemperatures; FMAZ = Faroe Marine Ash Zone; HS = Heinrich Stadial;MIS = Marine Isotope Stage; NGRIP = North Greenland Ice Core Project;V‐PDB = Vienna Peedee Belemnite.
10.1029/2019GC008298Geochemistry, Geophysics, Geosystems
MIRZALOO ET AL. 4196
axis is likely responsible for the inferred increase in bottom current speed at core site 905 during GI sealevel high stands (Figure 5). However, a comparable sawtooth pattern as in core 905 with gradualintensification of bottom currents followed by a sharp decline has also been recorded at core sitesalong the western and eastern flank of Reykjanes Ridge (SO82‐07GGC, 1,580‐m wd; LO09‐18GC,1,460‐m wd; SO82‐05GGC, 1,420‐m wd; MD99‐2247, 1,690‐m wd; Figure 1 and Table 3). This suggeststhat the bottom current circulation along the Reykjanes Ridge is strongly controlled by overflowcascading over the IFR.5.4.3. LGMDuring the LGM, sea level was lower by at least ~120m (Arz et al., 2007; Waelbroeck et al., 2002) and glacierspropagated onto Iceland and the Faroe shelves, both shallowing and narrowing the IFR gateway. Ice sheetsextended off the Iceland shore with grounding lines ~200 m below present sea level during the LGM(Boulton et al., 1988; Ingólfsson et al., 1997). The proximity of the ice shelf grounding line probably contrib-uted the relatively high EM1 flux at the shallow core site 909 (Figures 2 and 5). On the other hand, the sedi-ment coarseness (high EM1 and log [Zr/Rb]) can be linked to relatively strong bottom currents at shallowsite 909 during the LGM (Figures 2 and 5), which is in agreement with a shoaled ISOW and shallower modeof circulation as recorded in other sediment cores from the North Atlantic Ocean (Elmore et al., 2015;Thornalley, Barker, et al., 2013). The isotopic δ13C signatures of benthic foraminifera south of the NordicSeas show that the intermediate water <2 km was well ventilated during the LGM (termed Glacial NorthAtlantic Intermediate Water) as the Polar Front was situated south of Iceland and convection cells wereactive in this area (Oppo & Horowitz, 2000; Oppo & Lehman, 1993). Time periods of both low δ13C andδ18O could reflect formation of sea ice and brine injection particularly during HSS and LGM, which is vitalfor the renewal of bottom water and deep ocean convection (Peterson, 2018; Rasmussen & Thomsen, 2004;Vidal et al., 1998).5.4.4. HoloceneAt ~9 ka, the increase in EM2 points to the intensification of overflowwater at core site 905 (Figure 5), whichis likely caused by the deepening and increasing strength of overflow water as is recorded in cores from theNorth Atlantic and the Labrador Sea (Hall et al., 2004; Hoffmann & Mertz, 1992; Kissel et al., 2013;Thornalley, Blaschek, et al., 2013). The absence of late Holocene sediments at the deep site coincides withthe maximum overflow during the mid‐Holocene thermal maximum (~7 ka BP; Rasmussen, Bigler, et al.,2014). The older core top AMS 14C age (16,991 + 50 years BP) at site 909 suggests that the nondeposition zonerelated to maximum flow speed shifted through time with increasing water depth, in line with observationsby Thornalley, Barker, et al. (2013). This vertical shift might be analogous to the progressively increasing bot-tom current speeds during GIs as recorded in core 905. The lack of large hiatuses and/or very coarse layersduring the GIs indicates that maximum bottom current speeds were not reached until the Holocene at thedeep core site over the last ~55 ka. The interglacial high sea levels, enhanced convection, and overflow fromthe Nordic Seas cause water masses to shoal and to cascade over the crest of IFR. Similar conditions can alsobe expected for the previous interglacial (MIS5) and the current rising sea level needs to be taken intoaccount as an important control on future ISOW overflow.
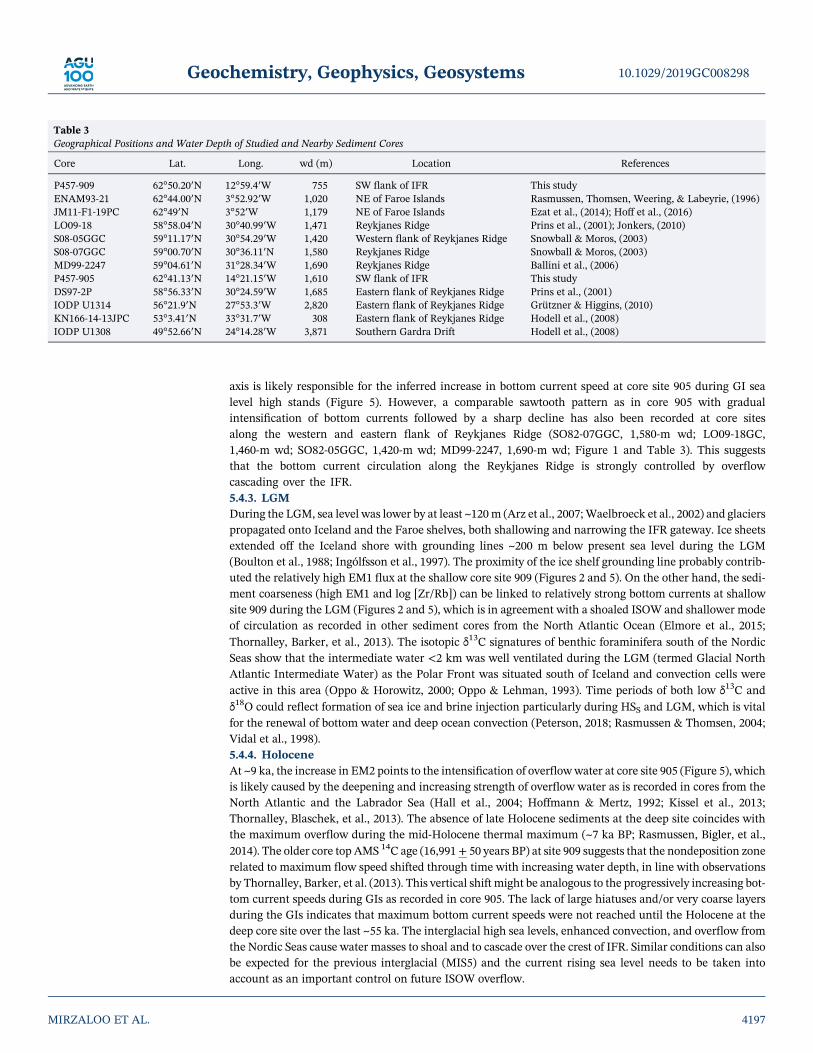
Table 3Geographical Positions and Water Depth of Studied and Nearby Sediment Cores
Core Lat. Long. wd (m) Location References
P457‐909 62°50.20′N 12°59.4′W 755 SW flank of IFR This studyENAM93‐21 62°44.00′N 3°52.92′W 1,020 NE of Faroe Islands Rasmussen, Thomsen, Weering, & Labeyrie, (1996)JM11‐F1‐19PC 62°49′N 3°52′W 1,179 NE of Faroe Islands Ezat et al., (2014); Hoff et al., (2016)LO09‐18 58°58.04′N 30°40.99′W 1,471 Reykjanes Ridge Prins et al., (2001); Jonkers, (2010)S08‐05GGC 59°11.17′N 30°54.29′W 1,420 Western flank of Reykjanes Ridge Snowball & Moros, (2003)S08‐07GGC 59°00.70′N 30°36.11′N 1,580 Reykjanes Ridge Snowball & Moros, (2003)MD99‐2247 59°04.61′N 31°28.34′W 1,690 Reykjanes Ridge Ballini et al., (2006)P457‐905 62°41.13′N 14°21.15′W 1,610 SW flank of IFR This studyDS97‐2P 58°56.33′N 30°24.59′W 1,685 Eastern flank of Reykjanes Ridge Prins et al., (2001)IODP U1314 56°21.9′N 27°53.3′W 2,820 Eastern flank of Reykjanes Ridge Grützner & Higgins, (2010)KN166‐14‐13JPC 53°3.41′N 33°31.7′W 308 Eastern flank of Reykjanes Ridge Hodell et al., (2008)IODP U1308 49°52.66′N 24°14.28′W 3,871 Southern Gardra Drift Hodell et al., (2008)
10.1029/2019GC008298Geochemistry, Geophysics, Geosystems
MIRZALOO ET AL. 4197
6. Conclusions
1. This study provides new multiproxy paleoceanographic records from the southwestern flank of the IFR,which today routes half of the ISOW overflow water from the Nordic seas to the North Atlantic Ocean.
2. The log (Ti/K) XRF records covering the time span from ~55 to 6 ka BP display distinct shifts in prove-nance between local basaltic sources (i.e., Iceland and Faroe Islands) and distal felsic sources comprisingthe British and Fennoscandian ice sheets.
3. End‐member modeling of the lithogenic grain size distributions reveals three end‐members, which aremodified and sorted by bottom currents.
4. The proportion of EM3 and EM2 + EM1 significantly correlates to the variations in log (Ti/K) indicatingthat bottom current strength and provenance changes are tightly coupled together over the last ~55 to 6kyr.
5. IRD that is irregularly dispersed in the sediment cores has a predominantly local origin from Iceland andFaroe Islands, although detrital carbonates and other rock types have been derived from distal ice sheets.
6. Heinrich‐like events are characterized by the deposition of fine‐grained felsic sediment originating frommouth fans, which were fed by the paleo‐ice streams of the BIIS.
7. The relative sediment coarseness during the LGM at the shallow site can be linked to both strong near‐bottom currents and a shoaled ISOW.
8. During GIs, dominantly Ti‐rich sediments were deposited at the IFR, whereas K‐rich sediments weredeposited during (Heinrich) stadials. The deposition of the Ti‐rich sediments cooccurs with coarse‐grained lithogenic sediments due to intensified southward ISOW overflow during GIs. In contrast, theaccumulation of fine‐grained sediments during (Heinrich) stadials can be attributed to a weakenedISOW flow.
9. The inferred variation in bottom currents strength follows the D‐O oscillation pattern during MIS‐3;however, the gradual intensification is followed by an abrupt decline, which is opposite to the interstadialwarming pattern recorded in Greenland ice cores. This discrepancy most likely reflects the cumulativeeffect of (1) near‐bottom currents through the Faroe Channels and (2) overflow cascading over the IFRat the core sites 905 and 909, while paleoceanographic records at the northern entrance of the FSC areexclusively affected by water masses flowing southward through the Faroe Channels.
ReferencesAbbott, P. M., & Davies, S. M. (2012). Volcanism and the Greenland ice‐cores: The tephra record. Earth‐Science Reviews, 115(3), 173–191.Andrews, J. T. (2000). Icebergs and iceberg rafted detritus (IRD) in the North Atlantic: Facts and assumptions. Oceanography‐Washington
Dc‐Oceanography Society, 13(3), 100–108.Arnalds, O., Dagsson‐Waldhauserova, P., & Olafsson, H. (2016). The Icelandic volcanic aeolian environment: Processes and impacts—A
review. Aeolian Research, 20, 176–195.Arnalds, O., Ólafsson, H., & Dagsson‐Waldhauserova, P. (2014). Quantification of iron‐rich volcanogenic dust emissions and deposition
over the ocean from Icelandic dust sources. Biogeosciences, 11(23), 6623–6632. https://doi.org/10.5194/bg‐11‐6623‐2014Arz, H. W., Lamy, F., Ganopolski, A., Nowaczyk, N., & Pätzold, J. (2007). Dominant Northern Hemisphere climate control over millennial‐
scale glacial sea‐level variability. Quaternary Science Reviews, 26(3), 312–321.Ballini, M., Kissel, C., Colin, C., & Richter, T. (2006). Deep‐water mass source and dynamic associated with rapid climatic variations during
the last glacial stage in the North Atlantic: A multiproxy investigation of the detrital fraction of deep‐sea sediments. Geochemistry,Geophysics, Geosystems, 7, Q02N01. https://doi.org/10.1029/2005GC001070
Barker, S., Chen, J., Gong, X., Jonkers, L., Knorr, G., & Thornalley, D. (2015). Icebergs not the trigger for North Atlantic cold events. Nature,520(7547), 333.
Beaird, N., Rhines, P., & Eriksen, C. (2013). Overflow waters at the Iceland–Faroe Ridge observed in multiyear seaglider surveys. Journal ofPhysical Oceanography, 43(11), 2334–2351.
Blott, S. J., & Pye, K. (2001). GRADISTAT: A grain size distribution and statistics package for the analysis of unconsolidated sediments.Earth surface processes and Landforms, 26(11), 1237–1248.
Boessenkool, K., Hall, I., Elderfield, H., & Yashayaev, I. (2007). North Atlantic climate and deep‐ocean flow speed changes during the last230 years. Geophysical Research Letters, 34, L13614. https://doi.org/10.1029/2007GL030285
Bonanati, C., Wehrmann, H., Portnyagin, M., Hoernle, K., Mirzaloo, M., & Nürnberg, D. (2016). Tephra in marine sediment cores offshoresouthern Iceland: A 68,000 year record of explosive volcanism, paper presented at EGU General Assembly Conference Abstracts.
Bond, G., Heinrich, H., Broecker, W., Labeyrie, L., McManus, J., Andrews, J., et al. (1992). Evidence for massive discharges of icebergs intothe North Atlantic ocean during the last glacial period. Nature, 360(6401), 245.
Boulton, G., Thors, K., & Jarvis, J. (1988). Dispersal of glacially derived sediment over part of the continental shelf of south Iceland and thegeometry of the resultant sediment bodies. Marine Geology, 83(1‐4), 193–223.
Bower, A., Furey, H., & Lozier, S. (2017). Overflow water pathways in the subpolar North Atlantic observed with deep floats, paper pre-sented at EGU General Assembly Conference Abstracts.
Davies, S. M., Wastegård, S., Abbott, P., Barbante, C., Bigler, M., Johnsen, S. J., et al. (2010). Tracing volcanic events in the NGRIP ice‐coreand synchronising North Atlantic marine records during the last glacial period. Earth and Planetary Science Letters, 294(1‐2), 69–79.
10.1029/2019GC008298Geochemistry, Geophysics, Geosystems
MIRZALOO ET AL. 4198
AcknowledgmentsThis study was funded and supportedby the Helmholtz Research School forOcean System Science and Technology(HOSST) program, GEOMAR. Theauthors are grateful to the captain andcrew of RV POSEIDON cruise 457 forthe recovery of cores P457‐905 andP457‐909. We are grateful to NadineGehre for technical assistance, JulienSchirrmacher for sample preparation,and Sebastian Fessler for stable isotopemeasurements. Maarten Prins andLukas Jonkers are thanked for helpfuldiscussions on grain size analysis. Alldata related to this article can be foundonline at https://doi.org/10.1594/PANGAEA.901946, the Data Publisherfor Earth & Environmental Science,PANGAEA.
Dokken, T. M., Nisancioglu, K. H., Li, C., Battisti, D. S., & Kissel, C. (2013). Dansgaard‐Oeschger cycles: Interactions between ocean and seaice intrinsic to the Nordic seas. Paleoceanography, 28, 491–502. https://doi.org/10.1002/palo.20042
Dorn, W., & Werner, F. (1993). The contour‐current flow along the southern Iceland—Faeroe Ridge as documented by its bedforms andasymmetrical channel fillings. Sedimentary Geology, 82(1‐4), 47–59.
Dowdeswell, J., Elverhøi, A., Andrews, J., & Hebbeln, D. (1999). Asynchronous deposition of ice‐rafted layers in the Nordic seas and NorthAtlantic Ocean. Nature, 400(6742), 348.
Elmore, A. C., Wright, J. D., & Chalk, T. B. (2015). Precession‐driven changes in Iceland–Scotland OverflowWater penetration and bottomwater circulation on Gardar Drift since ~200 ka. Palaeogeography, Palaeoclimatology, Palaeoecology, 440, 551–563.
Ezat, M. M., Rasmussen, T. L., & Groeneveld, J. (2014). Persistent intermediate water warming during cold stadials in the southeasternNordic seas during the past 65 ky. Geology, 42(8), 663–666.
Ezat, M. M., Rasmussen, T. L., Thornalley, D. J., Olsen, J., Skinner, L. C., Hönisch, B., & Groeneveld, J. (2017). Ventilation history of NordicSeas overflows during the last (de) glacial period revealed by species‐specific benthic foraminiferal 14C dates. Paleoceanography, 32,172–181. https://doi.org/10.1002/2016PA003053
Grant, K., Rohling, E., Ramsey, C. B., Cheng, H., Edwards, R., Florindo, F., et al. (2014). Sea‐level variability over five glacial cycles. Naturecommunications, 5, 5076.
Griggs, A. J., Davies, S. M., Abbott, P. M., Rasmussen, T. L., & Palmer, A. P. (2014). Optimising the use of marine tephrochronology in theNorth Atlantic: A detailed investigation of the Faroe Marine Ash Zones II, III and IV. Quaternary Science Reviews, 106, 122–139.
Grützner, J., & Higgins, S. M. (2010). Threshold behavior of millennial scale variability in deep water hydrography inferred from a 1.1 Malong record of sediment provenance at the southern Gardar Drift. Paleoceanography, 25, PA4204. https://doi.org/10.1029/2009PA001873
Hall, I. R., Bianchi, G. G., & Evans, J. R. (2004). Centennial to millennial scale Holocene climate‐deep water linkage in the North Atlantic.Quaternary Science Reviews, 23(14‐15), 1529–1536.
Hansen, B., &Meincke, J. (1979). Eddies and meanders in the Iceland‐Faroe Ridge area. Deep Sea Research Part A. Oceanographic ResearchPapers, 26(9).
Hansen, B., & Østerhus, S. (2000). North Atlantic–Nordic seas exchanges. Progress in Oceanography, 45(2), 109–208.Heinrich, H. (1988). Origin and consequences of cyclic ice rafting in the northeast Atlantic Ocean during the past 130,000 years.Quaternary
research, 29(2), 142–152.Hodell, D. A., Channell, J. E., Curtis, J. H., Romero, O. E., & Röhl, U. (2008). Onset of “Hudson Strait”Heinrich events in the eastern North
Atlantic at the end of the middle Pleistocene transition (∼640 ka)? Paleoceanography, 23, PA4218. https://doi.org/10.1029/2008PA001591
Hodell, D. A., Evans, H. F., Channell, J. E., & Curtis, J. H. (2010). Phase relationships of North Atlantic ice‐rafted debris and surface‐deepclimate proxies during the last glacial period. Quaternary Science Reviews, 29(27), 3875–3886.
Hoff, U., Rasmussen, T. L., Stein, R., Ezat, M. M., & Fahl, K. (2016). Sea ice and millennial‐scale climate variability in the Nordic seas 90(thinsp) kyr ago to present. Nature Communications, 7.
Hoffmann, G., & Mertz, D. F. (1992). Sedimentation patterns of the Iceland‐Faroe Ridge and volcanism within the Tjörnes Fracture Zonenorth of Iceland = Seimentationsmuster am Island‐Faroer‐Rücken und Vulkanismus im Bereich der Tjörnes‐Bruchzone nördlichIslands: Cruise report 185/3, RV" Poseidon"(POS185/3).
Hoffmann, S. S., Dalsing, R. E., & Murphy, S. C. (2019). Sortable silt records of intermediate‐depth circulation and sedimentation in theSouthwest Labrador Sea since the Last Glacial Maximum. Quaternary Science Reviews, 206, 99–110.
Hubbard, A., Sugden, D., Dugmore, A., Norddahl, H., & Pétursson, H. G. (2006). A modelling insight into the Icelandic Last GlacialMaximum ice sheet. Quaternary Science Reviews, 25(17‐18), 2283–2296.
Hughes, A. L., Gyllencreutz, R., Lohne, Ø. S., Mangerud, J., & Svendsen, J. I. (2016). The last Eurasian ice sheets—A chronological databaseand time‐slice reconstruction, DATED‐1. Boreas, 45(1), 1–45.
Ingólfsson, Ó., Björck, S., Haflidason, H., & Rundgren, M. (1997). Glacial and climatic events in Iceland reflecting regional North Atlanticclimatic shifts during the Pleistocene‐Holocene transition. Quaternary Science Reviews, 16(10), 1135–1144.
Jonkers, L. (2010). Rapid oceanographic changes associated with last glacial ice‐rafting events, Vrije Universiteit and royal NIOZ,Amsterdam.
Jonkers, L., Barker, S., Hall, I. R., & Prins, M. A. (2015). Correcting for the influence of ice‐rafted detritus on grain size‐based paleocurrentspeed estimates. Paleoceanography, 30, 1347–1357. https://doi.org/10.1002/2015PA002830
Jonkers, L., Prins, M. A., Brummer, G. J. A., Konert, M., & Lougheed, B. C. (2009). Experimental insights into laser diffraction particlesizing of fine‐grained sediments for use in palaeoceanography. Sedimentology, 56(7), 2192–2206.
Jonkers, L., Prins, M. A., Moros, M., Weltje, G. J., Troelstra, S. R., & Brummer, G.‐J. A. (2012). Temporal offsets between surface tem-perature, ice‐rafting and bottom flow speed proxies in the glacial (MIS 3) northern North Atlantic.Quaternary Science Reviews, 48, 43–53.
Keigwin, L., Jones, G., Lehman, S., & Boyle, E. (1991). Deglacial meltwater discharge, North Atlantic deep circulation, and abrupt climatechange. Journal of Geophysical Research, 96(C9), 16,811–16,826.
Kissel, C. (2005). Magnetic signature of rapid climatic variations in glacial North Atlantic, a review. Comptes Rendus Geoscience, 337(10‐11),908–918.
Kissel, C., Laj, C., Labeyrie, L., Dokken, T., Voelker, A., & Blamart, D. (1999). Rapid climatic variations during marine isotopic stage 3:Magnetic analysis of sediments from Nordic Seas and North Atlantic. Earth and Planetary Science Letters, 171(3), 489–502.
Kissel, C., Van Toer, A., Laj, C., Cortijo, E., & Michel, E. (2013). Variations in the strength of the North Atlantic bottom water duringHolocene. Earth and Planetary Science Letters, 369, 248–259.
Kuijpers, A., Hansen, B., Hühnerbach, V., Larsen, B., Nielsen, T., & Werner, F. (2002). Norwegian Sea overflow through the Faroe–Shetland gateway as documented by its bedforms. Marine Geology, 188(1), 147–164.
Kuijpers, A., & Nielsen, T. (2016). Near‐bottom current speed maxima in North Atlantic contourite environments inferred from current‐induced bedforms and other seabed evidence. Marine Geology, 378, 230–236.
Kuijpers, A., Troelstra, S., Wisse, M., Nielsen, S. H., & Van Weering, T. (1998). Norwegian Sea overflow variability and NE Atlantic surfacehydrography during the past 150,000 years. Marine Geology, 152(1), 75–99.
Lamy, F., Arz, H. W., Kilian, R., Lange, C. B., Lembke‐Jene, L., Wengler, M., et al. (2015). Glacial reduction and millennial‐scale variationsin Drake Passage throughflow. Proceedings of the National Academy of Sciences, 112(44), 13,496–13,501.
Manighetti, B., & McCave, I. (1995). Late glacial and Holocene palaeocurrents around Rockall Bank, NE Atlantic Ocean.Paleoceanography, 10(3), 611–626.
Maslin, M. (1995). Changes in North Atlantic deep water formation associated with the Heinrich events. Naturwissenschaften, 82(7),330–333.
10.1029/2019GC008298Geochemistry, Geophysics, Geosystems
MIRZALOO ET AL. 4199
Masson, D., Wynn, R., & Bett, B. (2004). Sedimentary environment of the Faroe‐Shetland and Faroe Bank Channels, north‐east Atlantic,and the use of bedforms as indicators of bottom current velocity in the deep ocean. Sedimentology, 51(6), 1207–1241.
McCave, I., & Andrews, J. (2019). Distinguishing current effects in sediments delivered to the ocean by ice. I. Principles, methods andexamples. Quaternary Science Reviews, 212, 92–107.
McCave, I., & Hall, I. R. (2006). Size sorting in marine muds: Processes, pitfalls, and prospects for paleoflow‐speed proxies. Geochemistry,Geophysics, Geosystems, 7, Q10N05. https://doi.org/10.1029/2006GC001284
McCave, I., Thornalley, D., & Hall, I. (2017). Relation of sortable silt grain‐size to deep‐sea current speeds: Calibration of the “Mud CurrentMeter,”. Deep Sea Research Part I: Oceanographic Research Papers, 127, 1–12.
Navrátil, T., Hladil, J., Strnad, L., Koptíková, L., & Skála, R. (2013). Volcanic ash particulate matter from the 2010 Eyjafjallajökull eruptionin dust deposition at Prague, central Europe. Aeolian Research, 9, 191–202.
Nørgaard‐Pedersen, N., Spielhagen, R. F., Erlenkeuser, H., Grootes, P. M., Heinemeier, J., & Knies, J. (2003). Arctic Ocean during the LastGlacial Maximum: Atlantic and polar domains of surface water mass distribution and ice cover. Paleoceanography, 18(3), 1063. https://doi.org/10.1029/2002PA000781
Nürnberg, D., Dethleff, D., Tiedemann, R., Kaiser, A., & Gorbarenko, S. A. (2011). Okhotsk Sea ice coverage and Kamchatka glaciation overthe last 350 ka—Evidence from ice‐rafted debris and planktonic δ18O. Palaeogeography, Palaeoclimatology, Palaeoecology, 310(3‐4),191–205.
Olsen, J., Rasmussen, T. L., & Reimer, P. J. (2014). North Atlantic marine radiocarbon reservoir ages through Heinrich event H4: A newmethod for marine age model construction. Geological Society, London, Special Publications, 398.
Oppo, D., & Lehman, S. (1993). Mid‐depth circulation of the subpolar North Atlantic during the last glacial maximum. Science, 259(5098),1148–1152.
Oppo, D. W., & Horowitz, M. (2000). Glacial deep water geometry: South Atlantic benthic foraminiferal Cd/Ca and δ13C evidence.Paleoceanography, 15(2), 147–160.
Østerhus, S., Turrell, W. R., Hansen, B., Lundberg, P., & Buch, E. (2001). Observed transport estimates between the North Atlantic and theArctic Mediterranean in the Iceland–Scotland region. Polar Research, 20(2), 169–175.
Ostmann, A., Schnurr, S., & Arbizu, P. M. (2014). Marine environment around Iceland: Hydrography, sediments and first predictive modelsof Icelandic deep‐sea sediment characteristics. Polish Polar Research, 35(2), 151–176.
Paterson, G. A., & Heslop, D. (2015). New methods for unmixing sediment grain size data. Geochemistry, Geophysics, Geosystems, 16,4494–4506. https://doi.org/10.1002/2015GC006070
Patton, H., Hubbard, A., Andreassen, K., Auriac, A., Whitehouse, P. L., Stroeven, A. P., et al. (2017). Deglaciation of the Eurasian ice sheetcomplex. Quaternary Science Reviews, 169, 148–172.
Peck, V., Hall, I., Zahn, R., Elderfield, H., Grousset, F., Hemming, S., & Scourse, J. (2006). High resolution evidence for linkages betweenNW European ice sheet instability and Atlantic Meridional Overturning Circulation. Earth and Planetary Science Letters, 243(3‐4),476–488.
Peterson, A. K. (2018). Observations of brine plumes below melting Arctic sea ice. Ocean Science, 14(1), 127–138.Praetorius, S. K., McManus, J. F., Oppo, D. W., & Curry, W. B. (2008). Episodic reductions in bottom‐water currents since the last ice age.
Nature Geoscience, 1(7), 449–452.Prins, M., Bouwer, L., Beets, C. J., Troelstra, S. R., Weltje, G. J., Kruk, R. W., et al. (2002). Ocean circulation and iceberg discharge in the
glacial North Atlantic: Inferences from unmixing of sediment size distributions. Geology, 30(6), 555–558.Prins, M., Troelstra, S., Kruk, R., Van Der Borg, K., De Jong, A., &Weltje, G. J. (2001). The late Quaternary sedimentary record of Reykjanes
Ridge, north Atlantic. Radiocarbon, 43(2B), 939–947.Prins, M., & Weltje, G‐J. (1999). End‐member modeling of siliciclastic grain‐size distributions: The late Quaternary record of eolian and
fluvial sediment supply to the Arabian Sea and its paleoclimatic significance.Puteanus, D., &Werner, F. (1990). Bericht über Reise Nr. 158 (POS158) des FS Poseidon in das Seegebiet um Island = Report on cruise 158
of RV Poseidon N and SE of Iceland.Rahmstorf, S. (2002). Ocean circulation and climate during the past 120,000 years. Nature, 419(6903), 207.Rasmussen, S., Bigler, M., Blockley, S., Blunier, T., Buchardt, S., Clausen, H., et al. (2014). A stratigraphic framework for abrupt climatic
changes during the Last Glacial period based on three synchronized Greenland ice‐core records: Refining and extending the INTIMATEevent stratigraphy. Quaternary Science Reviews, 106, 14–28.
Rasmussen, T. L., & Thomsen, E. (2004). The role of the North Atlantic Drift in the millennial timescale glacial climate fluctuations.Palaeogeography, Palaeoclimatology, Palaeoecology, 210(1), 101–116.
Rasmussen, T. L., Thomsen, E., Labeyrie, L., & van Weering, T. C. (1996). Circulation changes in the Faeroe‐Shetland Channel correlatingwith cold events during the last glacial period (58–10 ka). Geology, 24(10), 937–940.
Rasmussen, T. L., Thomsen, E., & Moros, M. (2016). North Atlantic warming during Dansgaard‐Oeschger events synchronous withAntarctic warming and out‐of‐phase with Greenland climate. Scientific reports, 6, 20,535.
Rasmussen, T. L., Thomsen, E., Skirbekk, K., Ślubowska‐Woldengen, M., Kristensen, D. K., & Koç, N. (2014). Spatial and temporal dis-tribution of Holocene temperature maxima in the northern Nordic seas: Interplay of Atlantic‐, Arctic‐ and polar water masses.Quaternary Science Reviews, 92, 280–291.
Rasmussen, T. L., Thomsen, E., & Van Weering, T. C. (1998). Cyclic sedimentation on the Faeroe Drift 53‐10 ka BP related to climaticvariations. Geological Society, London, Special Publications, 129(1), 255–267.
Rasmussen, T. L., Thomsen, E., Weering, T. C., & Labeyrie, L. (1996). Rapid changes in surface and deep water conditions at the FaeroeMargin during the last 58,000 years. Paleoceanography, 11(6), 757–771.
Rebesco, M., Hernández‐Molina, F. J., Van Rooij, D., & Wåhlin, A. (2014). Contourites and associated sediments controlled by deep‐watercirculation processes: State‐of‐the‐art and future considerations. Marine Geology, 352, 111–154.
Reimer, P. J., Bard, E., Bayliss, A., Beck, J. W., Blackwell, P. G., Ramsey, C. B., et al. (2013). IntCal13 and Marine13 radiocarbon age cali-bration curves 0–50,000 years cal BP. Radiocarbon, 55(4), 1869–1887.
Richter, T. O., Van der Gaast, S., Koster, B., Vaars, A., Gieles, R., de Stigter, H. C., et al. (2006). The Avaatech XRF Core Scanner: Technicaldescription and applications to NE Atlantic sediments. Geological Society, London, Special Publications, 267(1), 39–50.
Sarnthein, M., Jansen, E., Weinelt, M., Arnold, M., Duplessy, J. C., Erlenkeuser, H., et al. (1995). Variations in Atlantic surface oceanpaleoceanography, 50°‐80°N: A time‐slice record of the last 30,000 years. Paleoceanography, 10(6), 1063–1094.
Schneider, R., Price, B., Müller, P., Kroon, D., & Alexander, I. (1997). Monsoon related variations in Zaire (Congo) sediment load andinfluence of fluvial silicate supply onmarine productivity in the east equatorial Atlantic during the last 200,000 years. Paleoceanography,12(3), 463–481.
10.1029/2019GC008298Geochemistry, Geophysics, Geosystems
MIRZALOO ET AL. 4200
Scholle, P. A., Bebout, D. G., & Moore, C. H. (1983). Carbonate depositional environments: AAPG Memoir 33, AAPG.Scholle, P. A., Hsu, K., & Jenkyns, H. (1974). Diagenesis of Upper Cretaceous chalks from England, Northern Ireland and the North Sea. In
K. J. Hsü, & H. C. Jenkyns (Eds.), Pelagic sediments: on land and under the sea (pp. 177–210). https://doi.org/10.1002/9781444304855Scourse, J. D., Haapaniemi, A. I., Colmenero‐Hidalgo, E., Peck, V. L., Hall, I. R., Austin, W. E., et al. (2009). Growth, dynamics and
deglaciation of the last British–Irish ice sheet: The deep‐sea ice‐rafted detritus record.Quaternary Science Reviews, 28(27‐28), 3066–3084.Seidov, D., & Prien, R. (1996). A coarse resolution North Atlantic ocean circulation model: An intercomparison study with a paleoceano-
graphic example, paper presented at Annales Geophysicae.Snowball, I., & Moros, M. (2003). Saw‐tooth pattern of North Atlantic current speed during Dansgaard‐Oeschger cycles revealed by the
magnetic grain size of Reykjanes Ridge sediments at 59 N. Paleoceanography, 18(2), 1026. https://doi.org/10.1029/2001PA000732Svensson, A., Andersen, K. K., Bigler, M., Clausen, H. B., Dahl‐Jensen, D., Davies, S., et al. (2008). A 60 000 year Greenland stratigraphic ice
core chronology. Climate of the Past, 4(1), 47–57.Talma, A., & Vogel, J. C. (1993). A simplified approach to calibrating 14C dates. Radiocarbon, 35(2), 317–322.Thornalley, D. J., Barker, S., Becker, J., Hall, I. R., & Knorr, G. (2013). Abrupt changes in deep Atlantic circulation during the transition to
full glacial conditions. Paleoceanography, 28, 253–262. https://doi.org/10.1002/palo.20025Thornalley, D. J., Blaschek, M., Davies, F. J., Praetorius, S., Oppo, D. W., McManus, J. F., et al. (2013). Long‐term variations in Iceland–
Scotland overflow strength during the Holocene. Climate of the Past, 9(5), 2073–2084.Van Hateren, J., Prins, M., & van Balen, R. (2018). On the genetically meaningful decomposition of grain‐size distributions: A comparison
of different end‐member modelling algorithms. Sedimentary geology, 375, 49–71.Veres, D., Bazin, L., Landais, A., Kele, H. T. M., Lemieux‐Dudon, B., Parrenin, F., et al. (2013). The Antarctic ice core chronology
(AICC2012): An optimized multi‐parameter and multi‐site dating approach for the last 120 thousand years. Climate of the Past, 9(4),1733–1748.
Vidal, L., Labeyrie, L., &Weering, T. V. (1998). Benthic δ18O records in the North Atlantic over the last glacial period (60–10 kyr): Evidencefor brine formation. Paleoceanography and Paleoclimatology, 13(3), 245–251.
Voelker, A. H., Grootes, P. M., Nadeau, M.‐J., & Sarnthein, M. (2000). Radiocarbon levels in the Iceland Sea from 25–53 kyr and their link tothe Earth's magnetic field intensity. Radiocarbon, 42(3), 437–452.
Waelbroeck, C., Labeyrie, L., Michel, E., Duplessy, J. C., McManus, J., Lambeck, K., et al. (2002). Sea‐level and deep water temperaturechanges derived from benthic foraminifera isotopic records. Quaternary Science Reviews, 21(1‐3), 295–305.
Wastegård, S., & Rasmussen, T. L. (2001). New tephra horizons fromOxygen Isotope Stage 5 in the North Atlantic: Correlation potential forterrestrial, marine and ice‐core archives. Quaternary Science Reviews, 20(15), 1587–1593.
Weltje, G. J., & Tjallingii, R. (2008). Calibration of XRF core scanners for quantitative geochemical logging of sediment cores: Theory andapplication. Earth and Planetary Science Letters, 274(3), 423–438.
Werner, R., & Nürnberg, D. (2014). RV POSEIDON Fahrtbericht/Cruise Report P457 (POS457): Iceland hazards; volcanic risks fromIceland and climate change: The late Quaternary to anthropogene development, Reykjavík/Iceland–Galway/Ireland, 7.‐22. August2013.
10.1029/2019GC008298Geochemistry, Geophysics, Geosystems
MIRZALOO ET AL. 4201
Related Documents