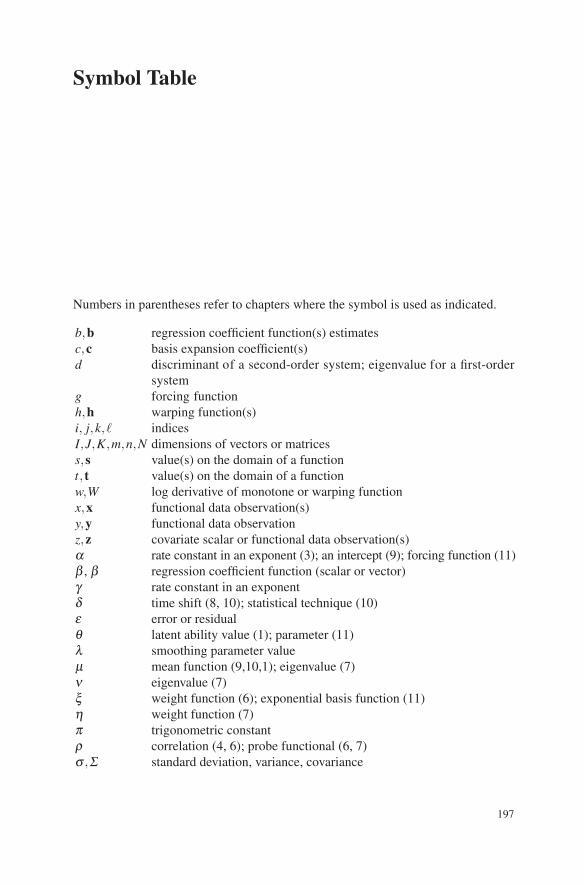
Symbol Table Numbers in parentheses refer to chapters where the symbol is used as indicated. b, b regression coefficient function(s) estimates c, c basis expansion coefficient(s) d g forcing function h, h warping function(s) i, j, k,‘ indices I , J, K, m, n, N dimensions of vectors or matrices s, s value(s) on the domain of a function t , t value(s) on the domain of a function w , W log derivative of monotone or warping function x, x functional data observation(s) y , y functional data observation z, z covariate scalar or functional data observation(s) α β , β regression coefficient function (scalar or vector) γ rate constant in an exponent δ time shift (8, 10); statistical technique (10) ε error or residual θ latent ability value (1); parameter (11) λ smoothing parameter value μ mean function (9,10,1); eigenvalue (7) ν eigenvalue (7) ξ weight function (6); exponential basis function (11) η weight function (7) π trigonometric constant ρ correlation (4, 6); probe functional (6, 7) σ , Σ standard deviation, variance, covariance 197 discriminant of a second-order system; eigenvalue for a first-order system rate constant in an exponent (3); an intercept (9); forcing function (11)

Welcome message from author
This document is posted to help you gain knowledge. Please leave a comment to let me know what you think about it! Share it to your friends and learn new things together.
Transcript
Symbol Table
Numbers in parentheses refer to chapters where the symbol is used as indicated.
b,b regression coefficient function(s) estimatesc,c basis expansion coefficient(s)d
g forcing functionh,h warping function(s)i, j,k, ` indicesI,J,K,m,n,N dimensions of vectors or matricess,s value(s) on the domain of a functiont, t value(s) on the domain of a functionw,W log derivative of monotone or warping functionx,x functional data observation(s)y,y functional data observationz,z covariate scalar or functional data observation(s)αβ , β regression coefficient function (scalar or vector)γ rate constant in an exponentδ time shift (8, 10); statistical technique (10)ε error or residualθ latent ability value (1); parameter (11)λ smoothing parameter valueµ mean function (9,10,1); eigenvalue (7)ν eigenvalue (7)ξ weight function (6); exponential basis function (11)η weight function (7)π trigonometric constantρ correlation (4, 6); probe functional (6, 7)σ ,Σ standard deviation, variance, covariance
197
discriminant of a second-order system; eigenvalue for a first-ordersystem
rate constant in an exponent (3); an intercept (9); forcing function (11)

φ ,φ basis functionψ,ζ basis functionΘ matrix of basis function valuesΦ matrix of basis function valuesΨ matrix of basis function values
198 Symbol Table

References
Adler, D. and D. Murcoch (2009). rgl: 3D visualization device system (OpenGL).R package version 0.82. http://rgl.neoscientists.org.
Bellman, R. and R. S. Roth (1971). The use of splines with unknown end pointsin the identification of systems. Journal of Mathematical Analysis and Applica-tions 34, 26–33.
Bookstein, F. L. (1991). Morphometric Tools for Landmark Data: Geometry andBiology. Cambridge: Cambridge University Press.
Borrelli, R. L. and C. S. Coleman (2004). Differential Equations: A ModellingPerspective. New York: Wiley.
Brumback, B. A. and J. A. Rice (1998). Smoothing spline models for the analysisof nested and crossed samples of curves. Journal of the American StatisticalAssociation 93, 961–994.
Brunel, N. (2008). Parameter estimation of ODEs via nonparametric estimators.Electronic Journal of Statistics 2, 1242–1267.
Cardot, H., F. Ferraty, A. Mas, and P. Sarda (2003b). Testing hypotheses in thefunctional linear model. Scandanavian Journal of Statistics 30, 241–255.
Cardot, H., F. Ferraty, and P. Sarda (1999). Functional linear model. Statistics andProbability Letters 45, 11–22.
Cardot, H., F. Ferraty, and P. Sarda (2003a). Spline estimators for the functionallinear model. Statistica Sinica 13, 571–591.
Cardot, H., A. Goia, and P. Sarda (2004). Testing for no effect in functional lin-ear models, some computational approaches. Communications in Statistics—Simulation and Computation 33, 179–199.
Chambers, J. M. (2008). Software for Data Analysis. New York: Springer.Chambers, J. M. and T. J. Hastie (1991). Statistical Models in S. New York: Chap-
man and Hall.Chaudhuri, P. and J. S. Marron (1999). SiZer for exploration of structures in curves.
Journal of the American Statistical Association 94, 807–823.Chen, J. and H. Wu (2008). Estimation of time-varying parameters in deterministic
dynamic models. Statistica Sinica 18, 987–1006.
199

200 References
Chiou, J. M. and H. G. Muller (2009). Modeling hazard rates as functional datafor the analysis of cohort lifetables and mortality forecasting. Journal of theAmerican Statistical Association, in press.
Craven, P. and G. Wahba (1979). Smoothing noisy data with spline functions: Es-timating the correct degree of smoothing by the method of generalized cross-validation. Numerische Mathematik 31, 377–403.
Cuevas, A., M. Febrero, and R. Fraiman (2002). Linear functional regression: Thecase of fixed design and functional response. Canadian Journal of Statistics 30,285–300.
de Boor, C. (2001). A Practical Guide to Splines, Revised Edition. New York:Springer.
Delsol, L., F. Ferraty, and P. Vieu (2008). Structural test in regression on functionalvariables. to appear.
Escabias, M., A. Aguilera, and M. J. Valderrama (2004). Principal component esti-mation of functional logistic regression: Discussion of two different approaches.Nonparametric Statistics 16, 365–384.
Eubank, R. L. (1999). Spline Smoothing and Nonparametric Regression, SecondEdition. New York: Marcel Dekker.
Fan, J. and I. Gijbels (1996). Local Polynomial Modelling and Its Applications.London: Chapman and Hall.
Ferraty, F. and P. Vieu (2001). The functional nonparametric model and its applica-tions to spectometric data. Computational Statistics 17, 545–564.
Fisher, N. I., T. L. Lewis, and B. J. J. Embleton (1987). Statistical Analysis ofSpherical Data. Cambridge: Cambridge University Press.
Gasser, T. and A. Kneip (1995). Searching for structure in curve samples. Journalof the American Statistical Association 90, 1179–1188.
Gervini, D. and T. Gasser (2004). Self–modeling warping functions. Journal of theRoyal Statistical Society, Series B 66, 959–971.
Hastie, T. and R. Tibshirani (1993). Varying-coefficient models. Journal of theRoyal Statistical Society, Series B 55, 757–796.
Hiebeler (2009). Matlab / R reference. http://www.math.umaine.edu/faculty/hiebeler/comp/matlabR.pdf, accessed 2009.02.06.
James, G., J. Wang, and J. Zhu (2009). Functional linear regression that’s inter-pretable. Annals of Statistics, in press.
James, G. M. (2002). Generalized linear models with functional predictors. Journalof the Royal Statistical Society, Series B 64, 411–432.
James, G. M. and T. Hastie (2001). Functional linear discriminant analysis forirregularly sampled curves. Journal of the Royal Statistical Society, Series B 63,533–550.
James, G. M., T. J. Hastie, and C. A. Sugar (2000). Principal component models forsparse functional data. Biometrika 87, 587–602.
James, G. M. and C. A. Sugar (2003). Clustering sparsely sampled functional data.Journal of the American Statistical Association 98, 397–408.
Jolliffe, I. T. (2002). Principal Components Analysis, Second Edition. New York:Springer.

References 201
Kneip, A. and T. Gasser (1992). Statistical tools to analyze data representing asample of curves. Annals of Statistics 20, 1266–1305.
Kneip, A. and J. O. Ramsay (2008). Combining registration and fitting for functionalmodels. Journal of the American Statistical Association 20, 1266–1305.
Kuznetsov, Y. A. (2004). Elements of Applied Bifurcation Theory. New York:Springer.
Liu, X. and H. G. Muller (2004). Functional convex averaging and synchronizationfor time-warped random curves. Journal of the American Statistical Associa-tion 99, 687–699.
Malfait, N. and J. O. Ramsay (2003). The historical functional linear model. Cana-dian Journal of Statistics 31, 115–128.
Muller, H.-G. and U. Stadtmuller (2005). Generalized functional linear models.Annals of Statistics 33, 774–805.
Olshen, R. A., E. N. Biden, M. P. Wyatt, and D. H. Sutherland (1989). Gait analysisand the bootstrap. Annals of Statistics 17, 1419–1440.
Pascual, M. and S. P. Ellner (2000). Linking ecological patterns to environmentalforcing via nonlinear time series models. Ecology 81(10), 2767–2780.
Ramsay, J. O., R. D. Bock, and T. Gasser (1995a). Comparison of height accel-eration curves in the Fels, Zurich, and Berkeley growth data. Annals of HumanBiology 22, 413–426.
Ramsay, J. O., G. Hooker, D. Campbell, and J. Cao (2007). Parameter estimation indifferential equations: A generalized smoothing approach. Journal of the RoyalStatistical Society, Series B 16, 741–796.
Ramsay, J. O. and B. W. Silverman (2005). Functional Data Analysis, Second Edi-tion. New York: Springer.
Ramsay, J. O., X. Wang, and R. Flanagan (1995b). A functional data analysis of thepinch force of human fingers. Applied Statistics 44, 17–30.
Rossi, N., X. Wang, and J. O. Ramsay (2002). Nonparametric item response func-tion estimates with the em algorithm. Journal of the Behavioral and EducationalSciences 27, 291–317.
Rupert, D., M. P. Wand, and R. J. Carroll (2003). Semiparametric Regression. Cam-bridge: Cambridge University Press.
Sakoe, H. and S. Chiba (1978). Dynamic programming algorithm optimization forspoken word recognition. IEEE Transactions, ASSP-26 1, 43–49.
Sarkar, D. (2008). lattice: Lattice Graphics. R package version 0.17-13.Schumaker, L. (1981). Spline Functions: Basic Theory. New York: Wiley.Silverman, B. W. (1986). Density Estimation for Statistics and Data Analysis. Lon-
don: Chapman and Hall.Simonoff, J. S. (1996). Smoothing Methods in Statistics. New York: Springer.Tuddenham, R. D. and M. M. Snyder (1954). Physical growth of California boys
and girls from birth to eighteen years. University of California Publications inChild Development 1, 183–364.
Varah, J. M. (1982). A spline least squares method for numerical parameter estima-tion in differential equations. SIAM Journal on Scientific Computing 3, 28–46.

202 References
Yao, F., H.-G. Muller, and J.-L. Wang (2005). Functional data analysis for longitu-dinal data. Annals of Statistics 33, 2873–2903.
Zwiefelhofer, D., J. H. Reynolds, and M. Keim (2008). Population trends andannual density estimates for select wintering seabird species on Kodiak Island,Alaska. Technical report, U.S. Fish and Wildlife Service, Kodiak NationalWildlife Refuge. Technical Report, no. 08-00x.
Index
., 22<-, 22=, 22[], 22, 23$, 22$fd suffix, 23
alignment, see registration, see registrationamplitude variation, 16, 118, 119, 125ANOVA
amplitude and phase, 125functional regression, 147
Applied Psychology Unit, 14argument names, 23argument passing, 23arithmetic, 48assessing fit, 77assignment operator, 22
B-spline, 35, 37, 44, 50, 52, 57, 152baby’s tibia data, 72bases, 45basis
B-spline, see B-splineconstant, see constant basisexponential, see exponential basisFourier, see Fourier basismonomial, see monomial basispolygonal, see polygonal basispower, see power basissmooth.basis, 80
basis, 42basis function coefficients, 30basis function expansion, 30basis function systems, 29basisfd, 42basisfd object, 29
Berkeley Growth Study, 1, 67, 73, 91, 119,166, 179, see growth data
bifd, 57biomechanics, 5, 13bivariate functional data object, 56boundary instability with splines, 38break points, 33bucket, 180
c(), 22c2rMap, 93Cambridge, 14Canadian Weather data, 103Canadian weather data, 10, 13, 17, 39, 46, 47,
52, 59, 67, 77, 83, 85, 94, 95, 99, 110,132, 134, 135, 139, 145, 147, 168
canonical correlation analysis, 17, 88, 99, 110cca.fd, 111, 114
CCA, see canonical correlation analysiscca.fd, 111, 114Chinese script, see handwritingclass, 24climate region, 147coefficients, 45compact support, 35concurrent linear model, see functional
regressionconcurvity, 155conditional covariance matrix, 87confidence intervals, 92, 95
derivatives, 92functional regression, 140
confidence intervals for concurrent model, seefnctional regression157
confidence limits for probe values, 95confidence regions, 83constant basis, 30, 39, 134, 137
203
204 Index
constant basis function, 30constrained smooth, 70constructor functions, 42container components, 41continuous registration, 122contour plot, 85correlated residuals, 78covariance function, 84create, 30create.fourier.basis, 32cross-covariance function, 85
data display, 14data interpolation, 12data registration, 117, see registrationdata representation, 12degree of a spline, 33degrees of freedom, 65density estimation, 9, 74density.fd, 74, 75Depression, 3deriv.fd, 56derivative, 13derivatives, see principal differential analysis,
see smoothinguse in FDA, 18
descriptive statistics, 16, 83diet effect, 150differential equation, 11, 64, 136, 179differential operator, see linear differential
operatordiscriminant, 181division, 49dynamics, 179
Edmonton, 10eigen.pda, 192eigenfunction, 99empirical orthogonal functions, 40, 101energy, 16, 88eval.bifd, 85exponential basis, 40exponentiation, 49
fd, 57fd object, see functional data object“fda” script, see handwritingfdevaluation, 49fdPar class, 78feature alignment, see registration: landmarkfit, 77fixed point, 183forcing function, 11Fourier basis, 32
Fourier basis functions, 30Fourier series, 13Fperm.fd, 145fRegress, see functional regression, 149,
169fRegress.CV, 173fRegress.stderr, 173functional basis object, 31
methods, 40functional contrast, 88functional data, 1, 39
class, 45fd, 45
functional data object, 45bivariate, 56labels, 46methods, 48
functional F-test, 168functional linear model, 17, see functional
regressionfunctional parameter, 9functional parameter object, 39, 66, 133, 134,
137, 148, 185, 188fdPar class, 78
functional principal components, see principalcomponents analysis
functional probe, 83, 87, 100functional regression, 17, see principal
differential analysis, see regressionanalysis
ANOVA, 147bivariate regression coefficient function,
162, 165concurrent linear model, 154confidence intervals, 140confidence intervals for concurrent model,
157fRegress, 169fRegress.CV, 173fRegress.stderr, 173functional response, 147integral, 162, 163linmod, 174plotbeta, 174principal components, 141roughness penalty, 135, 138, 153scalar response, 131set up, 132statistical tests, 143y2cMap, 141
functional t-Test, 166functions, 23, 45
gait data, 5, 12, 14, 39, 47, 99, 158

Index 205
gait data: model for knee angle, 158generalized cross-validation, 66generic functions, 25goodness of fit, 77goods index, 1, 3, 88growth data, 1, 13, 15, 38, 47, 59–62, 66, 67,
87, 88, 91, 104, 117, 119, 122, 166, 179,190, see Berkeley Growth Study
handwriting, 39Chinese, 7, 126, 162“fda” script, 7, 108, 187
harmonic acceleration, 12, 55, 136harmonic acceleration operator, 55, see linear
harmonic accelerationharmonic process, 88harmonics, 103“Hat” matrix, 65hazard rate, 163hip angle, 5, 158historical linear model, 163http://www.functionaldata.org,
see www.functionaldata.orghydrolics, 180
I-splines, 35index, 1, 3, 88inner product, 93inner product function, 93inprod, 93int2Lfd, 55interchild variability, 16interpolation, 12
kinetic energy, 89knee angle, 5, 158knot spacing, 37knots, 34Kodiak Island, 149Kronecker product, 158
labels for functional data objects, 46landmark, 118, 121, 123, 190landmarkreg, 127lattice package, 85leak, 180Lfd, 57, see linear differential operatorline continuation, 22line termination, 22linear differential equation, 194linear differential operator, 11, 18, 55, 65, 68,
94, 140, 185Lfd, 55
linear differential operators, 55
linear harmonic acceleration, 55, 56, 63, 64,139, see harmonic acceleration operator
linear mapping, 93linear model, see functional linear modellinmod, 174lip data, 185, 187list, 24list object, 23, 47log hazard rate, 163logical variables, 22
M-spline, 35manufacturing index, 1, 3, 88Matlab and R syntax, 21Matlab syntax, 21mean, 49mean.fd, 84mental test, 9methods, 25, 40, 48midpubertal age, 15midspurt, 2mollusk, 150monomial basis, 30, 39, 40monomial basis functions, 30monotone smooth, 71Montreal, 10, 52mortality, 163Motion Analysis Laboratory, 5multicollinearity, 155multivariate function, 45multivariate functional data, 5, 185, 187
nbasis, 31neurophysiology, 13Newton, 179nondurable goods index, 1, 3–5, 88–90nonfunctional data, 9nonurable goods cycle, 90normal equations, 156normalizing constant, 74number of spline basis function rule, 35numerical precision, 38
object, 24object-oriented programming, 24oil refinery data, 4, 6, 34order of a spline, 33order of spline rule, 36orthonormal, 101, 102
PCA, see principal components analysispca.fd, 103, 108pca.fd function, 113PDA, see principal differential analysis

206 Index
pda.fd, 191pda.overlay, 193penalized negative log likelihood, 74penalized sum of squares, see roughness
penaltyperiod, 21permutation tests, 165perspective plot, 85PGS, see pubertal growth spurtphase variation, 16, 118, 119, 125phase-plane plot, 15, 83, 88, 91, 159, 160pinch force data, 13pinchforce, 13plotbeta, 174pointwise confidence intervals, 92polygonal basis, 40polynomial functions, 30polynomial regression, 39positive smooth, 70potential energy, 89power basis, 40precipitation data, 12, 67, 71, 85, 94, 95, 99,
103, 110, 120, 132predict, 50pressure, 180Prince Rupert, 10, 95principal component scores, 102principal components
functional regression, 141principal components analysis, 3, 16, 17, 40,
88, 99, 133, 141pca.fd, 102, 113
principal differential analysis, 179eigen.pda, 192lip data, 185pda.fd, 185, 187, 191pda.overlay, 193registration, 190
probe score, 111probe weight, 110psychometrics, 9pubertal growth spurt, 2, 92, 117, 118,
120–122, 190
R syntax, 21rangeval, 31refinery, 4, 34region effect, 17, 147, 168register.fd, 128register.newfd, 193registration, 3, 13, 14, 117
continuous, 122landmark, 118, 121landmarkreg, 121, 127
principal differential analysis, 190register.fd, 122, 128register.newfd, 193
regression analysis, 51, see functionalregression, see smoothing
regression splines, 60regularization, 17residual covariance matrix, 87Resolute, 10rgl package, 85rotation matrix, 102roughness penalties, 62roughness penalty, 12
functional regression, 135, 138roughness penalty matrix, 64rounding errors, 38
scree plot, 102seabird data, 149seasonal variation, 88semicolon, 22Shelikof Strait, 149shellfish, 150singleton index, 24smooth
constrained, 70monotone, 71positive, 70
smoothing, 12, 55, 59density, 74functional parameter object, 66matrix, 65parameter, 66regression splines, 59roughness penalty, see roughness penaltysmooth.basis, 80
spline basis, 33spline basis functions, 30spline function, 36splines
regression, 59stability, 183statistical tests, see functional regression:
statistical tests“statistics” script, see handwriting: Chinesestd.fd, 84struct, 24struct array, 22subsec:datadisplay, 14subsec:rangeoft, 38sum, 49sum of B-splines, 37support of a spline, 35, 37surface plot, 85

Index 207
Swedish mortality data, 163syntax, 21
temperature, 10, 32, 45, 63, 87, 94, 99, 110,120, 132, 147, 168
test data, 9tests
F-test, 168Fperm.fd, 175permutation, 165t-test, 166tperm.fd, 176
tibia, 72time warping, see registrationtotal curvature, 63transect, 149tray 47, 4truncated power basis, 35
Uganik, 149
underscore, 21US nondurable goods manufacturing index, 1,
3, 88Uyak, 149
var.fd, 84variance-covariance surface, 84VARIMAX, 102varmx.pca.fd, 104, 108vec2Lfd, 56Vietnam War, 3
walking, see gait dataweb site, 19weight function, 87World War II, 3www.functionaldata.org, 19
y2cMap, 93, 141, see functional regressiony2rMap, 93
springer.com
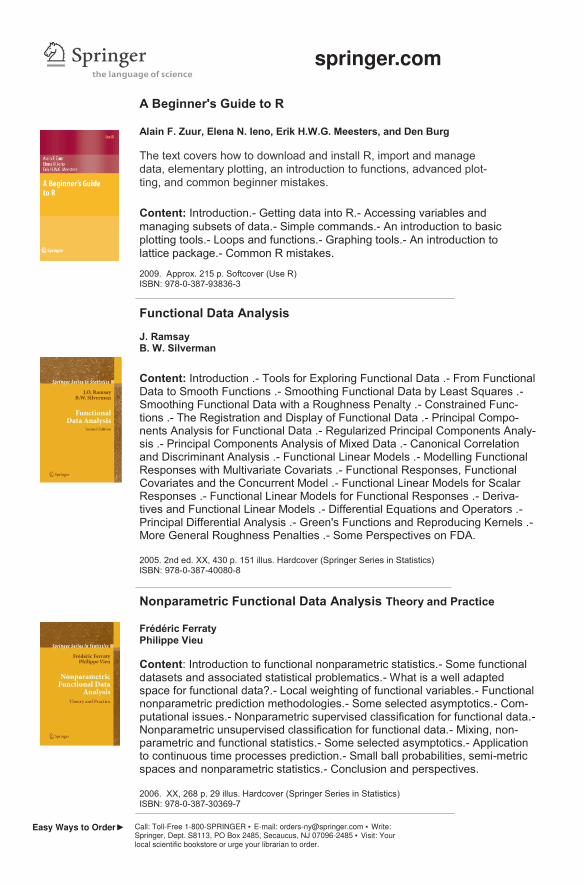
A Beginner's Guide to R
2009. Approx. 215 p. Softcover (Use R) ISBN: 978-0-387-93836-3
The text covers how to download and install R, import and manage
data, elementary plotting, an introduction to functions, advanced plot-
ting, and common beginner mistakes.
Content: Introduction.- Getting data into R.- Accessing variables and
managing subsets of data.- Simple commands.- An introduction to basic
plotting tools.- Loops and functions.- Graphing tools.- An introduction to
lattice package.- Common R mistakes.
Alain F. Zuur, Elena N. Ieno, Erik H.W.G. Meesters, and Den Burg
Content: Introduction .- Tools for Exploring Functional Data .- From Functional Data to Smooth Functions .- Smoothing Functional Data by Least Squares .- Smoothing Functional Data with a Roughness Penalty .- Constrained Func-tions .- The Registration and Display of Functional Data .- Principal Compo-nents Analysis for Functional Data .- Regularized Principal Components Analy-sis .- Principal Components Analysis of Mixed Data .- Canonical Correlation and Discriminant Analysis .- Functional Linear Models .- Modelling Functional Responses with Multivariate Covariats .- Functional Responses, Functional Covariates and the Concurrent Model .- Functional Linear Models for Scalar Responses .- Functional Linear Models for Functional Responses .- Deriva-tives and Functional Linear Models .- Differential Equations and Operators .- Principal Differential Analysis .- Green's Functions and Reproducing Kernels .- More General Roughness Penalties .- Some Perspectives on FDA.
2005. 2nd ed. XX, 430 p. 151 illus. Hardcover (Springer Series in Statistics) ISBN: 978-0-387-40080-8
J. Ramsay B. W. Silverman
Functional Data Analysis
Nonparametric Functional Data Analysis Theory and Practice Frédéric Ferraty Philippe Vieu
Content: Introduction to functional nonparametric statistics.- Some functional datasets and associated statistical problematics.- What is a well adapted space for functional data?.- Local weighting of functional variables.- Functional nonparametric prediction methodologies.- Some selected asymptotics.- Com-putational issues.- Nonparametric supervised classification for functional data.- Nonparametric unsupervised classification for functional data.- Mixing, non-parametric and functional statistics.- Some selected asymptotics.- Application to continuous time processes prediction.- Small ball probabilities, semi-metric spaces and nonparametric statistics.- Conclusion and perspectives. 2006. XX, 268 p. 29 illus. Hardcover (Springer Series in Statistics) ISBN: 978-0-387-30369-7
Easy Ways to Order► Call: Toll-Free 1-800-SPRINGER ▪ E-mail: [email protected] ▪ Write: Springer, Dept. S8113, PO Box 2485, Secaucus, NJ 07096-2485 ▪ Visit: Your local scientific bookstore or urge your librarian to order.
Related Documents