INCREASE IN SCALABILITY OF DWDM TRANSMISSION USING FORWARD ERROR CORRECTION By S.IMMANUEL (Reg.No:1026005) A PROJECT REPORT Submitted to the FACULTY OF INFORMATION AND COMMUNICATION ENGINEERING In partial fulfillment of the requirements For the award of the degree of MASTER OF ENGINEERING IN OPTICAL COMMUNICATION A.C. COLLEGE OF ENGINEERING AND TECHNOLOGY, KARAIKUDI-4. ANNA UNIVERSITY CHENNAI 600 025 MAY- 2012

Welcome message from author
This document is posted to help you gain knowledge. Please leave a comment to let me know what you think about it! Share it to your friends and learn new things together.
Transcript

INCREASE IN SCALABILITY OF DWDM TRANSMISSION USING
FORWARD ERROR CORRECTION
By
S.IMMANUEL
(Reg.No:1026005)
A PROJECT REPORT
Submitted to the
FACULTY OF INFORMATION AND COMMUNICATION ENGINEERING
In partial fulfillment of the requirements
For the award of the degree
of
MASTER OF ENGINEERING
IN
OPTICAL COMMUNICATION
A.C. COLLEGE OF ENGINEERING AND TECHNOLOGY,
KARAIKUDI-4.
ANNA UNIVERSITY
CHENNAI 600 025
MAY- 2012

ii
DECLARATION
I hereby declare that the work entitled “ INCREASE IN SCALABILITY
OF DWDM TRANSMISSION USING FORWARD ERROR CORRECTION” is
submitted in partial fulfillment of the requirement for the award of the degree in M.E.,
Anna University, Chennai- 600 025, is a record of the my own work carried out by me
during the academic year 2011 – 2012 under the supervision and guidance of
Dr.A.Sivanantha Raja, Associate Professor, Department of Electronics and
Communication Engineering, Alagappa Chettiar College of Engineering and Technology,
Karaikudi. The extent and source of information are derived from the existing literature
and have been indicated through the dissertation at the appropriate places. The matter
embodied in this work is original and has not been submitted for the award of any other
degree or diploma, either in this or any other University.
S.Immanuel
Reg. No.1026005
I certify that the declaration made above by the candidate is true
Dr.A.Sivanantha Raja,
Associate Professor,
Department of ECE

iii
BONAFIDE CERTIFICATE
Certified that this project report titled “INCREASE IN SCALABILITY OF
DWDM TRANSMISSION USING FORWARD ERROR CORRECTION” is the bonafide
work of Mr. S.IMMANUEL, Reg.No.1026005 who carried out the research under my
supervision. Certified further, that to the best of my knowledge the work reported herein
does not form part of any other project report or dissertation on the basis of which a degree
or award was conferred on an earlier occasion on this or any other candidate.
SIGNATURE
Dr. A.Sivanantha Raja
SUPERVISOR
Forwarded by
SIGNATURE
Prof.I.Muthumani M.E.,
HEAD OF THE DEPARTMENT
Examined on:
Internal Examiner External Examiner

iv
ABSTRACT
The scalability of spectrum sliced dense wavelength-division-multiplexing
(DWDM) transmission systems primarily intended for metro access applications. A
theoretical analysis elucidates the tradeoff between the loss budget and the sliced
bandwidth (i.e., the number of channels with assuming light sources with a fixed
bandwidth). Moreover, the use of forward error correction (FEC) to expand scalability is
studied. Based on the analysis, two spectrum-sliced DWDM transmission schemes are
introduced. One demonstrates 10-Gb/s, eight channel spectrum-sliced DWDM
transmission with the channel spacing of 200 GHz without FEC, and the other confirms
10-Gb/s, eight channel spectrum-sliced DWDM transmission with the channel spacing of
200 GHz with FEC. We have also conducted 100 GHZ Grid 40 Channel, 50 GHZ Grid 80
Channel, 25 GHZ Grid 160 Channel DWDM Transmission without FEC. We have also
conducted 100 GHZ Grid 40 Channel, 50 GHZ Grid 80 Channel, 25 GHZ Grid 160
Channel DWDM Transmission with FEC.

v
ACKNOWLEDGEMENT
I thank god for having gracefully blessed us to come up till now and thereby giving
strength and courage to complete the project successfully. I sincerely submit this project to
the almighty lotus feet.
With profound gratitude, respect and pride I express my sincere thanks to our
principal Dr.P.N.NEELAKANTAN, for his encouragement and keen interest shown in
my project.
It gives me great pleasure to express my sincere gratitude to Head of Department
Prof.I.MUTHUMANI, for her constant support and encouragement to me for completing
this project work.
I owe deep depth of gratitude to my beloved guide Dr.A.SIVANANTHA RAJA,
for his inspiration and guidance and lending all assistants and support at each and every
stage, which made me to complete this project in an efficient and successful manner.
I wish to thank Prof.K.KALAISELVI.,M.E., and Prof.R.SAROJINI.,M.E.,
Department of ECE and Mr.A.Vetrivel SDE(BSNL) for their suggestions and help during
this project period.
I happily acknowledge my family members and friends for their support lend to me
with which, I have completed this endeavor.

vi
CONTENTS
CHAPTER
NO.
TITLE PAGE
NO
.
1 INTRODUCTION 1
1.1 MOTIVATION FOR THE PROJECT 1
1.2 LITERATURE REVIEW
1
1.3 OPTICAL FIBERS
3
1.4 OPTICAL FIBER COMMUNICATION
4
1.5 PRINCIPLE OF OPERATION
5
1.6 INDEX OF REFRACTION
5
1.7 TYPES OF OPTICAL FIBERS
5
1.7.1 MULTI MODE FIBER
5
1.7.2 SINGLE MODE FIBER
7
1.8 MECHANISM OF ATTENUATION
8
1.9 TOTAL INTERNAL REFRACTION
9
1.10 TERMINATION AND SPLICING
9
2 WAVELENGTH DIVISION MULTIPLEXING 12
2.1 WDM SYSTEMS 12
2.2 COARSE WAVELENGTH DIVISION MULTIPLEXING
14
2.3 DENSE WAVELENGTH DIVISION MULTIPLEXING
15
3 FIBER USED IN DWDM 17
3.1 NONZERO DISPERSION SHIFTED FIBER (ITU-T G.655) 17
3.2 RECOMMENDATION G.655
17
4 DWDM SYSTEMS 19

vii
4.1 MANAGING THE DWDM NETWORK 21
4.1.1 WAVELENGTH CONVERTING TRANSPONDERS 21
4.1.2 MUXPONDER 23
4.1.3 RECONFIGURABLE ADD DROP MULTIPLEXER
(ROADM)
23
4.1.4 OPTICAL CROSS CONNECTS (OXCS) 23
5 PRACTICAL DWDM SYSTEM 24
5.1 DWDM SETUP 24
5.1.1 COMPONENTS IN DWDM
24
5.1.2 PROCEDURE FOR SETUP 25
6 FORWARD ERROR CORRECTION 26
6.1 TYPES OF FEC 26
6.1.1 LIST OF FEW ERROR CORRECTING CODES 27
6.2 FEC IN OPTICAL NETWORK 27
7 SPECTRUM SCLICED DWDM TRANSMISSION 29
7.1 CONFIGURATION OF TARGET SYSTEMS 29
7.2 THEORETICAL ANALYSIS 30
7.2.1 SCALABILITY: TRADEOFF BETWEEN LOSS BUDGET
AND CHANNEL SPACING
30
7.2.2 USE OF FEC FOR EXPANDING THE SCALABILITY 32
8 DWDM EXPERIMENTS 38
8.1 10-G SPECTRUM SCLICED DWDM TRANSMISSION USING
FEC
38
9 RESULTS, ANALYSIS AND DISCUSSIONS 40
10 CONCLUSION AND FUTURE SCOPE 47

viii
10.1 CONCLUSION 47
10.2 FUTURE SCOPE 47
REFERENCES 48
PUBLICATIONS 50

ix
LIST OF FIGURES
FIGURE
NO.
TITLE PAGE
NO.
1.1 PROPAGATION OF LIGHT THROUGH A MULTI-MODE OPTICAL
FIBER
5
1.2 STRUCTURE OF TYPICAL SINGLE MODE FIBER 7
1.3 LIGHT ATTENUATION BY ZBLAN AND SILICA FIBER 8
1.4 ST CONNECTORS ON MULTI MODE FIBER 10
2.1 CWDM BANDWIDTH 14
2.2 DWDM BANDWIDTH 16
3.1 1550 NM BAND PERFORMANCE 18
4.1 DWDM TRANSMISSION 20
5.1 DWDM SETUP 24
7.1 MODEL FOR THEORETICAL ANALYSIS 29
7.2 CALCULATED LOSS BUDGET TO ACHIEVE THE BER OF 1E-12
WITHOUT FEC (1.25 GB/S PER CHANNEL).
31
7.3 CALCULATED LOSS BUDGET TO ACHIEVE THE BER OF 1 ×
10−12 WITHOUT FEC (10 GB/S PER CHANNEL).
32
7.4 CALCULATED LOSS BUDGET TO ACHIEVE THE BER OF 1E−12
WITH FEC (10 GB/S PER CHANNEL).
33
7.5 EXPANSION OF SCALABILITY PERMITTED BY USING FEC. 34
7.6 EXPERIMENTAL SETUP FOR CONFIRMING THE RESULTS OF
THEORETICAL ANALYSIS.
35
7.7 BER CHARACTERISTICS WHEN SLICED BANDWIDTH IS 130/200
GHZ.
36
8.1(1) EXPERIMENTAL SETUP FOR 10 G × EIGHT CH DWDM
TRANSMISSION;
38
8.1(2) MEASURED OPTICAL SPECTRUM AFTER MULTIPLEXING. 38
9.1 BER CHARACTERISTICS OF 10 GB/S EIGHT CHANNEL DWDM 40

x
TRANSMISSION WITHOUT FEC.
9.2 BER CHARACTERISTICS OF 10 GB/S EIGHT CHANNEL DWDM
TRANSMISSION WITH FEC.
41
9.3 BER CHARACTERISTICS OF 40 CHANNEL 100GHZ SPACING
DWDM TRANSMISSION WITHOUT FEC.
42
9.4 BER CHARACTERISTICS OF 40 CHANNEL 100GHZ SPACING
DWDM TRANSMISSION WITH FEC
42
9.5 BER CHARACTERISTICS OF 80 CHANNEL 50GHZ SPACING
DWDM TRANSMISSION WITHOUT FEC
43
9.6 BER CHARACTERISTICS OF 80 CHANNEL 50GHZ SPACING
DWDM TRANSMISSION WITH FEC
44
9.7 BER CHARACTERISTICS OF 160 CHANNEL 25GHZ SPACING
DWDM TRANSMISSION WITHOUT FEC
44
9.8 BER CHARACTERISTICS OF 160 CHANNEL 25GHZ SPACING
DWDM TRANSMISSION WITH FEC
45

xi
LIST OF TABLES
TABLE
NO.
TITLE PAGE
NO.
1.1 SIZE OF DIFFERENT MEDIUM 8
9.1 BER VALUES OF VARIOUS DWDM TRANSMISSION SYSTEM 46
CHAPTER 1
INTRODUCTION
1.1 MOTIVATION FOR THE PROJECT
Network operators project a long term trend of traffic growth at a rate of over 75%
per year, which in turn requires the capacity to be doubled approximately every 12-18
months. Given the current network traffic load and growth rate of the operators, there
exists an urgent need to increase the network capacity through improvements in spectral
efficiency. This can be accomplished by launching 100Gb/s per channel instead of 10Gb/s
over 50GHz spaced channels.
One of the most cost effective architectures is to deploy 100Gb/s systems utilizing
existing 10Gb/s infrastructure. Long distance DWDM communication systems are
typically limited by optical signal-to-noise ratio (OSNR). Unfortunately, a straight forward
10x increase in the data rate over an existing channel results in a 10x reduction in OSNR.
Closing this significant performance gap between the two systems requires a 10x
improvement in OSNR for 100Gb/s implementations. There are several techniques that can
be used to reduce the OSNR deficit such as through DP-QPSK modulation in conjunction
with a coherent receiver. However, even after taking advantage of all these techniques, a
significant OSNR deficit remains. The OSNR gap must be closed in order to achieve the
objective of transmitting 100Gb/s over existing 10Gb/s infrastructure. Among the available
technologies to further improve the OSNR deficit, Forward Error Correction (FEC) is
commonly considered as an attractive cost-effective candidate to recover the lost
sensitivity due to the transition to higher data rates.
1.2 LITERATURE REVIEW
Development of “ INCREASE IN SCALABILITY OF DWDM
TRANSMISSION USING FORWARD ERROR CORRECTION” was carried out
according to the Literature Survey Performed as given below
Takashi Mitsui, Kazutaka Hara, Masamichi Fujiwara, Jun-ichi Kani Masashi
Tadokoro,Naoto Yoshimoto, and Hisaya Hadama have showed that the sensitivity
was improved by -31.5 dB m and the loss budget was obtained about 20 dB at a sliced
1

bandwidth of 400 GHz by using FEC even if assuming a light source of 0 dB m output
power[1].
S. Kaneko et al have showed that FEC increases not only the loss budget to
match those of normal WDM systems, but also the number of available channels, which is
a feature not possible in normal WDM systems[2].
Spectral grids for WDM applications: DWDM frequency grid,‖ ITU-T
Recommendation G.694.1, K. Fukuchi, T. Kasamatsu, M. Morie, R. Ohhira, T. Ito,
K. Sekiya, D. Ogasahara, and T. Ono, R. D. Feldman, E. E. Harstead, S. Jiang, T. H.
Wood, and M. Zirngibl, K. Iwatsuki, J. Kani, H. Suzuki, and M. Fujiwara, have
showed that Dense wavelength-division-multiplexing (DWDM) [3] is the key technology
to increase the capacity of optical fiber transmission, and so has been widely deployed to
core networks to cope with the increasing demand to transfer huge loads such as Internet
traffic. As the next step, while further increases in capacity (e.g., over 10 Tb/s) have been
pursued [4],several attempts have been made to apply DWDM to access networks [5], [6].
J. S. Lee, Y. C. Chung, and D. J. DiGiovanni, have proposed that The most
important issue in DWDM access networks is to decrease the burden of
operating/administrating ―wavelengths,‖ which may be assigned differently to each user
or each user group in the access networks [7].
J. S. Lee, Y. C. Chung, and D. J. DiGiovanni, K. Akimoto, J. Kani, M.
Teshima, and K. Iwatsuki, J. H. Han, S. J. Kim, and J. S. Lee, S. J. Kim, J. H. Han, J.
S. Lee, and C. S. Park, K. H. Han, E. S. Son, H. Y. Choi, K. W. Lim, and Y. C.
Chung, have showed that The spectrum-sliced wavelength division multiplexing (WDM) scheme has
been proposed as one of the approaches to address this issue [7]–[11].
J.S. Lee, Y. C. Chung, and D. J. DiGiovanni, have showed that a particular
noise factor in the spectrum-sliced scheme is the signal-signal beat noise; the signal-to-
noise ratio (SNR) can be expressed as being proportional to the ratio of data rate to sliced
bandwidth [7].
J. H. Han, S. J. Kim, and J. S. Lee, S. J. Kim, J. H. Han, J. S. Lee, and C. S.
Park, have showed that 2.5-Gb/s spectrum-sliced transmission in which the bandwidth
2
was broadened through intra channel four-wave mixing in a nonlinear fiber at the receiver
[9] or a gain saturated semiconductor optical amplifier (SOA) at the transmitter [10].
K. H. Han, E. S. Son, H. Y. Choi, K. W. Lim, and Y. C. Chung, have showed
that the increase in scalability offered by forward error correction (FEC) is detailed. An
attempt to increase the loss budget by implementing FEC to spectrum-sliced WDM
systems was reported in [11].
1.3 OPTICAL FIBERS
An optical fiber is a thin, flexible, transparent fiber that acts as a waveguide, or
"light pipe", to transmit light between the two ends of the fiber. The field of applied
science and engineering concerned with the design and application of optical fibers is
known as fiber optics. Optical fibers are widely used in Fiber Optic Communications,
which permits transmission over longer distances and at higher bnadwidths (data rates)
than other forms of communication. Fibers are used instead of metal wires because signals
travel along them with less loss and are also immune to electromagnetic interference.
Fibers are also used for illumination, and are wrapped in bundles so they can be used to
carry images, thus allowing viewing in tight spaces. Specially designed fibers are used for
a variety of other applications, including sensors and fiber lasers.
Optical fiber typically consists of a transparent core surrounded by a transparent
cladding material with a lower index of refraction. Light is kept in the core by total internal
refraction. This causes the fiber to act as a waveguide. Fibers which support many
propagation paths or transverse modes are called multi mode fibers ,while those which can
only support a single mode are called single mode fibers. Multi-mode fibers generally have
a larger core diameter, and are used for short-distance communication links and for
applications where high power must be transmitted. Single-mode fibers are used for most
communication links longer than 1,050 meters. Joining lengths of optical fiber is more
complex than joining electrical wire or cable. The ends of the fibers must be carefully
cleaved, and then spliced together either mechanically or by fusing them together with
heat. Special optical fiber connectors are used to make removable connections.
3

1.4 OPTICAL FIBER COMMUNICATION
Optical fiber can be used as a medium for telecommunication and networking
because it is flexible and can be bundled as cables. It is especially advantageous for long-
distance communications, because light propagates through the fiber with little attenuation
compared to electrical cables. This allows long distances to be spanned with few repeaters.
Additionally, the per-channel light signals propagating in the fiber have been modulated at
rates as high as 111 gigabits per second by NTT, although 10 or 40 Gbit/s is typical in
deployed systems. Each fiber can carry many independent channels, each using a different
wavelength of light (Wavelength Division Multiplexing (WDM)). The net data rate (data
rate without overhead bytes) per fiber is the per-channel data rate reduced by the FEC
overhead, multiplied by the number of channels (usually up to eighty in commercial dense
WDM systems as of 2008). The current laboratory fiber optic data rate record, held by Bell
Labs in Villarceaux, France, is multiplexing 155 channels, each carrying 100 Gbit/s over a
7000 km fiber. Nippon Telegraph and Telephone Corporation have also managed 69.1
Tbit/s over a single 240 km fiber (multiplexing 432 channels, equating to 171 Gbit/s per
channel). Bell Labs also broke a 100 Petabit per second kilometer barrier (15.5 Tbit/s over
a single 7000 km fiber)
For short distance applications, such as creating a network within an office
building, fiber-optic cabling can be used to save space in cable ducts. This is because a
single fiber can often carry much more data than many electrical cables, such as 4 pair cat-
5 Ethernet cabling. Fiber is also immune to electrical interference; there is no cross-talk
between signals in different cables and no pickup of environmental noise. Non-armored
fiber cables do not conduct electricity, which makes fiber a good solution for protecting
communications equipment located in high voltage environments such as power generation
facilities, or metal communication structures prone to lightning strikes. They can also be
used in environments where explosive fumes are present, without danger of ignition.
Wiretapping is more difficult compared to electrical connections, and there are concentric
dual core fibers that are said to be tap-proof.
4

1.5 PRINCIPLE OF OPERATION
An optical fiber is a cylindrical dielectric waveguide (non-conducting waveguide)
that transmits light along its axis, by the process of total internal reflection. The fiber
consists of a core surrounded by a cladding layer, both of which are made of dielectric
materials. To confine the optical signal in the core, the refractive index of the core must be
greater than that of the cladding. The boundary between the core and cladding may either
be abrupt, in step-index fiber, or gradual, in graded-index fiber.
1.6 INDEX OF REFRACTION
The index of refraction is a way of measuring the speed of light in a material. Light
travels fastest in a vacuum, such as outer space. The speed of light in a vacuum is about
300,000 kilometers (186 thousand miles) per second. Index of refraction is calculated by
dividing the speed of light in a vacuum by the speed of light in some other medium. The
index of refraction of a vacuum is therefore 1, by definition. The typical value for the
cladding of an optical fiber is 1.46. The core value is typically 1.48. The larger the index of
refraction, the slower light travels in that medium. From this information, a good rule of
thumb is that signal using optical fiber for communication will travel at around 200 million
meters per second. Or to put it another way, to travel 1000 kilometers in fiber, the signal
will take 5 milliseconds to propagate. Thus a phone call carried by fiber between Sydney
and New York, a 12000 kilometer distance, means that there is an absolute minimum delay
of 60 milliseconds (or around 1/16 of a second) between when one caller speaks to when
the other hears.
1.7 TYPES OF OPTICAL FIBERS
1.7.1 Multimode Fiber
Fig 1.1 Propagation of light through a multi-mode optical fiber
5
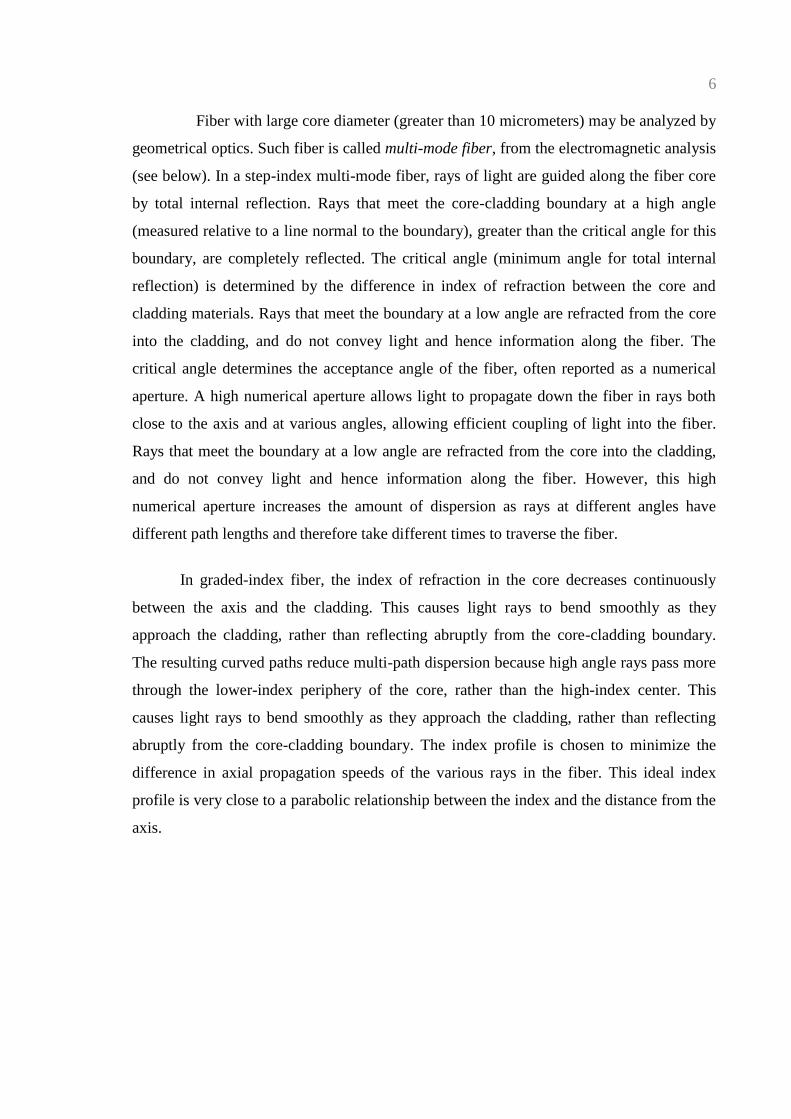
Fiber with large core diameter (greater than 10 micrometers) may be analyzed by
geometrical optics. Such fiber is called multi-mode fiber, from the electromagnetic analysis
(see below). In a step-index multi-mode fiber, rays of light are guided along the fiber core
by total internal reflection. Rays that meet the core-cladding boundary at a high angle
(measured relative to a line normal to the boundary), greater than the critical angle for this
boundary, are completely reflected. The critical angle (minimum angle for total internal
reflection) is determined by the difference in index of refraction between the core and
cladding materials. Rays that meet the boundary at a low angle are refracted from the core
into the cladding, and do not convey light and hence information along the fiber. The
critical angle determines the acceptance angle of the fiber, often reported as a numerical
aperture. A high numerical aperture allows light to propagate down the fiber in rays both
close to the axis and at various angles, allowing efficient coupling of light into the fiber.
Rays that meet the boundary at a low angle are refracted from the core into the cladding,
and do not convey light and hence information along the fiber. However, this high
numerical aperture increases the amount of dispersion as rays at different angles have
different path lengths and therefore take different times to traverse the fiber.
In graded-index fiber, the index of refraction in the core decreases continuously
between the axis and the cladding. This causes light rays to bend smoothly as they
approach the cladding, rather than reflecting abruptly from the core-cladding boundary.
The resulting curved paths reduce multi-path dispersion because high angle rays pass more
through the lower-index periphery of the core, rather than the high-index center. This
causes light rays to bend smoothly as they approach the cladding, rather than reflecting
abruptly from the core-cladding boundary. The index profile is chosen to minimize the
difference in axial propagation speeds of the various rays in the fiber. This ideal index
profile is very close to a parabolic relationship between the index and the distance from the
axis.
6

1.7.2 Single Mode Fiber
Fig 1.2 Structure of Typical Single Mode Fiber
Fiber with a core diameter less than about ten times the wavelength of the
propagating light cannot be modeled using geometric optics. Instead, it must be analyzed
as an electromagnetic structure, by solution of Maxwell's equations as reduced to the
electromagnetic wave equation. The electromagnetic analysis may also be required to
understand behaviors such as speckle that occur when coherent light propagates in multi-
mode fiber. As an optical waveguide, the fiber supports one or more confined transverse
modes by which light can propagate along the fiber. Fiber supporting only one mode is
called single-mode or mono-mode fiber. The behavior of larger-core multi-mode fiber can
also be modeled using the wave equation, which shows that such fiber supports more than
one mode of propagation (hence the name). The results of such modeling of multi-mode
fiber approximately agree with the predictions of geometric optics, if the fiber core is large
enough to support more than a few modes.
The waveguide analysis shows that the light energy in the fiber is not completely
confined in the core. Instead, especially in single-mode fibers, a significant fraction of the
energy in the bound mode travels in the cladding as an evanescent wave.
The most common type of single-mode fiber has a core diameter of 8–10
micrometers and is designed for use in the near infrared. The mode structure depends on
the wavelength of the light used, so that this fiber actually supports a small number of
additional modes at visible wavelengths. Multi-mode fiber, by comparison, is
7

manufactured with core diameters as small as 50 micrometers and as large as hundreds of
micrometers. The normalized frequency V for this fiber should be less than the first zero of
the Bessel functionJ0 (approximately 2.405).
TABLE 1.1
Size of Different Medium
S.No. Medium Diameter
1 Core 8 µm
2 Cladding 125 µm
3 Buffer 250 µm
4 Jacket 400 µm
1.8 MECHANISM OF ATTENUATION
Fig 1.3 Light attenuation by ZBLAN and silica fibers
Attenuation in fiber optics, also known as transmission loss, is the reduction in
intensity of the light beam (or signal) with respect to distance traveled through a
transmission medium. Attenuation coefficients in fiber optics usually use units of dB/km
8

through the medium due to the relatively high quality of transparency of modern optical
transmission media. The medium is usually a fiber of silica glass that confines the incident
light beam to the inside. Attenuation is an important factor limiting the transmission of a
digital signal across large distances. Thus, much research has gone into both limiting the
attenuation and maximizing the amplification of the optical signal. Empirical research has
shown that attenuation in optical fiber is caused primarily by both scattering and
absorption.
1.9 TOTAL INTERNAL REFRACTION
When light traveling in a dense medium hits a boundary at a steep angle (larger
than the "critical angle" for the boundary), the light will be completely reflected. This
effect is used in optical fibers to confine light in the core. Light travels along the fiber
bouncing back and forth off of the boundary. Because the light must strike the boundary
with an angle greater than the critical angle, only light that enters the fiber within a certain
range of angles can travel down the fiber without leaking out. This range of angles is called
the acceptance cone of the fiber. The size of this acceptance cone is a function of the
refractive index difference between the fiber's core and cladding.
In simpler terms, there is a maximum angle from the fiber axis at which light may
enter the fiber so that it will propagate, or travel, in the core of the fiber. The sine of this
maximum angle is the numerical aperture (NA) of the fiber. Fiber with a larger NA
requires less precision to splice and work with than fiber with a smaller NA. Single-mode
fiber has a small NA.
1.10 TERMINATION AND SPLICING
Optical fibers are connected to terminal equipment by optical fiber connectors.
These connectors are usually of a standard type such as FC, SC, ST, LC, or MTRJ.
9

Fig 1.4 ST Connectors on Multi Mode Fiber
Optical fibers may be connected to each other by connectors or by splicing, that is,
joining two fibers together to form a continuous optical waveguide. The generally accepted
splicing method is arc fusion splicing, which melts the fiber ends together with an electric
arc. For quicker fastening jobs, a "mechanical splice" is used.
Fibers are terminated in connectors so that the fiber end is held at the end face
precisely and securely. A fiber-optic connector is basically a rigid cylindrical barrel
surrounded by a sleeve that holds the barrel in its mating socket. The mating mechanism
can be "push and click", "turn and latch" ("bayonet"), or screw-in (threaded). A typical
connector is installed by preparing the fiber end and inserting it into the rear of the
connector body. Quick-set adhesive is usually used so the fiber is held securely, and a
strain relief is secured to the rear. Once the adhesive has set, the fiber's end is polished to a
mirror finish. Various polish profiles are used, depending on the type of fiber and the
application. For single-mode fiber, the fiber ends are typically polished with a slight
curvature, such that when the connectors are mated the fibers touch only at their cores.
This is known as a "physical contact" (PC) polish. The curved surface may be polished at
an angle, to make an "angled physical contact" (APC) connection. Such connections have
higher loss than PC connections, but greatly reduced back reflection, because light that
10

reflects from the angled surface leaks out of the fiber core; the resulting loss in signal
strength is known as gap loss. APC fiber ends have low back reflection even when
disconnected.
11
CHAPTER 2
WAVELENGTH DIVISION MULTIPLEXING
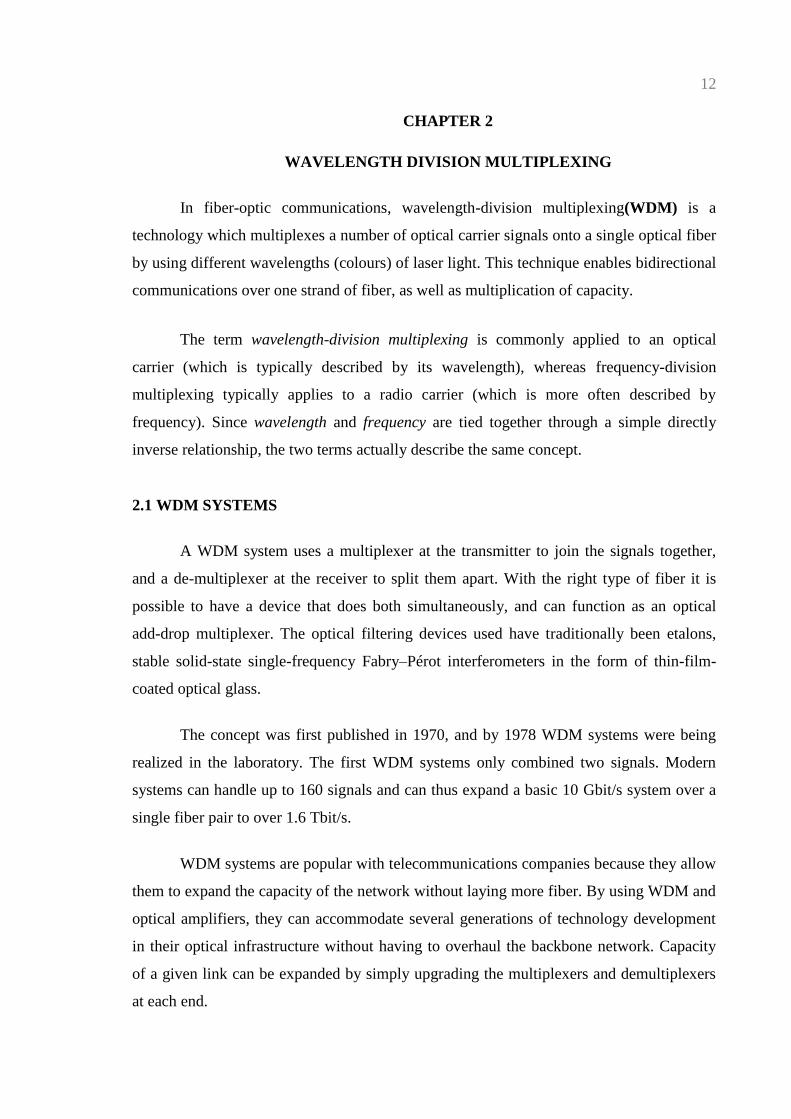
In fiber-optic communications, wavelength-division multiplexing(WDM) is a
technology which multiplexes a number of optical carrier signals onto a single optical fiber
by using different wavelengths (colours) of laser light. This technique enables bidirectional
communications over one strand of fiber, as well as multiplication of capacity.
The term wavelength-division multiplexing is commonly applied to an optical
carrier (which is typically described by its wavelength), whereas frequency-division
multiplexing typically applies to a radio carrier (which is more often described by
frequency). Since wavelength and frequency are tied together through a simple directly
inverse relationship, the two terms actually describe the same concept.
2.1 WDM SYSTEMS
A WDM system uses a multiplexer at the transmitter to join the signals together,
and a de-multiplexer at the receiver to split them apart. With the right type of fiber it is
possible to have a device that does both simultaneously, and can function as an optical
add-drop multiplexer. The optical filtering devices used have traditionally been etalons,
stable solid-state single-frequency Fabry–Pérot interferometers in the form of thin-film-
coated optical glass.
The concept was first published in 1970, and by 1978 WDM systems were being
realized in the laboratory. The first WDM systems only combined two signals. Modern
systems can handle up to 160 signals and can thus expand a basic 10 Gbit/s system over a
single fiber pair to over 1.6 Tbit/s.
WDM systems are popular with telecommunications companies because they allow
them to expand the capacity of the network without laying more fiber. By using WDM and
optical amplifiers, they can accommodate several generations of technology development
in their optical infrastructure without having to overhaul the backbone network. Capacity
of a given link can be expanded by simply upgrading the multiplexers and demultiplexers
at each end.
12

This is often done by using optical-to-electrical-to-optical (O/E/O) translation at the
very edge of the transport network, thus permitting interoperation with existing equipment
with optical interfaces.
Most WDM systems operate on single-mode fiber optical cables, which have a core
diameter of 9 µm. Certain forms of WDM can also be used in multi-mode fiber cables
(also known as premises cables) which have core diameters of 50 or 62.5 µm.
Early WDM systems were expensive and complicated to run. However, recent
standardization and better understanding of the dynamics of WDM systems have made
WDM less expensive to deploy.
Optical receivers, in contrast to laser sources, tend to be wideband devices.
Therefore the de-multiplexer must provide the wavelength selectivity of the receiver in the
WDM system.
WDM systems are divided in different wavelength patterns, conventional or coarse
and dense WDM. Conventional WDM systems provide up to 8 channels in the 3rd
transmission window (C-Band) of silica fibers around 1550 nm. Dense wavelength
division multiplexing (DWDM) uses the same transmission window but with denser
channel spacing. Channel plans vary, but a typical system would use 40 channels at
100 GHz spacing or 80 channels with 50 GHz spacing. Some technologies are capable of
25 GHz spacing (sometimes called ultra-dense WDM). New amplification options (Raman
amplification) enable the extension of the usable wavelengths to the L-band, more or less
doubling these numbers.
Coarse wavelength division multiplexing (CWDM) in contrast to conventional
WDM and DWDM uses increased channel spacing to allow less sophisticated and thus
cheaper transceiver designs. To again provide 8 channels on a single fiber CWDM uses the
entire frequency band between second and third transmission window (1310/1550 nm
respectively) including both windows (minimum dispersion window and minimum
attenuation window) but also the critical area where OH scattering may occur,
recommending the use of OH-free silica fibers in case the wavelengths between second
and third transmission window shall also be used. Avoiding this region, the channels 31,
49, 51, 53, 55, 57, 59, 61 remain and these are the most commonly used.
13

WDM, DWDM and CWDM are based on the same concept of using multiple
wavelengths of light on a single fiber, but differ in the spacing of the wavelengths, number
of channels, and the ability to amplify the multiplexed signals in the optical space. EDFA
provide an efficient wideband amplification for the C-band, Raman amplification adds a
mechanism for amplification in the L-band. For CWDM wideband optical amplification is
not available, limiting the optical spans to several tens of kilometers.
2.2 COARSE WAVELENGTH DIVISION MULTPLEXING
Originally, the term "coarse wavelength division multiplexing" was fairly generic,
and meant a number of different things. In general, these things shared the fact that the
choice of channel spacings and frequency stability was such that erbium doped fiber
amplifiers (EDFAs) could not be utilized. Prior to the relatively recent ITU standardization
of the term, one common meaning for coarse WDM meant two (or possibly more) signals
multiplexed onto a single fiber, where one signal was in the 1550 nm band, and the other in
the 1310 nm band
.
Fig 2.1 CWDM Bandwidth
In 2002 the ITU standardized a channel spacing grid for use with CWDM (ITU-T
G.694.2), using the wavelengths from 1270 nm through 1610 nm with a channel spacing of
20 nm. (G.694.2 was revised in 2003 to shift the actual channel centers by 1, so that strictly
speaking the center wavelengths are 1271 to 1611 nm.) Many CWDM wavelengths below
14

1470 nm are considered "unusable" on older G.652 specification fibers, due to the
increased attenuation in the 1270–1470 nm bands. Newer fibers which conform to the
G.652.C and G.652.D standards, such as Corning SMF-28e and Samsung Widepass nearly
eliminate the "water peak" attenuation peak and allow for full operation of all 20 ITU
CWDM channels in metropolitan networksTheEthernetLX-4 10 Gbit/s physical layer
standard is an example of a CWDM system in which four wavelengths near 1310 nm, each
carrying a 3.125 gigabit-per-second (Gbit/s) data stream, are used to carry 10 Gbit/s of
aggregate data.
The main characteristic of the recent ITU CWDM standard is that the signals are
not spaced appropriately for amplification by EDFAs. This therefore limits the total
CWDM optical span to somewhere near 60 km for a 2.5 Gbit/s signal, which is suitable for
use in metropolitan applications. The relaxed optical frequency stabilization requirements
allow the associated costs of CWDM to approach those of non-WDM optical components.
CWDM is also being used in cable television networks, where different
wavelengths are used for the downstream and upstream signals. In these systems, the
wavelengths used are often widely separated, for example the downstream signal might be
at 1310 nm while the upstream signal is at 1550 nm.
2.3 DENSE WAVELENGTH DIVISION MULTPLEXING
The EDFAs cost is thus leveraged across as many Dense wavelength division
multiplexing, or DWDM for short, refers originally to optical signals multiplexed within
the 1550 nm band so as to leverage the capabilities (and cost) of erbium doped fiber
amplifiers (EDFAs), which are effective for wavelengths between approximately 1525–
1565 nm (C band), or 1570–1610 nm (L band). EDFAs were originally developed to
replace SONET/SDH optical-electrical-optical (OEO) regenerators, which they have made
practically obsolete. EDFAs can amplify any optical signal in their operating range,
regardless of the modulated bit rate.
15
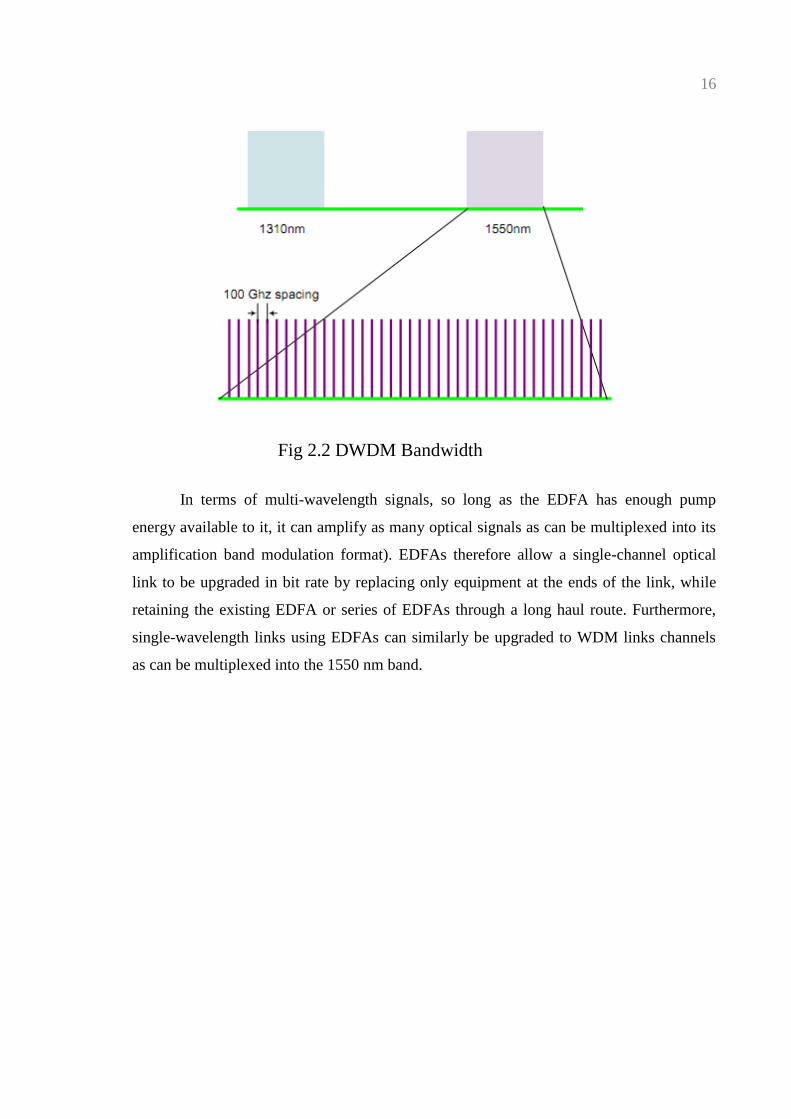
Fig 2.2 DWDM Bandwidth
In terms of multi-wavelength signals, so long as the EDFA has enough pump
energy available to it, it can amplify as many optical signals as can be multiplexed into its
amplification band modulation format). EDFAs therefore allow a single-channel optical
link to be upgraded in bit rate by replacing only equipment at the ends of the link, while
retaining the existing EDFA or series of EDFAs through a long haul route. Furthermore,
single-wavelength links using EDFAs can similarly be upgraded to WDM links channels
as can be multiplexed into the 1550 nm band.
16

CHAPTER 3
FIBERS USED IN DWDM
3.1 NONZERO DISPERSION SHIFTED FIBER (ITU-T G.655)
Using nonzero dispersion-shifted fiber (NZDSF) can mitigate nonlinear
characteristics. NZDSF fiber overcomes these effects by moving the zero-dispersion
wavelength outside the 1550-nm operating window. The practical effect of this is to have a
small but finite amount of chromatic dispersion at 1550 nm, which minimizes nonlinear
effects, such as FWM, SPM, and XPM, which are seen in the dense wavelength-division
multiplexed (DWDM) systems without the need for costly dispersion compensation. There
are two fiber families called nonzero dispersion (NZD+ and NZD–), in which the zero-
dispersion value falls before and after the 1550-nm wavelength, respectively. The typical
chromatic dispersion for G.655 fiber at 1550 nm is 4.5 ps/nm-km. The attenuation
parameter for G.655 fiber is typically 0.2 dB/km at 1550 nm, and the PMD parameter is
less than 0.1ps/km. The Corning LEAF fiber is an example of an enhanced G.655 fiber
(shown in fig.) with a 32 percent larger effective area
3.2 RECOMMENDATION G.655
The correlation of the measured values of lc, lcc, and lcj depends on the specific
fiber and cable design and the test conditions. While in general, lcc<lcj<lc, a general
quantitative relationship cannot be easily established. The importance of ensuring single-
mode transmission in the minimum cable length between joints at the minimum operating
wavelength is paramount. This may be performed by recommending the maximum cable
cut-off wavelength lcc of a cabled single-mode fiber to be 1480 nm, or for typical jumpers
by recommending a maximum jumper cable cut-off to be 1480 nm, or for worst case
length and bends by recommending a maximum fiber cut-off wavelength to be 1470 nm.
17
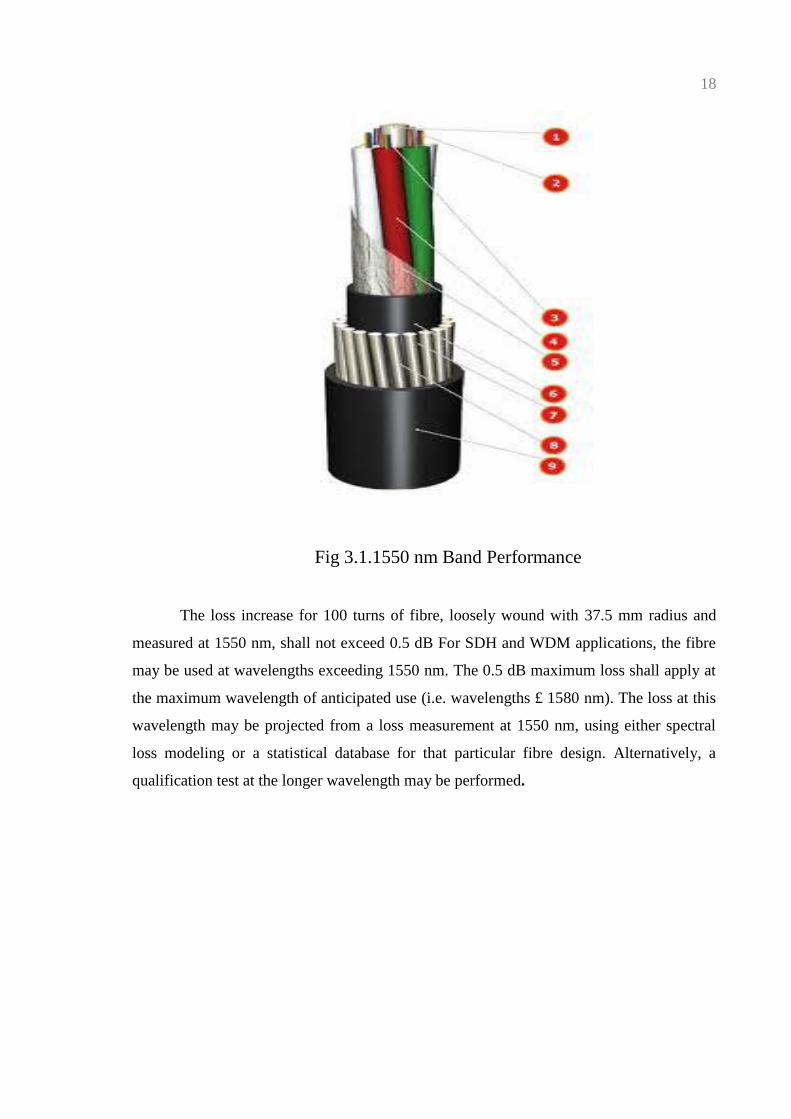
Fig 3.1.1550 nm Band Performance
The loss increase for 100 turns of fibre, loosely wound with 37.5 mm radius and
measured at 1550 nm, shall not exceed 0.5 dB For SDH and WDM applications, the fibre
may be used at wavelengths exceeding 1550 nm. The 0.5 dB maximum loss shall apply at
the maximum wavelength of anticipated use (i.e. wavelengths £ 1580 nm). The loss at this
wavelength may be projected from a loss measurement at 1550 nm, using either spectral
loss modeling or a statistical database for that particular fibre design. Alternatively, a
qualification test at the longer wavelength may be performed.
18
CHAPTER 4
DWDM SYSTEMS
At this stage, a basic DWDM system contains several main
components:
1. A DWDM terminal multiplexer. The terminal multiplexer actually contains one
wavelength converting transponder for each wavelength signal it will carry. The
wavelength converting transponders receive the input optical signal (i.e., from a
client-layer SONET/SDH or other signal), convert that signal into the electrical
domain, and retransmit the signal using a 1550 nm band laser. (Early DWDM
systems contained 4 or 8 wavelength converting transponders in the mid-1990s. By
2000 or so, commercial systems capable of carrying 128 signals were available.)
The terminal mux also contains an optical multiplexer, which takes the various
1550 nm band signals and places them onto a single fiber (e.g. SMF-28 fiber). The
terminal multiplexer may or may not also support a local EDFA for power
amplification of the multi-wavelength optical signal.
2. An intermediate line repeater is placed approx. every 80 – 100 km for
compensating the loss in optical power, while the signal travels along the fiber. The
signal is amplified by an EDFA, which usually consists of several amplifier stages.
3. An intermediate optical terminal or optical add-drop multiplexer. This is a
remote amplification site that amplifies the multi-wavelength signal that may have
traversed up to 140 km or more before reaching the remote site. Optical diagnostics
and telemetry are often extracted or inserted at such a site, to allow for localization
of any fiber breaks or signal impairments. In more sophisticated systems (which are
no longer point-to-point), several signals out of the multiwavelength signal may be
removed and dropped locally.
4. A DWDM terminal de-multiplexer. The terminal de-multiplexer breaks the multi-
wavelength signal back into individual signals and outputs them on separate fibers
for client-layer systems (such as SONET/SDH) to detect. However, in order to
allow for transmission to remote client-layer systems (and to allow for digital
domain signal integrity determination) such de-multiplexed signals are usually sent
to O/E/O output transponders prior to being relayed to their client-layer systems.
19
Often, the functionality of output transponder has been integrated into that of input
transponder, so that most commercial systems have transponders that support bi-
directional interfaces on both their 1550-nm (i.e., internal) side, and external (i.e.,
client-facing) side. Transponders in some systems supporting 40 GHz nominal
operation may also perform forward error correction (FEC) via 'digital wrapper'
technology, as described in the ITU-TG.709 standard.
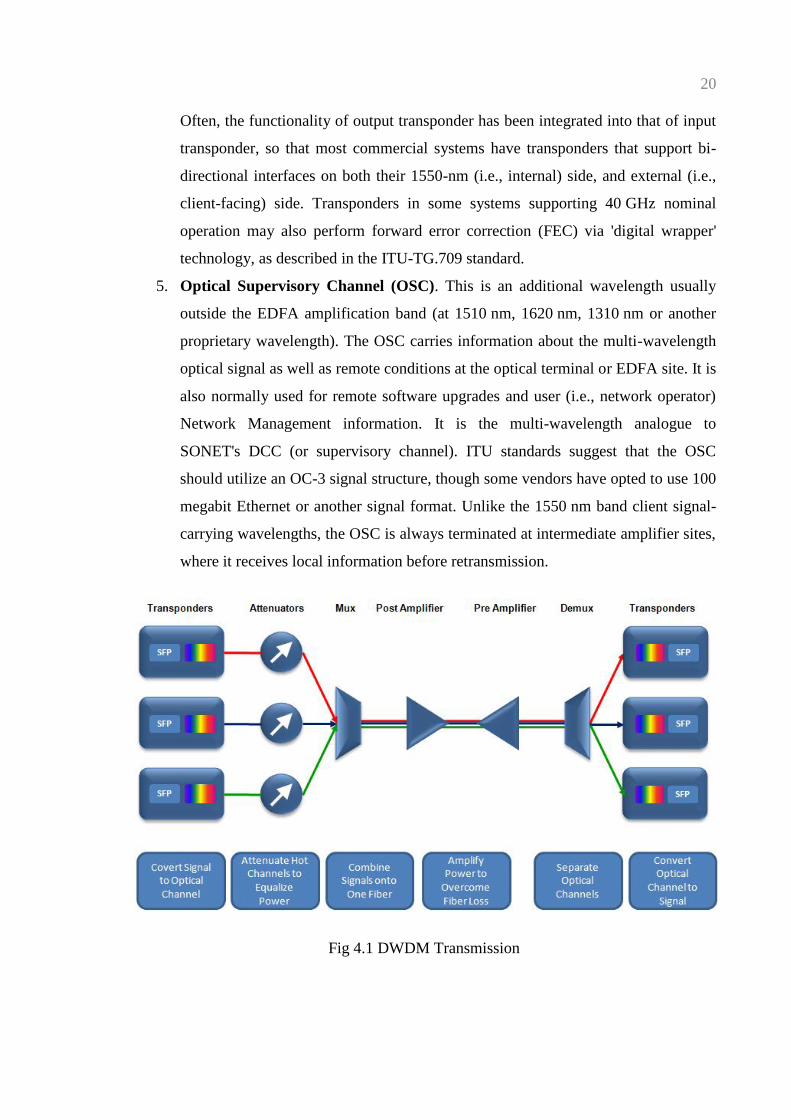
5. Optical Supervisory Channel (OSC). This is an additional wavelength usually
outside the EDFA amplification band (at 1510 nm, 1620 nm, 1310 nm or another
proprietary wavelength). The OSC carries information about the multi-wavelength
optical signal as well as remote conditions at the optical terminal or EDFA site. It is
also normally used for remote software upgrades and user (i.e., network operator)
Network Management information. It is the multi-wavelength analogue to
SONET's DCC (or supervisory channel). ITU standards suggest that the OSC
should utilize an OC-3 signal structure, though some vendors have opted to use 100
megabit Ethernet or another signal format. Unlike the 1550 nm band client signal-
carrying wavelengths, the OSC is always terminated at intermediate amplifier sites,
where it receives local information before retransmission.
Fig 4.1 DWDM Transmission
20

The introduction of the ITU-T G.694.1 frequency grid in 2002 has made it easier to
integrate WDM with older but more standard SONET/SDH systems. WDM wavelengths
are positioned in a grid having exactly 100 GHz (about 0.8 nm) spacing in optical
frequency, with a reference frequency fixed at 193.10 THz (1552.52 nm). The main grid is
placed inside the optical fiber amplifier bandwidth, but can be extended to wider
bandwidths. Today's DWDM systems use 50 GHz or even 25 GHz channel spacing for up
to 160 channel operation.
DWDM systems have to maintain more stable wavelength or frequency than those
needed for CWDM because of the closer spacing of the wavelengths. Precision
temperature control of laser transmitter is required in DWDM systems to prevent "drift"
off a very narrow frequency window of the order of a few GHz. In addition, since DWDM
provides greater maximum capacity it tends to be used at a higher level in the
communications hierarchy than CWDM, for example on the Internet backbone and is
therefore associated with higher modulation rates, thus creating a smaller market for
DWDM devices with very high performance levels. These factors of smaller volume and
higher performance result in DWDM systems typically being more expensive than
CWDM.
Recent innovations in DWDM transport systems include pluggable and software-
tunable transceiver modules capable of operating on 40 or 80 channels. This dramatically
reduces the need for discrete spare pluggable modules, when a handful of pluggable
devices can handle the full range of wavelengths.
4.1 MANAGING THE DWDM NETWORK
4.1.1 Wavelength Converting Transponders
At this stage, some details concerning Wavelength Converting Transponders
should be discussed, as this will clarify the role played by current DWDM technology as
an additional optical transport layer. It will also serve to outline the evolution of such
systems over the last 10 or so years.
As stated above, wavelength converting transponders served originally to translate
the transmit wavelength of a client-layer signal into one of the DWDM system's internal
21

wavelengths in the 1550 nm band (note that even external wavelengths in the 1550 nm will
most likely need to be translated, as they will almost certainly not have the required
frequency stability tolerances nor will it have the optical power necessary for the system's
EDFA).
In the mid-1990s, however, wavelength converting transponders rapidly took on
the additional function of signal regeneration. Signal regeneration in transponders quickly
evolved through 1R to 2R to 3R and into overhead-monitoring multi-bit rate 3R
regenerators. These differences are outlined below:
1R:
Retransmission: Basically, early transponders were "garbage in garbage
out" in that their output was nearly an analogue 'copy' of the received optical signal,
with little signal cleanup occurring. This limited the reach of early DWDM systems
because the signal had to be handed off to a client-layer receiver (likely from a
different vendor) before the signal deteriorated too far. Signal monitoring was
basically confined to optical domain parameters such as received power.
2R:
Re-time and re-transmit: Transponders of this type were not very common
and utilized a quasi-digital Schmitt-triggering method for signal clean-up. Some
rudimentary signal quality monitoring was done by such transmitters that basically
looked at analogue parameters.
3R:
Re-time, re-transmit, re-shape. 3R Transponders were fully digital and
normally able to view SONET/SDH section layer overhead bytes such as A1 and
A2 to determine signal quality health. Many systems will offer 2.5 Gbit/s
transponders, which will normally mean the transponder is able to perform 3R
regeneration on OC-3/12/48 signals, and possibly gigabit Ethernet, and reporting
on signal health by monitoring SONET/SDH section layer overhead bytes. Many
transponders will be able to perform full multi-rate 3R in both directions. Some
vendors offer 10 Gbit/s transponders, which will perform Section layer overhead
monitoring to all rates up to and including OC-192.
22

4.1.2 Muxponder
The muxponder (from multiplexed transponder) has different names depending on
vendor. It essentially performs some relatively simple time division multiplexing of lower
rate signals into a higher rate carrier within the system (a common example is the ability to
accept 4 OC-48s and then output a single OC-192 in the 1550 nm band). More recent
muxponder designs have absorbed more and more TDM functionality, in some cases
obviating the need for traditional SONET/SDH transport equipment.
4.1.3 Reconfigurable Add Drop Multiplexer (ROADM)
As mentioned above, intermediate optical amplification sites in DWDM systems
may allow for the dropping and adding of certain wavelength channels. In most systems
deployed as of August 2006 this is done infrequently, because adding or dropping
wavelengths requires manually inserting or replacing wavelength-selective cards. This is
costly, and in some systems requires that all active traffic be removed from the DWDM
system, because inserting or removing the wavelength-specific cards interrupts the multi-
wavelength optical signal.
With a ROADM, network operators can remotely reconfigure the multiplexer by
sending soft commands. The architecture of the ROADM is such that dropping or adding
wavelengths does not interrupt the 'pass-through' channels. Numerous technological
approaches are utilized for various commercial ROADMs, the tradeoff being between cost,
optical power, and flexibility.
4.1.4 Optical Cross Connects (OXCs)
When the network topology is a mesh, where nodes are interconnected by fibers to
form an arbitrary graph, an additional fiber interconnection device is needed to route the
signals from an input port to the desired output port. These devices are called optical cross-
connectors (OXCs).Various categories of OXCs include elctronic, optical,and wavelength
selective devices.
23

CHAPTER 5
PRACTICAL DWDM SYSTEM
5.1 DWDM SETUP
Fig 5.1 DWDM Setup
5.1.1 Components in DWDM
DWDM setup mainly consists of the following blocks
1.Add/Drop Multiplexer (ADM)
2.Transponders (TRP)
3.Multiplexer
4.Optical Booster Amplifier (OBA)
5.Optical Supervisory Channel (OSC)
6.Optical Power Amplifier (OPA)
7.De-multiplexer
24

5.1.2 Procedure for Setup
The optical input signal is given to the ADM whose input and output are black and
white signals. From the TX of ADM, the signals are given to the TX IN of TRP. The
wavelength will depend on whether the DWDM is a 2.5 or 10 Gbps system. The TX OUT
of TRP will be coloured signals with different colour for different wavelength. From the
TX OUT, connection is given to IN of MUX. It has different ports. It combines different
signal inputs to form a single signal. The OUT of MUX will be common to all ports. This
OUT is given to IN of OBA.
The OBA contains EDFA which provides high power amplification. Additional
OSC signals are given to the OBA which is useful for supervising the signal and
eliminating the unnecessary signals. From OUT of OBA, the signal is passed to the line
fiber. From the other end of the line fiber, signals are given for amplification to OPA IN.
Here the signal gets amplified and the OSC signals are dropped. Thus, from OPA OUT,
only the information carrying signal will be given to DEMUX IN. In DEMUX single
signals is converted to different signals. This is then fed to the RX IN of TRP. The out
coming black and white signals from RX OUT of TRP the signals are given to ADM RX.
Thus the complete transmission and reception of signals are shown within the DWDM.
25
CHAPTER 6
FORWARD ERROR CORRECTION
Forward error correction (FEC) or channel coding is a technique used
for controlling errors in data transmission over unreliable or noisy communication
channels. The central idea is the sender encodes their message in a redundant way by using
an error-correcting code (ECC). The American mathematician Richard Hamming
pioneered this field in the 1940s and invented the first error-correcting code in 1950:
the Hamming (7,4) code.
FEC processing in a receiver may be applied to a digital bit stream or in the
demodulation of a digitally modulated carrier. For the latter, FEC is an integral part of the
initial analog-to-digital conversion in the receiver. The Viterbi decoder implements a soft-
decision algorithm to demodulate digital data from an analog signal corrupted by noise.
Many FEC coders can also generate a bit-error rate (BER) signal which can be used as
feedback to fine-tune the analog receiving electronics.
FEC is accomplished by adding redundancy to the transmitted information using a
predetermined algorithm. A redundant bit may be a complex function of many original
information bits. The original information may or may not appear literally in the encoded
output; codes that include the unmodified input in the output are systematic, while those
that do not are non-systematic. Many FEC coders can also generate a bit-error rate (BER)
signal which can be used as feedback to fine-tune the analog receiving electronics.
6.1 TYPES OF FEC
Forward error correction (FEC) or channel coding is a technique used
for controlling errors in data transmission over unreliable or noisy communication
channels. The central idea is the sender encodes their message in a redundant way by using
an error-correcting code (ECC). The American mathematician Richard Hamming
pioneered this field in the 1940s and invented the first error-correcting code in 1950:
the Hamming (7,4) code.
FEC processing in a receiver may be applied to a digital bit stream or in the
demodulation of a digitally modulated carrier. For the latter, FEC is an integral part of the
initial analog-to-digital conversion in the receiver. The Viterbi decoder implements a soft-
decision algorithm to demodulate digital data from an analog signal corrupted by noise.
26

Many FEC coders can also generate a bit-error rate (BER) signal which can be used as
feedback to fine-tune the analog receiving electronics.
FEC is accomplished by adding redundancy to the transmitted information using a
predetermined algorithm. A redundant bit may be a complex function of many original
information bits. The original information may or may not appear literally in the encoded
output; codes that include the unmodified input in the output are systematic, while those
that do not are non-systematic. Many FEC coders can also generate a bit-error rate (BER)
signal which can be used as feedback to fine-tune the analog receiving electronics.
6.1.1 List Of Few Error Correcting Codes
Convolutional Code
Group Codes
Hamming Code
Lexicographic Code
Long Code
M of n Codes
Reed-Solomon Error Correction
Reed-Muller Code
Turbo Code
Trellis Coded Modulation
6.2 FEC IN OPTICAL NETWORK
Light traveling over fiber optic connections must contend with natural impairments
that degrade signal quality. The amount of degradation increases with both distance and
data rate. One way to reduce the effects of the impairments is to utilize forward error
correction (FEC). Now that FEC can be implemented readily in inexpensive silicon, it has
become an essential component of optical transport networking (OTN) equipment,
particularly at today’s higher frequencies. Achieving higher gain by using FEC algorithms
reduces carrier Capex since it allows optical devices to be spaced further apart in networks.
Of course, the cost of implementing FEC does counter the gains.
There are many ways to implement FEC. The ITU-T (Recommendation G.709)
defined a standard method for OTN frames utilizing a Reed-Solomon technique. The
approach, sometimes called Generic FEC (GFEC), is necessary for any standards-
compliant OTN framer. However, the method is satisfactory only for lower-data rate and
27

shorter reach applications. Researchers have developed more advanced FEC techniques,
optimized to achieve higher gain. Some of the algorithms are proprietary, while others
have been standardized. Various Enhanced FEC (EFEC) techniques built for higher gain
have been defined within ITU-T (Recommendation G.975.1). It outlines nine techniques
(I.1 through I.9) which can be used in transponders, regenerators, muxponders, and
switches at OTU-2 (10Gbps) and OTU-3 (40Gbps). However, equipment deployed at
OTU-4 (100Gbps) must utilize proprietary FEC as well as soft-decision FEC (SDFEC)
techniques.
Optical equipment manufacturers that have deployed OTN technologies have used
a variety of FEC technologies in OTU-2, OTU-3, and OTU-4 cards. The choice has often
varied even within a single company with one division selecting an ASSP provider with a
specific FEC algorithm for one OTN card, while another division has developed a card
utilizing a different algorithm. As OEMs integrate multiple platforms, they prefer to
develop cards supporting Universal FEC, allowing a direct interface to a variety of
techniques, depending on which card is attached at the other end of the optical fiber. One
way of supporting universal FEC is to integrate multiple techniques in silicon and select
the appropriate one upon deployment. The disadvantage of this approach is that it wastes
silicon since only one part of the device is actually used in practice. Another option is to
use programmable logic and configure the silicon at deployment with the appropriate FEC
technology.
Field programmable gate array (FPGA) suppliers are investing more aggressively
in OTN IP and offering the capabilities of delivering FEC, framer, and muxing solutions
optimized for a specific application. Vendors developing their own FEC techniques for
next-generation systems can offer configurable support for standards-based techniques
without using additional silicon. As bandwidth grows and OTN deployments evolve to
100Gbps and beyond, the utilization of FEC techniques will become more widespread.
Implementing the front-end FEC with programmable logic allows for a risk-proof
approach that supports a variety of algorithms and allows for future needs, new standards,
and further developments.
28
CHAPTER 7
SPECTRUM SCLICED DWDM TRANSMISSION
7.1 CONFIGURATION OF TARGET SYSTEMS
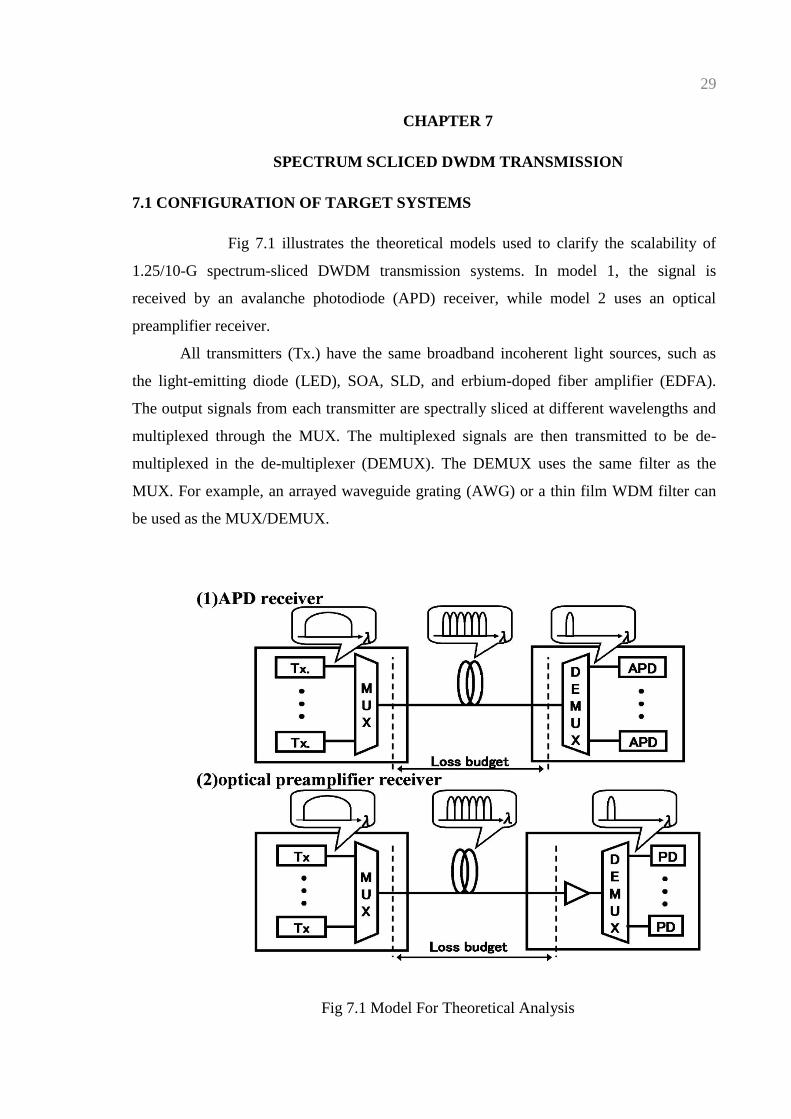
Fig 7.1 illustrates the theoretical models used to clarify the scalability of
1.25/10-G spectrum-sliced DWDM transmission systems. In model 1, the signal is
received by an avalanche photodiode (APD) receiver, while model 2 uses an optical
preamplifier receiver.
All transmitters (Tx.) have the same broadband incoherent light sources, such as
the light-emitting diode (LED), SOA, SLD, and erbium-doped fiber amplifier (EDFA).
The output signals from each transmitter are spectrally sliced at different wavelengths and
multiplexed through the MUX. The multiplexed signals are then transmitted to be de-
multiplexed in the de-multiplexer (DEMUX). The DEMUX uses the same filter as the
MUX. For example, an arrayed waveguide grating (AWG) or a thin film WDM filter can
be used as the MUX/DEMUX.
Fig 7.1 Model For Theoretical Analysis
29
In the case of model 2, the multiplexed signals are amplified
simultaneously before passing through the DEMUX. The loss budget is defined as the
allowable loss in the transmission line in both cases.
7.2 THEORETICAL ANALYSIS
Designing a WDM transmission system involves both the loss budget and the
number of channels. However, in WDM transmission systems that use a spectrum-slicing
scheme, there is a tradeoff between these two requirements. To increase the number of
channels, it is necessary to narrow the channel spacing due to the fixed bandwidth of the
light sources. However, as the amount of signal-signal beat noise, which is the dominant
noise factor, is inversely proportional to the sliced bandwidth, narrowing the channel
spacing degrades the received sensitivity, and the loss budget becomes smaller.
In this section, the scalability of 1.25/10-G spectrum-slice DWDM transmission is
discussed taking the above two requirements into account. We first clarify the scalability
of the models shown in Fig. 1 and then study the possibility of using FEC to enhance this
scalability. The results of experiments conducted to prove the validity of the theoretical
analysis are also presented.
7.2.1 Scalability: Tradeoff Between Loss Budget And Channel Spacing
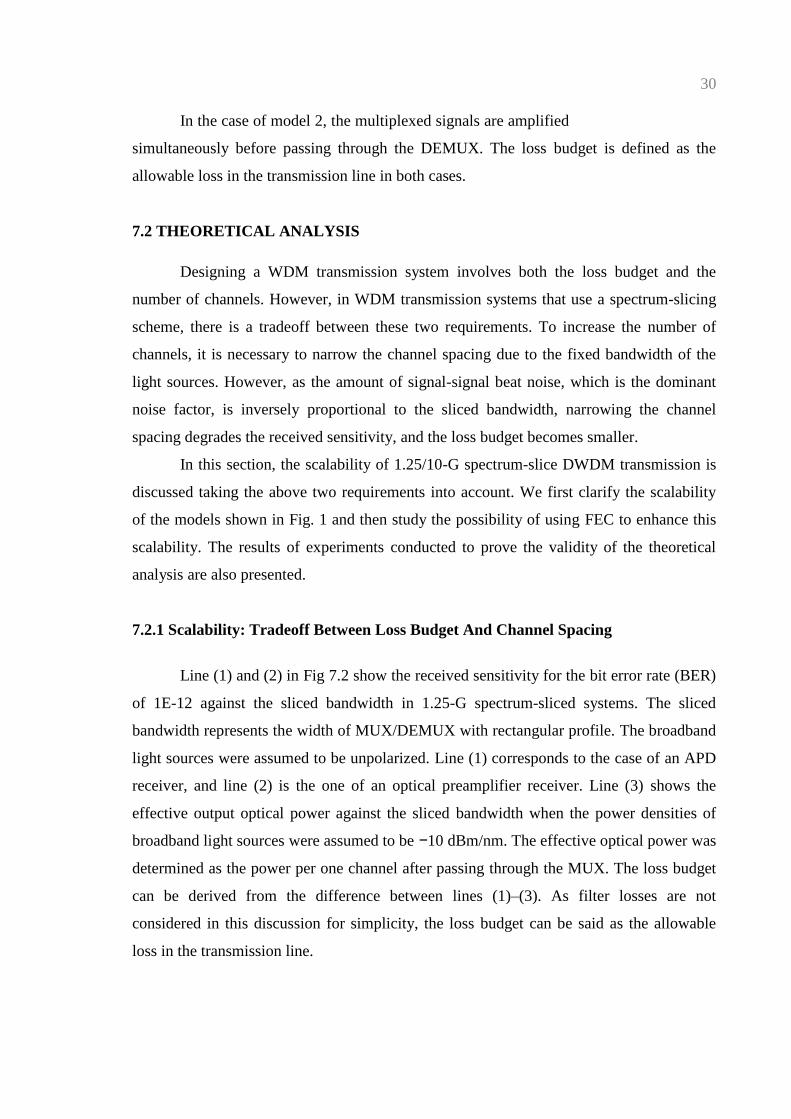
Line (1) and (2) in Fig 7.2 show the received sensitivity for the bit error rate (BER)
of 1E-12 against the sliced bandwidth in 1.25-G spectrum-sliced systems. The sliced
bandwidth represents the width of MUX/DEMUX with rectangular profile. The broadband
light sources were assumed to be unpolarized. Line (1) corresponds to the case of an APD
receiver, and line (2) is the one of an optical preamplifier receiver. Line (3) shows the
effective output optical power against the sliced bandwidth when the power densities of
broadband light sources were assumed to be −10 dBm/nm. The effective optical power was
determined as the power per one channel after passing through the MUX. The loss budget
can be derived from the difference between lines (1)–(3). As filter losses are not
considered in this discussion for simplicity, the loss budget can be said as the allowable
loss in the transmission line.
30
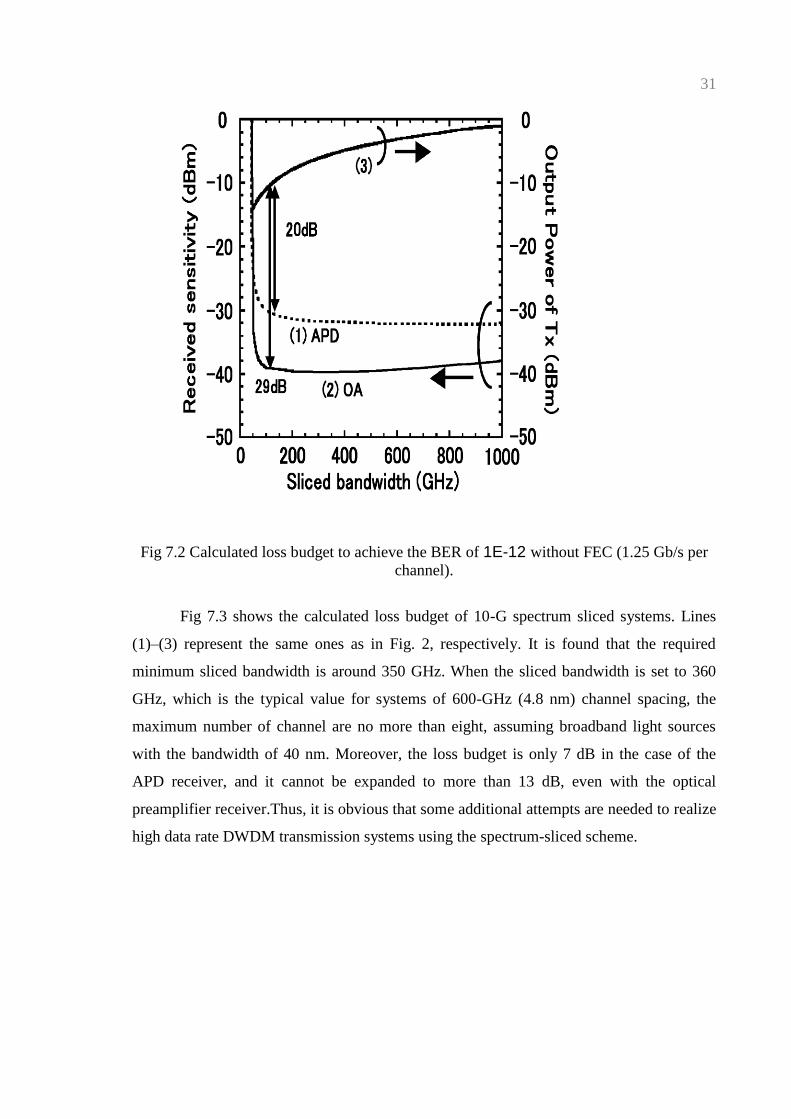
Fig 7.2 Calculated loss budget to achieve the BER of 1E-12 without FEC (1.25 Gb/s per
channel).
Fig 7.3 shows the calculated loss budget of 10-G spectrum sliced systems. Lines
(1)–(3) represent the same ones as in Fig. 2, respectively. It is found that the required
minimum sliced bandwidth is around 350 GHz. When the sliced bandwidth is set to 360
GHz, which is the typical value for systems of 600-GHz (4.8 nm) channel spacing, the
maximum number of channel are no more than eight, assuming broadband light sources
with the bandwidth of 40 nm. Moreover, the loss budget is only 7 dB in the case of the
APD receiver, and it cannot be expanded to more than 13 dB, even with the optical
preamplifier receiver.Thus, it is obvious that some additional attempts are needed to realize
high data rate DWDM transmission systems using the spectrum-sliced scheme.
31

Fig 7.3 Calculated loss budget to achieve the BER of 1 × 10⁻¹² without FEC (10 Gb/s
per channel).
7.2.2 Use of FEC for Expanding The Scalability
As discussed above, the scalability of spectrum-sliced DWDM transmission
systems for high data rate is limited severely. Therefore, it is difficult to design systems
with large loss budget and a large enough number of channels.
To expand the scalability, we study the use of FEC, which has been usually used to
improve the received sensitivity in the long-haul transmission systems. We assumed a code
that can improve the BER of 1.8E−4 to the BER of 1E−12,which is a feature that a well-
known Reed–Solomon (255,239) code can achieve. In our study, as an example to reveal
the general effect FEC offers, a Reed–Solomon (255,239) code which redundancy ratio is
1/14 was chosen.
32
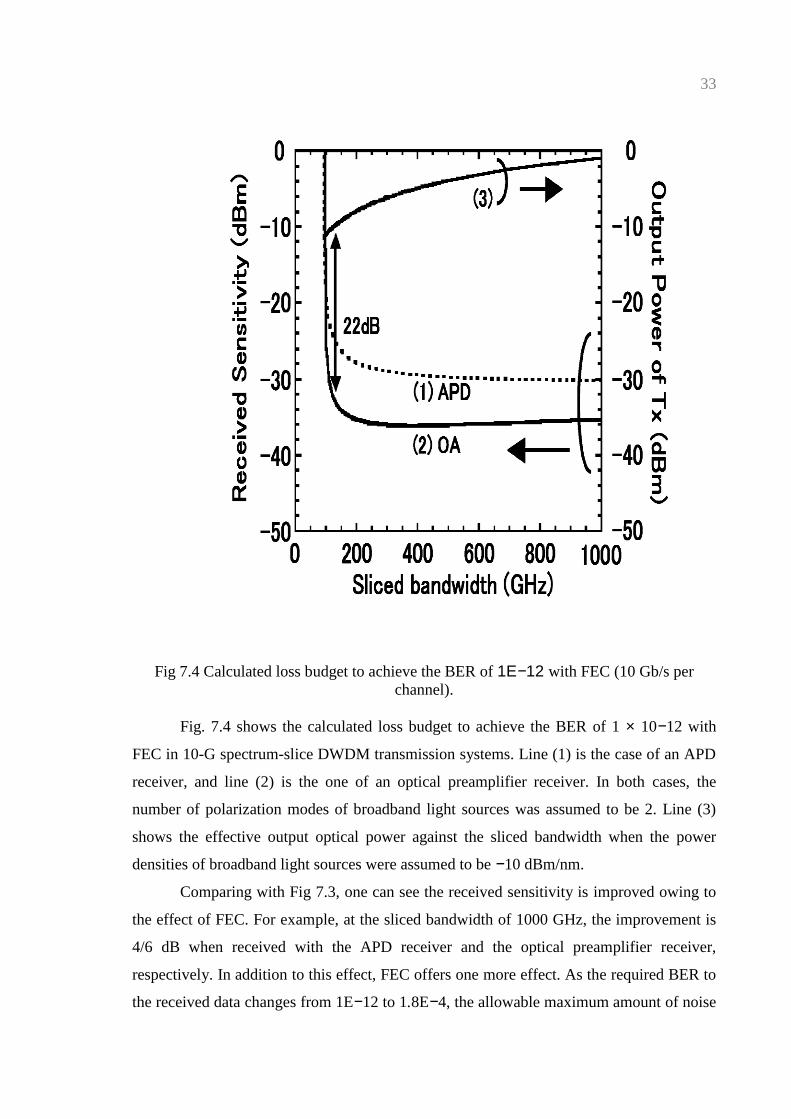
Fig 7.4 Calculated loss budget to achieve the BER of 1E−12 with FEC (10 Gb/s per
channel).
Fig. 7.4 shows the calculated loss budget to achieve the BER of 1 × 10⁻¹² with
FEC in 10-G spectrum-slice DWDM transmission systems. Line (1) is the case of an APD
receiver, and line (2) is the one of an optical preamplifier receiver. In both cases, the
number of polarization modes of broadband light sources was assumed to be 2. Line (3)
shows the effective output optical power against the sliced bandwidth when the power
densities of broadband light sources were assumed to be −10 dBm/nm.
Comparing with Fig 7.3, one can see the received sensitivity is improved owing to
the effect of FEC. For example, at the sliced bandwidth of 1000 GHz, the improvement is
4/6 dB when received with the APD receiver and the optical preamplifier receiver,
respectively. In addition to this effect, FEC offers one more effect. As the required BER to
the received data changes from 1E−12 to 1.8E−4, the allowable maximum amount of noise
33

increases, and when the signal–signal beat noise is the dominant noise factor, the increase
of the amount of noise permits a narrower sliced bandwidth. The required minimum sliced
bandwidth narrows from 350 to 95 GHz.
From Fig 7.4, we can see that the loss budget of 22 dB with the sliced bandwidth of
120 GHz can be obtained when the optical preamplifier receiver is used. If we assume that
the bandwidth of broadband light sources is 40 nm, we can design a 200-GHz channel
spacing, 25-channel, 10-G spectrum-sliced DWDM transmission system with the loss
budget of 22 dB by using FEC and the optical preamplifier.
Fig 7.5 Expansion of scalability permitted by using FEC.
Fig 7.5 concludes the scalability of spectrum-sliced DWDM transmission systems.
Loss budgets against the data rate of 1.25, 2.5, and 10 Gb/s are shown. Lines (1) and (2)
correspond to the case when an APD receiver is used and the time channel spacing is
34

200/600 GHz, respectively. Lines (3) and (4) are the cases when the FEC-coded signal
whose channel spacing is 200 GHz is received with an APD receiver and an optical
preamplifier receiver, respectively. The sliced bandwidth was assumed to be 0.6 times of
channel spacing (the same as that used in the previous analysis). The values of 1.25 and 10
Gb/s are extracted from Figs. 2–4, and the ones of 2.5 Gb/s are newly calculated.
As can be seen from Fig 7.5, when the APD receiver is used, the 10-Gb/s signal
cannot be supported without broadening the channel spacing to 600 GHz (in other words,
the sliced bandwidth to 360 GHz). It is found that by using FEC, the 10-Gb/s signal with
200-GHz channel spacing comes to be able to be supported by the APD receiver. The
results indicate that the usage of FEC not only increases the loss budget but also increases
the number of available channels. It can also be seen that the usage of the optical amplifier
receiver in addition to FEC further increase the scalability so that the loss budget over 20
dB can be achievable for 10-Gb/s signals with 200-GHz channel spacing.
Fig 7.6 Experimental setup for confirming the results of theoretical analysis.
35
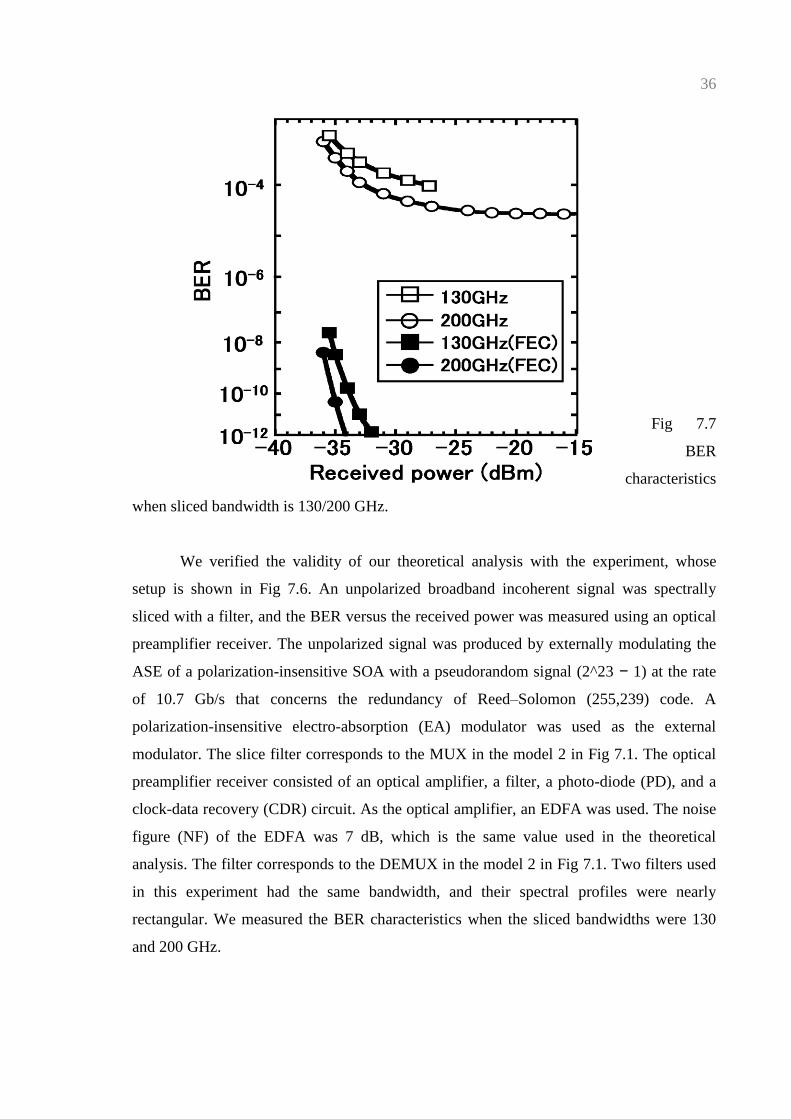
Fig 7.7
BER
characteristics
when sliced bandwidth is 130/200 GHz.
We verified the validity of our theoretical analysis with the experiment, whose
setup is shown in Fig 7.6. An unpolarized broadband incoherent signal was spectrally
sliced with a filter, and the BER versus the received power was measured using an optical
preamplifier receiver. The unpolarized signal was produced by externally modulating the
ASE of a polarization-insensitive SOA with a pseudorandom signal (2^23 − 1) at the rate
of 10.7 Gb/s that concerns the redundancy of Reed–Solomon (255,239) code. A
polarization-insensitive electro-absorption (EA) modulator was used as the external
modulator. The slice filter corresponds to the MUX in the model 2 in Fig 7.1. The optical
preamplifier receiver consisted of an optical amplifier, a filter, a photo-diode (PD), and a
clock-data recovery (CDR) circuit. As the optical amplifier, an EDFA was used. The noise
figure (NF) of the EDFA was 7 dB, which is the same value used in the theoretical
analysis. The filter corresponds to the DEMUX in the model 2 in Fig 7.1. Two filters used
in this experiment had the same bandwidth, and their spectral profiles were nearly
rectangular. We measured the BER characteristics when the sliced bandwidths were 130
and 200 GHz.
36

Fig 7.7 shows the BER characteristics. The open squares/ circles plot the measured
values when the sliced bandwidth is 130/200 GHz, respectively. The closed squares/circles
represent the values gained when the received data are assumed to be decoded. The
required received power for the BER of 1E−12 was −32/ − 34 dBm when the sliced
bandwidth was 130/200 GHz. These measured values agree well with the result of the
theoretical analysis shown in Fig 7.4. As the differences between measured and calculated
results were less than 1 dB, we could verify the validity of our theoretical analysis in the
range of the sliced bandwidth between 130 and 200 GHz.
37
CHAPTER 8
DWDM EXPERIMENTS
In this section, we describe the results of two spectrum sliced DWDM transmission
experiments. One confirms 10-Gb/s, eight channel DWDM transmission without FEC and
the channel spacing of 200 GHz. The other assesses 10-Gb/s, eight channel DWDM
transmission with FEC and the channel spacing of 200 GHz. We have also conducted 100
GHZ Grid 40 Channel, 50 GHZ Grid 80 Channel, 25 GHZ Grid 160 Channel DWDM
Transmission without FEC. We have also conducted 100 GHZ Grid 40 Channel, 50 GHZ
Grid 80 Channel, 25 GHZ Grid 160 Channel DWDM Transmission with FEC.
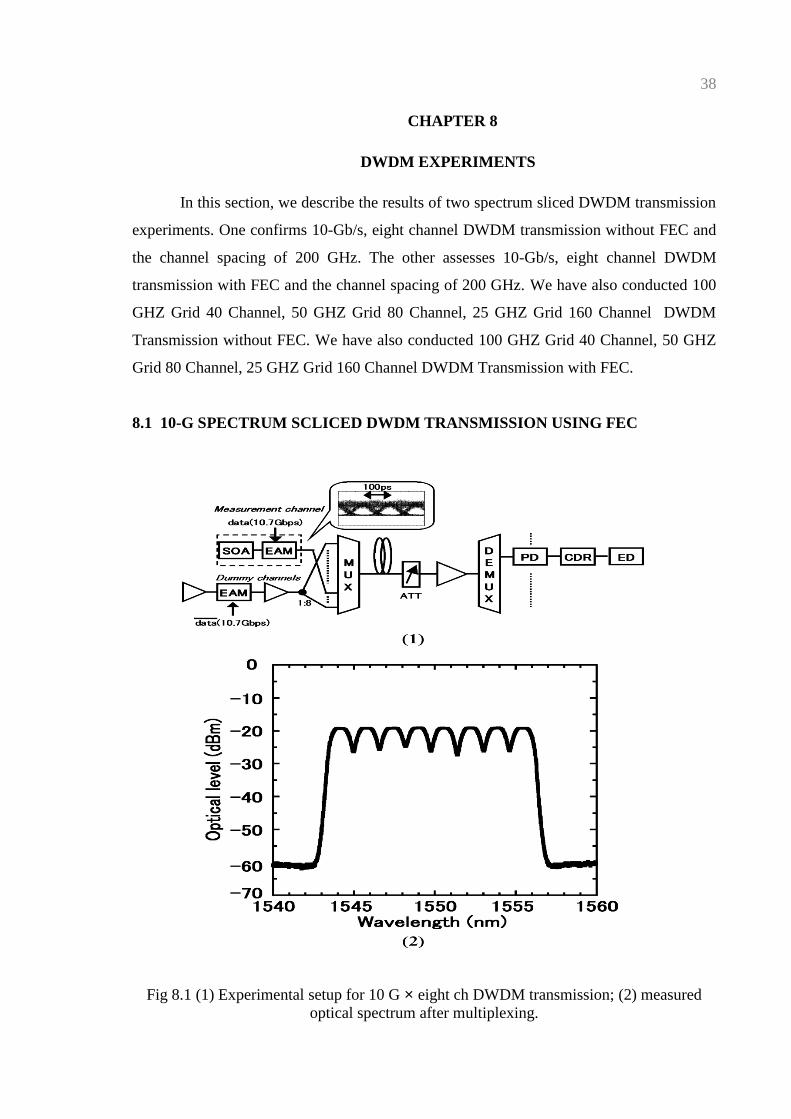
8.1 10-G SPECTRUM SCLICED DWDM TRANSMISSION USING FEC
Fig 8.1 (1) Experimental setup for 10 G × eight ch DWDM transmission; (2) measured
optical spectrum after multiplexing.
38

An eight channel 10-G spectrum-sliced WDM transmission was conducted with the
setup shown in Fig 8.1(1). The signal for the measurement channel was launched from the
same polarization-insensitive broadband light source used in the experiment shown in Fig
7.6. This signal was pseudorandom (2^23 − 1), and its data rate was 10.7 Gb/s to consider
the effectiveness of FEC. An eye diagram is shown in the inset of Fig 8.1(1); a clear eye
opening can be observed. Dummy signals were produced by externally modulating the
ASE of an EDFA with a polarization-insensitive EA modulator and split by a 1 : 8 coupler
after being amplified by an EDFA. The measurement signal and seven out of eight dummy
signals were spectrally sliced, multiplexed through an 8-port thin-film WDM filter with a
nearly rectangular profile and transmitted. Fig 8.1(2) shows a spectrum of the multiplexed
signals. All signals have nearly the same peak power of −19 dBm and a 3-dB bandwidth of
130 GHz. The transmitted signals were received with an optical preamplifier receiver
constructed around an EDFA whose NF was 5.5 dB, an 8-port thin-film WDM filter, a PD,
and a CDR circuit. The thin-film WDM filter was the same one used for multiplexing, and
it not only de-multiplexed the multiplexed signals but also eliminated the ASE of the
preamplifier. We measured the BER characteristics when the transmission line was 20 km
of dispersion shift fiber (DSF) or 2 km of SMF.
39

CHAPTER 9
RESULTS, ANALYSIS AND DISCUSSIONS
Fig 9.1 BER characteristics of 10 Gb/s Eight Channel DWDM Transmission without FEC.
Fig 9.1 Shows BER Characteristics of 10 Gb/s Eight Channel DWDM
Transmission without FEC. BER is measured to be 8E-4 when the received power is -34.5
dB m.
0.00E+00
1.00E-04
2.00E-04
3.00E-04
4.00E-04
5.00E-04
6.00E-04
7.00E-04
8.00E-04
9.00E-04
-40 -30 -20 -10 0
BER
Recieved Power (dBm)
10 GB/s Eight Channel DWDM Transmission without FEC
BER SMF 2KM without FEC
BER DSF20KM without FEC
40

Fig 9.2 BER characteristics of 10 Gb/s Eight Channel DWDM Transmission with FEC.
Fig 9.2 Shows BER Characteristics of 10 Gb/s Eight Channel DWDM
Transmission with FEC. BER is measured to be 1E-12 when the received power is -34.5
dB m.
0.00E+00
1.00E-12
2.00E-12
3.00E-12
4.00E-12
5.00E-12
6.00E-12
7.00E-12
-38 -37 -36 -35 -34 -33 -32
BER
Recieved Power(dBm)
10 Gb/s Eight Channel DWDM Transmission with FEC
BER SMF2Km(FEC)
BER DSF 20Km(FEC)
41

Fig. 9.3. BER characteristics of 40 Channel 100GHZ spacing DWDM Transmission
without FEC.
Fig 9.3 Shows BER Characteristics of 40 Channel 100 GHZ Spacing DWDM
Transmission without FEC. BER is measured to be 8E-5 when the received power is -35
dB m.
Fig. 9.4. BER characteristics of 40 Channel 100GHZ spacing DWDM Transmission with
FEC
0.00E+00
1.00E-05
2.00E-05
3.00E-05
4.00E-05
5.00E-05
6.00E-05
7.00E-05
8.00E-05
9.00E-05
-40 -30 -20 -10 0
BER
Recieved Optical Power(dBm)
100 GHZ grid 40 Channel DWDM Transmission without FEC
BER without FEC
0.00E+00
1.00E-13
2.00E-13
3.00E-13
4.00E-13
5.00E-13
6.00E-13
-38 -37 -36 -35 -34 -33 -32
BER
Recieved Power(dBm)
100 GHZ Grid 40 Channel DWDM Transmission With FEC
BER (FEC)
42

Fig 9.4 Shows BER Characteristics of 40 Channel 100 GHZ Spacing DWDM
Transmission with FEC. BER is measured to be 1E-13 when the received power is -35 dB
m
Fig 9.5 BER characteristics of 80 Channel 50GHZ spacing DWDM Transmission without
FEC
Fig 9.5 Shows BER Characteristics of 80 Channel 50 GHZ Spacing DWDM
Transmission without FEC. BER is measured to be 8E-7 when the received power is -35
dB m.
0.00E+00
1.00E-07
2.00E-07
3.00E-07
4.00E-07
5.00E-07
6.00E-07
7.00E-07
8.00E-07
9.00E-07
-40 -30 -20 -10 0
BER
Recieved Power (dBm)
50 GHz Grid DWDM Transmission without FEC
BER without FEC
43

Fig 9.6 BER characteristics of 80 Channel 50GHZ spacing DWDM Transmission with
FEC
Fig 9.6 Shows BER Characteristics of 80 Channel 50 GHZ Spacing DWDM
Transmission without FEC. BER is measured to be 4E-14 when the received power is -35
dB m.
Fig 9.7 BER characteristics of 160 Channel 25GHZ spacing DWDM Transmission
without FEC
0.00E+00
1.00E-14
2.00E-14
3.00E-14
4.00E-14
5.00E-14
6.00E-14
7.00E-14
8.00E-14
9.00E-14
-38 -37 -36 -35 -34 -33 -32
BER
Recieved Power (dBm)
50 GHZ Grid 80 Channel DWDM Transmission with FEC
BER (FEC)
0.00E+00
1.00E-08
2.00E-08
3.00E-08
4.00E-08
5.00E-08
6.00E-08
7.00E-08
8.00E-08
9.00E-08
-40 -30 -20 -10 0
BER
Recieved Power(dBm)
25 GHZ Grid 160 Channel DWDM Transmission without FEC
BER without FEC
44
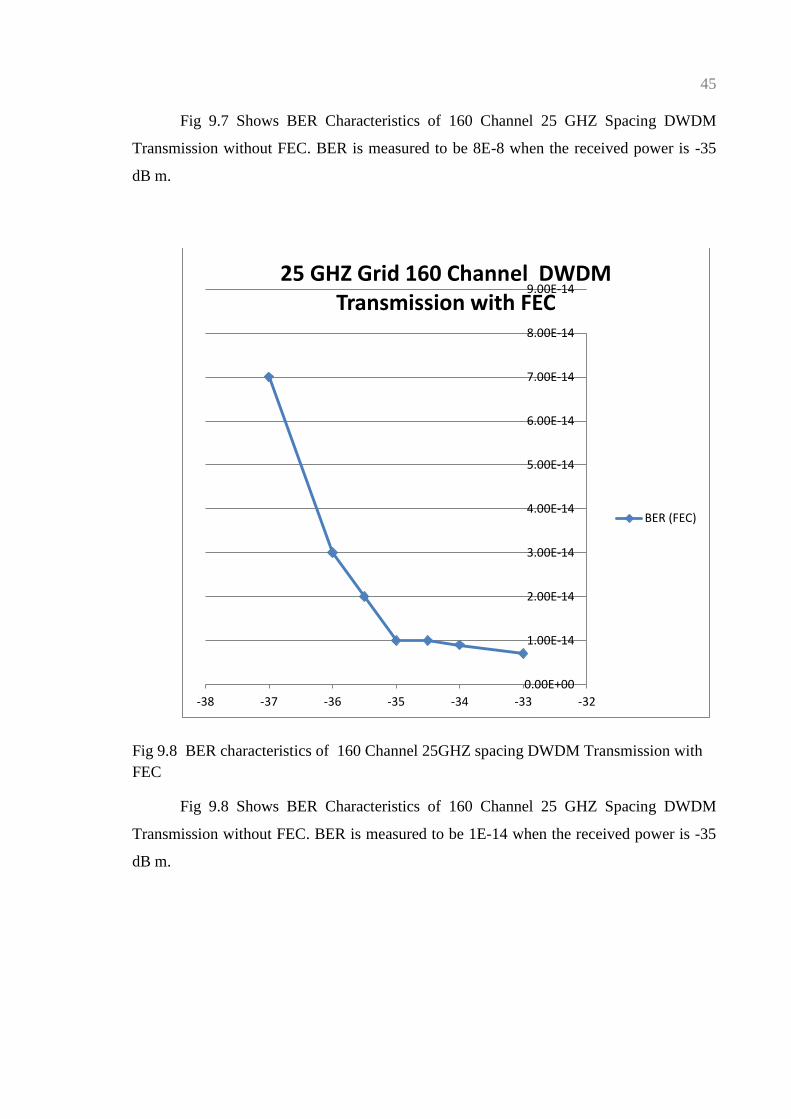
Fig 9.7 Shows BER Characteristics of 160 Channel 25 GHZ Spacing DWDM
Transmission without FEC. BER is measured to be 8E-8 when the received power is -35
dB m.
Fig 9.8 BER characteristics of 160 Channel 25GHZ spacing DWDM Transmission with
FEC
Fig 9.8 Shows BER Characteristics of 160 Channel 25 GHZ Spacing DWDM
Transmission without FEC. BER is measured to be 1E-14 when the received power is -35
dB m.
0.00E+00
1.00E-14
2.00E-14
3.00E-14
4.00E-14
5.00E-14
6.00E-14
7.00E-14
8.00E-14
9.00E-14
-38 -37 -36 -35 -34 -33 -32
25 GHZ Grid 160 Channel DWDM Transmission with FEC
BER (FEC)
45

TABLE 9.1
BER values of Various DWDM Transmission System
DWDM System BER without FEC BER with FEC
10 Gb/s Eight Channel 8E-4 1E-12
100 GHZ Spacing 40
Channel
8E-5 1E-13
50 GHZ Spacing 80
Channel
8E-7 4E-14
25 GHZ Spacing 160
Channel
8E-8 1E-14
Table 9.1 Shows the BER values of Various DWDM Transmission System Without
FEC and BER Characteristics of Various DWDM Transmission System With FEC.
46
CHAPTER 10
CONCLUSION AND FUTURE SCOPE
10.1 CONCLUSION
This paper clarified the scalability of 1.25/10-G spectrum sliced DWDM
transmission systems through a theoretical analysis; the analysis results were confirmed by
transmission experiments. First, the tradeoff between the loss budget and the sliced
bandwidth (i.e., the number of channels assuming fixed bandwidth light sources) was
elucidated by the theoretical analysis. Next, the expansion of the scalability made possible
by using FEC was studied, and it was revealed that four times as many as channels can be
accommodated with the use of a familiar FEC code. Finally, two WDM transmission
experiments were performed and shown to verify the results of the theoretical analysis.
10.2 FUTURE SCOPE
Super FEC Coding can be implemented in high data rate DWDM Systems with
more number of channels.
47

REFERENCES
[1] Takashi Mitsui, Kazutaka Hara, Masamichi Fujiwara, Jun-ichi Kani Masashi
Tadokoro,Naoto Yoshimoto, and Hisaya Hadama.;‖Simple and Scalable
WDM/TDMA-PON using Spectral Slicing and Forward Error Correction‖ , J.
LightwaveTechnol., 2011.
[2] S. Kaneko et al. ‗Scalability of Spectrum-sliced DWDM transmission and Its
Expansion Using Forward Error Correction„, J. Light wave Technol., 2006, vol. 24,
pp. 1295-1301
[3] “Spectral grids for WDM applications: DWDM frequency grid,” ITU-T
Recommendation G.694.1, Jun. 2002.
[4] K. Fukuchi, T. Kasamatsu, M. Morie, R. Ohhira, T. Ito, K. Sekiya, D. Ogasahara,
and T. Ono, “10.96-Tb/s (273×40-Gb/s) triple-band/ultra dense WDM optical-
repeated transmission experiment,” presented at the Tech. Dig. Optical Fiber
communication Conf. (OFC), Anaheim, CA,2001, Paper PD24.
[5] R. D. Feldman, E. E. Harstead, S. Jiang, T. H. Wood, and M. Zirngibl, “An
evaluation of architectures incorporating wavelength division multiplexing for
broad-band fiber access,” J. Light w. Technol., vol. 16, no. 9,pp. 1546–1559, Sep.
1998.
[6] K. Iwatsuki, J. Kani, H. Suzuki, and M. Fujiwara, “Access and metro networks
based on WDM technologies,” J. Light w. Technol., vol. 22, no. 11, pp. 2623–2630,
Nov. 2004.
[7] ] J. S. Lee, Y. C. Chung, and D. J. DiGiovanni, “Spectrum-sliced fiber amplifier
light source for multichannel WDM applications,” IEEE Photon. Technol. Lett.,
vol. 5, no. 12, pp. 1458–1461, Dec. 1993.
[8] ] K. Akimoto, J. Kani, M. Teshima, and K. Iwatsuki, “Super-dense WDM
transmission of spectrum-sliced incoherent light for wide-area access network,” J.
Light w. Technol., vol. 21, no. 11, pp. 2715–2722, Nov. 2003.
48

[9] J. H. Han, S. J. Kim, and J. S. Lee, “Transmission of 4 × 2.5-Gb/s spectrum-sliced
incoherent light channels over 240 km of dispersion shifted fiber with 200-GHz
channel spacing,” IEEE Photon. Technol. Lett., vol. 11, no. 7, pp. 901–903, Jul.
1999.
[10] S. J. Kim, J. H. Han, J. S. Lee, and C. S. Park, “Intensity noise suppression in
spectrum-sliced incoherent light communication systems using a gain saturated
semiconductor optical amplifier,” IEEE Photon. Technol. Lett., vol. 11, no. 8, pp.
1042–1044, Aug. 1999.
[11] K. H. Han, E. S. Son, H. Y. Choi, K. W. Lim, and Y. C. Chung, “Bidirectional
WDMPON using light-emitting diodes spectrum-sliced with cyclic arrayed-
waveguide grating,” IEEE Photon. Technol. Lett., vol. 16, no. 10,pp. 2380–2382,
Oct. 2004.
49

PUBLICATIONS
[1] S.Immanuel, Dr.A.Sivanantha Raja, (2012) “Increase in Scalability of DWDM
Transmission using Forward Error Correction". National Conference on
Microwave & Optical Communication, Alagappa Chettiar College of Engineering
& Technology, Karaikudi.
50
Related Documents