Giampaolo Lanzieri 2013 edition Long-term contribution of migration in ageing populations: Japan compared with Europe Statistical working papers ISSN 1681-4789 ISSN 2315-0807

Welcome message from author
This document is posted to help you gain knowledge. Please leave a comment to let me know what you think about it! Share it to your friends and learn new things together.
Transcript

Giampaolo Lanzieri
2013 edition
Long-term contribution of migration in ageing populations: Japan compared with Europe
Exer in vu
lla faci blam
con
se euis n
ibh
el utat d
ip ex elestisim
R
ilis aug
iati siscilit venis n
im
Statistical working papers
ISSN 1681-4789
2013
ed
ition
ISSN 2315-0807

Giampaolo Lanzieri
2013 edition
Long-term contribution of migration in ageingpopulations: Japan compared with Europe
Statistical working papers
2013 edition

Europe Direct is a service to help you find answers to your questions about the European Union.
Freephone number (*):
00 800 6 7 8 9 10 11 (*) The information given is free, as are most calls (though some operators, phone boxes or hotels
may charge you). More information on the European Union is available on the Internet (http://europa.eu). Cataloguing data can be found at the end of this publication. Luxembourg: Publications Office of the European Union, 2013 ISBN 978-92-79-32339-3 ISSN 2315-0807 doi:10.2785/29184 Cat. No: KS-TC-13-001-EN-N Theme: Population and social conditions Collection: Statistical working papers © European Union, 2013 Reproduction is authorised provided the source is acknowledged.
3 Long-term contribution of migration in ageing populations: Japan compared with Europe
Table of contents 0BAbstract ........................................................................................................................... 0H4
1BIntroduction ..................................................................................................................... 1H4
9BPrevious related studies and current contribution ..................................................................... 2H5
10BData sources and geographic coverage ................................................................................... 3H7
2BA description of past and future demographic trends in Japan and Europe ................... 4H8
11BAssumptions about the future course of fertility, mortality and migration .................................. 5H9
12BNumber of events and age structures ..................................................................................... 6H10
13BChanging age structures ......................................................................................................... 7H12
3BThe main factors of population dynamics in Japan ....................................................... 8H13
14BFurther insights on the past natural change ............................................................................ 9H16
15BPopulation momentum ............................................................................................................ 10H17
16BContribution of fertility and mortality to population ageing ...................................................... 11H18
17BProjections, assumptions and future population size .............................................................. 12H19
18BProjections, assumptions and future population ageing ......................................................... 13H20
19BAgeing: a ‘new’ demographic transition? ................................................................................ 14H21
4BAnd if…? — Thinking of different future scenarios ....................................................... 15H22
20BJapan converging with European countries .................................................................................. 16H22
21BA short-term rejuvenation input ............................................................................................... 17H24
22BPartial replacement migration .................................................................................................. 18H25
5BThe contribution of migration to the composition of the future population .................... 19H26
23BThe states space ..................................................................................................................... 20H26
24BPopulation of foreign citizenship .............................................................................................. 21H27
25BPopulation of foreign background ............................................................................................ 22H28
26BThe challenge of the integration of migrants ........................................................................... 23H28
6BConclusions .................................................................................................................. 24H32
7BReferences ................................................................................................................... 25H34
8BAcknowledgements and disclaimer .............................................................................. 26H37
4 Long-term contribution of migration in ageing populations: Japan compared with Europe
Abstract This paper looks at past and projected demographic trends in Japan in comparison to European countries to highlight similarities and differences between these low-fertility, ageing populations. The role and impact of the two demographic options (fertility and migration) to counteract the prospected population decline and ageing in Japan are analysed by means of formal demography results and multistate projections. After assessing the important but limited potential of the contribution of fertility, the study quantifies the consequences of various assumptions about immigration on the composition of its future population and compares those results with European prospects. It is shown that, within the range of the currently foreseeable assumptions, only a migration inflow comparable to that currently taking place towards Europe would avoid excessive population decline and ageing in Japan, but with a relevant diversification of its composition of the population. Within five decades, the population of foreign background would be particularly important in the younger age groups, where its share could reach from 10 % to 30 % of the population, depending on future inflows.
Introduction Several countries in the world are now experiencing, or are going to experience, population age structures never seen before. An ever-increasing life expectancy combined with below-replacement levels of fertility is modifying the shape of the age profile of the population from the well-known and traditional pyramid, with the larger younger cohorts at the bottom, to an almost reversed pyramid, where the larger cohorts are among the elderly. The process of ageing, as measured by any indicator, is expected to be particularly relevant in selected European countries and in East Asia, notably in Japan.
According to the latest projections from Eurostat (the Statistical Office of the European Union) and from the National Institute of Population and Social Security Research of Japan, the ageing of the population may speed up in the near future, driven by the ageing of the baby boomer generation. This ageing may be accompanied by a shrinking of the population size, with further repercussions on the potential labour force, which may no longer be sufficient to support economic growth. The demographic solutions envisaged by the countries affected may differ in this regard, but essentially they are aiming to increase fertility levels and/or increase the flow of immigration. An alternative approach, which would tackle the socio-economic challenges of a shrinking and ageing population without attempting to influence the components of population change (either natural change or net migration), is not usually perceived as an option, or such adaptations are simply left to demographic inertia.
All of these approaches have supporters and detractors. Decisions relating to childbearing are often considered as belonging to the private sphere of the individual, and therefore out of the reach of policy actions. On the other hand, national policies could be addressed to ensure favourable conditions for fertility, helping those who aspire to larger family sizes to meet their wishes. However, any increase in fertility would need at least a couple of decades before becoming ‘visible’ to the labour market. Migration is therefore often proposed as a quick and readily available solution to shortages in the labour force. Migratory flows may actually take place without any specific action or will by the host country. Historical events or contingent economic situations, in both the country of origin and the destination country, as well as particular geographical location, have seen some European countries experience sudden rises in the flow of immigration in the recent past. In fact, EU Member States and Japan have different migration histories: over recent decades, the former have gradually transformed themselves from sending to receiving countries, migration becoming an — if not the most — important component of population change; the latter has always recorded low levels of migration, its population growth being supported by the vital events so far.
However, the impact of migration on the composition of their populations has not yet been thoroughly analysed. In fact, in addition to the arithmetical increase of the population size due to the arrival of immigrants, their contribution to demographic changes via

5 Long-term contribution of migration in ageing populations: Japan compared with Europe
fertility and mortality also needs to be considered. As migrants are usually younger than natives, such a contribution becomes more and more visible with the ageing of the host population. Many commentators highlight the benefits of migration for the economy and for the demographic dynamic in general. However, besides the contribution to the labour market, the impact of migration on the future composition of the population may actually be central to discussions about concrete implementation of population policies, as well as ways of ensuring a smooth integration of migrants into the host society. In Europe, migration and integration of migrants are definitely important items in the current political agenda. As a rapidly ageing country, Japan may also want to consider these issues, benefitting from the experiences in other areas of the world, comparable as for economic and demographic dynamics.
Previous related studies and current contribution In general terms, Japan and several European countries are commonly considered to share a common demographic path. Are the prospected demographic futures as well as their drivers really similar between these two areas of the world? Many studies in the past have looked at the peculiarities of Japan, and Europe is also one of the areas of the world on which there is abundance of demographic analyses. However, apart from studies which take a global perspective, any direct comparison between the two is somehow missing.
General overviews of past demographic trends in Europe are usually readily available in the international literature and cover various time periods (e.g. regular publications from Eurostat, European Commission 2011, Avdeev et al. 2011, Monnier 2004, Bourgeois-Pichat 1981). Population projections for European countries are regularly issued by Eurostat (Lanzieri 2006, 2011a, Giannakouris 2008) together with their methodological details (Lanzieri 2004, 2005, 2007, 2009, 2010a). Other studies take a much broader and more speculative perspective on the demographic future of Europe (e.g. Demeny 2003, Coleman 2006a).
Perhaps due to difficulties in finding comparable and readily available data on this part of the word, such an abundance of general
demographic trends in the international literature of comparative regional studies is less easily seen for East Asia, although studies do exist (e.g. Attané et al. 2009). Methodological details about the population projections for Japan released by the National Institute of Population and Social Security Research are largely given in Kaneko et al. (2008, 2009) and IPSS (2012) and are built upon a number of preliminary analysis and the development of specific methodologies about fertility (e.g. Iwasawa and Kaneko 2010, Kaneko 2010) and mortality (e.g. Ishii 2010, Kaneko 2011). Mortality in Japan has received attention in the international literature (e.g. Meslé and Vallin 2006) due to its outperforming trends, which makes Japan the frontrunner in mortality improvements (Horiuchi 2011). As for fertility, given the importance of its latest trends, several scholars have performed comparative analyses between Japan and other East Asian and/or selected European countries on this specific demographic component (e.g. Feyrer et al. 2008, Suzuki 2009, Frejka et al. 2010), and many studies focus only on Japan (e.g. Ogawa and Retherford 1993, Retherford et al. 1996, Ogawa 2003, Boling 1998, 2008). Such a predominance of studies on Japanese fertility is probably also due to the fact that fertility is perceived as the primary (and for some the only feasible) component in which to intervene in order to counter prospected demographic trends.
In comparison to fertility and mortality, studies of the demographic consequences of migration for Japan are less abundant in the international literature — if they exist at all. However, the need in Japan for a foreign labour force in consideration of demographic and economic trends has already been presented for some time (e.g. Yamanaka 1993), with some studies focusing on ethnic groups specific to Japanese migration history (Tsuda 1999a, 1999b). As for Europe, the implications of significant immigration flows in low-fertility populations have been stressed since the 1980s (e.g. Espenshade 1986), when the effects of the decline in fertility after the post-World War II baby boom were becoming clearer, and it has been increasingly present in the scientific literature (e.g. Teitelbaum 2004, Coleman 2006b). The issue has also received attention in formal demography, where studies have been performed dealing with the effects of including immigration in population models (e.g. Espenshade et al. 1982) and its impact on

6 Long-term contribution of migration in ageing populations: Japan compared with Europe
composition of the population (e.g. Steinmann and Jäger 2000) or structure (e.g. Wu and Li 2003, Alho 2008).
This interaction between low fertility and immigration is considered essentially a ‘Western issue’, and it is also argued that these countries may follow a different pattern of ethnic diversification than East Asian countries (Coleman 2009). However, while drawing attention to this issue, no estimation of the impact of migration on the future composition of the population was usually provided, or it was done by assembling available projections (using different methodologies) carried out in single countries. Finally, a comparative quantitative study has been carried out on the EU Member States (Lanzieri 2011b), showing the relevant impact of migration on the future composition of the European population. These results were also recalled in the latest official demographic report of the European Commission (2011), which focused on the implications of migration on the composition of the population, highlighting how migration is contributing to the shape of new Europeans.
This study intends primarily to look at the potential demographic contribution of migrants to population change in Japan compared to the situation in the Member States of the European Union (EU) and in the countries of the European Free Trade Association (EFTA). As demographic changes may take a long time to fully develop, the period considered here ranges from 1960 to 2060, thus comprising 100 years, equally split between observed (1960–2010) and projected (2010–2060) data, the latter from the official projections in Japan and in the European Union. In the first part, a descriptive comparison is made between the past and projected demographic trends of Japan and European countries. Besides being a necessary starting point, by overlapping those trends the peculiarities of Japan can clearly be seen. In the second part, the analysis is deepened to identify the major demographic components responsible for population decline and ageing, including by using relations from formal demography. Its outcomes may be helpful to shed further light on the factors behind the population dynamics in Japan, and thus to identify potential demographic levers. In the third part, the focus is on future developments, and it is assumed that Japan will behave demographically in a similar manner to European countries or experience
different migratory flows. What then would be its demographic perspective? In fact, considering alternative scenarios highlights the importance of attributing the right meaning to the projections, which are not pure forecasts. Projections have an important informative function for policy-makers, who should become used to being confronted with various scenarios, as in other domains where future developments are analysed. Finally, the fourth part focuses on the contribution of migrants to demographic changes, comparing the prospected composition of the population in Japan and in European countries. This final part provides, probably for the first time, specific quantitative information to the discussion on migration policies in Japan.
The perspective taken in this study is to set the spotlight on Japan and to use the European countries as background for comparisons. Obviously, ‘Europe’ groups together countries whose demographic profile is quite different, and therefore efforts are here made to keep the analysis at national level, but without blurring the picture with a series of country-by-country comparisons. This analysis also keeps a purely demographic perspective, without entering into the field of possible population policy, although actually demographic issues do not necessarily require demographic solutions. Finally, this study looks at population dynamics from three points of view: change in population size (growth/decline), population ageing and composition of the population. While the former two are basic standards for analysis, the latter has received relatively little attention so far. To tackle the issue of the composition of the population, the multistate population projections technique is used here.
Therefore, the first contribution of this study is to look at the past and future demography of Japan in relative terms, where European countries provide the basis for comparison for the assessment. Then, it shows what the potential influence is and thus what the margins of action are of the demographic levers (fertility and migration) to counterbalance current demographic trends in Japan. It clarifies the extent of the validity of the claimed demographic similarity between Japan and Europe. Further, it gives a clear quantification of the effect of migration on the prospective composition of the population of Japan, so far missing in the literature. To do so, the analysis also uses results from formal demography and

7 Long-term contribution of migration in ageing populations: Japan compared with Europe
an advanced projections methodology, this latter applied keeping consistency with the latest official results. This study thus also indirectly shows the benefits of different methodologies for the demographic analysis of Japan.
Data sources and geographic coverage European data are from Eurobase, the database of Eurostat, apart from a small amount of data about past fertility and mortality indicators, taken from the Database of Developed Countries of INED, the National Institute of Demographic Studies of France. Input data on Japan are mainly from the Statistics Bureau (population estimates and vital events), the Ministry of Health, Labour and Welfare (vital events), the Ministry of Justice (migration) and the Japanese Mortality Database (mortality) for past data and indicators, and from the National Institute of Population and Social Security Research for data from projections. However, all computations of rates and projected indicators for both Japan and European countries have been performed in this study using a common methodology. Unlike most of the statistics usually available, data for Japan here include foreigners, apart from live births from foreign mothers, which are not available for the period 1967–1986.
To ease comparisons between Japan and European countries, a few adaptations have been necessary. All the population data are here expressed as of 1 January of the given year(s) and all flow data (either vital events or migration) refer to the calendar year, i.e. the period from 1 January to 31 December of the given years(s). This time referencing is slightly different from the one adopted in Japan, where the so-called ‘Fiscal Year’ (FY), running from 1 April of a given year to 31 March of the following year, is the usual time window of reference, and 1 October (which is in fact the mid-period of the FY) is the date to which population data are referred. As for the unknown, persons with unknown citizenship have been included in the foreign population and persons with unknown age have been proportionally attributed to single age classes. Therefore, the figures computed in this study cannot match exactly the values reported in other official Japanese publications, although they should be a close approximation.
Further, the graphs displayed in this paper make use of statistics of distribution for Europe. For each year, the solid bold grey lines represent the minimum and maximum values recorded among European countries, which of course do not necessarily refer to the same country over the whole period. The grey bold dashed lines corresponds to the 1st and 9th deciles, the dashed black lines to the 1st and 3rd quartile, and the central dotted line to the median. As the number of countries considered here is 31, the median in fact identifies a specific country; further, on each side, the dashed grey line identifies a specific country and excludes the three European countries with the most extreme values, the interval between the black and grey dashed lines contains the further four, and the interval between the median and the dashed black line the residual seven. Japan is always shown with a solid black line. For a small number of indicators, the values are not available for all European countries and the corresponding time series are then shown only for the years for which there is full coverage.
Initial estimates of the foreign population in Japan are based on the latest Census 2010 results. However, in any country, the exercise of taking a census may be confronted with population groups difficult to reach, and typically this is the case with the foreign population. Thus, it should not be surprising if this specific group were insufficiently covered by the Japanese census, and the effective size of the foreign population in Japan could be even one third higher than that resulting from the census. The outcomes presented in this study referring to the foreign population size should therefore be considered an underestimate.
For the sake of simplicity, the following set of 31 European countries, members of the EU or of the EFTA, is referred to here as ‘Europe’, although it does not cover the whole continent: Austria (AT), Belgium (BE), Bulgaria (BG), Cyprus (CY), the Czech Republic (CZ), Denmark (DK), Estonia (EE), Finland (FI), France (FR), Germany (DE), Greece (EL), Hungary (HU), Iceland (IS), Ireland (IE), Italy (IT), Latvia (LV), Liechtenstein (LI), Lithuania (LT), Luxembourg (LU), Malta (MT), the Netherlands (NL), Norway (NO), Poland (PL), Portugal (PT), Romania (RO), Slovakia (SK), Slovenia (SI), Spain (ES), Sweden (SE), Switzerland (CH) and the United Kingdom (UK). Occasionally, two further aggregates are

8 Long-term contribution of migration in ageing populations: Japan compared with Europe
presented for Europe: one is the simple arithmetic average of the values recorded in the European countries (Avg EU+), the other is the
value referring to Europe as a whole (EU+), where therefore the relative weight of the countries plays a role.
A description of past and future demographic trends in Japan and Europe Starting from 1960, the population size has been increasing in Japan and in many, but not all, European countries. The left panel of Figure 1 shows the population trend of Japan compared to distribution statistics for Europe. For the first five decades, the population size of Japan has been growing as in European countries with higher growth, but it is projected that this trend
will reverse in the half-century to come, classifying Japan in the group of European countries with low population growth or even decline compared to 1960 (the Czech Republic, Estonia, Lithuania and Romania). For at least three quarters of European countries, the population size in 2060 is instead projected to be higher than 100 years earlier.
Figure 1: Actual and projected population size
Since in the projected period there is a reversal of past trends, it is interesting to take a closer look at it, as in the right panel of Figure 1. Compared to the situation on 1 January 2010, Japan is projected to experience the fastest population decline. As soon as the 2020s, its population decline would be comparable to that projected for Latvia and Lithuania, and before 2050 the population of Japan would have a stronger shrinking than Bulgaria, the country with the highest projected population decline in Europe, ending in 2060 with a population size about one third smaller than in 2010. More than half of European countries are instead projected to have a larger population size at the end of the projected period.

9 Long-term contribution of migration in ageing populations: Japan compared with Europe
Assumptions about the future course of fertility, mortality and migration According to the latest respective projection exercises, assumptions about future levels of fertility in Japan are almost stationary after the upturn which began in 2006, while for Europe a slight increase is projected along with convergence between countries (see the top-left panel of Figure 2). Hence, while since the year after the ‘year of the Fire Horse’ (Hinoe-Uma) (1) fertility in Japan has been decreasing together with the mainstream of the European countries, from 2020 onwards, it is assumed that its level will depart from general European trends, progressively increasing the distance from Latvia, the European country with the lowest projected fertility. In fact, perhaps contrary to common belief, the European country which had in the past the smallest differences from Japan in the path of fertility decline is Hungary. Even focusing on the most recent decade, this still holds, although similarities with other countries (such as Poland, Romania, Germany and Italy) have also emerged.
As for assumptions about mortality, life expectancy at birth for men in Japan, while increasing with the group of European countries with higher values in the latest 15 years (such as Sweden and Switzerland), is projected to depart from them and to converge towards the median of the European values, going even further below (see the bottom-right panel of Figure 2). Values related to Japanese male life expectancy at birth at the end of the projected period are thus comparable with those projected for countries such as Austria, Denmark, Ireland, Portugal, Slovenia and Finland. Projected values for Japanese female life expectancy at birth (the bottom-left panel of Figure 2) instead retain the top ranking, although reducing the distance from those European countries with which Japan had closer values over the past decade (France, Spain and Switzerland).
Finally, the graph showing net migration rates (the top-right panel of Figure 2) highlight the volatility of this component, amplified by the fact that those values are here computed as
(1) According to the Japanese calendar, that year corresponds to a
particular astrological combination occurring every 60 years and believed to have negative consequences on girls born in that year. This belief may have affected the fertility rate of that year.
residual from the demographic balance and therefore incorporating all possible errors. (2) It is assumed that Japan will continue to take net migration values close to zero in the projected period, thus below the European countries with the lowest rates within two or three decades, despite the declining rates assumed for net migration in Europe.
(2) For instance, the peak for Japan in 2010 includes the difference
between the new census results and the population estimate for the previous year without post-census revision.

10 Long-term contribution of migration in ageing populations: Japan compared with Europe
Figure 2: Actual and projected values of fertility, migration and mortality indicators
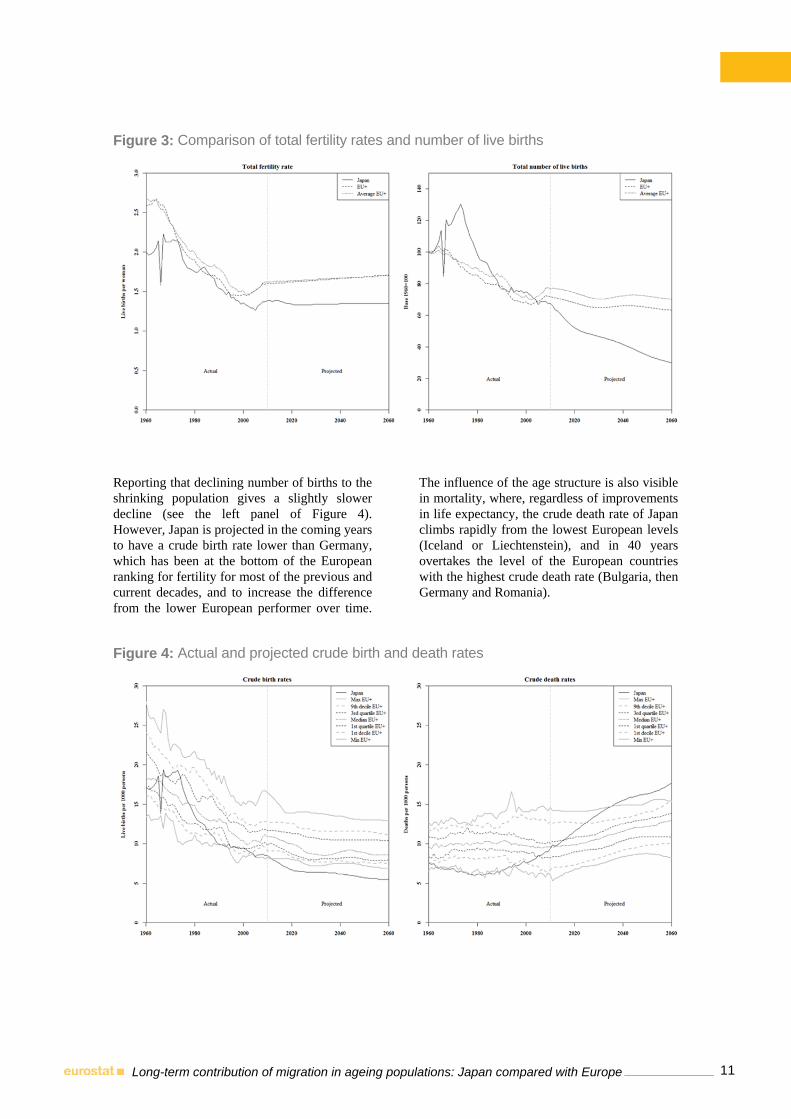
Number of events and age structures Therefore, in comparison with European countries, Japan is assumed to have lower but almost stable fertility, lower (for women) or similar (for men) mortality, and lower migration as well. However, to explain the projected trend reversal of the population size, these indicators have to be translated into a number of events. Figure 3 shows the trends for total fertility rates compared to the trend for the number of births.
Although fertility remains almost stable in the projected period, the number of births continues to decline in Japan, falling to about half a million at the end of the projected period. In Europe, the slight increase in fertility produces a just slightly declining number of births instead. This is because smaller cohorts of women of reproductive age will indeed deliver a shrinking number of births even in the presence of constant fertility rates.
11 Long-term contribution of migration in ageing populations: Japan compared with Europe
Figure 3: Comparison of total fertility rates and number of live births
Reporting that declining number of births to the shrinking population gives a slightly slower decline (see the left panel of Figure 4). However, Japan is projected in the coming years to have a crude birth rate lower than Germany, which has been at the bottom of the European ranking for fertility for most of the previous and current decades, and to increase the difference from the lower European performer over time.
The influence of the age structure is also visible in mortality, where, regardless of improvements in life expectancy, the crude death rate of Japan climbs rapidly from the lowest European levels (Iceland or Liechtenstein), and in 40 years overtakes the level of the European countries with the highest crude death rate (Bulgaria, then Germany and Romania).
Figure 4: Actual and projected crude birth and death rates

12 Long-term contribution of migration in ageing populations: Japan compared with Europe
Changing age structures The top-left panel of Figure 5 shows the declining trend in the proportion of young people (under the age of 15) in Japan. Already in 2010, this percentage was below that of Germany, the European country with the lowest share of young people. Japan is projected to further depart from the European countries and to end up with a negative difference of more than 2 p.p. in 2060 from Romania, which will by then be the country with the lowest percentage in Europe.
The older age structure of Japan in comparison to European countries is clearly visible looking at the ageing indicators in the same Figure 5. The percentage of the population aged 65 and over in Japan is already higher than the currently older (in demographic terms) European countries (Germany and Italy), and that difference is projected to increase up to about 4 p.p. by 2060 (from Latvia at that time). The impact on the Japanese pension system is more understandable looking at the old age dependency ratio, which shows a dramatic increase from 0.1 in 1960 to almost 0.8 elderly persons for every person of working age (15–64) in 2060. By that time, the European country
which is projected to have the highest OADR is Latvia, at a level lower than Japan by more than 10 %.
Bloom et al. (2000) explain the important role played by demographic change in economic growth in East Asia, and in particular by the so-called ‘demographic dividend’, delivered from the demographic transition and the resulting population change via labour supply, savings and human capital (Bloom et al. 2003). The importance of the links between the changing age structure and economy is also highlighted in Ogawa et al. (2010), who illustrate how the demographic transition translates in fact into two demographic dividends, the first (corresponding to the growth rate of the economic support ratio) being transitory, while the second (corresponding to the growth rate of productivity) potentially more long-lasting, depending upon the policies implemented. According to the official projections, that economically favourable demographic window will thus be closing in the coming decades, as rapidly in Japan as in European countries, as shown by the fall in the percentage of population of working age (the bottom-left panel of Figure 5).

13 Long-term contribution of migration in ageing populations: Japan compared with Europe
Figure 5: Actual and projected age structure indicators
The main factors of population dynamics in Japan Therefore, the number of live births decreases due to the shrinking of female generations reaching reproductive age, and the number of deaths increases due to the larger cohorts (from the baby boomer generation) reaching older ages. Still another component may play a role in population change: migration. Total population change can indeed be broken down into parts attributable to natural change (live births minus deaths) on one hand, and to net migration on the
other (including adjustments, if computed as residual from the demographic balancing equation). Representing these two components on a plan (with the axes crossing at a value of zero) shows the countries which have population growth or decline, depending on their position on the plan. Further, by taking into account the relative intensity of the components of population change, the countries can be classified by typology as in Table 1.
14 Long-term contribution of migration in ageing populations: Japan compared with Europe
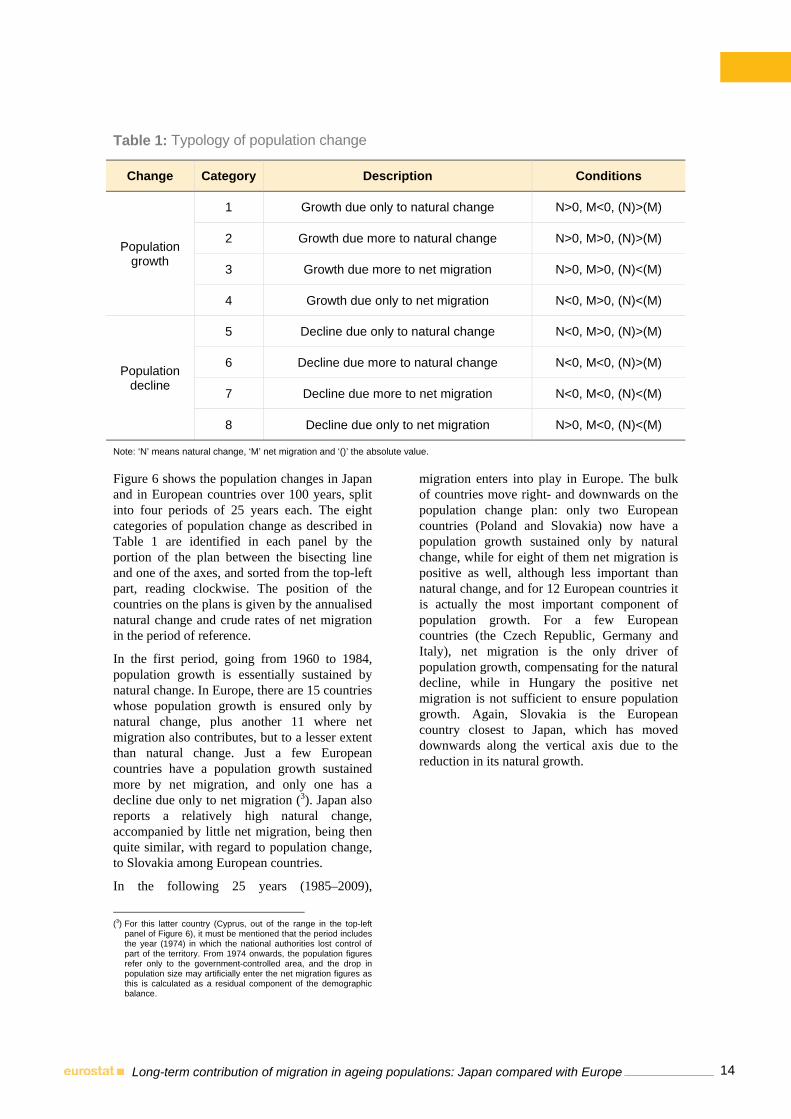
Table 1: Typology of population change
Change Category Description Conditions
Population growth
1 Growth due only to natural change N>0, M<0, (N)>(M)
2 Growth due more to natural change N>0, M>0, (N)>(M)
3 Growth due more to net migration N>0, M>0, (N)<(M)
4 Growth due only to net migration N<0, M>0, (N)<(M)
Population decline
5 Decline due only to natural change N<0, M>0, (N)>(M)
6 Decline due more to natural change N<0, M<0, (N)>(M)
7 Decline due more to net migration N<0, M<0, (N)<(M)
8 Decline due only to net migration N>0, M<0, (N)<(M)
Note: ‘N’ means natural change, ‘M’ net migration and ‘()’ the absolute value.
Figure 6 shows the population changes in Japan and in European countries over 100 years, split into four periods of 25 years each. The eight categories of population change as described in Table 1 are identified in each panel by the portion of the plan between the bisecting line and one of the axes, and sorted from the top-left part, reading clockwise. The position of the countries on the plans is given by the annualised natural change and crude rates of net migration in the period of reference.
In the first period, going from 1960 to 1984, population growth is essentially sustained by natural change. In Europe, there are 15 countries whose population growth is ensured only by natural change, plus another 11 where net migration also contributes, but to a lesser extent than natural change. Just a few European countries have a population growth sustained more by net migration, and only one has a decline due only to net migration (3). Japan also reports a relatively high natural change, accompanied by little net migration, being then quite similar, with regard to population change, to Slovakia among European countries.
In the following 25 years (1985–2009),
(3) For this latter country (Cyprus, out of the range in the top-left
panel of Figure 6), it must be mentioned that the period includes the year (1974) in which the national authorities lost control of part of the territory. From 1974 onwards, the population figures refer only to the government-controlled area, and the drop in population size may artificially enter the net migration figures as this is calculated as a residual component of the demographic balance.
migration enters into play in Europe. The bulk of countries move right- and downwards on the population change plan: only two European countries (Poland and Slovakia) now have a population growth sustained only by natural change, while for eight of them net migration is positive as well, although less important than natural change, and for 12 European countries it is actually the most important component of population growth. For a few European countries (the Czech Republic, Germany and Italy), net migration is the only driver of population growth, compensating for the natural decline, while in Hungary the positive net migration is not sufficient to ensure population growth. Again, Slovakia is the European country closest to Japan, which has moved downwards along the vertical axis due to the reduction in its natural growth.

15 Long-term contribution of migration in ageing populations: Japan compared with Europe
Figure 6: Actual and projected population change in Japan and in European countries by 25-year period
Note: CY and IS out of range in the top-left panel, respectively in the slices corresponding to categories 8 and 1 of Table 1.
In the first part of the projected period (2010–2034), natural growth slows down further and migration remains the most important component of population change, although on a reduced scale. European countries, besides having moved slightly downward on the plan, are indeed less dispersed and closer to the origin, and none any longer present rates higher than 20 per thousand of the population. Only in Iceland is population growth only due to natural change; 13 countries are still growing thanks to both components, but now the number of those whose growth is only due to net migration increases to eight. The remaining European
countries (nine in total) are now experiencing a population decline (for both components in the Baltic countries and Bulgaria, in the others despite the positive net migration). Japan continues moving downward along the vertical axis, entering the area of population decline, and it gets close to Latvia.
In the last part of the projected period (2035–2060), positive net migration is no longer sufficient to sustain population growth, faced with the scale of the natural decline. European countries are projected to move downward on the plan, and most of them (18) are grouped into the area characterised by a natural decline

16 Long-term contribution of migration in ageing populations: Japan compared with Europe
stronger than the positive net migration. In 11 countries, net migration is still the main engine of population growth, while Iceland and Ireland are the only two countries where population growth is still due more to natural change. Japan continues its vertical fall and, although Latvia is still the closest European country, the distance between them has increased.
Further insights on the past natural change If natural change is the main factor behind the population change (growth/decline) of Japan, it may be interesting to look at which component (fertility or mortality) has played the most important part. The first, most intuitive comparison would be between the respective crude rates. Looking again at Figure 4 (the two panels have the same scale), it can there be seen how mortality started playing a more important role from the 1990s onwards, while fertility has been declining all the time since the 1970s. The two cross each other during the past decade. However, these crude rates are influenced by the underlying age structure, which has been changing over time. From the theory of stable populations, it is known that if fertility and mortality rates are kept constant, any population would converge to an age structure independent from the original one and defined only by fertility and mortality schedules, a property called (strong) ergodicity. The growth rate of this ultimate stable-equivalent population is called the intrinsic growth rate. Preston and Guillot (1997) provides a simple formula to decompose the intrinsic growth rate r into the contributions of fertility and mortality:
( ) ( ) ( )[ ]T
ApSTFRr Mlnlnln ++
= [1]
where S is the proportion of female births assumed constant across ages of the mothers, p(AM) is the probability of surviving from birth to the mean age at childbearing and T is the mean length of a generation.
Assimilating Japan to a closed population, i.e. a population without in- or out-migration, the ln(TFR) and ln[p(AM)] have been estimated for the period 1960–2010 and are shown in the left panel of Figure 7, together with the approximate estimate of the intrinsic growth rate corresponding to the fertility and mortality
schedules of each year. Fertility provides a higher contribution to the level of the growth rate in the stable-equivalent populations, although its importance decreases over time; mortality instead has an almost null influence, at least from 1980 onwards. Due to the (constant) negative effect of the proportion of female births (not shown), the intrinsic growth rate decreases over time down to about -1.5 % in the past decade. Thus, if current fertility and mortality conditions were to remain for a long period, the ultimate stable-equivalent population of Japan would shrink to a rate such to halve that population within half a century.
Taking two points in time and assuming that the proportions of female births as well as the mean length of a generation do not change during that period, the contribution to the change of the intrinsic growth rate can be expressed as:
( )( )
+
⋅=Δ
1
2
1
2
lnln1
M
M
Ap
Ap
TFR
TFR
Tr [2]
where the indexes 1 and 2 refer to the two successive points in time, respectively before and after the changes. By using [2], it can be estimated that the decline of the TFR from 1960 to 2009 has reduced the intrinsic growth rate by 0.014, while improvements in mortality have increased it by 0.003, other conditions being equal. In summary, fertility has been playing the major role in what concerns the influence on both levels and changes in the long-term prospects of population growth/decline, i.e. once the effect of the contemporary age structure is removed.
As for Europe as a whole, whose starting level is higher than in Japan in 1960, the relation above proves that the decline in the intrinsic growth rate, i.e. the annual growth rate that would prevail if fertility and mortality levels remained constant, depends on the proportional reduction of the TFR, and not on the absolute one. As the estimated change in the intrinsic growth rate for Europe as a whole due to the decline in fertility is about -0.017 (other conditions being equal), the fertility reduction which has occurred in the past 50 years would have had in Europe a larger (negative) impact on the intrinsic growth rate than in Japan.

17 Long-term contribution of migration in ageing populations: Japan compared with Europe
Figure 7: Theoretical contribution of fertility and mortality to population change and ageing
Note: for the sake of the readability of the graph and given the minor importance for the current analysis, ln(S) from [1] is not shown in the left panel.
Population momentum As discussed above, the decline of fertility combined with the age structure of the population has had a large influence on actual population trends in Japan, due to the shrinking of the number of women of reproductive age. Intuitively, in order to oppose this ongoing population decline and ageing, one would then think to increase the size of these cohorts of women. This situation recalls the concept of population momentum, originally proposed by Keyfitz (1971), who defines it as the ratio of the size of an ultimately stationary population (4) to that of an initial stable population when fertility is immediately shifted to the replacement level. In its original formulation, Keyfitz was referring to the case of (stable) population growth rather than decline, but the concept has been further elaborated and is now widespread and also applicable to declining populations.
Bongaarts and Bulatao (1999) report a simplified analytical expression to compute the population momentum, based on the ratio of the proportion of females under the age of 30 in the original population to the same proportion in the
(4) A stationary population is a population whose growth rate is zero
and results from births, age-specific death rates and age-specific net migration rates all remaining constant over time. It is usually considered the case of net migration rates equal to zero at any age. The stationary population is a special case of the stable population (concept used in the previous paragraph).
ultimate population which emerges in the long run with fertility at replacement level, mortality fixed, and zero migration. By adopting their method, the population momentum has been computed for Japan as well as for all European countries, and reported in Table 2.

18 Long-term contribution of migration in ageing populations: Japan compared with Europe
Table 2: Momentum multiplier in 2010 in Japan and in the European countries, sorted in ascending order
JP 0.815 LV 0.893 FI 0.952 LU 0.991
IT 0.823 PT 0.894 DK 0.961 MT 0.993
BG 0.824 ES 0.902 BE 0.962 UK 1.018
DE 0.835 RO 0.917 LI 0.967 FR 1.030
EL 0.851 AT 0.918 SK 0.972 NO 1.040
HU 0.860 LT 0.928 PL 0.979 CY 1.117
SI 0.865 EE 0.930 NL 0.980 IE 1.163
CZ 0.880 CH 0.933 SE 0.985 IS 1.190
It can be seen that Japan has a lower momentum than any European country, implying that its population would have proportionally the biggest decrease due to its age structure before reaching the stationary state. On the contrary, in a group of European countries (the United Kingdom, France, Norway, Cyprus, Ireland and Iceland) the momentum is still positive and hence the population would continue to grow even if fertility were immediately set at the replacement level and mortality ceased to improve. Although the age structure of a population is essentially the outcome of past vital rates, the comparisons in Figure 2 and Figure 3 show that the declining path of Japanese fertility from above-replacement levels has not been that different from the European one, and in the previous paragraph it has been estimated that its impact on the intrinsic growth rate is less than for Europe. What made the difference is then probably the different contribution of migration to population change in recent decades, which in Europe has modified the results of the action of the vital rates, especially in the childbearing ages.
Contribution of fertility and mortality to population ageing Population momentum is closely linked to the ageing of the population, as proved by Kim and Schoen (1997) using three different measures of ageing. Both are, in fact, related to changes in the vital rates, one looking at the consequences on population size, the other on its age structure. The analysis of population momentum has already provided information about the relevance of the current age structure (which is, in its turn, the outcome of past vital rates) on the ultimate population size. Once migration is
excluded, thus assuming Japan to be a closed population, the assessment of the relative importance of fertility and mortality for the ageing of the population can be carried out using a relation proposed by Preston et al. (1989). Starting from the consideration that ageing is a natural process which, in a theoretical closed population with no vital events, would take place at regular speed (one year more of the population mean age for each calendar year), Preston et al. (1989) prove that in a closed population it is the combined action of birth and death rates which opposes this process, as in the following equation:
( ) PPDP AbAAddtdA ⋅−−⋅−= 1 [3]
where dtdAP is the derivative of the mean age of population AP with respect to time, AD is the mean age at death, and b and d are respectively the crude birth and death rates. Therefore, the higher the (positive) difference between the mean age at death and the mean age of the population (multiplied by the death rate), the stronger the contribution of mortality to the opposition to the ageing process. More intuitively for fertility, the higher the birth rate (multiplied by the mean age of the population), the stronger the opposition as well.
Those quantities have been estimated for the period 1960–2010 for Japan and shown in the right panel of Figure 7. The solid line is the annual change in the mean age of the population. In the absence of vital events, that change would be equal to one. That line is never equal to one in Figure 7, but it is always in the upper positive half, meaning that the population in Japan has anyway aged over time. The two lines in the lower negative half are the contributions of fertility and mortality to the
19 Long-term contribution of migration in ageing populations: Japan compared with Europe
opposition to the ageing. Fertility is always more negative than mortality, meaning that the contribution of the former is more important of that of the latter, but none, either singularly or combined, reach levels sufficient to stop (or even reverse) the population ageing. Looking at the relative contributions, the ageing has been ‘allowed’ (i.e. less opposed) more by mortality
than by fertility, and therefore, using an expression popular among demographers, the ageing in Japan has taken place more ‘from the top’ of the (age) pyramid rather than ‘from the bottom’. This outcome is against a probably common belief that fertility has been the main cause so far of the ageing population in Japan.
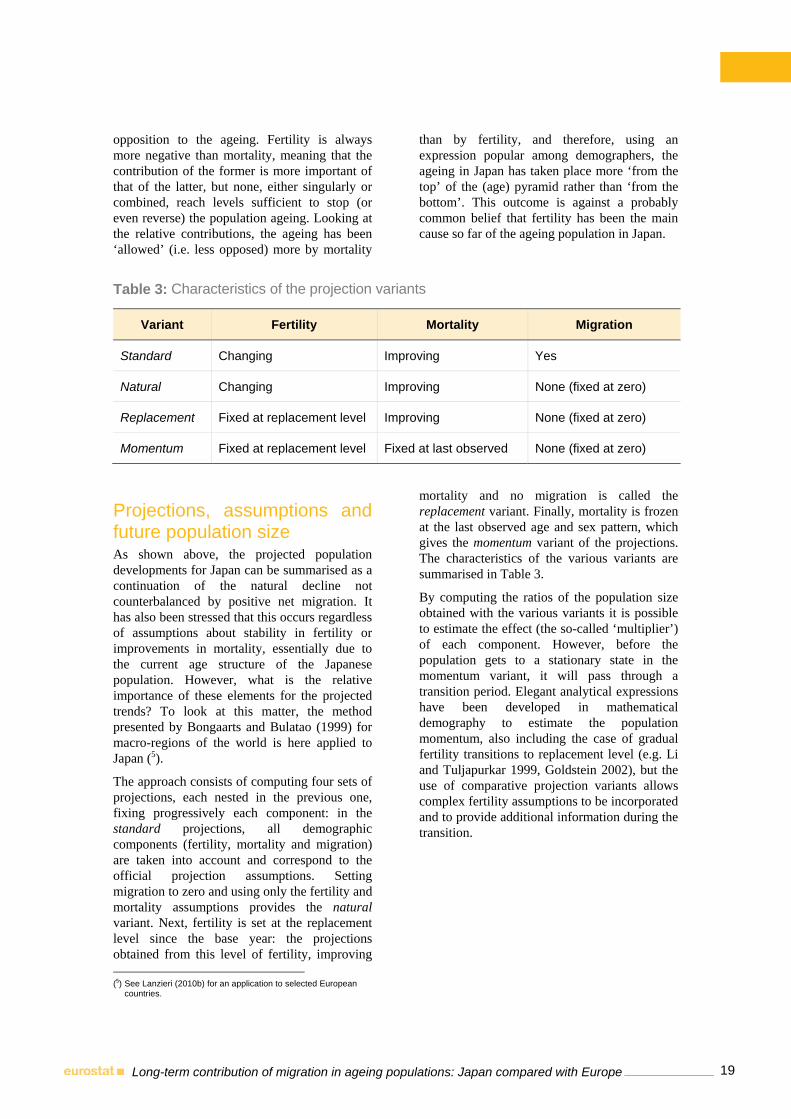
Table 3: Characteristics of the projection variants
Variant Fertility Mortality Migration
Standard Changing Improving Yes
Natural Changing Improving None (fixed at zero)
Replacement Fixed at replacement level Improving None (fixed at zero)
Momentum Fixed at replacement level Fixed at last observed None (fixed at zero)
Projections, assumptions and future population size As shown above, the projected population developments for Japan can be summarised as a continuation of the natural decline not counterbalanced by positive net migration. It has also been stressed that this occurs regardless of assumptions about stability in fertility or improvements in mortality, essentially due to the current age structure of the Japanese population. However, what is the relative importance of these elements for the projected trends? To look at this matter, the method presented by Bongaarts and Bulatao (1999) for macro-regions of the world is here applied to Japan (5).
The approach consists of computing four sets of projections, each nested in the previous one, fixing progressively each component: in the standard projections, all demographic components (fertility, mortality and migration) are taken into account and correspond to the official projection assumptions. Setting migration to zero and using only the fertility and mortality assumptions provides the natural variant. Next, fertility is set at the replacement level since the base year: the projections obtained from this level of fertility, improving (5) See Lanzieri (2010b) for an application to selected European
countries.
mortality and no migration is called the replacement variant. Finally, mortality is frozen at the last observed age and sex pattern, which gives the momentum variant of the projections. The characteristics of the various variants are summarised in Table 3.
By computing the ratios of the population size obtained with the various variants it is possible to estimate the effect (the so-called ‘multiplier’) of each component. However, before the population gets to a stationary state in the momentum variant, it will pass through a transition period. Elegant analytical expressions have been developed in mathematical demography to estimate the population momentum, also including the case of gradual fertility transitions to replacement level (e.g. Li and Tuljapurkar 1999, Goldstein 2002), but the use of comparative projection variants allows complex fertility assumptions to be incorporated and to provide additional information during the transition.
20 Long-term contribution of migration in ageing populations: Japan compared with Europe
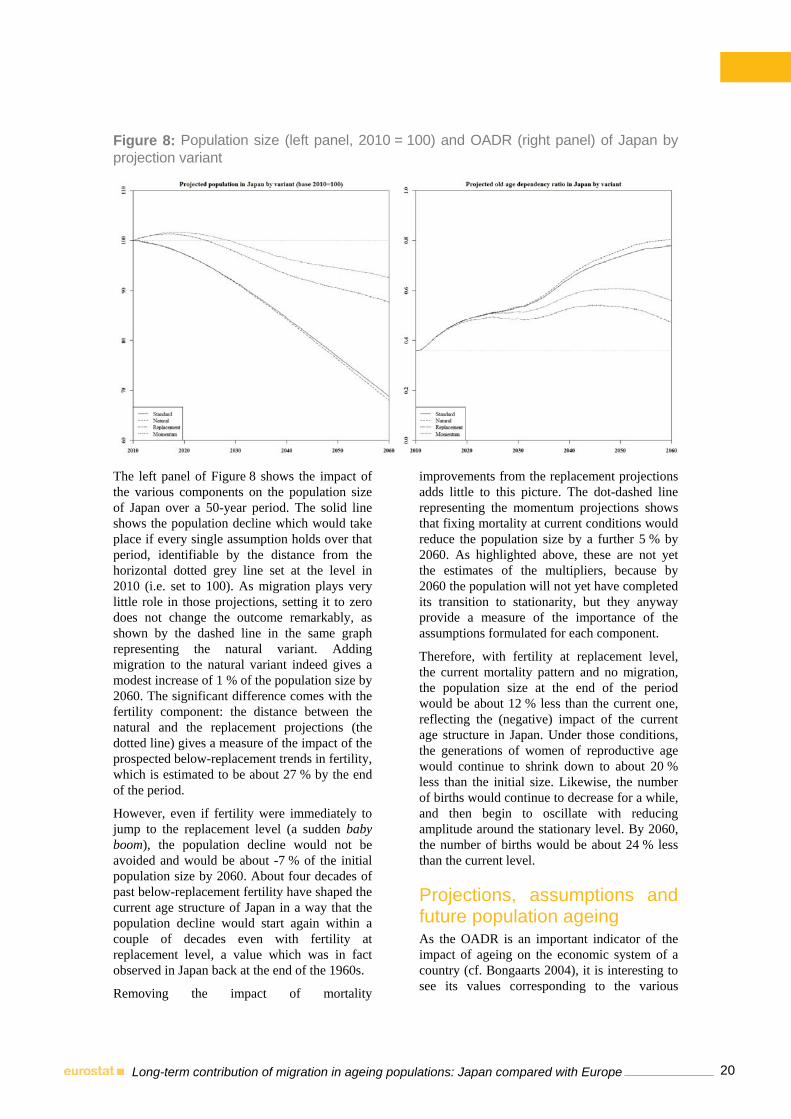
Figure 8: Population size (left panel, 2010 = 100) and OADR (right panel) of Japan by projection variant
The left panel of Figure 8 shows the impact of the various components on the population size of Japan over a 50-year period. The solid line shows the population decline which would take place if every single assumption holds over that period, identifiable by the distance from the horizontal dotted grey line set at the level in 2010 (i.e. set to 100). As migration plays very little role in those projections, setting it to zero does not change the outcome remarkably, as shown by the dashed line in the same graph representing the natural variant. Adding migration to the natural variant indeed gives a modest increase of 1 % of the population size by 2060. The significant difference comes with the fertility component: the distance between the natural and the replacement projections (the dotted line) gives a measure of the impact of the prospected below-replacement trends in fertility, which is estimated to be about 27 % by the end of the period.
However, even if fertility were immediately to jump to the replacement level (a sudden baby boom), the population decline would not be avoided and would be about -7 % of the initial population size by 2060. About four decades of past below-replacement fertility have shaped the current age structure of Japan in a way that the population decline would start again within a couple of decades even with fertility at replacement level, a value which was in fact observed in Japan back at the end of the 1960s.
Removing the impact of mortality
improvements from the replacement projections adds little to this picture. The dot-dashed line representing the momentum projections shows that fixing mortality at current conditions would reduce the population size by a further 5 % by 2060. As highlighted above, these are not yet the estimates of the multipliers, because by 2060 the population will not yet have completed its transition to stationarity, but they anyway provide a measure of the importance of the assumptions formulated for each component.
Therefore, with fertility at replacement level, the current mortality pattern and no migration, the population size at the end of the period would be about 12 % less than the current one, reflecting the (negative) impact of the current age structure in Japan. Under those conditions, the generations of women of reproductive age would continue to shrink down to about 20 % less than the initial size. Likewise, the number of births would continue to decrease for a while, and then begin to oscillate with reducing amplitude around the stationary level. By 2060, the number of births would be about 24 % less than the current level.
Projections, assumptions and future population ageing As the OADR is an important indicator of the impact of ageing on the economic system of a country (cf. Bongaarts 2004), it is interesting to see its values corresponding to the various

21 Long-term contribution of migration in ageing populations: Japan compared with Europe
variants during the transition to stationarity, as shown in the right panel of Figure 8. Under the standard set of assumptions, by 2060 the OADR would reach a level of about 0.78. Given its already moderate levels, migration alleviates only a little the weight of the elderly on the population of working age, and closing to migration implies an increase of less than 0.03 in the OADR. On the contrary, fertility at the replacement level would reduce it to 0.56, a remarkable downward change, although occurring after the threshold of 0.60 has been exceeded for some years. If mortality were also not to improve anymore, the OADR would end at a level just about 0.11 more than the current value, although passing through a period with higher values. However, in no variant would the ageing stop its increase by 2060, although its extent is obviously dependent on the assumptions.
Ageing: a ‘new’ demographic transition? The decline in fertility to below-replacement levels is, then, a major factor in explaining past and projected trends in population size. However, long-lasting, constantly below-replacement fertility (and mortality) rates do not imply ageing, because after a while the proportionate age structure becomes stable. It is instead the change in the birth rates, either its acceleration or deceleration, which influences the age structure and therefore the ageing of the population. Therefore, from the point of view of formal demography, the so-called ‘First Demographic Transition’, defined by the change in birth and death rates from higher to lower levels, has temporary consequences on population growth and ageing, but not necessarily ‘forever’, because the lower levels on which those rates stabilise may (still) be sufficient to counterbalance the natural ageing of the population (and of course the population could also be stationary, but this is of less interest here).
This seems not to be the case for the countries under consideration. Over the past 50 years, Japan and European countries have moved from higher to lower fertility, and those rates
(together with mortality and migration) have not been intense enough (anymore) to counteract the ageing of the population. This latter process is expected to continue for a few decades more, then perhaps to stabilise afterwards at (much) higher levels, following a path which could be modelled by a logistic curve (Lanzieri 2011a). Such a stabilisation of ageing depends, of course, very much on the assumptions formulated for the very long term, and should then be taken with a high degree of caution. In particular, it is likely that the major force opposing ageing in the future will be mortality.
In presenting his idea about a Third Demographic Transition triggered by immigration in low-fertility countries, Coleman (2006 p.419) lists the criteria that a population change should meet to be labelled as a ‘transition’: rapidity (in historical terms), unprecedented, irreversible, and of high social, cultural and political relevance. It is quite straightforward to see there the characteristics of the process of ageing ongoing in Japan and Europe, at least the majority of them. While the intention here is not to analyse the validity of the classification of the population ageing as a ‘demographic transition’, such a label could actually help focus attention on the important challenges this process entails for future societies. Looking at ageing as a transition — thus a permanent shift to a stable higher level and not a temporary one — would further stress the importance of being prepared for this new socio-economic framework. Demographic levers are not the only options; on the contrary, several policies could and should be thought of to ensure a smooth transition and to be prepared for the new demographic regime. However, even confining ourselves to a ‘no-change’ policy scenario, it may be useful to explore all possible demographic options. While fertility definitely plays an important role in both population decline and ageing in Japan, even a sudden rise would not stop these ongoing processes. Further, according to the official projections, there are currently no signs of fertility recovery in Japan. This highlights the importance of looking at migration as a potential lever to counterbalance, or at least attenuate, Japanese demographic trends.
22 Long-term contribution of migration in ageing populations: Japan compared with Europe
And if…? — Thinking of different future scenariosIt has been shown above that, regardless of assumptions of vital rates, the population of Japan is expected to both decline and age due to its negative population momentum. However, the extent of these processes does depend on the future course of fertility, mortality and, last but not least, migration. Sensitivity variants are useful tools to assess the impact of changes in the assumptions on the population dynamics, but this is left to the official forecasters. The approach taken here is, instead, of thinking of different scenarios for the setting of assumptions.
On fertility and mortality, the easiest way to compare the structural differences between Japan and European countries is to assume that the former behaves demographically like the latter ones, and to incorporate Japan into the European convergence framework. The main assumption on which EU projections are based is that socio-economic differences between countries are fading in the very long term. This may give rise to some scepticism about the incorporation of Japan in the (converging) mainstream, considering the cultural differences. However, whether or not in the future the socio-economic drivers of fertility and mortality are the most important explanatory factors, the convergence scenario may be an alternative way of thinking about future Japanese dynamics, especially considering that demographic convergence is never fully achieved (not even between European countries) and that this framework is used to control for the range of variation in fertility and mortality across countries, which may sound plausible. As a matter of fact, demographic convergence has occurred in past decades (Wilson 2001), and although the timing and pace of fertility may be debatable (Dorius 2008, Lanzieri 2010c), on mortality such convergence may also concern forerunner countries as Japan (Wilmoth 1998).
As the European experience shows, migration is typically a very volatile component, and the one most influenced by policies and economic cycles. It is probably the easiest lever on which policy-makers can rely for population policies with an immediate impact, although in a global context the ‘migration market’ is becoming progressively competitive, at least for the skilled labour force. Immigration is not necessarily a
controlled phenomenon, but considering the geographical characteristics of Japan, this is more likely to be the case than in Europe. Two theoretical cases are considered here: in the first, it is assumed that policy-makers will opt for action on immigration limited in time, such as an injection of demographic rejuvenation to boost population growth and avoid excessive decline and ageing in the future; in the second, future migration inflows are linked to the shrinking of the population of working age. As for historical comparisons, the former may be roughly thought of as the migration from Europe to the USA at the beginning of last century, stopped by the Immigration Act of 1924; the latter as the labour migration occurring in Western Europe in the 1960s until the economic crisis of 1973 (cf. Fassmann and Münz 1992).
Therefore, three theoretical alternatives to the official scenario (here named ‘Standard’) are considered below. The first scenario, named ‘Convergence’, only modifies the fertility and mortality assumptions. The latter two focus instead on the migration assumptions, as the real lever available to policy-makers to driving future population change in Japan, and migrants are assumed to settle permanently in the country. Although a policy aiming to attract temporary workers is more likely in Japan, the full demographic effect of migration cannot take place if those workers leave the country after a while. As Tsuda (1999a) shows for the case of the nikkeijin (Brazilians of Japanese origin), permanent settlement does not always come from a decision taken once at the beginning of the immigration; it may well be the final outcome of a prolonged temporary stay.
Japan converging with European countries In order to isolate the impact of fertility and mortality assumptions, the migration assumptions are left unchanged, thus as from the official projections for Japan. The assumptions for fertility in the convergence scenario would point to a recovery of the TFR for both nationals and foreigners, as shown in the left panel of Figure 9, and to decreasing differences in fertility behaviour between these two population groups. As for mortality (right

23 Long-term contribution of migration in ageing populations: Japan compared with Europe
panel of Figure 9), there would not be much difference in the assumptions on female life expectancy at birth, but in the Convergence scenario male mortality would be assumed to
catch up with improvements in female life expectancy, which gives an increasing difference for male life expectancy at birth between the two scenarios.
Figure 9: Fertility and mortality assumptions for Japan in the Standard and Convergence scenarios
The left panel of Figure 10 shows the projected populations according to the various scenarios for 2010 to 2060. As expected, the higher fertility as well as male mortality assumptions of the Convergence scenario (the dashed line) reduce the projected population decline to 18 % of the original size, a difference of about 4 p.p. from the official projections (the solid grey line).
As for the ageing, showed in the right panel of Figure 10, the benefit of the more ‘generous’ assumptions of the Convergence scenario is little visible and can be quantified in a reduction of the OADR of about 0.02 by 2060, which would still place Japan 0.08 points above the European country with the highest projected
OADR (Latvia by that time). This should not come as a surprise, as it has been explained above that the current age structure of Japan would not stop the population ageing even for a much more significant recovery of fertility than that assumed in the Convergence scenario. Moreover, there is higher male life expectancy which may partially offset the downsizing effect of fertility on the OADR. From this point of view, fertility assumptions for Japan are ‘robust’ as to what concerns the impact on population decline and ageing for the next five decades, in the sense that variations — to the extent foreseeable as of today — from the current official set of assumptions would not radically modify the main messages.

24 Long-term contribution of migration in ageing populations: Japan compared with Europe
Figure 10: Projected population size and OADR in Japan by scenario
A short-term rejuvenation input The case of a temporary opening up to immigration to offset the negative population trends in Japan, the ‘Rejuvenation’ scenario, is here presented in two variants to highlight the relevance of the inflow size. In both variants, this exceptional migration inflow is assumed to take place in the period 2020–2029, when the effects of ageing may start to be more acute (see Figure 5) and in consideration of the time necessary to implement such a policy.
Assuming a net inflow of half a million foreigners each year per 10-year period, equally split by sex, this corresponds to a crude rate of about four persons per 1,000 inhabitants (not taking into account the migration of Japanese nationals), a proportion below that projected for several European countries in the same period (6). A more extreme hypothesis would be to consider a net inflow of one million foreigners each year over the same period, which would instead be a bit above the rates assumed for European countries (7). For all years before and after the ‘opening’ period, net migration of foreigners is set to the same level
(6) In fact it is just above the average of the values of the 3rd quartile
of the distribution of European countries in the period 2020–29, whose rates however include the migration of nationals. Including the migration of Japanese nationals, the average rate is actually below the European value. See also the top-right panel of Figure 2.
(7) European countries are assumed to have shrinking immigration flows after 2020, which contributes to explaining the high ranking of Japan under this scenario.
as the Standard scenario. Likewise, all the other assumptions (including migration of Japanese nationals) are as from the official Japanese projections, in which foreigners are assumed to have lower fertility than nationals. Therefore, in both variants, immigrants are assumed to be imin, i.e. permanent settlers, and not dekasegi, i.e. temporary workers who leave the country after a while.
In the first variant (named ‘Rejuvenation 0.5’, the black dotted line in both panels of Figure 10), the decrease in the number of women of reproductive age slows down after 2020 to then begin declining again at the same pace as in the Standard scenario after 2030, and getting progressively closer to that case. In the higher variant (named ‘Rejuvenation 1.0’, the black dot-dashed line in both panels of Figure 10), the shrinking of the cohorts of women of reproductive age is instead stopped after 2020, and a positive trend is projected to take place over that decade. However, afterwards that number would start again to decline down to a value 40 % less than the original size by 2060, but still about 10 p.p. higher than in the Standard scenario. In both variants, the number of births is then boosted in the decade 2020–29, and this ‘bubble’ propagates as a wave in the future, with the oscillations of the number of births getting progressively smaller in amplitude and closer on average to the number of births in the Standard scenario. By 2060, the number of live births in Japan would be about 44–50 % (depending on

25 Long-term contribution of migration in ageing populations: Japan compared with Europe
the variant) less than in 2010, thus 6–12 p.p. higher than in the Standard scenario.
Those waves of births are not visible in the projected total population size, but the overall effect can be seen. In the lower immigration variant, the population decline is stopped, while in the higher variant it is inverted (see left panel of Figure 10). However, that effect does not last long and the population re-starts its decline after 2030, keeping the same pace as the Standard scenario but with values shifted upwards. In the long term, those temporary deviations would be completely absorbed and the decline would be equal to that projected in the Standard scenario.
As for the ageing (right panel of Figure 10), the impact of the migration opening is much more interesting, as the OADR is projected to be at much lower levels, closer to the European values, within the time horizon of the projections. However, as immigrants age as well, when the generations which immigrated in the 2020s reach older ages, the OADR is likely to climb very rapidly, up to — if not higher than — the levels of the Standard scenario. Depending on the age profile of the immigrants, such an effect would probably take place after 2060, and it is therefore not visible in the current analysis.
Therefore, a temporary action generates a temporary outcome as well. The benefits of a migration limited in time have a shorter duration for the population decline, and a longer one for the ageing of the population (8). This may be understood as the effect of a baby boom, where the new-borns have the average age of the immigrants (9): there is a time window in which the demographic conditions are more favourable, but later on all cohorts arrive at older ages. For immigration, the demographic benefit is closer to the date of the event (immigration) than for fertility. From a purely demographic perspective, immigrants could be seen as new-borns in their twenties.
(8) For population size, the objective would be to avoid population
decline, while for the ageing of the population it would be to soften the increase: the durations mentioned in the sentence should be read from this perspective. Otherwise, the extent of the population decline is reduced throughout the projected period, which could also be considered a benefit of temporary immigration. .
(9) For the sake of precision, immigrants are likely to have different fertility (and mortality) than the host population, at least in the short term, and therefore they are not exactly the same as a baby boom shifted backwards by 20–30 years.
Partial replacement migration In this last scenario, named ‘Replacement’, it is again the case of immigrants who become permanent settlers in Japan, but the size of the inflows is this time determined by demographic conditions and not by a quota-like migration policy. It is assumed that approximately (10) one quarter of the projected shrinking of the population of working age from the official projections is replaced by foreign immigrants, and all other assumptions are as in the Standard scenario. This gives an average annual number of net foreign migrants below 250,000, a level far below the one assumed for Italy, which has a population size less than half that of Japan. Compared to the population, this assumptions corresponds to an average crude net migration rate (always restricted to foreigners) of about 2.1 net migrants per 1,000 inhabitants, a level which is even below the median of the European countries.
This gives a progressive slowing down of the decline of the cohorts of women of reproductive age and a similar pattern for the number of births. The increase in births in 2060 is estimated to be as high as 13 p.p. from the Standard scenario, again under the assumption of lower fertility among foreigners than Japanese women. This is a differential comparable to that obtained in the Convergence scenario, where fertility is assumed to increase, and higher than that based on a Rejuvenation input.
The final impact (in 2060) in terms of population size and ageing is similar to the previous migration scenario, but the path is smoother and progressive, and likely to also continue beyond that time horizon. As shown in the left panel of Figure 10, the population decline by 2060 estimated under the Replacement scenario is about 20 %, a result almost equal to that obtained with a high inflow of immigrants in a short period (variant Rejuvenation 1.0). As for the ageing (the right panel of Figure 10), the impact on the OADR for the next three decades is almost similar to the case of the variant Rejuvenation 0.5, but then it departs from it, being at lower levels ending at 0.66, a value below the European maximum projected for that year (taken by (10) The ‘replacement’ migration is not applied year by year, which
would indeed imply a replacement; instead, it is computed once for all from the Standard scenario and added to its migration assumption.

26 Long-term contribution of migration in ageing populations: Japan compared with Europe
Latvia). Here, the real difference between the migration assumptions is probably not visible, but it is likely that, after 2060, the OADR would remain almost stable in the Replacement scenario, contrary to what is expected in the Rejuvenation case.
Hence, this Replacement scenario would see Japan as a ‘European’ country, though penalised by lower fertility. Migration levels would be
comparable to those in Europe, and generated by the needs of the national labour market, therefore without necessarily a pro-active migration policy. As in Europe, continuing immigration flows in a low-fertility context is likely to contribute an important component to the shape of the future population of Japan. This issue is addressed in the following section.
The contribution of migration to the composition of the future population
The states space To control for future changes in the composition of the population, the projection methodology used here is based on the transitions between states (see van Imhoff and Keilman 1992). The population is classified according to a combination of characteristics, namely age, sex and citizenship background. For this latter, four states are here used: natives, immigrants, second-generation migrants and new citizens. The first category includes all nationals with
Japanese parents, the second the foreign immigrants, the third the offspring of these immigrants, and the last all persons who acquire Japanese citizenship as well as the offspring of mixed Japanese–foreign marriages. The persons classified either as immigrants or as second-generation migrants are then the foreign population or population with foreign citizenship, and adding the new citizens gives the population with foreign background (see Table 4).
Table 4: States space and its aggregations
Aggregation by citizenship Citizenship background Aggregation by background
Nationals Natives National background
New citizens
Foreign background Foreigners
Immigrants
Second generation migrants
For the sake of simplicity and due to the lack of information, the stock of second-generation migrants, as well as that of new citizens, is assumed to be null at the beginning of the projected period. It is also assumed that they are closed to migratory flows: therefore, migrants can only enter either the state of natives or that of immigrants. As for births, those from natives are considered to be natives as well, and likewise the offspring of new citizens are classified as new citizens. Births from immigrants can instead be classified either as a
‘new citizen’ (births from mixed unions with one Japanese parent) or as second-generation migrants, according to a predefined probability distribution. Births from second-generation migrants are instead assumed to be new citizens. This latter assumption makes those new-borns disappear from the ‘statistical view’ of the foreign population, but it is considered that either the degree of integration of the second-generation migrants would increase their chances of union with nationals or the development of legislative settings recognising

27 Long-term contribution of migration in ageing populations: Japan compared with Europe
jus soli (11) for the descendants of foreign background from the third generation onwards may be implemented, as is the case now, for instance, in Luxembourg. Anyway, the full contribution of migration to the composition of the population can be recovered from the breakdown by background, which groups all persons with at least one foreign ancestor. All the other assumptions are taken from the official Japanese projections. In particular for fertility, second-generation migrants are assumed to have the same demographic behaviour as (first-generation) immigrants, and the new citizens that of the natives. In fact, this implies that the fertility of the population with foreign backgrounds converges on the fertility of the natives as time passes. As for transitions between states, migrants of any of the two generations are assumed to acquire Japanese citizenship based on fixed age- and sex-specific rates, while Japanese people are assumed to never change their citizenship and transitions between immigrant and second-generation states are impossible by definition.
The above-mentioned study of population by foreign/national background in EU countries (Lanzieri 2011b) is used here for the sake of comparison with the Japanese case. However, that study uses the variable ‘country of birth’ to identify national or foreign background, and therefore comparability with the current analysis is not absolute. Moreover, it obviously does not include the case of a change of state due to the acquisition of citizenship, and thus the ‘new citizens’ category does not exist there. Of the four models there presented, the closest to the present study is Model 3, where there is a fertility differential between foreign- and native-born and all descendants of a foreign-born mother (regardless of the generation) are considered of foreign background, here used for comparisons with the projected population with a foreign background in Japan. The results of Model 1 in Lanzieri (2011b) are instead closest to the projected foreign population in Japan, if one ignores the fertility differentials between nationals and foreigners. The results of Models 1 and 3 in Lanzieri (2011b) are then used here to represent the projected situation for
(11) The principle of jus soli states that newborns (can) take the
citizenship of the country in which they were born, as opposed to jus sanguinis, where instead newborns take the citizenship(s) of their parent(s), regardless of the country of birth. The legislative setting of a country may well have a mix of the two principles, sometimes also depending on the generation.
Europe, but the reader should bear in mind the conceptual differences between the two studies.
Population of foreign citizenship Under the official assumptions above specified, the size of the population of foreign citizenship is estimated to be about 3.5 million at the end of the projected period (1 January 2060), corresponding to 4 % of the total population of Japan (see Table 5). However, its presence is more relevant in the younger population of working age (15–39 years old), where they almost reach 6 %. Compared to European countries, these values appear very moderate. According to the results of Model 1 in Lanzieri (2011b), within the EU, only Poland and Romania would have proportions of foreigners that low, and together with Bulgaria, Estonia, Latvia and Slovakia below 10 % of the total population.
Some of the alternative scenarios would change this picture. As shown in Table 5, the proportion of foreigners in the respective age-specific populations makes almost no difference in the Convergence scenario. In fact, the difference there was in fertility and mortality assumptions, and the effect of the former requires some time before it becomes visible. The impact is much more visible in the scenarios based on alternative migration assumptions. In the two variants of the Rejuvenation scenario, the effect of the migration opening after 2020 is visible in the age group 15–39, moving up to the age group 40–64 by the end of the projected period, due to the progressive ageing of those special generations which immigrated in the 2020s. At that time, the share of foreigners is projected to reach between 13 % and 21 %, a level a few times higher than in the Standard scenario. The overall percentage of foreigners would be over 11 % in the higher variant, again a level which is quite modest compared to European countries.
In the Replacement scenario, that overall percentage does not change much (less than 12 %), but the age distribution of the foreign population is more equilibrated than in the Rejuvenation scenario, and the age group in which there is the larger presence of foreigners is always the younger population of working age (15–39 years old).

28 Long-term contribution of migration in ageing populations: Japan compared with Europe
Population of foreign background In the breakdown of the population by background, the group of new citizens is moved to the persons with a foreign background, which inflates the figures reported above in the classification by citizenship. In Table 6 it can be seen that, based on the assumptions of the official projections, the share of persons with a foreign background (regardless of their actual citizenship) by 2060 would be about 10–11 % in the younger population: in other words, one student out of ten would have a foreign background. Again, compared to European countries as in the results of Model 3 in Lanzieri (2011b), this would be a very modest percentage, below even the lowest share among the countries for which such information is available, projected for Estonia.
If alternative migratory flows take place in future decades, those percentages must be substantially revised upwards. However, in none of the alternative scenarios will the proportion of the total population with a foreign background in 2060 exceed 20 %, a level which is instead projected to be crossed by many European countries in the coming decades, some of them even currently. The highest shares by age group are projected in the Replacement scenario, where by the end of the projected period almost one out of three of either students or young workers will have a foreign background. Unlike in the Rejuvenation scenario, in the Replacement scenario the percentages of persons with a foreign background increase progressively over time within each age group.
The challenge of the integration of migrants The permanent settlement of relevant immigration flows brings new challenges to the host populations, and policy-makers may wish to implement policies to ease the integration or assimilation of the immigrants. Along with the immigrants themselves, a new community also emerges, that so-called ‘second generation’ of migrants who, despite being born in the host country, may feel the influence of their parents’ country of origin and face particular difficulties in integration. Or, at the other extreme, they may be much more assimilated than their parents, even refusing any reference to the
culture of origin, which may create conflict situations within families. Between these two extremes lie, of course, the cases of unproblematic integration/assimilation in the host countries.
Table 7 shows the composition of the population in Japan by single citizenship background. Due to the assumptions applied here about second-generation migrants, their proportion grows very slowly over time, only ‘fed’ by migration. Nevertheless, depending on the scenario, that little quota means a group size of between half a million and a bit less than two million people. If the assumption about the naturalisation of third-generation migrants does not apply and/or the current stock was much different from zero, then those figures would definitely be higher.
Those who become Japanese citizens may be seen as successful cases of integration. Their share is quite relevant in the alternative migration scenarios (between 6 % and 9 % of the total population), although part of it comes from the assumption about the births from second-generation migrants. Further, those shares depend as well on policies regarding the acquisition of citizenship, which may of course change over time.

29 Long-term contribution of migration in ageing populations: Japan compared with Europe
Table 5: Age-specific percentages of the population of foreign citizenship in Japan in selected years by scenario and major age group (%)
Standard
Age group 2010 2020 2030 2040 2050 2060
0–14 0.8 1.4 2.1 2.4 2.5 2.5
15–39 2.2 3.5 4.3 5.1 5.7 5.9
40–64 1.1 1.5 2.4 3.6 4.7 5.3
65+ 0.4 0.5 0.7 1.0 1.5 2.4
Total 1.3 1.7 2.3 2.9 3.5 4.0
Convergence
Age group 2010 2020 2030 2040 2050 2060
0–14 0.8 1.4 2.0 2.3 2.4 2.4
15–39 2.2 3.5 4.3 5.1 5.4 5.5
40–64 1.1 1.5 2.4 3.6 4.7 5.2
65+ 0.4 0.5 0.7 1.0 1.5 2.4
Total 1.3 1.7 2.3 2.9 3.4 3.9
Rejuvenation 0.5
Age group 2010 2020 2030 2040 2050 2060
0–14 0.8 1.4 5.0 7.1 5.5 3.1
15–39 2.2 3.5 15.8 13.7 8.1 8.4
40–64 1.1 1.5 2.5 6.9 13.4 13.5
65+ 0.4 0.5 0.6 0.8 1.4 3.2
Total 1.3 1.7 5.8 6.6 7.1 7.6
Rejuvenation 1.0
Age group 2010 2020 2030 2040 2050 2060
0–14 0.8 1.4 8.1 11.4 8.4 3.8
15–39 2.2 3.5 25.9 21.7 10.6 10.7
40–64 1.1 1.5 2.7 10.5 21.3 20.9
65+ 0.4 0.5 0.4 0.5 1.2 4.1
Total 1.3 1.7 9.5 10.4 10.9 11.2
Replacement
Age group 2010 2020 2030 2040 2050 2060
0–14 0.8 2.6 5.1 6.8 8.1 8.5
15–39 2.2 8.6 11.7 15.7 18.9 18.7
40–64 1.1 1.6 3.8 8.4 12.7 16.0
65+ 0.4 0.4 0.6 0.8 1.6 4.7
Total 1.3 3.3 5.0 7.6 9.9 11.8

30 Long-term contribution of migration in ageing populations: Japan compared with Europe
Table 6: Age-specific percentages of the population of foreign background in Japan in selected years by scenario and major age group (%)
Standard
Age group 2010 2020 2030 2040 2050 2060
0–14 0.8 2.6 4.9 6.2 8.1 10.4
15–39 2.2 3.8 5.1 7.1 9.2 10.8
40–64 1.1 1.7 2.9 4.6 6.3 7.9
65+ 0.4 0.5 0.8 1.3 2.0 3.5
Total 1.3 2.0 3.0 4.1 5.5 6.9
Convergence
Age group 2010 2020 2030 2040 2050 2060
0–14 0.8 2.6 4.7 6.1 8.0 10.0
15–39 2.2 3.8 5.1 7.0 8.9 10.3
40–64 1.1 1.7 2.9 4.6 6.3 7.8
65+ 0.4 0.5 0.8 1.3 2.0 3.5
Total 1.3 2.0 3.0 4.1 5.5 6.9
Rejuvenation 0.5
Age group 2010 2020 2030 2040 2050 2060
0–14 0.8 2.6 9.8 17.8 17.1 16.0
15–39 2.2 3.8 17.0 17.0 15.0 19.6
40–64 1.1 1.7 3.0 8.5 17.2 19.2
65+ 0.4 0.5 0.7 1.0 1.9 4.5
Total 1.3 2.0 6.8 9.1 11.2 13.5
Rejuvenation 1.0
Age group 2010 2020 2030 2040 2050 2060
0–14 0.8 2.6 14.9 28.3 25.7 21.9
15–39 2.2 3.8 27.6 26.2 21.0 28.0
40–64 1.1 1.7 3.2 12.6 27.1 29.3
65+ 0.4 0.5 0.5 0.7 1.7 5.8
Total 1.3 2.0 10.9 14.3 17.1 20.1
Replacement
Age group 2010 2020 2030 2040 2050 2060
0–14 0.8 4.7 11.6 16.2 22.5 29.1
15–39 2.2 9.1 13.2 19.6 26.5 30.0
40–64 1.1 1.7 4.5 10.5 16.6 22.2
65+ 0.4 0.5 0.6 1.0 2.2 6.8
Total 1.3 3.7 6.4 10.3 14.6 19.2

31 Long-term contribution of migration in ageing populations: Japan compared with Europe
Table 7: Composition of the population in Japan by citizenship background and scenario (%)
Standard
State 2010 2020 2030 2040 2050 2060
Natives 98.7 98.0 97.0 95.9 94.5 93.1
New citizens 0.0 0.3 0.7 1.2 2.0 2.9
Immigrants 1.3 1.6 2.1 2.6 3.0 3.4
2nd-generation 0.0 0.1 0.2 0.4 0.5 0.6
Total 100.0 100.0 100.0 100.0 100.0 100.0
Convergence
State 2010 2020 2030 2040 2050 2060
Natives 98.7 98.0 97.0 95.9 94.5 93.1
New citizens 0.0 0.3 0.7 1.2 2.0 3.0
Immigrants 1.3 1.6 2.1 2.5 2.9 3.3
2nd-generation 0.0 0.1 0.2 0.4 0.5 0.6
Total 100.0 100.0 100.0 100.0 100.0 100.0
Rejuvenation 0.5
State 2010 2020 2030 2040 2050 2060
Natives 98.7 98.0 93.2 90.9 88.8 86.5
New citizens 0.0 0.3 1.0 2.5 4.1 5.9
Immigrants 1.3 1.6 5.4 5.7 6.0 6.4
2nd-generation 0.0 0.1 0.4 0.9 1.1 1.2
Total 100.0 100.0 100.0 100.0 100.0 100.0
Rejuvenation 1.0
State 2010 2020 2030 2040 2050 2060
Natives 98.7 98.0 89.1 85.7 82.9 79.9
New citizens 0.0 0.3 1.4 3.9 6.3 8.9
Immigrants 1.3 1.6 8.9 8.9 9.1 9.4
2nd-generation 0.0 0.1 0.6 1.5 1.8 1.8
Total 100.0 100.0 100.0 100.0 100.0 100.0
Replacement
State 2010 2020 2030 2040 2050 2060
Natives 98.7 96.3 93.6 89.7 85.4 80.8
New citizens 0.0 0.4 1.4 2.7 4.7 7.4
Immigrants 1.3 3.1 4.5 6.7 8.6 10.1
2nd-generation 0.0 0.2 0.5 0.9 1.3 1.7
Total 100.0 100.0 100.0 100.0 100.0 100.0

32 Long-term contribution of migration in ageing populations: Japan compared with Europe
Conclusions The issues of population decline and ageing in Japan are already well known and the subject of many analyses. However, besides generic conclusions about the importance of fertility recovery and/or opening up immigration flow to counteract these processes, there has so far been no detailed study in the international literature about the implications for the future composition of the population in Japan of these demographic options. This latter point is instead actually central to an assessment of their feasibility by the policy-makers.
With the ambition of filling, at least partially, this gap, this study has looked at both past and future demographic trends in Japan, using European countries as background to provide a comparative element. The analysis of past trends is useful in understanding the demographic dynamics behind the current situation and their implications for the future. It has been shown that Japan is going to endure — in demographic terms — a four-decade period of below-replacement fertility plus the absence of significant immigration. This has made the difference from European countries, especially in recent decades, when immigration flows have become an important — if not the most important — component of growth in Europe. Probably contrary to the common belief, it is with Eastern European countries that Japan has had higher similarity in the past half-century with regard to fertility trends and population changes, and with Western European countries with regard to mortality.
Privileging fertility as lever with which to intervene to counteract what are perceived as negative population developments, many analyses of the Japanese situation have then focused on the drivers of fertility and the reasons behind its decline. However, although a recovery in fertility may certainly soften the impact of population decline and ageing, by itself it will not avoid any of them. In fact, the current population structure in Japan is such that these processes will continue for a period even if a sudden baby boom, sufficient to bring fertility back to replacement level, were to occur and mortality did not improve any further. As shown by its negative population momentum, Japan currently has a population structure which is producing shrinking cohorts of women of reproductive age over time. Therefore, even
important increases of the fertility rates will not translate, at least in the short term, into an increase in the number of births. As a by-product, this makes the main messages of the projections for Japan somehow less sensitive to changes in the (only) fertility assumptions.
The other demographic option is then the opening up to migration, as other commentators have already said. However, it is again a matter of ‘quantities’. How much to open? Current projections for Japan continue to assume very little migration over the coming decades. Even with these conservative assumptions, the population with a foreign background may become ‘visible’, especially in selected age groups. Further, the prospective size of the foreign population is likely to be an underestimate, as it is based on the assumption that the fertility of immigrants would continue to be lower than natives in the long run, and with a base population in which there may be under-coverage of the current stock of foreigners.
Alternative scenarios about future migration inflow show that immigration comparable to that predicted for Europe would indeed help, but Japanese society would undergo a (relatively) rapid change in its composition, although to a much lesser extent than in many European countries. For the positive contribution of migration to population dynamics to be long-lasting and not just occasional, a migration limited in time would perhaps not be the best solution. It is also likely that a slow and progressive increase in immigration would be easier to integrate/assimilate than a sudden inflow — though controlled — of immigrants. In any case, the permanent settlement of immigrants generates a new population group, the ‘second generation’, whose integration may require special attention.
Assuming changes in only one of the two demographic levers (fertility or migration) is very likely a purely theoretical case. It is a combination of the two which will most probably provide a (demographic) solution for policy-makers to deal with population decline and ageing. Although the time horizon of the projections is conventionally of at least 50 years, a policy does not need to last for the same period without adaptation, but can instead be

33 Long-term contribution of migration in ageing populations: Japan compared with Europe
played by ear, meaning making adjustments as the need for them becomes apparent. For instance, a recovery in fertility would make the recourse to migration less necessary: figures on immigration would then be less significant, at least for the proportions, if not also in absolute numbers. On the other side, certain demographic changes are slow but inexorable, and neglecting the early warning signs may have high costs for the socio-economic structure of a country. Generally speaking, the issue of ageing has been known for decades to demographers, but it is only now that its challenges are starting to become evident that action is being undertaken, probably with higher costs than in the case of timely reactions.
Are Japan and Europe on the same track? Not exactly. With the large approximations due to the demographic variety within Europe, both are struggling to recover their fertility from low levels and are the beneficiaries of continuing improvements in mortality. However, when these indicators are linked to the age structures, the differences in the numbers of events are evident, and it is actually those numbers which shape the changes in population. The main difference is indeed in the role migration has played — and is expected to continue to play — in Europe. This would make some European countries try to continue their population growth or soften their decline, unlike Japan, where population decline is already taking place and may accelerate in the future. As for ageing, this is expected to occur everywhere in Europe, but to a (much) less extent than currently projected for Japan. This comes with a diversification of the composition of the European populations, which in the long term may reach considerable levels in particular countries. Therefore, while for Europe the current projections return a long-term picture of aged, multicultural populations (not necessarily in decline), for Japan the demographic situation is prospected to be more homogeneous as for the composition of a (much) smaller and (much) more aged population. The composition of the population and the extent of its ageing would then be the real elements of difference in the diverging demographic paths of Japan and Europe.
In 1959, just before the period considered here, Dore (1959 p. 103) wrote: ‘Japan is a happy hunting ground for the demographer and for the comparative sociologist.’ Nowadays, this still applies, and it may well continue to do so for a
while. In the historical period and geographical areas considered in this study, population decline and ageing are usually perceived as ‘negative’ population developments. This ‘dogma’ may have its roots in the complex connection of the population dynamic with economic growth, as witnessed by the large amount of literature, from Malthus onwards. While the processes of decline and/or ageing clearly bring new challenges to societies, this should not prevent solutions from being sought also from outside of the range of the usual demographic options. In 2006, the European Commission identified five key policy areas: demographic renewal, employment, productivity, integration of migrants and sustainable public finances. Japan may well find its own way without affecting the current demographic trends. At the very end, one of the most important qualities of human populations is their capacity to adapt. Will Japan develop a new way to deal with population decline and ageing? Dore’s sentiment is still a very modern one…

34 Long-term contribution of migration in ageing populations: Japan compared with Europe
References Alho, J.M. (2008) ‘Migration, fertility, and aging in stable populations’, Demography, 45(3):641–650.
Attané, I., Barbiéri, M., Divinagracia, E., Dutreuilh, C., Fulton, D., Horko, K., Reay-Jones, R. and Rogers, G. (2009) ‘The Demography of East and Southeast Asia from the 1950s to the 2000s — A Summary of Changes and a Statistical Assessment’, Population (English Edition, 2002-), 64(1):9–146.
Avdeev, A., Eremenko, T., Festy, P., Gaymu, J., Le Bouteillec, N. and Springer, S. (2011) ‘Populations and Demographic Trends of European Countries, 1980–2010’, Population (English Edition, 2002-), 66(1):9–130.
Bloom, D.E., Canning G. and Malaney, P.N. (2000) ‘Population Dynamics and Economic Growth in Asia’, Population and Development Review, Supplement on Population and Economic Change in East Asia, 26:257–290.
Bloom, D.E., Canning G. and Sevilla, J. (2003) ‘The Demographic Dividend — A New Perspective on the Economic Consequences of Population Change’, RAND Publications, Santa Monica, California.
Boling, P. (1998) ‘Family Policy in Japan’, Journal of Social Policy, 27(2):173–190.
Boling, P. (2008) ‘Demography, Culture and Policy: Understanding Japan’s Low Fertility’, Population and Development Review, 34(2):307–326.
Bongaarts, J. (2004) ‘Population Aging and the Rising Cost of Public Pensions’, Population and Development Review, 30(1):1–23.
Bongaarts, J. and Bulatao, R.A. (1999) ‘Completing the Demographic Transition’, Population and Development Review, 25(3):515–529.
Bourgeois-Pichat, J. (1981) ‘Recent Demographic Change in Western Europe: An Assessment’, Population and Development Review, 7(1):19–42.
Coleman, D. (2006a) ‘Europe’s Demographic Future: Determinants, Dimensions, and Challenges’, Population and Development
Review, Supplement: The Political Economy of Global Population Change, 1950–2050, 32:52–95.
Coleman, D. (2006b) ‘Immigration and Ethnic Change in Low-Fertility Countries: A Third Demographic Transition’, Population and Development Review, 32(3):401–446.
Coleman, D. (2009) ‘Divergent Patterns in the Ethnic Transformation of Societies’, Population and Development Review, 35(3):449–478.
Demeny, P. (2003) ‘Population Policy Dilemmas in Europe at the Dawn of the Twenty-First Century’, Population and Development Review, 29(1):1–28.
Dore, R.P. (1959) ‘Japan: Country of Accelerated Transition’, Population Studies, 13(1):103–111.
Dorius, S.F. (2008) ‘Global Demographic Convergence? A Reconsideration of Changing Intercountry Inequality in Fertility’, Population and Development Review, 34(3):519–537.
Espenshade, T.J. (1986) ‘Population Dynamics with Immigration and Low Fertility’, Population and Development Review, 12:248–261, Supplement: Below-Replacement Fertility in Industrial Societies: Causes, Consequences, Policies.
Espenshade, T.J., Bouvier, L.F. and Arthur, W.B. (1982) ‘Immigration and the stable population model’, Demography, 19(1):125–133.
European Commission (2006) ‘The demographic future of Europe — from challenge to opportunity’, Commission Communication COM(2006) 571 of 12.10.2006, Brussels.
European Commission (2011) ‘Demography Report 2010’, Publications Office of the European Union, Luxembourg.
Fassmann, H. and Münz, R. (1992) ‘Patterns and Trends of International Migration in Western Europe’, Population and Development Review, 18(3):457–480.
Feyrer, J., Sacerdote, B. and Stern, A.D. (2008) ‘Will the Stork Return to Europe and Japan? Understanding Fertility within Developed
35 Long-term contribution of migration in ageing populations: Japan compared with Europe
Nations’, Journal of Economic Perspectives, 22(3):3–22.
Frejka, T., Jones, G.W. and Sardon, J.-P. (2010) ‘East Asian Childbearing Patterns and Policy Developments’, Population and Development Review, 36(3):579–606.
Giannakouris, K. (2008) ‘Ageing characterises the demographic perspectives of the European societies’, Eurostat Statistics in Focus 72/2008, Publications Office of the European Union, Luxembourg.
Goldstein, J.R. (2002) ‘Population momentum for gradual demographic transitions: an alternative approach’, Demography, 39(1):65–73.
Horiuchi, S. (2011) ‘Major Causes of the Rapid Longevity Extension in Postwar Japan’, Japanese Journal of Population, 9(1):162–171.
IPSS — National Institute of Population and Social Security Research (2012) ‘Population Projections for Japan: 2011 to 2060’, (forthcoming).
Ishii, F. (2010) ‘Application of age-transformation approaches to mortality projection for Japan’, in Proceedings of the Eurostat/UNECE Work Session on Demographic Projections, Eurostat Methodologies and working papers, pp.217–230, Publications Office of the European Union, Luxembourg.
Iwasawa, M. and Kaneko, R. (2010) ‘Explanations for regional fertility reversal after 2005 in Japan: demographic, socio-economic and cultural factors’, in Proceedings of the Eurostat/UNECE Work Session on Demographic Projections, Eurostat Methodologies and working papers, pp.155–167, Publications Office of the European Union, Luxembourg.
Kaneko, R. (2010) ‘Applying a fertility projection system to period effect analysis: an examination of the recent fertility upturn in Japan’, in Proceedings of the Eurostat/UNECE Work Session on Demographic Projections, Eurostat Methodologies and working papers, pp.185–202, Publications Office of the European Union, Luxembourg.
Kaneko, R. (2011) ‘The Society Created by the Longevity Revolution — Historical Development and Associated Issues’, Japanese Journal of Population, 9(1):135–154.
Kaneko, R., Ishikawa, A., Ishii, F., Sasai, T., Iwasawa, M., Mita, F., Moriizumi R. (2008) ‘Population Projections for Japan: 2006–2055 — Outline of Results, Methods, and Assumptions’, Japanese Journal of Population, 6(1):76–114.
Kaneko, R., Ishikawa, A., Ishii, F., Sasai, T., Iwasawa, M., Mita, F., Moriizumi R. (2009) ‘Commentary to Population Projections for Japan — A Supplement to Report of the 2006 Revision’, Japanese Journal of Population, 7(1):1–46.
Keyfitz, N. (1971) ‘On the Momentum of Population Growth’, Demography, 8(1):71–80.
Kim, Y.J. and Schoen, R. (1997) ‘Population momentum expresses population aging’, Demography, 34(3):421–427.
Lanzieri, G. (2004) ‘EUROPOP2003: Methodology for International Migration Assumptions in the EU-15 Member States’, Eurostat Working Paper of 2 June 2004 for the Consultation of the Member States and Accession Countries, Luxembourg, May-June 2004.
Lanzieri, G. (2005) ‘Eurostat Population Projections 2004-based: main results from the Trend scenario’, Revista de Estudos Demográficos, 37:43–75.
Lanzieri, G. (2006) ‘Long-term population projections at national level’, Eurostat Statistics in Focus 3/2006, Publications Office of the European Union, Luxembourg.
Lanzieri, G. (2007) ‘EUROPOP2007 Convergence Scenario: Summary Note’, Eurostat Working Paper of 26 November 2007 for the meeting of the Joint Working Group on Population Projections and Working Group on Ageing Populations and Sustainability, Luxembourg, 29-30 November 2007.
Lanzieri, G. (2009) ‘EUROPOP2008: a set of population projections for the European Union’, paper for the XXVI IUSSP International Population Conference, 27 September – 2 October 2009, Marrakech (Morocco).
Lanzieri, G. (2010a) ‘Update of the Eurostat Population Projections: Summary of the Methodology and Provisional Results of EUROPOP2010’, Eurostat Working Paper of 30 November 2010 for the meeting of the Joint Working Group on Population Projections and Working Group on Ageing Populations and
36 Long-term contribution of migration in ageing populations: Japan compared with Europe
Sustainability, Luxembourg, 13-14 December 2010.
Lanzieri, G. (2010b) ‘Looking 50 years ahead: a natural projection of the populations of the Balkan countries to 2061’, paper for the IV International Conference of Demography of the Balkans, 13–15 May 2010, Budva (Montenegro).
Lanzieri, G. (2010c) ‘Is Fertility Converging Across the Member States of the European Union?’, in Proceedings of the Eurostat/UNECE Work Session on Demographic Projections, Eurostat Methodologies and working papers, pp.137–154, Publications Office of the European Union, Luxembourg.
Lanzieri, G. (2011a) ‘The greying of the baby-boomers. A century-long view of ageing in European populations’, Eurostat Statistics in Focus 23/2011, Publications Office of the European Union, Luxembourg.
Lanzieri, G. (2011b) ‘Fewer, older and multi-cultural? Projections of the EU populations by foreign/national background’, Eurostat Metho-dologies and working papers, Publications Office of the European Union, Luxembourg.
Li, N. and Tuljapurkar, S. (1999) ‘Population Momentum for Gradual Demographic Transi-tions’, Population Studies, 53(2):255–262.
Meslé, F. and Vallin, J. (2006) ‘Diverging Trends in Female Old-Age Mortality: The United States and the Netherlands versus France and Japan’, Population and Development Review, 32(1):123–145.
Monnier, A. (2004) ‘The European Union at the Time of Enlargement’, Population (English Edition, 2002-), 59(2):315–336.
Ogawa, N. (2003) ‘Japan’s changing fertility mechanisms and its policy responses’, Journal of Population Research, 20(1):89–106.
Ogawa, N., Chawla, A. and Matsukura, R. (2010) ‘Some New Insights into the Demographic Transition and Changing Age Structures in the ESCAP Region’, NUPRI Reprint Series No 96.
Ogawa, N. and Retherford, R.D. (1993) ‘The Resumption of Fertility Decline in Japan: 1973–92’, Population and Development Review, 19(4):703–741.
Preston, S.H. and Guillot, M. (1997) ‘Population dynamics in an age of declining
fertility’, Genus, LIII(3–4):15–31.
Preston, S.H., Himes, C. and Eggers, M. (1989) ‘Demographic Conditions for Population Ageing’, Demography, 26(4):691–704.
Retherford, R.D., Ogawa, N. and Sakamoto, S. (1996) ‘Values and Fertility Change in Japan’, Population and Development Review, 19(4):703–741.
Steinmann, G. and Jäger, M. (2000) ‘Immigration and integration nonlinear dynamics of minorities’, Mathematical Population Studies, 9(1):65–82.
Suzuki, T. (2009) ‘Fertility Decline and Governmental Interventions in Eastern Asian Advanced Countries’, Japanese Journal of Population, 7(1):47–56.
Teitelbaum, M.S. (2004) ‘Western Experiences with International Migration in the Context of Population Decline’, Japanese Journal of Population, 2(1):29–40.
Tsuda, T. (1999a) ‘The Permanence of “Temporary” Migration: The “Structural Embeddedness” of Japanese-Brazilian Immigrant Workers in Japan’, Journal of Asian Studies, 58(3):687–722.
Tsuda, T. (1999b) ‘The Motivation to Migrate: The Ethnic and Sociocultural Constitution of the Japanese-Brazilian Return-Migration System’, Economic Development and Cultural Change, 48(1):1–31.
van Imhoff, E. and Keilman, N. (1992) ‘LIPRO 2.0: An Application of a Dynamic Demographic Projection Model to Household Structure in the Netherlands’, NIDI-CBGS publication no.23, Swets&Zeitlinger Publisher.
Yamanaka, K. (1993) ‘New Immigration Policy and Unskilled Foreign Workers in Japan’, Pacific Affairs, 66(1): 72–90.
Wilmoth, J.R. (1998) ‘Is the Pace of Japanese Mortality Decline Converging Toward International Trends?’ Population and Development Review, 24(3):593–600.
Wilson, C. (2001) ‘On the Scale of Global Demographic Convergence 1950–2000’, Population and Development Review, 27(1):151–171.
Wu, Z. and Li, N. (2003) ‘Immigration and the dependency ratio of a host population’, Mathematical Population Studies, 10:21–39.

37 Long-term contribution of migration in ageing populations: Japan compared with Europe
Acknowledgements and disclaimer The study was carried out during my stay at the Department of Population Dynamic Research of the National Institute of Population and Social Security Research in Tokyo, in the framework of an Invitation Fellowship Program for Research of the Japan Society for the Promotion of Science. I am grateful for the large and ready access to data on Japan and particularly on the latest projections exercise, as well as for the kind support from Ryuichi Kaneko, Futoshi Ishii, Miho Iwasawa and Kenji Kamata.
The views here expressed are exclusively those of the author and do not necessarily represent those of the European Commission / Eurostat.
A former version of this paper is:
Lanzieri, G. (2012): “Fewer and older: a common destiny for Japan and Europe? A comparative view of the contribution of migration in ageing populations”. In Ishii F. ed. (2012): "Incorporation of foreign-born population and its impact on future population dynamics and social security in Japan", p.247-285. National Institute of Population and Social Security Research, Tokyo.


European Commission
Long-term contribution of migration in ageing populations: Japan compared with Europe —Giampaolo Lanzieri Luxembourg: Publications Office of the European Union 2013 — 37 pp. — 21 x 29.7 cm Theme: Population and social conditions Collection: Statistical working papers ISBN 978-92-79-32339-3 ISSN 2315-0807 doi:10.2785/29184 Cat. No: KS-TC-13-001-EN-N

HOW TO OBTAIN EU PUBLICATIONS
Free publications: • one copy:
via EU Bookshop (http://bookshop.europa.eu);
• more than one copy or posters/maps: from the European Union’s representations (http://ec.europa.eu/represent_en.htm); from the delegations in non-EU countries (http://eeas.europa.eu/delegations/index_en.htm); by contacting the Europe Direct service (http://europa.eu/europedirect/index_en.htm) or calling 00 800 6 7 8 9 10 11 (freephone number from anywhere in the EU) (*). (*) The information given is free, as are most calls (though some operators, phone boxes or hotels may charge you).
Priced publications: • via EU Bookshop (http://bookshop.europa.eu).
Priced subscriptions: • via one of the sales agents of the Publications Office of the European Union
(http://publications.europa.eu/others/agents/index_en.htm).

Exer in vu
lla faci blam
con
se euis n
ibh
el utat d
ip ex elestisim
R
ilis aug
iati siscilit venis n
im
2013
ed
ition
KS-TC-13-001-EN
-N
doi:10.2785/29184
Related Documents