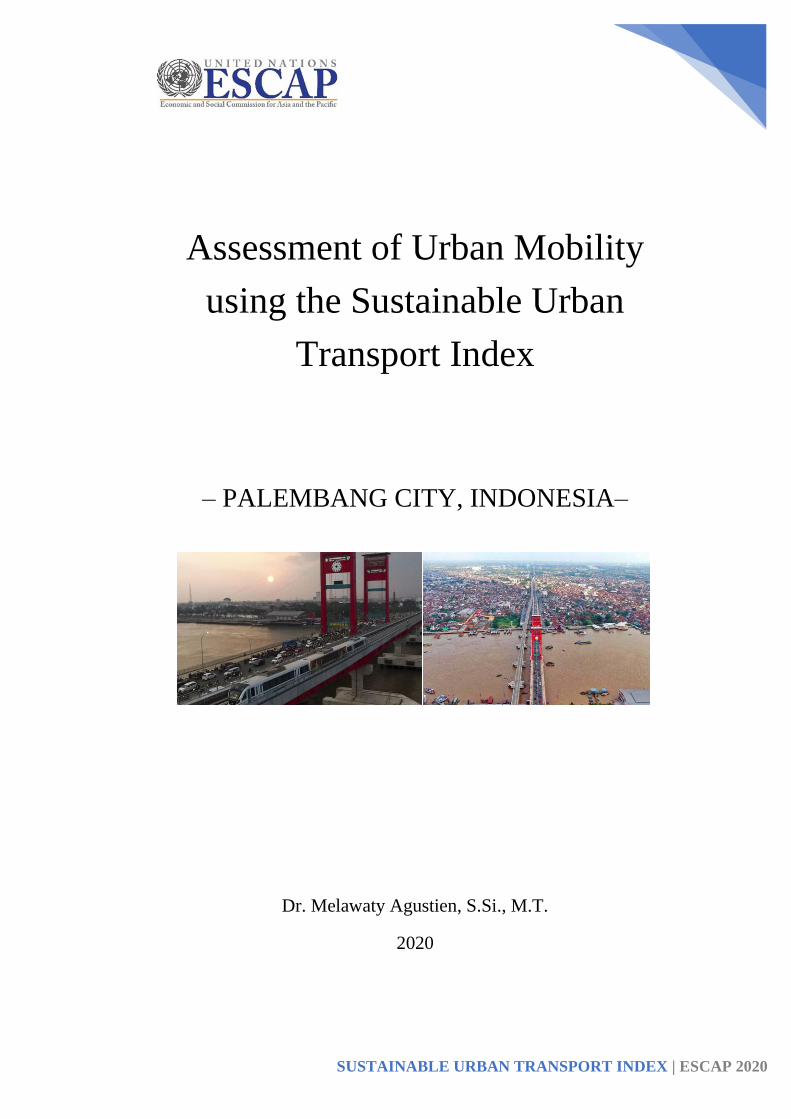
SUSTAINABLE URBAN TRANSPORT INDEX | ESCAP 2020 Assessment of Urban Mobility using the Sustainable Urban Transport Index – PALEMBANG CITY, INDONESIA– Dr. Melawaty Agustien, S.Si., M.T. 2020

Welcome message from author
This document is posted to help you gain knowledge. Please leave a comment to let me know what you think about it! Share it to your friends and learn new things together.
Transcript
SUSTAINABLE URBAN TRANSPORT INDEX | ESCAP 2020
Assessment of Urban Mobility
using the Sustainable Urban
Transport Index
– PALEMBANG CITY, INDONESIA–
Dr. Melawaty Agustien, S.Si., M.T.
2020
i
i
TABLE OF CONTENTS
I.1 General description ................................................................................................ 2 I.2 Demography .......................................................................................................... 3
I.2.1 Population and Employment ..................................................................... 3 I.2.2 Household Expenditure ............................................................................ 5 I.2.3 System of Regional Account .................................................................... 6
I.3 Road Network Data ............................................................................................... 7 II.1 Number of vehicles .............................................................................................. 12 II.2 Transportation Network in Palembang City ........................................................ 14
II.2.1 Public Transportation Infrastructure ....................................................... 17 II.3 Master plan of transportation in Palembang ........................................................ 21
II.3.1 Construction of the passenger terminal .................................................. 21 II.3.2 Improvement of Public Transportation Services .................................... 22 II.3.3 Railway Network System ....................................................................... 23 II.3.4 Train Station ........................................................................................... 23 II.3.5 River, Lake and Crossing Transport Network System (ASDP) ............. 24 II.3.6 Mode Integration .................................................................................... 25 II.3.7 Bicycle Lane ........................................................................................... 27
II.4 Transit Oriented Development ............................................................................. 29 II.5 Road and Railway -based transportation ............................................................. 30
II.5.1 Trans Musi .............................................................................................. 30 II.5.2 Light Rail Transit (LRT) ........................................................................ 34
II.6 Policy Direction for Transportation Development in Palembang City ................ 36 IV.1 Sustainable Urban Transportation Index ............................................................. 48 IV.2 Data collection for each SUTI indicators in Palembang City .............................. 49
List of Tables
Table I-1: Total Area and Percentage to Municipal Area by Subdistrict in ...................................... 3 Table I-2: Population, Annual Population Growth Rate, Percentage Distribution of Population,
Population Density, and Population Sex Ratio by Subdistrict in Palembang Municipality, 2019 .... 4 Table I-3: Percentage of Population by Per Capita Spending Group a ............................................ 5 Table I-4 Poverty Line, Number, and Percentage of Poor People in Palembang Municipality, 2012–
2019 .................................................................................................................................................. 6 Table I-5 Length of Roads by Level of Government Authority in Palembang Municipality 2017–
2019 .................................................................................................................................................. 8 Table I-6: List of National Roads in Palembang City ....................................................................... 8 Table I-7 Length of roads by condition of roads in Palembang Municipality in km from 2017 to
2019 ................................................................................................................................................ 11 Table II-1: Number of Motor Vehicles by Subdistrict and Type of Vehicle................................... 13 Table II-2: Number of Traffic Accident By Location in Teritory of ............................................... 14 Table II-3 List Of Number Of Public Transport In Palembang Area 2020 ..................................... 15 Table II-4: List of terminals in Palembang based on Type A, B and C .......................................... 18 Table II-5 Railway Transport Infrastructure And Facilities in Palembang City ............................. 19 Table II-6 Origin-Destination of River Transportation and its Function ........................................ 20 Table II-7 Terminal Development Plan in Palembang City ............................................................ 21 Table II-8 Inter-Mode Integration Location Plan ............................................................................ 25 Table II-9 Intermodal Integration Development Recommendations ............................................... 26
ii
ii
Table II-10 TOD location proposal in the Palembang City ............................................................ 29 Table II-11 Trans Musi Bus Line Corridor Plan ............................................................................. 32 Table II-12 Average Number of LRT Passengers Per Day For Weekends and Weekdays 2019-2020
........................................................................................................................................................ 35 Table II-13 The proportion of the budget for each program to improve public transportation of the
transportation service (US Dollar) .................................................................................................. 37 Table II-14 The proportion of the budget for Rehabilitation and maintenance of road transport
infrastructure / pedestrian (US Dollar) ........................................................................................... 42 Table III-1: Ten indicators of Sustainable Urban Transport Index ................................................. 43 Table IV-1: Ten indicators for Sustainable Urban Transport Index ................................................ 48 Table IV-2: Atributes And Percentage Of Community Satisfaction With ...................................... 55 Table V-1 Roughly Indicative Guideline For Allocating Scores To The Various Aspects............ 63 Table VII-1 Suggestions for some indicators that have low result ................................................. 77
List of Figures
Figure I-1: Palembang City Administration Maps ............................................................................ 2 Figure I-2: Percentage Distribution of Gross Regional Domestic ..................................................... 7 Figure I-3: Road network in Palembang city .................................................................................... 9 Figure I-4: Percentage Length of roads by condition of roads in Palembang municipality ............ 10 Figure II-1: Number of Motor Vehicles by Type of Vehicle in ...................................................... 12 Figure II-2: Congestion on one of Palembang City road ................................................................ 14 Figure II-3: Public Transport Network in Palembang City ............................................................. 17 Figure II-4: Integration of Trans Musi Route and Palembang City LRT Line ................................ 26 Figure II-5 First alternative route Jakabaring Sport City – ............................................................ 27 Figure II-6 Second alternative route Kambang Iwak – ................................................................... 28 Figure II-7 Bicycle Lane Plan ......................................................................................................... 28 Figure II-8 Four large LRT stations, which will be developed into Transit-Oriented .................... 29 Figure II-9: Trans Musi ................................................................................................................... 33 Figure II-10: Teman Bus ................................................................................................................. 34 Figure II-11: Palembang LRT Network Map .................................................................................. 36 Figure II-12: LRT in Palembang City ............................................................................................. 36
i
i
Disclaimer:
This report has been issued without formal editing.
The designation employed and the presentation of the material in the report do not imply
the expression of any opinion whatsoever on the part of the Secretariat of the United
Nations concerning the legal status of any country, territory, city or area or of its authorities,
or concerning the delimitation of its frontiers or boundaries. The views expressed, analysis,
conclusions and recommendations are those of the author(s) and should not necessarily be
considered as reflecting the views or carrying the endorsement of the United Nations.
Mention of firm names and commercial products does not imply the endorsement of the
United Nations.
2
2
INTRODUCTION
I.1 General description
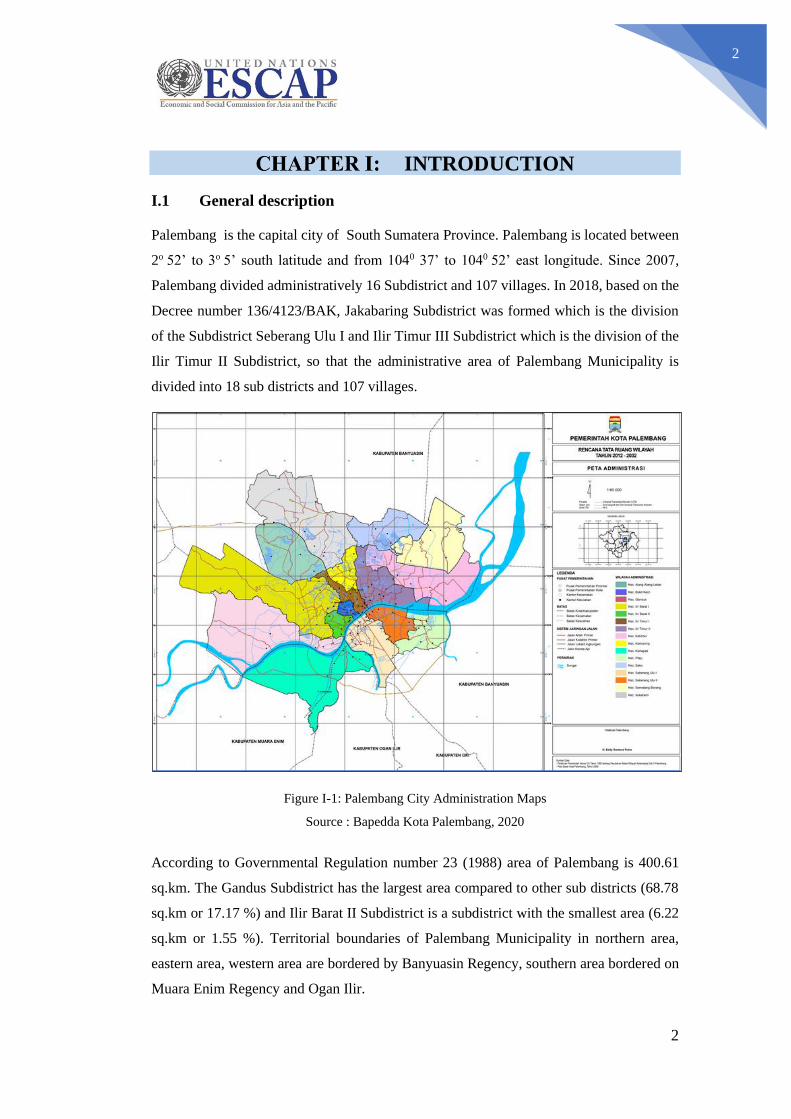
Palembang is the capital city of South Sumatera Province. Palembang is located between
2o 52’ to 3o 5’ south latitude and from 1040 37’ to 1040 52’ east longitude. Since 2007,
Palembang divided administratively 16 Subdistrict and 107 villages. In 2018, based on the
Decree number 136/4123/BAK, Jakabaring Subdistrict was formed which is the division
of the Subdistrict Seberang Ulu I and Ilir Timur III Subdistrict which is the division of the
Ilir Timur II Subdistrict, so that the administrative area of Palembang Municipality is
divided into 18 sub districts and 107 villages.
Figure I-1: Palembang City Administration Maps
Source : Bapedda Kota Palembang, 2020
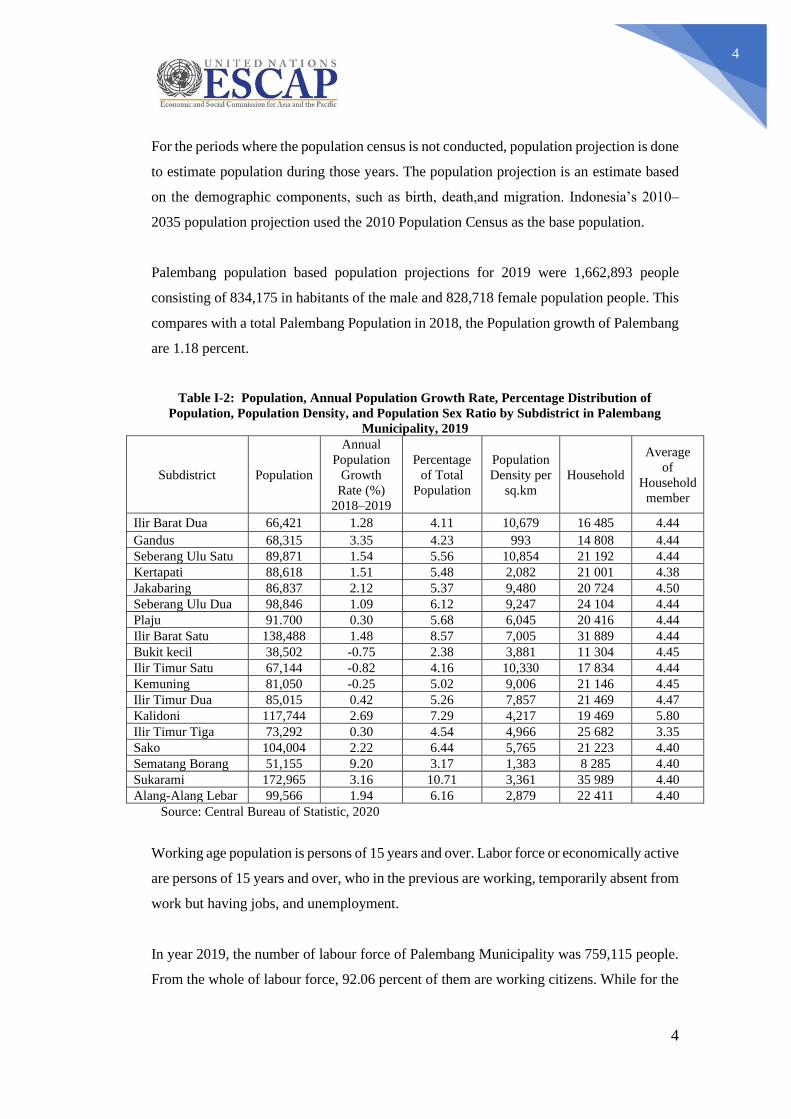
According to Governmental Regulation number 23 (1988) area of Palembang is 400.61
sq.km. The Gandus Subdistrict has the largest area compared to other sub districts (68.78
sq.km or 17.17 %) and Ilir Barat II Subdistrict is a subdistrict with the smallest area (6.22
sq.km or 1.55 %). Territorial boundaries of Palembang Municipality in northern area,
eastern area, western area are bordered by Banyuasin Regency, southern area bordered on
Muara Enim Regency and Ogan Ilir.
3
3
Table I-1: Total Area and Percentage to Municipal Area by Subdistrict in
Palembang Municipality, 2019
Number
Subdistrict Capital of Subdistrict Total Area
(sq.km)
Percentage to
Municipal
Area (%)
1 Ilir Barat Dua Dua-puluh-sembilan Ilir 6.22 1.55
2 Gandus Gandus 68.78 17.17
3 Seberang Ulu Satu Tiga Empat Ulu 8.28 2.07
4 Kertapati Karyajaya 42.56 10.62
5 Jakabaring Lima-belas Ulu 9.16 2.29
6 Seberang Ulu Dua Empat-belas Ulu 10.69 2.67
7 Plaju Plaju Ilir 15.17 3.79
8 Ilir Barat Satu Bukitlama 19.77 4.93
9 Bukitkecil Dua-puluh-enam Ilir 9.92 2.48
10 Ilir Timur Satu Dua-puluh Ilir Tiga 6.50 1.62
11 Kemuning Ario Kemuning 9.00 2.25
12 Ilir Timur Dua Tiga Ilir 10.82 2.70
13 Kalidoni Kalidoni 27.92 6.97
14 Ilir Timur Tiga Delapan Ilir 14.76 3.68
15 Sako Sako Baru 18.04 4.50
16 Sematangborang Srimulya 36.98 9.23
17 Sukarami Kebunbunga 51.46 12.85
18 Alang-Alang Lebar Talangkelapa 34.58 8.63
Source: Central Bureau of Statistic, 2020
I.2 Demography
I.2.1 Population and Employment
The main source of demographic data is population census, which is conducted every ten
years. Population Census has been conducted six times since Indonesia’s independence:
1961, 1971, 1980, 1990, 2000, and 2010. The method of data collection in a population
census involves interviewing respondents and conducting e-census. Enumeration of the
population uses the concept of “usual residence”, which is the concept of “places where
people usually live”. De jure was applied to the permanent residents, while defacto was
applied to non-permanent residents. The permanent residents were enumerated in place
where they normally live, the non-permanent residents were enumerated where they were
found by the enumerators,on the night of ‘Census Date’. Thenon permanent residents
include homeless people, ship crew, boatpeople, remote area community, andinternally
displaced persons. Those who had permanent residence andhad been travelling away from
their home for six months or more werenot enumerated in their permanentplace, but in the
place where theywere during the census.
4
4
For the periods where the population census is not conducted, population projection is done
to estimate population during those years. The population projection is an estimate based
on the demographic components, such as birth, death,and migration. Indonesia’s 2010–
2035 population projection used the 2010 Population Census as the base population.
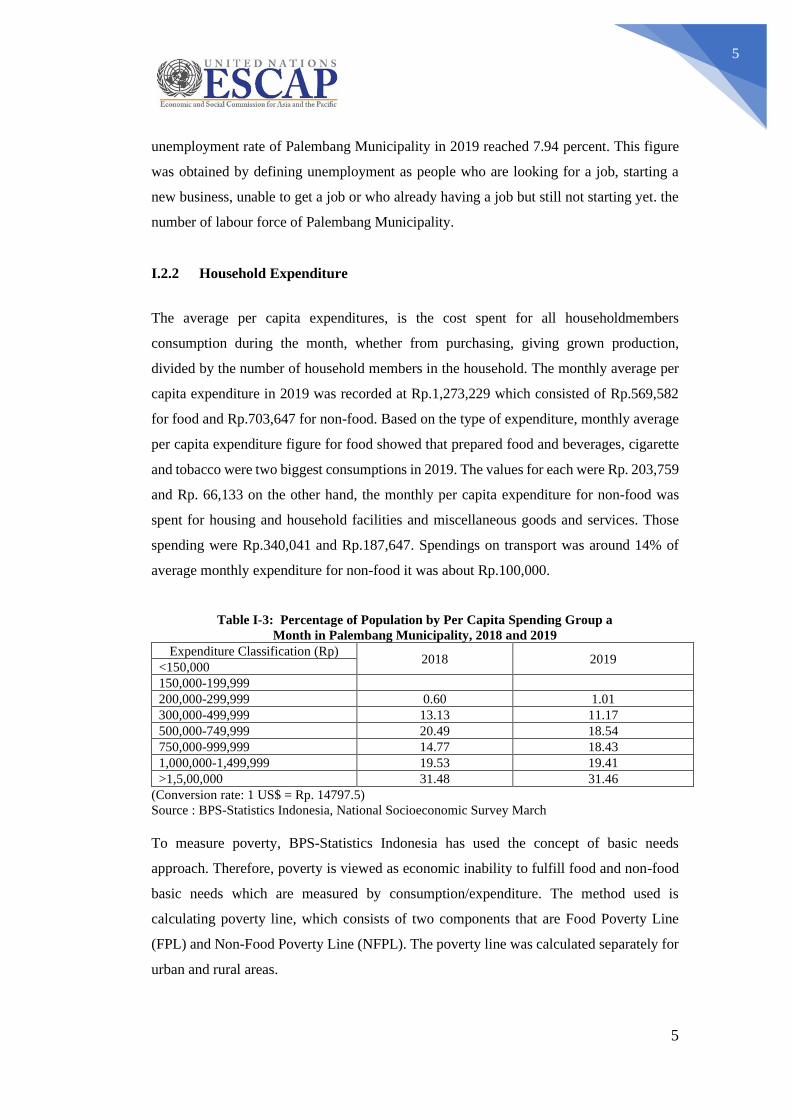
Palembang population based population projections for 2019 were 1,662,893 people
consisting of 834,175 in habitants of the male and 828,718 female population people. This
compares with a total Palembang Population in 2018, the Population growth of Palembang
are 1.18 percent.
Table I-2: Population, Annual Population Growth Rate, Percentage Distribution of
Population, Population Density, and Population Sex Ratio by Subdistrict in Palembang
Municipality, 2019
Subdistrict Population
Annual
Population
Growth
Rate (%)
2018–2019
Percentage
of Total
Population
Population
Density per
sq.km
Household
Average
of
Household
member
Ilir Barat Dua 66,421 1.28 4.11 10,679 16 485 4.44
Gandus 68,315 3.35 4.23 993 14 808 4.44
Seberang Ulu Satu 89,871 1.54 5.56 10,854 21 192 4.44
Kertapati 88,618 1.51 5.48 2,082 21 001 4.38
Jakabaring 86,837 2.12 5.37 9,480 20 724 4.50
Seberang Ulu Dua 98,846 1.09 6.12 9,247 24 104 4.44
Plaju 91.700 0.30 5.68 6,045 20 416 4.44
Ilir Barat Satu 138,488 1.48 8.57 7,005 31 889 4.44
Bukit kecil 38,502 -0.75 2.38 3,881 11 304 4.45
Ilir Timur Satu 67,144 -0.82 4.16 10,330 17 834 4.44
Kemuning 81,050 -0.25 5.02 9,006 21 146 4.45
Ilir Timur Dua 85,015 0.42 5.26 7,857 21 469 4.47
Kalidoni 117,744 2.69 7.29 4,217 19 469 5.80
Ilir Timur Tiga 73,292 0.30 4.54 4,966 25 682 3.35
Sako 104,004 2.22 6.44 5,765 21 223 4.40
Sematang Borang 51,155 9.20 3.17 1,383 8 285 4.40
Sukarami 172,965 3.16 10.71 3,361 35 989 4.40
Alang-Alang Lebar 99,566 1.94 6.16 2,879 22 411 4.40
Source: Central Bureau of Statistic, 2020
Working age population is persons of 15 years and over. Labor force or economically active
are persons of 15 years and over, who in the previous are working, temporarily absent from
work but having jobs, and unemployment.
In year 2019, the number of labour force of Palembang Municipality was 759,115 people.
From the whole of labour force, 92.06 percent of them are working citizens. While for the
5
5
unemployment rate of Palembang Municipality in 2019 reached 7.94 percent. This figure
was obtained by defining unemployment as people who are looking for a job, starting a
new business, unable to get a job or who already having a job but still not starting yet. the
number of labour force of Palembang Municipality.
I.2.2 Household Expenditure
The average per capita expenditures, is the cost spent for all householdmembers
consumption during the month, whether from purchasing, giving grown production,
divided by the number of household members in the household. The monthly average per
capita expenditure in 2019 was recorded at Rp.1,273,229 which consisted of Rp.569,582
for food and Rp.703,647 for non-food. Based on the type of expenditure, monthly average
per capita expenditure figure for food showed that prepared food and beverages, cigarette
and tobacco were two biggest consumptions in 2019. The values for each were Rp. 203,759
and Rp. 66,133 on the other hand, the monthly per capita expenditure for non-food was
spent for housing and household facilities and miscellaneous goods and services. Those
spending were Rp.340,041 and Rp.187,647. Spendings on transport was around 14% of
average monthly expenditure for non-food it was about Rp.100,000.
Table I-3: Percentage of Population by Per Capita Spending Group a
Month in Palembang Municipality, 2018 and 2019
Expenditure Classification (Rp) 2018 2019
<150,000
150,000-199,999
200,000-299,999 0.60 1.01
300,000-499,999 13.13 11.17
500,000-749,999 20.49 18.54
750,000-999,999 14.77 18.43
1,000,000-1,499,999 19.53 19.41
>1,5,00,000 31.48 31.46
(Conversion rate: 1 US$ = Rp. 14797.5)
Source : BPS-Statistics Indonesia, National Socioeconomic Survey March
To measure poverty, BPS-Statistics Indonesia has used the concept of basic needs
approach. Therefore, poverty is viewed as economic inability to fulfill food and non-food
basic needs which are measured by consumption/expenditure. The method used is
calculating poverty line, which consists of two components that are Food Poverty Line
(FPL) and Non-Food Poverty Line (NFPL). The poverty line was calculated separately for
urban and rural areas.
6
6
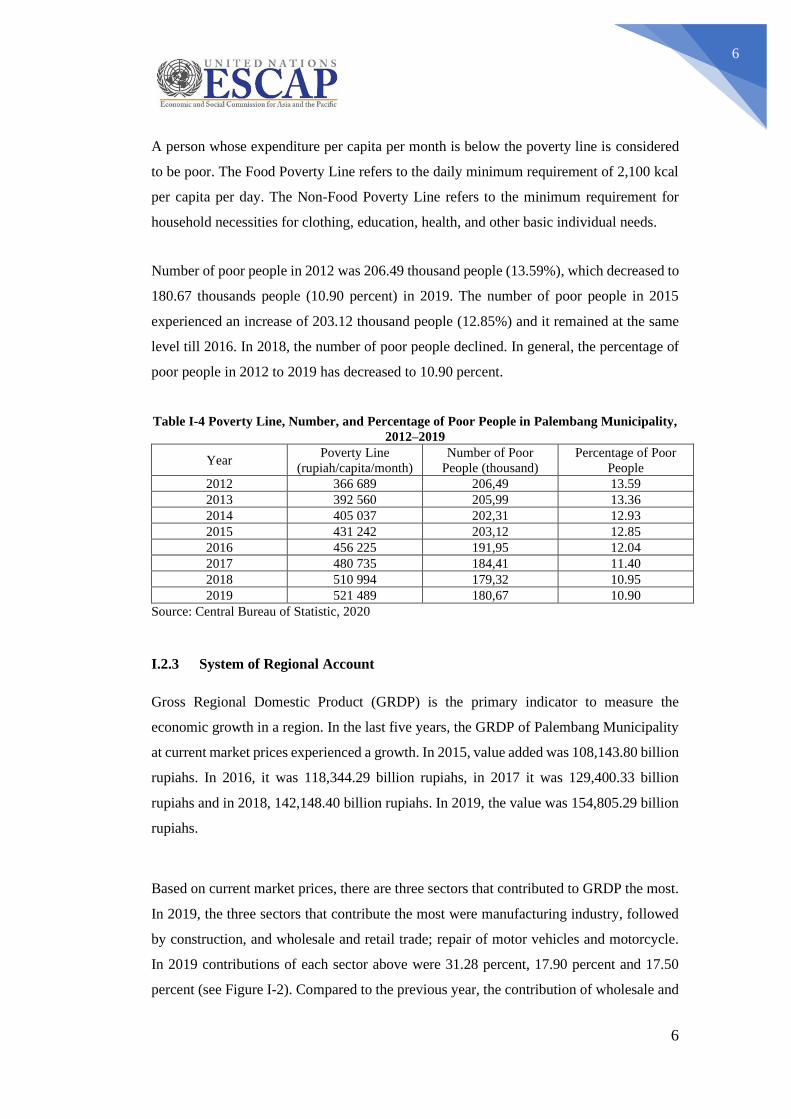
A person whose expenditure per capita per month is below the poverty line is considered
to be poor. The Food Poverty Line refers to the daily minimum requirement of 2,100 kcal
per capita per day. The Non-Food Poverty Line refers to the minimum requirement for
household necessities for clothing, education, health, and other basic individual needs.
Number of poor people in 2012 was 206.49 thousand people (13.59%), which decreased to
180.67 thousands people (10.90 percent) in 2019. The number of poor people in 2015
experienced an increase of 203.12 thousand people (12.85%) and it remained at the same
level till 2016. In 2018, the number of poor people declined. In general, the percentage of
poor people in 2012 to 2019 has decreased to 10.90 percent.
Table I-4 Poverty Line, Number, and Percentage of Poor People in Palembang Municipality,
2012–2019
Year Poverty Line
(rupiah/capita/month)
Number of Poor
People (thousand)
Percentage of Poor
People
2012 366 689 206,49 13.59
2013 392 560 205,99 13.36
2014 405 037 202,31 12.93
2015 431 242 203,12 12.85
2016 456 225 191,95 12.04
2017 480 735 184,41 11.40
2018 510 994 179,32 10.95
2019 521 489 180,67 10.90
Source: Central Bureau of Statistic, 2020
I.2.3 System of Regional Account
Gross Regional Domestic Product (GRDP) is the primary indicator to measure the
economic growth in a region. In the last five years, the GRDP of Palembang Municipality
at current market prices experienced a growth. In 2015, value added was 108,143.80 billion
rupiahs. In 2016, it was 118,344.29 billion rupiahs, in 2017 it was 129,400.33 billion
rupiahs and in 2018, 142,148.40 billion rupiahs. In 2019, the value was 154,805.29 billion
rupiahs.
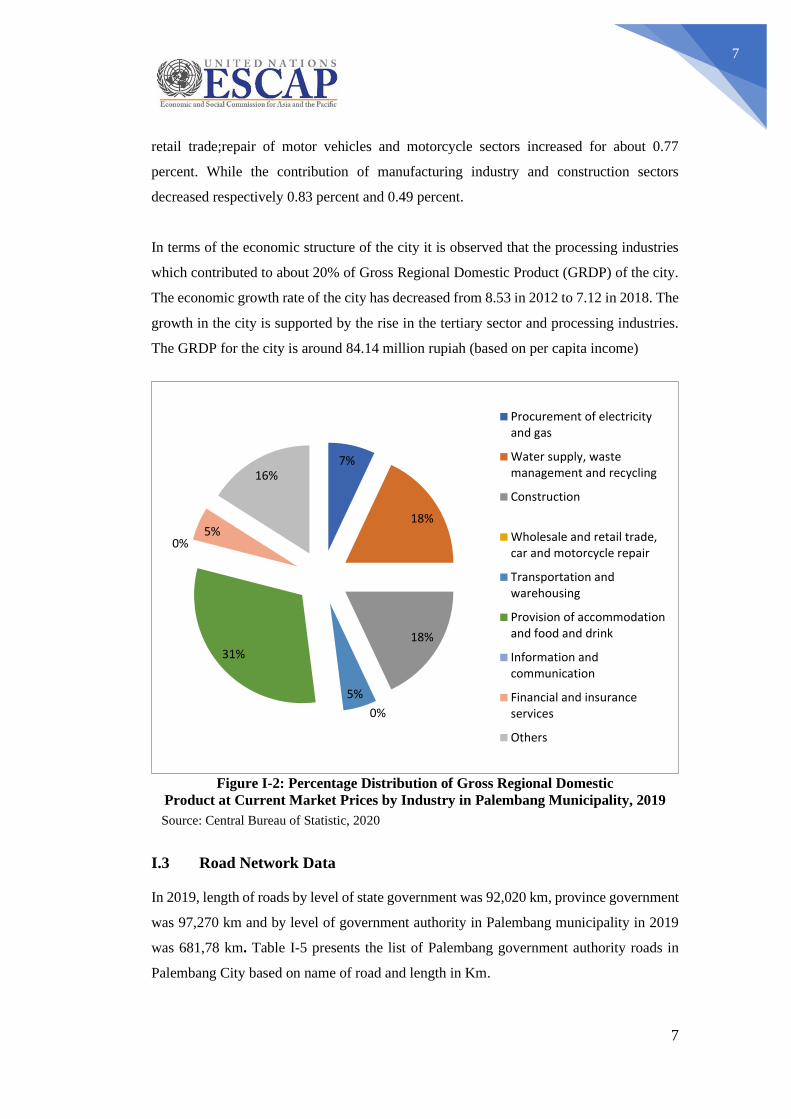
Based on current market prices, there are three sectors that contributed to GRDP the most.
In 2019, the three sectors that contribute the most were manufacturing industry, followed
by construction, and wholesale and retail trade; repair of motor vehicles and motorcycle.
In 2019 contributions of each sector above were 31.28 percent, 17.90 percent and 17.50
percent (see Figure I-2). Compared to the previous year, the contribution of wholesale and
7
7
retail trade;repair of motor vehicles and motorcycle sectors increased for about 0.77
percent. While the contribution of manufacturing industry and construction sectors
decreased respectively 0.83 percent and 0.49 percent.
In terms of the economic structure of the city it is observed that the processing industries
which contributed to about 20% of Gross Regional Domestic Product (GRDP) of the city.
The economic growth rate of the city has decreased from 8.53 in 2012 to 7.12 in 2018. The
growth in the city is supported by the rise in the tertiary sector and processing industries.
The GRDP for the city is around 84.14 million rupiah (based on per capita income)
Figure I-2: Percentage Distribution of Gross Regional Domestic
Product at Current Market Prices by Industry in Palembang Municipality, 2019
Source: Central Bureau of Statistic, 2020
I.3 Road Network Data
In 2019, length of roads by level of state government was 92,020 km, province government
was 97,270 km and by level of government authority in Palembang municipality in 2019
was 681,78 km. Table I-5 presents the list of Palembang government authority roads in
Palembang City based on name of road and length in Km.
7%
18%
18%
0%
5%
31%
0%5%
16%
Procurement of electricityand gas
Water supply, wastemanagement and recycling
Construction
Wholesale and retail trade,car and motorcycle repair
Transportation andwarehousing
Provision of accommodationand food and drink
Information andcommunication
Financial and insuranceservices
Others
8
8
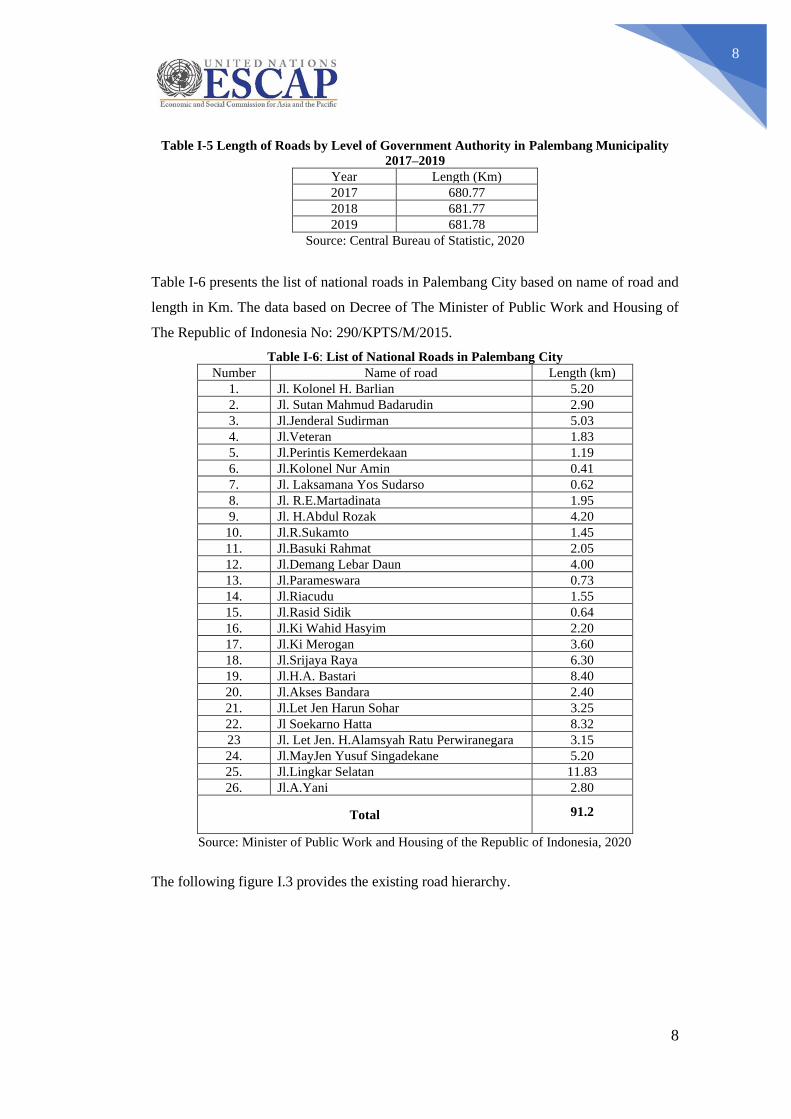
Table I-5 Length of Roads by Level of Government Authority in Palembang Municipality
2017–2019
Year Length (Km)
2017 680.77
2018 681.77
2019 681.78
Source: Central Bureau of Statistic, 2020
Table I-6 presents the list of national roads in Palembang City based on name of road and
length in Km. The data based on Decree of The Minister of Public Work and Housing of
The Republic of Indonesia No: 290/KPTS/M/2015.
Table I-6: List of National Roads in Palembang City
Number Name of road Length (km)
1. Jl. Kolonel H. Barlian 5.20
2. Jl. Sutan Mahmud Badarudin 2.90
3. Jl.Jenderal Sudirman 5.03
4. Jl.Veteran 1.83
5. Jl.Perintis Kemerdekaan 1.19
6. Jl.Kolonel Nur Amin 0.41
7. Jl. Laksamana Yos Sudarso 0.62
8. Jl. R.E.Martadinata 1.95
9. Jl. H.Abdul Rozak 4.20
10. Jl.R.Sukamto 1.45
11. Jl.Basuki Rahmat 2.05
12. Jl.Demang Lebar Daun 4.00
13. Jl.Parameswara 0.73
14. Jl.Riacudu 1.55
15. Jl.Rasid Sidik 0.64
16. Jl.Ki Wahid Hasyim 2.20
17. Jl.Ki Merogan 3.60
18. Jl.Srijaya Raya 6.30
19. Jl.H.A. Bastari 8.40
20. Jl.Akses Bandara 2.40
21. Jl.Let Jen Harun Sohar 3.25
22. Jl Soekarno Hatta 8.32
23 Jl. Let Jen. H.Alamsyah Ratu Perwiranegara 3.15
24. Jl.MayJen Yusuf Singadekane 5.20
25. Jl.Lingkar Selatan 11.83
26. Jl.A.Yani 2.80
Total 91.2
Source: Minister of Public Work and Housing of the Republic of Indonesia, 2020
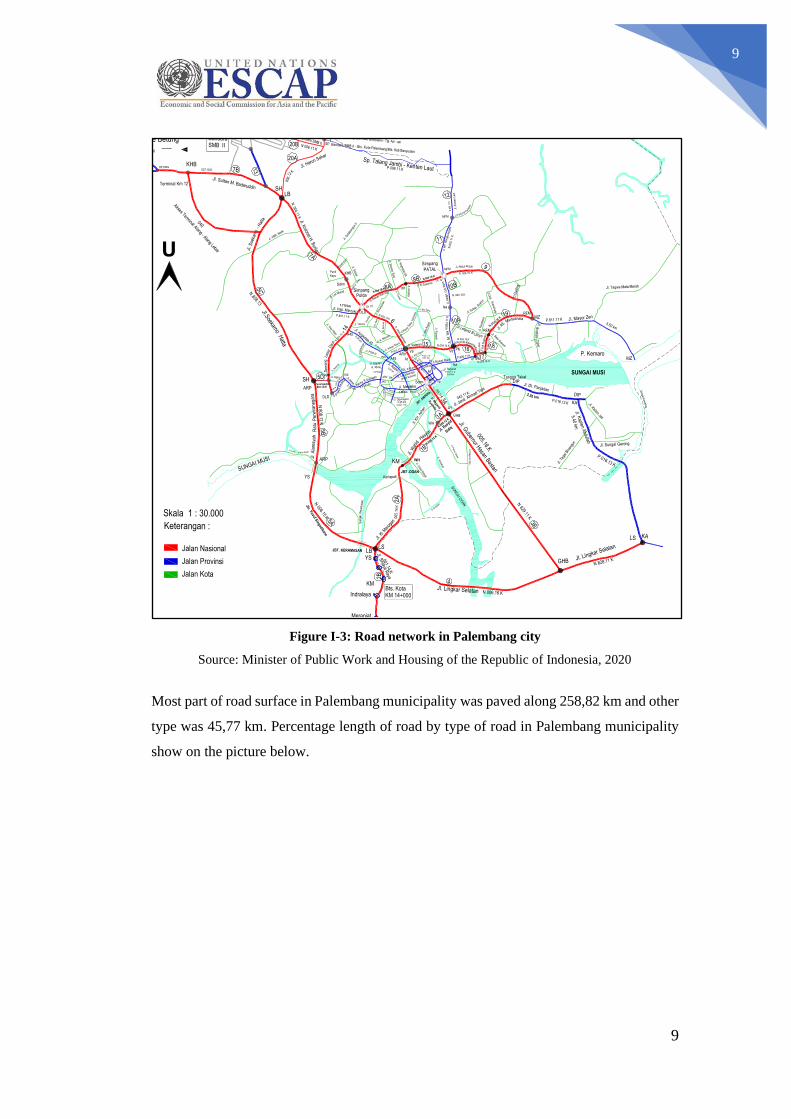
The following figure I.3 provides the existing road hierarchy.
9
9
Figure I-3: Road network in Palembang city
Source: Minister of Public Work and Housing of the Republic of Indonesia, 2020
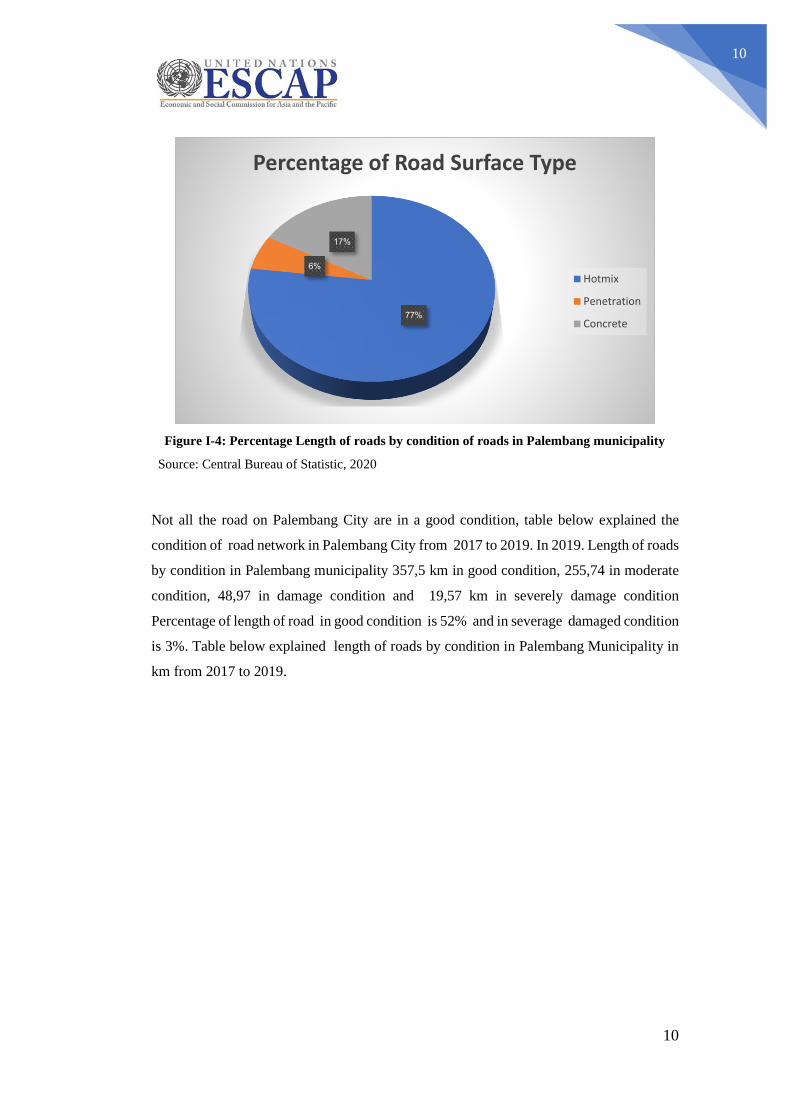
Most part of road surface in Palembang municipality was paved along 258,82 km and other
type was 45,77 km. Percentage length of road by type of road in Palembang municipality
show on the picture below.
10
10
Figure I-4: Percentage Length of roads by condition of roads in Palembang municipality
Source: Central Bureau of Statistic, 2020
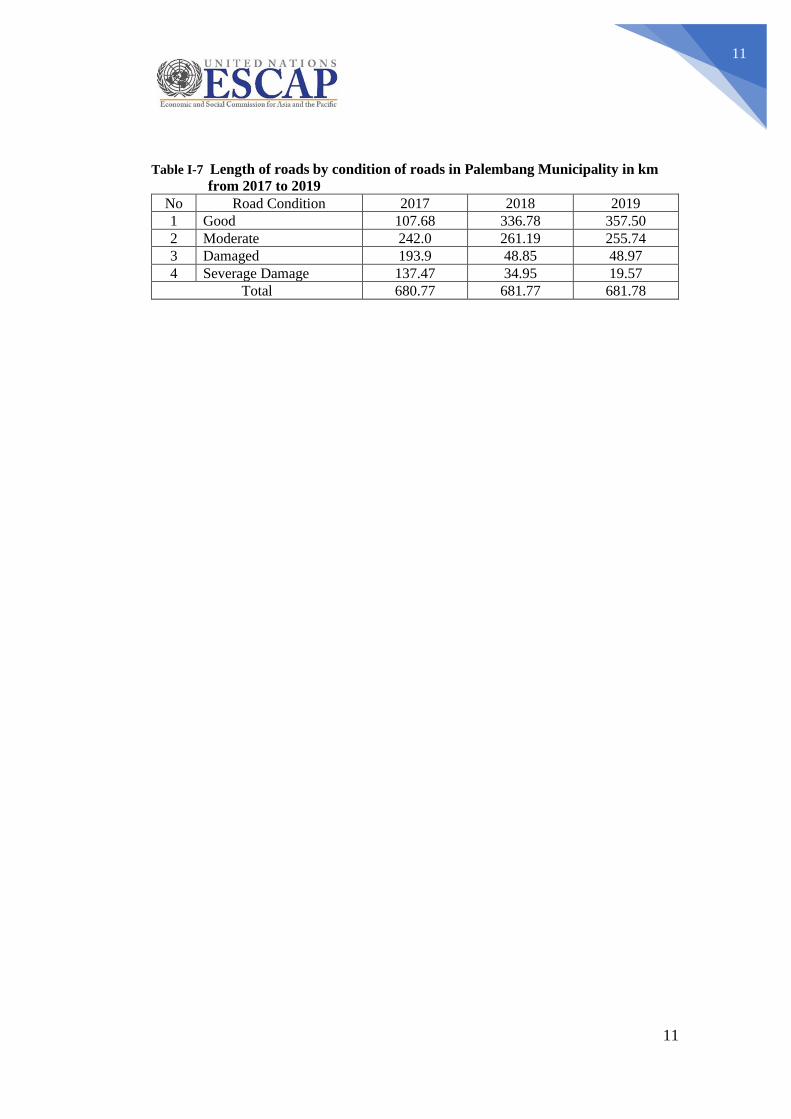
Not all the road on Palembang City are in a good condition, table below explained the
condition of road network in Palembang City from 2017 to 2019. In 2019. Length of roads
by condition in Palembang municipality 357,5 km in good condition, 255,74 in moderate
condition, 48,97 in damage condition and 19,57 km in severely damage condition
Percentage of length of road in good condition is 52% and in severage damaged condition
is 3%. Table below explained length of roads by condition in Palembang Municipality in
km from 2017 to 2019.
77%
6%
17%
Percentage of Road Surface Type
Hotmix
Penetration
Concrete
11
11
Table I-7 Length of roads by condition of roads in Palembang Municipality in km
from 2017 to 2019
No Road Condition 2017 2018 2019
1 Good 107.68 336.78 357.50
2 Moderate 242.0 261.19 255.74
3 Damaged 193.9 48.85 48.97
4 Severage Damage 137.47 34.95 19.57
Total 680.77 681.77 681.78
12
12
CURRENT STATE OF URBAN
TRANSPORT SYSTEMS AND
SERVICE
This chapter includes the current state of urban transport systems and service including a
brief description of the road and public transport network & infrastructure situation along
with issues identified, and the policy and projects response to deal with the situation.
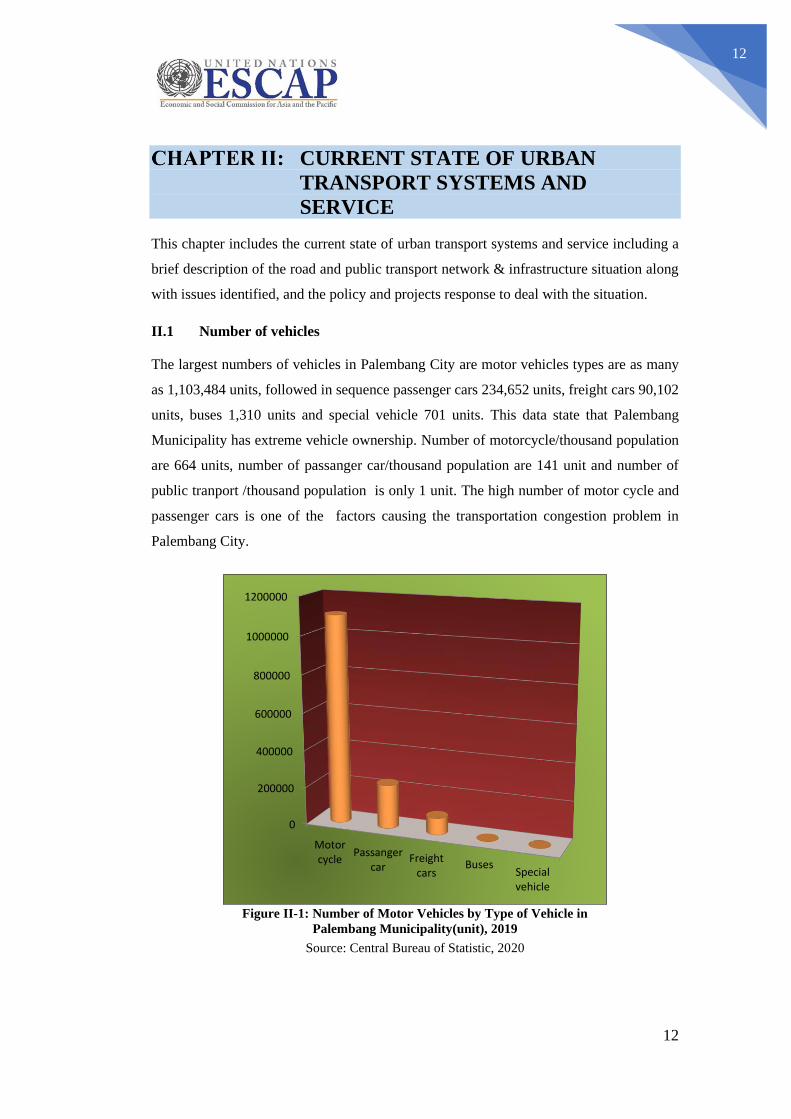
II.1 Number of vehicles
The largest numbers of vehicles in Palembang City are motor vehicles types are as many
as 1,103,484 units, followed in sequence passenger cars 234,652 units, freight cars 90,102
units, buses 1,310 units and special vehicle 701 units. This data state that Palembang
Municipality has extreme vehicle ownership. Number of motorcycle/thousand population
are 664 units, number of passanger car/thousand population are 141 unit and number of
public tranport /thousand population is only 1 unit. The high number of motor cycle and
passenger cars is one of the factors causing the transportation congestion problem in
Palembang City.
Figure II-1: Number of Motor Vehicles by Type of Vehicle in
Palembang Municipality(unit), 2019
Source: Central Bureau of Statistic, 2020
0
200000
400000
600000
800000
1000000
1200000
Motorcycle
Passangercar
Freightcars
BusesSpecialvehicle
13
13
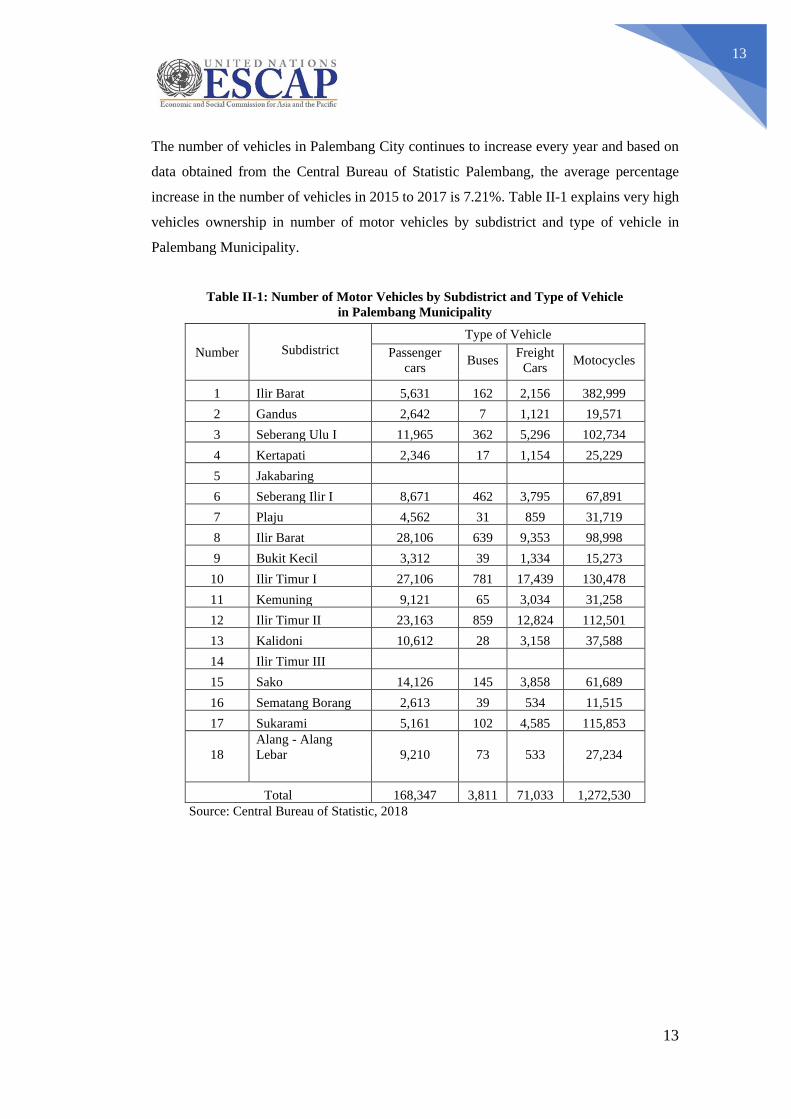
The number of vehicles in Palembang City continues to increase every year and based on
data obtained from the Central Bureau of Statistic Palembang, the average percentage
increase in the number of vehicles in 2015 to 2017 is 7.21%. Table II-1 explains very high
vehicles ownership in number of motor vehicles by subdistrict and type of vehicle in
Palembang Municipality.
Table II-1: Number of Motor Vehicles by Subdistrict and Type of Vehicle
in Palembang Municipality
Number Subdistrict
Type of Vehicle
Passenger
cars Buses
Freight
Cars Motocycles
1 Ilir Barat 5,631 162 2,156 382,999
2 Gandus 2,642 7 1,121 19,571
3 Seberang Ulu I 11,965 362 5,296 102,734
4 Kertapati 2,346 17 1,154 25,229
5 Jakabaring
6 Seberang Ilir I 8,671 462 3,795 67,891
7 Plaju 4,562 31 859 31,719
8 Ilir Barat 28,106 639 9,353 98,998
9 Bukit Kecil 3,312 39 1,334 15,273
10 Ilir Timur I 27,106 781 17,439 130,478
11 Kemuning 9,121 65 3,034 31,258
12 Ilir Timur II 23,163 859 12,824 112,501
13 Kalidoni 10,612 28 3,158 37,588
14 Ilir Timur III
15 Sako 14,126 145 3,858 61,689
16 Sematang Borang 2,613 39 534 11,515
17 Sukarami 5,161 102 4,585 115,853
18
Alang - Alang
Lebar 9,210 73 533 27,234
Total 168,347 3,811 71,033 1,272,530
Source: Central Bureau of Statistic, 2018
14
14
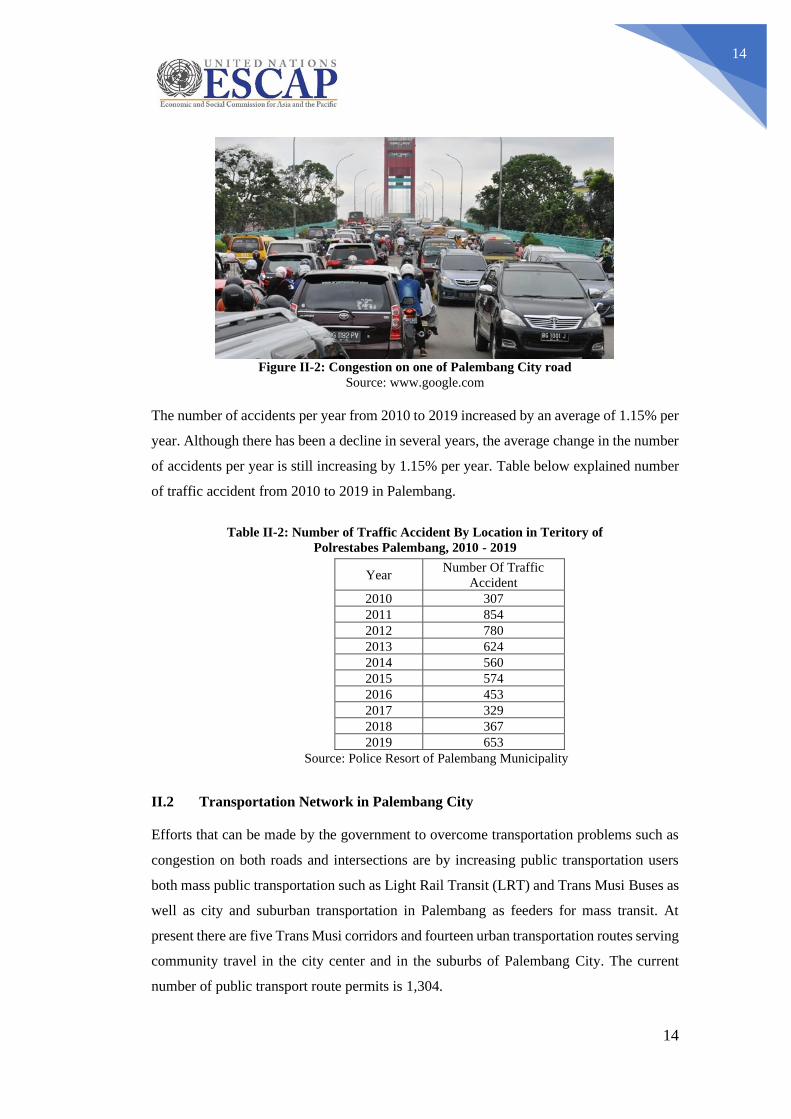
Figure II-2: Congestion on one of Palembang City road
Source: www.google.com
The number of accidents per year from 2010 to 2019 increased by an average of 1.15% per
year. Although there has been a decline in several years, the average change in the number
of accidents per year is still increasing by 1.15% per year. Table below explained number
of traffic accident from 2010 to 2019 in Palembang.
Table II-2: Number of Traffic Accident By Location in Teritory of
Polrestabes Palembang, 2010 - 2019
Year Number Of Traffic
Accident
2010 307
2011 854
2012 780
2013 624
2014 560
2015 574
2016 453
2017 329
2018 367
2019 653
Source: Police Resort of Palembang Municipality
II.2 Transportation Network in Palembang City
Efforts that can be made by the government to overcome transportation problems such as
congestion on both roads and intersections are by increasing public transportation users
both mass public transportation such as Light Rail Transit (LRT) and Trans Musi Buses as
well as city and suburban transportation in Palembang as feeders for mass transit. At
present there are five Trans Musi corridors and fourteen urban transportation routes serving
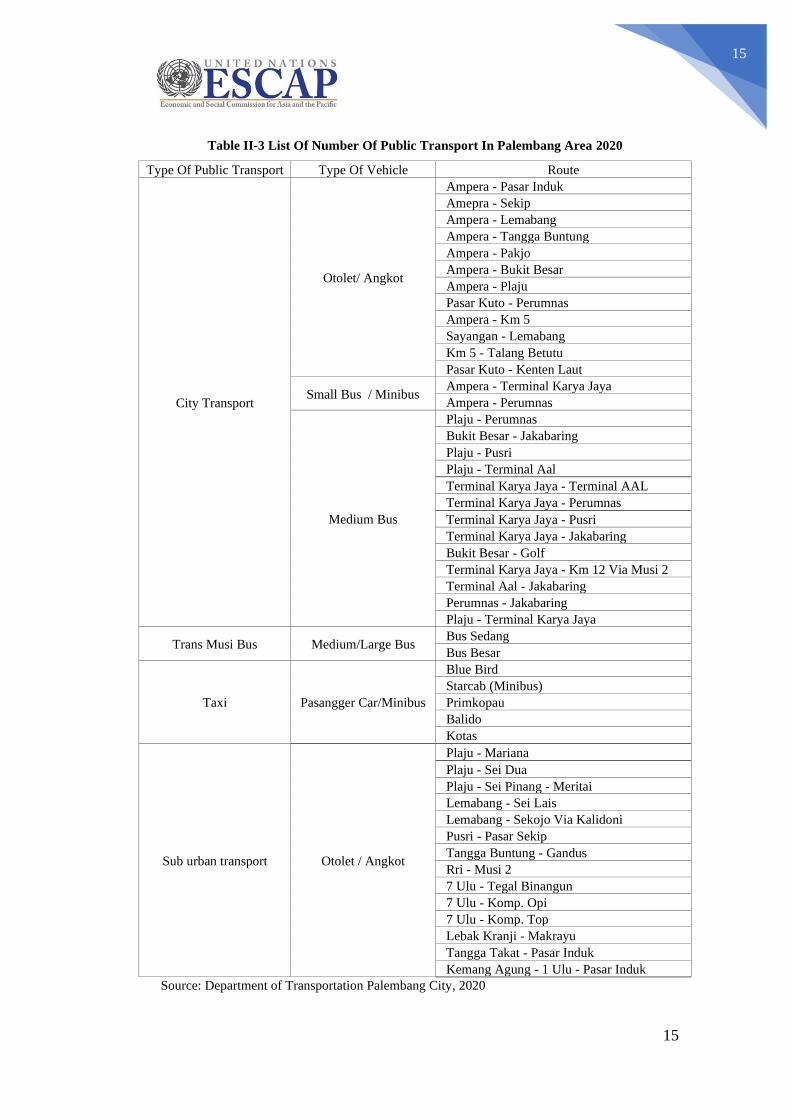
community travel in the city center and in the suburbs of Palembang City. The current
number of public transport route permits is 1,304.
15
15
Table II-3 List Of Number Of Public Transport In Palembang Area 2020
Type Of Public Transport Type Of Vehicle Route
City Transport
Otolet/ Angkot
Ampera - Pasar Induk
Amepra - Sekip
Ampera - Lemabang
Ampera - Tangga Buntung
Ampera - Pakjo
Ampera - Bukit Besar
Ampera - Plaju
Pasar Kuto - Perumnas
Ampera - Km 5
Sayangan - Lemabang
Km 5 - Talang Betutu
Pasar Kuto - Kenten Laut
Small Bus / Minibus Ampera - Terminal Karya Jaya
Ampera - Perumnas
Medium Bus
Plaju - Perumnas
Bukit Besar - Jakabaring
Plaju - Pusri
Plaju - Terminal Aal
Terminal Karya Jaya - Terminal AAL
Terminal Karya Jaya - Perumnas
Terminal Karya Jaya - Pusri
Terminal Karya Jaya - Jakabaring
Bukit Besar - Golf
Terminal Karya Jaya - Km 12 Via Musi 2
Terminal Aal - Jakabaring
Perumnas - Jakabaring
Plaju - Terminal Karya Jaya
Trans Musi Bus Medium/Large Bus Bus Sedang
Bus Besar
Taxi Pasangger Car/Minibus
Blue Bird
Starcab (Minibus)
Primkopau
Balido
Kotas
Sub urban transport Otolet / Angkot
Plaju - Mariana
Plaju - Sei Dua
Plaju - Sei Pinang - Meritai
Lemabang - Sei Lais
Lemabang - Sekojo Via Kalidoni
Pusri - Pasar Sekip
Tangga Buntung - Gandus
Rri - Musi 2
7 Ulu - Tegal Binangun
7 Ulu - Komp. Opi
7 Ulu - Komp. Top
Lebak Kranji - Makrayu
Tangga Takat - Pasar Induk
Kemang Agung - 1 Ulu - Pasar Induk
Source: Department of Transportation Palembang City, 2020
16
16
There are currently 5 Trans Musi Bus routes operating, Plaju-Palembang Square Mall,
Sako-Palembang Indah Mall, Karya Jaya-Jakabaring, Alang-Alang Lebar-Dempo and
Pusri- Palembang Square Mall. There are 73 buses with a passenger capacity of 34 people
for medium buses and 59 people for large buses. Since it began operating until 2019 the
Trans Musi Bus is managed by PT. Palembang Jaya Development Facility (PT. SP2J)
which is a Regional-Owned Enterprise (BUMD) of Palembang City, but in 2020 the
management is handed over to PT. Trans Musi Palembang Jaya which is a subsidiary of
PT. SP2J. Starting in 2020 Trans Musi Bus operations will be assisted by both the bus and
the budget center. Improvement of mass public transport services can be done by ensuring
that the public transport service standards meet the service standards described in PM
No.27 2015. The regulation explains that there are six types of minimum service standards
that must be met related to security, safety, comfort, affordability, regularity, and equality.
Based on these regulations the performance of the Trans Musi Bus service still needs to be
improved, especially in terms of regularity. With the limited number of operating fleets and
traffic congestion conditions, the waiting time for the arrival of the Trans Musi Bus at each
bus stop is still relatively long, which is around 15-30 minutes. In addition, there are still
several other types of services that are not in accordance with minimum service standards
and must continue to be improved.
An evaluation of the characteristics of the Trans Musi Bus service is used to assess Public
transport quality and reliability in Palembang. The data used was obtained from the
satisfaction survey of Trans Musi bus transportation users in July 2020. Due to the COVID-
19 pandemic the survey is used google form which was distributed to passangers of Trans
Musi in Palembang.
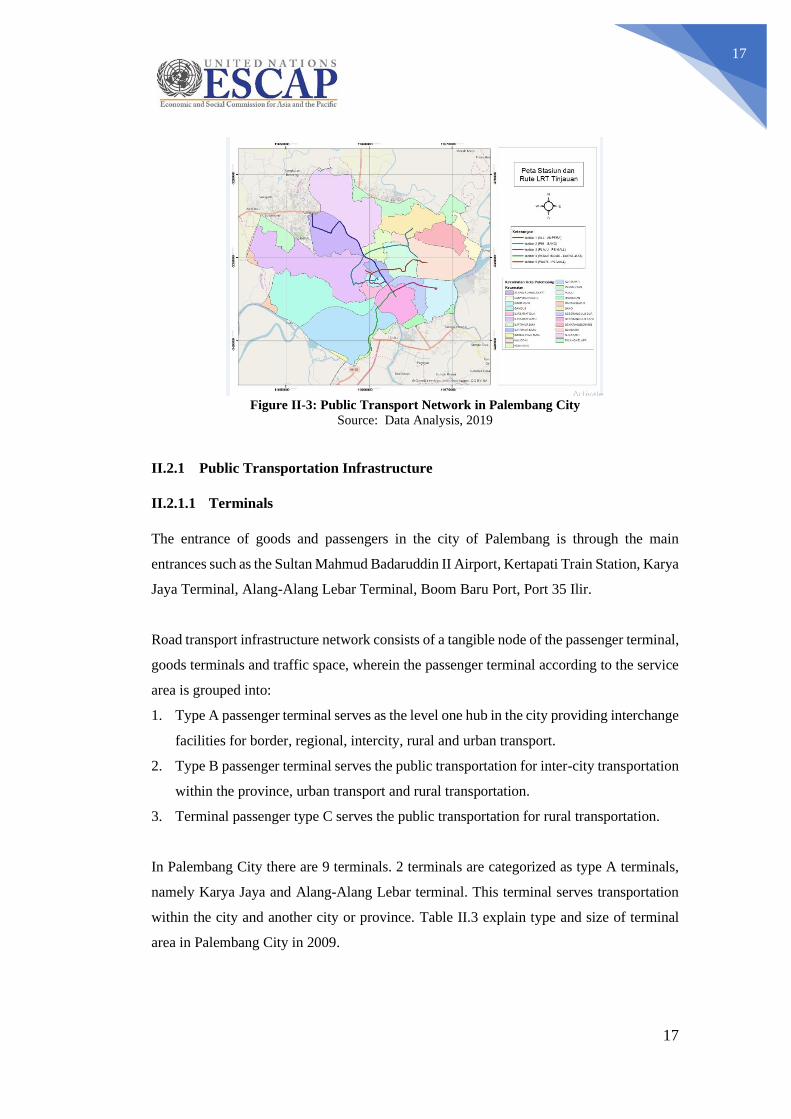
Figure II-4 explain Trans Musi route on Palembang road network. From the picture we can
see that not all the route serve all the district area in Palembang City. From the picture we
can see that Trans Musi Bus route has not been serve all the area in Palembang City. So
the Trans Musi Bus need feeder modes to connect the origin and destination of traveler.
17
17
Figure II-3: Public Transport Network in Palembang City
Source: Data Analysis, 2019
II.2.1 Public Transportation Infrastructure
II.2.1.1 Terminals
The entrance of goods and passengers in the city of Palembang is through the main
entrances such as the Sultan Mahmud Badaruddin II Airport, Kertapati Train Station, Karya
Jaya Terminal, Alang-Alang Lebar Terminal, Boom Baru Port, Port 35 Ilir.
Road transport infrastructure network consists of a tangible node of the passenger terminal,
goods terminals and traffic space, wherein the passenger terminal according to the service
area is grouped into:
1. Type A passenger terminal serves as the level one hub in the city providing interchange
facilities for border, regional, intercity, rural and urban transport.
2. Type B passenger terminal serves the public transportation for inter-city transportation
within the province, urban transport and rural transportation.
3. Terminal passenger type C serves the public transportation for rural transportation.
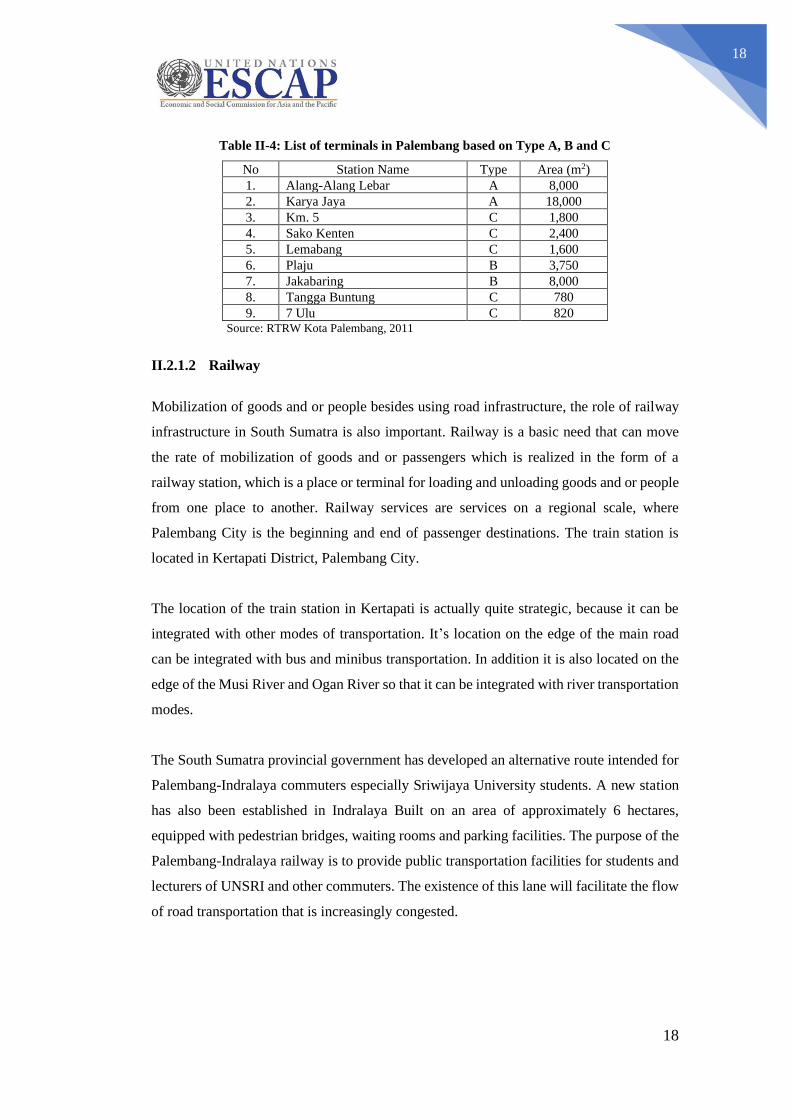
In Palembang City there are 9 terminals. 2 terminals are categorized as type A terminals,
namely Karya Jaya and Alang-Alang Lebar terminal. This terminal serves transportation
within the city and another city or province. Table II.3 explain type and size of terminal
area in Palembang City in 2009.
18
18
Table II-4: List of terminals in Palembang based on Type A, B and C
No Station Name Type Area (m2)
1. Alang-Alang Lebar A 8,000
2. Karya Jaya A 18,000
3. Km. 5 C 1,800
4. Sako Kenten C 2,400
5. Lemabang C 1,600
6. Plaju B 3,750
7. Jakabaring B 8,000
8. Tangga Buntung C 780
9. 7 Ulu C 820 Source: RTRW Kota Palembang, 2011
II.2.1.2 Railway
Mobilization of goods and or people besides using road infrastructure, the role of railway
infrastructure in South Sumatra is also important. Railway is a basic need that can move
the rate of mobilization of goods and or passengers which is realized in the form of a
railway station, which is a place or terminal for loading and unloading goods and or people
from one place to another. Railway services are services on a regional scale, where
Palembang City is the beginning and end of passenger destinations. The train station is
located in Kertapati District, Palembang City.
The location of the train station in Kertapati is actually quite strategic, because it can be
integrated with other modes of transportation. It’s location on the edge of the main road
can be integrated with bus and minibus transportation. In addition it is also located on the
edge of the Musi River and Ogan River so that it can be integrated with river transportation
modes.
The South Sumatra provincial government has developed an alternative route intended for
Palembang-Indralaya commuters especially Sriwijaya University students. A new station
has also been established in Indralaya Built on an area of approximately 6 hectares,
equipped with pedestrian bridges, waiting rooms and parking facilities. The purpose of the
Palembang-Indralaya railway is to provide public transportation facilities for students and
lecturers of UNSRI and other commuters. The existence of this lane will facilitate the flow
of road transportation that is increasingly congested.
19
19
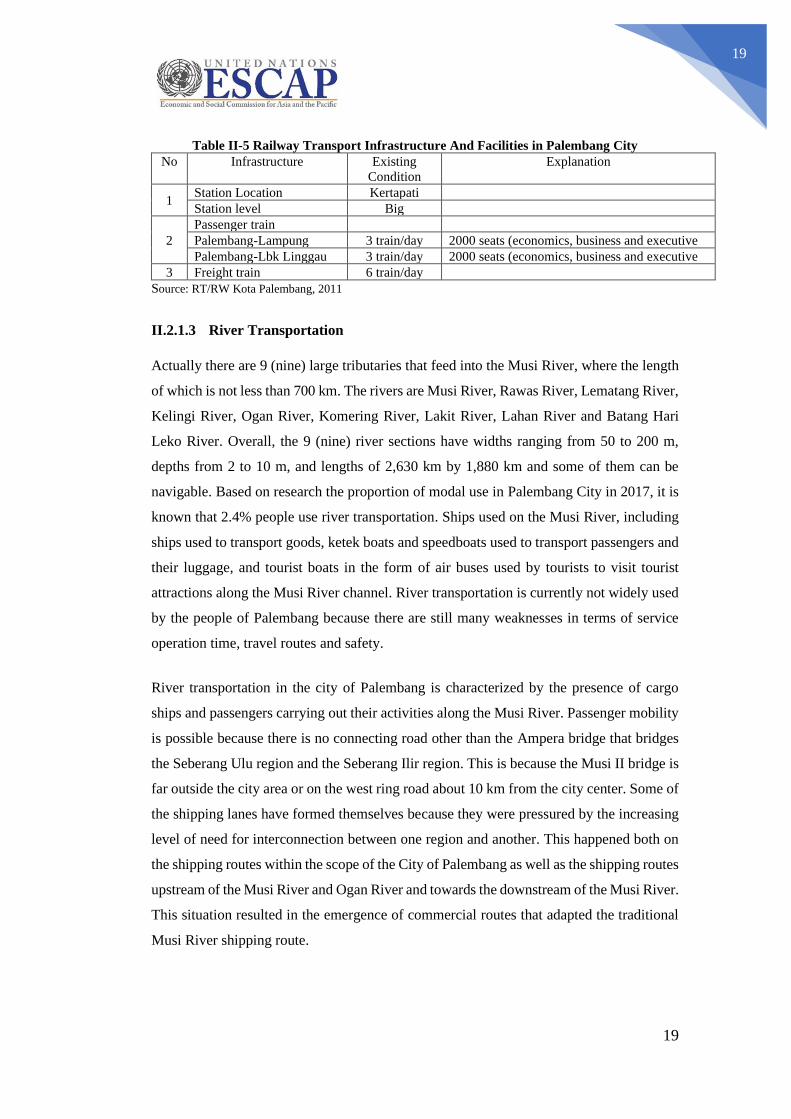
Table II-5 Railway Transport Infrastructure And Facilities in Palembang City
No Infrastructure Existing
Condition
Explanation
1 Station Location Kertapati
Station level Big
2
Passenger train
Palembang-Lampung 3 train/day 2000 seats (economics, business and executive
Palembang-Lbk Linggau 3 train/day 2000 seats (economics, business and executive
3 Freight train 6 train/day
Source: RT/RW Kota Palembang, 2011
II.2.1.3 River Transportation
Actually there are 9 (nine) large tributaries that feed into the Musi River, where the length
of which is not less than 700 km. The rivers are Musi River, Rawas River, Lematang River,
Kelingi River, Ogan River, Komering River, Lakit River, Lahan River and Batang Hari
Leko River. Overall, the 9 (nine) river sections have widths ranging from 50 to 200 m,
depths from 2 to 10 m, and lengths of 2,630 km by 1,880 km and some of them can be
navigable. Based on research the proportion of modal use in Palembang City in 2017, it is
known that 2.4% people use river transportation. Ships used on the Musi River, including
ships used to transport goods, ketek boats and speedboats used to transport passengers and
their luggage, and tourist boats in the form of air buses used by tourists to visit tourist
attractions along the Musi River channel. River transportation is currently not widely used
by the people of Palembang because there are still many weaknesses in terms of service
operation time, travel routes and safety.
River transportation in the city of Palembang is characterized by the presence of cargo
ships and passengers carrying out their activities along the Musi River. Passenger mobility
is possible because there is no connecting road other than the Ampera bridge that bridges
the Seberang Ulu region and the Seberang Ilir region. This is because the Musi II bridge is
far outside the city area or on the west ring road about 10 km from the city center. Some of
the shipping lanes have formed themselves because they were pressured by the increasing
level of need for interconnection between one region and another. This happened both on
the shipping routes within the scope of the City of Palembang as well as the shipping routes
upstream of the Musi River and Ogan River and towards the downstream of the Musi River.
This situation resulted in the emergence of commercial routes that adapted the traditional
Musi River shipping route.
20
20
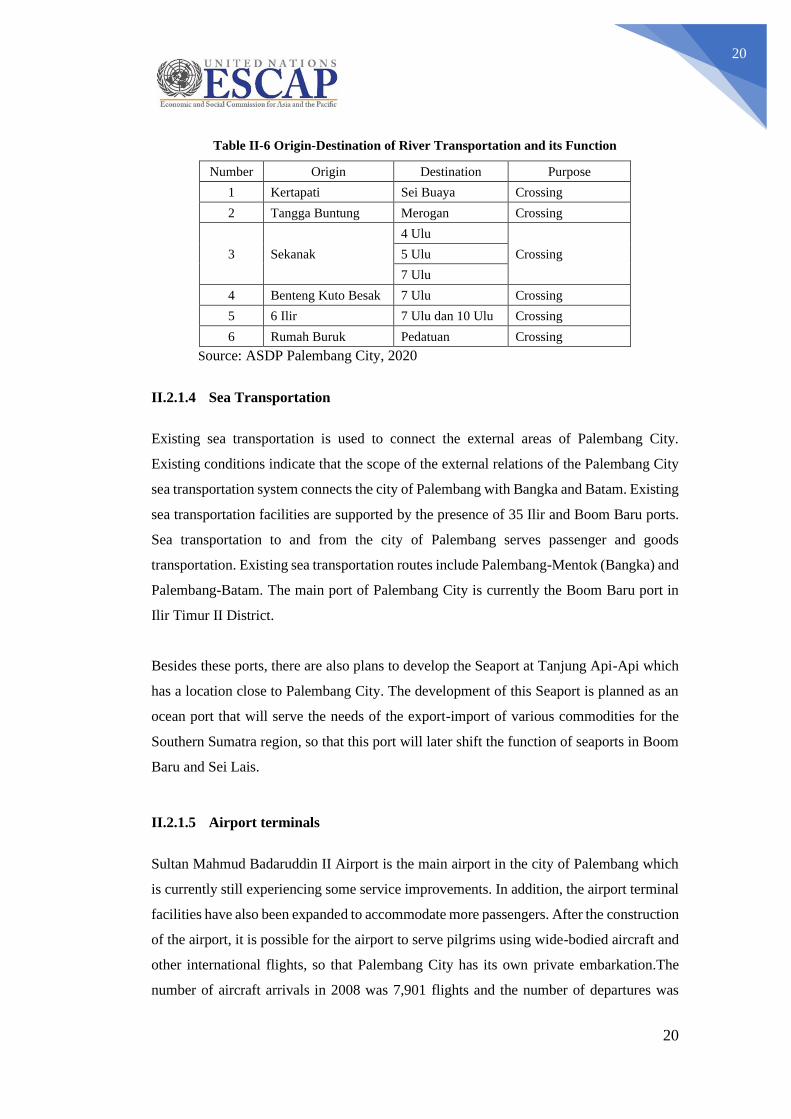
Table II-6 Origin-Destination of River Transportation and its Function
Number Origin Destination Purpose
1 Kertapati Sei Buaya Crossing
2 Tangga Buntung Merogan Crossing
3 Sekanak
4 Ulu
Crossing 5 Ulu
7 Ulu
4 Benteng Kuto Besak 7 Ulu Crossing
5 6 Ilir 7 Ulu dan 10 Ulu Crossing
6 Rumah Buruk Pedatuan Crossing
Source: ASDP Palembang City, 2020
II.2.1.4 Sea Transportation
Existing sea transportation is used to connect the external areas of Palembang City.
Existing conditions indicate that the scope of the external relations of the Palembang City
sea transportation system connects the city of Palembang with Bangka and Batam. Existing
sea transportation facilities are supported by the presence of 35 Ilir and Boom Baru ports.
Sea transportation to and from the city of Palembang serves passenger and goods
transportation. Existing sea transportation routes include Palembang-Mentok (Bangka) and
Palembang-Batam. The main port of Palembang City is currently the Boom Baru port in
Ilir Timur II District.
Besides these ports, there are also plans to develop the Seaport at Tanjung Api-Api which
has a location close to Palembang City. The development of this Seaport is planned as an
ocean port that will serve the needs of the export-import of various commodities for the
Southern Sumatra region, so that this port will later shift the function of seaports in Boom
Baru and Sei Lais.
II.2.1.5 Airport terminals
Sultan Mahmud Badaruddin II Airport is the main airport in the city of Palembang which
is currently still experiencing some service improvements. In addition, the airport terminal
facilities have also been expanded to accommodate more passengers. After the construction
of the airport, it is possible for the airport to serve pilgrims using wide-bodied aircraft and
other international flights, so that Palembang City has its own private embarkation.The
number of aircraft arrivals in 2008 was 7,901 flights and the number of departures was
21
21
7,903 flights, with a total of 812,828 passengers. Several airlines that have operated in
Palembang include Garuda Indonesia, Lion Air, Sriwijaya Air, Batavia Air, Kartika Air,
and Silk Air.
II.3 Master plan of transportation in Palembang
II.3.1 Construction of the passenger terminal
The need for terminal facilities according to the results of analysis based on established
standards, the terminal needs in 2009 were 12 terminals for the entire city, considering the
service scale of a terminal covers 120,000 inhabitants. Based on the projections that have
been made, up to 2029 Palembang City needs 18 terminals. Placement of 18 terminals can
be adjusted to the type of terminal to be built, so that the number of terminals can be
reduced but the type of existing terminal is increased. To support effective terminal
functions, good public transport route planning and other equipment such as bus stops and
bases are needed. The direction of the placement plan for the Palembang City terminal
location is to determine 3 (three) service types, namely Type A, Type B and Type C. In
2020, 15 terminals in Palembang City have been operating according to the plan set by the
government. The terminal consists of terminals of type A, B and C. Number and terminal
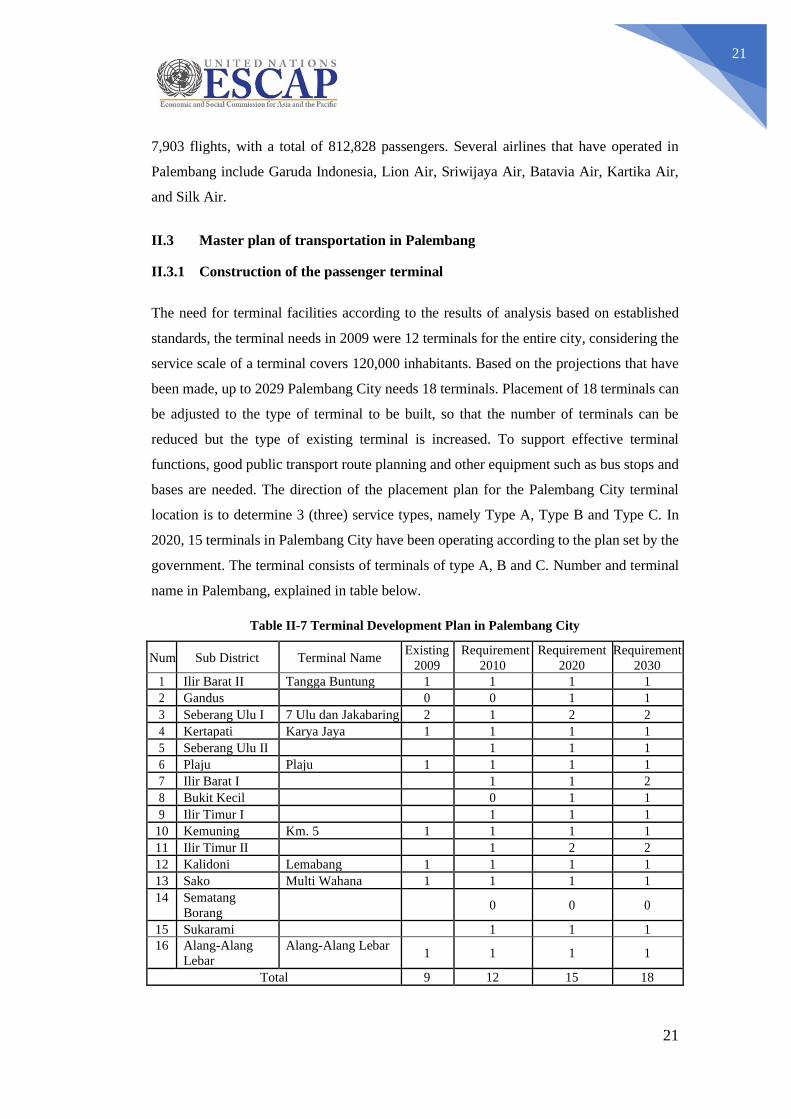
name in Palembang, explained in table below.
Table II-7 Terminal Development Plan in Palembang City
Num Sub District Terminal Name Existing
2009
Requirement
2010
Requirement
2020
Requirement
2030
1 Ilir Barat II Tangga Buntung 1 1 1 1
2 Gandus 0 0 1 1
3 Seberang Ulu I 7 Ulu dan Jakabaring 2 1 2 2
4 Kertapati Karya Jaya 1 1 1 1
5 Seberang Ulu II 1 1 1
6 Plaju Plaju 1 1 1 1
7 Ilir Barat I 1 1 2
8 Bukit Kecil 0 1 1
9 Ilir Timur I 1 1 1
10 Kemuning Km. 5 1 1 1 1
11 Ilir Timur II 1 2 2
12 Kalidoni Lemabang 1 1 1 1
13 Sako Multi Wahana 1 1 1 1
14 Sematang
Borang
0 0 0
15 Sukarami 1 1 1
16 Alang-Alang
Lebar
Alang-Alang Lebar 1 1 1 1
Total 9 12 15 18
22
22
II.3.2 Improvement of Public Transportation Services
In order to reform and develop the public transport system, it is necessary to restructure the
route network which is strived to reach the entire region with the lowest possible level of
intermodal transfer. The areas served are potential areas or areas for generating and
attracting trips such as residential areas, tourism areas, offices, trade and service centers
and educational areas.
Routes are divided into two types: main public mass transit routes that serve the main
activity area and through the main roads, and branch routes that serve the supporting
activity area and through collector roads. Main routes are at least served by medium buses
and branch routes with small buses. Feeder public transport routes (feeders), the design is
provided by each related city that is intended to serve the internal movement of settlements
to the path of the branch route, using the microlet mode.
To support the development of public transport and the completeness of its route network,
it is necessary to have supporting facilities, namely facilities for passengers to get on and
off both in relation to the beginning and end of a trip as well as for transfers between service
routes (transfers). Shelter placement is determined based on provisions relating to the
walking distance of passengers where for the CBD area between 200 m-400 m and the
periphery area between 300 m-500 m. The distance between the shelters is also very much
determined by the land use condition of the route trajectory, the denser the area is built, the
closer the shelter distance is set in the distance range above.
The determination of this shelter is not only for the main routes served by buses, but also
for branch and branch routes served by microbuses. This is to provide service certainty for
the community regarding places to obtain services. In terms of shelter development, it is
necessary to first review the land use and traffic conditions, this is to prevent the presence
of shelters. The concept of the development of mass transportation in Palembang City
considers the direction of the spatial structure of the City of Palembang. The development
of mass transit technology choices in the city of Palembang requires criteria to measure the
mass transit routes to be chosen. The criteria used to determine the design of mass transit
routes include the origin of the destination (settlement, shopping areas, business areas,
tourist areas, schools, etc.), data on road conditions, characteristics of the physical
compatibility of mass transit technology structures with the surrounding environment, and
23
23
funding capabilities. The development of mass transit has considered integration between
modes of mass transportation so as to make it easier for users to switch modes to reach
their travel destinations.
II.3.3 Railway Network System
Rail transportation is one of the modes of land transportation which is expected to be an
alternative for residents in carrying out their activities and mobility. Rail transportation can
be used for transporting passengers and goods. The planned development of railroad
transportation in the city of Palembang includes the development of a regional railroad
transportation system (between regions) and an urban railroad transportation system
(within cities). At present, the existing railway network includes:
a) Palembang-Tanjung Karang (Lampung) railroad; and
b) Palembang - Lubuk Linggau train line.
While for the development of inter-regional railroad transportation in Palembang, the
program will be implemented by the central and provincial governments, including:
a) Development of the Indralaya-Tanjung Api-Api International Port Railway. The
construction of this pathway will pass through a small part of the city of Palembang,
namely in the Gandus region, but it will greatly affect the development of the region.
b) Construction of the Palembang-Indralaya double decker railroad to improve services for
commuters, especially students and lecturers of Sriwijaya Indralaya University and
workers who live in Indralaya but work in Palembang, and vice versa.
c) Development of the Palembang-Batung-Sekayu railroad.
d) Development of the Palembang-Betung-Jambi railroad.
e) LRT of Sultan Mahmud Badaruddin II Airport - Ampera-Jakabaring
f) Palembang City Ring Train
II.3.4 Train Station
The plan to develop an urban railway station system (in a city) is aimed at supporting the
performance of the railroad network, including:
a) Improvement and development of the Kertapati Railway Station in Kel. Kertapati.
b) Construction of Karya Jaya multi-mode terminal which will combine road and rail
transportation modes combined with warehousing areas, Karya Jaya industrial area.
24
24
II.3.5 River, Lake and Crossing Transport Network System (ASDP)
In general, the river transportation route network in Palembang City is the Musi River from
upstream to downstream and its tributaries, such as the Ogan River and the Keramasan
River. The rivers pass through piers and shelters on both sides of the riverbanks and also
access to tourist sites along the rivers. In order to improve the quality and quantity of river
transportation services in Palembang City, river transportation development plans include:
a) Development of river transportation as another option that is complementary (integrated)
with commensurate quality. As a city divided by Musi River and its tributaries (Ogan
River, Keramasan River, etc.), river transportation is the forerunner of transportation in
Palembang City. Therefore, to improve the performance of river transportation so that it
is in line with land transportation, river transportation needs to be developed that is not
only an alternative to land transportation.
b) Integrating river transportation and tourism will be able to improve the quality of public
transport services, because tourism services generally have high service requirements.
c) Development of river transportation with a buy the service system, to support the
integration of transportation modes in the city of Palembang.
d) Development of supporting facilities for river transportation such as docks, river gas
stations, shelters.
Provision of river transportation services in the form of ASDP shipping lanes as follows:
a) The cruise route Benteng Kuto Besak (BKB) - Sungai Lais;
b) The shipping route of Benteng Kuto Besak-Tangga Buntung;
c) The shipping route of Benteng Kuto Besak-Jakabaring;
d) The cruise route Benteng Kuto Besak -Multi Moda Karyajaya;
e) Benteng Kuto Besak -Pertamina cruise route;
f) The shipping route of Benteng Kuto Besak - Drought Island;
g) The Jakabaring-Kemarau Island shipping route;
h) The shipping route Benteng Kuto Besak Benteng Kuto Besak -Pulokerto; and
i) BKB-other regional shipping routes
The ups and downs of passengers are only carried out at designated docks and shelters. In
this case the existing docks and shelters are still used to make optimal improvements (the
quality is the same as the quality of shelters / shelters for land transportation). While
25
25
construction of new docks and shelters is carried out to connect the planned river route
network.
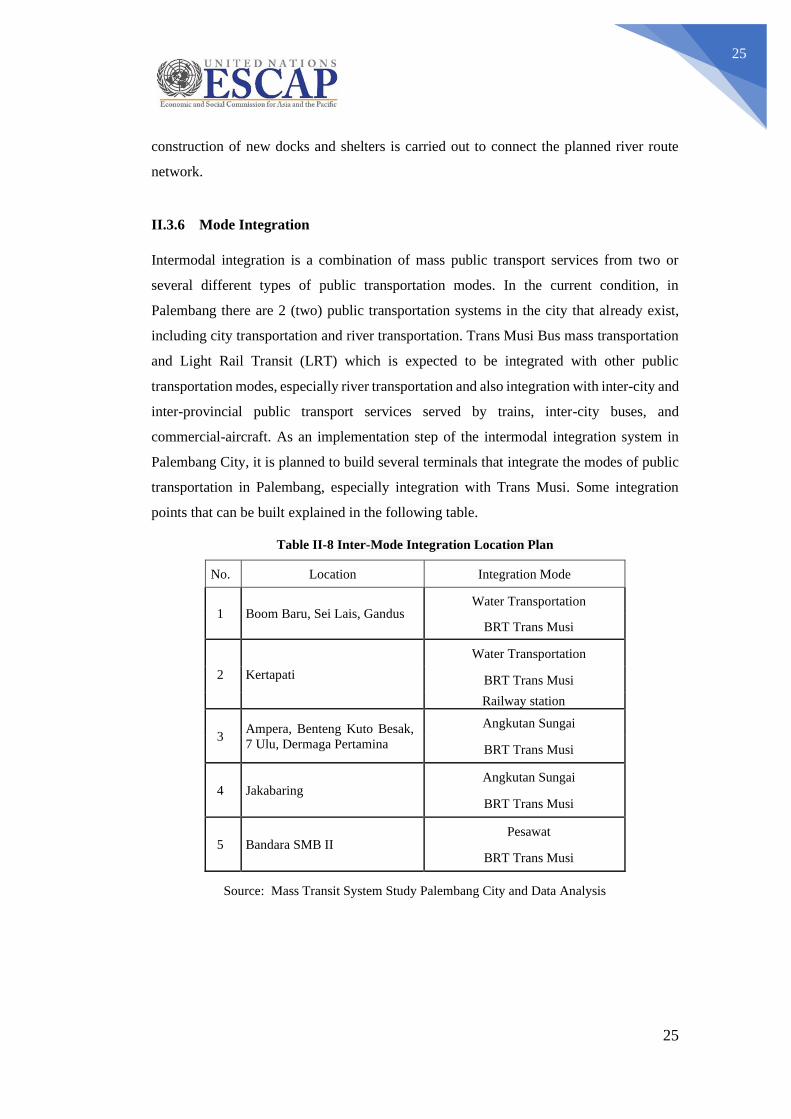
II.3.6 Mode Integration
Intermodal integration is a combination of mass public transport services from two or
several different types of public transportation modes. In the current condition, in
Palembang there are 2 (two) public transportation systems in the city that already exist,
including city transportation and river transportation. Trans Musi Bus mass transportation
and Light Rail Transit (LRT) which is expected to be integrated with other public
transportation modes, especially river transportation and also integration with inter-city and
inter-provincial public transport services served by trains, inter-city buses, and
commercial-aircraft. As an implementation step of the intermodal integration system in
Palembang City, it is planned to build several terminals that integrate the modes of public
transportation in Palembang, especially integration with Trans Musi. Some integration
points that can be built explained in the following table.
Table II-8 Inter-Mode Integration Location Plan
No. Location Integration Mode
1 Boom Baru, Sei Lais, Gandus Water Transportation
BRT Trans Musi
2 Kertapati
Water Transportation
BRT Trans Musi
Railway station
3 Ampera, Benteng Kuto Besak,
7 Ulu, Dermaga Pertamina
Angkutan Sungai
BRT Trans Musi
4 Jakabaring Angkutan Sungai
BRT Trans Musi
5 Bandara SMB II Pesawat
BRT Trans Musi
Source: Mass Transit System Study Palembang City and Data Analysis
26
26
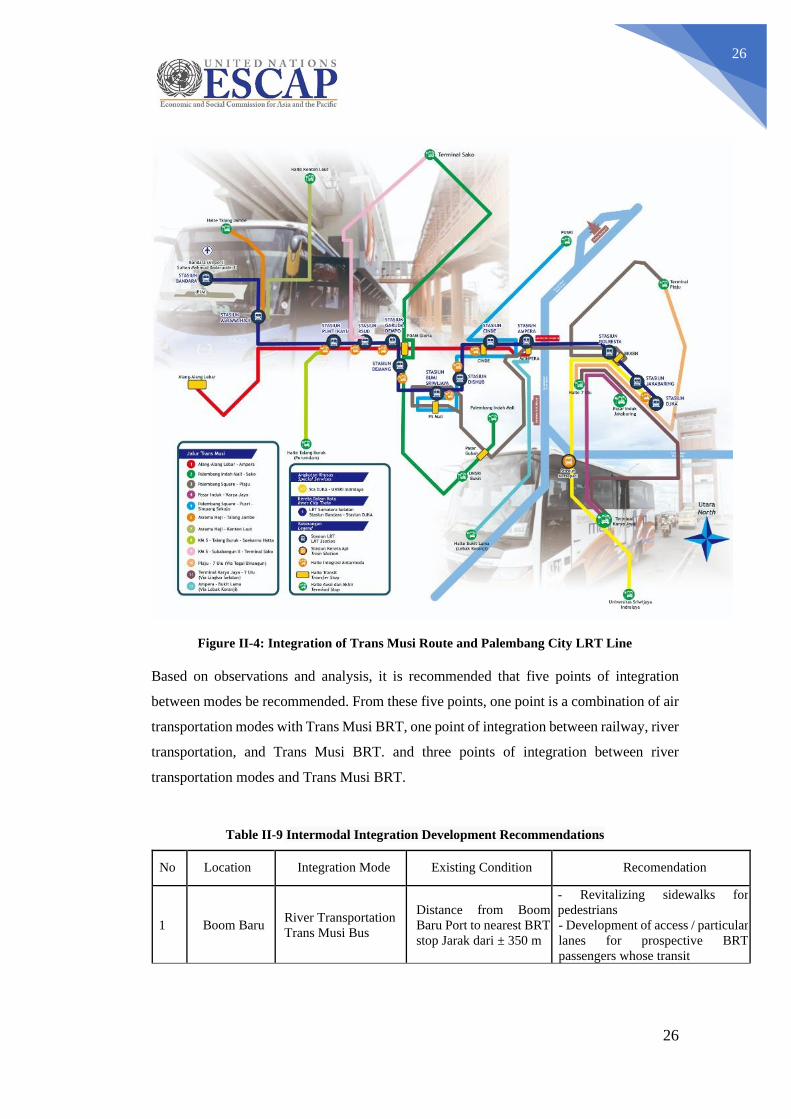
Figure II-4: Integration of Trans Musi Route and Palembang City LRT Line
Based on observations and analysis, it is recommended that five points of integration
between modes be recommended. From these five points, one point is a combination of air
transportation modes with Trans Musi BRT, one point of integration between railway, river
transportation, and Trans Musi BRT. and three points of integration between river
transportation modes and Trans Musi BRT.
Table II-9 Intermodal Integration Development Recommendations
No Location Integration Mode Existing Condition Recomendation
1 Boom Baru River Transportation
Trans Musi Bus
Distance from Boom
Baru Port to nearest BRT
stop Jarak dari ± 350 m
- Revitalizing sidewalks for
pedestrians
- Development of access / particular
lanes for prospective BRT
passengers whose transit
27
27
No Location Integration Mode Existing Condition Recomendation
2 Kertapati River Transportation
Trans Musi Bus
Train Station
Existing Port (Ki
Merogan) located too far
from BRT stop or station
plan
- Port transfer to Kertapati Bridge
direction, approaching station
- Development of particular access
from train station to BRT stop
3 Ampera River Transportation
Trans Musi Bus
Distance from Port to
Jakabaring
Terminal/BRT stop ±600
m
- Require feeder mode like taxibike
or taxi
4 Jakabaring River Transportation
Trans Musi Bus
Distance from Port to
Jakabaring
Terminal/BRT stop ±950
m
- Require feeder mode like taxibike
or taxi
5 Bandara SMB
II
Airplane
Trans Musi Bus
-Land transportation
mode that support this
airport is only taxi
-Airport distance to
public transport lane is
too far
- Develop BRT stop near airport
terminal
- Develop particular access from
airport to BRT stop
Source: Mass Transit System Study Palembang City, 2009
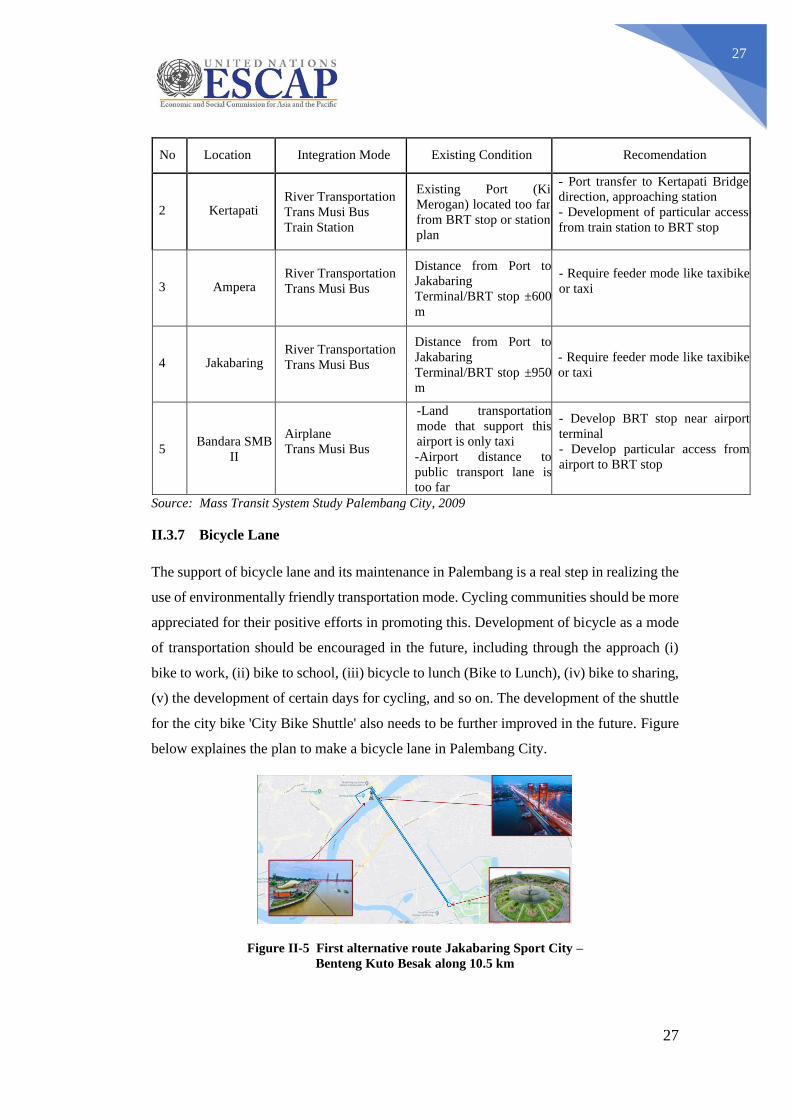
II.3.7 Bicycle Lane
The support of bicycle lane and its maintenance in Palembang is a real step in realizing the
use of environmentally friendly transportation mode. Cycling communities should be more
appreciated for their positive efforts in promoting this. Development of bicycle as a mode
of transportation should be encouraged in the future, including through the approach (i)
bike to work, (ii) bike to school, (iii) bicycle to lunch (Bike to Lunch), (iv) bike to sharing,
(v) the development of certain days for cycling, and so on. The development of the shuttle
for the city bike 'City Bike Shuttle' also needs to be further improved in the future. Figure
below explaines the plan to make a bicycle lane in Palembang City.
Figure II-5 First alternative route Jakabaring Sport City –
Benteng Kuto Besak along 10.5 km
28
28
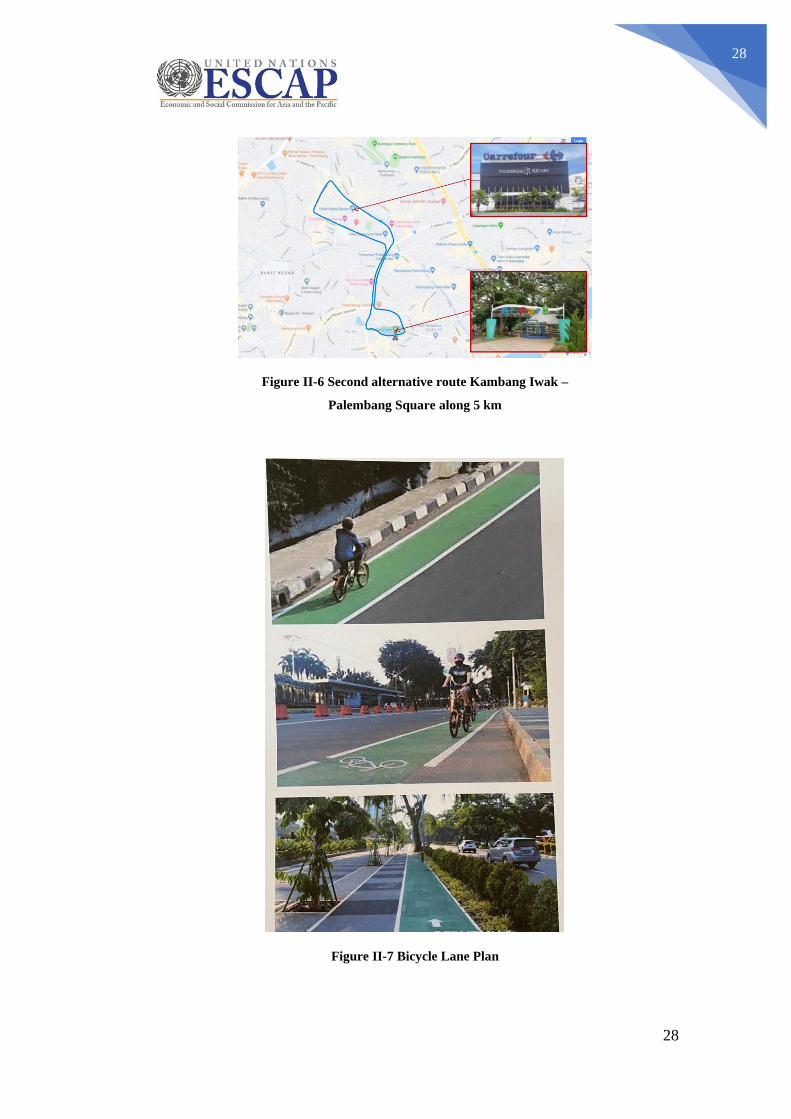
Figure II-6 Second alternative route Kambang Iwak –
Palembang Square along 5 km
Figure II-7 Bicycle Lane Plan
29
29
II.4 Transit Oriented Development
Transit-Oriented Development or hereinafter abbreviated as TOD, is the concept of
regional development around the transit node so that added value focuses on the integration
between mass public transport networks, and between mass public transport networks and
non-motorized modes of transportation networks, reduced use motorized vehicles that are
accompanied by the development of mixed, dense areas, have moderate to high spatial
utilization intensity.
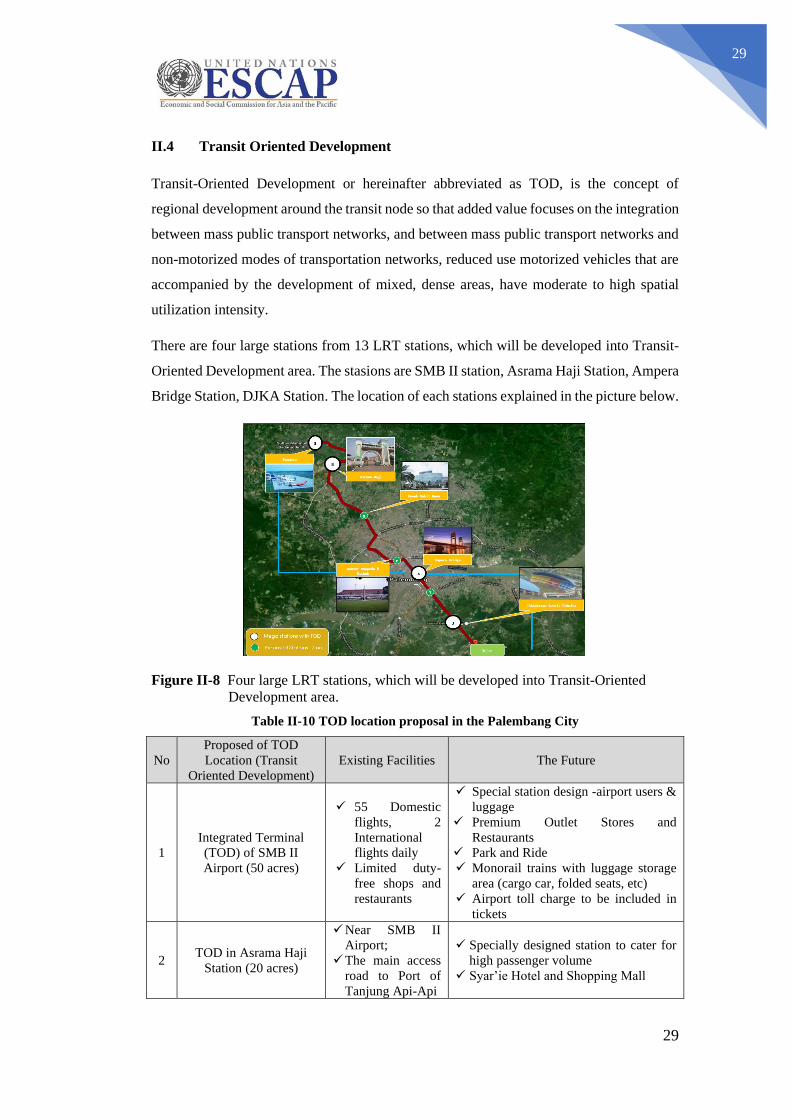
There are four large stations from 13 LRT stations, which will be developed into Transit-
Oriented Development area. The stasions are SMB II station, Asrama Haji Station, Ampera
Bridge Station, DJKA Station. The location of each stations explained in the picture below.
Figure II-8 Four large LRT stations, which will be developed into Transit-Oriented
Development area.
Table II-10 TOD location proposal in the Palembang City
No
Proposed of TOD
Location (Transit
Oriented Development)
Existing Facilities The Future
1
Integrated Terminal
(TOD) of SMB II
Airport (50 acres)
✓ 55 Domestic
flights, 2
International
flights daily
✓ Limited duty-
free shops and
restaurants
✓ Special station design -airport users &
luggage
✓ Premium Outlet Stores and
Restaurants
✓ Park and Ride
✓ Monorail trains with luggage storage
area (cargo car, folded seats, etc)
✓ Airport toll charge to be included in
tickets
2 TOD in Asrama Haji
Station (20 acres)
✓ Near SMB II
Airport;
✓ The main access
road to Port of
Tanjung Api-Api
✓ Specially designed station to cater for
high passenger volume
✓ Syar’ie Hotel and Shopping Mall
30
30
No
Proposed of TOD
Location (Transit
Oriented Development)
Existing Facilities The Future
✓ Near settlements
✓ Pilgrim
Dormitory
✓ Public Transport Hub (Passengers from
KM12 Bus Terminal, Taxis, Feeder
Bus)
✓ Park and Ride Facilities
3 TOD in Ampera Bridge
(8 acres)
✓ Local Water
Transportation
✓ Market and
Bazaar
✓ Riverside
attractions,
restaurants,
historical
monument (
Benteng Kota
✓ River cruise
✓ Shopping Mall
✓ High rise commercial and residential
buildings
✓ “Eye of Palembang” – Ferris wheel
✓ Revival and refurbishment of
Ampera Bridge
4 TOD in Jakabaring
Sports City (50 acres
✓ Stadium and
Sports facilities
✓ Small shopping
centre
✓ Convention Centre
✓ Shopping Malls
✓ Multi-Storey Park and Ride
✓ Apartments/ Condominiums
✓ Medical Centre
Source: TOD analysis in LRT stations in Palembang City, 2019
II.5 Road and Railway -based transportation
II.5.1 Trans Musi
The purpose of developing Trans Musi Bus is the creation of urban public transport that is
safe, convenient, easy, on time, affordable tariff with excellent service standards. The
condition of Trans Musi Bus is still not satisfactory for the community so the level of use
is far less than the use of motorcycles. From the result of survey analysis of consultant team
and data from Dinas Perhubungan Kota Palembang, it is seen that the average load factor
for each corridor per day is 23% with the average amount of passanger for each corridor
per day is 1338 people.
Currently there are more than 100 Trans Musi cars ready to operate. If based on the
subsidies of City Government of 80's (ready to operate). There are several reasons the bus
is not operating in 2020 this year. Firstly, due to the spread of the COVID-19 pandemic,
the community activity was reduced drastically from before. Until recently 30 units of
buses were operated. In other words, Trans Musi has not given significant advantages from
the operational side. Secondly, the city of Palembang is currently gaining additional new
fleet similar to Trans Musi, but managed by a different company, namely PT TMPJ to run
31
31
a grant of Ministry of Transportation. PT TMPJ is subsidiary of PT SP2J which was
deliberately formed to receive grants from the Ministry of Transportation. “Teman Bus”
program is the program of Ministry, managed by PT TMPJ to fill the empty corridor.
Hopefully after the pandemic COVID-19, along with the activities of the community so
that Trans Musi can be alternative mode of public transport. Curently, there are 45 units of
“Teman Bus” and Trans Musi 30 units. If the condition has normal there will be 80 buses
again that will operate in Palembang. From the data compiled, the total budget of 2019
issued by PT SP2J for Trans Musi amounted to Rp 4.83 billion, includes, cost of purchase
of sparepart Rp 2.621 billion, oil purchase cost Rp 214 million, washing BRT Rp 549
million, overhaule Rp 76 million, BRT equipment cost Rp 44 million, BRT cost of
retreading Rp 110 million, mechanical equipment Rp 56 million, and tire BRT fee of Rp
1.84 billion.
At least there are 200 Trans Musi stops are in damaged condition. Even some of them are
quite a few. There are a Total of 254 bus stops and several bus stops built by private. Some
of the visible damage from these bus stops are from damaged paints and the condition no
longer feasible to be used. This condition is an impact on the comfort of people and public
transport users in the city of Palembang. Constraints are currently faced by Palembang
Department of Transportation, is the lack of budget maintenance so it is not maximal. For
the improvement of one bus stop is Rp 30 million. While in one year, there was only a
budget of Rp 100 million. For that, the fore will run two options in the repair of this stop.
It is using CSR or through third parties with a system of cooperation.
The development of Trans Musi Bus is to become a Bus Rapid Transit (BRT), it can be in
the form of a Bus that uses a special lane that is separate from other lanes (Busway). BRT
is a bus system that is fast, convenient, safe and timely in terms of infrastructure, vehicles
and schedules. Use the bus to serve service of better quality than other bus services. Each
BRT system must use a different improvised system, although the improvised sharing with
other BRT systems. The results of the system dart were to approach the rail transit if they
still enjoyed bus safety and fare. Countries that use BRT in North America, in Europe and
Australia are called busway and the name is also used in Indonesia, while other countries
call it quality bus or easy bus service when reaching high quality. Bus rapid transit uses
some of the names of rapid transit which describe high-capacity rail transportation or we
32
32
can call it right-of-way. Rapid transit trains use underground tunnels, and typical long-
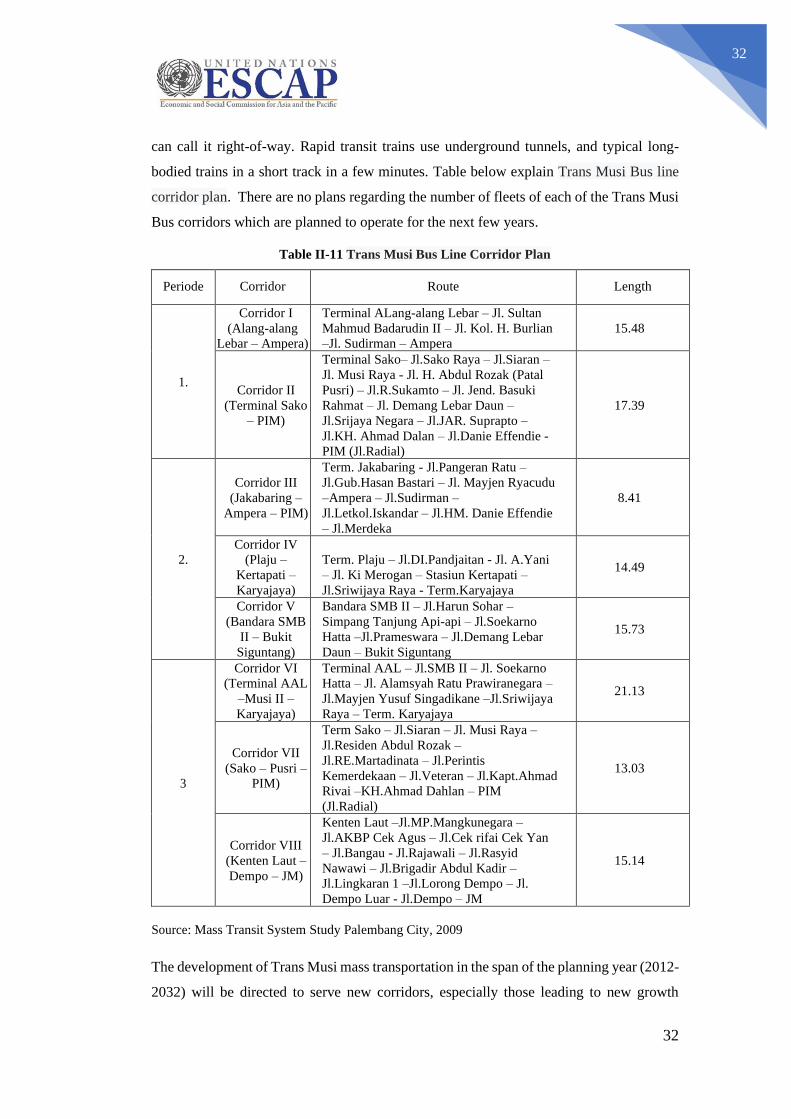
bodied trains in a short track in a few minutes. Table below explain Trans Musi Bus line
corridor plan. There are no plans regarding the number of fleets of each of the Trans Musi
Bus corridors which are planned to operate for the next few years.
Table II-11 Trans Musi Bus Line Corridor Plan
Periode Corridor Route Length
1.
Corridor I
(Alang-alang
Lebar – Ampera)
Terminal ALang-alang Lebar – Jl. Sultan
Mahmud Badarudin II – Jl. Kol. H. Burlian
–Jl. Sudirman – Ampera
15.48
Corridor II
(Terminal Sako
– PIM)
Terminal Sako– Jl.Sako Raya – Jl.Siaran –
Jl. Musi Raya - Jl. H. Abdul Rozak (Patal
Pusri) – Jl.R.Sukamto – Jl. Jend. Basuki
Rahmat – Jl. Demang Lebar Daun –
Jl.Srijaya Negara – Jl.JAR. Suprapto –
Jl.KH. Ahmad Dalan – Jl.Danie Effendie -
PIM (Jl.Radial)
17.39
2.
Corridor III
(Jakabaring –
Ampera – PIM)
Term. Jakabaring - Jl.Pangeran Ratu –
Jl.Gub.Hasan Bastari – Jl. Mayjen Ryacudu
–Ampera – Jl.Sudirman –
Jl.Letkol.Iskandar – Jl.HM. Danie Effendie
– Jl.Merdeka
8.41
Corridor IV
(Plaju –
Kertapati –
Karyajaya)
Term. Plaju – Jl.DI.Pandjaitan - Jl. A.Yani
– Jl. Ki Merogan – Stasiun Kertapati –
Jl.Sriwijaya Raya - Term.Karyajaya
14.49
Corridor V
(Bandara SMB
II – Bukit
Siguntang)
Bandara SMB II – Jl.Harun Sohar –
Simpang Tanjung Api-api – Jl.Soekarno
Hatta –Jl.Prameswara – Jl.Demang Lebar
Daun – Bukit Siguntang
15.73
3
Corridor VI
(Terminal AAL
–Musi II –
Karyajaya)
Terminal AAL – Jl.SMB II – Jl. Soekarno
Hatta – Jl. Alamsyah Ratu Prawiranegara –
Jl.Mayjen Yusuf Singadikane –Jl.Sriwijaya
Raya – Term. Karyajaya
21.13
Corridor VII
(Sako – Pusri –
PIM)
Term Sako – Jl.Siaran – Jl. Musi Raya –
Jl.Residen Abdul Rozak –
Jl.RE.Martadinata – Jl.Perintis
Kemerdekaan – Jl.Veteran – Jl.Kapt.Ahmad
Rivai –KH.Ahmad Dahlan – PIM
(Jl.Radial)
13.03
Corridor VIII
(Kenten Laut –
Dempo – JM)
Kenten Laut –Jl.MP.Mangkunegara –
Jl.AKBP Cek Agus – Jl.Cek rifai Cek Yan
– Jl.Bangau - Jl.Rajawali – Jl.Rasyid
Nawawi – Jl.Brigadir Abdul Kadir –
Jl.Lingkaran 1 –Jl.Lorong Dempo – Jl.
Dempo Luar - Jl.Dempo – JM
15.14
Source: Mass Transit System Study Palembang City, 2009
The development of Trans Musi mass transportation in the span of the planning year (2012-
2032) will be directed to serve new corridors, especially those leading to new growth
33
33
centers and through Musi III to Musi Bridge VI. At least there are at least 5 additional
corridors to support the movement of the population within this period. Until this report
was compiled, there had been the addition of one Trans Musi corridor, namely Sako-PIM,
as many as 19 units. The total number of fleets currently operating is 73 units, consisting
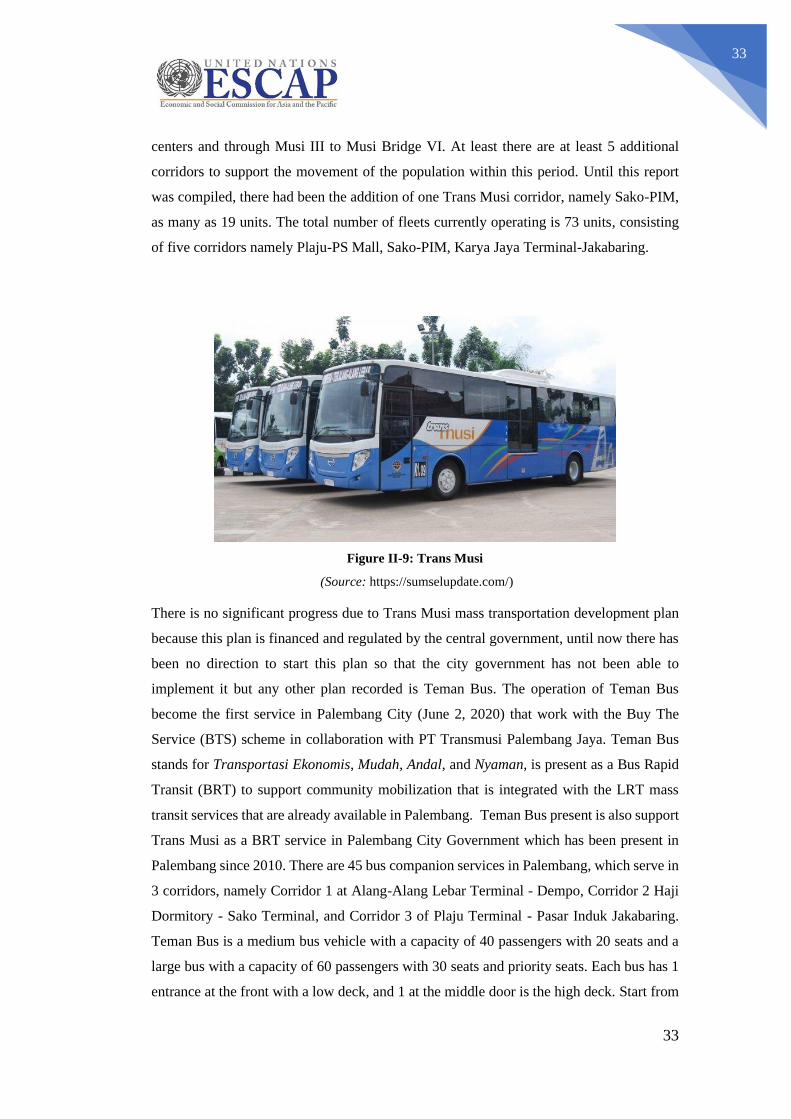
of five corridors namely Plaju-PS Mall, Sako-PIM, Karya Jaya Terminal-Jakabaring.
Figure II-9: Trans Musi
(Source: https://sumselupdate.com/)
There is no significant progress due to Trans Musi mass transportation development plan
because this plan is financed and regulated by the central government, until now there has
been no direction to start this plan so that the city government has not been able to
implement it but any other plan recorded is Teman Bus. The operation of Teman Bus
become the first service in Palembang City (June 2, 2020) that work with the Buy The
Service (BTS) scheme in collaboration with PT Transmusi Palembang Jaya. Teman Bus
stands for Transportasi Ekonomis, Mudah, Andal, and Nyaman, is present as a Bus Rapid
Transit (BRT) to support community mobilization that is integrated with the LRT mass
transit services that are already available in Palembang. Teman Bus present is also support
Trans Musi as a BRT service in Palembang City Government which has been present in
Palembang since 2010. There are 45 bus companion services in Palembang, which serve in
3 corridors, namely Corridor 1 at Alang-Alang Lebar Terminal - Dempo, Corridor 2 Haji
Dormitory - Sako Terminal, and Corridor 3 of Plaju Terminal - Pasar Induk Jakabaring.
Teman Bus is a medium bus vehicle with a capacity of 40 passengers with 20 seats and a
large bus with a capacity of 60 passengers with 30 seats and priority seats. Each bus has 1
entrance at the front with a low deck, and 1 at the middle door is the high deck. Start from
34
34
official announcement for Teman Bus operation until unspecified time, people who use
Teman Bus are free of charge. The government provides a full subsidy for the operational
costs of services carried out by operators with predetermined service standards. This
service standard is the reference for operator services for better service to the community,
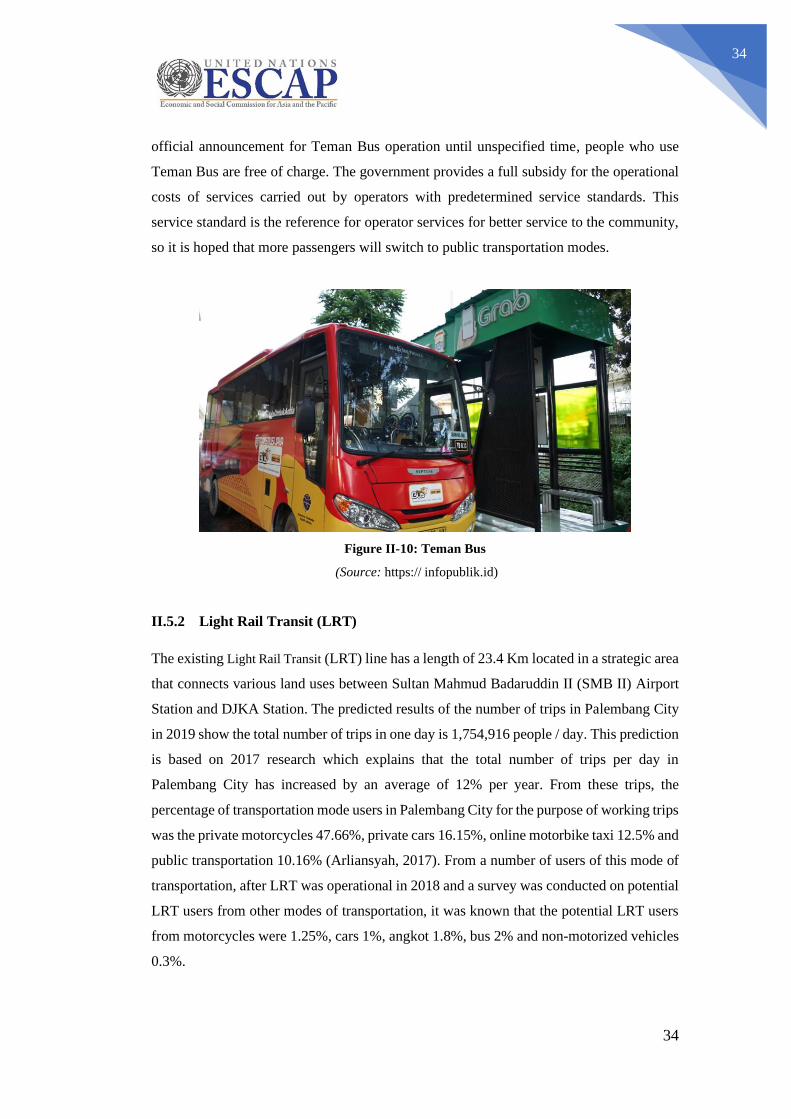
so it is hoped that more passengers will switch to public transportation modes.
Figure II-10: Teman Bus
(Source: https:// infopublik.id)
II.5.2 Light Rail Transit (LRT)
The existing Light Rail Transit (LRT) line has a length of 23.4 Km located in a strategic area
that connects various land uses between Sultan Mahmud Badaruddin II (SMB II) Airport
Station and DJKA Station. The predicted results of the number of trips in Palembang City
in 2019 show the total number of trips in one day is 1,754,916 people / day. This prediction
is based on 2017 research which explains that the total number of trips per day in
Palembang City has increased by an average of 12% per year. From these trips, the
percentage of transportation mode users in Palembang City for the purpose of working trips
was the private motorcycles 47.66%, private cars 16.15%, online motorbike taxi 12.5% and
public transportation 10.16% (Arliansyah, 2017). From a number of users of this mode of
transportation, after LRT was operational in 2018 and a survey was conducted on potential
LRT users from other modes of transportation, it was known that the potential LRT users
from motorcycles were 1.25%, cars 1%, angkot 1.8%, bus 2% and non-motorized vehicles
0.3%.
35
35
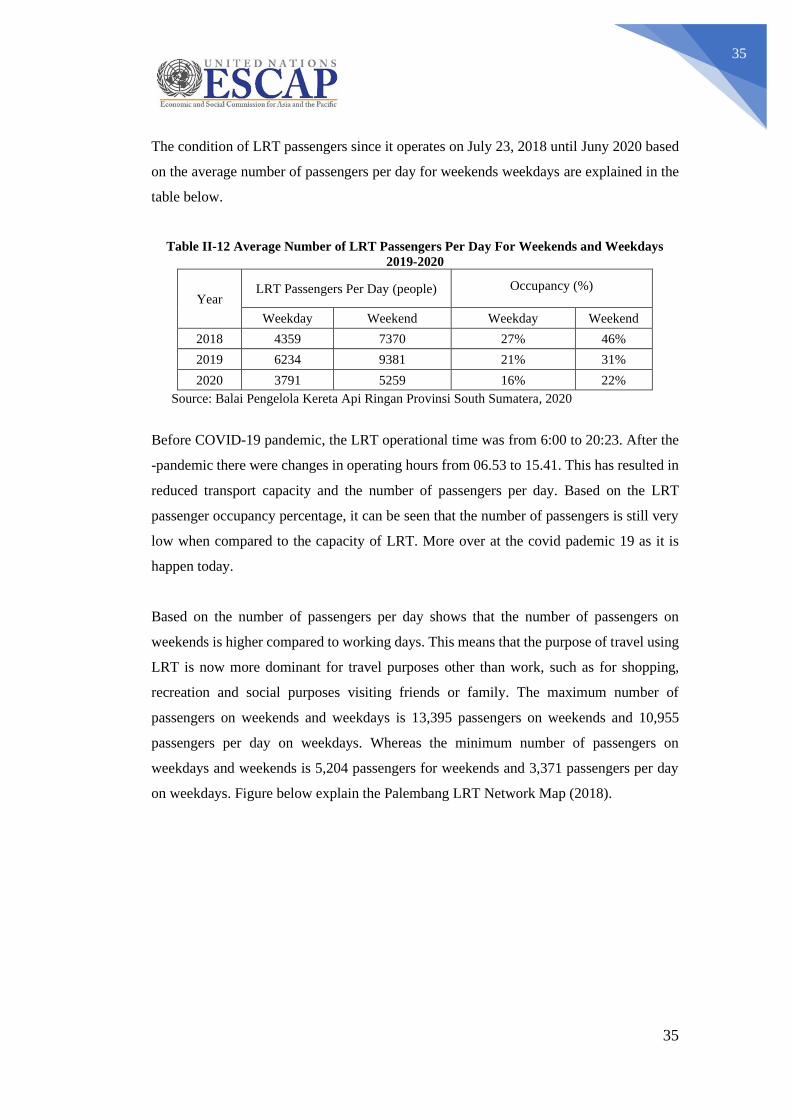
The condition of LRT passengers since it operates on July 23, 2018 until Juny 2020 based
on the average number of passengers per day for weekends weekdays are explained in the
table below.
Table II-12 Average Number of LRT Passengers Per Day For Weekends and Weekdays
2019-2020
Year LRT Passengers Per Day (people) Occupancy (%)
Weekday Weekend Weekday Weekend
2018 4359 7370 27% 46%
2019 6234 9381 21% 31%
2020 3791 5259 16% 22%
Source: Balai Pengelola Kereta Api Ringan Provinsi South Sumatera, 2020
Before COVID-19 pandemic, the LRT operational time was from 6:00 to 20:23. After the
-pandemic there were changes in operating hours from 06.53 to 15.41. This has resulted in
reduced transport capacity and the number of passengers per day. Based on the LRT
passenger occupancy percentage, it can be seen that the number of passengers is still very
low when compared to the capacity of LRT. More over at the covid pademic 19 as it is
happen today.
Based on the number of passengers per day shows that the number of passengers on
weekends is higher compared to working days. This means that the purpose of travel using
LRT is now more dominant for travel purposes other than work, such as for shopping,
recreation and social purposes visiting friends or family. The maximum number of
passengers on weekends and weekdays is 13,395 passengers on weekends and 10,955
passengers per day on weekdays. Whereas the minimum number of passengers on
weekdays and weekends is 5,204 passengers for weekends and 3,371 passengers per day
on weekdays. Figure below explain the Palembang LRT Network Map (2018).
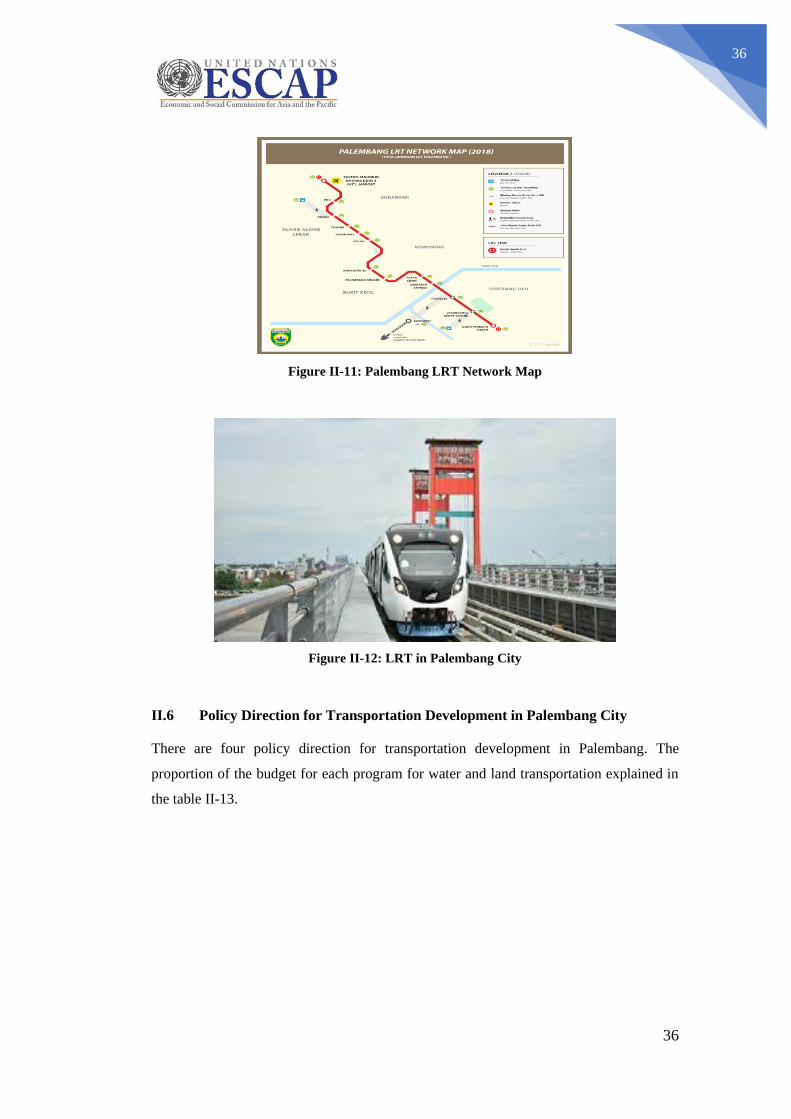
36
36
Figure II-11: Palembang LRT Network Map
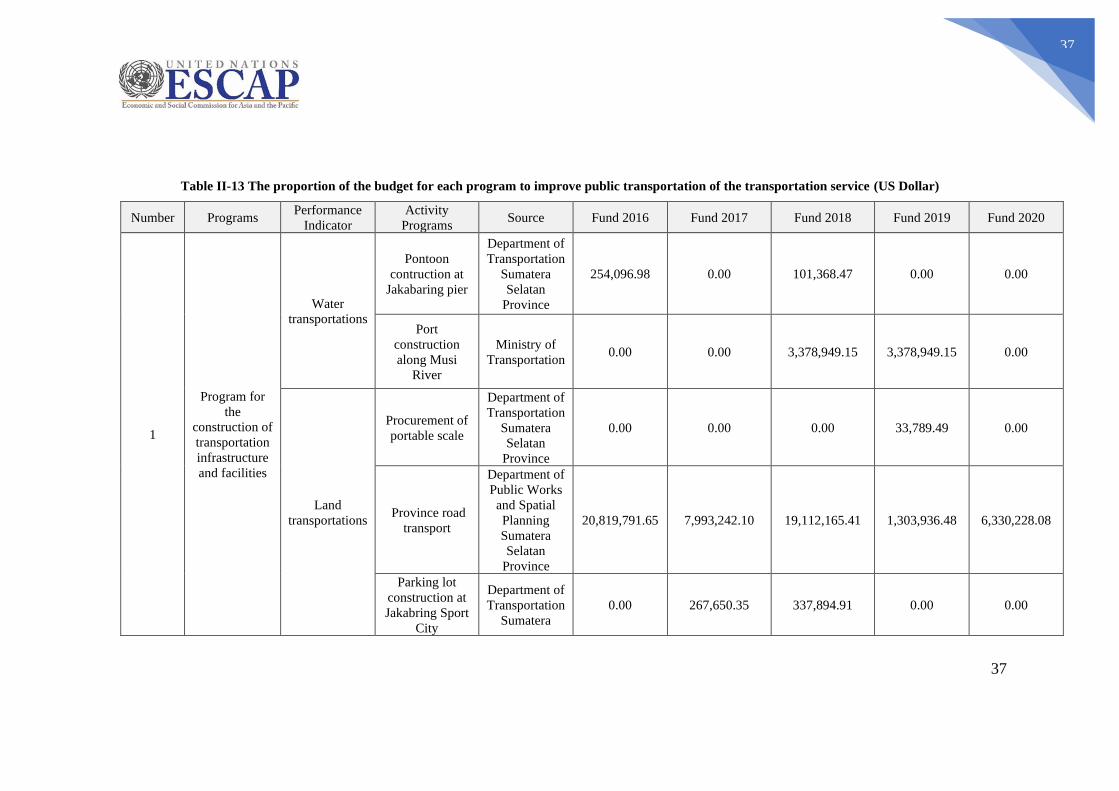
Figure II-12: LRT in Palembang City
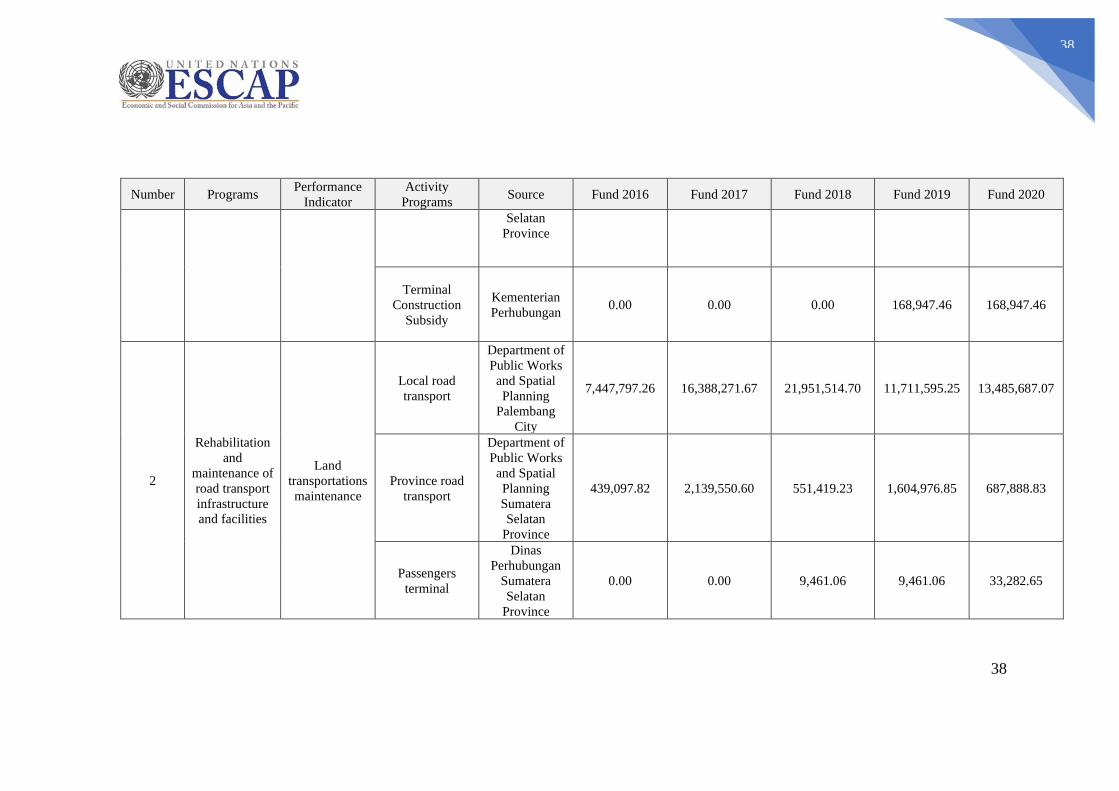
II.6 Policy Direction for Transportation Development in Palembang City
There are four policy direction for transportation development in Palembang. The
proportion of the budget for each program for water and land transportation explained in
the table II-13.
37
37
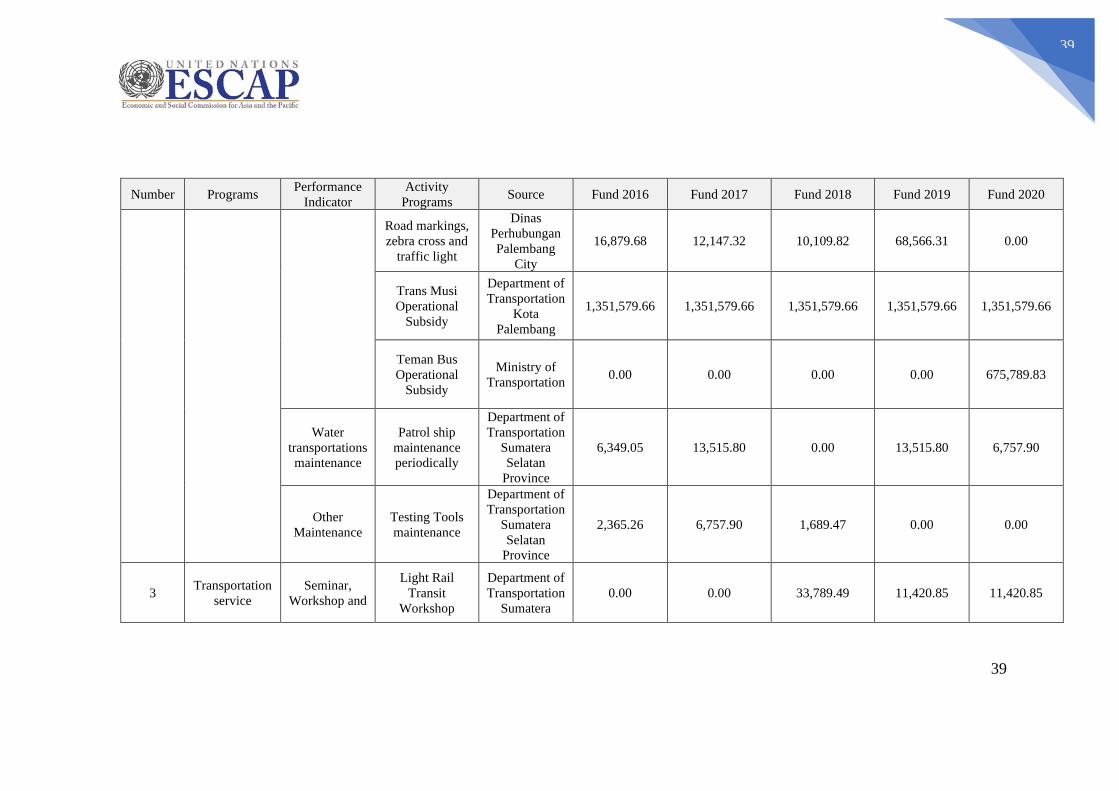
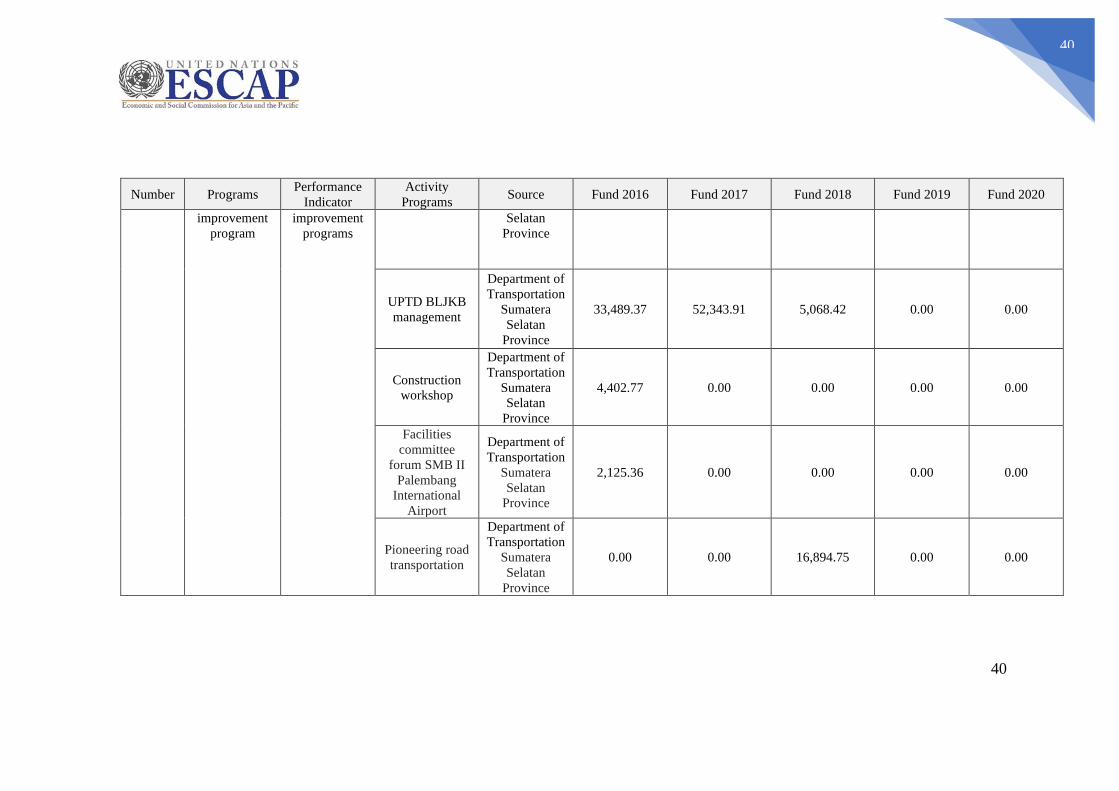
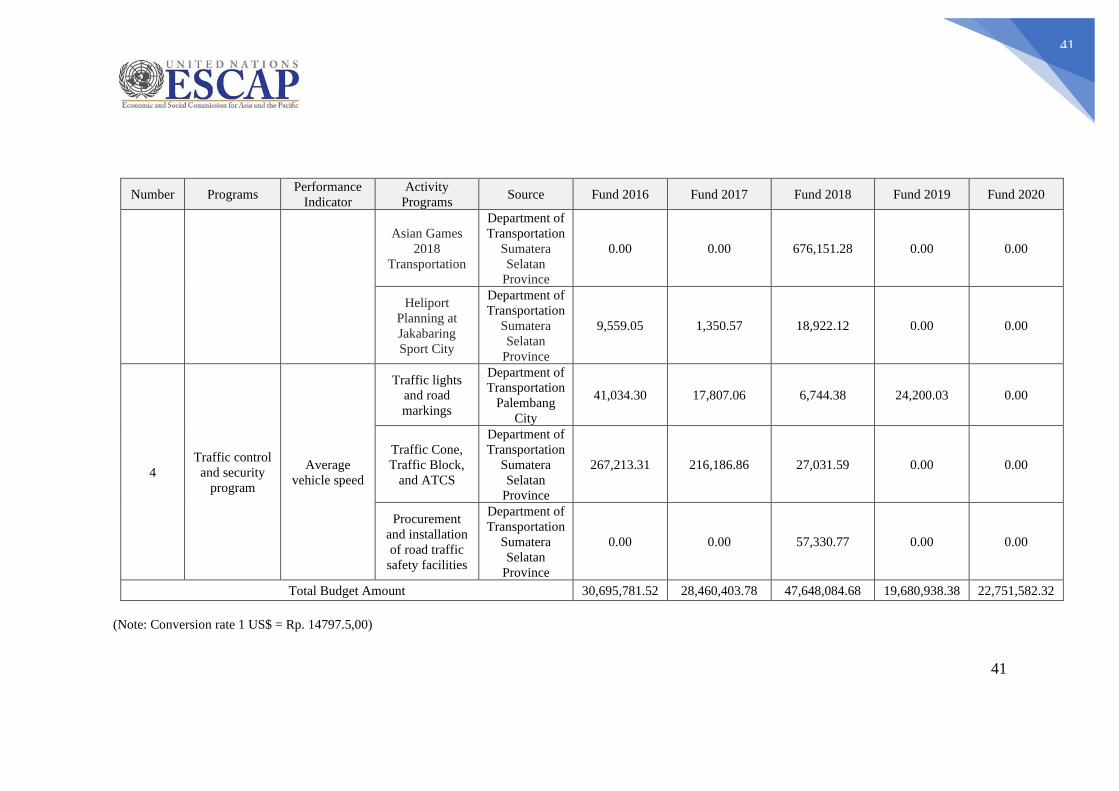
Table II-13 The proportion of the budget for each program to improve public transportation of the transportation service (US Dollar)
Number Programs Performance
Indicator
Activity
Programs Source Fund 2016 Fund 2017 Fund 2018 Fund 2019 Fund 2020
1
Program for
the
construction of
transportation
infrastructure
and facilities
Water
transportations
Pontoon
contruction at
Jakabaring pier
Department of
Transportation
Sumatera
Selatan
Province
254,096.98 0.00 101,368.47 0.00 0.00
Port
construction
along Musi
River
Ministry of
Transportation 0.00 0.00 3,378,949.15 3,378,949.15 0.00
Land
transportations
Procurement of
portable scale
Department of
Transportation
Sumatera
Selatan
Province
0.00 0.00 0.00 33,789.49 0.00
Province road
transport
Department of
Public Works
and Spatial
Planning
Sumatera
Selatan
Province
20,819,791.65 7,993,242.10 19,112,165.41 1,303,936.48 6,330,228.08
Parking lot
construction at
Jakabring Sport
City
Department of
Transportation
Sumatera
0.00 267,650.35 337,894.91 0.00 0.00
38
38
Number Programs Performance
Indicator
Activity
Programs Source Fund 2016 Fund 2017 Fund 2018 Fund 2019 Fund 2020
Selatan
Province
Terminal
Construction
Subsidy
Kementerian
Perhubungan 0.00 0.00 0.00 168,947.46 168,947.46
2
Rehabilitation
and
maintenance of
road transport
infrastructure
and facilities
Land
transportations
maintenance
Local road
transport
Department of
Public Works
and Spatial
Planning
Palembang
City
7,447,797.26 16,388,271.67 21,951,514.70 11,711,595.25 13,485,687.07
Province road
transport
Department of
Public Works
and Spatial
Planning
Sumatera
Selatan
Province
439,097.82 2,139,550.60 551,419.23 1,604,976.85 687,888.83
Passengers
terminal
Dinas
Perhubungan
Sumatera
Selatan
Province
0.00 0.00 9,461.06 9,461.06 33,282.65
39
39
Number Programs Performance
Indicator
Activity
Programs Source Fund 2016 Fund 2017 Fund 2018 Fund 2019 Fund 2020
Road markings,
zebra cross and
traffic light
Dinas
Perhubungan
Palembang
City
16,879.68 12,147.32 10,109.82 68,566.31 0.00
Trans Musi
Operational
Subsidy
Department of
Transportation
Kota
Palembang
1,351,579.66 1,351,579.66 1,351,579.66 1,351,579.66 1,351,579.66
Teman Bus
Operational
Subsidy
Ministry of
Transportation 0.00 0.00 0.00 0.00 675,789.83
Water
transportations
maintenance
Patrol ship
maintenance
periodically
Department of
Transportation
Sumatera
Selatan
Province
6,349.05 13,515.80 0.00 13,515.80 6,757.90
Other
Maintenance
Testing Tools
maintenance
Department of
Transportation
Sumatera
Selatan
Province
2,365.26 6,757.90 1,689.47 0.00 0.00
3 Transportation
service
Seminar,
Workshop and
Light Rail
Transit
Workshop
Department of
Transportation
Sumatera
0.00 0.00 33,789.49 11,420.85 11,420.85
40
40
Number Programs Performance
Indicator
Activity
Programs Source Fund 2016 Fund 2017 Fund 2018 Fund 2019 Fund 2020
improvement
program
improvement
programs
Selatan
Province
UPTD BLJKB
management
Department of
Transportation
Sumatera
Selatan
Province
33,489.37 52,343.91 5,068.42 0.00 0.00
Construction
workshop
Department of
Transportation
Sumatera
Selatan
Province
4,402.77 0.00 0.00 0.00 0.00
Facilities
committee
forum SMB II
Palembang
International
Airport
Department of
Transportation
Sumatera
Selatan
Province
2,125.36 0.00 0.00 0.00 0.00
Pioneering road
transportation
Department of
Transportation
Sumatera
Selatan
Province
0.00 0.00 16,894.75 0.00 0.00
41
41
Number Programs Performance
Indicator
Activity
Programs Source Fund 2016 Fund 2017 Fund 2018 Fund 2019 Fund 2020
Asian Games
2018
Transportation
Department of
Transportation
Sumatera
Selatan
Province
0.00 0.00 676,151.28 0.00 0.00
Heliport
Planning at
Jakabaring
Sport City
Department of
Transportation
Sumatera
Selatan
Province
9,559.05 1,350.57 18,922.12 0.00 0.00
4
Traffic control
and security
program
Average
vehicle speed
Traffic lights
and road
markings
Department of
Transportation
Palembang
City
41,034.30 17,807.06 6,744.38 24,200.03 0.00
Traffic Cone,
Traffic Block,
and ATCS
Department of
Transportation
Sumatera
Selatan
Province
267,213.31 216,186.86 27,031.59 0.00 0.00
Procurement
and installation
of road traffic
safety facilities
Department of
Transportation
Sumatera
Selatan
Province
0.00 0.00 57,330.77 0.00 0.00
Total Budget Amount 30,695,781.52 28,460,403.78 47,648,084.68 19,680,938.38 22,751,582.32
(Note: Conversion rate 1 US$ = Rp. 14797.5,00)
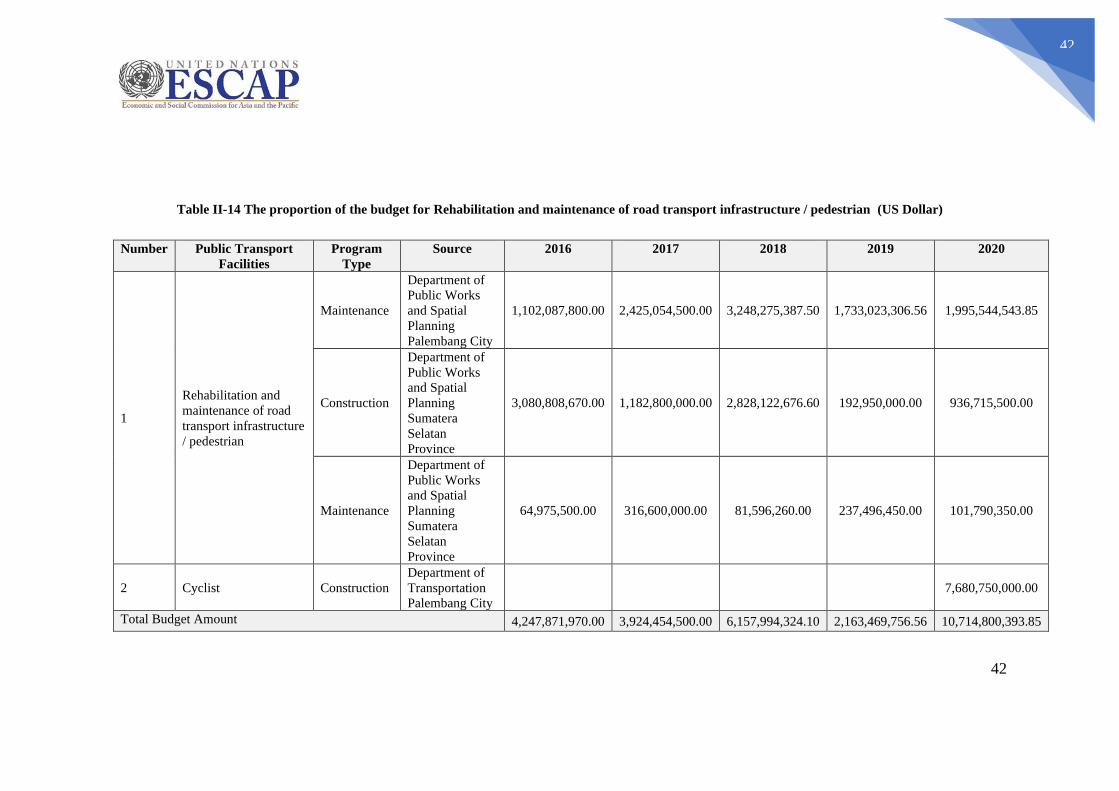
42
42
Table II-14 The proportion of the budget for Rehabilitation and maintenance of road transport infrastructure / pedestrian (US Dollar)
Number Public Transport
Facilities
Program
Type
Source 2016 2017 2018 2019 2020
1
Rehabilitation and
maintenance of road
transport infrastructure
/ pedestrian
Maintenance
Department of
Public Works
and Spatial
Planning
Palembang City
1,102,087,800.00 2,425,054,500.00 3,248,275,387.50 1,733,023,306.56 1,995,544,543.85
Construction
Department of
Public Works
and Spatial
Planning
Sumatera
Selatan
Province
3,080,808,670.00 1,182,800,000.00 2,828,122,676.60 192,950,000.00 936,715,500.00
Maintenance
Department of
Public Works
and Spatial
Planning
Sumatera
Selatan
Province
64,975,500.00 316,600,000.00 81,596,260.00 237,496,450.00 101,790,350.00
2 Cyclist Construction
Department of
Transportation
Palembang City
7,680,750,000.00
Total Budget Amount 4,247,871,970.00 3,924,454,500.00 6,157,994,324.10 2,163,469,756.56 10,714,800,393.85
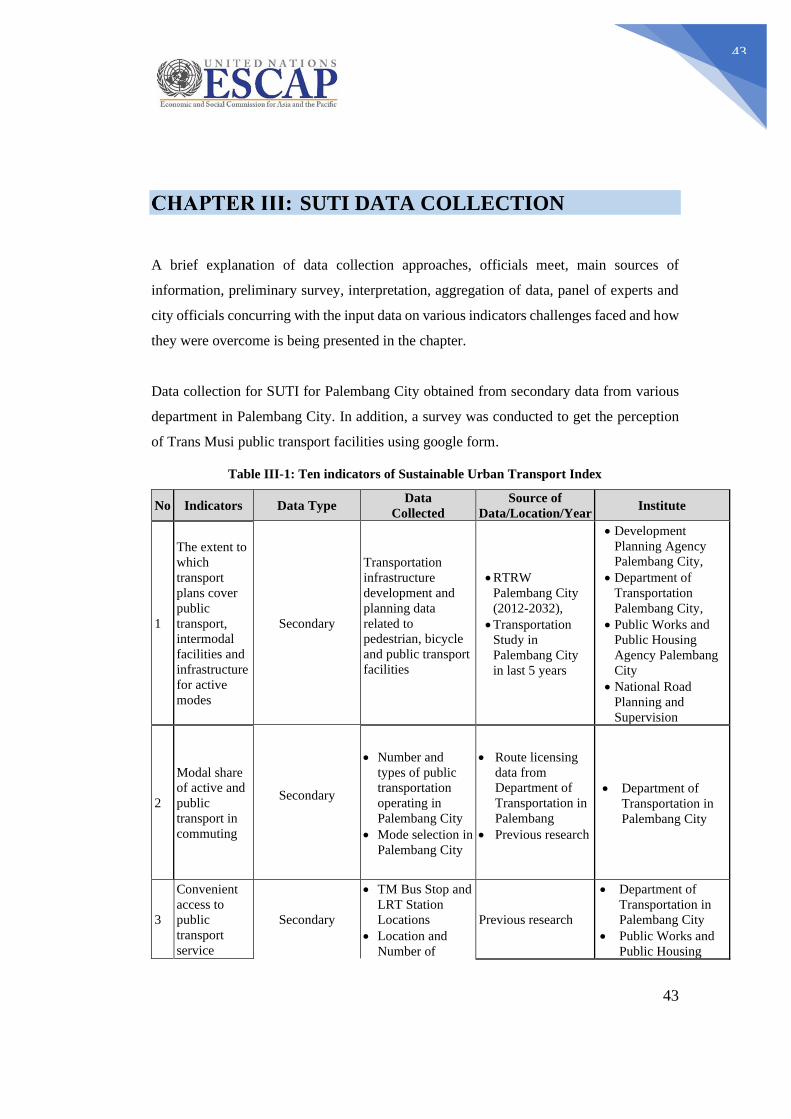
43
43
SUTI DATA COLLECTION
A brief explanation of data collection approaches, officials meet, main sources of
information, preliminary survey, interpretation, aggregation of data, panel of experts and
city officials concurring with the input data on various indicators challenges faced and how
they were overcome is being presented in the chapter.
Data collection for SUTI for Palembang City obtained from secondary data from various
department in Palembang City. In addition, a survey was conducted to get the perception
of Trans Musi public transport facilities using google form.
Table III-1: Ten indicators of Sustainable Urban Transport Index
No Indicators Data Type Data
Collected
Source of
Data/Location/Year Institute
1
The extent to
which
transport
plans cover
public
transport,
intermodal
facilities and
infrastructure
for active
modes
Secondary
Transportation
infrastructure
development and
planning data
related to
pedestrian, bicycle
and public transport
facilities
• RTRW
Palembang City
(2012-2032),
• Transportation
Study in
Palembang City
in last 5 years
• Development
Planning Agency
Palembang City,
• Department of
Transportation
Palembang City,
• Public Works and
Public Housing
Agency Palembang
City
• National Road
Planning and
Supervision
2
Modal share
of active and
public
transport in
commuting
Secondary
• Number and
types of public
transportation
operating in
Palembang City
• Mode selection in
Palembang City
• Route licensing
data from
Department of
Transportation in
Palembang
• Previous research
• Department of
Transportation in
Palembang City
3
Convenient
access to
public
transport
service
Secondary
• TM Bus Stop and
LRT Station
Locations
• Location and
Number of
Previous research
• Department of
Transportation in
Palembang City
• Public Works and
Public Housing
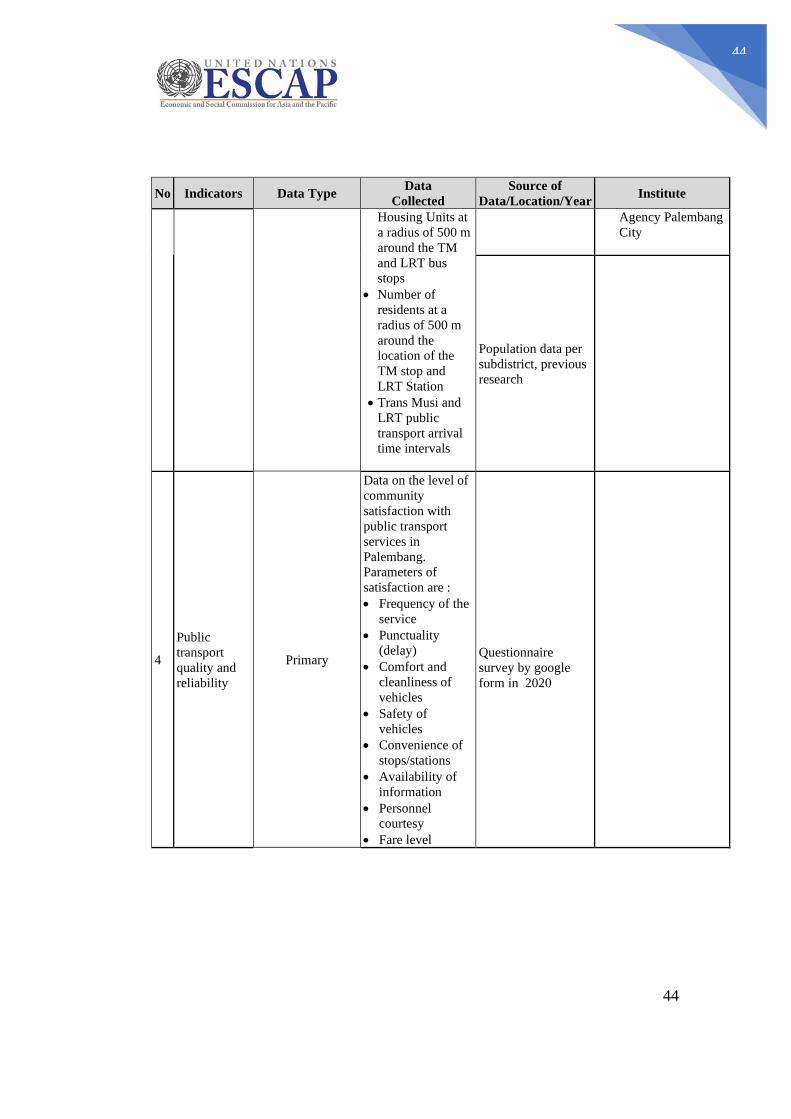
44
44
No Indicators Data Type Data
Collected
Source of
Data/Location/Year Institute
Housing Units at
a radius of 500 m
around the TM
and LRT bus
stops
• Number of
residents at a
radius of 500 m
around the
location of the
TM stop and
LRT Station
• Trans Musi and
LRT public
transport arrival
time intervals
Agency Palembang
City
Population data per
subdistrict, previous
research
4
Public
transport
quality and
reliability
Primary
Data on the level of
community
satisfaction with
public transport
services in
Palembang.
Parameters of
satisfaction are :
• Frequency of the
service
• Punctuality
(delay)
• Comfort and
cleanliness of
vehicles
• Safety of
vehicles
• Convenience of
stops/stations
• Availability of
information
• Personnel
courtesy
• Fare level
Questionnaire
survey by google
form in 2020
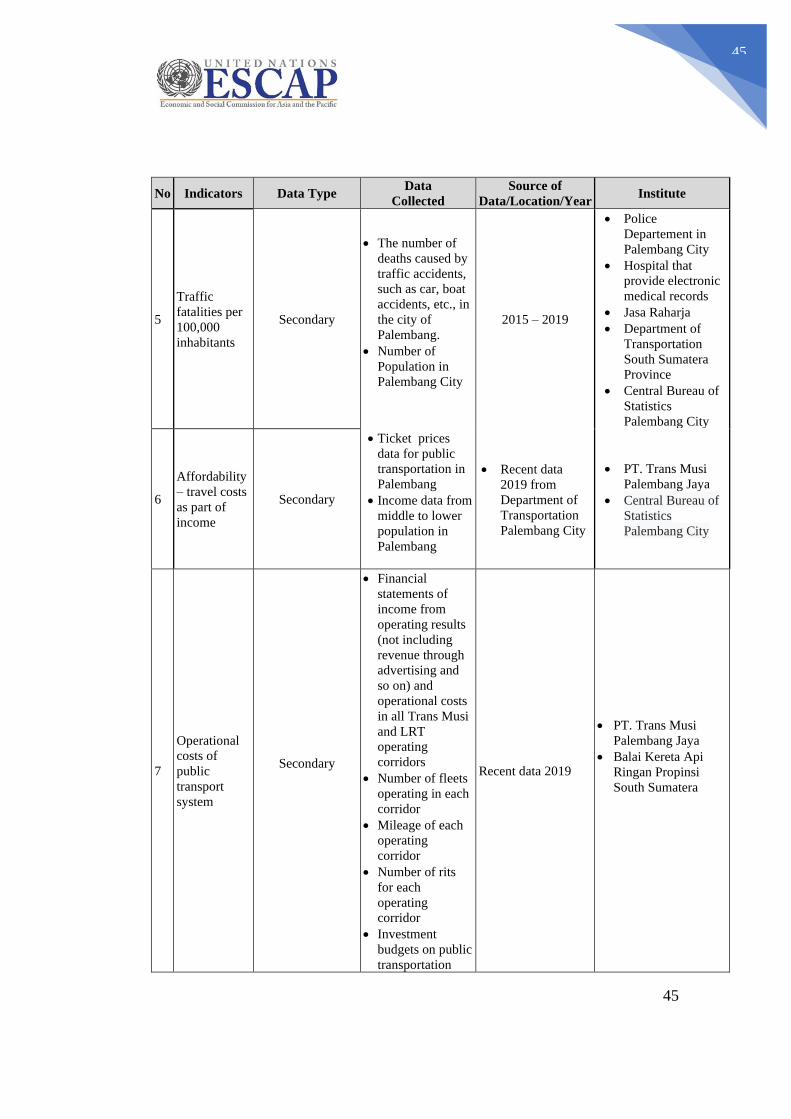
45
45
No Indicators Data Type Data
Collected
Source of
Data/Location/Year Institute
5
Traffic
fatalities per
100,000
inhabitants
Secondary
• The number of
deaths caused by
traffic accidents,
such as car, boat
accidents, etc., in
the city of
Palembang.
• Number of
Population in
Palembang City
2015 – 2019
• Police
Departement in
Palembang City
• Hospital that
provide electronic
medical records
• Jasa Raharja
• Department of
Transportation
South Sumatera
Province
• Central Bureau of
Statistics
Palembang City
6
Affordability
– travel costs
as part of
income
Secondary
• Ticket prices
data for public
transportation in
Palembang
• Income data from
middle to lower
population in
Palembang
• Recent data
2019 from
Department of
Transportation
Palembang City
• PT. Trans Musi
Palembang Jaya
• Central Bureau of
Statistics
Palembang City
7
Operational
costs of
public
transport
system
Secondary
• Financial
statements of
income from
operating results
(not including
revenue through
advertising and
so on) and
operational costs
in all Trans Musi
and LRT
operating
corridors
• Number of fleets
operating in each
corridor
• Mileage of each
operating
corridor
• Number of rits
for each
operating
corridor
• Investment
budgets on public
transportation
Recent data 2019
• PT. Trans Musi
Palembang Jaya
• Balai Kereta Api
Ringan Propinsi
South Sumatera
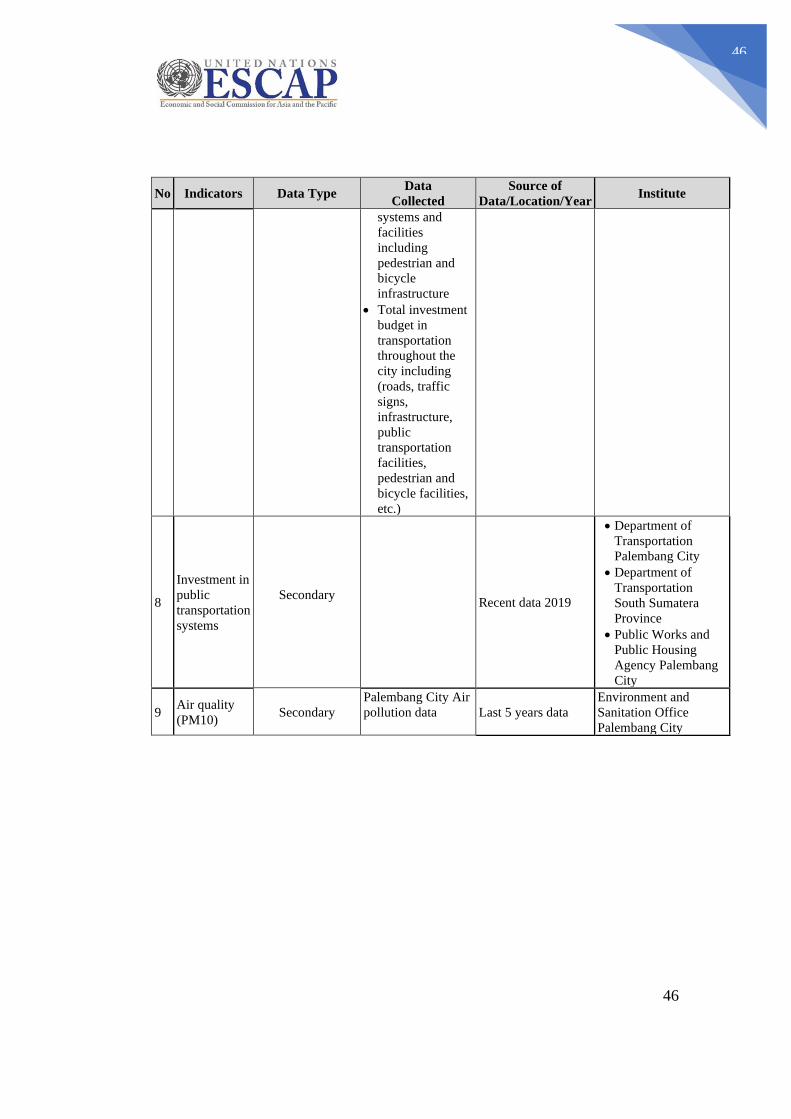
46
46
No Indicators Data Type Data
Collected
Source of
Data/Location/Year Institute
systems and
facilities
including
pedestrian and
bicycle
infrastructure
• Total investment
budget in
transportation
throughout the
city including
(roads, traffic
signs,
infrastructure,
public
transportation
facilities,
pedestrian and
bicycle facilities,
etc.)
8
Investment in
public
transportation
systems
Secondary
Recent data 2019
• Department of
Transportation
Palembang City
• Department of
Transportation
South Sumatera
Province
• Public Works and
Public Housing
Agency Palembang
City
9 Air quality
(PM10) Secondary
Palembang City Air
pollution data
Last 5 years data
Environment and
Sanitation Office
Palembang City
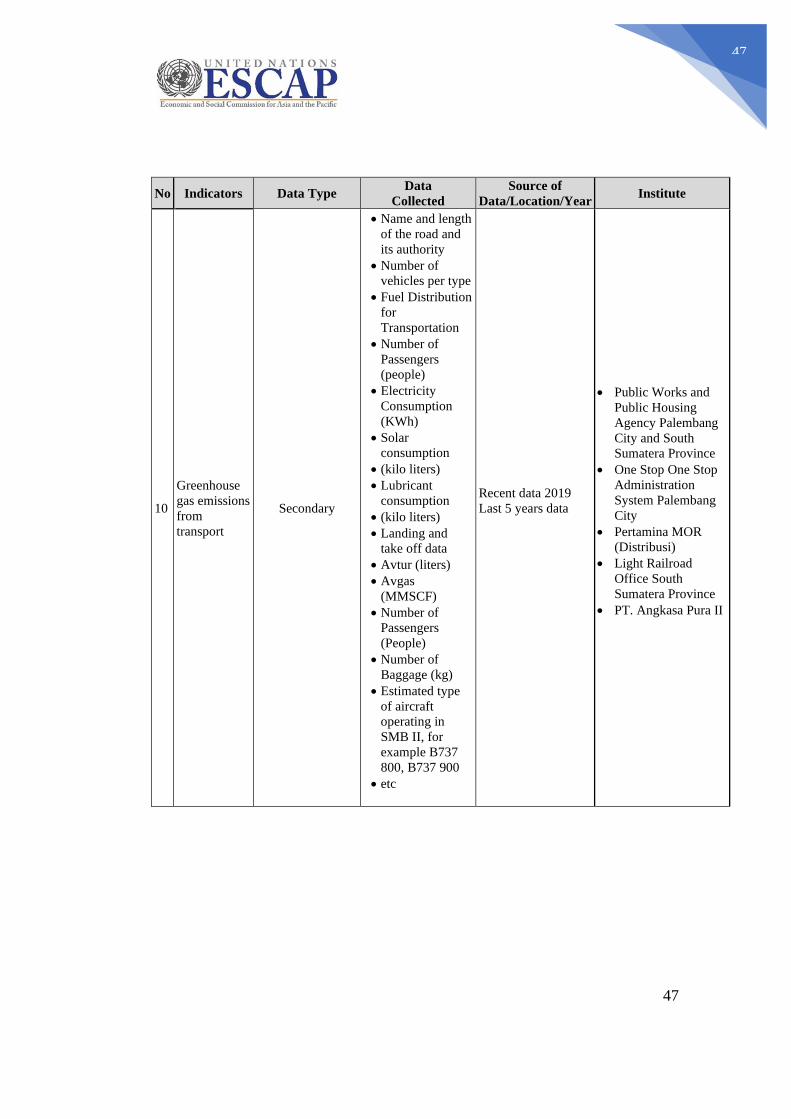
47
47
No Indicators Data Type Data
Collected
Source of
Data/Location/Year Institute
10
Greenhouse
gas emissions
from
transport
Secondary
• Name and length
of the road and
its authority
• Number of
vehicles per type
• Fuel Distribution
for
Transportation
• Number of
Passengers
(people)
• Electricity
Consumption
(KWh)
• Solar
consumption
• (kilo liters)
• Lubricant
consumption
• (kilo liters)
• Landing and
take off data
• Avtur (liters)
• Avgas
(MMSCF)
• Number of
Passengers
(People)
• Number of
Baggage (kg)
• Estimated type
of aircraft
operating in
SMB II, for
example B737
800, B737 900
• etc
Recent data 2019
Last 5 years data
• Public Works and
Public Housing
Agency Palembang
City and South
Sumatera Province
• One Stop One Stop
Administration
System Palembang
City
• Pertamina MOR
(Distribusi)
• Light Railroad
Office South
Sumatera Province
• PT. Angkasa Pura II
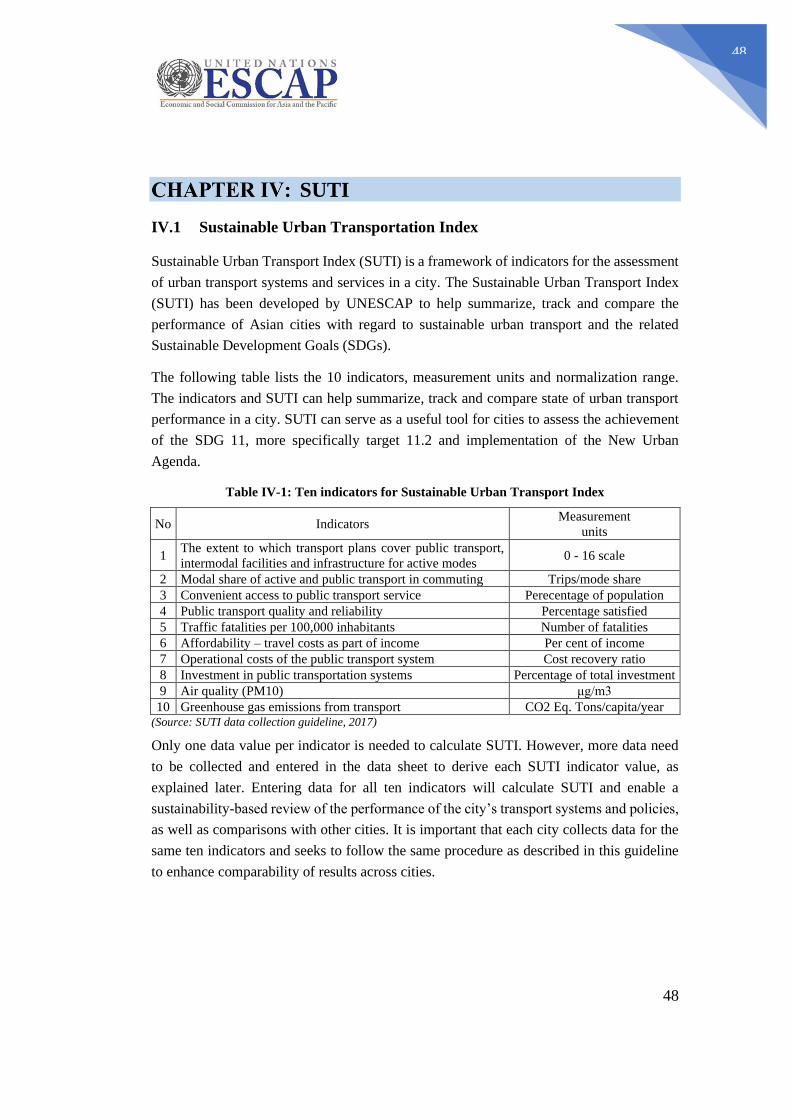
48
48
SUTI
IV.1 Sustainable Urban Transportation Index
Sustainable Urban Transport Index (SUTI) is a framework of indicators for the assessment
of urban transport systems and services in a city. The Sustainable Urban Transport Index
(SUTI) has been developed by UNESCAP to help summarize, track and compare the
performance of Asian cities with regard to sustainable urban transport and the related
Sustainable Development Goals (SDGs).
The following table lists the 10 indicators, measurement units and normalization range.
The indicators and SUTI can help summarize, track and compare state of urban transport
performance in a city. SUTI can serve as a useful tool for cities to assess the achievement
of the SDG 11, more specifically target 11.2 and implementation of the New Urban
Agenda.
Table IV-1: Ten indicators for Sustainable Urban Transport Index
No Indicators Measurement
units
1 The extent to which transport plans cover public transport,
intermodal facilities and infrastructure for active modes 0 - 16 scale
2 Modal share of active and public transport in commuting Trips/mode share
3 Convenient access to public transport service Perecentage of population
4 Public transport quality and reliability Percentage satisfied
5 Traffic fatalities per 100,000 inhabitants Number of fatalities
6 Affordability – travel costs as part of income Per cent of income
7 Operational costs of the public transport system Cost recovery ratio
8 Investment in public transportation systems Percentage of total investment
9 Air quality (PM10) μg/m3
10 Greenhouse gas emissions from transport CO2 Eq. Tons/capita/year (Source: SUTI data collection guideline, 2017)
Only one data value per indicator is needed to calculate SUTI. However, more data need
to be collected and entered in the data sheet to derive each SUTI indicator value, as
explained later. Entering data for all ten indicators will calculate SUTI and enable a
sustainability-based review of the performance of the city’s transport systems and policies,
as well as comparisons with other cities. It is important that each city collects data for the
same ten indicators and seeks to follow the same procedure as described in this guideline
to enhance comparability of results across cities.
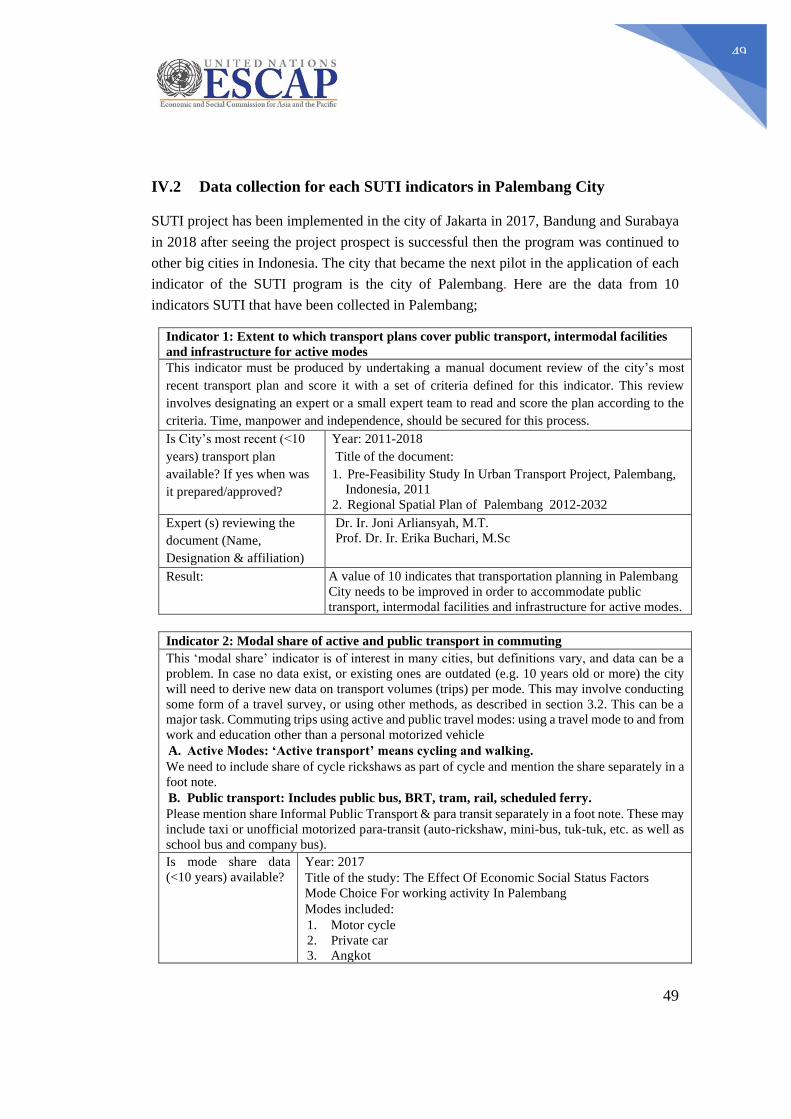
49
49
IV.2 Data collection for each SUTI indicators in Palembang City
SUTI project has been implemented in the city of Jakarta in 2017, Bandung and Surabaya
in 2018 after seeing the project prospect is successful then the program was continued to
other big cities in Indonesia. The city that became the next pilot in the application of each
indicator of the SUTI program is the city of Palembang. Here are the data from 10
indicators SUTI that have been collected in Palembang;
Indicator 1: Extent to which transport plans cover public transport, intermodal facilities
and infrastructure for active modes
This indicator must be produced by undertaking a manual document review of the city’s most
recent transport plan and score it with a set of criteria defined for this indicator. This review
involves designating an expert or a small expert team to read and score the plan according to the
criteria. Time, manpower and independence, should be secured for this process.
Is City’s most recent (<10
years) transport plan
available? If yes when was
it prepared/approved?
Year: 2011-2018
Title of the document:
1. Pre-Feasibility Study In Urban Transport Project, Palembang,
Indonesia, 2011
2. Regional Spatial Plan of Palembang 2012-2032
Expert (s) reviewing the
document (Name,
Designation & affiliation)
Dr. Ir. Joni Arliansyah, M.T.
Prof. Dr. Ir. Erika Buchari, M.Sc
Result: A value of 10 indicates that transportation planning in Palembang
City needs to be improved in order to accommodate public
transport, intermodal facilities and infrastructure for active modes.
Indicator 2: Modal share of active and public transport in commuting
This ‘modal share’ indicator is of interest in many cities, but definitions vary, and data can be a
problem. In case no data exist, or existing ones are outdated (e.g. 10 years old or more) the city
will need to derive new data on transport volumes (trips) per mode. This may involve conducting
some form of a travel survey, or using other methods, as described in section 3.2. This can be a
major task. Commuting trips using active and public travel modes: using a travel mode to and from
work and education other than a personal motorized vehicle
A. Active Modes: ‘Active transport’ means cycling and walking.
We need to include share of cycle rickshaws as part of cycle and mention the share separately in a
foot note.
B. Public transport: Includes public bus, BRT, tram, rail, scheduled ferry.
Please mention share Informal Public Transport & para transit separately in a foot note. These may
include taxi or unofficial motorized para-transit (auto-rickshaw, mini-bus, tuk-tuk, etc. as well as
school bus and company bus).
Is mode share data
(<10 years) available?
Year: 2017
Title of the study: The Effect Of Economic Social Status Factors
Mode Choice For working activity In Palembang
Modes included:
1. Motor cycle
2. Private car
3. Angkot
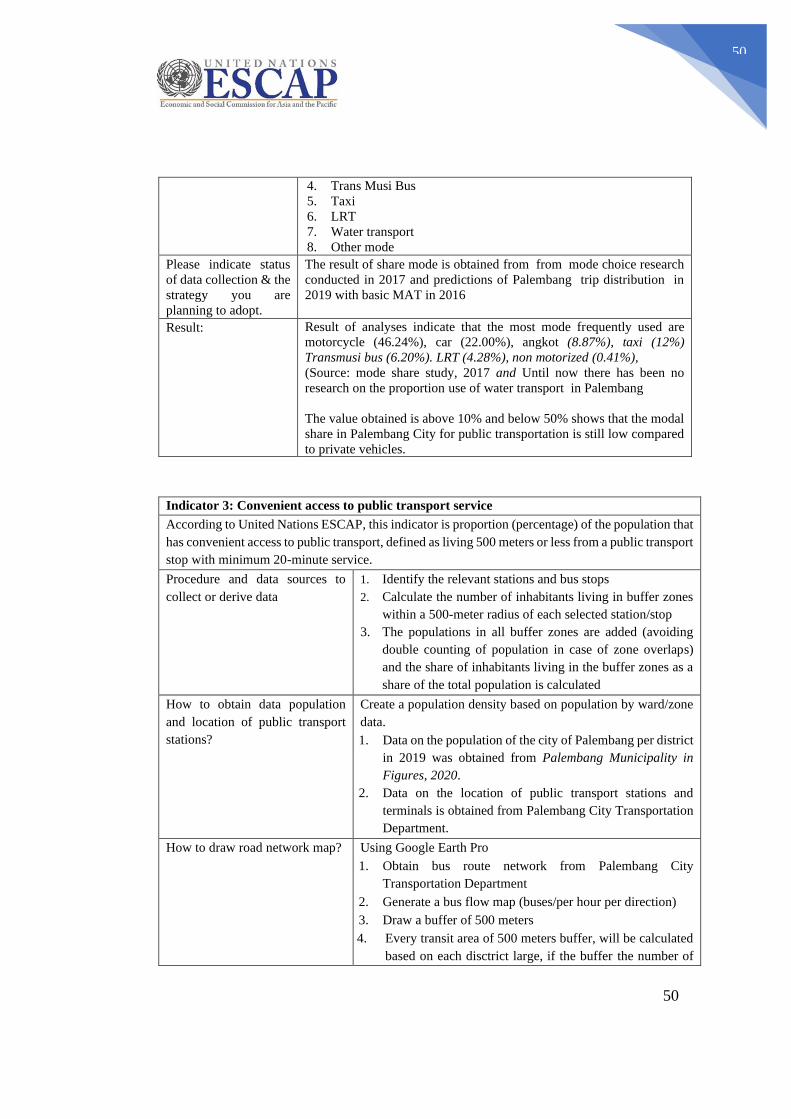
50
50
4. Trans Musi Bus
5. Taxi
6. LRT
7. Water transport
8. Other mode
Please indicate status
of data collection & the
strategy you are
planning to adopt.
The result of share mode is obtained from from mode choice research
conducted in 2017 and predictions of Palembang trip distribution in
2019 with basic MAT in 2016
Result: Result of analyses indicate that the most mode frequently used are
motorcycle (46.24%), car (22.00%), angkot (8.87%), taxi (12%)
Transmusi bus (6.20%). LRT (4.28%), non motorized (0.41%),
(Source: mode share study, 2017 and Until now there has been no
research on the proportion use of water transport in Palembang
The value obtained is above 10% and below 50% shows that the modal
share in Palembang City for public transportation is still low compared
to private vehicles.
Indicator 3: Convenient access to public transport service
According to United Nations ESCAP, this indicator is proportion (percentage) of the population that
has convenient access to public transport, defined as living 500 meters or less from a public transport
stop with minimum 20-minute service.
Procedure and data sources to
collect or derive data
1. Identify the relevant stations and bus stops
2. Calculate the number of inhabitants living in buffer zones
within a 500-meter radius of each selected station/stop
3. The populations in all buffer zones are added (avoiding
double counting of population in case of zone overlaps)
and the share of inhabitants living in the buffer zones as a
share of the total population is calculated
How to obtain data population
and location of public transport
stations?
Create a population density based on population by ward/zone
data.
1. Data on the population of the city of Palembang per district
in 2019 was obtained from Palembang Municipality in
Figures, 2020.
2. Data on the location of public transport stations and
terminals is obtained from Palembang City Transportation
Department.
How to draw road network map? Using Google Earth Pro
1. Obtain bus route network from Palembang City
Transportation Department
2. Generate a bus flow map (buses/per hour per direction)
3. Draw a buffer of 500 meters
4. Every transit area of 500 meters buffer, will be calculated
based on each disctrict large, if the buffer the number of
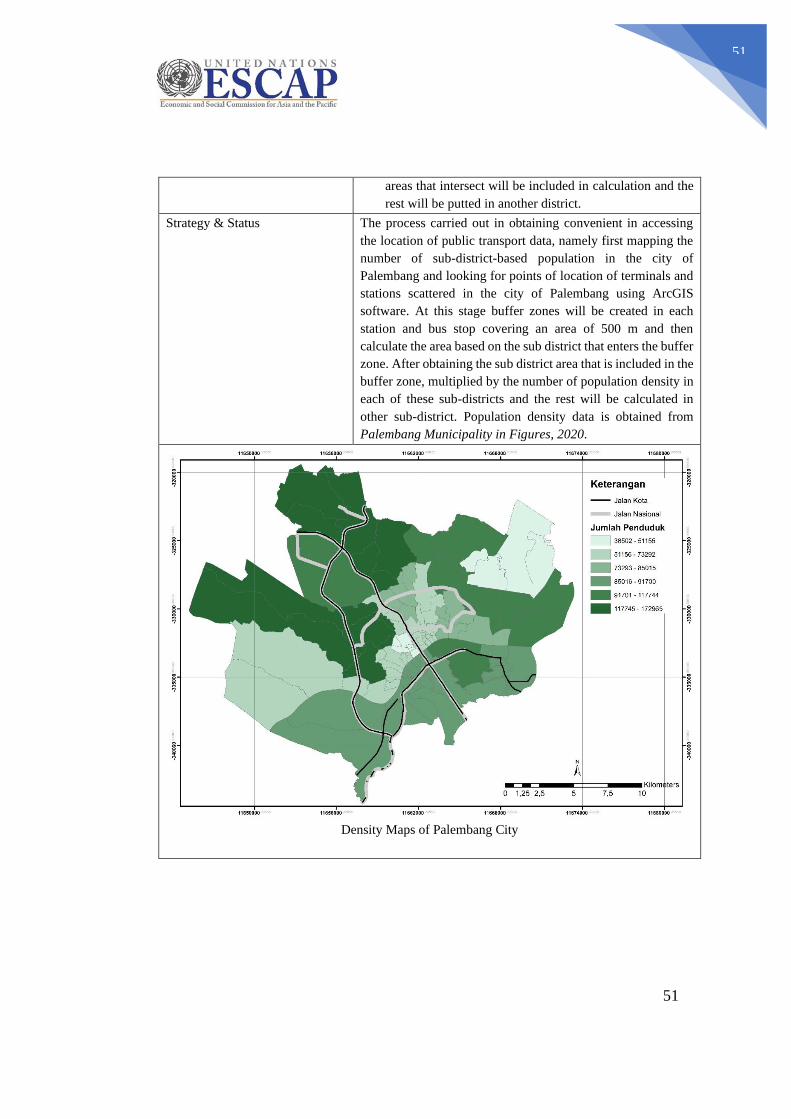
51
51
areas that intersect will be included in calculation and the
rest will be putted in another district.
Strategy & Status
The process carried out in obtaining convenient in accessing
the location of public transport data, namely first mapping the
number of sub-district-based population in the city of
Palembang and looking for points of location of terminals and
stations scattered in the city of Palembang using ArcGIS
software. At this stage buffer zones will be created in each
station and bus stop covering an area of 500 m and then
calculate the area based on the sub district that enters the buffer
zone. After obtaining the sub district area that is included in the
buffer zone, multiplied by the number of population density in
each of these sub-districts and the rest will be calculated in
other sub-district. Population density data is obtained from
Palembang Municipality in Figures, 2020.
Density Maps of Palembang City
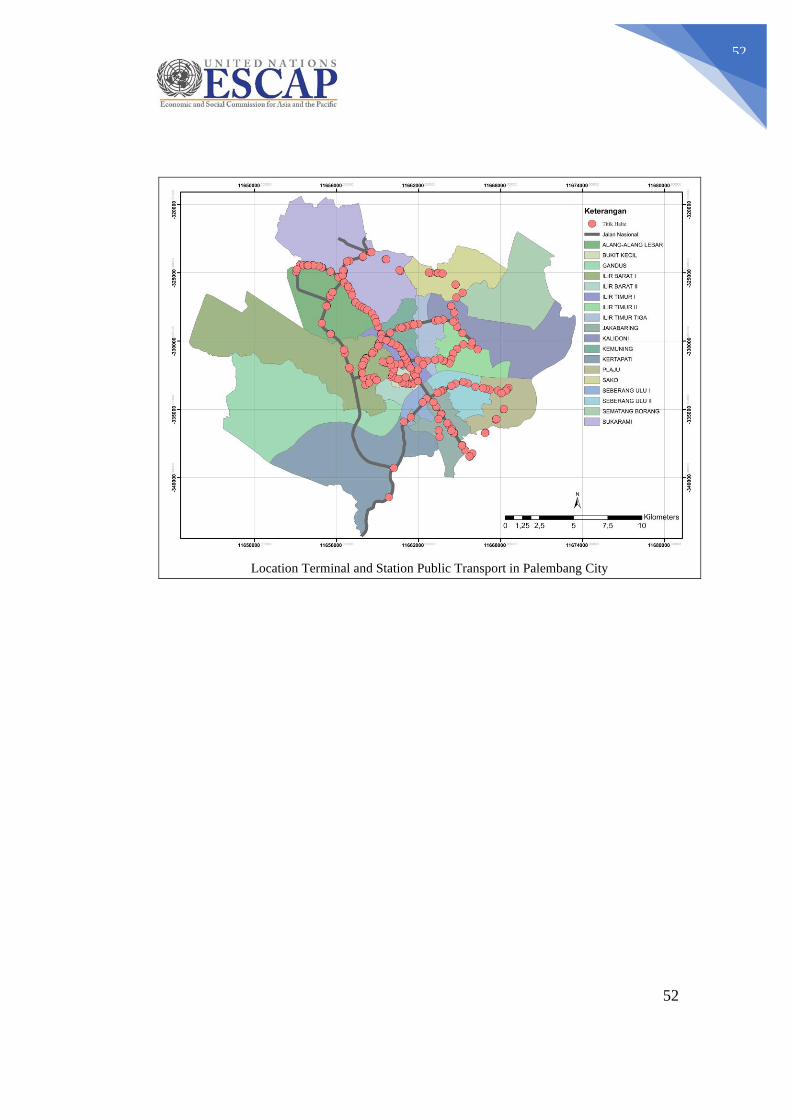
52
52
Location Terminal and Station Public Transport in Palembang City
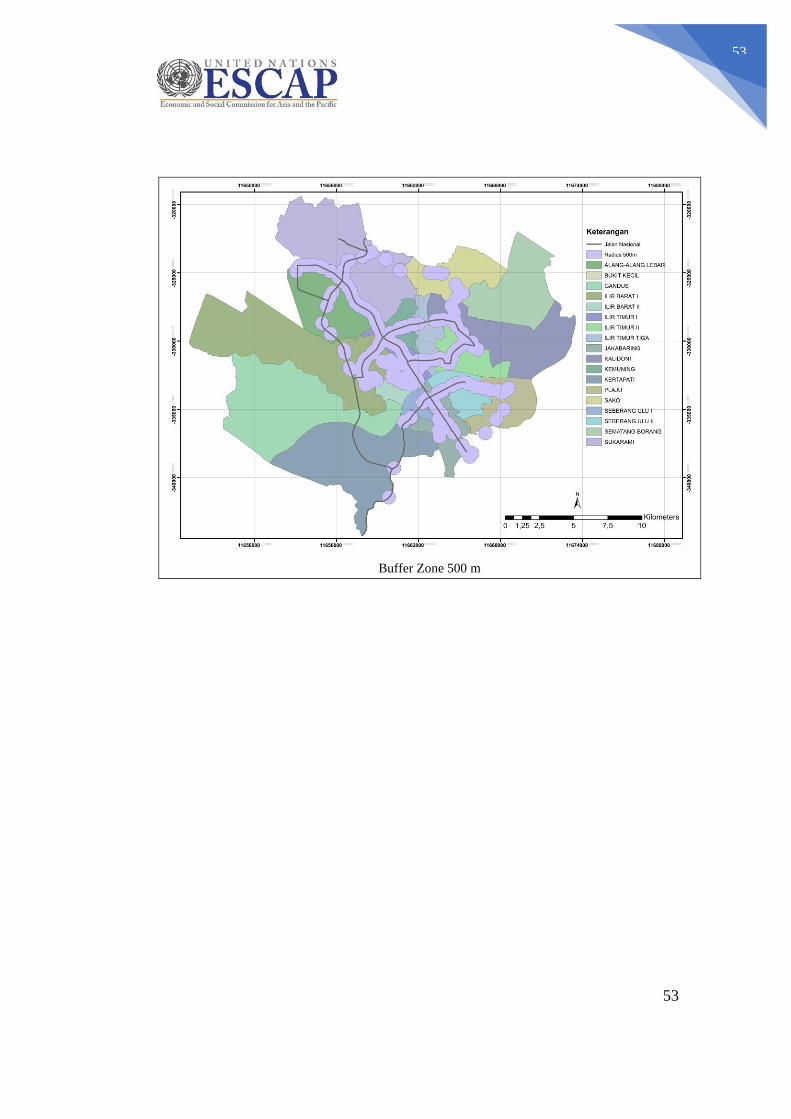
53
53
Buffer Zone 500 m
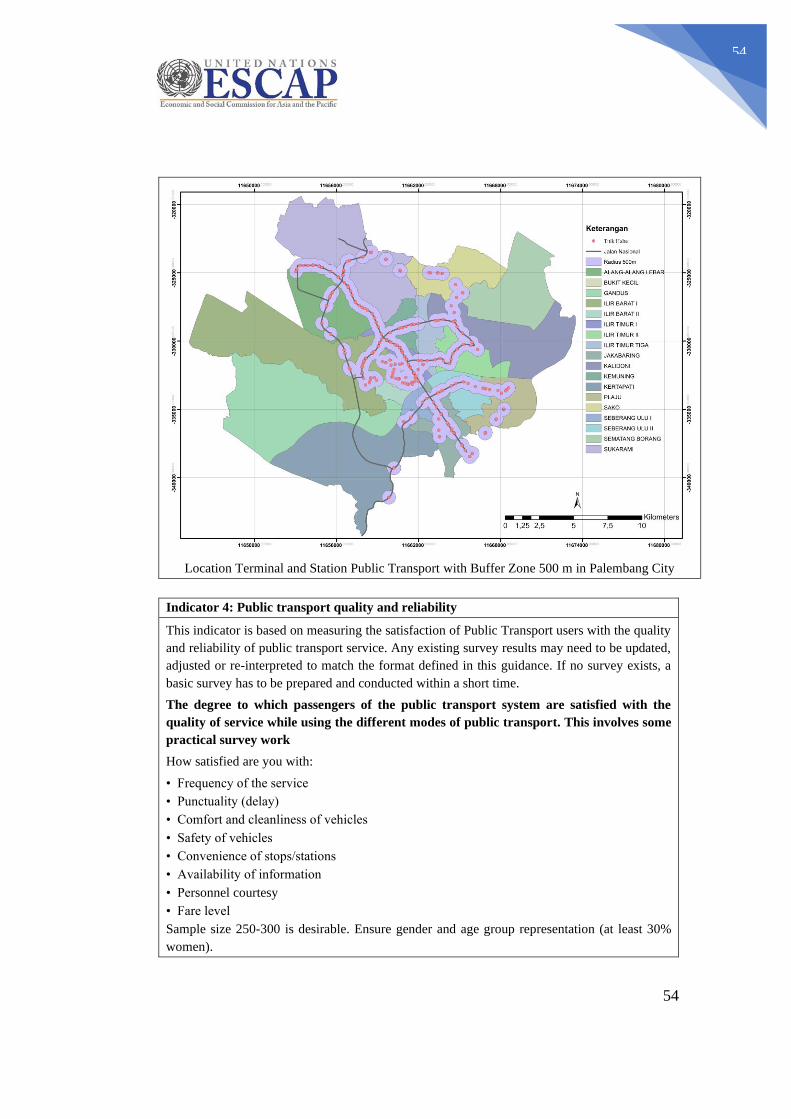
54
54
Location Terminal and Station Public Transport with Buffer Zone 500 m in Palembang City
Indicator 4: Public transport quality and reliability
This indicator is based on measuring the satisfaction of Public Transport users with the quality
and reliability of public transport service. Any existing survey results may need to be updated,
adjusted or re-interpreted to match the format defined in this guidance. If no survey exists, a
basic survey has to be prepared and conducted within a short time.
The degree to which passengers of the public transport system are satisfied with the
quality of service while using the different modes of public transport. This involves some
practical survey work
How satisfied are you with:
• Frequency of the service
• Punctuality (delay)
• Comfort and cleanliness of vehicles
• Safety of vehicles
• Convenience of stops/stations
• Availability of information
• Personnel courtesy
• Fare level
Sample size 250-300 is desirable. Ensure gender and age group representation (at least 30%
women).
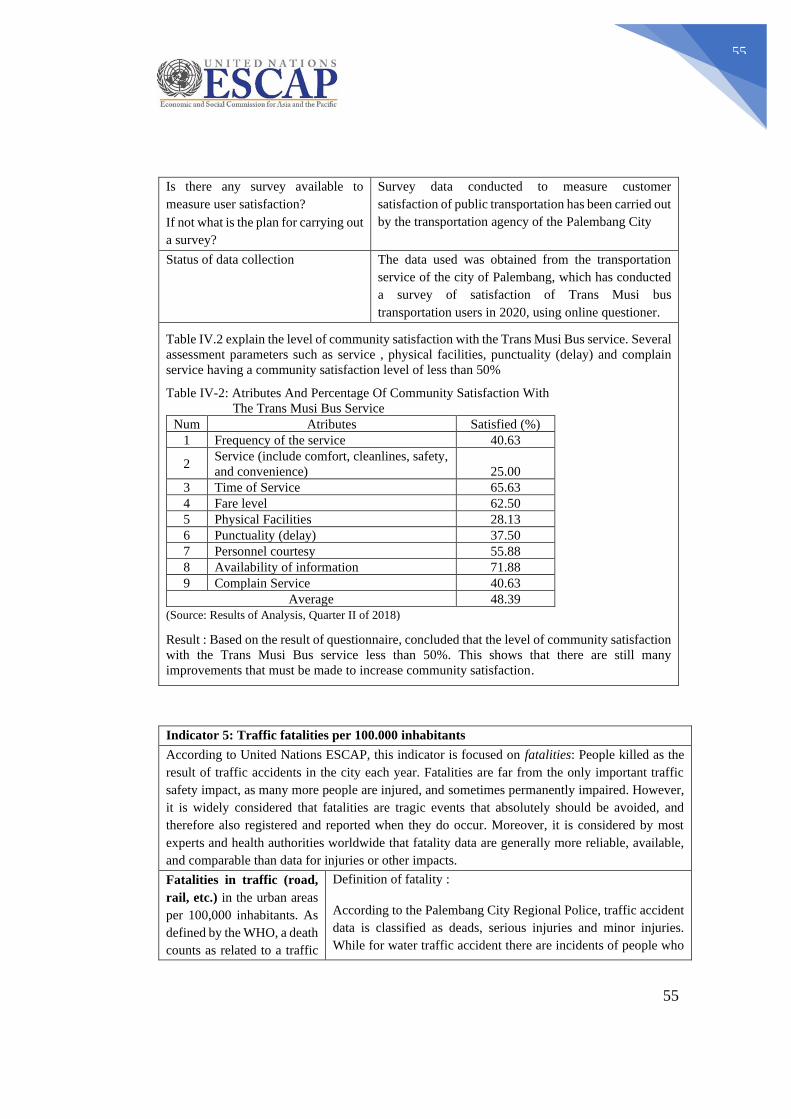
55
55
Is there any survey available to
measure user satisfaction?
If not what is the plan for carrying out
a survey?
Survey data conducted to measure customer
satisfaction of public transportation has been carried out
by the transportation agency of the Palembang City
Status of data collection The data used was obtained from the transportation
service of the city of Palembang, which has conducted
a survey of satisfaction of Trans Musi bus
transportation users in 2020, using online questioner.
Table IV.2 explain the level of community satisfaction with the Trans Musi Bus service. Several
assessment parameters such as service , physical facilities, punctuality (delay) and complain
service having a community satisfaction level of less than 50%
Table IV-2: Atributes And Percentage Of Community Satisfaction With
The Trans Musi Bus Service
Num Atributes Satisfied (%)
1 Frequency of the service 40.63
2 Service (include comfort, cleanlines, safety,
and convenience) 25.00
3 Time of Service 65.63
4 Fare level 62.50
5 Physical Facilities 28.13
6 Punctuality (delay) 37.50
7 Personnel courtesy 55.88
8 Availability of information 71.88
9 Complain Service 40.63
Average 48.39 (Source: Results of Analysis, Quarter II of 2018)
Result : Based on the result of questionnaire, concluded that the level of community satisfaction
with the Trans Musi Bus service less than 50%. This shows that there are still many
improvements that must be made to increase community satisfaction.
Indicator 5: Traffic fatalities per 100.000 inhabitants
According to United Nations ESCAP, this indicator is focused on fatalities: People killed as the
result of traffic accidents in the city each year. Fatalities are far from the only important traffic
safety impact, as many more people are injured, and sometimes permanently impaired. However,
it is widely considered that fatalities are tragic events that absolutely should be avoided, and
therefore also registered and reported when they do occur. Moreover, it is considered by most
experts and health authorities worldwide that fatality data are generally more reliable, available,
and comparable than data for injuries or other impacts.
Fatalities in traffic (road,
rail, etc.) in the urban areas
per 100,000 inhabitants. As
defined by the WHO, a death
counts as related to a traffic
Definition of fatality :
According to the Palembang City Regional Police, traffic accident
data is classified as deads, serious injuries and minor injuries.
While for water traffic accident there are incidents of people who
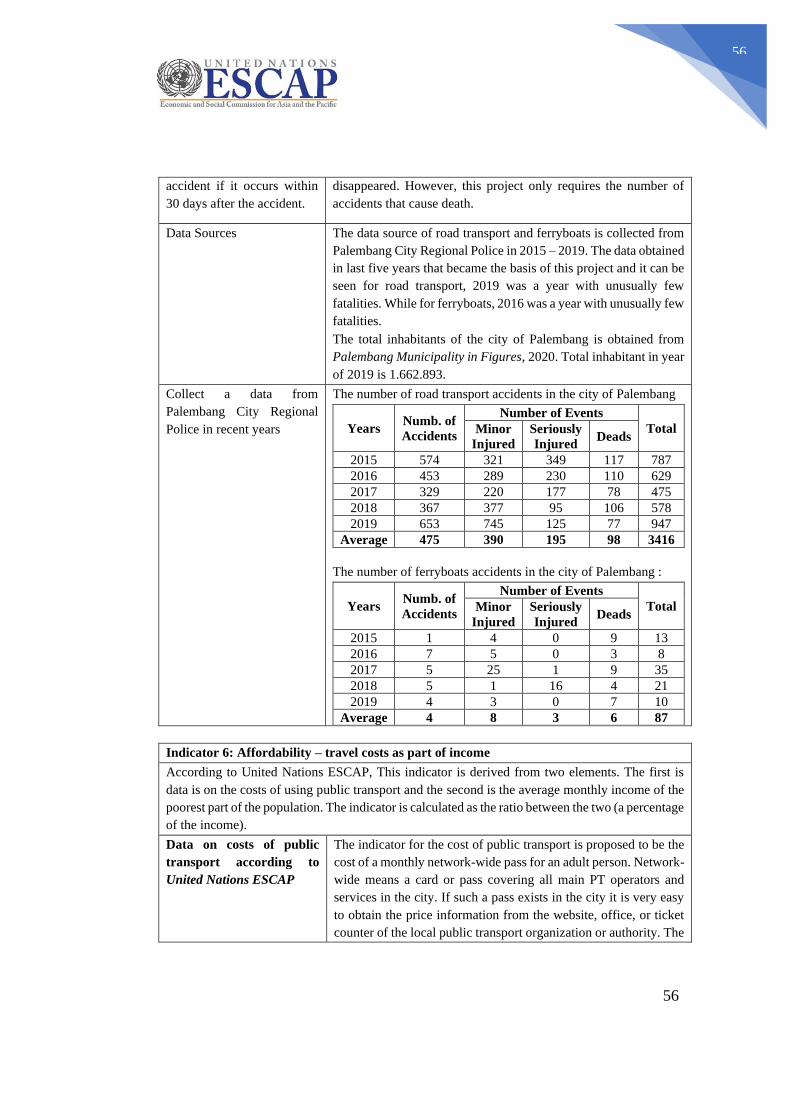
56
56
accident if it occurs within
30 days after the accident.
disappeared. However, this project only requires the number of
accidents that cause death.
Data Sources The data source of road transport and ferryboats is collected from
Palembang City Regional Police in 2015 – 2019. The data obtained
in last five years that became the basis of this project and it can be
seen for road transport, 2019 was a year with unusually few
fatalities. While for ferryboats, 2016 was a year with unusually few
fatalities.
The total inhabitants of the city of Palembang is obtained from
Palembang Municipality in Figures, 2020. Total inhabitant in year
of 2019 is 1.662.893.
Collect a data from
Palembang City Regional
Police in recent years
The number of road transport accidents in the city of Palembang
Years Numb. of
Accidents
Number of Events
Total Minor
Injured
Seriously
Injured Deads
2015 574 321 349 117 787
2016 453 289 230 110 629
2017 329 220 177 78 475
2018 367 377 95 106 578
2019 653 745 125 77 947
Average 475 390 195 98 3416
The number of ferryboats accidents in the city of Palembang :
Years Numb. of
Accidents
Number of Events
Total Minor
Injured
Seriously
Injured Deads
2015 1 4 0 9 13
2016 7 5 0 3 8
2017 5 25 1 9 35
2018 5 1 16 4 21
2019 4 3 0 7 10
Average 4 8 3 6 87
Indicator 6: Affordability – travel costs as part of income
According to United Nations ESCAP, This indicator is derived from two elements. The first is
data is on the costs of using public transport and the second is the average monthly income of the
poorest part of the population. The indicator is calculated as the ratio between the two (a percentage
of the income).
Data on costs of public
transport according to
United Nations ESCAP
The indicator for the cost of public transport is proposed to be the
cost of a monthly network-wide pass for an adult person. Network-
wide means a card or pass covering all main PT operators and
services in the city. If such a pass exists in the city it is very easy
to obtain the price information from the website, office, or ticket
counter of the local public transport organization or authority. The
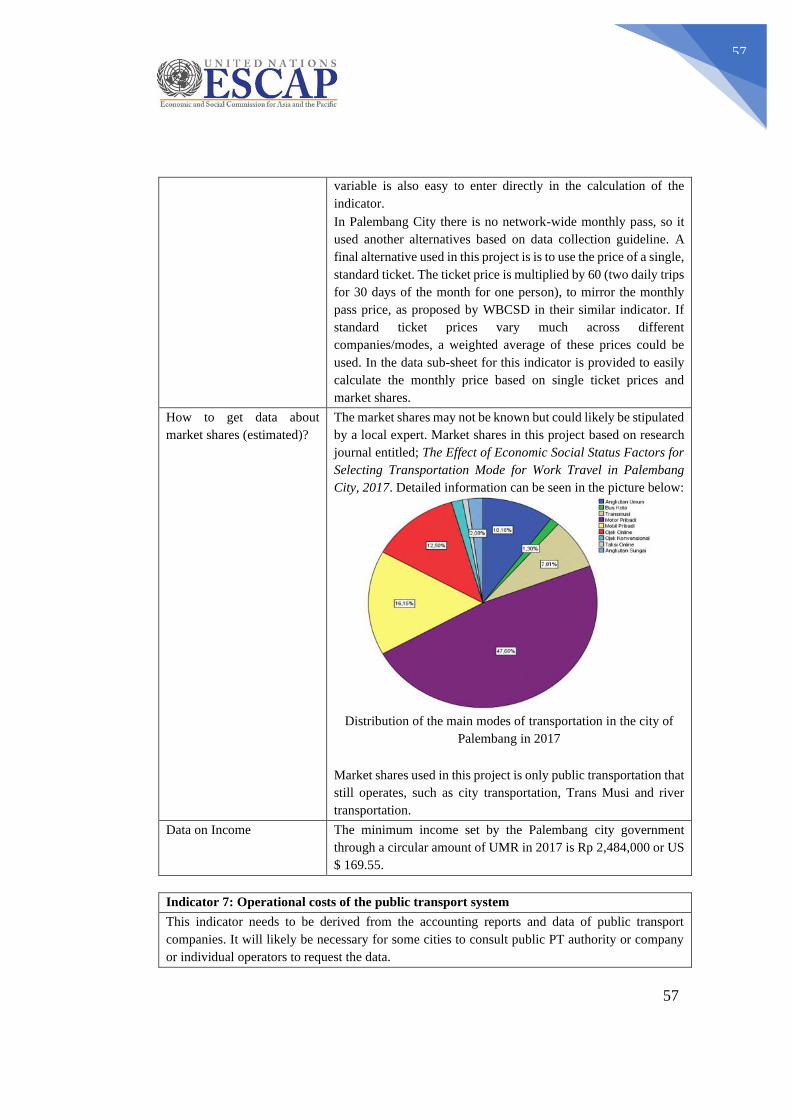
57
57
variable is also easy to enter directly in the calculation of the
indicator.
In Palembang City there is no network-wide monthly pass, so it
used another alternatives based on data collection guideline. A
final alternative used in this project is is to use the price of a single,
standard ticket. The ticket price is multiplied by 60 (two daily trips
for 30 days of the month for one person), to mirror the monthly
pass price, as proposed by WBCSD in their similar indicator. If
standard ticket prices vary much across different
companies/modes, a weighted average of these prices could be
used. In the data sub-sheet for this indicator is provided to easily
calculate the monthly price based on single ticket prices and
market shares.
How to get data about
market shares (estimated)?
The market shares may not be known but could likely be stipulated
by a local expert. Market shares in this project based on research
journal entitled; The Effect of Economic Social Status Factors for
Selecting Transportation Mode for Work Travel in Palembang
City, 2017. Detailed information can be seen in the picture below:
Distribution of the main modes of transportation in the city of
Palembang in 2017
Market shares used in this project is only public transportation that
still operates, such as city transportation, Trans Musi and river
transportation.
Data on Income The minimum income set by the Palembang city government
through a circular amount of UMR in 2017 is Rp 2,484,000 or US
$ 169.55.
Indicator 7: Operational costs of the public transport system
This indicator needs to be derived from the accounting reports and data of public transport
companies. It will likely be necessary for some cities to consult public PT authority or company
or individual operators to request the data.
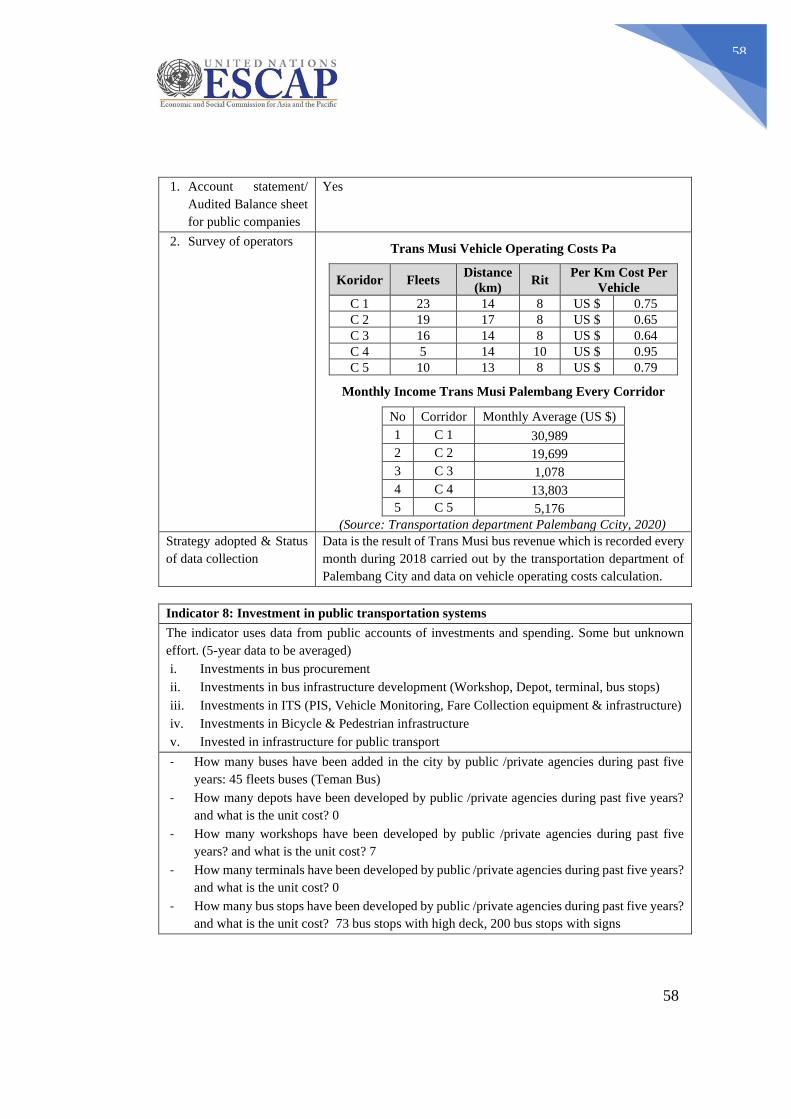
58
58
1. Account statement/
Audited Balance sheet
for public companies
Yes
2. Survey of operators Trans Musi Vehicle Operating Costs Pa
Koridor Fleets Distance
(km) Rit
Per Km Cost Per
Vehicle
C 1 23 14 8 US $ 0.75
C 2 19 17 8 US $ 0.65
C 3 16 14 8 US $ 0.64
C 4 5 14 10 US $ 0.95
C 5 10 13 8 US $ 0.79
Monthly Income Trans Musi Palembang Every Corridor
No Corridor Monthly Average (US $)
1 C 1 30,989
2 C 2 19,699
3 C 3 1,078
4 C 4 13,803
5 C 5 5,176
(Source: Transportation department Palembang Ccity, 2020)
Strategy adopted & Status
of data collection
Data is the result of Trans Musi bus revenue which is recorded every
month during 2018 carried out by the transportation department of
Palembang City and data on vehicle operating costs calculation.
Indicator 8: Investment in public transportation systems
The indicator uses data from public accounts of investments and spending. Some but unknown
effort. (5-year data to be averaged)
i. Investments in bus procurement
ii. Investments in bus infrastructure development (Workshop, Depot, terminal, bus stops)
iii. Investments in ITS (PIS, Vehicle Monitoring, Fare Collection equipment & infrastructure)
iv. Investments in Bicycle & Pedestrian infrastructure
v. Invested in infrastructure for public transport
- How many buses have been added in the city by public /private agencies during past five
years: 45 fleets buses (Teman Bus)
- How many depots have been developed by public /private agencies during past five years?
and what is the unit cost? 0
- How many workshops have been developed by public /private agencies during past five
years? and what is the unit cost? 7
- How many terminals have been developed by public /private agencies during past five years?
and what is the unit cost? 0
- How many bus stops have been developed by public /private agencies during past five years?
and what is the unit cost? 73 bus stops with high deck, 200 bus stops with signs
59
59
Status/ strategy The data obtained is the data of the transportation agency budget of the city
of Palembang, which is the last 5 years data. The explained on table II-14
dan II.15
Indicator 9: Air quality (pm10)
The indicator use is population weighted air quality monitoring data reported to national agency or WHO. May need
conversion from PM2.5 data if PM10 not available. Should require limited effort.
1. Are there Air Quality Monitoring Systems set
up in the city?
Yes,
If Yes, How many stations? There are 2 stations
Palembang City has two air quality monitoring station points
managed by the South Sumatra Province Environment and Land
Office (DLHP Sumsel), which is located in the South Sumatra
DLHP office and Radial intersection. On the other hand, in 2019,
the Palembang City Environment and Sanitation Office (DLHK
Palembang) has taken 3 (three) measurements of PM10 at 14
points, in March, June / July, and November 2019.
What is being monitored? PM10
Remarks / Status The results of monitoring conducted by DLHK Palembang on
2019, is used in this report.
Result: Air Pollutant Standard Index is a number that does not have a unit that describes the condition of ambient air
quality at a particular location and time, which is based on the impact on human health, aesthetic values and other living
things.
PM10 Measurement Results
Period of measurement: March, 2019
No Measurement location Qty Unit Date of
measurement
1 Simpang Pasar Plaju 89.6 μg/Nm3 12/03/2019
2 Depan Bank Sumsel Babel Jakabaring 76.3 μg/Nm3 12/03/2019
3 Simpang 4 Kertapati – Musi II 112 μg/Nm3 12/03/2019
4 Simpang 4 Bandara 119.3 μg/Nm3 13/03/2019
5 Simpang 4 Musi II – Soekarno Hatta 134.8 μg/Nm3 13/03/2019
6 Pintu Masuk Bank Indonesia (Jl. Jend Sudirman) 108.4 μg/Nm3 15/03/2019
7 Simpang 4 Veteran 94.6 μg/Nm3 15/03/2019
8 Depan Kantor Walikota 134.7 μg/Nm3 19/03/2019
9 Depan Bundaran Air Mancur 129.4 μg/Nm3 19/03/2019
10 Simpang Pasar Lemabang 114.4 μg/Nm3 21/03/20 9
11 Simpang Celentang 92.5 μg/Nm3 21/03/2019
12 Simpang Patal 77.4 μg/Nm3 25/03/2019
13 Simpang Polda 104.6 μg/Nm3 25/03/2019
14 Simpang TPA Sukawinatan 92.7 μg/Nm3 27/03/2019
Average 105.76 μg/Nm3
Source: Palembang City Environment and Sanitation Office (DLHK Palembang)
Period of measurement: June, 2019
No Measurement location Qty Unit Date of
measurement
1 Depan Kantor Walikota 108.9 μg/Nm3 25/06/2019
2 Depan Masjid Agung (Bundaran Air Mancur) 134.7 μg/Nm3 25/06/2019
3 Simpang 4 andara (Bandara Emas) 92.8 μg/Nm3 26/06/2019
4 Simpang 4 Musi II – Soekarno Hatta (Parameswara) 115.3 μg/Nm3 26/06/2019
60
60
5 Pintu Masuk Bank Indonesia (Jl. Jend Sudirman) 76.4 μg/Nm3 28/06/2019
6 Simpang 4 Veteran (Apotik Indah Medica) 68.3 μg/Nm3 28/06 2019
7 Simpang 4 Pasar Lemabang 107.2 μg/Nm3 02/07/2019
8 Simpang Pasar Plaju 92.4 μg/Nm3 02/07/2019
9 Simpang Patal 114.5 μg/Nm3 04/07/2019
10 Simpang Celentang 127.6 μg/Nm3 04/07/2019
11 Jalan Gub H. Bastari Depan Bank Sumsel Babel Jakabaring 104. μg/Nm3 05/07/2019
12 Simpang 4 Kertapati – Musi II (Pegayut) 136.4 μg/Nm3 05/07/2019
13 Simpang Polda 117.3 μg/Nm3 08/07/2019
14 Simpang TPA Sukawinatan 96.4 μg/Nm3 09/07/2019
Average 106.60 μg/Nm3
Source: Palembang City Environment and Sanitation Office (DLHK Palembang)
Period of measurement: November, 2019
No Measurement location Qty Unit Date of
measurement
1 Depan Kantor Walikota 51.2 μg/Nm3 06/11/2019
2 Depan Masjid Agung (Bundaran Air Mancur) 66.2 μg/Nm3 06/11/2019
3 Simpang 4 Bandara ( ndara Emas) 56.3 μg/Nm3 07/11/2019
4 Simpang 4 Musi II – Soekarno Hatta (Parameswara) 279.5 μg/Nm3 07/11/2019
5 Pintu Masuk Bank Indonesia (Jl. Jend Sudirman) 56.9 μg/Nm3 08/11/2019
6 Simpang 4 Veteran (Apotik Indah Medica) 112.0 μg/Nm3 08/11/2019
7 impang 4 Pasar Lemabang 116.3 μg/Nm3 11/11/2019
8 Simpang Pasar Plaju 159.0 μg/Nm3 11/11/2019
9 Simpang Patal 8.1 μg/Nm3 12/11/2019
10 Simpang Celentang 22.8 μg/Nm3 12/11/2019
11 Jalan Gub H. Bastari Depan Bank Sumsel Babel Jakabaring 24.5 μg/Nm3 13 1/2019
12 Simpang 4 Kertapati – Musi II (Pegayut) 279.5 μg/Nm3 13/11/2019
13 Simpang Polda 64.0 μg/Nm3 14/11/2019
14 Simpang TPA Sukawinatan 93.0 μg/Nm3 14/11/2019
Average 99.24 μg/Nm3
Source: Palembang City Environment and Sanitation Office (DLHK Palembang)
Note:
the mean value of PM10 (2019): 103.87 μg/Nm3
Indicator 10: GHG emissions from transport
GHG emissions
Is an account or estimate of the emissions
of CO2 from transport in the city is
available?
Yes
If Yes, Data Source: Palembang City Environment and
Sanitation Office (DLHK Palembang)
Reference Year: 2017. The calculation of GHG emissions
from the transportation sector in 2018 & 2019 is being carried
out by DLHK Palembang..
If not, a figure
has to be calculated using one of the
following methods:
1. Modes (i) X daily trip length X
emission factors (i)
2. Indirectly from gasoline and diesel
sales. Petrol consumed x emission
factor + Diesel consumption x emission
factor
i. Is data on mode wise total trips and trip length available
both for passenger and goods vehicles?
Some indication of vintage information to indicate
technology and mix of vehicles by fuel type would be
required.
Is such data available? Yes/No
ii. Is data on sale of petrol and diesel available? Yes/No
Any reasonable estimate on consumption of the same
within and outside is feasible? Yes/No
61
61
How is city collecting data?
What is the status?
Fuel sales data (2017) distributed in Palembang are obtained
from the Central Statistics Bureau of Palembang. The data
was corrected with data on industrial fuel consumption from
Hiswana Migas of Palembang. In 2020, GHH inventory is
being carried out by DLHK Palembang, and data on fuel
consumption for transportation (2016 - 2019) is being
requested from PT. Pertamina Distribution.
Greenhouse gas emissions by fuel:
No
. Parameter
type of fuel Note
Diesel
oil Gasoline
(1) Fuel Consumption (kilo
liter) 94.649 246.139
(2) Fuel Consumption (TJ) 3.382 8.123 (2)=(1)*NCV
(3) CO2 Emissions (ton
CO2) 251.253 562.895 (3)=(2)*EFCO2 (kg CO2/TJ) * 0,001
(4) CH4 Emissions (ton
CH4) 13 268
(4)=(2)*EFCH4 (kg CH4/TJ) * 0,001
(5) N2O Emissions (ton
N2O) 13 26
(5)=(2)*EFN2O (kg N2O/TJ) * 0,001
(6) GHG Emission (ton
CO2e) 255.618 576.582
(6) =
[(3)*GWPCO2]+[(4)*GWPCH4]+[(5)*GWPN2
O]
(7) Carbon intensity
(ton CO2e/capita)
0,51 (7) = (6) per population (2017) = 1.623.099
people
Note:
Density of diesel oil
(HSD)
837,50 kg/m3
The results of "Puslitbang
Teknologi Migas (Lemigas)
KESDM" (2011)
NCV of diesel oil
(HSD)
42,66 TJ/Gg
Proceedings of the Scientific & Exhibition
Meeting of Puslitbang KESDM Results (2017), pp.
327-332.
NCV of
HSD/ADO 0,0357
TJ/kilo
liter.
Pedoman Inventarisasi GRK Nasional, Bk II, Vol.
1, Pengadaan&Penggunaan Energi (2012), pp. 12
NCV of motor
gasoline 0,0330
TJ/kilo
liter. CO2 Emission Factor
(motor gasoline) - mobile
source 69300
kg
CO2/TJ
2006 IPCC Guideline, Vol. 2, Tabel 3.2.1, hal 3.16
& Tbl 3.2.2, hal 3.21 (for mobile emission source)
CH4 Emission Factor
(motor gasoline) - mobile
source 33
kg
CH4/TJ
2006 IPCC Guideline, Vol. 2, Tabel 3.2.1, hal 3.16
& Tbl 3.2.2, hal 3.21 (for mobile emission source)
N2O Emission Factor
(motor gasoline) - mobile
source 3,2
kg
N2O/T
J
2006 IPCC Guideline, Vol. 2, Tabel 3.2.1, hal 3.16
& Tbl 3.2.2, hal 3.21 (for mobile emission source)
CO2 Emission Factor
(HSD) - mobile source 74300
kg
CO2/TJ
Proceedings of the Scientific & Exhibition
Meeting of Puslitbang KESDM Results (2017), pp.
327-332.
CH4 Emission Factor
(HSD) - mobile source 3,9
kg
CH4/TJ
2006 IPCC Guideline, Vol. 2, Tabel 3.2.1, hal 3.16
& Tbl 3.2.2, hal 3.21 (for mobile emission source)
N2O Emission Factor
(HSD) - mobile source 3,9
kg
N2O/T
J
2006 IPCC Guideline, Vol. 2, Tabel 3.2.1, hal 3.16
& Tbl 3.2.2, hal 3.21 (for mobile emission source)
Global Warming Potential /
GWP (100-yr time horizon)
62
62
CO2 1 Second Assessment Report/SAR - IPCC (1995)
CH4 21 Second Assessment Report/SAR - IPCC (1995)
N2
O 310 Second Assessment Report/SAR - IPCC (1995)
Source: Palembang City Environment and Sanitation Office (DLHK Palembang)
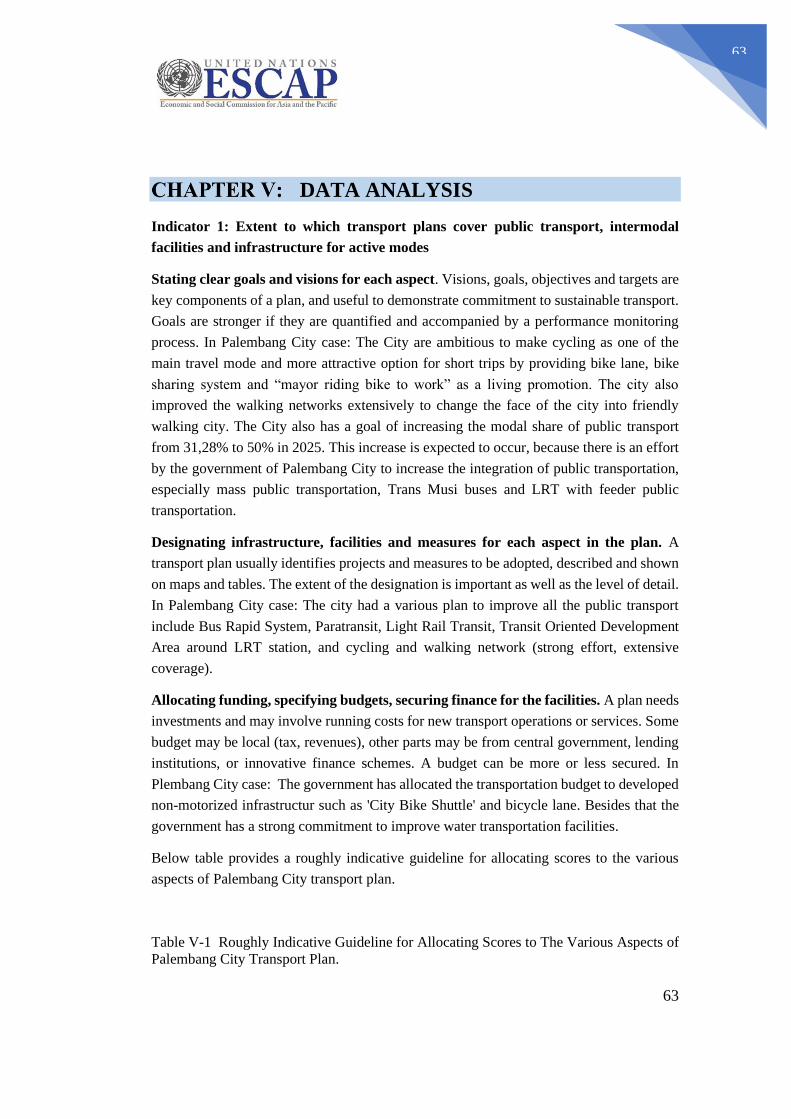
63
63
DATA ANALYSIS
Indicator 1: Extent to which transport plans cover public transport, intermodal
facilities and infrastructure for active modes
Stating clear goals and visions for each aspect. Visions, goals, objectives and targets are
key components of a plan, and useful to demonstrate commitment to sustainable transport.
Goals are stronger if they are quantified and accompanied by a performance monitoring
process. In Palembang City case: The City are ambitious to make cycling as one of the
main travel mode and more attractive option for short trips by providing bike lane, bike
sharing system and “mayor riding bike to work” as a living promotion. The city also
improved the walking networks extensively to change the face of the city into friendly
walking city. The City also has a goal of increasing the modal share of public transport
from 31,28% to 50% in 2025. This increase is expected to occur, because there is an effort
by the government of Palembang City to increase the integration of public transportation,
especially mass public transportation, Trans Musi buses and LRT with feeder public
transportation.
Designating infrastructure, facilities and measures for each aspect in the plan. A
transport plan usually identifies projects and measures to be adopted, described and shown
on maps and tables. The extent of the designation is important as well as the level of detail.
In Palembang City case: The city had a various plan to improve all the public transport
include Bus Rapid System, Paratransit, Light Rail Transit, Transit Oriented Development
Area around LRT station, and cycling and walking network (strong effort, extensive
coverage).
Allocating funding, specifying budgets, securing finance for the facilities. A plan needs
investments and may involve running costs for new transport operations or services. Some
budget may be local (tax, revenues), other parts may be from central government, lending
institutions, or innovative finance schemes. A budget can be more or less secured. In
Plembang City case: The government has allocated the transportation budget to developed
non-motorized infrastructur such as 'City Bike Shuttle' and bicycle lane. Besides that the
government has a strong commitment to improve water transportation facilities.
Below table provides a roughly indicative guideline for allocating scores to the various
aspects of Palembang City transport plan.
Table V-1 Roughly Indicative Guideline for Allocating Scores to The Various Aspects of
Palembang City Transport Plan.
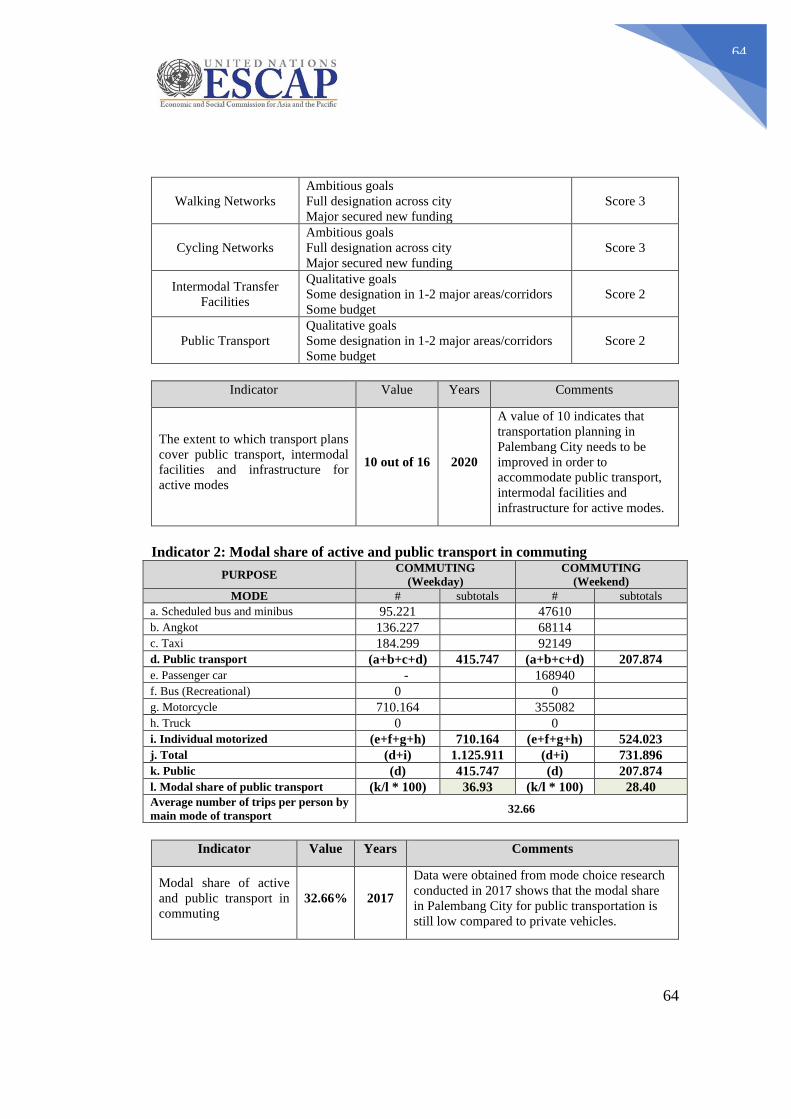
64
64
Walking Networks
Ambitious goals
Full designation across city
Major secured new funding
Score 3
Cycling Networks
Ambitious goals
Full designation across city
Major secured new funding
Score 3
Intermodal Transfer
Facilities
Qualitative goals
Some designation in 1-2 major areas/corridors
Some budget
Score 2
Public Transport
Qualitative goals
Some designation in 1-2 major areas/corridors
Some budget
Score 2
Indicator Value Years Comments
The extent to which transport plans
cover public transport, intermodal
facilities and infrastructure for
active modes
10 out of 16 2020
A value of 10 indicates that
transportation planning in
Palembang City needs to be
improved in order to
accommodate public transport,
intermodal facilities and
infrastructure for active modes.
Indicator 2: Modal share of active and public transport in commuting
PURPOSE COMMUTING
(Weekday)
COMMUTING
(Weekend)
MODE # subtotals # subtotals
a. Scheduled bus and minibus 95.221 47610
b. Angkot 136.227 68114
c. Taxi 184.299 92149
d. Public transport (a+b+c+d) 415.747 (a+b+c+d) 207.874
e. Passenger car - 168940
f. Bus (Recreational) 0 0
g. Motorcycle 710.164 355082
h. Truck 0 0
i. Individual motorized (e+f+g+h) 710.164 (e+f+g+h) 524.023
j. Total (d+i) 1.125.911 (d+i) 731.896
k. Public (d) 415.747 (d) 207.874
l. Modal share of public transport (k/l * 100) 36.93 (k/l * 100) 28.40 Average number of trips per person by
main mode of transport 32.66
Indicator Value Years Comments
Modal share of active
and public transport in
commuting
32.66% 2017
Data were obtained from mode choice research
conducted in 2017 shows that the modal share
in Palembang City for public transportation is
still low compared to private vehicles.
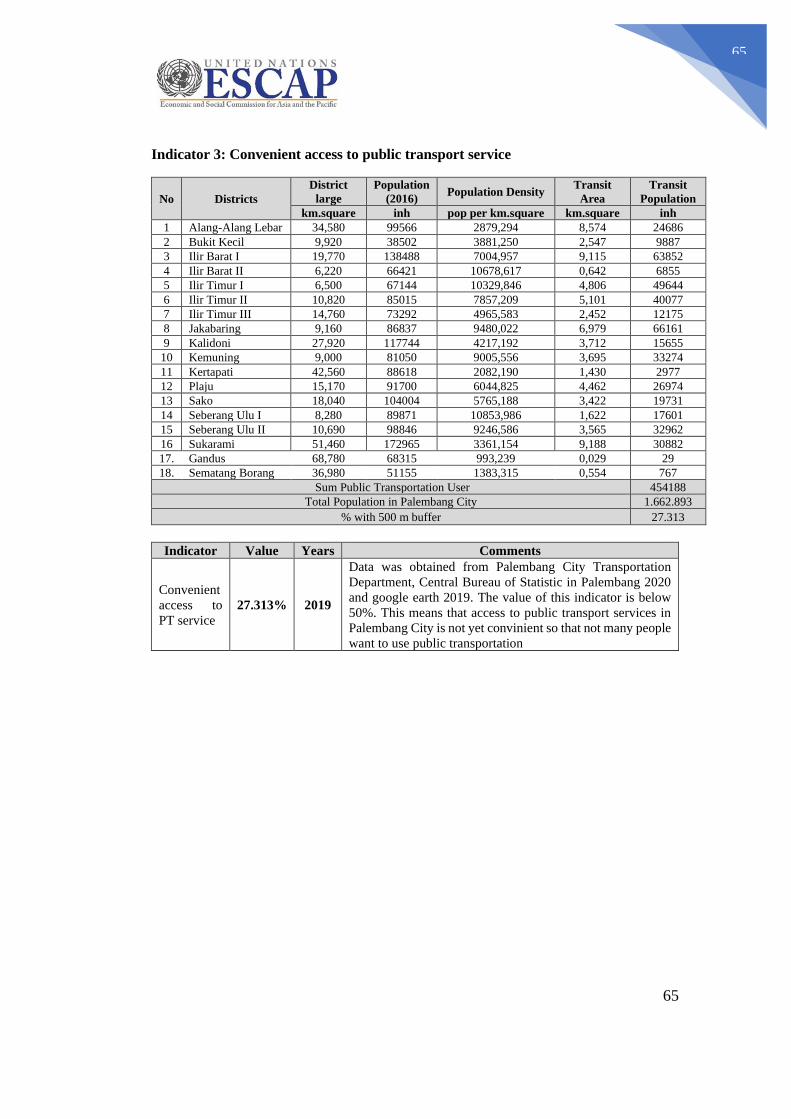
65
65
Indicator 3: Convenient access to public transport service
No Districts
District
large
Population
(2016) Population Density
Transit
Area
Transit
Population
km.square inh pop per km.square km.square inh
1 Alang-Alang Lebar 34,580 99566 2879,294 8,574 24686
2 Bukit Kecil 9,920 38502 3881,250 2,547 9887
3 Ilir Barat I 19,770 138488 7004,957 9,115 63852
4 Ilir Barat II 6,220 66421 10678,617 0,642 6855
5 Ilir Timur I 6,500 67144 10329,846 4,806 49644
6 Ilir Timur II 10,820 85015 7857,209 5,101 40077
7 Ilir Timur III 14,760 73292 4965,583 2,452 12175
8 Jakabaring 9,160 86837 9480,022 6,979 66161
9 Kalidoni 27,920 117744 4217,192 3,712 15655
10 Kemuning 9,000 81050 9005,556 3,695 33274
11 Kertapati 42,560 88618 2082,190 1,430 2977
12 Plaju 15,170 91700 6044,825 4,462 26974
13 Sako 18,040 104004 5765,188 3,422 19731
14 Seberang Ulu I 8,280 89871 10853,986 1,622 17601
15 Seberang Ulu II 10,690 98846 9246,586 3,565 32962
16 Sukarami 51,460 172965 3361,154 9,188 30882
17. Gandus 68,780 68315 993,239 0,029 29
18. Sematang Borang 36,980 51155 1383,315 0,554 767
Sum Public Transportation User 454188
Total Population in Palembang City 1.662.893
% with 500 m buffer 27.313
Indicator Value Years Comments
Convenient
access to
PT service
27.313% 2019
Data was obtained from Palembang City Transportation
Department, Central Bureau of Statistic in Palembang 2020
and google earth 2019. The value of this indicator is below
50%. This means that access to public transport services in
Palembang City is not yet convinient so that not many people
want to use public transportation
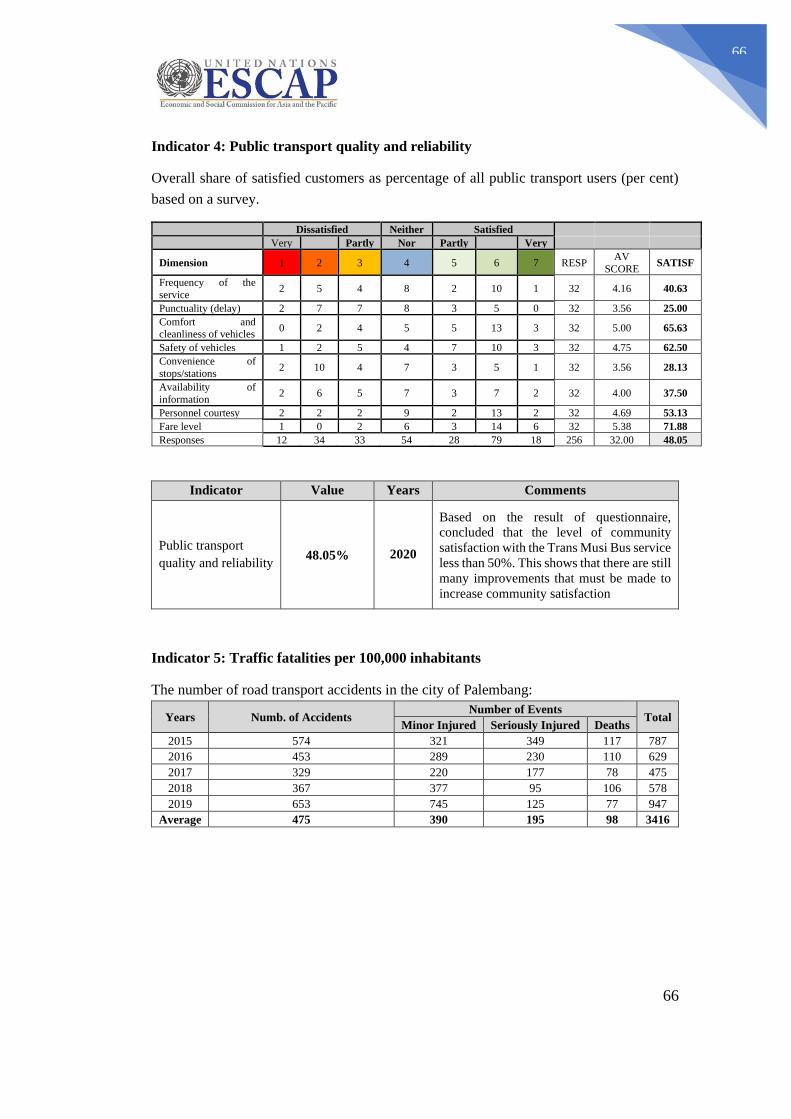
66
66
Indicator 4: Public transport quality and reliability
Overall share of satisfied customers as percentage of all public transport users (per cent)
based on a survey.
Dissatisfied Neither Satisfied
Very Partly Nor Partly Very
Dimension 1 2 3 4 5 6 7 RESP AV
SCORE SATISF
Frequency of the
service 2 5 4 8 2 10 1 32 4.16 40.63
Punctuality (delay) 2 7 7 8 3 5 0 32 3.56 25.00
Comfort and cleanliness of vehicles
0 2 4 5 5 13 3 32 5.00 65.63
Safety of vehicles 1 2 5 4 7 10 3 32 4.75 62.50
Convenience of
stops/stations 2 10 4 7 3 5 1 32 3.56 28.13
Availability of
information 2 6 5 7 3 7 2 32 4.00 37.50
Personnel courtesy 2 2 2 9 2 13 2 32 4.69 53.13
Fare level 1 0 2 6 3 14 6 32 5.38 71.88
Responses 12 34 33 54 28 79 18 256 32.00 48.05
Indicator Value Years Comments
Public transport
quality and reliability 48.05% 2020
Based on the result of questionnaire,
concluded that the level of community
satisfaction with the Trans Musi Bus service
less than 50%. This shows that there are still
many improvements that must be made to
increase community satisfaction
Indicator 5: Traffic fatalities per 100,000 inhabitants
The number of road transport accidents in the city of Palembang:
Years Numb. of Accidents Number of Events
Total Minor Injured Seriously Injured Deaths
2015 574 321 349 117 787
2016 453 289 230 110 629
2017 329 220 177 78 475
2018 367 377 95 106 578
2019 653 745 125 77 947
Average 475 390 195 98 3416
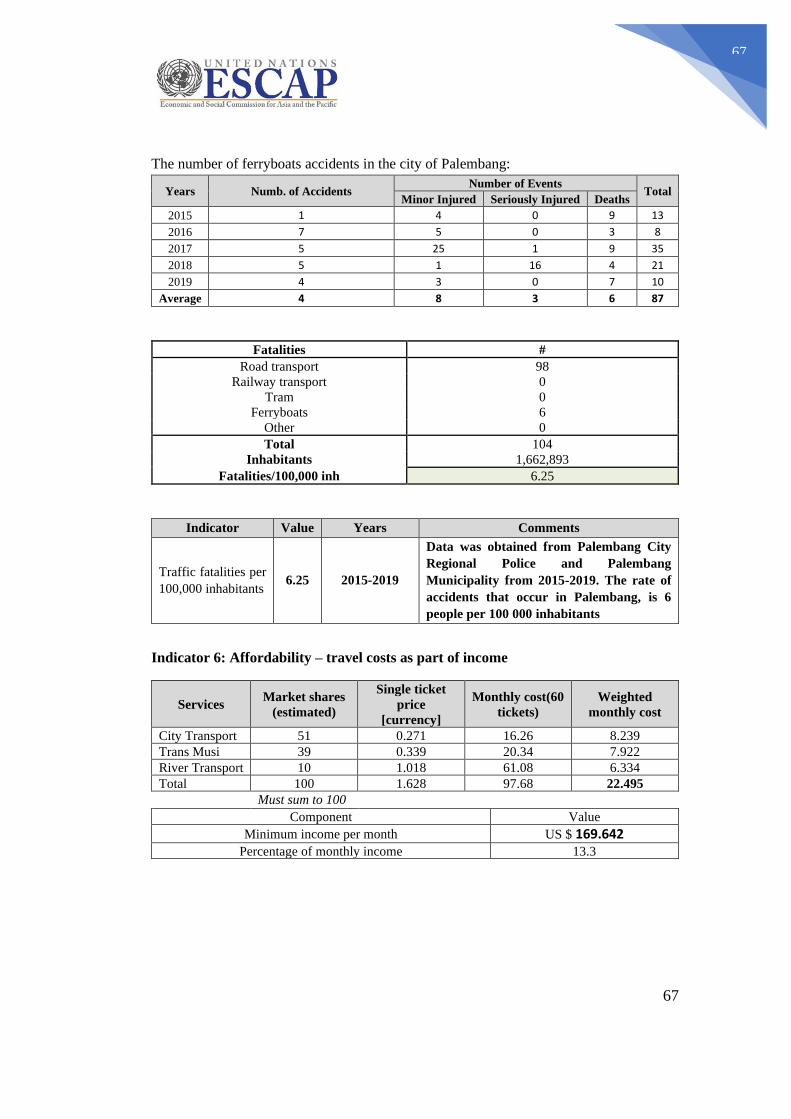
67
67
The number of ferryboats accidents in the city of Palembang:
Years Numb. of Accidents Number of Events
Total Minor Injured Seriously Injured Deaths
2015 1 4 0 9 13
2016 7 5 0 3 8
2017 5 25 1 9 35
2018 5 1 16 4 21
2019 4 3 0 7 10
Average 4 8 3 6 87
Fatalities #
Road transport 98
Railway transport 0
Tram 0
Ferryboats 6
Other 0
Total 104
Inhabitants 1,662,893
Fatalities/100,000 inh 6.25
Indicator Value Years Comments
Traffic fatalities per
100,000 inhabitants 6.25 2015-2019
Data was obtained from Palembang City
Regional Police and Palembang
Municipality from 2015-2019. The rate of
accidents that occur in Palembang, is 6
people per 100 000 inhabitants
Indicator 6: Affordability – travel costs as part of income
Services Market shares
(estimated)
Single ticket
price
[currency]
Monthly cost(60
tickets)
Weighted
monthly cost
City Transport 51 0.271 16.26 8.239
Trans Musi 39 0.339 20.34 7.922
River Transport 10 1.018 61.08 6.334
Total 100 1.628 97.68 22.495
Must sum to 100 Component Value
Minimum income per month US $ 169.642
Percentage of monthly income 13.3
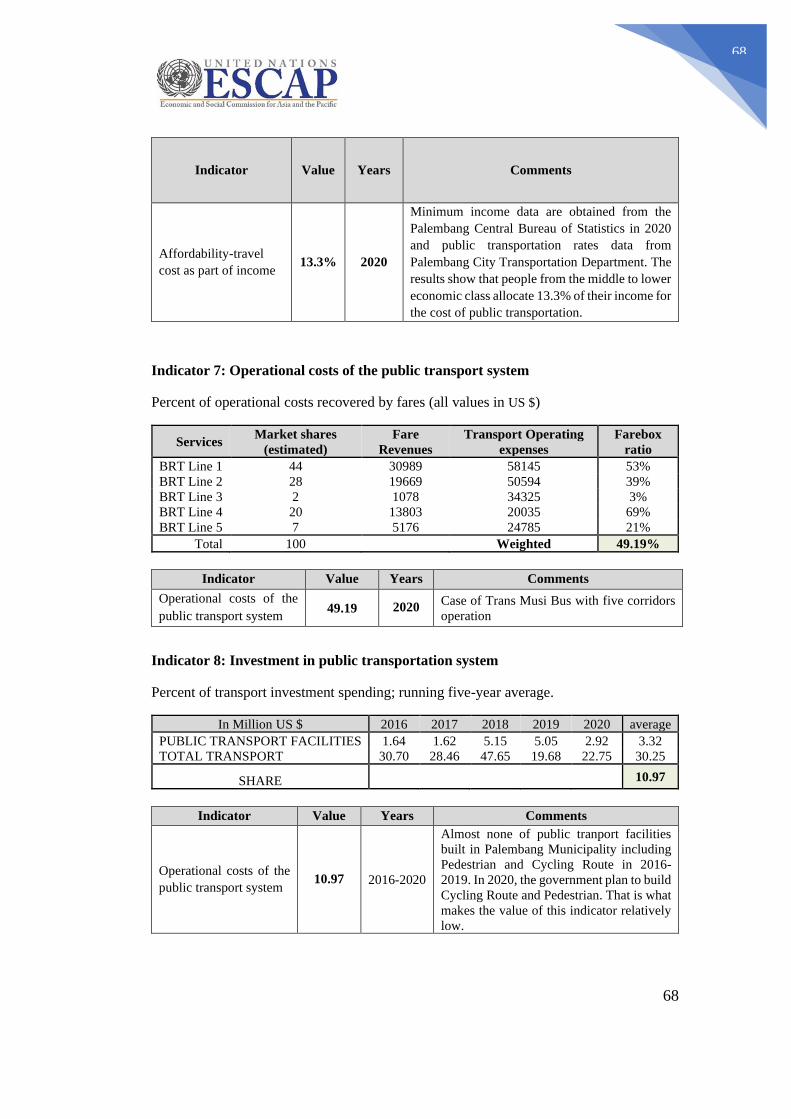
68
68
Indicator Value Years Comments
Affordability-travel
cost as part of income 13.3% 2020
Minimum income data are obtained from the
Palembang Central Bureau of Statistics in 2020
and public transportation rates data from
Palembang City Transportation Department. The
results show that people from the middle to lower
economic class allocate 13.3% of their income for
the cost of public transportation.
Indicator 7: Operational costs of the public transport system
Percent of operational costs recovered by fares (all values in US $)
Services Market shares
(estimated)
Fare
Revenues
Transport Operating
expenses
Farebox
ratio
BRT Line 1 44 30989 58145 53%
BRT Line 2 28 19669 50594 39%
BRT Line 3 2 1078 34325 3%
BRT Line 4 20 13803 20035 69%
BRT Line 5 7 5176 24785 21%
Total 100 Weighted 49.19%
Indicator Value Years Comments
Operational costs of the
public transport system 49.19 2020
Case of Trans Musi Bus with five corridors
operation
Indicator 8: Investment in public transportation system
Percent of transport investment spending; running five-year average.
In Million US $ 2016 2017 2018 2019 2020 average
PUBLIC TRANSPORT FACILITIES 1.64 1.62 5.15 5.05 2.92 3.32
TOTAL TRANSPORT 30.70 28.46 47.65 19.68 22.75 30.25
SHARE 10.97
Indicator Value Years Comments
Operational costs of the
public transport system 10.97 2016-2020
Almost none of public tranport facilities
built in Palembang Municipality including
Pedestrian and Cycling Route in 2016-
2019. In 2020, the government plan to build
Cycling Route and Pedestrian. That is what
makes the value of this indicator relatively
low.
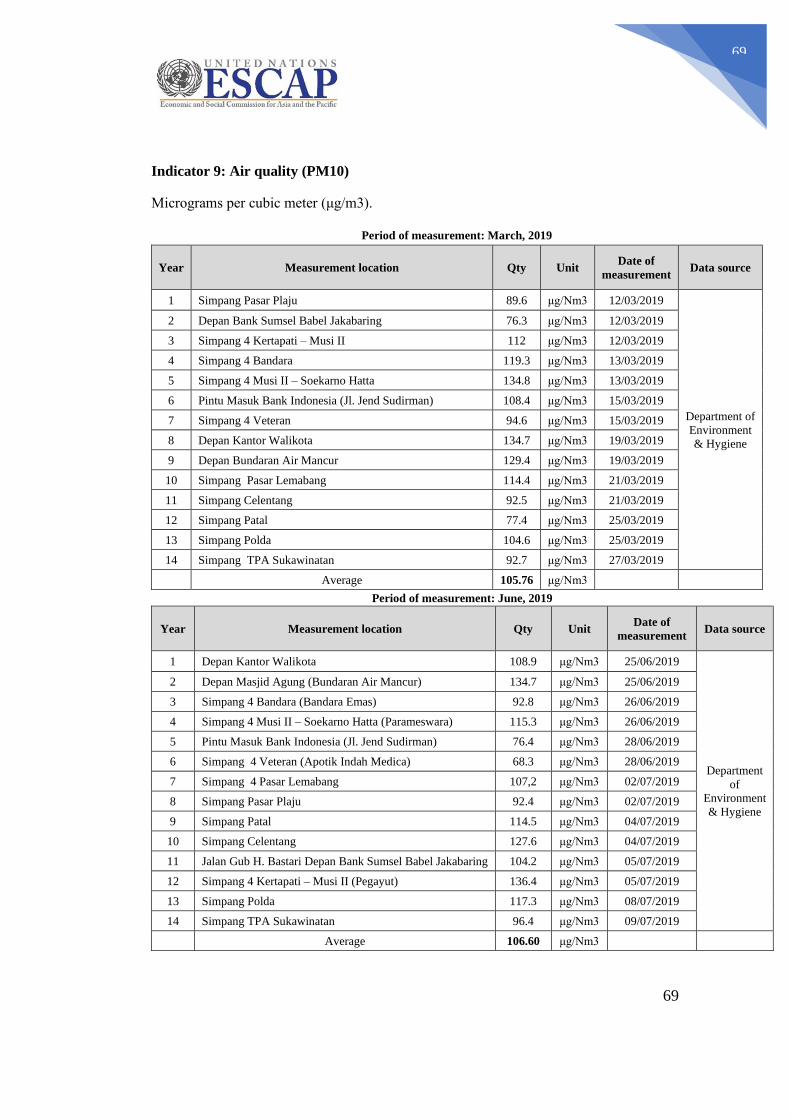
69
69
Indicator 9: Air quality (PM10)
Micrograms per cubic meter (μg/m3).
Period of measurement: March, 2019
Year Measurement location Qty Unit Date of
measurement Data source
1 Simpang Pasar Plaju 89.6 μg/Nm3 12/03/2019
Department of
Environment
& Hygiene
2 Depan Bank Sumsel Babel Jakabaring 76.3 μg/Nm3 12/03/2019
3 Simpang 4 Kertapati – Musi II 112 μg/Nm3 12/03/2019
4 Simpang 4 Bandara 119.3 μg/Nm3 13/03/2019
5 Simpang 4 Musi II – Soekarno Hatta 134.8 μg/Nm3 13/03/2019
6 Pintu Masuk Bank Indonesia (Jl. Jend Sudirman) 108.4 μg/Nm3 15/03/2019
7 Simpang 4 Veteran 94.6 μg/Nm3 15/03/2019
8 Depan Kantor Walikota 134.7 μg/Nm3 19/03/2019
9 Depan Bundaran Air Mancur 129.4 μg/Nm3 19/03/2019
10 Simpang Pasar Lemabang 114.4 μg/Nm3 21/03/2019
11 Simpang Celentang 92.5 μg/Nm3 21/03/2019
12 Simpang Patal 77.4 μg/Nm3 25/03/2019
13 Simpang Polda 104.6 μg/Nm3 25/03/2019
14 Simpang TPA Sukawinatan 92.7 μg/Nm3 27/03/2019
Average 105.76 μg/Nm3
Period of measurement: June, 2019
Year Measurement location Qty Unit Date of
measurement Data source
1 Depan Kantor Walikota 108.9 μg/Nm3 25/06/2019
Department
of
Environment
& Hygiene
2 Depan Masjid Agung (Bundaran Air Mancur) 134.7 μg/Nm3 25/06/2019
3 Simpang 4 Bandara (Bandara Emas) 92.8 μg/Nm3 26/06/2019
4 Simpang 4 Musi II – Soekarno Hatta (Parameswara) 115.3 μg/Nm3 26/06/2019
5 Pintu Masuk Bank Indonesia (Jl. Jend Sudirman) 76.4 μg/Nm3 28/06/2019
6 Simpang 4 Veteran (Apotik Indah Medica) 68.3 μg/Nm3 28/06/2019
7 Simpang 4 Pasar Lemabang 107,2 μg/Nm3 02/07/2019
8 Simpang Pasar Plaju 92.4 μg/Nm3 02/07/2019
9 Simpang Patal 114.5 μg/Nm3 04/07/2019
10 Simpang Celentang 127.6 μg/Nm3 04/07/2019
11 Jalan Gub H. Bastari Depan Bank Sumsel Babel Jakabaring 104.2 μg/Nm3 05/07/2019
12 Simpang 4 Kertapati – Musi II (Pegayut) 136.4 μg/Nm3 05/07/2019
13 Simpang Polda 117.3 μg/Nm3 08/07/2019
14 Simpang TPA Sukawinatan 96.4 μg/Nm3 09/07/2019
Average 106.60 μg/Nm3
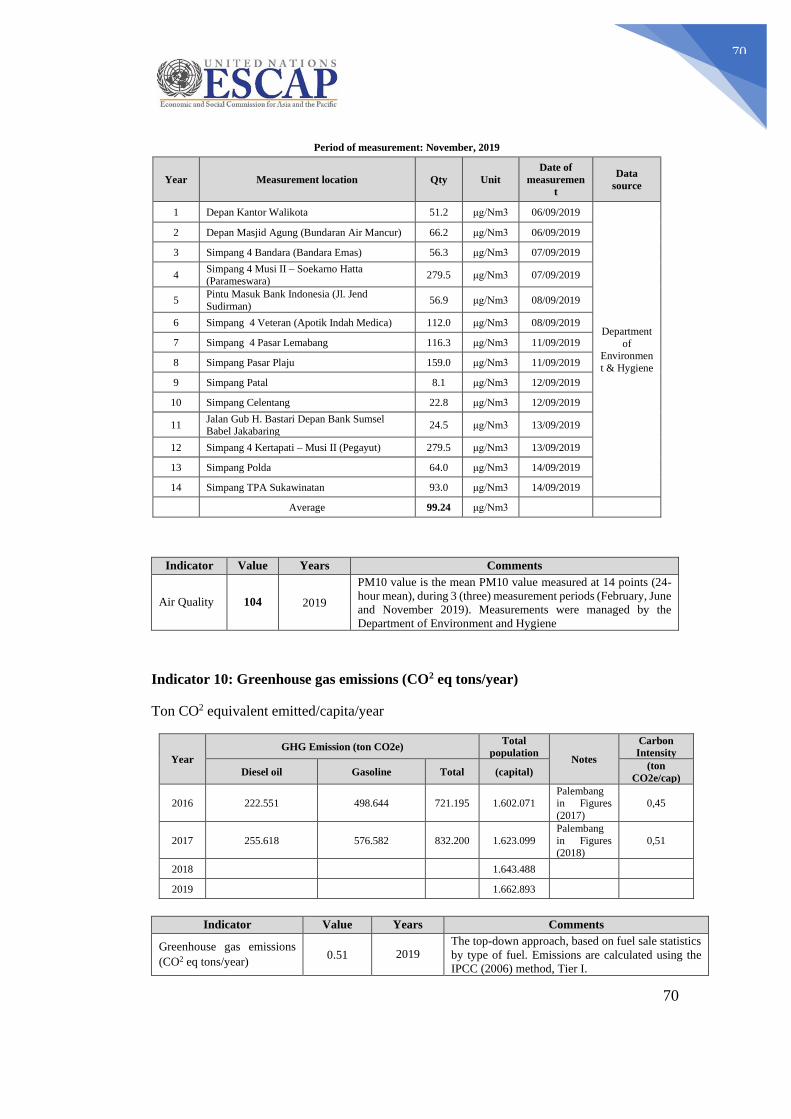
70
70
Period of measurement: November, 2019
Year Measurement location Qty Unit
Date of
measuremen
t
Data
source
1 Depan Kantor Walikota 51.2 μg/Nm3 06/09/2019
Department
of Environmen
t & Hygiene
2 Depan Masjid Agung (Bundaran Air Mancur) 66.2 μg/Nm3 06/09/2019
3 Simpang 4 Bandara (Bandara Emas) 56.3 μg/Nm3 07/09/2019
4 Simpang 4 Musi II – Soekarno Hatta (Parameswara)
279.5 μg/Nm3 07/09/2019
5 Pintu Masuk Bank Indonesia (Jl. Jend
Sudirman) 56.9 μg/Nm3 08/09/2019
6 Simpang 4 Veteran (Apotik Indah Medica) 112.0 μg/Nm3 08/09/2019
7 Simpang 4 Pasar Lemabang 116.3 μg/Nm3 11/09/2019
8 Simpang Pasar Plaju 159.0 μg/Nm3 11/09/2019
9 Simpang Patal 8.1 μg/Nm3 12/09/2019
10 Simpang Celentang 22.8 μg/Nm3 12/09/2019
11 Jalan Gub H. Bastari Depan Bank Sumsel Babel Jakabaring
24.5 μg/Nm3 13/09/2019
12 Simpang 4 Kertapati – Musi II (Pegayut) 279.5 μg/Nm3 13/09/2019
13 Simpang Polda 64.0 μg/Nm3 14/09/2019
14 Simpang TPA Sukawinatan 93.0 μg/Nm3 14/09/2019
Average 99.24 μg/Nm3
Indicator Value Years Comments
Air Quality 104 2019
PM10 value is the mean PM10 value measured at 14 points (24-
hour mean), during 3 (three) measurement periods (February, June
and November 2019). Measurements were managed by the
Department of Environment and Hygiene
Indicator 10: Greenhouse gas emissions (CO2 eq tons/year)
Ton CO2 equivalent emitted/capita/year
Year
GHG Emission (ton CO2e) Total
population Notes
Carbon
Intensity
Diesel oil Gasoline Total (capital) (ton
CO2e/cap)
2016 222.551 498.644 721.195 1.602.071 Palembang in Figures
(2017)
0,45
2017 255.618 576.582 832.200 1.623.099
Palembang
in Figures (2018)
0,51
2018 1.643.488
2019 1.662.893
Indicator Value Years Comments
Greenhouse gas emissions
(CO2 eq tons/year) 0.51 2019
The top-down approach, based on fuel sale statistics
by type of fuel. Emissions are calculated using the
IPCC (2006) method, Tier I.
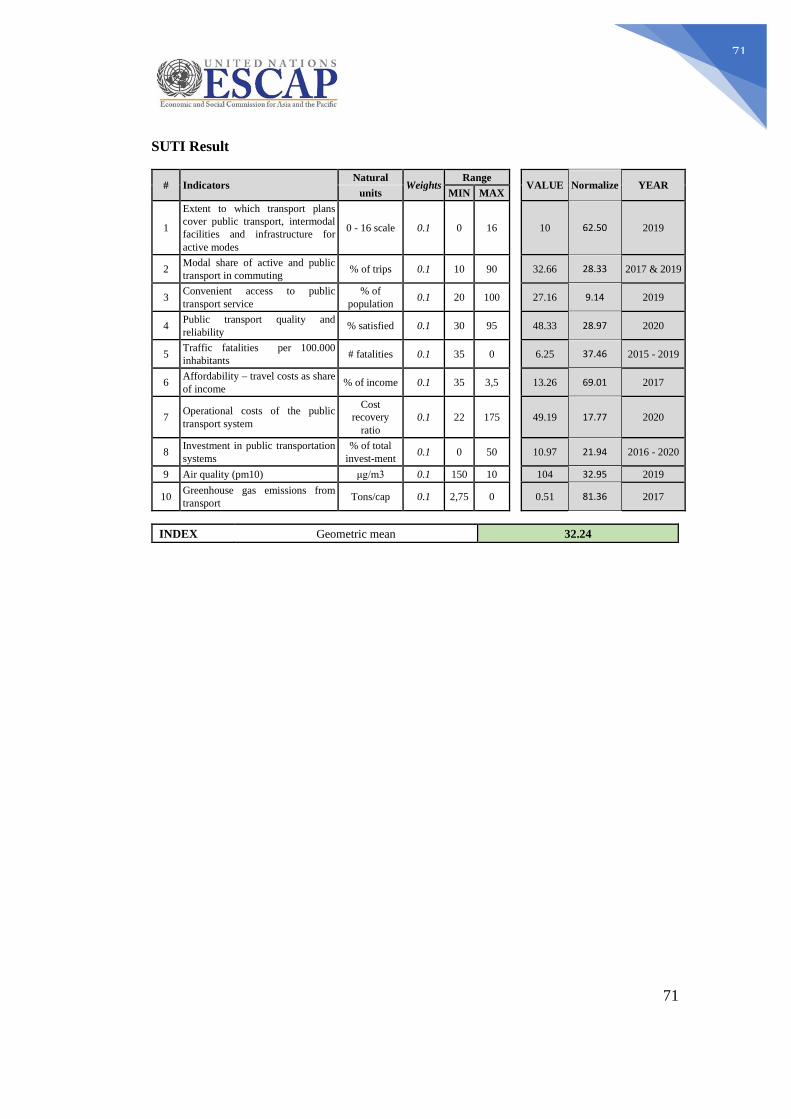
71
71
SUTI Result
# Indicators Natural
Weights Range VALUE Normalize YEAR
units MIN MAX
1
Extent to which transport plans
cover public transport, intermodal
facilities and infrastructure for
active modes
0 - 16 scale 0.1 0 16
10 62.50 2019
2 Modal share of active and public
transport in commuting % of trips 0.1 10 90
32.66 28.33 2017 & 2019
3 Convenient access to public
transport service
% of
population 0.1 20 100
27.16 9.14 2019
4 Public transport quality and
reliability % satisfied 0.1 30 95
48.33 28.97 2020
5 Traffic fatalities per 100.000
inhabitants # fatalities 0.1 35 0
6.25 37.46 2015 - 2019
6 Affordability – travel costs as share
of income % of income 0.1 35 3,5
13.26 69.01 2017
7 Operational costs of the public
transport system
Cost
recovery
ratio
0.1 22 175
49.19 17.77 2020
8 Investment in public transportation
systems
% of total
invest-ment 0.1 0 50
10.97 21.94 2016 - 2020
9 Air quality (pm10) μg/m3 0.1 150 10 104 32.95 2019
10 Greenhouse gas emissions from
transport Tons/cap 0.1 2,75 0
0.51 81.36 2017
INDEX Geometric mean 32.24
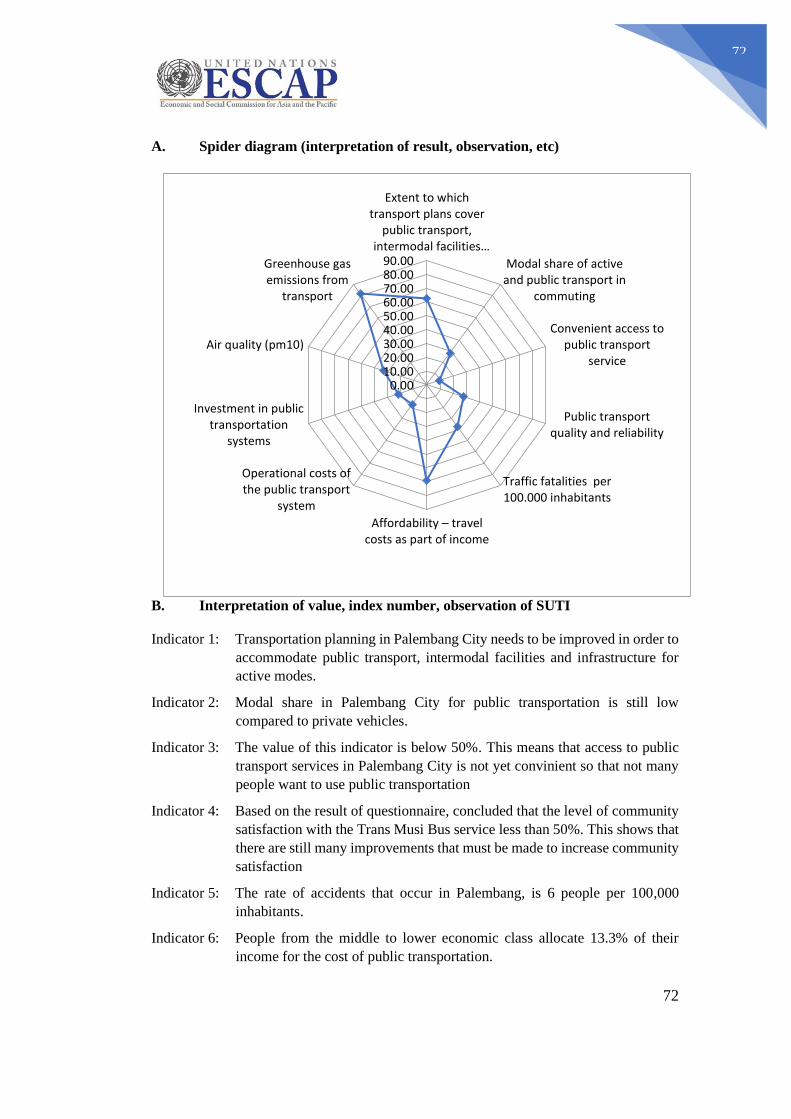
72
72
A. Spider diagram (interpretation of result, observation, etc)
B. Interpretation of value, index number, observation of SUTI
Indicator 1: Transportation planning in Palembang City needs to be improved in order to
accommodate public transport, intermodal facilities and infrastructure for
active modes.
Indicator 2: Modal share in Palembang City for public transportation is still low
compared to private vehicles.
Indicator 3: The value of this indicator is below 50%. This means that access to public
transport services in Palembang City is not yet convinient so that not many
people want to use public transportation
Indicator 4: Based on the result of questionnaire, concluded that the level of community
satisfaction with the Trans Musi Bus service less than 50%. This shows that
there are still many improvements that must be made to increase community
satisfaction
Indicator 5: The rate of accidents that occur in Palembang, is 6 people per 100,000
inhabitants.
Indicator 6: People from the middle to lower economic class allocate 13.3% of their
income for the cost of public transportation.
0.0010.0020.0030.0040.0050.0060.0070.0080.0090.00
Extent to whichtransport plans cover
public transport,intermodal facilities…
Modal share of activeand public transport in
commuting
Convenient access topublic transport
service
Public transportquality and reliability
Traffic fatalities per100.000 inhabitants
Affordability – travel costs as part of income
Operational costs ofthe public transport
system
Investment in publictransportation
systems
Air quality (pm10)
Greenhouse gasemissions from
transport
73
73
Indicator 7: The fare box ratio is below 100 therefore the government need to subsidize
Indicator 8: Almost none of public transport facilities built in Palembang Municipality
including pedestrian and cycling route in 2016-2019. In 2020, the
government plan to build cycling route and pedestrian facilities. That is what
makes the value of this indicator relatively low.
Indicator 9: PM10 value is the mean PM10 value measured at 14 points (24-hour mean),
during 3 (three) measurement periods (February, June and November 2019).
Measurements were managed by the Department of Environment and
Hygiene
Indicator 10: The top-down approach, based on fuel sale statistics by type of fuel.
Emissions are calculated using the IPCC (2006) method, Tier I.
C. Suggestion for urban transport improvement in the city
The SUTI result for each indicator show that the city still needs to improve and
emphasizing to:
• Improve the integration transfer facilities between public transport mode while also
providing more convenient access that can widen the coverage of public transport,
• Improve public transportation system by increasing the performance of the existing
public transport and introduce new public transport system, hopefully these efforts
could increase mode share in public transport, a good promotion or mobility
management in order to encourage the society to shift from private to public
transport modes,
• Reform the operation, the government need to develop a better system in running
the public transport therefore the farebox ratio will become higher and less
subsidized,
Palembang City would like to propose the SUTI Index system can be used for Medium
Term Development Plan 2025-2030.
74
74
IMPACTS OF COVID-19 SITUATION
ON PUBLIC TRANSPORT AND
RESPONSE
Positive case of COVID-19 in Indonesia was first detected on March 2, 2020, when two
people were confirmed to be infected by foreigner. As of April 9, the pandemic has spread
to 34 provinces with DKI Jakarta, East Java and West Java as the most exposed province
of corona virus infection in Indonesia.
The first three positive cases of COVID-19 were detected in South Sumatra Province on
March 24, 2020, the three patients were travelled from Jakarta. Until March 31, 2020, South
Sumatra still an infected area because there was no local transmission. The latest positive
case of COVID-19 infected a resident of Ogan Komering Ulu Regency, on March 31, 2020,
HS (62) who was known to have just returned from Jakarta and Bogor City. The positive
case was import cases, are obtained overseas. Previously, the first case of the COVID-19
corona infected a Palembang City resident, JS (54) who was known to have a travel history
from Jakarta City, then the second case infected E (54) was a medical worker in Prabumulih
City who was also known to have a history from Jakarta and Batam City. However, both
of them tested positive for COVID-19 one day after passing away at the Muhammad
Hoesin Central General Hospital (RSMH) Palembang on March 23, 2020. Meanwhile, HS
(62) tested positive for COVID-19 on March 30, 2020 based on the results of the
examination by the Central Laboratory of the Laboratory. Health (BBLK) Palembang.
In the first period of Large-Scale Social Restrictions Implementations, Palembang was
implemented Large-Scale Social Restrictions started from 21 May 2020 to 2 June 2020.
Because the transmission rate of the COVID-19 virus in Palembang had not yet reached
0.5 percent, the implementation of the Large-Scale Social Restrictions was again extended.
Start from 3 June 2020 to 16 June 2020.
Through the Traffic Unit, Palembang City Resort Police assesses that the COVID-19
pandemic has also affected traffic problems in Palembang City. During 2020 the trouble
spot or traffic problems in Palembang City have decreased, considering that since the
beginning of 2020, many activities have been restricted, such as offices, schools and others.
75
75
So that impact the number of road users who usually fill the highway. Based on survey
conducted, the traffic volume including public transportation decreased to 50%.
Based on regulation number 18, 2020 of Minister of Transportation or known as PM 18,
will be implemented on driving rules used in Palembang City during Large-Scale Social
Restrictions (PSBB). Minister of Transportation Regulation Number 18 is a regulation
launched by the Minister of Transportation Ad Interim Luhut Binsar Pandjaitan which has
been implemented in DKI Jakarta City previously under Large-Scale Social Restriction
status. The regulation regulates a community transformation model that can be applied
during the COVID-19 pandemic, especially for cities with Large- Scale Social Restriction
status. One of the directions related to the implementation of PM 18 is that vehicles have a
limit on the people to be transported and also there is a prohibition on online transportations
such as online taxis ride and online motorcycle ride to be operated during this status based
on these rules. The Transportation Agency will also do check the operations in various city
center points to implement driving rules during the Large-Scale Social Restrictions Status
in Palembang City at some check point locations.
One of mass transportation modes that is affected by the effects of the COVID-19 is Light
Rail Transit (LRT) in Palembang City. The number of Sumatera Selatan LRT trips in
December 2019 had increased. It is stated that there are 88 trips with 11,000 average of
passengers per day. In this current situation, the number of LRT passengers a day is around
450 to 500 passengers a day with only 22 trips. Therefore, during this pandemic, PT KAI
implemented several new policies to adjust to the new normal situation in the middle of the
COVID-19 pandemic, so that people using LRT can travel safely and comfortably. The
Light Rail Manager, PT KAI Divre III Palembang, South Sumatra, has adjusted the
operating hours to support the implementation of a new normal life order in the middle of
the COVID-19 pandemic. LRT operating hours on June 8, 2020 onwards will be adjusted
to be earlier, started from (06.53 WIB to 15.41 WIB) from the previous operating hours
(08.39 to 17.27 WIB). The operating hours changes was made to implement the European
Train Control System (ETCS), which in turn will improve the timeliness and safety of LRT
train trips. PT KAI will also follow directions given by the regional and central
governments to implement the Health protocol, as a precaution for the COVID-19 virus PT
KAI has sprayed and washed LRT using disinfectants, enforced social and physical
76
76
distancing, reduced operating hours, and health protocols while in stations and LRT such
as the uses face shield on frontliners officers and mask wearing requirement of passengers
and workers in the LRT station environment and on the LRT train.
On the other hand, based on data released by South Sumatera Central Bureau Statistics, sea
transport passengers during that period were recorded at zero. Meanwhile for air freight,
only 141 international flight passengers and 20,910 passengers for domestic flight. As for
rail transportation passenger, it was recorded as zero in May 2020, meanwhile the previous
month only 14,786 passengers. The COVID-19 pandemic had resulted no operation of sea
and rail transport. Meanwhile for air transportation there is a closure of flight access in
April 2020. The number of passengers from the 3 main sector of transportation, namely
Sultan Mahmud Badaruddin International Airport (SMB) II Palembang, Boom Baru Port
Palembang and Kertapati Station Palembang. The closure of access for passengers in the 3
modes of transportation as a manager's effort to reduce the spread of COVID-19.
The following are suggestions and input for the Palembang City Government in
overcoming the impact of COVID-19 on public transportation:
1. Provide stimulus and subsidies to public transport companies, including online
transportation because if the subsidies are not provided it can have an impact on
the welfare of transportation crews who depend on operating income and lead the
company to bankrupt.
2. Implement health protocols in each public transport sector such as prepare the wash
basin, implement disinfectant spraying, mandatory of using mask, and social
distancing in order to be able operating as normal.
3. Campaign to use public transportation with a safe and convenient systems with
implement trust-enhancing health protocols people in using public transportation.
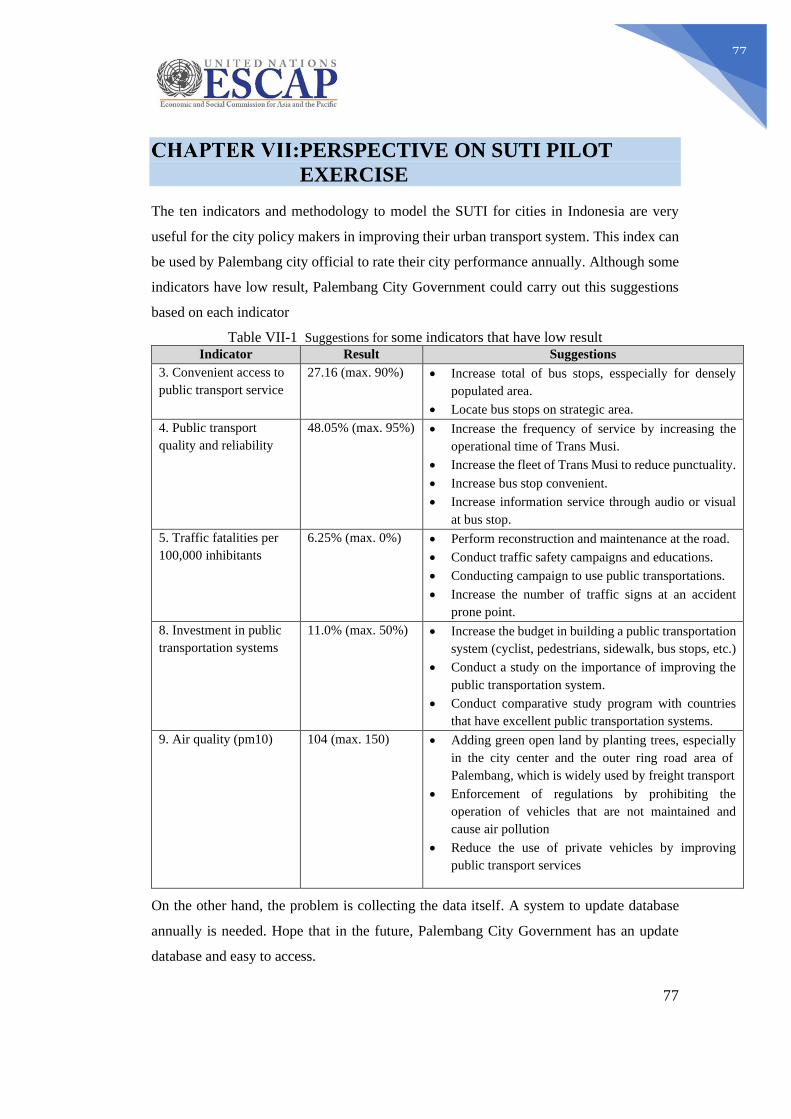
77
77
PERSPECTIVE ON SUTI PILOT
EXERCISE
The ten indicators and methodology to model the SUTI for cities in Indonesia are very
useful for the city policy makers in improving their urban transport system. This index can
be used by Palembang city official to rate their city performance annually. Although some
indicators have low result, Palembang City Government could carry out this suggestions
based on each indicator
Table VII-1 Suggestions for some indicators that have low result Indicator Result Suggestions
3. Convenient access to
public transport service
27.16 (max. 90%) • Increase total of bus stops, esspecially for densely
populated area.
• Locate bus stops on strategic area.
4. Public transport
quality and reliability
48.05% (max. 95%) • Increase the frequency of service by increasing the
operational time of Trans Musi.
• Increase the fleet of Trans Musi to reduce punctuality.
• Increase bus stop convenient.
• Increase information service through audio or visual
at bus stop.
5. Traffic fatalities per
100,000 inhibitants
6.25% (max. 0%) • Perform reconstruction and maintenance at the road.
• Conduct traffic safety campaigns and educations.
• Conducting campaign to use public transportations.
• Increase the number of traffic signs at an accident
prone point.
8. Investment in public
transportation systems
11.0% (max. 50%) • Increase the budget in building a public transportation
system (cyclist, pedestrians, sidewalk, bus stops, etc.)
• Conduct a study on the importance of improving the
public transportation system.
• Conduct comparative study program with countries
that have excellent public transportation systems.
9. Air quality (pm10)
104 (max. 150)
• Adding green open land by planting trees, especially
in the city center and the outer ring road area of
Palembang, which is widely used by freight transport
• Enforcement of regulations by prohibiting the
operation of vehicles that are not maintained and
cause air pollution
• Reduce the use of private vehicles by improving
public transport services
On the other hand, the problem is collecting the data itself. A system to update database
annually is needed. Hope that in the future, Palembang City Government has an update
database and easy to access.
78
78
ANNEXURES

79
79
A.1: Experts and officials met
Dinas Perhubungan Kota Palembang
Jl. Pangeran Sido Ing Lautan 35 Ilir , Kota Palembang , Sumatera Selatan
Phone: (06711) 442547
Head of Agency: Agus Rizal, AP., M. Si
80
80
A.2. References
Arliansyah J. (2017) , The Effect Of Economic Social Status Factors Mode Choice
For working activity In Palembang, Proceeding of Matec Web Conference Vol
101, SICEST 2017.
Balai Pengelola Kereta Api Ringan Provinsi South Sumatera, 2020
Department of Transportation Palembang City, 2020
Minister of Public Work and Housing of the Republic of Indonesia, 2020
Palembang Central Bureau of Statistic , 2020
Police Resort of Palembang Municipality
Urban Planning Department of Palembang City, 2020
https://www.sonora.id/read/422368270/pandemi-covid-19-turut-berdampak-terhadap-
permasalahan-lalu-lintas-di-palembang?page=all
http://detak-palembang.com/2020/05/psbb-di-palembang-dishub-terapkan-aturan-
permenhub-18/
https://www.antaranews.com/berita/1541216/lrt-palembang-sesuaikan-jam-operasional-
hadapi-new-normal
https://palembang.kompas.com/read/2020/06/08/17120241/menuju-new-normal-jam-
operasi-lrt-palembang-dimajukan-lebih-pagi
Related Documents