Welcome message from author
This document is posted to help you gain knowledge. Please leave a comment to let me know what you think about it! Share it to your friends and learn new things together.
Transcript
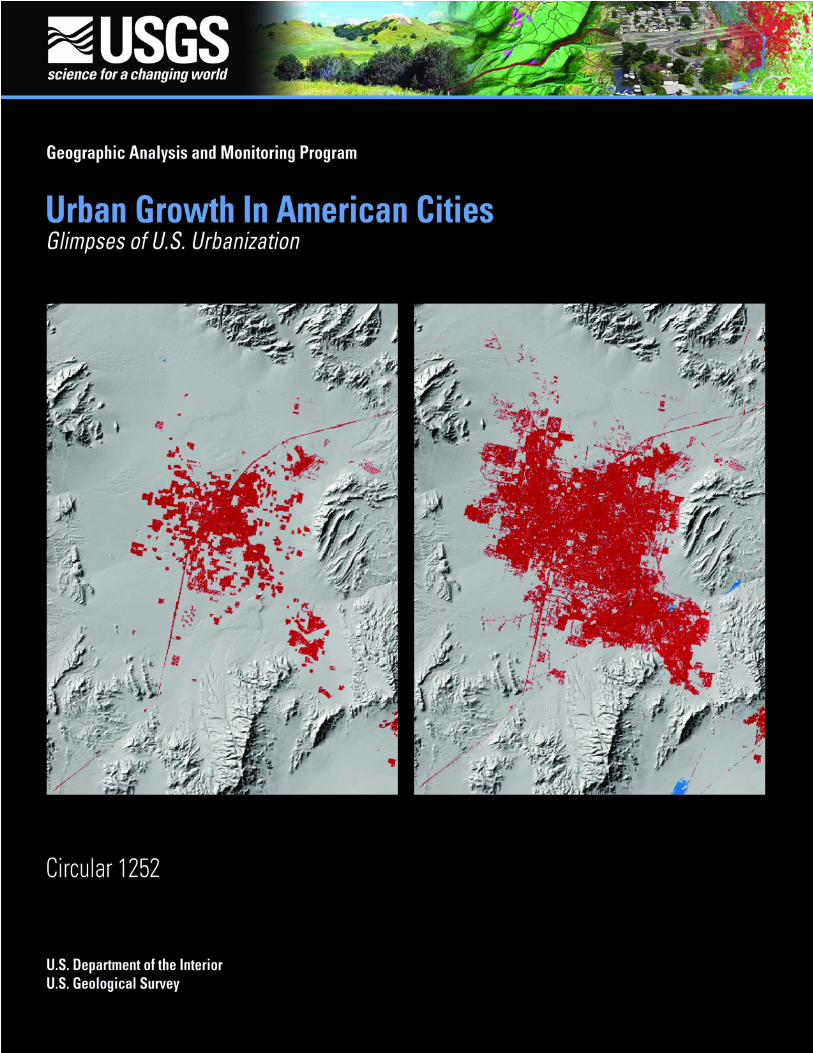

About the cover:
These two images of Las Vegas, Nevada, showurban extent as it was in 1973 and 1992. Betweenthese years, the urban area grew dramaticallythroughout the level basin. Visible in each imageare local landforms, such as the surrounding moun-tain ranges and Lake Meade. Read more about thegrowth of Las Vegas on pages 20 and 21.
Urban Growth in American CitiesGlimpses of U.S. Urbanization
U.S. Department of the InteriorU.S. Geological Survey
By Roger Auch1, Janis Taylor1, and William Acevedo2
January 2004
Circular 1252
1 SAIC TSSC, work performed under U.S. Geological Survey contract 03CRN001; Raytheon ITSS,work performed under U.S. Geological Survey contract 1434-CR-97-CN-40274.
2 U.S. Geological Survey
U.S. Department of the InteriorGale A. Norton, Secretary
U.S. Geological SurveyCharles G. Groat, Director
U.S. Geological Survey, EROS Data Center; 2003
Free on application to U.S. Geological Survey Information ServicesBox 25286, Denver Federal CenterDenver, CO 80225
For more information about the USGS and its productsTelephone: 1-888-ASK-USGSWorld Wide Web: http://www.usgs.gov
Any use of trade, product, or firm names in this publication is for descriptive purposes only and does not implyendorsement by the U.S. Government.
Although this report is the public domain, it contains copyrighted materials that are noted in the text. Permission toreproduce those items must be secured from the individual copyright owners.
iii
Table of Contents
Purpose and Introduction. . . . . . . . . . . . . . . . . . . . . . . . . . . . . . . . . . . . . . . . . . . . . . . . . . . . . . . . . . . . . . 1Growth of Urban Areas. . . . . . . . . . . . . . . . . . . . . . . . . . . . . . . . . . . . . . . . . . . . . . . . . . . . . . . . . . . . . . . . 2Locator Map . . . . . . . . . . . . . . . . . . . . . . . . . . . . . . . . . . . . . . . . . . . . . . . . . . . . . . . . . . . . . . . . . . . . . . . . . 8Historical Comparisons of Metropolitan Regions
Atlanta, Georgia . . . . . . . . . . . . . . . . . . . . . . . . . . . . . . . . . . . . . . . . . . . . . . . . . . . . . . . . . . . . . . . . 10Boston, Massachusetts . . . . . . . . . . . . . . . . . . . . . . . . . . . . . . . . . . . . . . . . . . . . . . . . . . . . . . . . . 12Chicago, Illinois . . . . . . . . . . . . . . . . . . . . . . . . . . . . . . . . . . . . . . . . . . . . . . . . . . . . . . . . . . . . . . . . 14Denver, Colorado . . . . . . . . . . . . . . . . . . . . . . . . . . . . . . . . . . . . . . . . . . . . . . . . . . . . . . . . . . . . . . . 16Houston, Texas . . . . . . . . . . . . . . . . . . . . . . . . . . . . . . . . . . . . . . . . . . . . . . . . . . . . . . . . . . . . . . . . . 18Las Vegas, Nevada . . . . . . . . . . . . . . . . . . . . . . . . . . . . . . . . . . . . . . . . . . . . . . . . . . . . . . . . . . . . . 20Memphis, Tennessee. . . . . . . . . . . . . . . . . . . . . . . . . . . . . . . . . . . . . . . . . . . . . . . . . . . . . . . . . . . . 22Minneapolis-St. Paul, Minnesota . . . . . . . . . . . . . . . . . . . . . . . . . . . . . . . . . . . . . . . . . . . . . . . . . 24Orlando, Florida . . . . . . . . . . . . . . . . . . . . . . . . . . . . . . . . . . . . . . . . . . . . . . . . . . . . . . . . . . . . . . . . 26Phoenix, Arizona . . . . . . . . . . . . . . . . . . . . . . . . . . . . . . . . . . . . . . . . . . . . . . . . . . . . . . . . . . . . . . . 28Pittsburgh, Pennsylvania . . . . . . . . . . . . . . . . . . . . . . . . . . . . . . . . . . . . . . . . . . . . . . . . . . . . . . . . 30Raleigh-Durham, North Carolina . . . . . . . . . . . . . . . . . . . . . . . . . . . . . . . . . . . . . . . . . . . . . . . . . . 32Reno-Sparks, Nevada . . . . . . . . . . . . . . . . . . . . . . . . . . . . . . . . . . . . . . . . . . . . . . . . . . . . . . . . . . . 34Sacramento, California . . . . . . . . . . . . . . . . . . . . . . . . . . . . . . . . . . . . . . . . . . . . . . . . . . . . . . . . . . 36Seattle-Tacoma, Washington. . . . . . . . . . . . . . . . . . . . . . . . . . . . . . . . . . . . . . . . . . . . . . . . . . . . . 38Tampa-St. Petersburg, Florida . . . . . . . . . . . . . . . . . . . . . . . . . . . . . . . . . . . . . . . . . . . . . . . . . . . . 40
Ongoing Urban Dynamics Research . . . . . . . . . . . . . . . . . . . . . . . . . . . . . . . . . . . . . . . . . . . . . . . . . . . 42Acknowledgments . . . . . . . . . . . . . . . . . . . . . . . . . . . . . . . . . . . . . . . . . . . . . . . . . . . . . . . . . . . . . . . . . . . 44Bibliography . . . . . . . . . . . . . . . . . . . . . . . . . . . . . . . . . . . . . . . . . . . . . . . . . . . . . . . . . . . . . . . . . . . . . . . . 45

Purpose and IntroductionThe Earth’s surface is changing rapidly. Changes are
local, regional, national, and even global in scope. Somechanges have natural causes, such as earthquakes or drought.Other changes, such as urban expansion, agricultural intensi-fication, resource extraction, and water resources develop-ment, are examples of human-induced change that havesignificant impact upon people, the economy, and resources.The consequences that result from these changes are oftendramatic and widespread (Buchanan, Acevedo, andZirbes, 2002)
It is the role of the U.S. Geological Survey (USGS) toprovide useful and relevant scientific information both to theagencies within the Department of the Interior and to theNation in general. In an effort to comply with this task,USGS scientists are assessing the status of, and the trends in,the Nation’s land surface. This assessment provides usefulinformation for regional and national land use decisionmak-ing. This knowledge can be used to deal with issues ofsignificance to the Nation, such as quality-of-life, ecology ofurban environments, ecosystem health, ecological integrity,water quality and quantity concerns, resource availability,vulnerability to natural hazards, safeguards to human health,air and land quality, and accessibility to scientific informa-tion. Results of these assessments can also be analyzed toreveal rates and trends in land use change. Results from urbangrowth studies provide a firm foundation for continuingresearch that explores the consequences of human modifica-tion of the landscape.
The USGS seeks to illustrate and explain the spatialhistory of urban growth and corresponding land use change.Scientists are studying urban environments from a regionalperspective and a time scale of decades to measure thechanges that have occurred in order to help understand theimpact of anticipated changes in the future.
Within this booklet are pairs of images of selectedurbanized regions from across the Nation. These image pairsillustrate the transformation that these areas have undergoneover two decades. Specifically, they depict changes in theextent of urban land. Each change pair is composed of oneimage from the 1970s and one image from the 1990s.Accompanying each image pair is a brief historical geography
of factors that helped facilitate major changes that haveoccurred since the founding of the main city and the conse-quences and challenges of regional urban growth. The goal ofthis publication is to provide an illustration of urban changethat is easily understood by a broad audience.
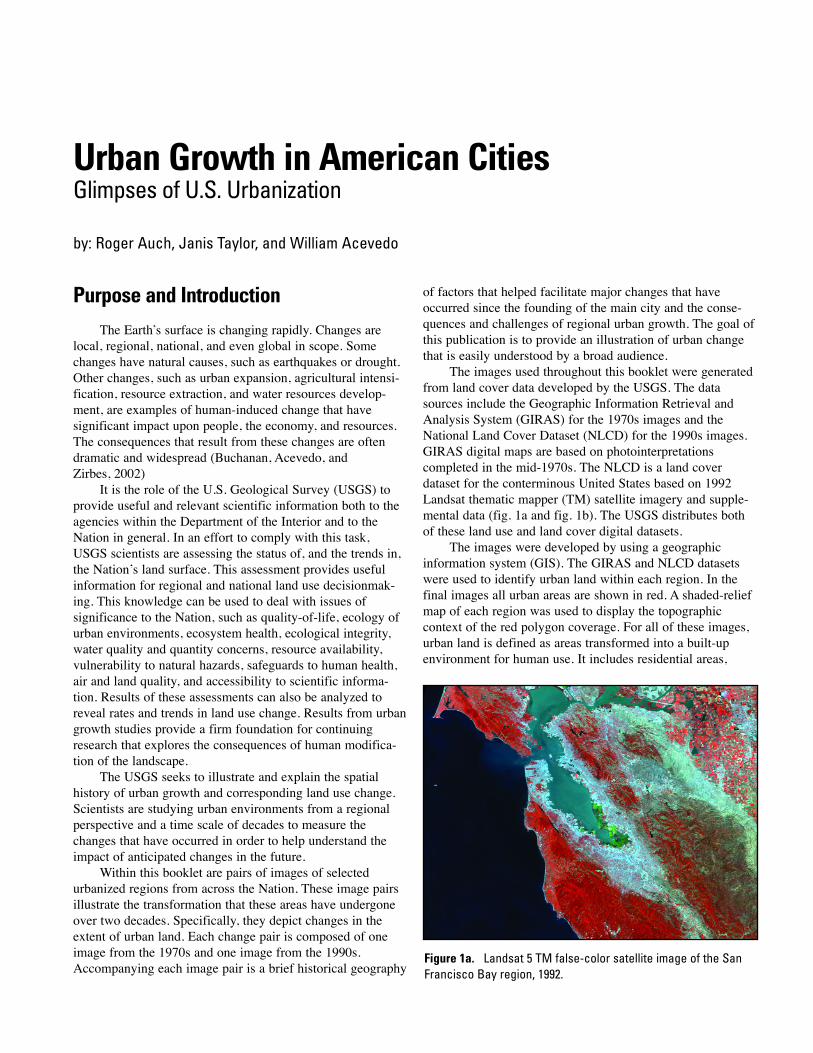
The images used throughout this booklet were generatedfrom land cover data developed by the USGS. The datasources include the Geographic Information Retrieval andAnalysis System (GIRAS) for the 1970s images and theNational Land Cover Dataset (NLCD) for the 1990s images.GIRAS digital maps are based on photointerpretationscompleted in the mid-1970s. The NLCD is a land coverdataset for the conterminous United States based on 1992Landsat thematic mapper (TM) satellite imagery and supple-mental data (fig. 1a and fig. 1b). The USGS distributes bothof these land use and land cover digital datasets.
The images were developed by using a geographicinformation system (GIS). The GIRAS and NLCD datasetswere used to identify urban land within each region. In thefinal images all urban areas are shown in red. A shaded-reliefmap of each region was used to display the topographiccontext of the red polygon coverage. For all of these images,urban land is defined as areas transformed into a built-upenvironment for human use. It includes residential areas,
Urban Growth in American CitiesGlimpses of U.S. Urbanization
by: Roger Auch, Janis Taylor, and William Acevedo
Figure 1a. Landsat 5 TM false-color satellite image of the SanFrancisco Bay region, 1992.

commercial and industrial developments, transportationfeatures, and institutions.
For this booklet, 16 metropolitan regions were selectedbecause they had a high rate of population growth between1970-90, had a high rate of growth in urban land areabetween 1970-90, or provided a broader geographic balanceacross the Nation. Each region selected contains the city theimage is named after. It also comprises all adjoining citiesand suburbs that make up a surrounding metropolitan region.Producing image maps of urban extent in different timeperiods is a first step toward understanding how urban growthproceeds in different regions.
Because urban growth is often incremental, change maybe overlooked in the short term, but the visual illustration ofthis growth can be quite dynamic over several decades. Therates of change can also vary over time and from one geo-graphic region to another. This can be seen, for example, in acomparison of urban growth in the Orlando and Pittsburghregions (see pages 26-27 and 30-31). In Orlando, urbanchange was dramatic over a very short time period, while inPittsburgh, urban change occurred much more slowly over thesame interval.
The image pairs shown in this booklet are meant toprovide the general public, as well as the decisionmaker, withinformation about urban changes that have occurred over thepast three decades. They can be helpful in understandingfuture urban growth patterns. Also, they can yield insightsinto the consequences of landscape change that result inserious economic and environmental issues.
Growth of Urban AreasThe growth of urban areas throughout the history of the
United States has been dramatic. Various circumstances anddriving forces have interacted over 225 years to reach a pointwhere 80 percent of the Nation’s population now lives inmetropolitan areas that occupy less than 20 percent of theland area. The amount of intensively urbanized land withinthese metropolitan areas is even less (Platt, 1996, 22-24).Urban population growth started slowly, accelerated in thesecond half of the 19th century, and then continued steadilythroughout the next hundred years (fig. 2). The form of, andreasons for, urbanization have, however, changed consider-ably over time.
American cities grew steadily throughout the first 75years of nationhood but remained relatively small in geo-graphic area and population. Most were located alongtransportation access points: at seaports, along navigable tidaland major inland rivers, along canals, and around the GreatLakes. The regional hinterlands beyond the cities producedraw commodities as a part of rural-based economies. Thosecommodities were then processed into durable goods in urbancenters and redistributed in the area or transported to otherregions where they were refined or even exported (Borchert,1967). By the eve of the Civil War, however, the nature ofurban development had begun to change. Cities were becom-ing centers of industry as access to local and regional naturalresources improved and these resources were exploited. Inaddition, European social unrest led to a steady stream ofimmigrants arriving in the United States. These conditionswere especially marked in New England and the MiddleAtlantic States. The South and Midwest, by contrast,remained predominantly rural, although regional economieswere linked to urban markets (Goldfield and Brownell, 1990,95-102, 104-109). A few Western cities also appeared at thistime, although few were significant on the national scene. Ingeneral, their economies tended to be based either on local-ized mineral wealth or on agriculture; a handful wereHispanic cultural centers (Starrs, 1995, 271-285).
2 Urban Growth in American Cities
Figure 2. Source: Historical Statistics of the United StatesColonial Times to 1970, Part 1, p. 11-12; Statistical Abstract of theUnited States 2000, p. 38.
Figure 1b. Landsat 5 TM 1991 false-color satellite image show-ing part of the Washington, D.C., metropolitan area.
The pace of urbanization quickened following the CivilWar. Trains became the dominant transportation modethroughout the country, especially after 1870, when aneconomical way to mass-produce steel was introduced,allowing the construction of a vast rail network. Many citieswere created as a result of railroad expansion, while othersgrew in size after becoming rail hubs. Industrialization alsogained prominence, and by 1890 a national economy hadbeen created. Natural resources from all parts of the countrywere used to fuel a rapidly expanding industrial Nation(Meyer, 1987, 321-345). Immigration, mostly from Europe,continued to bolster the burgeoning population. Drawn byfactory jobs, many immigrants settled in cities. At this time,the majority of the Nation’s urban population was still locatedin the Northeast and the Midwest (Goldfield and Brownell,1990, 185-212). Cities in the South and West continued togrow but remained smaller in comparison. For example, in1896, Miami had a mere 500 registered voters (Proctor, 1996,269-270).
Changes in agricultural production increased the flow ofpeople to the cities by the turn of the century. Regionalspecialization of specific commodities as a result of environ-mental conditions gave agricultural producers in some placesan advantage over producers elsewhere. Farmers in areaswhere land was of marginal quality many times had toabandon agriculture and seek other sources of employment(Meyer, 1987, 326-334; Borchert, 1987, 103, 107). In theSouth, many African-Americans migrated to northernindustrial cities to escape the growing failure of the postslav-ery sharecropping system that relied on monoculture cottonproduction (Clark, 1984, 145-146; Spinney, 2000, 167-170).Hispanic workers came to California and other Western Statesin increasing numbers as new irrigation projects made itpossible to raise high-value but labor-intensive fruits andvegetables. Migrant field workers and their families oftenended up living in small but growing urban areas throughoutthe region (Haverluk, 2000).
The old “downtown” city in America reached its zenithby the end of the First World War. The inner core of the citywas the center of industrial management, production, anddistribution. Such cities were predominantly densely popu-lated, because most workers lived in multifamily dwellingsnear their sites of employment. Downtown landscapes werealso being transformed as rising land prices and new tech-nologies fostered the construction of high-rise buildings, or“skyscrapers.” Suburbanization was initially limited toneighboring communities linked to city centers by railroadsand electric streetcars. Modern highways were just makingtheir first appearance (Muller, 1986). The U.S. Census of1920 revealed that, for the first time, more Americans lived inurban than rural settings (Platt, 1996, 215).
Between 1929 and 1945, the United States underwentboth the Great Depression and the Second World War. Theseevents ultimately formed a watershed that separated an oldform of urban dynamics from a new one that has evolvedover the past 50 years. Some of the seeds of this change had
already been sown, however, during the previous fewdecades. These included the rapid increase in automobileownership in the 1920s and the creation of the modernmortgage loan in the 1930s. Consumer spending also wasseverely curtailed as a result of the Depression and WorldWar II, first from hardship and then by forced austerity. Thisled to a buildup of personal savings that helped create theNation’s booming postwar economy into which the “babyboom” generation was born. Another factor that influencedthis change in urban growth dynamics was the involvementby the Federal Government, in both the national economy andthose of local communities, in committing massive amountsof money to fight the Depression and later, the war. Severalmetropolitan regions included in this booklet reflect growthstimulated by this World War II era activity. One noteworthyaspect of this involvement was the backing of long-termhome mortgage loans by several agencies, such as the FederalHousing Administration and the Veterans Administration,following the war. Most of the housing units financed in thismanner were built on the edge of the existing cities (Jackson,1985, 190-218). In time, the selective funding of major publicworks and the creation of a military-industrial complex wouldcome to favor some urban areas over others (Goldfield andBrownell, 1990, 323-341; Markusen and others, 1991, 8-25,51-81). Examples in the booklet include the Boston, Orlando,Seattle, and Denver areas. A third significant influence onurban growth in the postwar era was the exposure thatmillions of Americans had gained to other parts of thecountry. During the 1930s, many people abandoned regionsfraught with economic and environmental problems for newplaces that were thought to offer better opportunities andliving conditions (Gregory, 1989, 3-25; Lewis, 1987, 433-436). Others who had been involved in the armed serviceswere exposed to parts of the country that had greater appealas future places of residence than their former communities(Mohl and Mormino, 1996, 424-425; Lewis, 1987, 433-436;Abbott, 1981, 37-41, 98-119). Orlando, Tampa, Phoenix, LasVegas, and Denver are all examples of cities that had newmilitary bases during World War II and offered different butattractive natural amenities to potential new residents.
A new form of urban growth gained prominence afterthe war: mass suburbanization around the older cities. Severalfactors fostered its spread. First, the development of animproved highway system allowed people to commute totheir jobs in the cities from outside municipal boundaries.This trend began in the 1920s but accelerated greatly after the1940s. The passage of the Federal Interstate Highway Act inthe 1950s set the stage for large-scale, multilane roads thatbecame a reality over the next 20 years. Other driving forcesbehind suburbanization were subtler. The Nation’s growingmiddle class, comprised of both blue- and white-collarworkers, now had the financial resources to buy single-familyresidences away from the high-density city center and couldmaintain their suburban lifestyle by commuting (Jackson,1985, 231-245). The suburbs also represented a refuge for agrowing number of Americans who longed for quieter, less
Urban Growth in American Cities 3
hectic lives that were removed from the congestion, noise,pollution, multifamily residences, and high land pricestypically found in the heart of the city. Many of the Nation’scitizens were only a generation or two removed from farm orsmall-town living; the suburbs offered a means of bridgingsmall-town and city life (Herbers, 1986, 91-101).
The Cold War era spurred the development of technol-ogy aimed at keeping the United States ahead of its perceivedadversaries. Federal funding was channeled into researchcenters and the military-industrial complex. Communities thatwere home to major universities, aerospace and electronicsindustries, or defense installations benefited and grew as aresult of these expenditures (Markusen and others, 1991, 32-50). Civic leaders sometimes pressured State officials torestructure existing universities — or to establish new ones,as happened in Las Vegas — in attempts to attract newindustries to an area (Moehring, 2000, 223-227).Technological advancements, such as the widespread use ofair conditioning, the growth of civil aviation, and increasinglyinexpensive and plentiful electricity, encouraged the growthof cities in many parts of the country. Air conditioning, inparticular, helped overcome environmental conditions in theSoutheast and Southwest that were perceived drawbacks ofyear-round living in these regions (Mohl and Mormino, 1996,433-435; Moehring, 2000, 22-23). Examples from the bookletinclude Orlando, Tampa-St. Petersburg, Phoenix, and LasVegas.
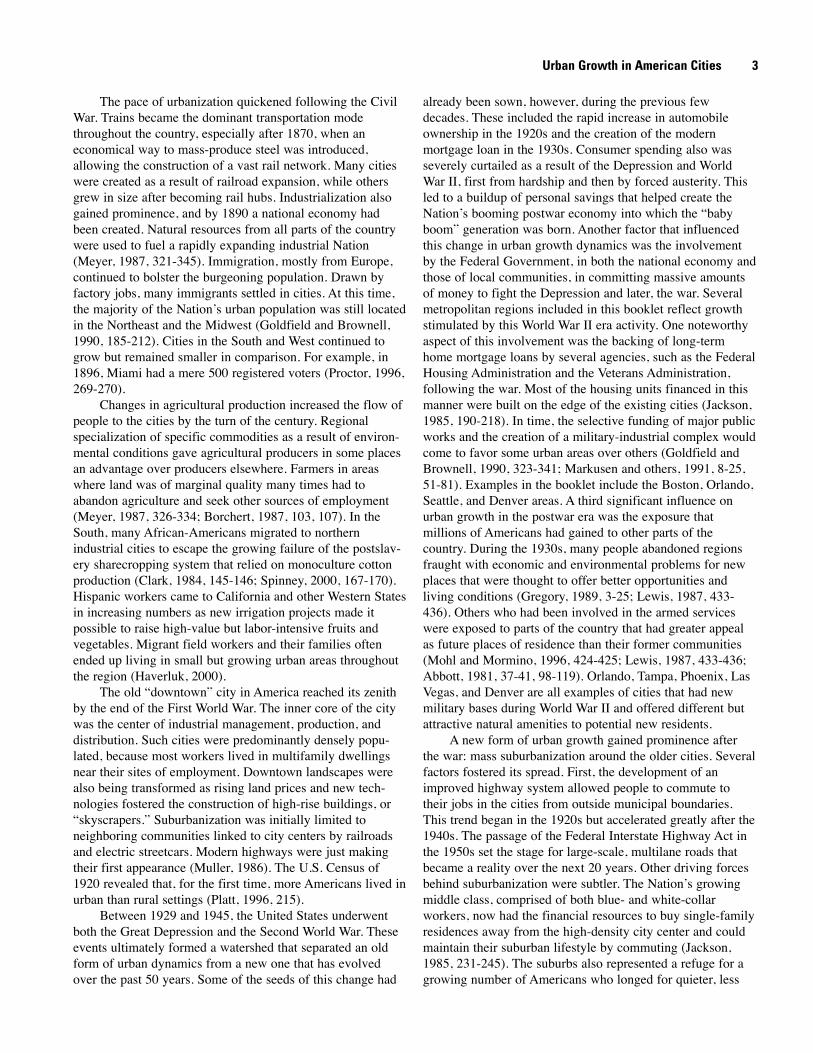
The 1970 census revealed that, by this time, more of theNation’s urban population lived in the suburbs than in centralcities. To a certain extent, suburbanization had been ongoingfor nearly a century, but the trend had exploded during thepost-World War II era. The suburbs had continued to growduring the 1960s, but by the end of the decade their relation-ship to the city centers had begun to change. The suburbswere no longer simply “bedroom communities” for commut-ing city workers. They were emerging as focal points for theretail and service sectors of the urban economy (Abbott,1981, 57) (fig. 3).
The city centers remained strongholds of finance andcorporate management. Manufacturing, on the other hand,was one of the leading segments of urban employment andwas beginning to suffer major losses in the central cities. Thiswas especially true for manufacturing’s “heavy” industries.Numerous factors contributed to this decline, but perhaps themost influential was the fact that the city centers had losttheir real or perceived competitive advantage. This deindustri-alization accelerated throughout the next decade and contin-ued into the 1980s. It left a changed urban landscape, bothphysically and functionally (Bluestone and Harrison, 1982,25-48; Jakle and Wilson, 1992, 57-92). Pittsburgh is the mostprominent example from the booklet.
Suburbanization did not strictly take the form of ever-widening concentric circles around a central city. Suburbsoften developed along main highways in a linear fashion,linking pre-existing, outlying communities with the main city,as seen in the Boston and Sacramento pairs. In other cases,
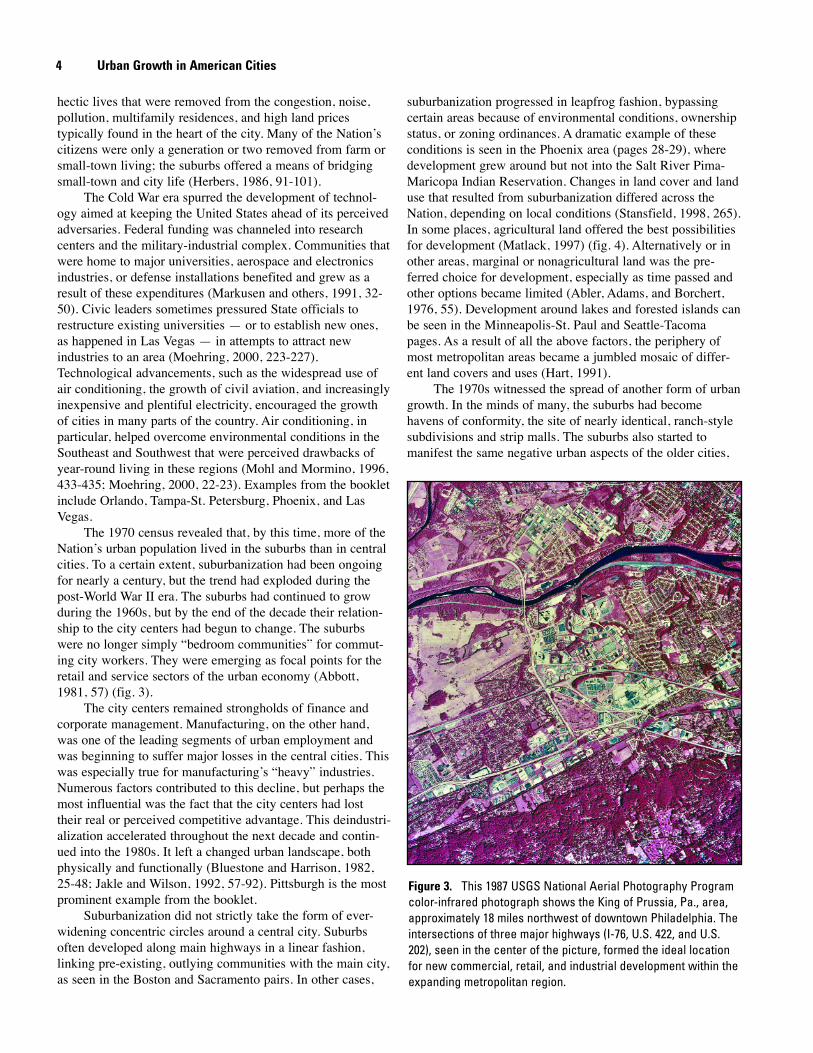
suburbanization progressed in leapfrog fashion, bypassingcertain areas because of environmental conditions, ownershipstatus, or zoning ordinances. A dramatic example of theseconditions is seen in the Phoenix area (pages 28-29), wheredevelopment grew around but not into the Salt River Pima-Maricopa Indian Reservation. Changes in land cover and landuse that resulted from suburbanization differed across theNation, depending on local conditions (Stansfield, 1998, 265).In some places, agricultural land offered the best possibilitiesfor development (Matlack, 1997) (fig. 4). Alternatively or inother areas, marginal or nonagricultural land was the pre-ferred choice for development, especially as time passed andother options became limited (Abler, Adams, and Borchert,1976, 55). Development around lakes and forested islands canbe seen in the Minneapolis-St. Paul and Seattle-Tacomapages. As a result of all the above factors, the periphery ofmost metropolitan areas became a jumbled mosaic of differ-ent land covers and uses (Hart, 1991).
The 1970s witnessed the spread of another form of urbangrowth. In the minds of many, the suburbs had becomehavens of conformity, the site of nearly identical, ranch-stylesubdivisions and strip malls. The suburbs also started tomanifest the same negative urban aspects of the older cities,
4 Urban Growth in American Cities
Figure 3. This 1987 USGS National Aerial Photography Programcolor-infrared photograph shows the King of Prussia, Pa., area,approximately 18 miles northwest of downtown Philadelphia. Theintersections of three major highways (I-76, U.S. 422, and U.S.202), seen in the center of the picture, formed the ideal locationfor new commercial, retail, and industrial development within theexpanding metropolitan region.
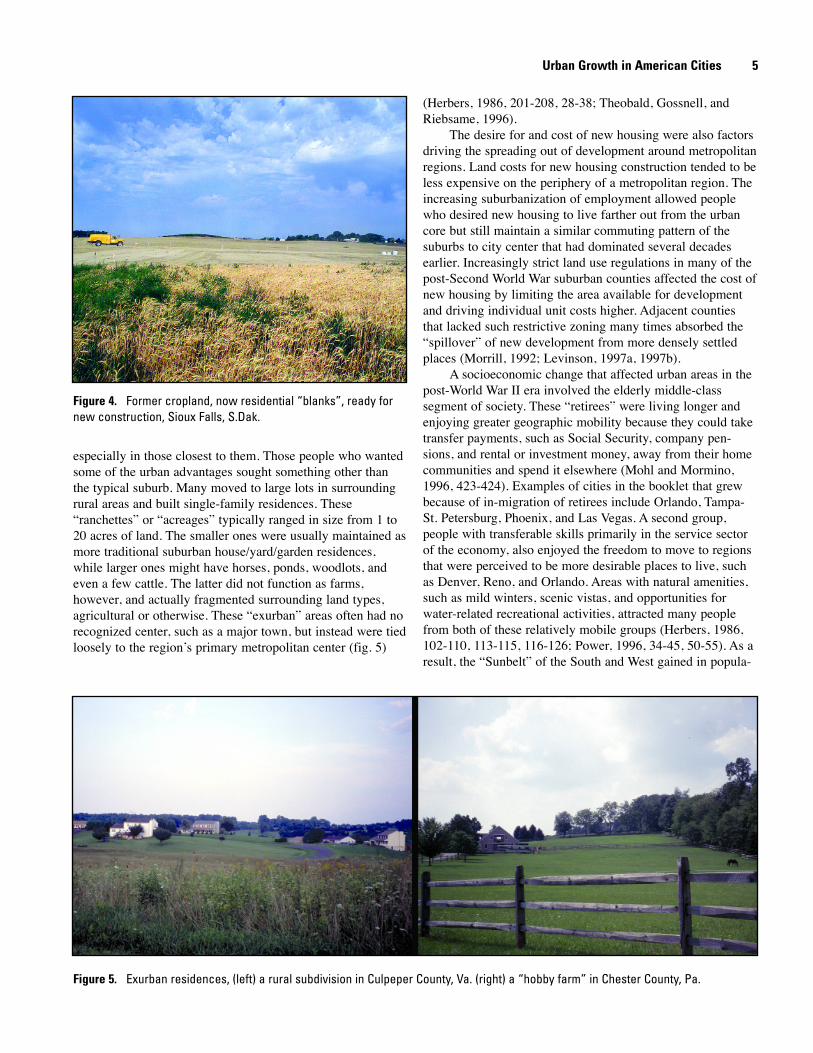
especially in those closest to them. Those people who wantedsome of the urban advantages sought something other thanthe typical suburb. Many moved to large lots in surroundingrural areas and built single-family residences. These“ranchettes” or “acreages” typically ranged in size from 1 to20 acres of land. The smaller ones were usually maintained asmore traditional suburban house/yard/garden residences,while larger ones might have horses, ponds, woodlots, andeven a few cattle. The latter did not function as farms,however, and actually fragmented surrounding land types,agricultural or otherwise. These “exurban” areas often had norecognized center, such as a major town, but instead were tiedloosely to the region’s primary metropolitan center (fig. 5)
(Herbers, 1986, 201-208, 28-38; Theobald, Gossnell, andRiebsame, 1996).
The desire for and cost of new housing were also factorsdriving the spreading out of development around metropolitanregions. Land costs for new housing construction tended to beless expensive on the periphery of a metropolitan region. Theincreasing suburbanization of employment allowed peoplewho desired new housing to live farther out from the urbancore but still maintain a similar commuting pattern of thesuburbs to city center that had dominated several decadesearlier. Increasingly strict land use regulations in many of thepost-Second World War suburban counties affected the cost ofnew housing by limiting the area available for developmentand driving individual unit costs higher. Adjacent countiesthat lacked such restrictive zoning many times absorbed the“spillover” of new development from more densely settledplaces (Morrill, 1992; Levinson, 1997a, 1997b).
A socioeconomic change that affected urban areas in thepost-World War II era involved the elderly middle-classsegment of society. These “retirees” were living longer andenjoying greater geographic mobility because they could taketransfer payments, such as Social Security, company pen-sions, and rental or investment money, away from their homecommunities and spend it elsewhere (Mohl and Mormino,1996, 423-424). Examples of cities in the booklet that grewbecause of in-migration of retirees include Orlando, Tampa-St. Petersburg, Phoenix, and Las Vegas. A second group,people with transferable skills primarily in the service sectorof the economy, also enjoyed the freedom to move to regionsthat were perceived to be more desirable places to live, suchas Denver, Reno, and Orlando. Areas with natural amenities,such as mild winters, scenic vistas, and opportunities forwater-related recreational activities, attracted many peoplefrom both of these relatively mobile groups (Herbers, 1986,102-110, 113-115, 116-126; Power, 1996, 34-45, 50-55). As aresult, the “Sunbelt” of the South and West gained in popula-
Urban Growth in American Cities 5
Figure 4. Former cropland, now residential “blanks”, ready fornew construction, Sioux Falls, S.Dak.
Figure 5. Exurban residences, (left) a rural subdivision in Culpeper County, Va. (right) a “hobby farm” in Chester County, Pa.
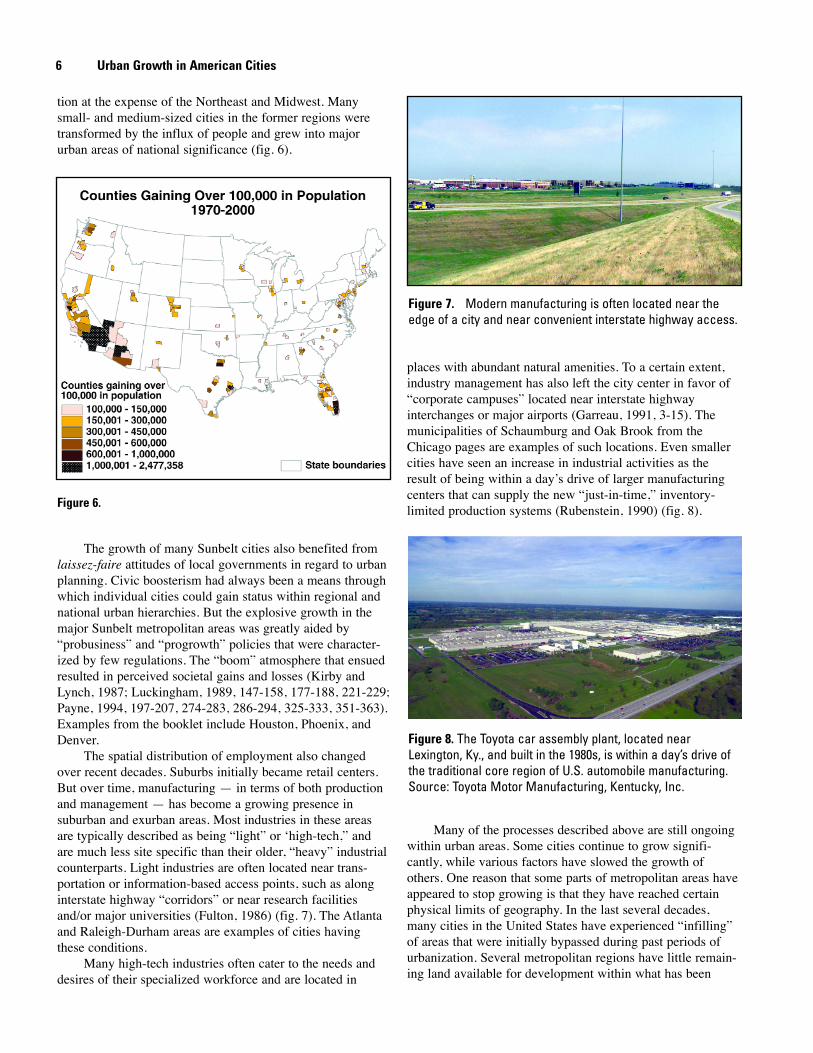
tion at the expense of the Northeast and Midwest. Manysmall- and medium-sized cities in the former regions weretransformed by the influx of people and grew into majorurban areas of national significance (fig. 6).
The growth of many Sunbelt cities also benefited fromlaissez-faire attitudes of local governments in regard to urbanplanning. Civic boosterism had always been a means throughwhich individual cities could gain status within regional andnational urban hierarchies. But the explosive growth in themajor Sunbelt metropolitan areas was greatly aided by“probusiness” and “progrowth” policies that were character-ized by few regulations. The “boom” atmosphere that ensuedresulted in perceived societal gains and losses (Kirby andLynch, 1987; Luckingham, 1989, 147-158, 177-188, 221-229;Payne, 1994, 197-207, 274-283, 286-294, 325-333, 351-363).Examples from the booklet include Houston, Phoenix, andDenver.
The spatial distribution of employment also changedover recent decades. Suburbs initially became retail centers.But over time, manufacturing — in terms of both productionand management — has become a growing presence insuburban and exurban areas. Most industries in these areasare typically described as being “light” or ‘high-tech,” andare much less site specific than their older, “heavy” industrialcounterparts. Light industries are often located near trans-portation or information-based access points, such as alonginterstate highway “corridors” or near research facilitiesand/or major universities (Fulton, 1986) (fig. 7). The Atlantaand Raleigh-Durham areas are examples of cities havingthese conditions.
Many high-tech industries often cater to the needs anddesires of their specialized workforce and are located in
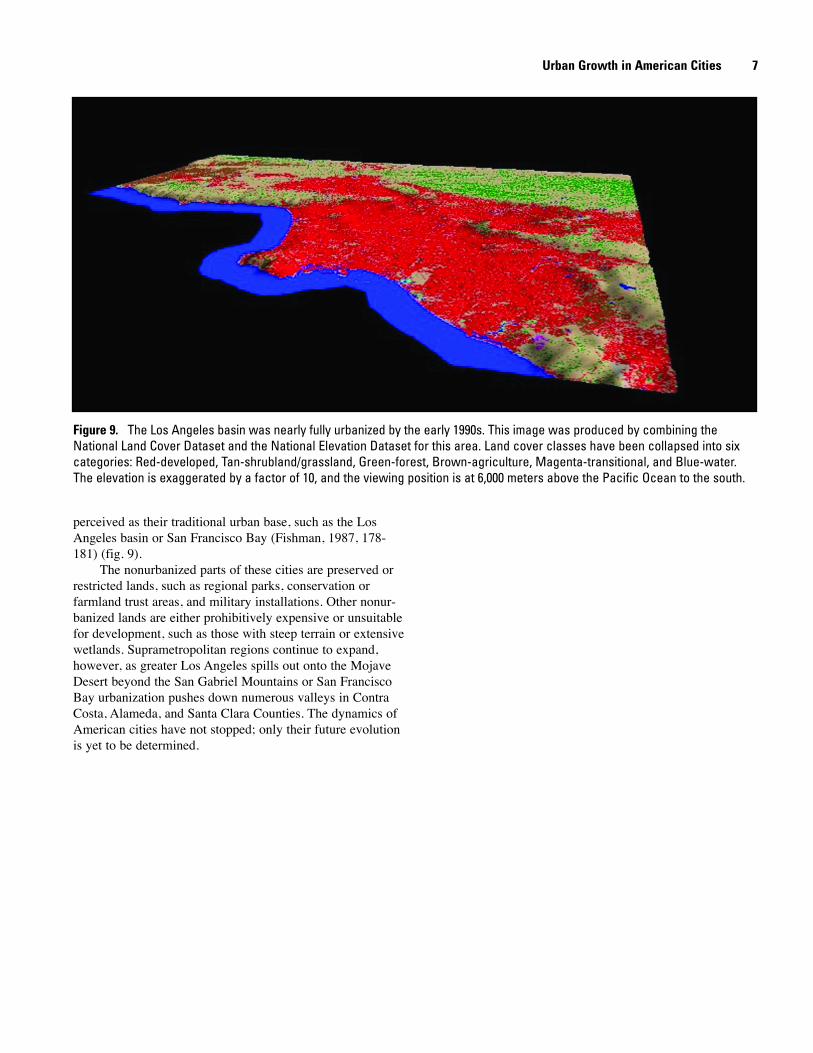
places with abundant natural amenities. To a certain extent,industry management has also left the city center in favor of“corporate campuses” located near interstate highwayinterchanges or major airports (Garreau, 1991, 3-15). Themunicipalities of Schaumburg and Oak Brook from theChicago pages are examples of such locations. Even smallercities have seen an increase in industrial activities as theresult of being within a day’s drive of larger manufacturingcenters that can supply the new “just-in-time,” inventory-limited production systems (Rubenstein, 1990) (fig. 8).
Many of the processes described above are still ongoingwithin urban areas. Some cities continue to grow signifi-cantly, while various factors have slowed the growth ofothers. One reason that some parts of metropolitan areas haveappeared to stop growing is that they have reached certainphysical limits of geography. In the last several decades,many cities in the United States have experienced “infilling”of areas that were initially bypassed during past periods ofurbanization. Several metropolitan regions have little remain-ing land available for development within what has been
6 Urban Growth in American Cities
Figure 7. Modern manufacturing is often located near theedge of a city and near convenient interstate highway access.
Figure 8. The Toyota car assembly plant, located nearLexington, Ky., and built in the 1980s, is within a day’s drive ofthe traditional core region of U.S. automobile manufacturing.Source: Toyota Motor Manufacturing, Kentucky, Inc.
Figure 6.
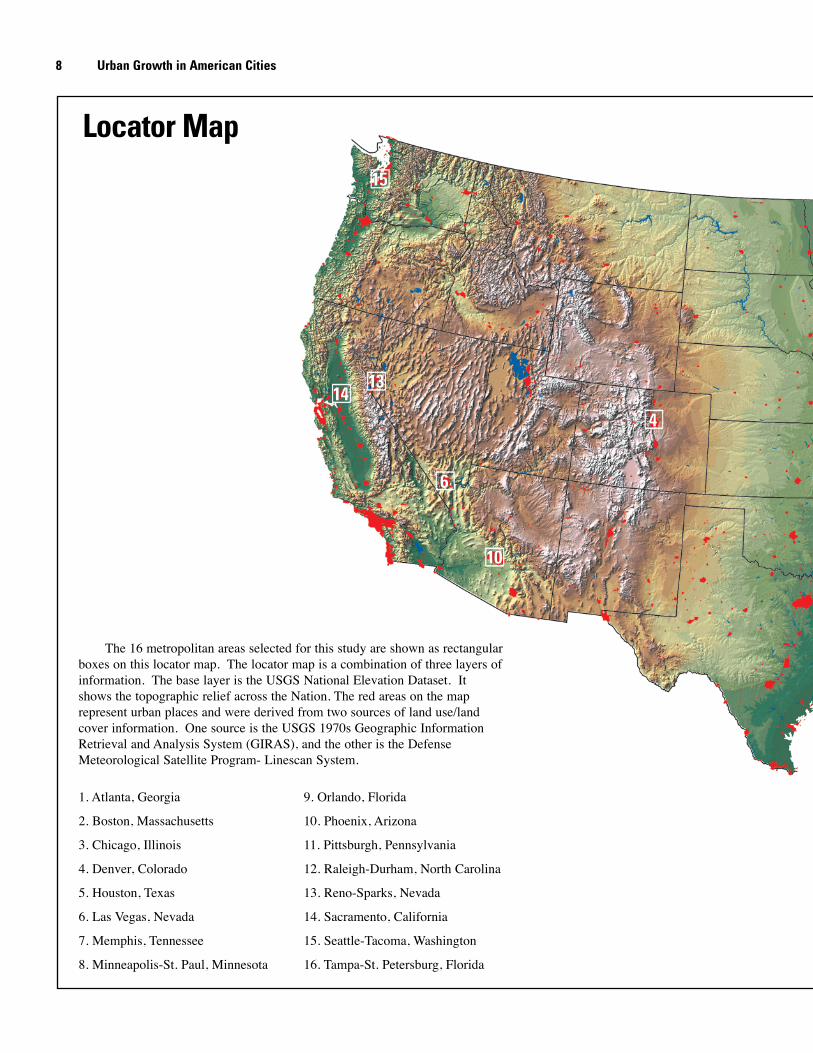
perceived as their traditional urban base, such as the LosAngeles basin or San Francisco Bay (Fishman, 1987, 178-181) (fig. 9).
The nonurbanized parts of these cities are preserved orrestricted lands, such as regional parks, conservation orfarmland trust areas, and military installations. Other nonur-banized lands are either prohibitively expensive or unsuitablefor development, such as those with steep terrain or extensivewetlands. Suprametropolitan regions continue to expand,however, as greater Los Angeles spills out onto the MojaveDesert beyond the San Gabriel Mountains or San FranciscoBay urbanization pushes down numerous valleys in ContraCosta, Alameda, and Santa Clara Counties. The dynamics ofAmerican cities have not stopped; only their future evolutionis yet to be determined.
Urban Growth in American Cities 7
Figure 9. The Los Angeles basin was nearly fully urbanized by the early 1990s. This image was produced by combining theNational Land Cover Dataset and the National Elevation Dataset for this area. Land cover classes have been collapsed into sixcategories: Red-developed, Tan-shrubland/grassland, Green-forest, Brown-agriculture, Magenta-transitional, and Blue-water.The elevation is exaggerated by a factor of 10, and the viewing position is at 6,000 meters above the Pacific Ocean to the south.
8 Urban Growth in American Cities
1515
14141313
66
1010
44
5
8
3
71
916
12
11
2
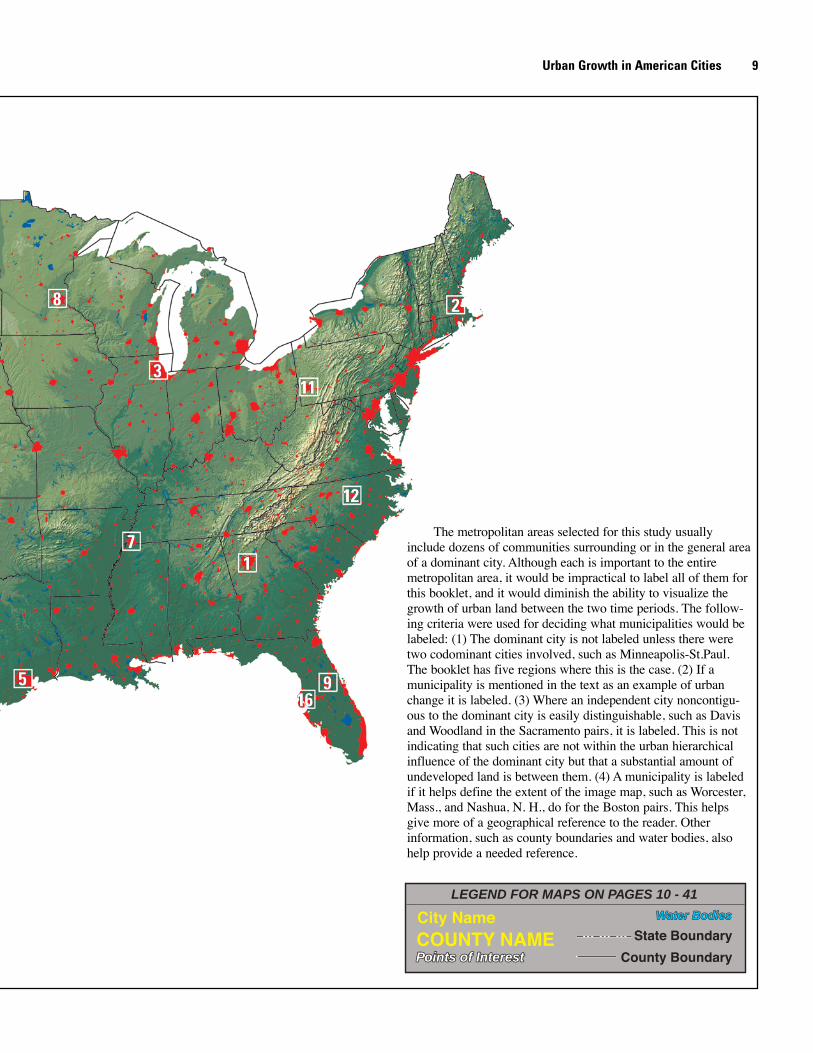
The 16 metropolitan areas selected for this study are shown as rectangularboxes on this locator map. The locator map is a combination of three layers ofinformation. The base layer is the USGS National Elevation Dataset. Itshows the topographic relief across the Nation. The red areas on the maprepresent urban places and were derived from two sources of land use/landcover information. One source is the USGS 1970s Geographic InformationRetrieval and Analysis System (GIRAS), and the other is the DefenseMeteorological Satellite Program- Linescan System.
1. Atlanta, Georgia
2. Boston, Massachusetts
3. Chicago, Illinois
4. Denver, Colorado
5. Houston, Texas
6. Las Vegas, Nevada
7. Memphis, Tennessee
8. Minneapolis-St. Paul, Minnesota
9. Orlando, Florida
10. Phoenix, Arizona
11. Pittsburgh, Pennsylvania
12. Raleigh-Durham, North Carolina
13. Reno-Sparks, Nevada
14. Sacramento, California
15. Seattle-Tacoma, Washington
16. Tampa-St. Petersburg, Florida
Locator Map
Urban Growth in American Cities 9
15
1413
6
10
4
55
88
33
7711
991616
1212
1111
22
The metropolitan areas selected for this study usuallyinclude dozens of communities surrounding or in the general areaof a dominant city. Although each is important to the entiremetropolitan area, it would be impractical to label all of them forthis booklet, and it would diminish the ability to visualize thegrowth of urban land between the two time periods. The follow-ing criteria were used for deciding what municipalities would belabeled: (1) The dominant city is not labeled unless there weretwo codominant cities involved, such as Minneapolis-St.Paul.The booklet has five regions where this is the case. (2) If amunicipality is mentioned in the text as an example of urbanchange it is labeled. (3) Where an independent city noncontigu-ous to the dominant city is easily distinguishable, such as Davisand Woodland in the Sacramento pairs, it is labeled. This is notindicating that such cities are not within the urban hierarchicalinfluence of the dominant city but that a substantial amount ofundeveloped land is between them. (4) A municipality is labeledif it helps define the extent of the image map, such as Worcester,Mass., and Nashua, N. H., do for the Boston pairs. This helpsgive more of a geographical reference to the reader. Otherinformation, such as county boundaries and water bodies, alsohelp provide a needed reference.
Water BodiesWater Bodies
Points of InterestPoints of Interest
State Boundary
County Boundary
City NameCOUNTY NAME
LEGEND FOR MAPS ON PAGES 10 - 41

Atlanta, Georgia
1970 Population - 1,434,676Includes Cobb, Douglas, Fulton,Gwinnett, DeKalb, Clayton, andRockdale Counties. NOTE: portionsof the above listed counties may notbe visible on the map
Red areas shown as developed land200,800 acres (314 square miles)
1973
10 Urban Growth in American Cities
The city of Atlanta, Georgia, was established in the 1840s near the junction of severalrailroad lines. Its location on the southern Appalachian piedmont made faster transporta-tion routes to other points in the Southeast possible via shorter “interior lines.” Railroadsremained the city’s dominant industry into the 1920s. Before the end of World War I,Atlanta became a district Federal Reserve Bank site, fostering its growth as a regionalfinancial center. City leaders also pursued the development of civilian air transportation.Over time, Atlanta grew from a regional to a national, and ultimately, an internationalaviation hub.
HartsfieldInt'l AirportHartsfieldInt'l Airport
Stone MountainMemorial ParkStone MountainMemorial Park
NorcrossMarietta
Conyers
COBB
FULTON
DOUGLAS
CLAYTON
ROCKDALE
DEKALB
GWINNETT
Allatoona LakeAllatoona Lake
Chatta
hooc
hee
River
Chatta
hooc
hee
River
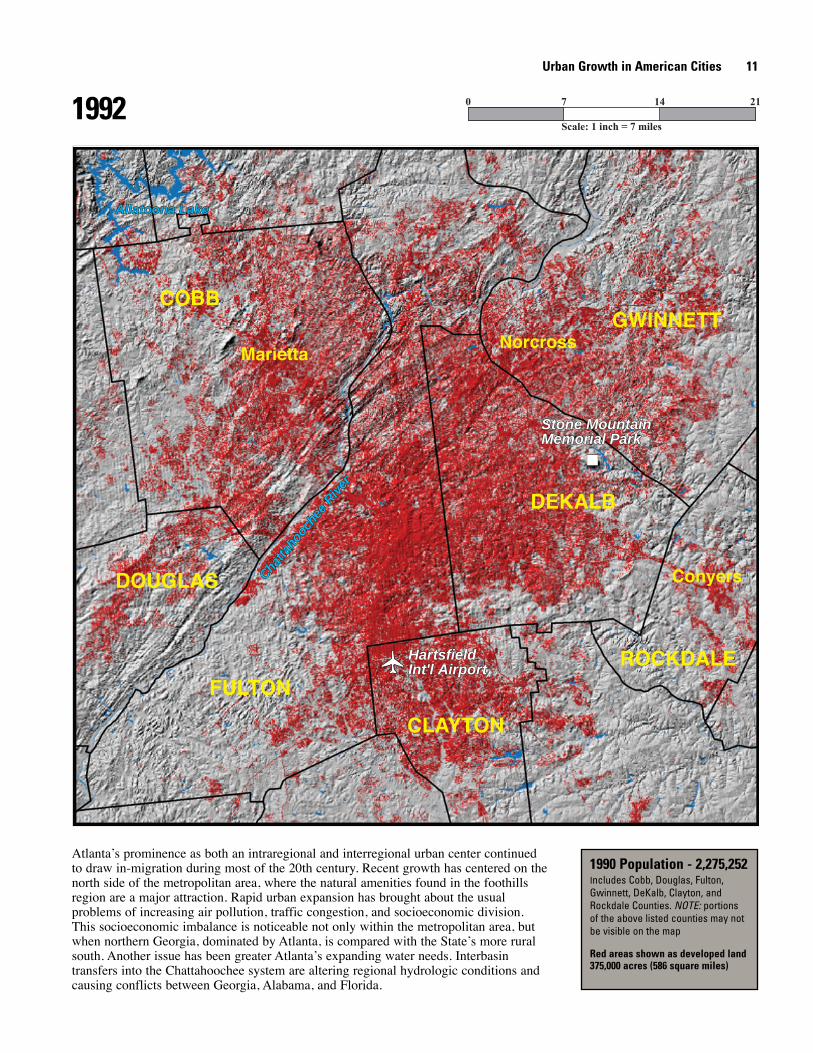
1990 Population - 2,275,252Includes Cobb, Douglas, Fulton,Gwinnett, DeKalb, Clayton, andRockdale Counties. NOTE: portionsof the above listed counties may notbe visible on the map
Red areas shown as developed land375,000 acres (586 square miles)
1992Urban Growth in American Cities 11
Atlanta’s prominence as both an intraregional and interregional urban center continuedto draw in-migration during most of the 20th century. Recent growth has centered on thenorth side of the metropolitan area, where the natural amenities found in the foothillsregion are a major attraction. Rapid urban expansion has brought about the usualproblems of increasing air pollution, traffic congestion, and socioeconomic division.This socioeconomic imbalance is noticeable not only within the metropolitan area, butwhen northern Georgia, dominated by Atlanta, is compared with the State’s more ruralsouth. Another issue has been greater Atlanta’s expanding water needs. Interbasintransfers into the Chattahoochee system are altering regional hydrologic conditions andcausing conflicts between Georgia, Alabama, and Florida.
Marietta
Conyers
Norcross
COBB
FULTON
DOUGLAS
CLAYTON
ROCKDALE
DEKALB
GWINNETT
HartsfieldInt'l Airport
Stone MountainMemorial Park
HartsfieldInt'l Airport
Allatoona LakeAllatoona Lake
Chatta
hooc
hee
River
Chatta
hooc
hee
River
Stone MountainMemorial Park
Scale: 1 inch = 7 miles
0 7 14 21
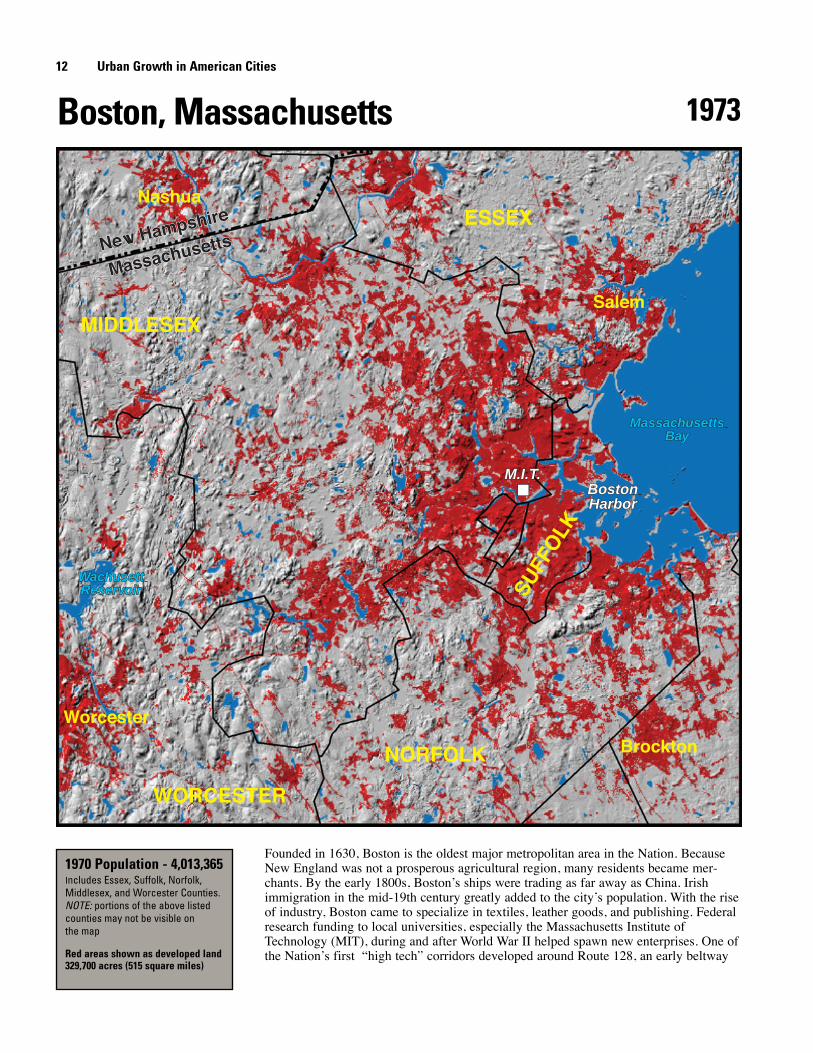
Founded in 1630, Boston is the oldest major metropolitan area in the Nation. BecauseNew England was not a prosperous agricultural region, many residents became mer-chants. By the early 1800s, Boston’s ships were trading as far away as China. Irishimmigration in the mid-19th century greatly added to the city’s population. With the riseof industry, Boston came to specialize in textiles, leather goods, and publishing. Federalresearch funding to local universities, especially the Massachusetts Institute ofTechnology (MIT), during and after World War II helped spawn new enterprises. One ofthe Nation’s first “high tech” corridors developed around Route 128, an early beltway
12 Urban Growth in American Cities
Boston, Massachusetts
M.I.T.M.I.T.BostonHarborBostonHarbor
Worcester
Brockton
Nashua
Salem
ESSEX
MIDDLESEX
WORCESTER
NORFOLK
SUFF
OLK
New Hampshire
MassachusettsNew Hampshire
Massachusetts
MassachusettsBay
MassachusettsBay
WachusettReservoirWachusettReservoir
1970 Population - 4,013,365Includes Essex, Suffolk, Norfolk,Middlesex, and Worcester Counties.NOTE: portions of the above listedcounties may not be visible onthe map
Red areas shown as developed land329,700 acres (515 square miles)
1973
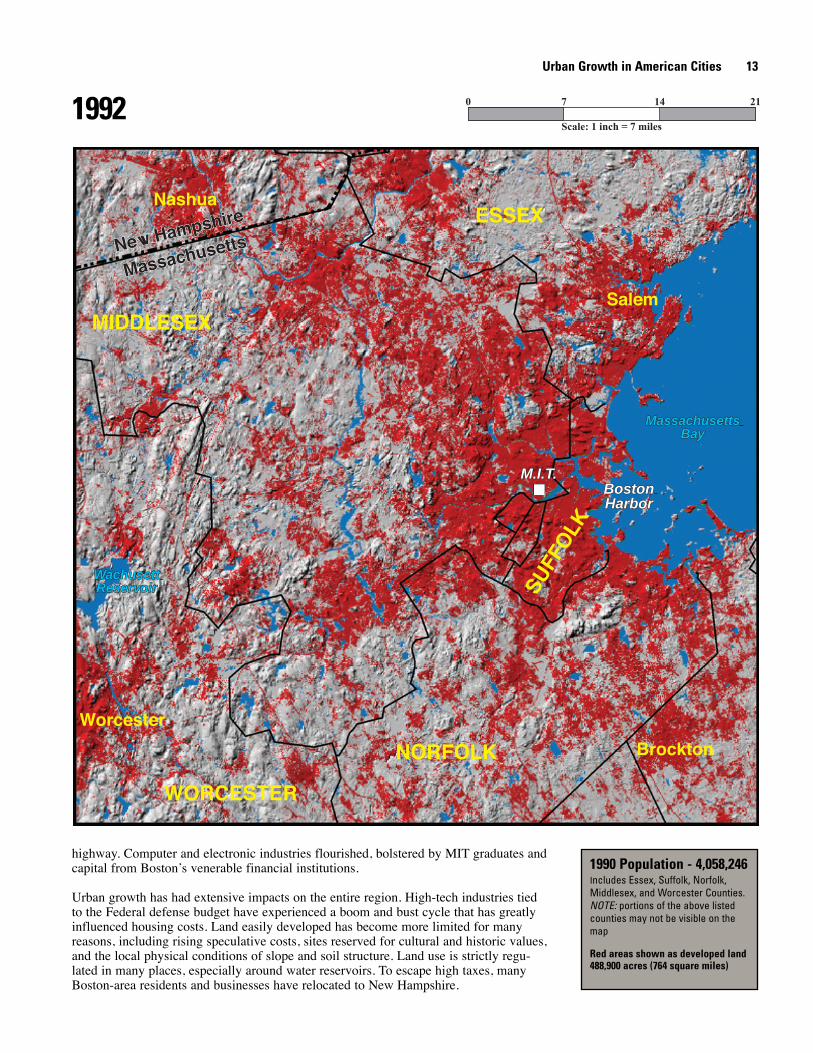
highway. Computer and electronic industries flourished, bolstered by MIT graduates andcapital from Boston’s venerable financial institutions.
Urban growth has had extensive impacts on the entire region. High-tech industries tiedto the Federal defense budget have experienced a boom and bust cycle that has greatlyinfluenced housing costs. Land easily developed has become more limited for manyreasons, including rising speculative costs, sites reserved for cultural and historic values,and the local physical conditions of slope and soil structure. Land use is strictly regu-lated in many places, especially around water reservoirs. To escape high taxes, manyBoston-area residents and businesses have relocated to New Hampshire.
Urban Growth in American Cities 13
1990 Population - 4,058,246Includes Essex, Suffolk, Norfolk,Middlesex, and Worcester Counties.NOTE: portions of the above listedcounties may not be visible on themap
Red areas shown as developed land488,900 acres (764 square miles)
1992
M.I.T.M.I.T.BostonHarborBostonHarbor
Worcester
Brockton
Salem
NashuaESSEX
MIDDLESEX
WORCESTER
NORFOLK
SUFF
OLK
New Hampshire
MassachusettsNew Hampshire
Massachusetts
WachusettReservoirWachusettReservoir
MassachusettsBay
MassachusettsBay
Scale: 1 inch = 7 miles
0 7 14 21
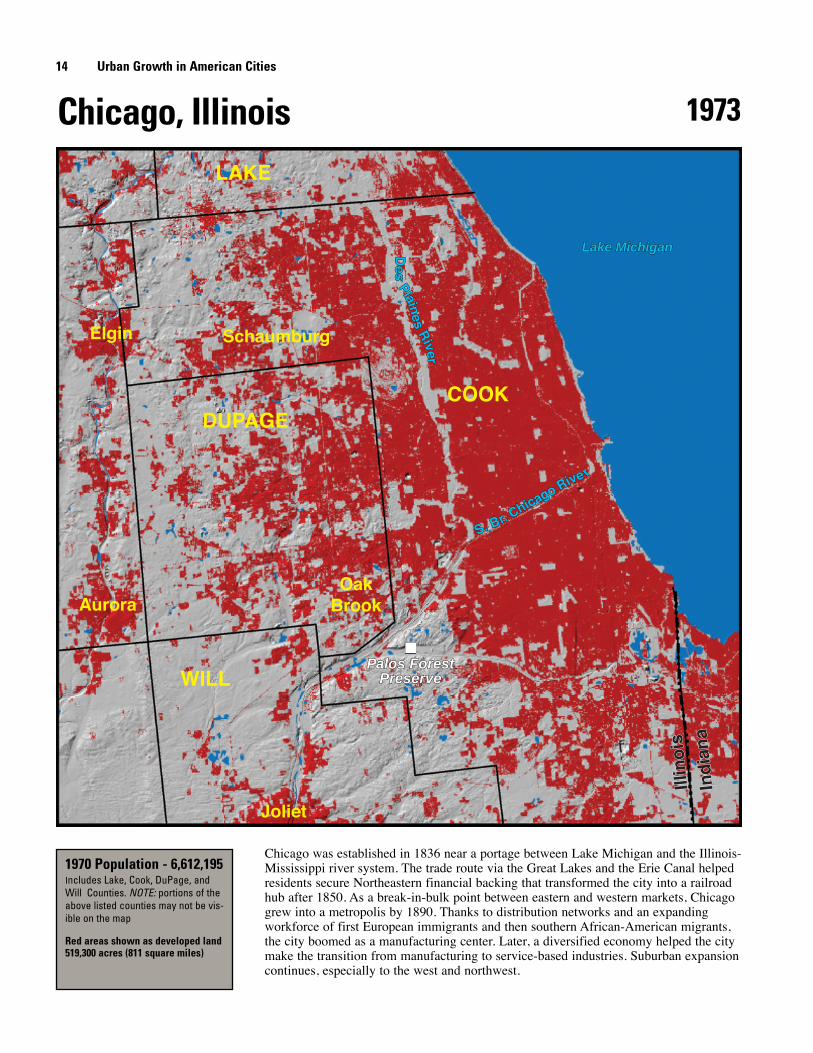
Chicago was established in 1836 near a portage between Lake Michigan and the Illinois-Mississippi river system. The trade route via the Great Lakes and the Erie Canal helpedresidents secure Northeastern financial backing that transformed the city into a railroadhub after 1850. As a break-in-bulk point between eastern and western markets, Chicagogrew into a metropolis by 1890. Thanks to distribution networks and an expandingworkforce of first European immigrants and then southern African-American migrants,the city boomed as a manufacturing center. Later, a diversified economy helped the citymake the transition from manufacturing to service-based industries. Suburban expansioncontinues, especially to the west and northwest.
14 Urban Growth in American Cities
Chicago, Illinois
Palos ForestPreserve
Palos ForestPreserve
Schaumburg
OakBrook
Joliet
Aurora
Elgin
COOK
WILL
DUPAGE
LAKE
Illin
ois
Ind
ian
aIll
ino
is
Ind
ian
a
Lake MichiganLake MichiganDe
sPlaine
sR
iver
De
sPlaine
sR
iver
S. Br. Chicago Rive r
S. Br. Chicago Rive r
1970 Population - 6,612,195Includes Lake, Cook, DuPage, andWill Counties. NOTE: portions of theabove listed counties may not be vis-ible on the map
Red areas shown as developed land519,300 acres (811 square miles)
1973
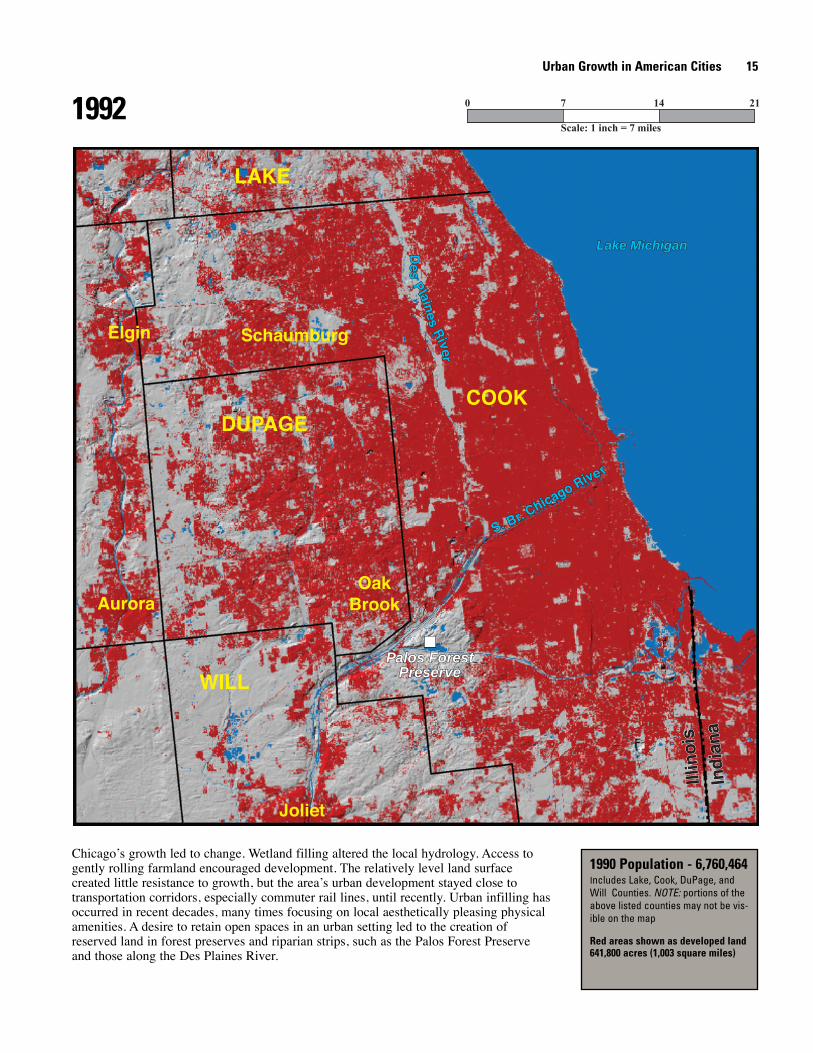
Chicago’s growth led to change. Wetland filling altered the local hydrology. Access togently rolling farmland encouraged development. The relatively level land surfacecreated little resistance to growth, but the area’s urban development stayed close totransportation corridors, especially commuter rail lines, until recently. Urban infilling hasoccurred in recent decades, many times focusing on local aesthetically pleasing physicalamenities. A desire to retain open spaces in an urban setting led to the creation ofreserved land in forest preserves and riparian strips, such as the Palos Forest Preserveand those along the Des Plaines River.
Urban Growth in American Cities 15
1990 Population - 6,760,464Includes Lake, Cook, DuPage, andWill Counties. NOTE: portions of theabove listed counties may not be vis-ible on the map
Red areas shown as developed land641,800 acres (1,003 square miles)
1992
Palos ForestPreserve
Palos ForestPreserve
Schaumburg
OakBrook
Joliet
Aurora
Elgin
COOK
WILL
DUPAGE
LAKE
Illin
ois
Ind
ian
aIll
ino
is
Ind
ian
a
Lake MichiganLake MichiganDe
sPlaine
sR
iver
De
sPlaine
sR
iver
S. Br. Chicago Rive r
S. Br. Chicago Rive r
Scale: 1 inch = 7 miles
0 7 14 21
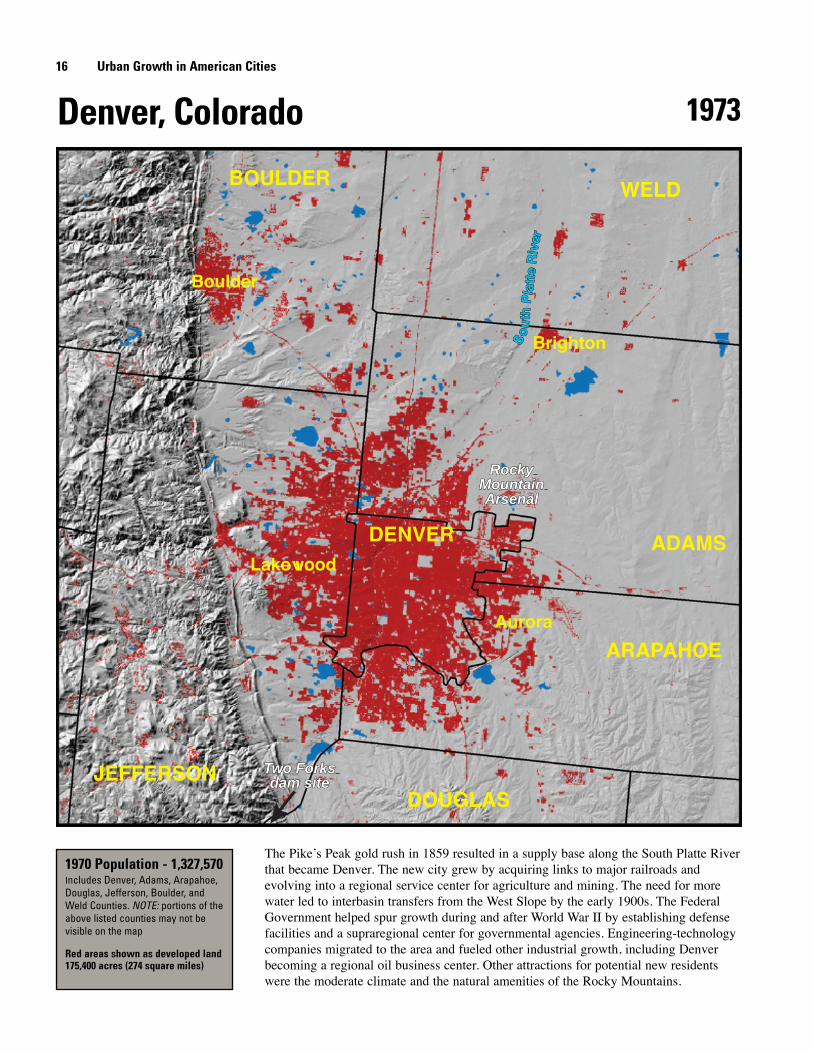
The Pike’s Peak gold rush in 1859 resulted in a supply base along the South Platte Riverthat became Denver. The new city grew by acquiring links to major railroads andevolving into a regional service center for agriculture and mining. The need for morewater led to interbasin transfers from the West Slope by the early 1900s. The FederalGovernment helped spur growth during and after World War II by establishing defensefacilities and a supraregional center for governmental agencies. Engineering-technologycompanies migrated to the area and fueled other industrial growth, including Denverbecoming a regional oil business center. Other attractions for potential new residentswere the moderate climate and the natural amenities of the Rocky Mountains.
16 Urban Growth in American Cities
Denver, Colorado
RockyMountainArsenal
Two Forksdam site
RockyMountainArsenal
Two Forksdam site
Boulder
Aurora
Lakewood
Brighton
WELD
ADAMS
ARAPAHOE
DENVER
DOUGLASJEFFERSON
BOULDER
So
uth
Pla
tte
Riv
er
So
uth
Pla
tte
Riv
er
1970 Population - 1,327,570Includes Denver, Adams, Arapahoe,Douglas, Jefferson, Boulder, andWeld Counties. NOTE: portions of theabove listed counties may not bevisible on the map
Red areas shown as developed land175,400 acres (274 square miles)
1973
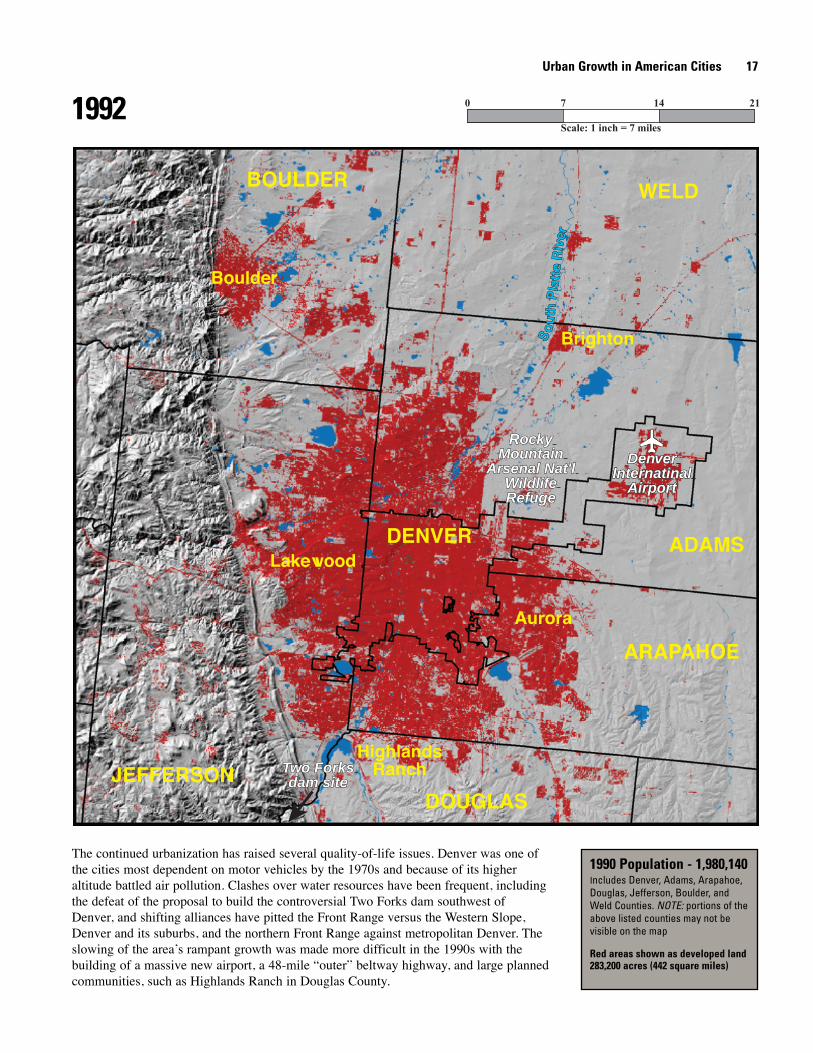
The continued urbanization has raised several quality-of-life issues. Denver was one ofthe cities most dependent on motor vehicles by the 1970s and because of its higheraltitude battled air pollution. Clashes over water resources have been frequent, includingthe defeat of the proposal to build the controversial Two Forks dam southwest ofDenver, and shifting alliances have pitted the Front Range versus the Western Slope,Denver and its suburbs, and the northern Front Range against metropolitan Denver. Theslowing of the area’s rampant growth was made more difficult in the 1990s with thebuilding of a massive new airport, a 48-mile “outer” beltway highway, and large plannedcommunities, such as Highlands Ranch in Douglas County.
Urban Growth in American Cities 17
1990 Population - 1,980,140Includes Denver, Adams, Arapahoe,Douglas, Jefferson, Boulder, andWeld Counties. NOTE: portions of theabove listed counties may not bevisible on the map
Red areas shown as developed land283,200 acres (442 square miles)
1992
RockyMountain
Arsenal Nat'lWildlifeRefuge
DenverInternatinal
Airport
DenverInternatinal
Airport
DenverInternatinal
Airport
Two Forksdam site
RockyMountain
Arsenal Nat'lWildlifeRefuge
DenverInternatinal
Airport
Two Forksdam site
Boulder
Aurora
Lakewood
HighlandsRanch
Brighton
WELD
ADAMS
ARAPAHOE
DENVER
DOUGLASJEFFERSON
BOULDER
So
uth
Pla
tte
Riv
er
So
uth
Pla
tte
Riv
er
Scale: 1 inch = 7 miles
0 7 14 21
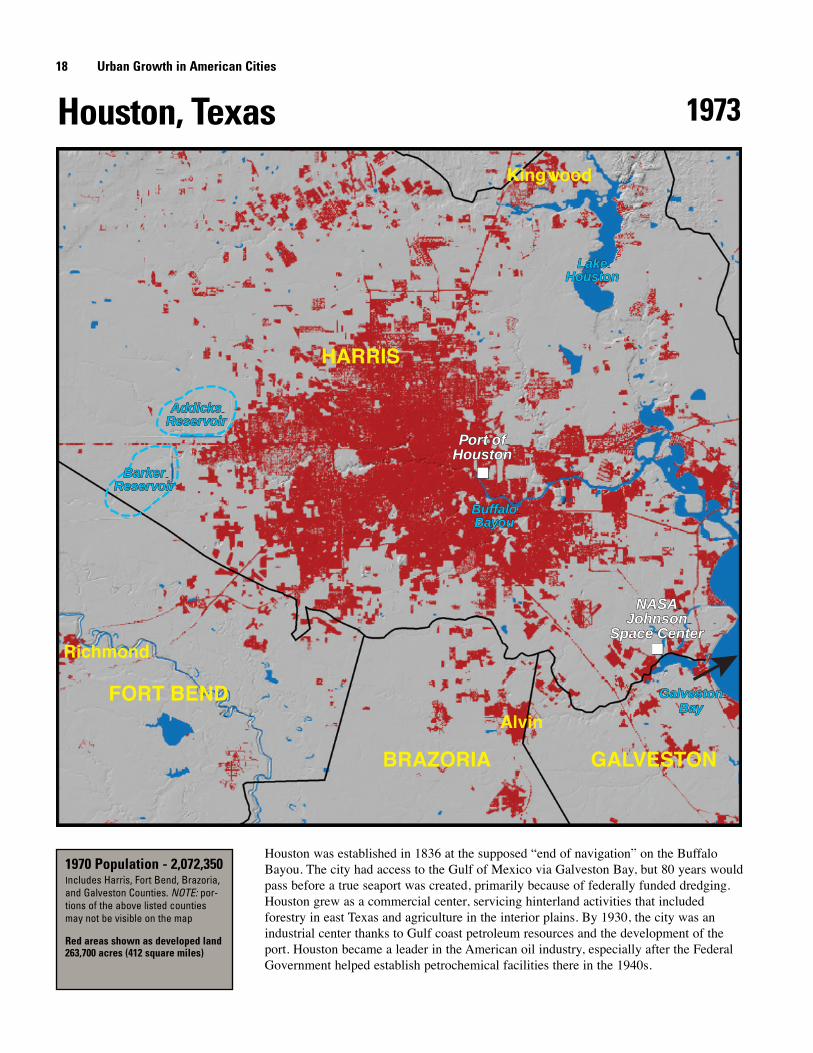
Houston was established in 1836 at the supposed “end of navigation” on the BuffaloBayou. The city had access to the Gulf of Mexico via Galveston Bay, but 80 years wouldpass before a true seaport was created, primarily because of federally funded dredging.Houston grew as a commercial center, servicing hinterland activities that includedforestry in east Texas and agriculture in the interior plains. By 1930, the city was anindustrial center thanks to Gulf coast petroleum resources and the development of theport. Houston became a leader in the American oil industry, especially after the FederalGovernment helped establish petrochemical facilities there in the 1940s.
18 Urban Growth in American Cities
Houston, Texas
Port ofHoustonPort of
Houston
NASAJohnson
Space Center
NASAJohnson
Space Center
Kingwood
Alvin
Richmond
BRAZORIA
FORT BEND
GALVESTON
HARRIS
LakeHouston
LakeHouston
BuffaloBayouBuffaloBayou
AddicksReservoirAddicks
Reservoir
GalvestonBay
GalvestonBay
BarkerReservoir
BarkerReservoir
1970 Population - 2,072,350Includes Harris, Fort Bend, Brazoria,and Galveston Counties. NOTE: por-tions of the above listed countiesmay not be visible on the map
Red areas shown as developed land263,700 acres (412 square miles)
1973
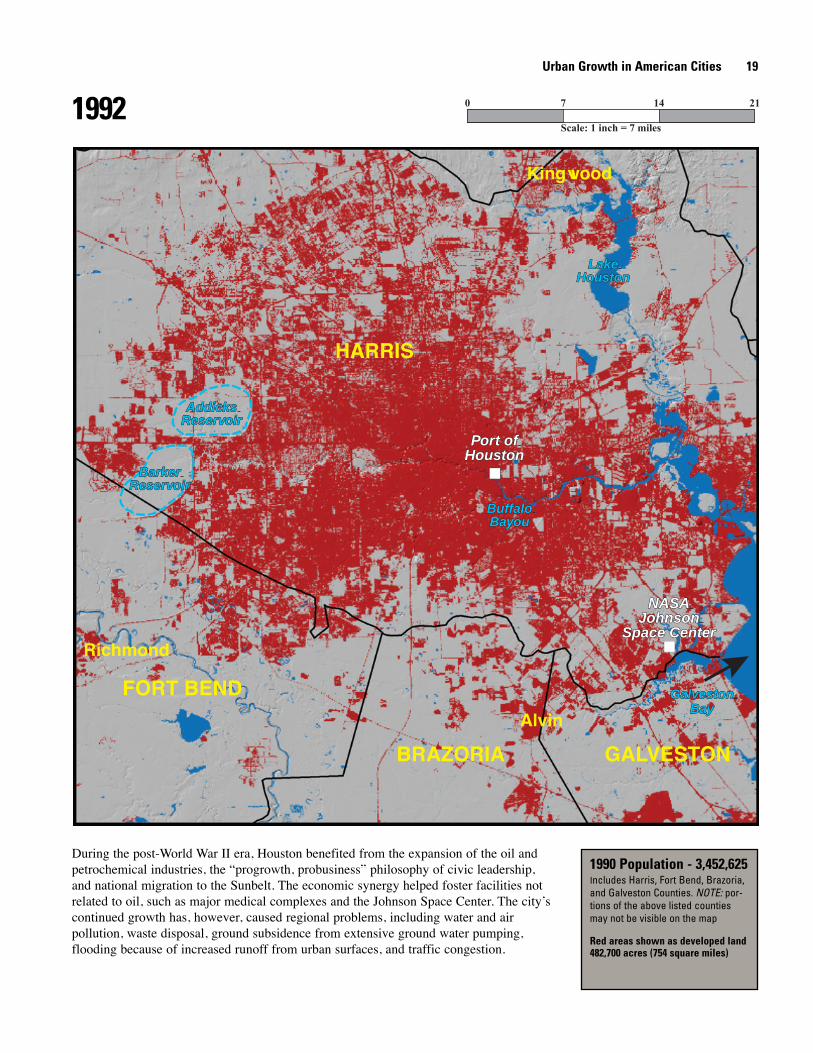
During the post-World War II era, Houston benefited from the expansion of the oil andpetrochemical industries, the “progrowth, probusiness” philosophy of civic leadership,and national migration to the Sunbelt. The economic synergy helped foster facilities notrelated to oil, such as major medical complexes and the Johnson Space Center. The city’scontinued growth has, however, caused regional problems, including water and airpollution, waste disposal, ground subsidence from extensive ground water pumping,flooding because of increased runoff from urban surfaces, and traffic congestion.
Urban Growth in American Cities 19
1990 Population - 3,452,625Includes Harris, Fort Bend, Brazoria,and Galveston Counties. NOTE: por-tions of the above listed countiesmay not be visible on the map
Red areas shown as developed land482,700 acres (754 square miles)
1992
Port ofHoustonPort of
Houston
NASAJohnson
Space Center
NASAJohnson
Space Center
Kingwood
Alvin
Richmond
BRAZORIA
FORT BEND
GALVESTON
HARRIS
LakeHouston
LakeHouston
BuffaloBayouBuffaloBayou
AddicksReservoirAddicks
Reservoir
GalvestonBay
GalvestonBay
BarkerReservoir
BarkerReservoir
Scale: 1 inch = 7 miles
0 7 14 21
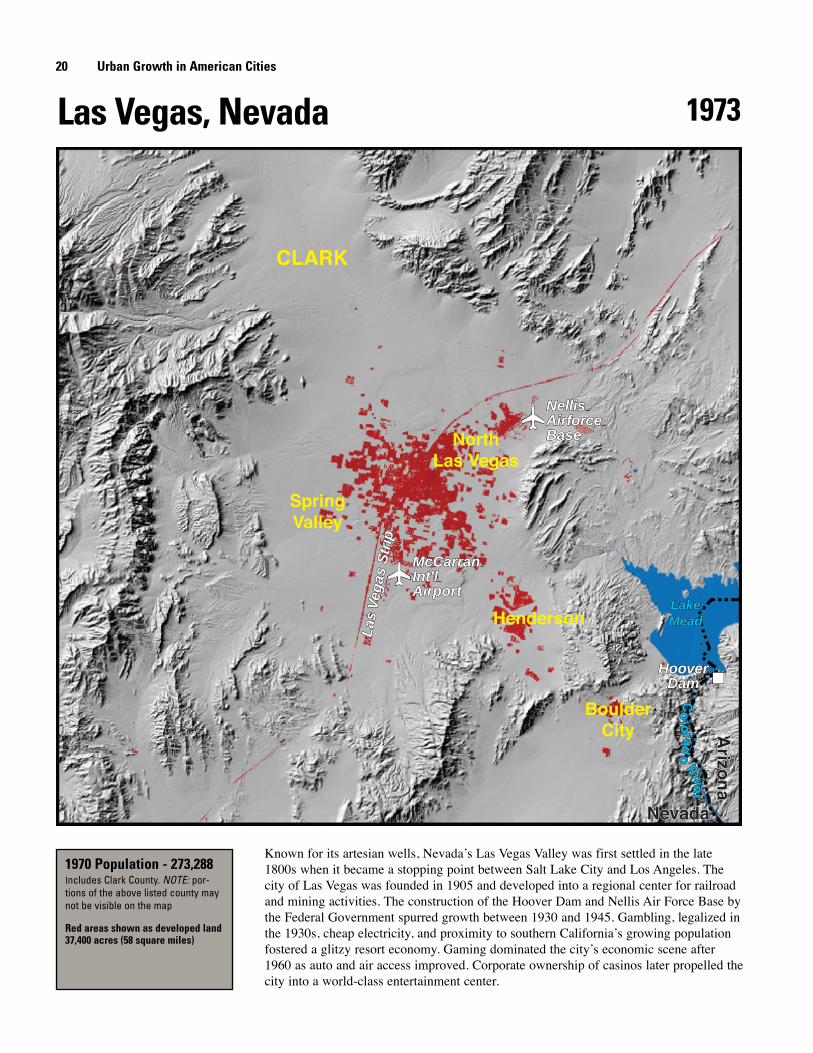
Known for its artesian wells, Nevada’s Las Vegas Valley was first settled in the late1800s when it became a stopping point between Salt Lake City and Los Angeles. Thecity of Las Vegas was founded in 1905 and developed into a regional center for railroadand mining activities. The construction of the Hoover Dam and Nellis Air Force Base bythe Federal Government spurred growth between 1930 and 1945. Gambling, legalized inthe 1930s, cheap electricity, and proximity to southern California’s growing populationfostered a glitzy resort economy. Gaming dominated the city’s economic scene after1960 as auto and air access improved. Corporate ownership of casinos later propelled thecity into a world-class entertainment center.
20 Urban Growth in American Cities
Las Vegas, Nevada
NellisAirforceBase
NellisAirforceBase
HooverDam
HooverDam
Las
Veg
as S
trip
Las
Veg
as S
trip
McCarranInt'lAirport
McCarranInt'lAirport
NorthLas Vegas
SpringValley
Henderson
BoulderCity
CLARK
NevadaNevada
Arizo
na
Arizo
na
LakeMeadLakeMead
Co
lorado
River
Co
lorado
River
1970 Population - 273,288Includes Clark County. NOTE: por-tions of the above listed county maynot be visible on the map
Red areas shown as developed land37,400 acres (58 square miles)
1973
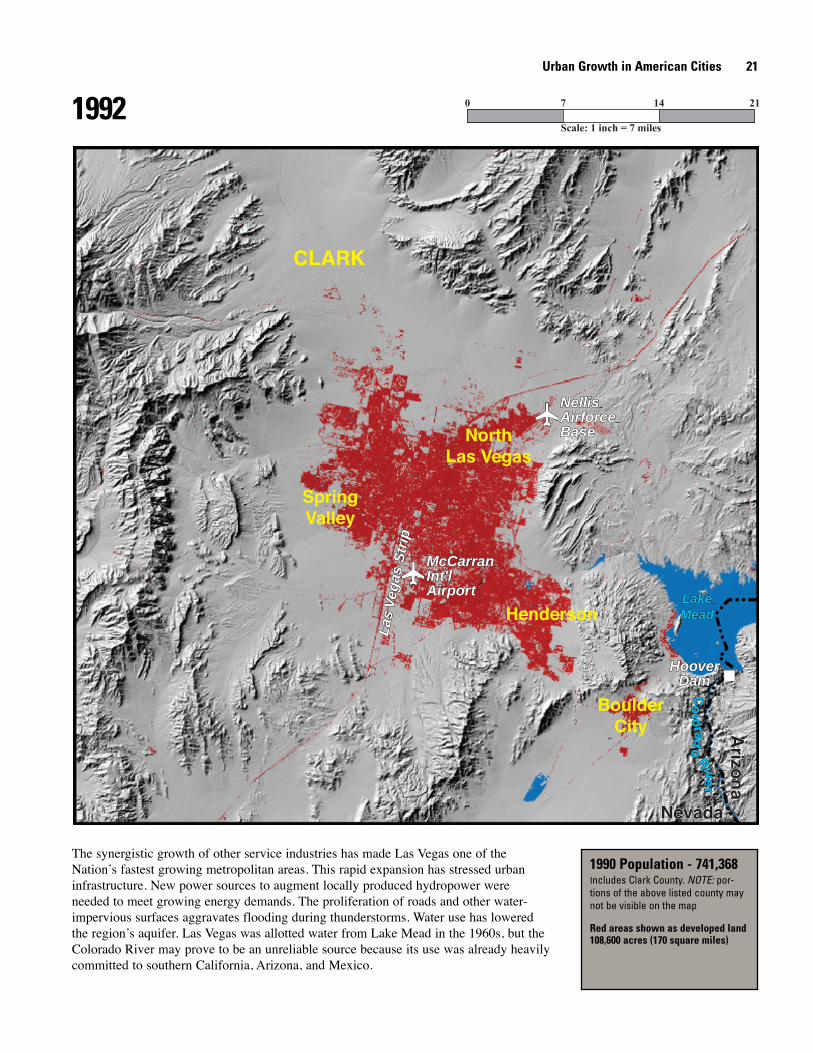
The synergistic growth of other service industries has made Las Vegas one of theNation’s fastest growing metropolitan areas. This rapid expansion has stressed urbaninfrastructure. New power sources to augment locally produced hydropower wereneeded to meet growing energy demands. The proliferation of roads and other water-impervious surfaces aggravates flooding during thunderstorms. Water use has loweredthe region’s aquifer. Las Vegas was allotted water from Lake Mead in the 1960s, but theColorado River may prove to be an unreliable source because its use was already heavilycommitted to southern California, Arizona, and Mexico.
Urban Growth in American Cities 21
1990 Population - 741,368Includes Clark County. NOTE: por-tions of the above listed county maynot be visible on the map
Red areas shown as developed land108,600 acres (170 square miles)
1992
NellisAirforceBase
NellisAirforceBase
Las
Veg
as S
trip
Las
Veg
as S
trip
HooverDam
HooverDam
McCarranInt'lAirport
McCarranInt'lAirport
NorthLas Vegas
SpringValley
Henderson
BoulderCity
CLARK
NevadaNevada
Arizo
na
Arizo
na
LakeMeadLakeMead
Co
lorado
River
Co
lorado
River
Scale: 1 inch = 7 miles
0 7 14 21
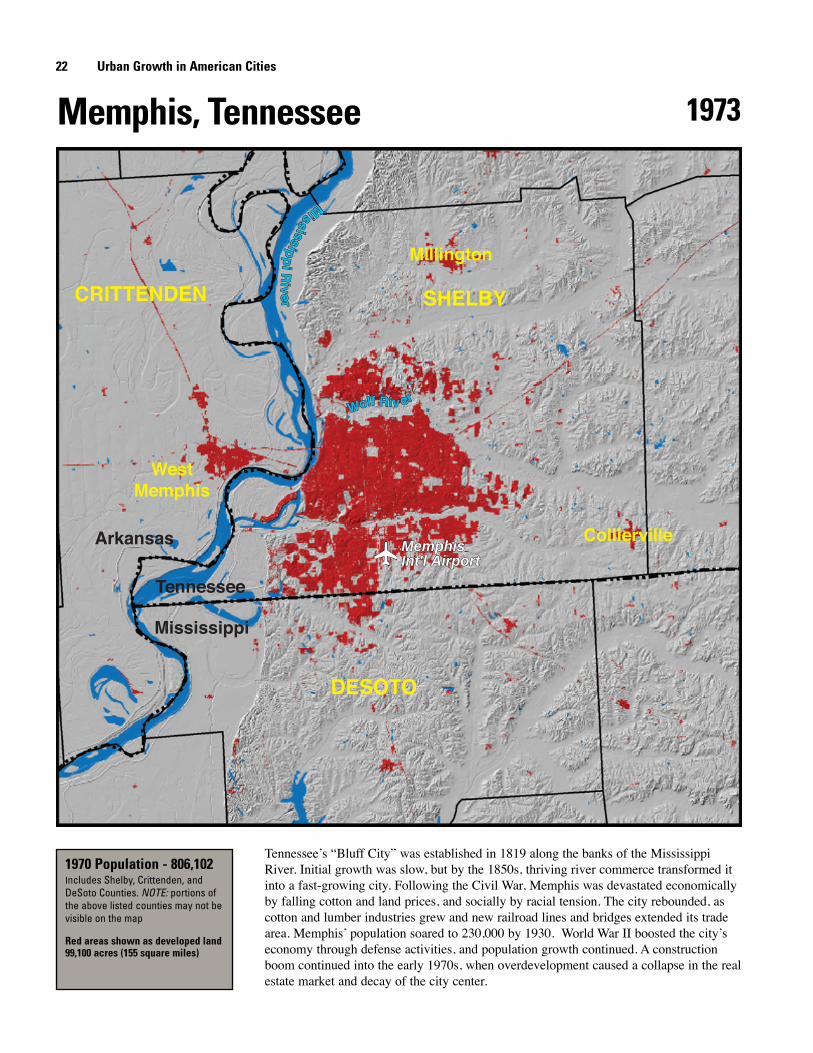
Tennessee’s “Bluff City” was established in 1819 along the banks of the MississippiRiver. Initial growth was slow, but by the 1850s, thriving river commerce transformed itinto a fast-growing city. Following the Civil War, Memphis was devastated economicallyby falling cotton and land prices, and socially by racial tension. The city rebounded, ascotton and lumber industries grew and new railroad lines and bridges extended its tradearea. Memphis’ population soared to 230,000 by 1930. World War II boosted the city’seconomy through defense activities, and population growth continued. A constructionboom continued into the early 1970s, when overdevelopment caused a collapse in the realestate market and decay of the city center.
22 Urban Growth in American Cities
Memphis, Tennessee
MemphisInt'l AirportMemphisInt'l Airport
Collierville
WestMemphis
Millington
SHELBY
DESOTO
CRITTENDEN
Arkansas
Tennessee
Mississippi
Mississipp
iRiver
Mississipp
iRiver
Wolf Riv erWolf Riv er
1970 Population - 806,102Includes Shelby, Crittenden, andDeSoto Counties. NOTE: portions ofthe above listed counties may not bevisible on the map
Red areas shown as developed land99,100 acres (155 square miles)
1973
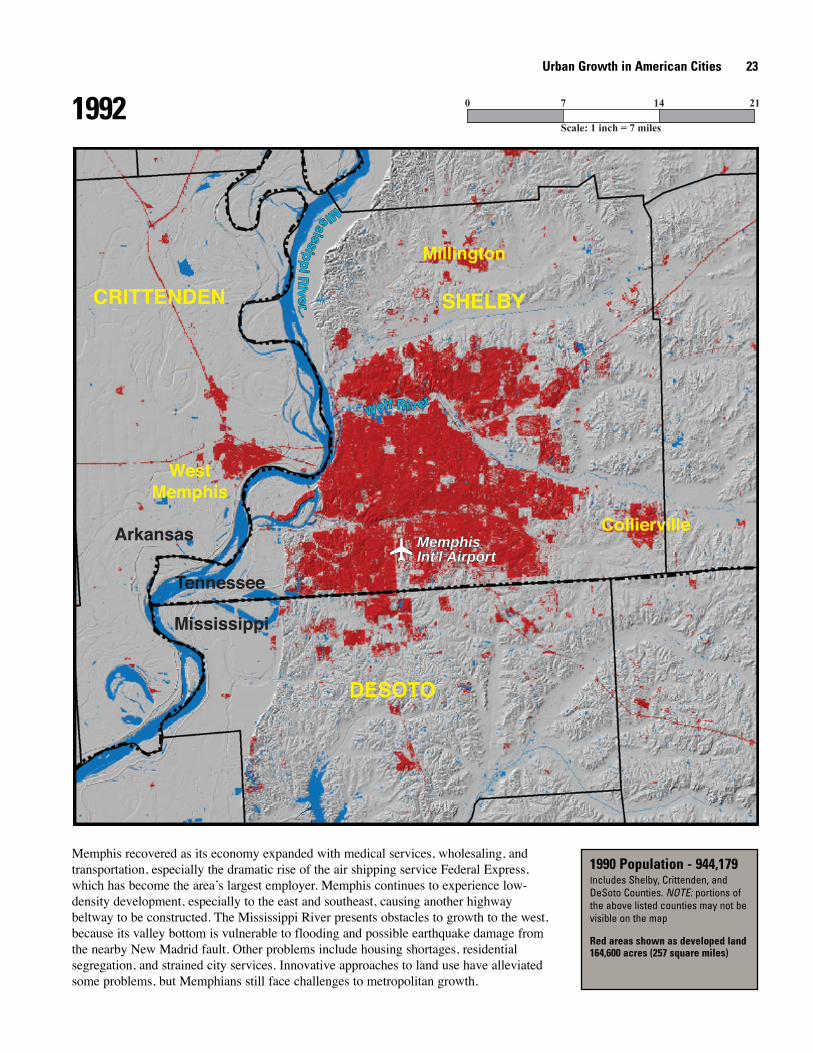
Memphis recovered as its economy expanded with medical services, wholesaling, andtransportation, especially the dramatic rise of the air shipping service Federal Express,which has become the area’s largest employer. Memphis continues to experience low-density development, especially to the east and southeast, causing another highwaybeltway to be constructed. The Mississippi River presents obstacles to growth to the west,because its valley bottom is vulnerable to flooding and possible earthquake damage fromthe nearby New Madrid fault. Other problems include housing shortages, residentialsegregation, and strained city services. Innovative approaches to land use have alleviatedsome problems, but Memphians still face challenges to metropolitan growth.
Urban Growth in American Cities 23
1990 Population - 944,179Includes Shelby, Crittenden, andDeSoto Counties. NOTE: portions ofthe above listed counties may not bevisible on the map
Red areas shown as developed land164,600 acres (257 square miles)
1992
MemphisInt'l AirportMemphisInt'l Airport
Collierville
Millington
WestMemphis
SHELBY
DESOTO
CRITTENDEN
Arkansas
Tennessee
Mississippi
Mississipp
iRiver
Mississipp
iRiver
Wolf Riv erWolf Riv er
Scale: 1 inch = 7 miles
0 7 14 21

Minneapolis and St. Paul were founded approximately 10 miles apart along the upperreaches of the Mississippi River by the 1850s. St. Paul was at the end of navigation andMinneapolis at the site of significant waterpower. They became marketing centers fortimber from the northern forests and agricultural commodities from the prairie. The TwinCities developed into a regional railroad hub and a centralized source of wholesalegoods and financial services for much of the Upper Midwest, including northernMontana. The metropolitan area flourished after World War II. Local entrepreneursfounded several corporations that rose to national prominence.
24 Urban Growth in American Cities
Minneapolis-St. Paul, Minnesota
Lock & DamNo. 2
Lock & DamNo. 2
Minneapolis
St. Paul
Chaska
Blaine
Stillwater
Elk River
AppleValley
ANOKA
HENNEPIN RAMSEY
CARVER
SCOTTDAKOTA
WASHINGTON
Lake MinnetonkaLake Minnetonka
Minnesota RiverMinnesota River
Mississip
pi R
iver
Mississip
pi R
iver
1970 Population - 1,874,612Includes Anoka, Washington, Dakota,Scott, Carver, Hennepin, and RamseyCounties. NOTE: portions of the abovelisted counties may not be visible onthe map
Red areas shown as developed land228,200 acres (356 square miles)
1973
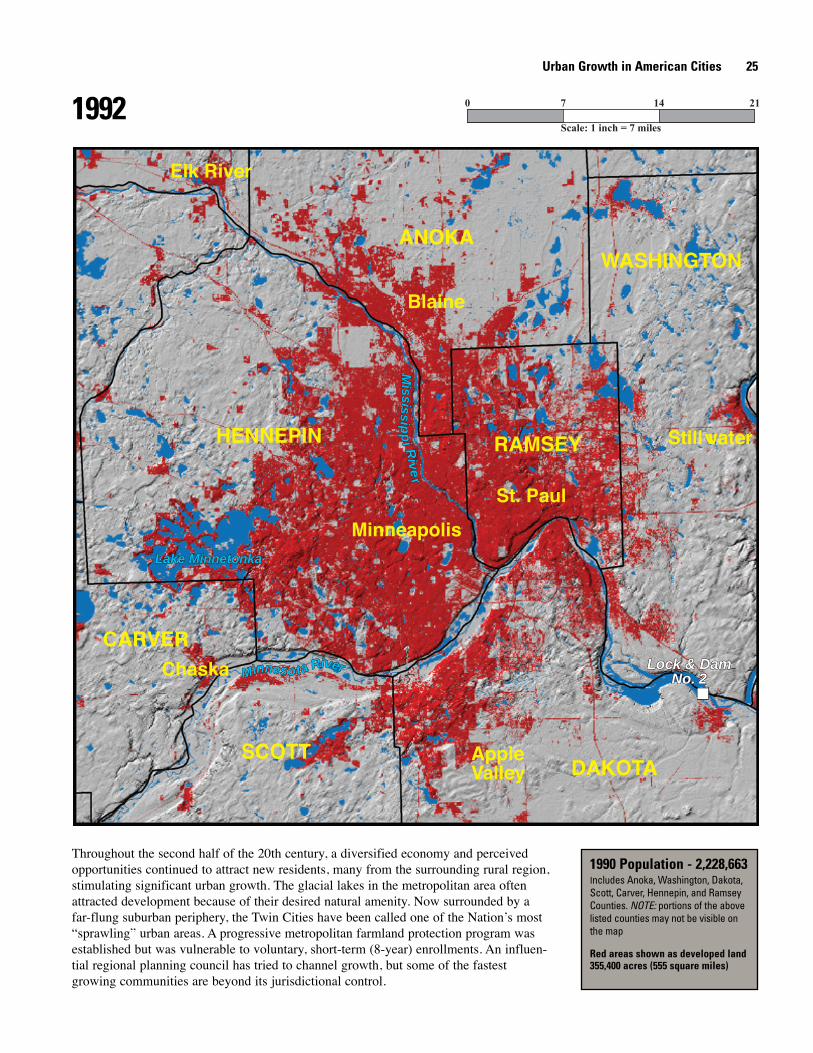
Throughout the second half of the 20th century, a diversified economy and perceivedopportunities continued to attract new residents, many from the surrounding rural region,stimulating significant urban growth. The glacial lakes in the metropolitan area oftenattracted development because of their desired natural amenity. Now surrounded by afar-flung suburban periphery, the Twin Cities have been called one of the Nation’s most“sprawling” urban areas. A progressive metropolitan farmland protection program wasestablished but was vulnerable to voluntary, short-term (8-year) enrollments. An influen-tial regional planning council has tried to channel growth, but some of the fastestgrowing communities are beyond its jurisdictional control.
Urban Growth in American Cities 25
1990 Population - 2,228,663Includes Anoka, Washington, Dakota,Scott, Carver, Hennepin, and RamseyCounties. NOTE: portions of the abovelisted counties may not be visible onthe map
Red areas shown as developed land355,400 acres (555 square miles)
1992
Lock & DamNo. 2
Lock & DamNo. 2
Minneapolis
St. Paul
Chaska
Blaine
Stillwater
Elk River
AppleValley
ANOKA
HENNEPIN RAMSEY
CARVER
SCOTTDAKOTA
WASHINGTON
Lake MinnetonkaLake Minnetonka
Minnesota RiverMinnesota River
Mississip
pi R
iver
Mississip
pi R
iver
Scale: 1 inch = 7 miles
0 7 14 21
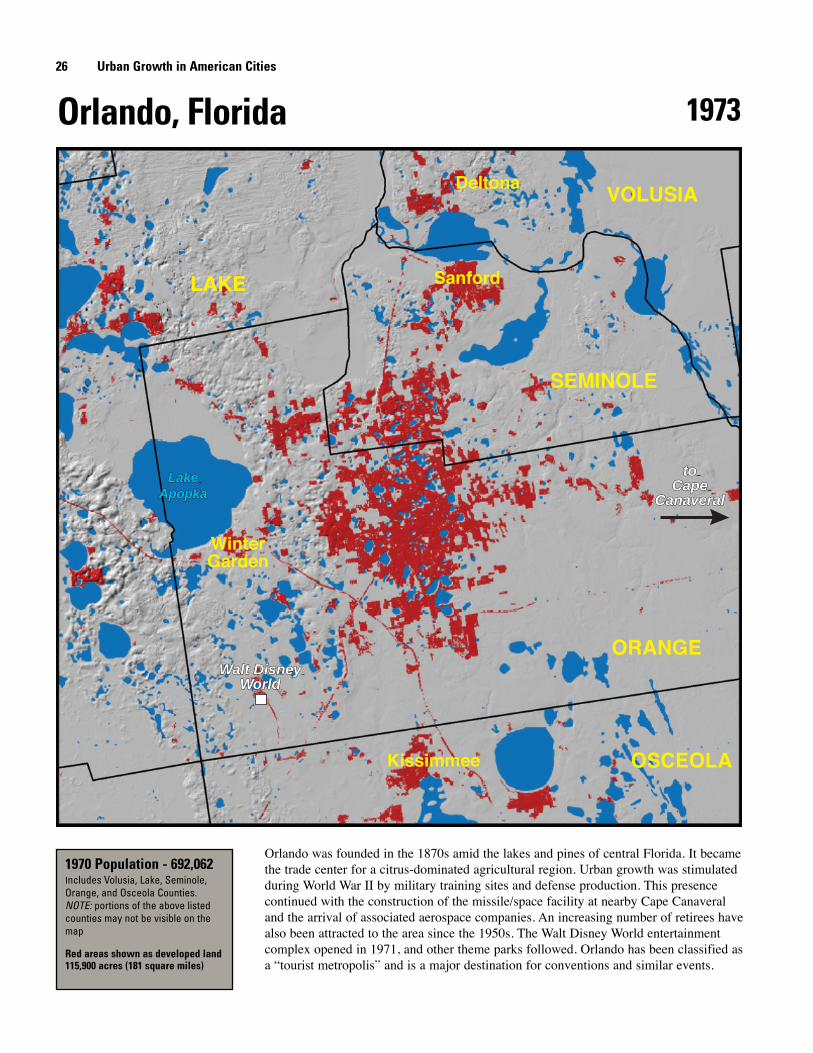
Orlando was founded in the 1870s amid the lakes and pines of central Florida. It becamethe trade center for a citrus-dominated agricultural region. Urban growth was stimulatedduring World War II by military training sites and defense production. This presencecontinued with the construction of the missile/space facility at nearby Cape Canaveraland the arrival of associated aerospace companies. An increasing number of retirees havealso been attracted to the area since the 1950s. The Walt Disney World entertainmentcomplex opened in 1971, and other theme parks followed. Orlando has been classified asa “tourist metropolis” and is a major destination for conventions and similar events.
26 Urban Growth in American Cities
Orlando, Florida
Walt DisneyWorld
Walt DisneyWorld
toCape
Canaveral
toCape
Canaveral
Kissimmee
Sanford
WinterGarden
Deltona
OSCEOLA
ORANGE
SEMINOLE
VOLUSIA
LAKE
LakeApopka
LakeApopka
1970 Population - 692,062Includes Volusia, Lake, Seminole,Orange, and Osceola Counties.NOTE: portions of the above listedcounties may not be visible on themap
Red areas shown as developed land115,900 acres (181 square miles)
1973
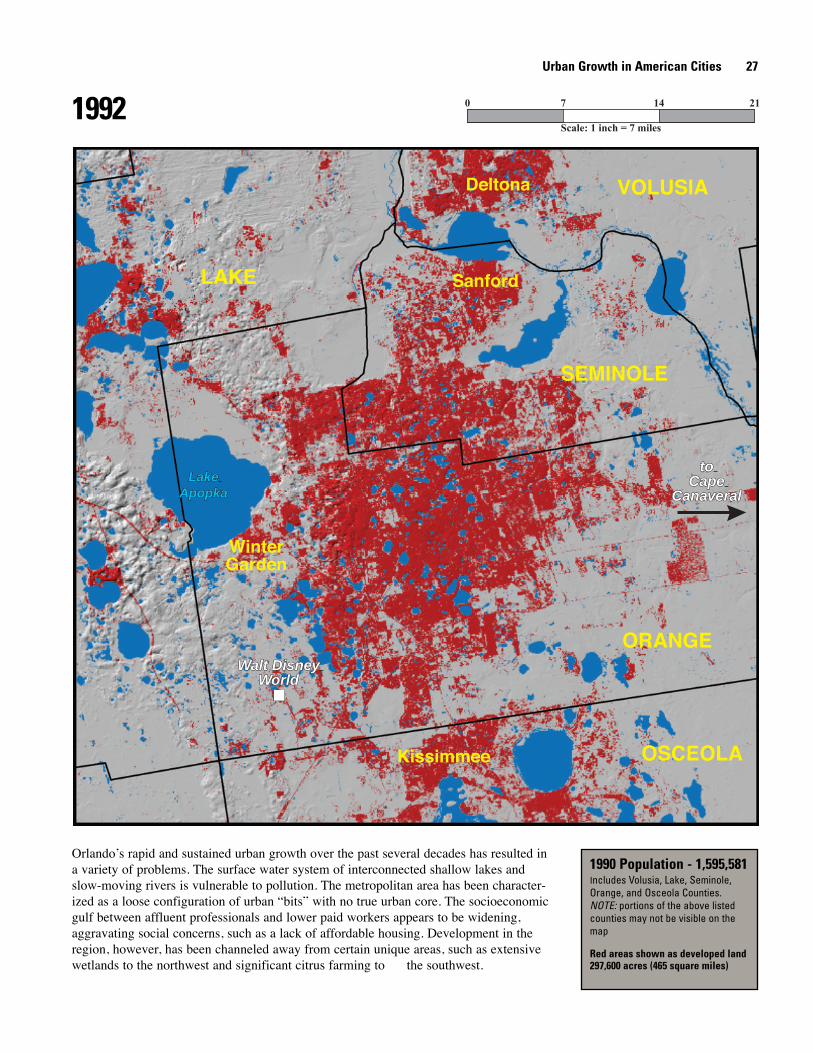
Orlando’s rapid and sustained urban growth over the past several decades has resulted ina variety of problems. The surface water system of interconnected shallow lakes andslow-moving rivers is vulnerable to pollution. The metropolitan area has been character-ized as a loose configuration of urban “bits” with no true urban core. The socioeconomicgulf between affluent professionals and lower paid workers appears to be widening,aggravating social concerns, such as a lack of affordable housing. Development in theregion, however, has been channeled away from certain unique areas, such as extensivewetlands to the northwest and significant citrus farming to the southwest.
Urban Growth in American Cities 27
1990 Population - 1,595,581Includes Volusia, Lake, Seminole,Orange, and Osceola Counties.NOTE: portions of the above listedcounties may not be visible on themap
Red areas shown as developed land297,600 acres (465 square miles)
1992
Walt DisneyWorld
Walt DisneyWorld
toCape
Canaveral
toCape
Canaveral
Kissimmee
Deltona
Sanford
WinterGarden
OSCEOLA
ORANGE
SEMINOLE
VOLUSIA
LAKE
LakeApopka
LakeApopka
Scale: 1 inch = 7 miles
0 7 14 21
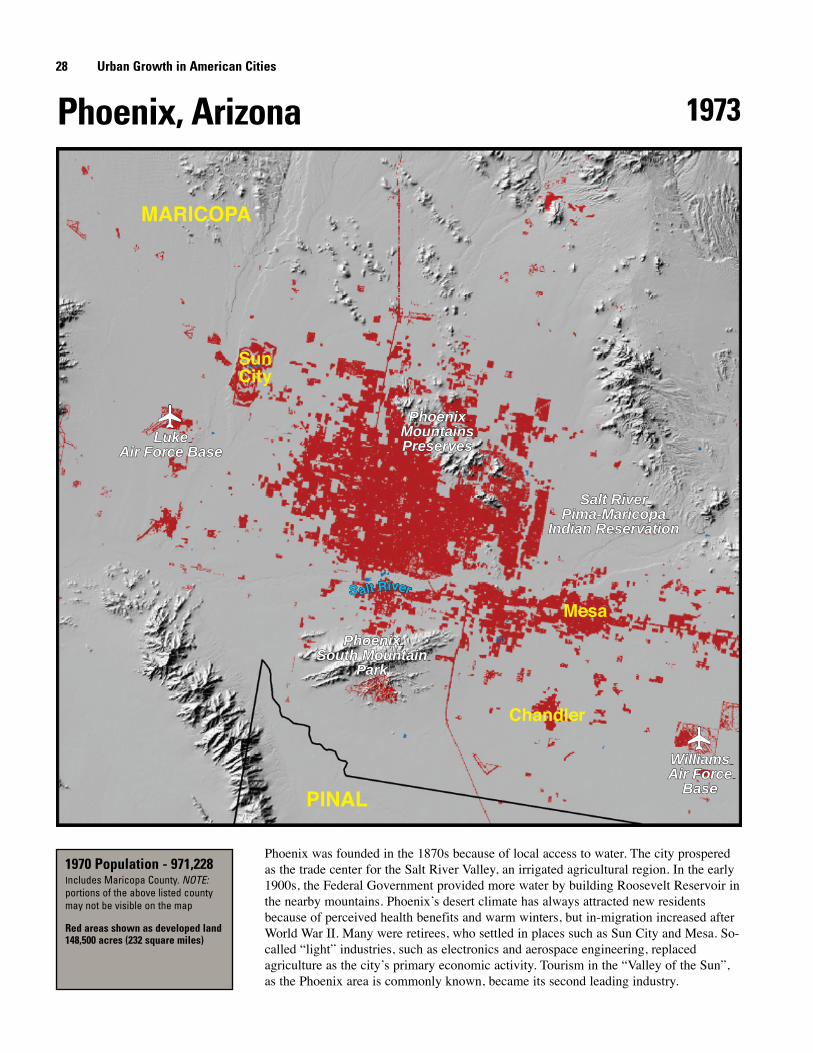
Phoenix was founded in the 1870s because of local access to water. The city prosperedas the trade center for the Salt River Valley, an irrigated agricultural region. In the early1900s, the Federal Government provided more water by building Roosevelt Reservoir inthe nearby mountains. Phoenix’s desert climate has always attracted new residentsbecause of perceived health benefits and warm winters, but in-migration increased afterWorld War II. Many were retirees, who settled in places such as Sun City and Mesa. So-called “light” industries, such as electronics and aerospace engineering, replacedagriculture as the city’s primary economic activity. Tourism in the “Valley of the Sun”,as the Phoenix area is commonly known, became its second leading industry.
28 Urban Growth in American Cities
Phoenix, Arizona
Salt RiverPima-Maricopa
Indian Reservation
Salt RiverPima-Maricopa
Indian Reservation
PhoenixMountainsPreserves
PhoenixMountainsPreserves
PhoenixSouth Mountain
Park
PhoenixSouth Mountain
Park
LukeAir Force Base
WilliamsAir Force
Base
LukeAir Force Base
WilliamsAir Force
Base
Mesa
Chandler
SunCity
PINAL
MARICOPA
S alt RiverS alt River
1970 Population - 971,228Includes Maricopa County. NOTE:portions of the above listed countymay not be visible on the map
Red areas shown as developed land148,500 acres (232 square miles)
1973
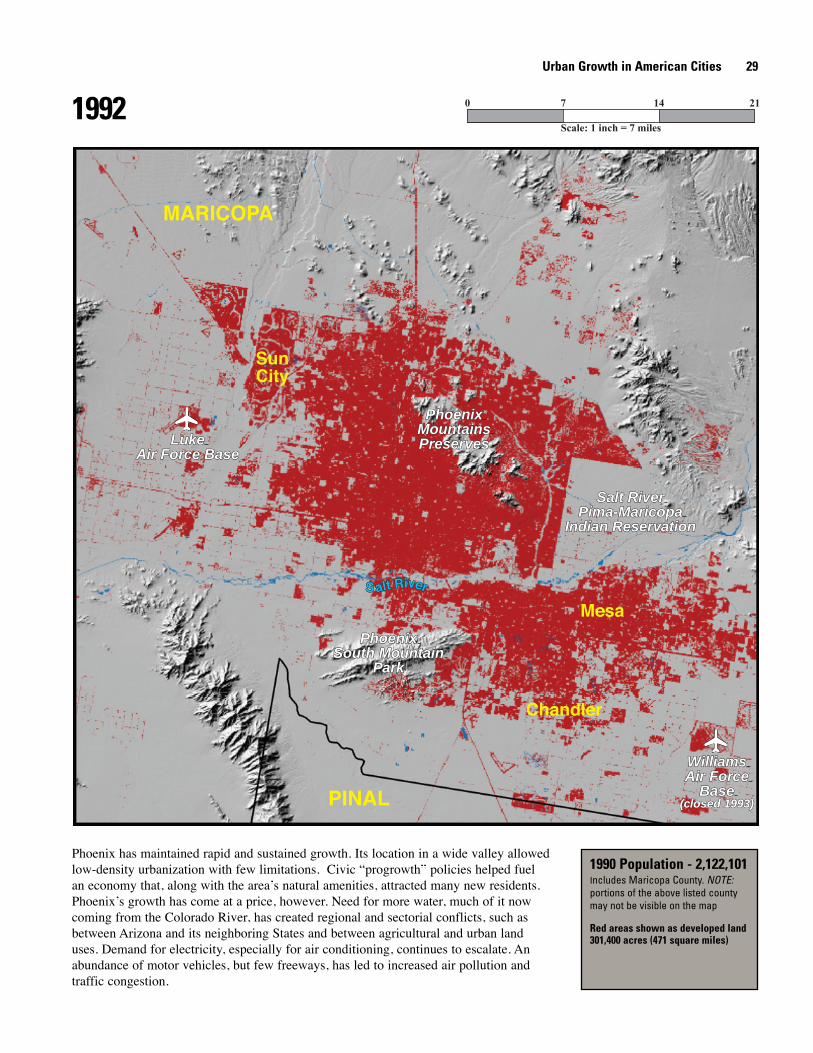
Phoenix has maintained rapid and sustained growth. Its location in a wide valley allowedlow-density urbanization with few limitations. Civic “progrowth” policies helped fuelan economy that, along with the area’s natural amenities, attracted many new residents.Phoenix’s growth has come at a price, however. Need for more water, much of it nowcoming from the Colorado River, has created regional and sectorial conflicts, such asbetween Arizona and its neighboring States and between agricultural and urban landuses. Demand for electricity, especially for air conditioning, continues to escalate. Anabundance of motor vehicles, but few freeways, has led to increased air pollution andtraffic congestion.
Urban Growth in American Cities 29
1990 Population - 2,122,101Includes Maricopa County. NOTE:portions of the above listed countymay not be visible on the map
Red areas shown as developed land301,400 acres (471 square miles)
1992
Salt RiverPima-Maricopa
Indian Reservation
Salt RiverPima-Maricopa
Indian Reservation
PhoenixMountainsPreserves
PhoenixMountainsPreserves
PhoenixSouth Mountain
Park
PhoenixSouth Mountain
Park
LukeAir Force Base
LukeAir Force Base
WilliamsAir Force
Base(closed 1993)losed 1993)
WilliamsAir Force
Base(closed 1993)
Mesa
SunCity
Chandler
PINAL
MARICOPA
S alt RiverS alt River
Scale: 1 inch = 7 miles
0 7 14 21
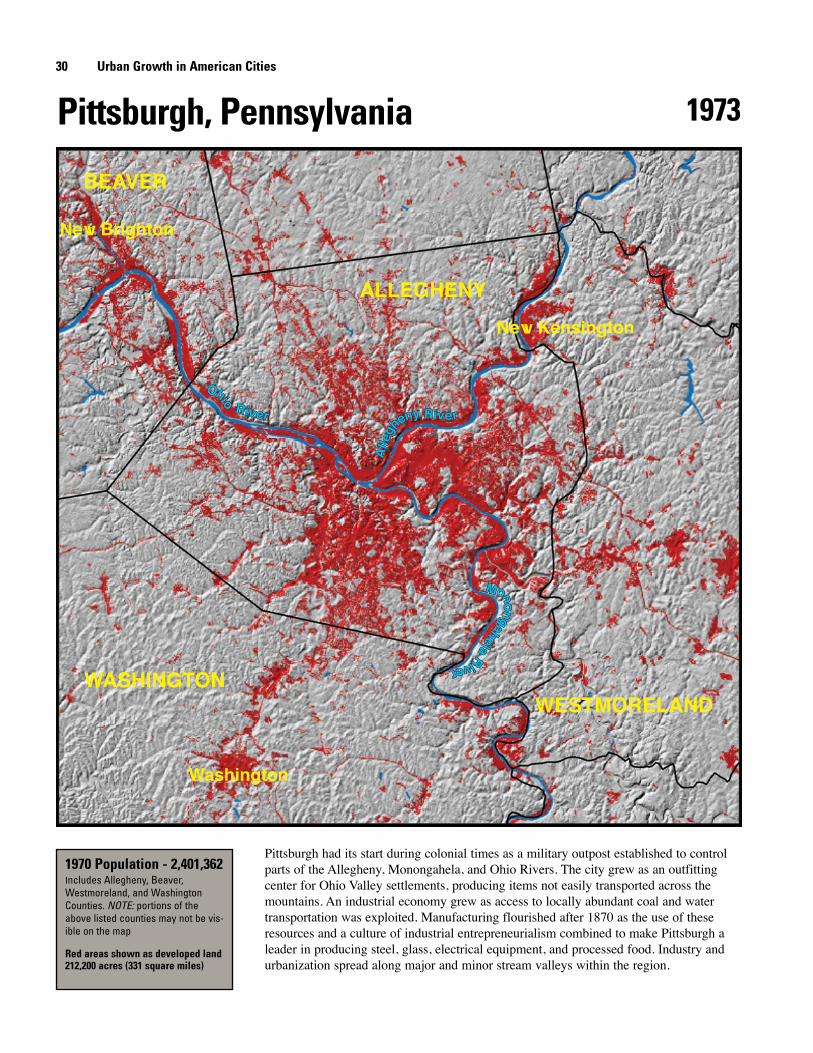
Pittsburgh had its start during colonial times as a military outpost established to controlparts of the Allegheny, Monongahela, and Ohio Rivers. The city grew as an outfittingcenter for Ohio Valley settlements, producing items not easily transported across themountains. An industrial economy grew as access to locally abundant coal and watertransportation was exploited. Manufacturing flourished after 1870 as the use of theseresources and a culture of industrial entrepreneurialism combined to make Pittsburgh aleader in producing steel, glass, electrical equipment, and processed food. Industry andurbanization spread along major and minor stream valleys within the region.
30 Urban Growth in American Cities
Pittsburgh, Pennsylvania
New Kensington
Washington
New Brighton
BEAVER
WESTMORELANDWASHINGTON
ALLEGHENY
Ohio
River
Ohio
River
MonongahelaRiver
MonongahelaRiver
Alle
gheny River
Alle
gheny River
1970 Population - 2,401,362Includes Allegheny, Beaver,Westmoreland, and WashingtonCounties. NOTE: portions of theabove listed counties may not be vis-ible on the map
Red areas shown as developed land212,200 acres (331 square miles)
1973
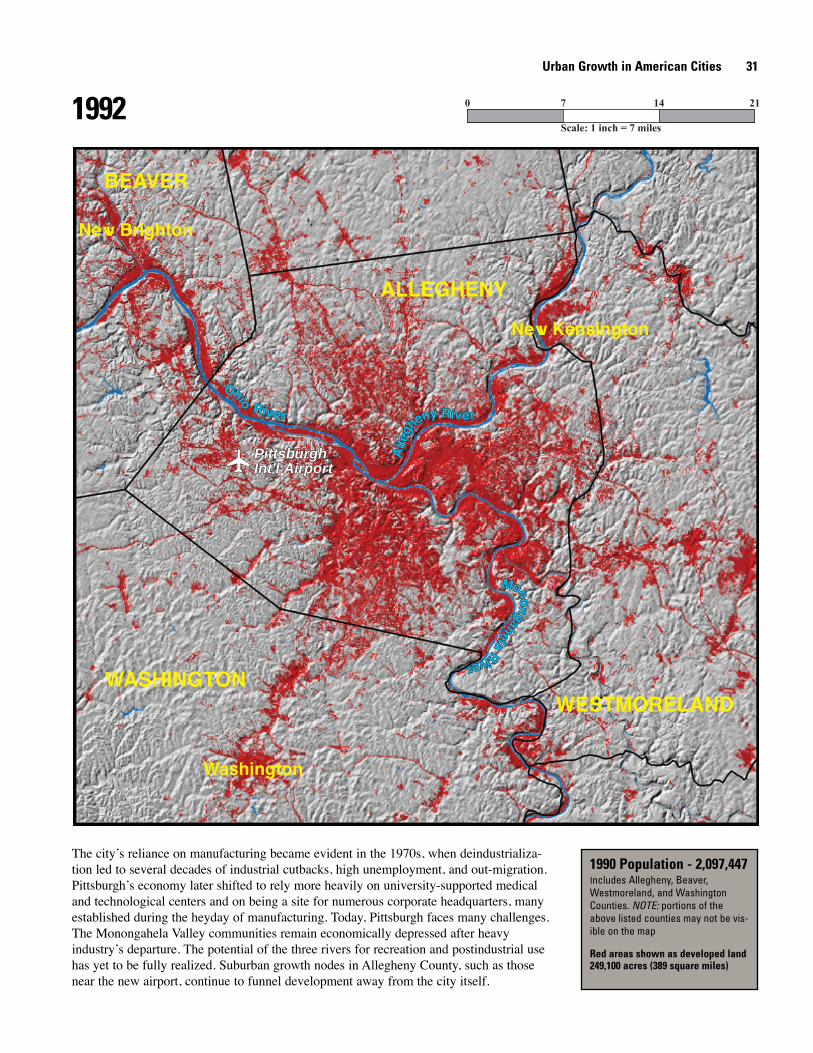
The city’s reliance on manufacturing became evident in the 1970s, when deindustrializa-tion led to several decades of industrial cutbacks, high unemployment, and out-migration.Pittsburgh’s economy later shifted to rely more heavily on university-supported medicaland technological centers and on being a site for numerous corporate headquarters, manyestablished during the heyday of manufacturing. Today, Pittsburgh faces many challenges.The Monongahela Valley communities remain economically depressed after heavyindustry’s departure. The potential of the three rivers for recreation and postindustrial usehas yet to be fully realized. Suburban growth nodes in Allegheny County, such as thosenear the new airport, continue to funnel development away from the city itself.
Urban Growth in American Cities 31
1990 Population - 2,097,447Includes Allegheny, Beaver,Westmoreland, and WashingtonCounties. NOTE: portions of theabove listed counties may not be vis-ible on the map
Red areas shown as developed land249,100 acres (389 square miles)
1992
PittsburghInt'l AirportPittsburghInt'l Airport
New Kensington
Washington
New Brighton
BEAVER
WESTMORELANDWASHINGTON
ALLEGHENY
Ohio
River
Ohio
River
MonongahelaRiver
MonongahelaRiver
Alle
gheny River
Alle
gheny River
Scale: 1 inch = 7 miles
0 7 14 21
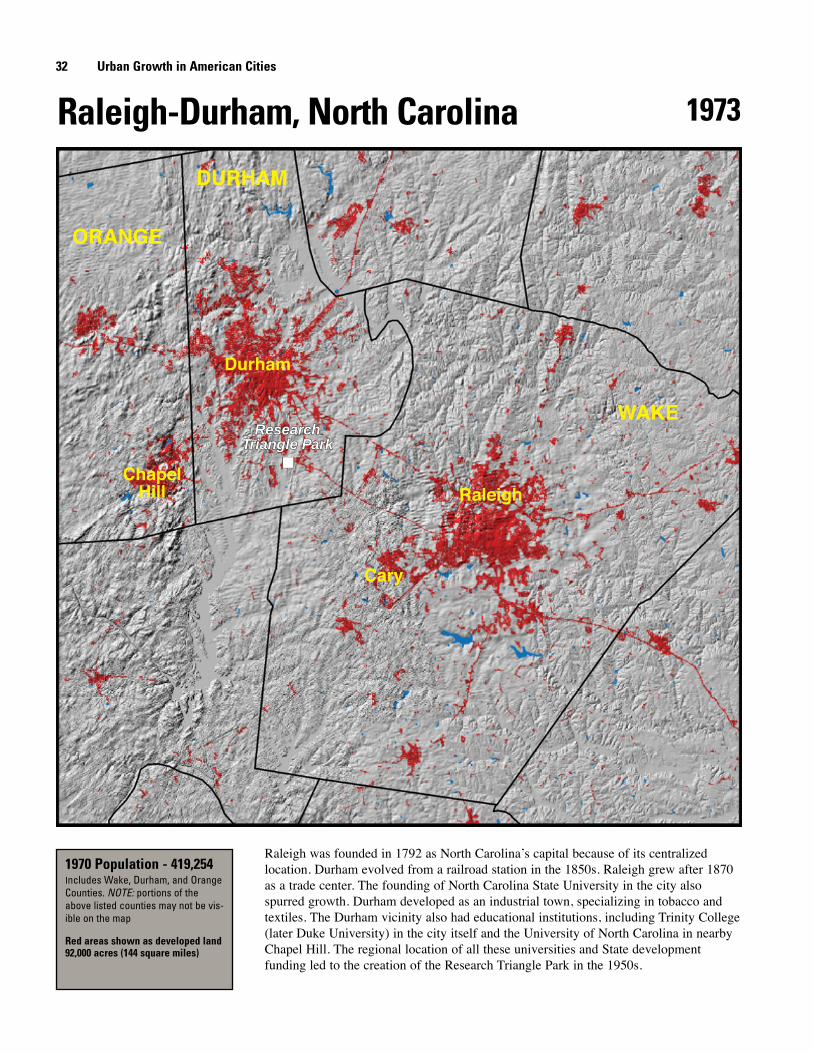
Raleigh was founded in 1792 as North Carolina’s capital because of its centralizedlocation. Durham evolved from a railroad station in the 1850s. Raleigh grew after 1870as a trade center. The founding of North Carolina State University in the city alsospurred growth. Durham developed as an industrial town, specializing in tobacco andtextiles. The Durham vicinity also had educational institutions, including Trinity College(later Duke University) in the city itself and the University of North Carolina in nearbyChapel Hill. The regional location of all these universities and State developmentfunding led to the creation of the Research Triangle Park in the 1950s.
32 Urban Growth in American Cities
Raleigh-Durham, North Carolina
ResearchTriangle Park
ResearchTriangle Park
Raleigh
Cary
ChapelHill
Durham
ORANGE
DURHAM
WAKE
1970 Population - 419,254Includes Wake, Durham, and OrangeCounties. NOTE: portions of theabove listed counties may not be vis-ible on the map
Red areas shown as developed land92,000 acres (144 square miles)
1973
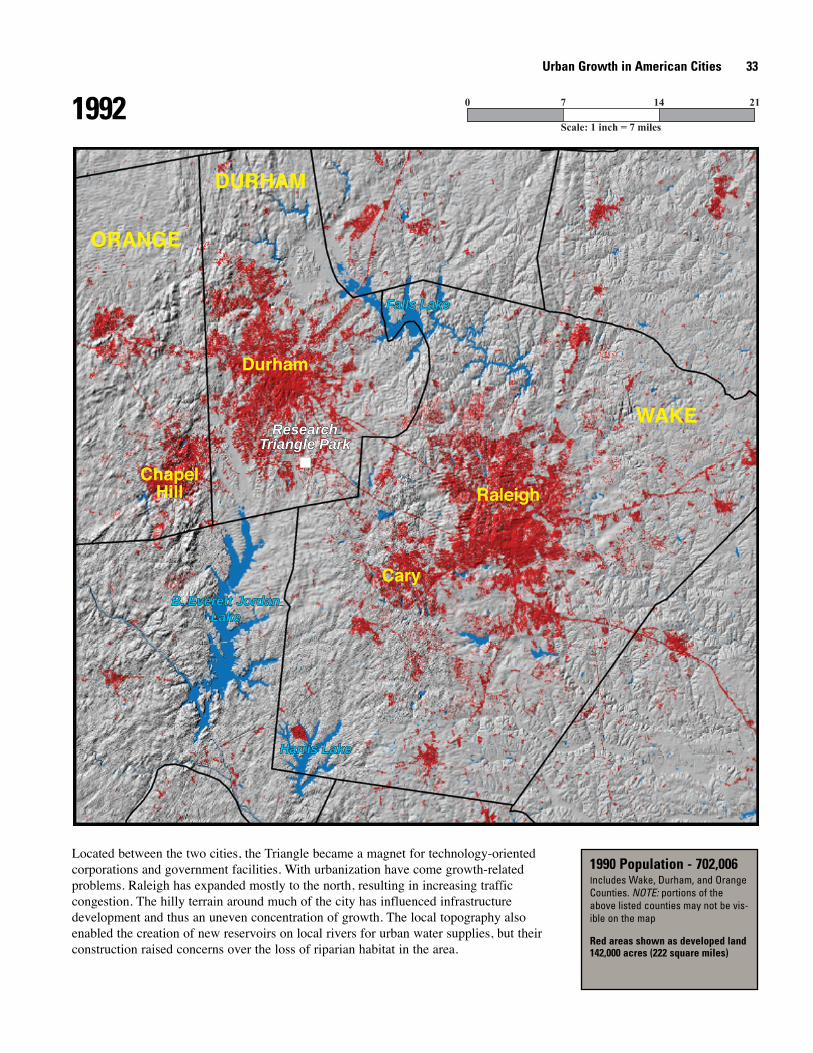
Located between the two cities, the Triangle became a magnet for technology-orientedcorporations and government facilities. With urbanization have come growth-relatedproblems. Raleigh has expanded mostly to the north, resulting in increasing trafficcongestion. The hilly terrain around much of the city has influenced infrastructuredevelopment and thus an uneven concentration of growth. The local topography alsoenabled the creation of new reservoirs on local rivers for urban water supplies, but theirconstruction raised concerns over the loss of riparian habitat in the area.
Urban Growth in American Cities 33
1990 Population - 702,006Includes Wake, Durham, and OrangeCounties. NOTE: portions of theabove listed counties may not be vis-ible on the map
Red areas shown as developed land142,000 acres (222 square miles)
1992
ResearchTriangle Park
ResearchTriangle Park
Raleigh
Cary
ChapelHill
Durham
ORANGE
DURHAM
WAKE
Falls LakeFalls Lake
Harris LakeHarris Lake
B. Everett JordanLake
B. Everett JordanLake
Scale: 1 inch = 7 miles
0 7 14 21
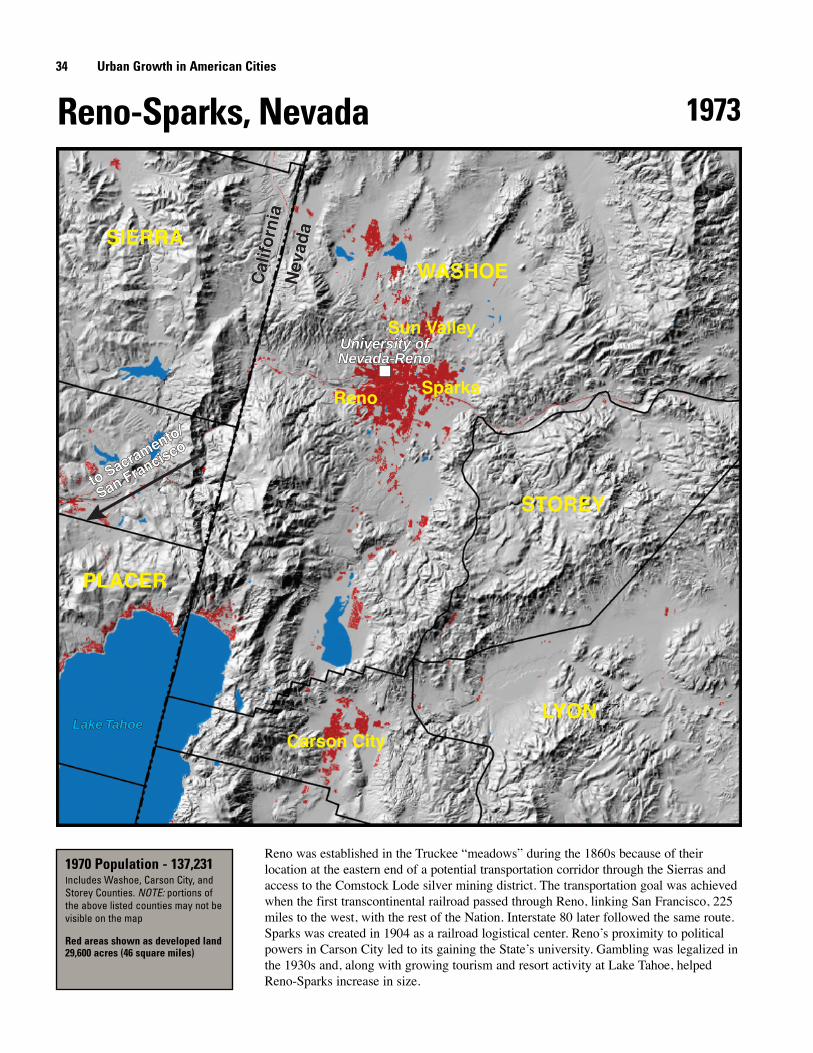
Reno was established in the Truckee “meadows” during the 1860s because of theirlocation at the eastern end of a potential transportation corridor through the Sierras andaccess to the Comstock Lode silver mining district. The transportation goal was achievedwhen the first transcontinental railroad passed through Reno, linking San Francisco, 225miles to the west, with the rest of the Nation. Interstate 80 later followed the same route.Sparks was created in 1904 as a railroad logistical center. Reno’s proximity to politicalpowers in Carson City led to its gaining the State’s university. Gambling was legalized inthe 1930s and, along with growing tourism and resort activity at Lake Tahoe, helpedReno-Sparks increase in size.
34 Urban Growth in American Cities
Reno-Sparks, Nevada
University ofNevada-RenoUniversity ofNevada-Reno
Reno
Sun Valley
Carson City
Sparks
to Sacramento/
San Francisco
to Sacramento/
San Francisco
WASHOE
PLACER
LYON
STOREY
SIERRAC
alifo
rnia
Cal
iforn
iaN
evad
aN
evad
a
Lake TahoeLake Tahoe
1970 Population - 137,231Includes Washoe, Carson City, andStorey Counties. NOTE: portions ofthe above listed counties may not bevisible on the map
Red areas shown as developed land29,600 acres (46 square miles)
1973
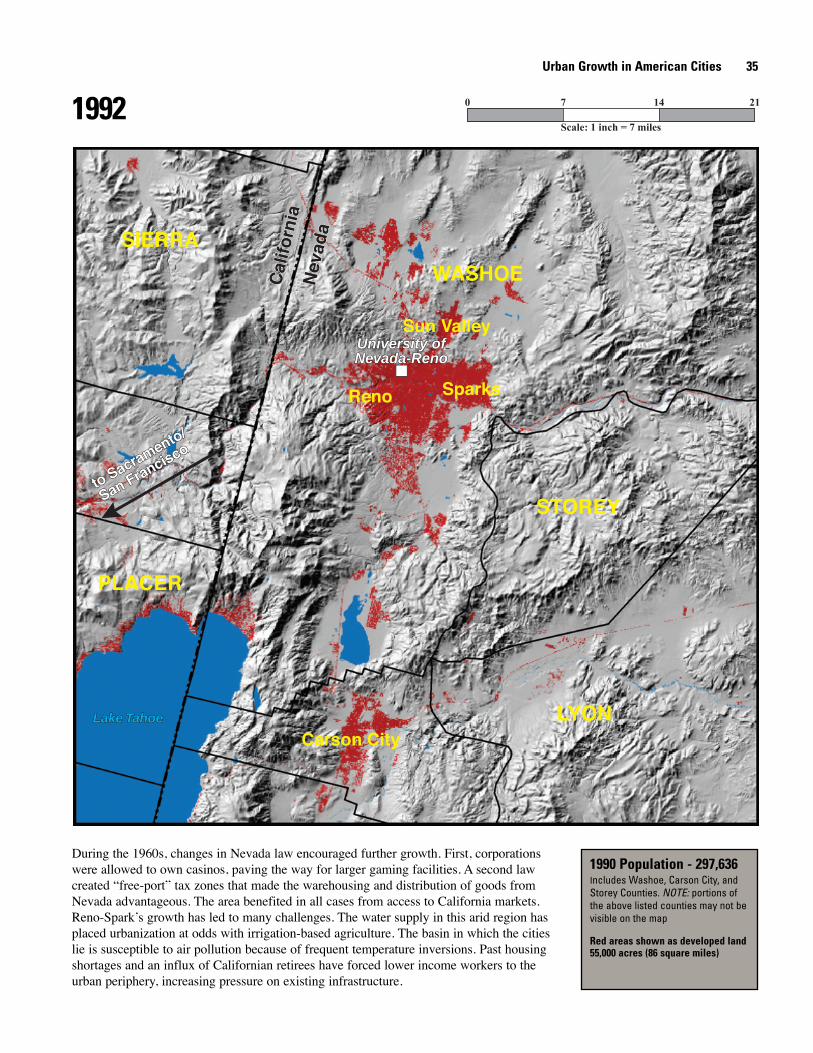
During the 1960s, changes in Nevada law encouraged further growth. First, corporationswere allowed to own casinos, paving the way for larger gaming facilities. A second lawcreated “free-port” tax zones that made the warehousing and distribution of goods fromNevada advantageous. The area benefited in all cases from access to California markets.Reno-Spark’s growth has led to many challenges. The water supply in this arid region hasplaced urbanization at odds with irrigation-based agriculture. The basin in which the citieslie is susceptible to air pollution because of frequent temperature inversions. Past housingshortages and an influx of Californian retirees have forced lower income workers to theurban periphery, increasing pressure on existing infrastructure.
Urban Growth in American Cities 35
1990 Population - 297,636Includes Washoe, Carson City, andStorey Counties. NOTE: portions ofthe above listed counties may not bevisible on the map
Red areas shown as developed land55,000 acres (86 square miles)
1992
University ofNevada-RenoUniversity ofNevada-Reno
Reno
Sun Valley
Carson City
Sparks
to Sacramento/
San Francisco
to Sacramento/
San Francisco
WASHOE
PLACER
LYON
STOREY
SIERRA
Cal
iforn
iaC
alifo
rnia
Nev
ada
Nev
ada
Lake TahoeLake Tahoe
Scale: 1 inch = 7 miles
0 7 14 21
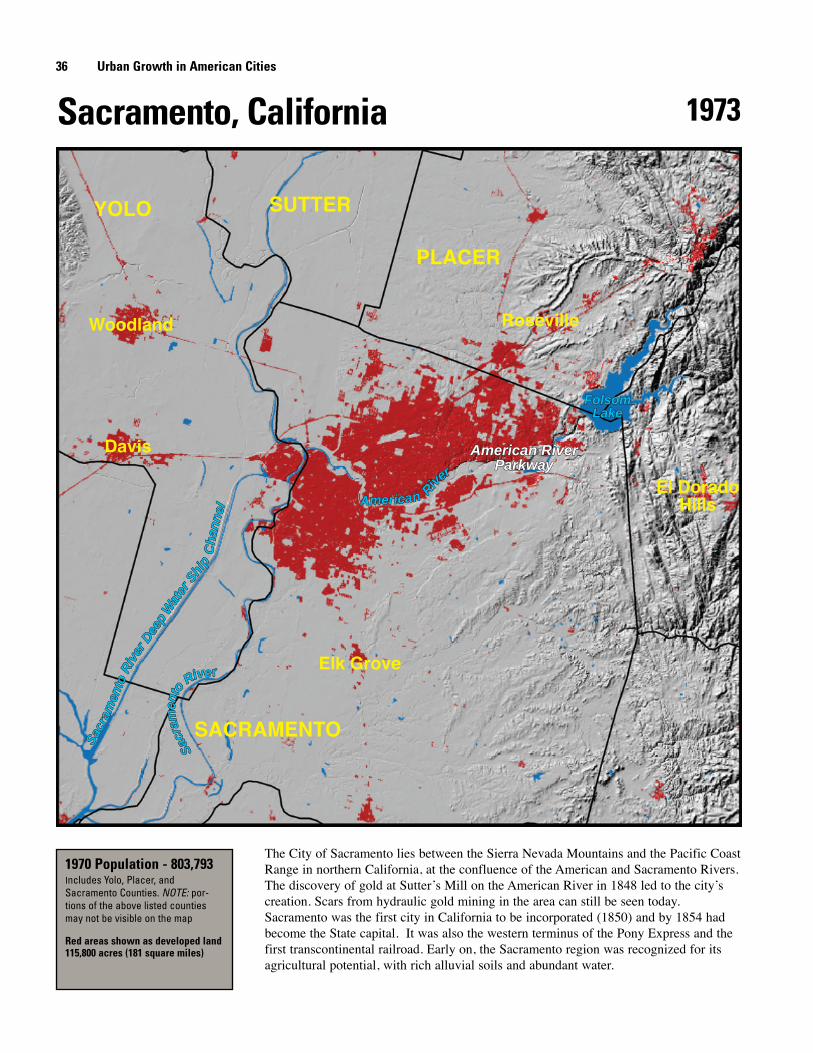
The City of Sacramento lies between the Sierra Nevada Mountains and the Pacific CoastRange in northern California, at the confluence of the American and Sacramento Rivers.The discovery of gold at Sutter’s Mill on the American River in 1848 led to the city’screation. Scars from hydraulic gold mining in the area can still be seen today.Sacramento was the first city in California to be incorporated (1850) and by 1854 hadbecome the State capital. It was also the western terminus of the Pony Express and thefirst transcontinental railroad. Early on, the Sacramento region was recognized for itsagricultural potential, with rich alluvial soils and abundant water.
36 Urban Growth in American Cities
Sacramento, California
American RiverParkway
American RiverParkway
Woodland
Elk Grove
El DoradoHills
Roseville
Davis
SACRAMENTO
YOLO SUTTER
PLACER
FolsomLake
FolsomLake
Sacr
amen
toR
iver
Deep
Wat
erShi
pC
hann
el
Sacr
amen
toR
iver
Deep
Wat
erShi
pC
hann
el
American River
American River
Sacr
amen
to
River
Sacr
amen
to
River
1970 Population - 803,793Includes Yolo, Placer, andSacramento Counties. NOTE: por-tions of the above listed countiesmay not be visible on the map
Red areas shown as developed land115,800 acres (181 square miles)
1973
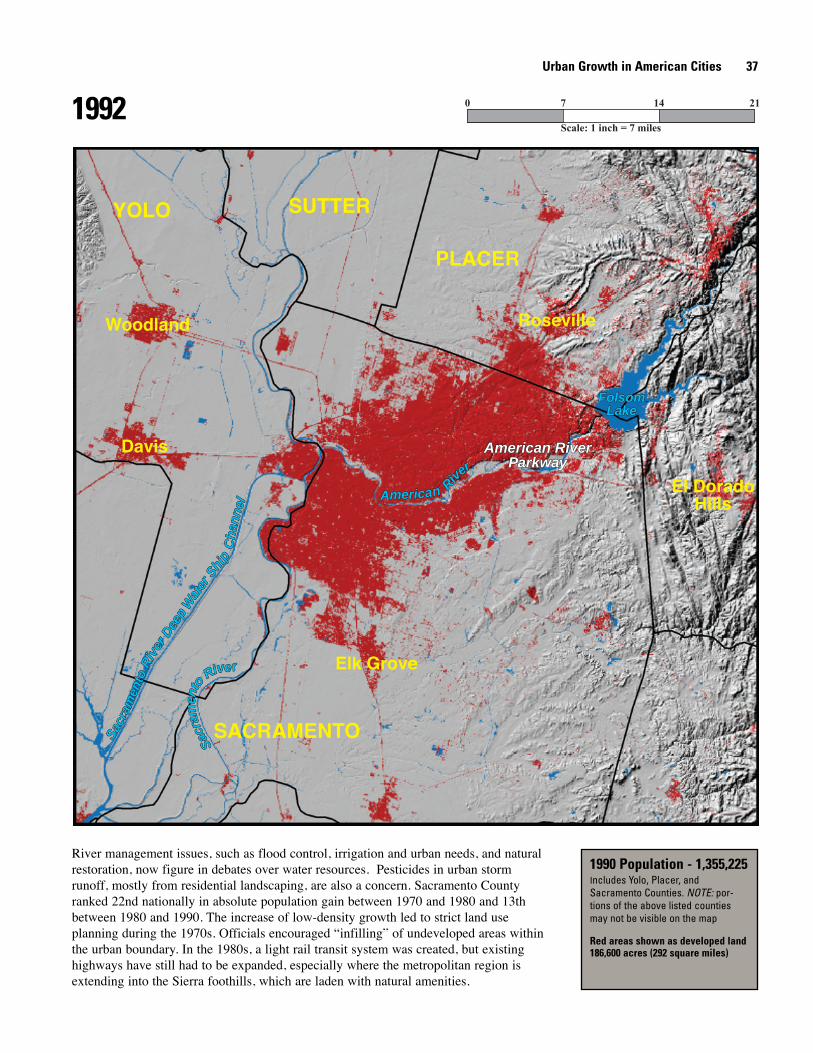
River management issues, such as flood control, irrigation and urban needs, and naturalrestoration, now figure in debates over water resources. Pesticides in urban stormrunoff, mostly from residential landscaping, are also a concern. Sacramento Countyranked 22nd nationally in absolute population gain between 1970 and 1980 and 13thbetween 1980 and 1990. The increase of low-density growth led to strict land useplanning during the 1970s. Officials encouraged “infilling” of undeveloped areas withinthe urban boundary. In the 1980s, a light rail transit system was created, but existinghighways have still had to be expanded, especially where the metropolitan region isextending into the Sierra foothills, which are laden with natural amenities.
Urban Growth in American Cities 37
1990 Population - 1,355,225Includes Yolo, Placer, andSacramento Counties. NOTE: por-tions of the above listed countiesmay not be visible on the map
Red areas shown as developed land186,600 acres (292 square miles)
1992
American RiverParkway
American RiverParkway
Woodland
Elk Grove
Roseville
Davis
El DoradoHills
SACRAMENTO
YOLO SUTTER
PLACER
FolsomLake
FolsomLake
Sacr
amen
toR
iver
Deep
Wat
erShi
pC
hann
el
Sacr
amen
toR
iver
Deep
Wat
erShi
pC
hann
el
American River
American River
Sacr
amen
to
River
Sacr
amen
to
River
Scale: 1 inch = 7 miles
0 7 14 21
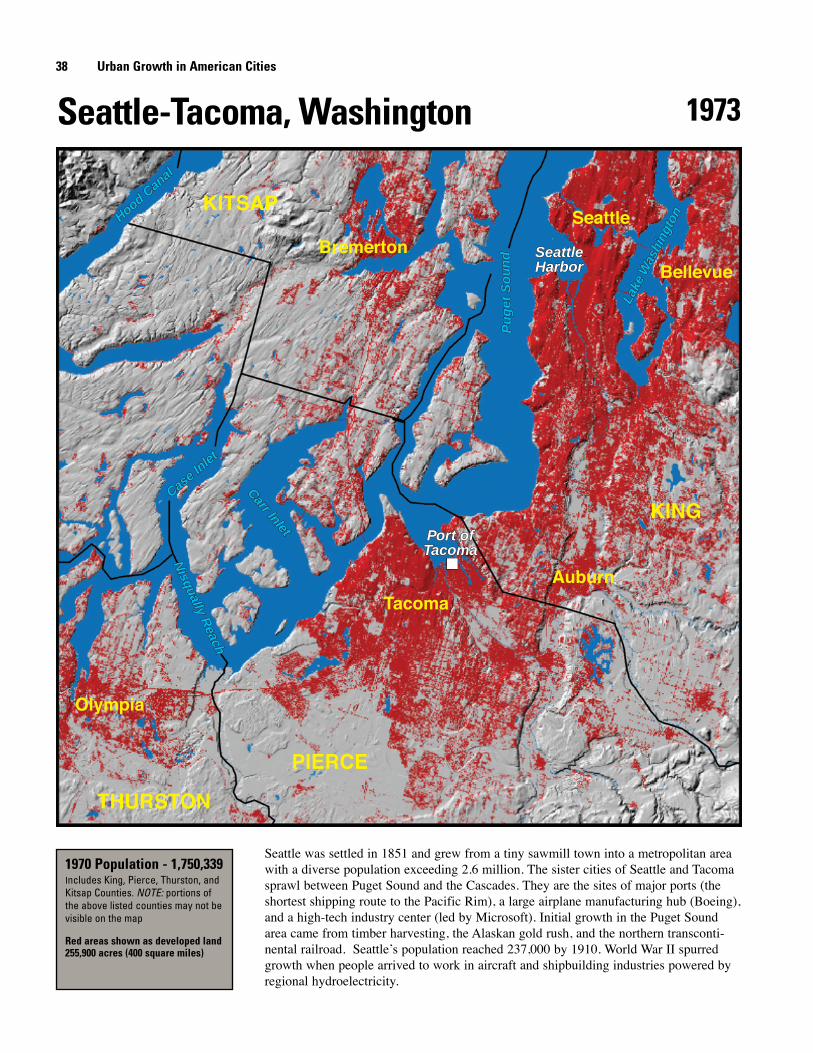
Seattle was settled in 1851 and grew from a tiny sawmill town into a metropolitan areawith a diverse population exceeding 2.6 million. The sister cities of Seattle and Tacomasprawl between Puget Sound and the Cascades. They are the sites of major ports (theshortest shipping route to the Pacific Rim), a large airplane manufacturing hub (Boeing),and a high-tech industry center (led by Microsoft). Initial growth in the Puget Soundarea came from timber harvesting, the Alaskan gold rush, and the northern transconti-nental railroad. Seattle’s population reached 237,000 by 1910. World War II spurredgrowth when people arrived to work in aircraft and shipbuilding industries powered byregional hydroelectricity.
38 Urban Growth in American Cities
Seattle-Tacoma, Washington
SeattleHarborSeattleHarbor
Port ofTacomaPort ofTacoma
Olympia
Bremerton
Seattle
Tacoma
Auburn
Bellevue
KITSAP
THURSTON
KING
PIERCE
Lake
Was
hing
ton
Lake
Was
hing
ton
Pu
get
So
un
dP
ug
et S
ou
nd
Carr Inlet
Carr Inlet
Hood Can
al
Hood Can
al
Case Inlet
Case Inlet
Nisqually R
each
Nisqually R
each
1970 Population - 1,750,339Includes King, Pierce, Thurston, andKitsap Counties. NOTE: portions ofthe above listed counties may not bevisible on the map
Red areas shown as developed land255,900 acres (400 square miles)
1973
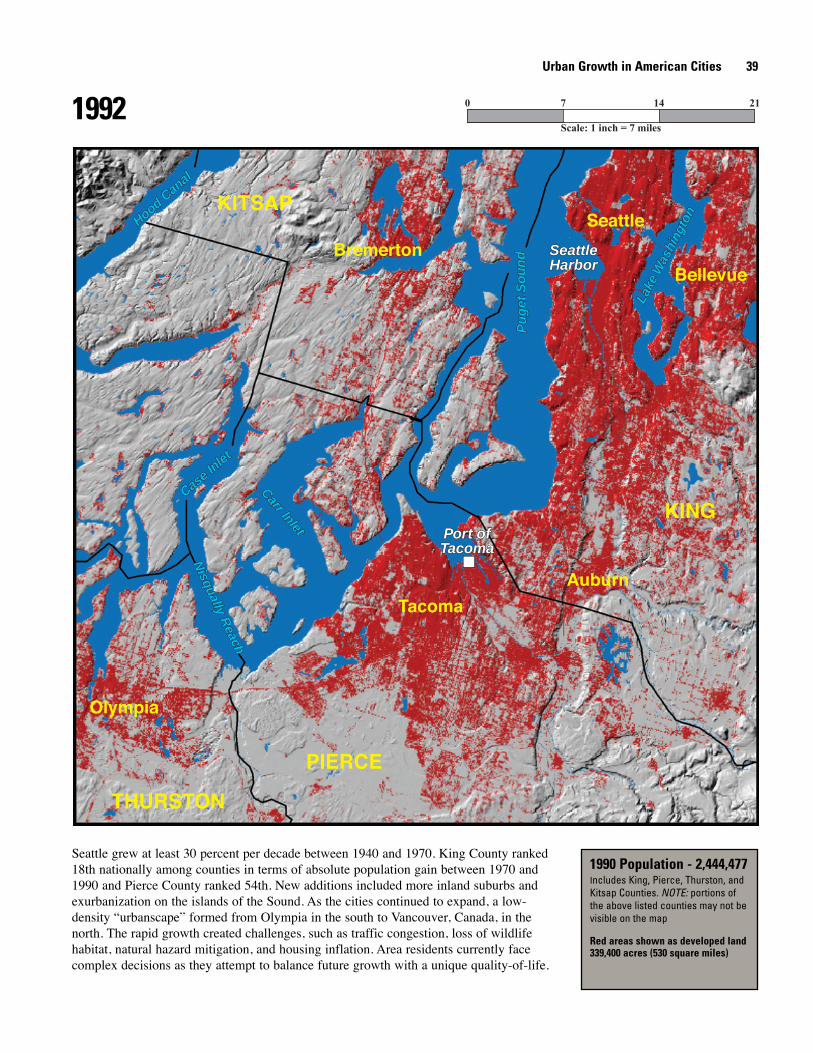
Seattle grew at least 30 percent per decade between 1940 and 1970. King County ranked18th nationally among counties in terms of absolute population gain between 1970 and1990 and Pierce County ranked 54th. New additions included more inland suburbs andexurbanization on the islands of the Sound. As the cities continued to expand, a low-density “urbanscape” formed from Olympia in the south to Vancouver, Canada, in thenorth. The rapid growth created challenges, such as traffic congestion, loss of wildlifehabitat, natural hazard mitigation, and housing inflation. Area residents currently facecomplex decisions as they attempt to balance future growth with a unique quality-of-life.
Urban Growth in American Cities 39
1990 Population - 2,444,477Includes King, Pierce, Thurston, andKitsap Counties. NOTE: portions ofthe above listed counties may not bevisible on the map
Red areas shown as developed land339,400 acres (530 square miles)
1992
SeattleHarborSeattleHarbor
Port ofTacomaPort ofTacoma
Olympia
Bremerton
Seattle
Tacoma
Auburn
Bellevue
KITSAP
THURSTON
KING
PIERCE
Lake
Was
hing
ton
Lake
Was
hing
ton
Pu
get
So
un
dP
ug
et S
ou
nd
Carr Inlet
Carr Inlet
Hood Can
al
Hood Can
al
Case Inlet
Case Inlet
Nisqually R
each
Nisqually R
each
Scale: 1 inch = 7 miles
0 7 14 21
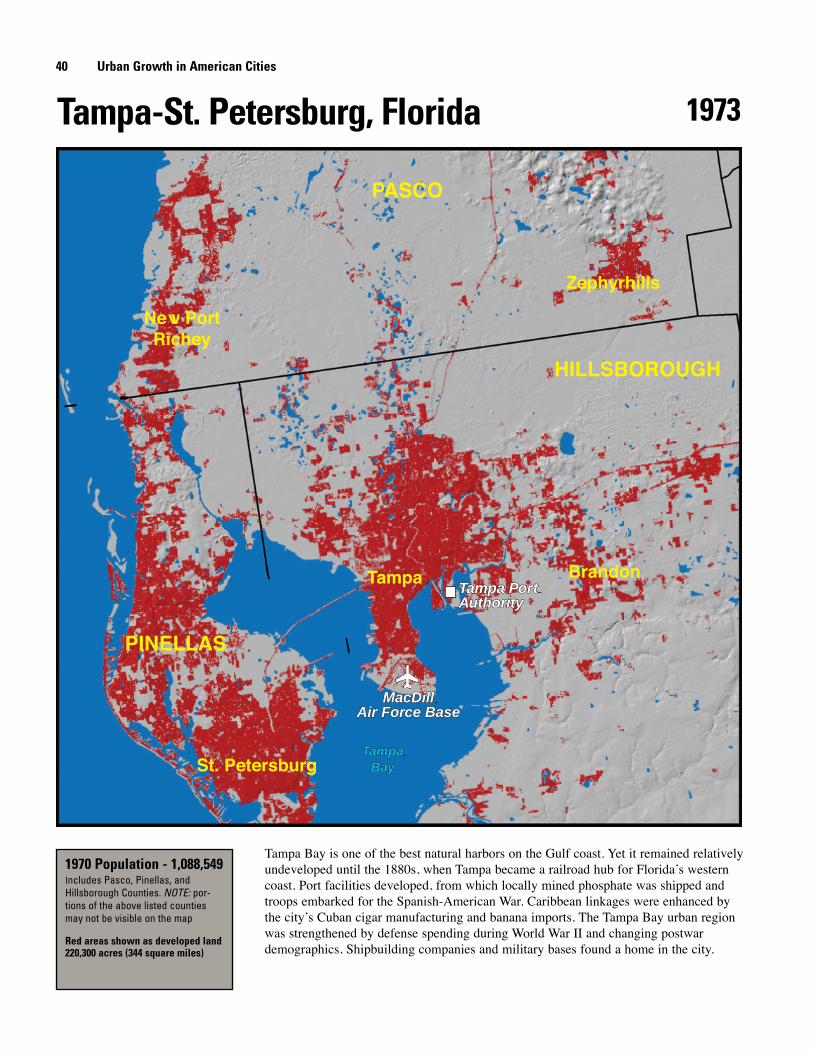
Tampa Bay is one of the best natural harbors on the Gulf coast. Yet it remained relativelyundeveloped until the 1880s, when Tampa became a railroad hub for Florida’s westerncoast. Port facilities developed, from which locally mined phosphate was shipped andtroops embarked for the Spanish-American War. Caribbean linkages were enhanced bythe city’s Cuban cigar manufacturing and banana imports. The Tampa Bay urban regionwas strengthened by defense spending during World War II and changing postwardemographics. Shipbuilding companies and military bases found a home in the city.
40 Urban Growth in American Cities
Tampa-St. Petersburg, Florida
Tampa PortAuthorityTampa PortAuthority
MacDillAir Force Base
MacDillAir Force Base
New PortRichey
Zephyrhills
BrandonTampa
St. Petersburg
PASCO
PINELLAS
HILLSBOROUGH
TampaBay
TampaBay
1970 Population - 1,088,549Includes Pasco, Pinellas, andHillsborough Counties. NOTE: por-tions of the above listed countiesmay not be visible on the map
Red areas shown as developed land220,300 acres (344 square miles)
1973

Large numbers of retirees also arrived, especially in St. Petersburg, Pinellas, and PascoCounties. The rapid urbanization of the Tampa Bay area has not been problem free.Ecologically, pollution, ship channel dredging, and wetland destruction have damagedthe Bay. Boat-based residential areas created by dredging and infilling are examples ofintense shore land alteration. The lack of coordinated regional planning, particularlybetween Tampa-St. Petersburg and Tampa-Hillsborough County, has strained publicinfrastructure. Tampa Bay area residents are cooperating to correct past problems andanticipate further growth.
Urban Growth in American Cities 41
1990 Population - 1,966,844Includes Pasco, Pinellas, andHillsborough Counties. NOTE: por-tions of the above listed countiesmay not be visible on the map
Red areas shown as developed land339,400 acres (530 square miles)
1992
Tampa PortAuthorityTampa PortAuthority
MacDillAir Force Base
MacDillAir Force Base
New PortRichey
Zephyrhills
BrandonTampa
St. Petersburg
PASCO
PINELLAS
HILLSBOROUGH
TampaBay
TampaBay
Scale: 1 inch = 7 miles
0 7 14 21
Ongoing Urban Dynamics ResearchThe USGS is committed to meeting the Nation’s needs for current base geographic data andmaps. This project demonstrates advances in technology that can be applied to the study ofspatial-temporal dynamics related to human impacts on land transformation. This knowledgebase and technology are being strengthened through The National Map, a consistent frame-work for geographic knowledge needed by the Nation. The building blocks of data andinformation used in Urban Dynamics research come from the wealth of archived USGS dataand information. Additional information used in the research is acquired from sourcessuch as the U.S. Census Bureau, Department of Agriculture, and National Aeronautics andSpace Administration.
The change pair images in this booklet are just one of the many products of urban growthresearch associated with The National Map. Other products include maps and GIS projectswith many layers of multiscale data and information associated with the physical changes thatoccur in urban areas over time. All of these products help to illustrate the changes, and fromthem many explanations can be derived about the causes of the changes. Ultimately, thisinformation enhances America’s ability to access, integrate, and apply geospatial data atglobal, national, and local scales.
Indepth Urban Dynamics research includes studies that are tracking the patterns, rates, andtrends of urban change. In addition to physical changes in urban extent, correlations are beingmade with demographic, economic, and environmental information. In each study, the localhistory and description of human events in the region play a large role in understandingchange. Computer models are being developed that can predict future urban growth patterns.Statistical analyses are being used to understand the causes and consequences of urban growth.
The USGS uses the geographic context of this research to provide comprehensive informationneeded in making land use management decisions, providing natural resource protection, andunderstanding significant social land use issues. A long-term goal of this research is to providea nationally consistent description of current urban land surface and land use conditions for theNation. A national study will highlight trends in urban change and provide a comparativeanalysis of diverse metropolitan areas within a national assessment of urban land use change.Another goal of this research is to inform policymakers and the public of likely impacts ofurban growth. It is hoped that these activities will provide the baseline information andunderstanding to help resource managers and the American public understand and live com-fortably with urban growth.
42 Urban Growth in American Cities

Urban Growth in American Cities 43
We would like to thank the following colleagues who helped throughout the process of creat-ing this circular. They include Mark Barber, Elizabeth Ciganovich, Douglas Denne, WilliamDraeger, John Hutchinson, Rebecca Johnson, David Kirtland, Christopher Laingen, ThomasLoveland, Lee McManus, Darrell Napton, Janice Nelson, Laurie Ortega, BhaskarRamachandran, June Thormodsgard, J. Nicholas Van Driel, and Ann Yaeger.
Acknowledgments

44 Urban Growth in American Cities
Abbott, C., 1981, The new urbanAmerica growth and politics inthe sunbelt cities: Chapel Hill,N.C., University of NorthCarolina Press, 317 p.
Abler, R., Adams, J. S., and Borchert,J. R., 1976, The twin cities of St.Paul and Minneapolis:Cambridge, Mass., BallingerPublishing Co., 69 p.
Acevedo, W., Foresman, T. W., andBuchanan, J. T., 1996, Originsand philosophy of building a tem-poral database to examine humantransformation processes, inProceedings ASPRS/ACSM annu-al convention and exhibition,Baltimore, Md., April 22-24,1996: Bethesda, Md., AmericanSociety for Photogrammetry &Remote Sensing, v. 1, p. 148-161.
Allardice, D., Wiewel, W., andWintermute, W., 1990, Chicago,Illinois: reaping the benefits ofsize and diversity, in Bingham, R.D., and Eberts, R. W., eds.,Economic restructuring of theAmerican Midwest: proceedingsof the Midwest economic restruc-turing conference of the federalreserve bank of Cleveland:Boston, Kluwer Academic, p. 75-102.
Allen, F., 1996, Atlanta rising theinvention of an international city1946-1996: Atlanta, Ga.,Longstreet Press, 290 p.
Anderson, J. B., 1990, DurhamCounty: Durham, N.C., DukeUniversity Press, 611 p.
Archer, K., 1997, The limits to theimagineered city: sociospatial
polarization in Orlando:Economic Geography, v. 73, no.3, p. 322-336.
Asano, T., 1987, Water quality man-agement in California: WaterInternational, v. 12, no. 3, p. 124-134.
Audirac, I., Shermyen, A. H., andSmith, M. T., 1990, Ideal urbanform and visions of the good lifeFlorida's growth managementdilemma: Journal of the AmericanPlanning Association, v. 56, no. 4,p. 470-482.
Bailey, H. C., Deanovic, L., Reyes,E., Kimball, T., Larson, K.,Cortright, K., Connor, V., andHinton, D. E., 2000, Diazinon andchlorpyrifos in urban waterwaysin northern California, USA:Environmental Toxicology andChemistry, v. 19, no. 1, p. 82-87.
Barnes, G., and Davis, G., 1999,Understanding urban traveldemand problems, solutions, andthe role of forecasting:Minneapolis, Minn., Center forTransportation Studies, Universityof Minnesota, 113 p.
Bathelt, H., 1991, Employmentchanges and input-output linkagesin key technology industries: acomparative analysis: RegionalStudies, v. 25, no. 1, p. 31-43.
Bederman, S. H., and Hartshorn, T.A., 1984, Quality of life inGeorgia: the 1980 experience:Southeastern Geographer, v. 24,no. 2, p. 78-98.
Bell, C., Acevedo, W., and Buchanan,J. T., 1995, Dynamic mapping ofurban regions: growth of the San
Bibliography
Francisco-Sacramento region, inProceedings Urban and RegionalInformation Systems Association,San Antonio, Tex.: Washington,D.C., Urban and RegionalInformation Systems Association,p. 723-734.
Bluestone, B., and Harrison, B.,1982, The deindustrialization ofAmerica: plant closings, commu-nity abandonment, and the dis-mantling of basic industry: NewYork, Basic Books, 323 p.
Borchert, J. R., 1987, America'snorthern heartland: Minneapolis,Minn., University of MinnesotaPress, 250 p.
---, 1967, American metropolitan evo-lution: Geographical Review, v.57, p. 301-332.
Braun, B. M., 1992, The economiccontribution of conventions: thecase of Orlando: Journal of TravelResearch, v. 30, no. 3, p. 32-37.
Breckenfeld, G., 1977, Refilling themetropolitan doughnut, in Therise of the sunbelt cities: BeverlyHills, Calif., Sage Publications, p.231-258.
Brindell, J. R., 1988, Balancing newdevelopment with conservation ofwetlands in Florida: Urban Lawand Policy, v. 9, p. 331-344.
Buchanan, J. E. ed., 1978, Phoenix achronological & documentary his-tory, 1865-1976: Dobbs Ferry,N.Y., Oceana Publications, Inc.,149 p.
Buchanan, J. T., Acevedo, W., andZirbes, R., 2002, Decision sup-port: a literature review and casestudies in the central valley ofCalifornia: U.S. GeologicalSurvey Open-File Report 03-129,available at http://landcover.usgs.gov/urban/pubs.html.
Buisseret, D., 1990, Historic Illinoisfrom the air: Chicago, University
of Chicago Press, 232 p.Bullamore, H. W., 1983, Non-resi-
dential land use in suburbanChicago: GeographicalPerspectives, v. 51, p. 1-13.
Buni, A., and Rogers, A., 1984,Boston city on a hill an illustratedhistory: Woodland Hills, Calif.,Windsor Publications, Inc., 240 p.
Chan, Y., and Ponder, R. J., 1979,The small package air freightindustry in the United States: areview of the Federal Expressexperience: TransportationResearch A, v. 13A, no. 4, p. 221-229.
Clark, S., Starr, J., Foresman, T. W.,Prince, W., and Acevedo, W.,1996, Development of temporaltransportation database for theanalysis of urban development inthe Baltimore-Washington region,in Proceedings ASPRS/ACSMannual convention and exhibition,Baltimore, Md., April 22-24,1996: Bethesda, Md., AmericanSociety for Photogrammetry &Remote Sensing, v. 3, p. 77-88.
Clark, T. D., 1984, The greening ofthe South the recovery of landand forest: Lexington, Ky.,University of Kentucky Press,168 p.
Clarke, K. C., 1997, Land transitionmodeling with deltrarons, avail-able at http://www.ncgia.ucsb.edu/conf/landuse97/, accessedJune 19, 1999.
Clarke, K. C., and Gaydos, L. J.,1998, Loose-coupling a cellularautomaton model and GIS: longterm urban growth prediction forSan Francisco andWashington/Baltimore:International Journal ofGeographical InformationScience, v. 12, no. 7, p. 699-714.
Colten, C. E., 1994, Chicago's waste
Urban Growth in American Cities 45
lands: refuse disposal and urbangrowth, 1840-1990: Journal ofHistorical Geography, v. 20, no.2, p. 124-142.
Conway, M., 1999, The great cities ofthe future: The Futurist, v. 33, no.6, p. 28-33.
Crawford, J. S., Acevedo, W.,Foresman, T. W., and Prince, W.,1996, Developing a temporal data-base of urban development for theBaltimore-Washington region, inProceedings ASPRS/ACSM annu-al convention and exhibition,Baltimore, Md., April 22-24,1996: Bethesda, Md., AmericanSociety for Photogrammetry &Remote Sensing, v. 3, p. 101-110.
Cronon, W., 1991, Nature's metropolisChicago and the great west: NewYork, W.W. Norton & Company,530 p.
Dameron, R. J., and Murphy, A. D.,1997, An international city toobusy to hate? social and culturalchange in Atlanta: 1970-1995:Urban Anthropology, v. 26, no. 1,p. 43-69.
Darkis, E. R., Jr., 1991, Durham,North Carolina city of medicineUSA, 82 p.
Davies, R. O., 1999, Sagebrush andcities the emergence of the newNevada, in Davies, R. O., ed.,Maverick spirit building the newNevada: Reno, Nev., University ofNevada Press, p. 3-11.
Dawson, D. B., 1997, Memphis newvisions, new horizons: Memphis,Tenn., Towery Publishing, Inc.,463 p.
Debbage, K. G., 1979, Air transporta-tion and urban-economic restruc-turing: competitive advantage inthe US Carolinas: Journal of AirTransport Management, v. 5, p.211-221.
Dietrich, W., 1999, How progress ate
America: American Forests, v.105, no. 3, p. 24-26.
Dorsett, L. W., and McCarthy, M.,1986, The queen city a history ofDenver (2nd ed.): Boulder, Colo.,Pruett Publishing Co., 382 p.
Dugan, J. M., 1981, Memphis cottonsto PUD (urban development legis-lation, USA): Planning (ASPO), v.47, no. 1, p. 19-22.
Dunn, H., 1985, Tampa a pictorial his-tory: Norfolk, Va., The DonningCompany, 224 p.
Elfin, J., and Wysong, J., 1990,Dynamics and planning policy:Geographical Review, v. 80, no. 2,p. 141-154.
Erickson, R. A., 1995, The locationand growth of Pennsylvania's met-ropolitan areas, in Miller, E. W.,ed., A geography of Pennsylvania:University Park, Pa., ThePennsylvania State UniversityPress, p. 315-335.
---, 1986, Multinucleation in metro-politan economies: Annals of theAssociation of AmericanGeographers, v. 76, no. 3, p. 331-346.
Feagin, J. R., 1985, The global con-text of metropolitan growth:Houston and the oil industry:American Journal of Sociology, v.90, no. 6, p. 1204-1230.
---, 1985, The social costs ofHouston's growth: a sunbeltboomtown reexamined: Journal ofUrban and Regional Research, v.9, no. 2, p. 164-185.
Fifield, B., 1996, Seeing Pittsburgh:Pittsburgh, Pa., University ofPittsburgh Press, 288 p.
Fisher, J. S., and Park, S. O., 1980,Locational dynamics of manufac-turing in the Atlanta metropolitanregion, 1968-1976: SoutheasternGeographer, v. 20, no. 2, p. 100-119.
46 Urban Growth in American Cities
Fishman, R., 1987, Bourgeoisutopias: the rise and fall of subur-bia: New York, Basic Books, 241p.
Fordham, J. W., 1993, Urban waterplanning- a western Nevada casestudy, in Hon, K., ed., Water man-agement in the '90s a time forinnovation proceedings of the20th anniversary conference,Seattle, Wash.: New York,American Society of CivilEngineers, p. 16-19.
Fowler, D. D., Cargill, T. F., Dahl, A.J., Eadington, W. R., Ganzel, R.,Siegel, R. L., Shahrani, M.,Walker, J. L., Wilcox, A. R., andWilcox, P. B., 1978, Final reportsociopolitical, economic, anddemographic factors relating torapid urban growth in an aridregion: a case study of the Reno,Nevada metropolitan area: Reno,Nev., Desert Research Institute,University of Nevada System, 74p.
Fulton, W., 1999, Ring around theregion: Planning (APA), v. 65, no.3, p. 18-23.
---, 1986, Silicon strips: Planning(APA), v. 52, no. 5, p. 7-12.
Garreau, J., 1991, Edge city life onthe new frontier: New York,Doubleday, 546 p.
Gladstone, D. L., 1998, Tourismurbanization in the United States:Urban Affairs Review, v. 34, no.1, p. 3-25.
Goldfield, D. R., and Brownell, B. A.,1990, Urban America a history:Boston, Houghton Mifflin, 493 p.
Goodstein, P., 1999, Denver in ourtime a people's history of themodern mile high city volumeone: big money in the big city:Denver, Colo., New SocialPublications, 496 p.
---, 2000, Denver in our time a peo-
ple's history of the modern milehigh city volume two: DIA andother scams: Denver, Colo., NewSocial Publications, 552 p.
Greene, R. P., 1997, The farmlandconversion process in a polynu-cleated metropolis: Landscapeand Urban Planning, v. 36, no. 4,p. 291-300.
Gregory, J. N., 1989, American exo-dus the dust bowl migration andOkie culture in California: NewYork, Oxford University Press,338 p.
Hagwood, J. J., 1976, Commitment toexcellence: a history of theSacramento district: Sacramento,Calif., U.S. Army Corps ofEngineers Sacramento District,289 p.
Hallinan, T. S., 1989, River city: righthere in California?: Yearbook-Association of Pacific CoastGeographers, v. 51, p. 49-64.
Harkins, J. E., 1982, Metropolis ofthe American Nile Memphis andShelby County an illustrated his-tory: Woodland Hills, Calif.,Windsor Publications, Inc., 223 p.
Hart, J. F., 1991, The perimetropoli-tan bow wave: GeographicalReview, v. 81, no. 1, p. 35-51.
Haverluk, T. W., 2000, Americanmetropolitan revolution: eastmeets west, paper presented at31st annual South Dakota stategeography convention,Brookings, S. Dak., Mar. 16-18,2000.
Herbers, J., 1986, The new heartland:America's flight beyond the sub-urbs and how it's changing ourfuture: New York, Times Books,228 p.
Hester, D. J., 1999, ModelingAlbuquerque's urban growth (casestudy: Isleta, New Mexico,1:24,000-scale quadrangle), in
Urban Growth in American Cities 47
U.S. Geological Survey Report99-203, Middle Rio Grande basinstudy- proceedings of the thirdannual workshop, Albuquerque,N. Mex., Feb. 24-25, 1999, p. 8-12.
Hewings, G. J. D., Sonis, M., Guo, J.,Israilevich, P. R., and Schindler,G., 1998, The hollowing outprocess in the Chicago economy,1975-2011: GeographicalAnalysis, v. 30, no. 3, p. 217-233.
Hoppen, S. K., Clarke, C., Gaydos, L.J., and Acevedo, W., 1996,Communicating scientific findingsto the general public, paper pre-sented at the 3rd international con-ference/workshop integrating GISand environmental modeling,Santa Fe, N. Mex., Jan. 21-25,1996.
Howells, D. H., 1989, Historicalaccount of public water suppliesin North Carolina: Raleigh, N. C.,The Water Resources ResearchInstitute of the University ofNorth Carolina, Report No. 244,113 p.
Hudson, J. C., 1999, Contemporaryworld trade and the geography ofstraight lines, paper presented at30th annual South Dakota stategeography convention, Brookings,S. Dak., April 8-10, 1999.
Jackson, K. T., 1985, Crabgrass fron-tier the suburbanization of theUnited States: New York, OxfordUniversity Press, 396 p.
Jakle, J. A., and Wilson, D., 1992,Derelict landscapes the wasting ofAmerica's built environment:Savage, Md., Rowman &Littlefield, Inc., 342 p.
Johansen, D., and Gates, C.M., 1967,Empire of the Columbia: a historyof the Pacific northwest (2nd ed.):New York, Harper and Row, 654p.
Johnston, R. A., Schwartz, S. I., andTracy, S., 1984, Growth phasingand resistance to infill develop-ment in Sacramento County:Journal of the American PlanningAssociation, v. 50, no. 4, p. 434-446.
Johnston, R. A., Sperling, D.,DeLuchi, M. A., and Tracy, S.,1988, Politics and technicaluncertainty in transportationinvestment analysis:Transportation Research A, v.21A, no. 6, p. 459-475.
Judd, D. R., 1986, From cowtown tosunbelt city: boosterism and eco-nomic growth in Denver, inFainstein, S. S., ed., Restructuringthe city the political economy ofurban redevelopment: WhitePlains, N.Y., Longman, Inc., p.169-201.
Keller, M., 1999, A spot of green on atour de sprawl: City Business-Minneapolis, v. 17, no. 7, p. 13.
Kirby, A., and Lynch, A. K., 1987, Aghost in the growth machine: theaftermath of rapid populationgrowth in Houston: UrbanStudies, v. 24, no. 587, p. 587-596.
Kirtland, D., Gaydos, L., Clarke, K.,DeCola, L., Acevedo, W., andBell, C., 1994, An analysis ofhuman induced land transforma-tions in San Francisco/Sacramento area: WorldResources Review, v. 6, no. 2, p.206-217.
Kostyu, J. A., and Kostyu, F. A.,1978, Durham a pictorial history:Norfolk, Va., The DonningCompany, 205 p.
Kramer, J., 1996, Integration of a GISwith a local scale self-modifyingcellular automaton urban growthin southeastern Orange County,M.A. Thesis: New York, Hunter
48 Urban Growth in American Cities
College, CUNY, 73 p.Land, B., and Land, M., 1995, A
short history of Reno: Reno, Nev.,University of Nevada Press, 130p.
Lankevich, G. J. ed., 1978, Atlanta achronological & documentary his-tory, 1813-1976: Dobbs Ferry,N.Y., Oceana Publications, Inc.,154 p.
---, 1974, Boston a chronological &documentary history, 1602-1970:Dobbs Ferry, N.Y., OceanaPublications, Inc., 152 p.
Lemmon, S. M., 1966, Raleigh- anexample of the “new South”?:The North Carolina HistoricalReview, v. 43, no. 3, p. 261-285.
Levee, A., 1998, The hub is hot:Planning (APA), v. 64, no. 3, p. 4-11.
Levinson, D. M., 1997, Job and hous-ing tenure and the journey towork: The Annals of RegionalScience, v. 31, p. 451-471.
---, 1997, The limits to growth man-agement: development regulationin Montgomery County,Maryland: Environment andPlanning B: Planning and Design,v. 24, p. 689-707.
Lewis, P., 1987, America between thewars: the engineering of a newgeography, in Mitchell, R. D., andGroves, P. A., eds., NorthAmerica the historical geographyof a changing continent: Totowa,N.J., Rowman & Littlefield, Inc.,p. 410-437.
Lubove, R., 1996, Twentieth centuryPittsburgh volume 2 the post-steelera: Pittsburgh, Pa., University ofPittsburgh Press, 413 p.
Luckingham, B., 1998, Discoveringgreater Phoenix an illustrated his-tory: Carlsbad, Calif., HeritageMedia Corporation, 343 p.
---, 1989, Phoenix the history of a
southwestern metropolis: Tucson,Ariz., University of ArizonaPress, 316 p.
Lyons, D., and Luker, B., Jr., 1998,Explaining the contemporary spa-tial structure of high-technologyemployment in Texas: UrbanGeography, v. 19, no. 5, p. 431-458.
Markusen, A., 1991, The military-industrial divide: Environmentand Planning D: Society andSpace, v. 9, p. 391-416.
Markusen, A., Hall, P., Campbell, S.,and Deitrick, S., 1991, The rise ofthe gunbelt the military remap-ping of industrial America: NewYork, Oxford University Press,341 p.
Marston, E., 1994, Ripples growwhen a dam dies: High CountryNews, Oct. 31, v. 26, no. 20.
Matlack, G. R., 1997, Land use andforest habitat distribution in thehinterland of a large city: Journalof Biogeography, v. 24, p. 297-307.
McComb, D. G., 1981, Houston: ahistory: Austin, Tex., Universityof Texas Press, 288 p.
McCormick, K., 1998, Home, homeon the ranchette (last ditch effortsto keep Colorado's Front Rangefrom looking like everyplaceelse): Planning (APA), v. 64, no.2, p. 4-8.
McPherson, E. G., and Luttiger, N.,1998, From nature to nurture; thehistory of Sacramento's urban for-est: Journal of Arboriculture, v.24, no. 2, p. 72-88.
Meyer, D. R., 1987, The nationalintegration of regional economies,1860-1920, in Mitchell, R. D.,and Groves, P. A., eds., NorthAmerica the historical geographyof a changing continent: Totowa,N.J., Rowman & Littlefield, Inc.,
Urban Growth in American Cities 49
p. 321-343.Miller, C., and Johnson, D. R., 1990,
The rise of urban Texas, in Miller,C., and Sanders, H. T., eds.,Urban Texas politics and develop-ment: College Station, Tex., TexasA & M University Press, p. 3-29.
Miller, E. W., 1995, Pittsburgh: anurban region in transition, inMiller, E. W., ed., A geography ofPennsylvania: University Park,Pa., The Pennsylvania StateUniversity Press, p. 374-395.
Mims, J. E., and Mims, K. M., 1981,Sacramento: a pictorial history ofCalifornia's capital: VirginiaBeach, Va., The DonningCompany, 207 p.
Mitchell, C. L. B., Perkins, W. J., andGurtowski, T. M., 1999, Seattlesolutions: Civil Engineering, v.69, no. 12, p. 54-57.
Moehring, E. P., 2000, Resort city inthe sunbelt Las Vegas 1930-2000(2nd ed.): Reno, Nev., Universityof Nevada Press, 359 p.
Mohl, R. A., and Mormino, G. R.,1996, The big change in the sun-shine state: a social history ofmodern Florida, in Gannon, M.,ed., The new history of Florida:Gainesville, Fla., University ofFlorida Press, p. 418-447.
Mormino, G. R., 1983, Tampa: fromhellhole to the good life, inBernard, R. M., and Rice, B. R.,eds., Sunbelt cities politics andgrowth since World War II:Austin, Tex., University of TexasPress, p. 138-161.
Morrill, R., 1992, Population redistri-bution within metropolitanregions in the 1980s: core, satel-lite, and exurban growth: Growthand Change, v. 23, no. 3, p. 277-302.
Morris, R. L., Devitt, D. A., Crites, A.M., Borden, G., and Allen, L. N.,
1997, Urbanization and waterconservation in Las Vegas valley,Nevada: Journal of WaterResources Planning andManagement- ASCE, v. 123, no.3, p. 189-195.
Mueller-Wille, C., 1990, Naturallandscape amenities and suburbangrowth metropolitan Chicago,1970-1980: Chicago, Universityof Chicago Press, 153 p.
Muller, P. O., 1986, Transportationand urban growth the shaping ofthe American metropolis: Focus,v. 36, no. 2, p. 8-17.
Murphy, A. B., 1986, Issues in thepreservation and management ofopen space for recreational use inmetropolitan Chicago:Environmental Review, v. 10, no.1, p. 31-43.
Napton, D., 1990, Regional farmlandprotection: the Twin Cities experi-ence: Journal of Soil and WaterConservation, v. 45, no. 4, p. 446-449.
Nash, G. D., 1985, The Americanwest transformed: the impact ofthe Second World War:Bloomington, Ind., IndianaUniversity Press, 304 p.
O'Connell, D. W., 1985, Florida'sstruggle for approval under theCoastal Zone Management Act:Natural Resources Journal, v. 25,no. 1, p. 61-72.
O'Connor, T. H., 1984, Bibles, brah-mins, and bosses a short historyof Boston (2nd ed.): Boston,Trustees of the Public Library ofthe City of Boston, 216 p.
Odell, K. A., and Weiman, D. F.,1998, Metropolitan development,regional financial centers, and thefounding of the Fed in the lowerSouth: Journal of EconomicHistory, v. 58, no. 1, p. 103-125.
Payne, D., 1994, Big D triumphs and
50 Urban Growth in American Cities
troubles of an American supercityin the 20th century: Dallas, Tex.,Three Forks Press, 497 p.
Perkins, D., ed., 1994, The News &Observer's Raleigh a living histo-ry of North Carolina's capital:Winston-Salem, N.C., John F.Blair, Publisher, 202 p.
Platt, R. H., 1996, Land use and soci-ety geography, law, and publicpolicy: Washington, D.C., IslandPress, 507 p.
Power, T. M., 1996, Lost landscapesand failed economies: the searchfor a value of place: Washington,D.C., Island Press, 304 p.
Powell, W. S., 1989, North Carolinathrough four centuries: ChapelHill, N.C., The University ofNorth Carolina Press, 652 p.
Pred, A., 1984, Structuration, biogra-phy formation, and knowledge:observations on port growth dur-ing the late mercantile period:Environment and Planning D:Society and Space, v. 2, p. 251-275.
Proctor, S., 1996, Prelude to the newFlorida, 1877-1919, in Gannon,M., ed., The new history ofFlorida: Gainesville, Fla.,University of Florida Press, p.266-286.
Pursell, D. E., Huston, C. R., andDavison, W. L., 1974, Economicbase of the Mississippi-Arkansas-Tennessee Council ofGovernments/Memphis DeltaDevelopment District area:Memphis, Tenn., Bureau ofBusiness and Economic Research,Memphis State University and theMississippi-Arkansas-TennesseeCouncil of Governments, 211 p.
Roger, R., 1996, Orlando too much ofa good thing: Planning (APA), v.62, no. 3, p. 4-10.
Rose, D. C., 1990, Seattle city pro-
file: Cities, v. 7, no. 4, p. 283-288.
Roth, D. C., and Ambrose, A., 1996,Metropolitan frontiers a short his-tory of Atlanta: Atlanta, Ga.,Longstreet Press, 226 p.
Rubenstein, J. M., 1990, Japanesemotor vehicle production in theUSA: where and why: Focus, v.40, no. 2, p. 7-11.
Scherzer, K. A., 2000, Southerncities- how exceptional?: Journalof Urban History, v. 26, no. 5, p.692-706.
Scwab, J., 1990, Two Forks stalled-for now: Planning (APA), v. 56,no. 4, p. 26-29.
Seabrook, C., 2000, Georgia, Florida,and Alabama far apart in watersquabbles, Atlanta Journal-Constitution, February 28, 2000,C, p. 4.
---, 1998, The Chattahoochee River inperil: the water wars: Georgia,Alabama, and Florida are lockedin a dispute over uses of the riverthat will affect everyday life fordecades, Atlanta Journal-Constitution, October 5, 1998, E,p. 1.
Severson, T., 1973, Sacramento anillustrated history: 1839-1874:San Francisco, Calif., CaliforniaHistorical Society, 207 p.
Shankland, G., 1981, Boston- theunlikely city: GeographicalMagazine, v. 53, no. 5, p. 323-327.
Spinney, R. G., 2000, City of bigshoulders a history of Chicago:DeKalb, Ill., Northern IllinoisUniversity Press, 300 p.
Stansfield, C. A., Jr., 1998, A geogra-phy of New Jersey the city in thegarden: New Brunswick, N.J.,Rutgers University Press, 313 p.
Starrs, P. F., 1995, Conflict andchange on the landscapes of the
Urban Growth in American Cities 51
arid American west, in Castle, E.N., ed., The changing Americancountryside: Lawrence, Kans.,University Press of Kansas, p.271-285.
Starrs, P. F., and Wright, J. B., 1995,Great Basin growth and the with-ering of California's Pacific idyll:Geographical Review, v. 85, no.4, p. 417-435.
Steinberg, P. E., and Clark, G. E.,1999, Troubled water? acquies-cence, conflict, and the politics ofplace in watershed management:Political Geography, v. 18, no. 4,p. 477-508.
Streatfield, D. C., 1988, The emeraldcity a landscape of paradox:Landscape Architecture, v. 78, no.6, p. 56-63.
Swanson, D. A., Malone, S. D., andSamora, B. A., 1992, MountRainier: a decade volcano: Eos, v.73, no. 16, p. 177-192.
The Economist, 2000, Ashes to sili-con Phoenix dreams of attractinghigh technology industries: v.355, no. 8165, p. 30-31.
---, 1999, A hydra in the desertPhoenix's urban sprawl: v. 352,no. 8128, p. 26-27.
---, 1999, Right in the governor'sback yard: v. 352, no. 8129, p.26-28.
Theobald, D. M., Gosnell, H., andRiebsame, W. E., 1996, Land useand landscape change in theColorado mountains II: a casestudy of the East River :Mountain Research andDevelopment, v. 16, no. 4, p. 407-418.
Thompson, D., 1986, Nevada a histo-ry of change: Reno, Nev., GraceDangberg Foundation, Inc., 232 p.
Thompson, G. L., 1998, Identifyinggainers and losers from transitservice change: a method applied
to Sacramento: Journal ofPlanning Education and Research,v. 18, p. 125-136.
Toker, F., 1986, Pittsburgh, an urbanportrait: Pittsburgh, Pa.,University of Pittsburgh Press,351 p.
U.S. Bureau of the Census, 1976,Historical statistics of the UnitedStates: colonial times to 1970,part 1: Washington, D.C., U.S.Government Publishing Office,609 p.
---, 2000, Statistical abstract of theUnited States: 2000: Washington,D.C., U.S. Government PrintingOffice, 999 p.
Vexler, R. I. ed., 1977, Pittsburgh achronological & documentary his-tory 1682-1976: Dobbs Ferry,N.Y., Oceana Publications, Inc.,154 p.
Vickers, J., 1997, Raleigh city of oaksan illustrated history: Sun Valley,Calif., American Historical Press,191 p.
Ward, G., 1996, The West an illustrat-ed history: Boston, Little, Brown,and Company, 445 p.
Warren, J. R., 1997, King County andits emerald city: Seattle: Tarzana,Calif., American Historical Press,294 p.
Waters, J., 1992, Setting the coursefor Twin Cities development:Minneapolis-St. Paul CityBusiness, v. 10, no. 24, p. 15.
Weiss, J., 1989, Aurora: Denver'sneighbor catches up: Planning(APA), v. 55, no. 1, p. 14-17.
Whitelegg, D., 2000, Keeping theireyes on the skies jet aviation,Delta Air Lines, and the growthof Atlanta: Journal of TransportHistory, v. 21, no. 1, p. 73-90.
52 Urban Growth in American Cities


Related Documents