J. Bio. & Env. Sci. 2015 269 | Ebrahimi et al. RESEARCH PAPER OPEN ACCESS Surface water quality assessment in Gilan Province, Iran Mohammad Ebrahimi 1* , Mohammad Javad Nematollahi 2 , Alireza Moradian 3 , Sadegh Adineh 2 , Rasoul Esmaeili 1 1 Department of Geology, Faculty of Sciences, University of Zanjan, Zanjan, Iran 2 Department of Earth Sciences, College of Sciences, Shiraz University, Shiraz, Iran 3 Department of Earth Sciences, College of Sciences, Ferdowsi University, Mashhad, Iran Article published on May 23, 2015 Key words: Hydrogeochemistry, Irrigation water quality, Surface water, Gilan province. Abstract Surface water in Gilan province is assessed in order to determine its hydrogeochemistry and irrigation water quality using 55 water samples. In this regard, concentration of major ions and physicochemical parameters including , , , , , , and pH, EC and TDS were determined. The average content of the major cations and anions follow as: and , respectively. Hydrogeochemical composition of surface water is a mixture of water types including , mixed and . Nonetheless, themajority of the samples has water type. Hence, alkaline earths and strong acid anions exceed alkalis and weak acid anions, respectively. Based on Gibbs diagrams and ionic ratios, weathering of silicate minerals is the main process controlling the surface water chemistry. Saturation indices (SIs) indicate that dissolution of carbonate minerals also plays an important role in regulating the surface water chemistry. Although sodium percentage (Na%), sodium adsorption ratio (SAR), electrical conductivity (EC), total dissolved solids (TDS) and permeability index (PI) in most of the samples are below the standard, nonetheless, residual sodium carbonate (RSC) and Total hardness (TH) indicate significant irrigation water unsuitability and hence thenecessity for caution and future study. * Corresponding Author: Mohammad Ebrahimi [email protected], Journal of Biodiversity and Environmental Sciences (JBES) ISSN: 2220-6663 (Print) 2222-3045 (Online) Vol. 6, No. 5, p. 269-280, 2015 http://www.innspub.net

Welcome message from author
This document is posted to help you gain knowledge. Please leave a comment to let me know what you think about it! Share it to your friends and learn new things together.
Transcript
J. Bio. & Env. Sci. 2015
269 | Ebrahimi et al.
RESEARCH PAPER OPEN ACCESS
Surface water quality assessment in Gilan Province, Iran
Mohammad Ebrahimi1*, Mohammad Javad Nematollahi2, Alireza Moradian3, Sadegh
Adineh2, Rasoul Esmaeili1
1Department of Geology, Faculty of Sciences, University of Zanjan, Zanjan, Iran
2Department of Earth Sciences, College of Sciences, Shiraz University, Shiraz, Iran
3Department of Earth Sciences, College of Sciences, Ferdowsi University, Mashhad, Iran
Article published on May 23, 2015
Key words: Hydrogeochemistry, Irrigation water quality, Surface water, Gilan province.
Abstract
Surface water in Gilan province is assessed in order to determine its hydrogeochemistry and irrigation water
quality using 55 water samples. In this regard, concentration of major ions and physicochemical parameters
including , , , , , ,
and pH, EC and TDS were determined. The average content
of the major cations and anions follow as: and
, respectively.
Hydrogeochemical composition of surface water is a mixture of water types including , mixed
and . Nonetheless, themajority of the samples has water type. Hence, alkaline earths and strong
acid anions exceed alkalis and weak acid anions, respectively. Based on Gibbs diagrams and ionic ratios,
weathering of silicate minerals is the main process controlling the surface water chemistry. Saturation indices
(SIs) indicate that dissolution of carbonate minerals also plays an important role in regulating the surface water
chemistry. Although sodium percentage (Na%), sodium adsorption ratio (SAR), electrical conductivity (EC), total
dissolved solids (TDS) and permeability index (PI) in most of the samples are below the standard, nonetheless,
residual sodium carbonate (RSC) and Total hardness (TH) indicate significant irrigation water unsuitability and
hence thenecessity for caution and future study.
*Corresponding Author: Mohammad Ebrahimi [email protected],
Journal of Biodiversity and Environmental Sciences (JBES) ISSN: 2220-6663 (Print) 2222-3045 (Online)
Vol. 6, No. 5, p. 269-280, 2015
http://www.innspub.net

J. Bio. & Env. Sci. 2015
270 | Ebrahimi et al.
Introduction
Intensive developments of industry, agricultural
production and ever intensive urbanization have led
to the increase in number of pollutants and the
amount of wastewater which pollute water flows. On
the contrary, the need for water of satisfying quality
continuously grows. A big amount of agricultural,
municipal and industrial wastewater discharges to
water bodies around the world. The discharging of
degradable wastewater in water bodies result in
decrease in water quality generally and particularly
DO (Dissolved Oxygen) concentrations (Nakhaeiet
al.,2010). Disposal of municipal, agricultural and
industrial wastewater into the rivers with little or no
treatment prior to discharge is a common practice in
many developing countries. This has caused a serious
concern over the deterioration of river water quality
(Hadguet al.,2014).
Recently, pollution has become a serious concern for
human life due to the industrial burst in the world.
And, the rivers are the main choices to hold and bear
the responsibility of pollutants, especially in the
developing countries (Akteret al.,2014).
The concerns over surface water quality are gradually
emerging due to the disposed location of industrial
units and the adverse effects on surrounding land and
aquatic environment, as well as subsequent impacts
on the system of the local community (Islam et
al.,2011).
Surface water resources such as rivers are among the
most vulnerable water bodies to contamination.
Rivers play important role in transporting domestic
and industrial wastewaters and non-point source
pollutants (Singh et al.,2004). The quality of surface
water is largely affected by physical, chemical and
biological processes such as weathering of rock
minerals, climate and amount of precipitation.
Anthropogenic activities (domestic and industrial
wastewaters, land reclamation, atmospheric
deposition, irrigation return flow, etc.) can also
degrade surface water quality and impair its use for
drinking, industrial and agricultural uses. To
characterize and control the surface water suitability
regular monitoring programs seem important
(Simeonov et al.,2004). Hence, the monitoring of
surface water quality parameters is subjected as one
of the most effective approaches to assess the
environmental status of water resources, and also to
set up the environmental protection policies.The
main objective of this study is to evaluate surface
water hydrogeochemistry and its suitability for
irrigation water use.
Materials and methods
Study area
Gilan province is situated in north latitudes 36 34 and
38 27 and east longitudes 48 53 and 50 34, and is
bounded by republic of Azerbayjan and Caspian Sea
on the north, Mazandaran and Caspian Sea on the
east, Ardabil on the west, and Qazvin and Zanjan on
the south (Fig. 1.a). Gilan covers an area 14711 km2
and includes 16 townships (Fig. 1.a) and contains
0.9% of the total area in Iran. The study area
experiences the climate of very humid and sultry in
the east (near to Caspian Sea) and mild and humid in
the center and west. The relative humidity is 80%,
varying between 55% in July and 98% in October,
being the most humid province in Iran. Average
annual temperature is 15.8 ˚C, ranging from 7.5 ˚C in
winter and 24 ˚C in summer. Rasht, the capital of the
province, is internationally known as the "City of
Silver Rains" and within Iran as the "City of
Rain". Average annual rainfall is 1402 mm, with a
minimum 40.2 mm in July and maximum 2302 mm
in October. According to the latest census in 2013, the
population of Gilan is 2480874, which 61% is urban
and the rest rural. Agriculture and forest activities are
the most important professions in the study area.
Geologic setting
The western Alborz range on the south and Talesh
Mounts on the north and west as huge barriers have
surrounded Gilan. At Pleistocene, the morphology of
Gilan was significantly changed by tectonics, climatic
changes and erosion. The Recent sediments along

J. Bio. & Env. Sci. 2015
271 | Ebrahimi et al.
with river, delta and coastal deposits and samples of
older rock units cover most sectors of Gilan,
indicating unstable nature of Gilan. The basement is
mainly composed of volcanic igneous rocks (andesitic,
basaltic and dacitic lavas and tuffs), regional
metamorphic rocks (green schist and amphibolite
schist facies, phyllite, meta-volcanic rocks, marble,
serpentinite) and sedimentary rocks (limestone,
sandstone, conglomerate, marl, shale, siltstone and
coal) along with old and new terraces and alluviums
(Fig. 1.b).Hydrologically, Gilan province is situated in
Caspian Sea catchment area. The direction of surface
water flow is towards Caspian Sea, thereby water
flows from the highlands in the west to lowlands in
the east (Fig. 1.c).
Fig. 1. a) Location of Gilan province, b) Lithology of the study area and c) sampling sites position along with
digital elevation model (DEM).
Sampling and analysis
Sampling was carried out from 55 surface water
samples in August 2013. Dry and clean bottles
prewashed with diluted (1:1) and rinsed three
times with the sampling water were used to collect
samples. Electrical conductivity (EC) and pH were
measured at the site using standard portable
instruments. The collected samples were instantly
labeled, refrigerated and carried to Gilan regional
water organization lab, and then retained at a
temperature of 4˚C prior to analysis. Concentration of
major ions was identified using the reference
analytical methods (Table 1). TDS were also measured
by evaporating pre-filtered samples to dryness.
Results and discussion
Physicochemical properties of the surface water The
data were checked for normal distribution using

J. Bio. & Env. Sci. 2015
272 | Ebrahimi et al.
Kolmogorov–Smirnov and Shapiro-Wilk tests. Only
and pH are normally distributed ( ),
while the significance level for the rest in both tests is
lower than 0.05 and thus the data are non-normally
distributed (Table 2). Therefore, the non-parametric
tests was applied to statistically assess the data.
Descriptive statistics of the analyzed data including
minimum, maximum and mean is presented in Table
3. Average content of the major cations and anions
are in the order of and
, respectively.
Table 1. Experimental methods used to determine
major ions concentration.
Parameter Method
Sodium Flame photometry
Potassium Flame photometry
Calcium Flame photometry
Magnesium Flame photometry
Chloride AgNO3 titration
Sulfate Spectrophotometry
Bicarbonate Titrimetry
Carbonate Titrimetry
Factor analysis (FA)
Factor analysis aims to reduce dimensionality and
explain as much information included in the data as
possible in the least possible components (Johnson
and Wichern,1992; Reimann et al.,2002). FA for the
variables EC, TDS, TH, pH, , , , ,
, ,
and was carried out with
principal component analysis (PCA) to identify
favorable number of principal components (PC) using
IBM SPSS 20. On the basis of eigenvalues >1, the first
three components explain 82.63% of cumulative
variance (Table 4).
The variables EC, TH, TDS, , , , ,
and have positive factor loadings in PC 1 and
explain 55.45% of the total variance. The constituents
from PC 1 are possibly derived from the identical
source, and/or undergo the same geochemical
processes. PC 2 which is comprised of and pH
explains 17.39% of the total variance. This means that
the surface water pH is primarily influenced by ,
due to the buffering effect of . PC 3 is
characterized by high positive factor loading and
accounts for 9.78% of the total variance.
Table 2. Statistical tests used to determine normality of the data.
Variables Kolmogorov-Smirnova Shapiro-Wilk
Statistic df Sig. Statistic df Sig.
0.137 55 0.012 0.912 55 0.001
0.128 55 0.024 0.883 55 0.000
0.335 55 0.000 0.564 55 0.000
0.333 55 0.000 0.440 55 0.000
0.094 55 0.200* 0.959 55 0.060
0.243 55 0.000 0.670 55 0.000
0.389 55 0.000 0.537 55 0.000
TDS 0.251 55 0.000 0.738 55 0.000
EC 0.233 55 0.000 0.739 55 0.000
pH 0.062 55 0.200* 0.976 55 0.334
0.536 55 0.000 0.182 55 0.000
*. This is a lower bound of the true significance.
a. Lilliefors Significance Correction.
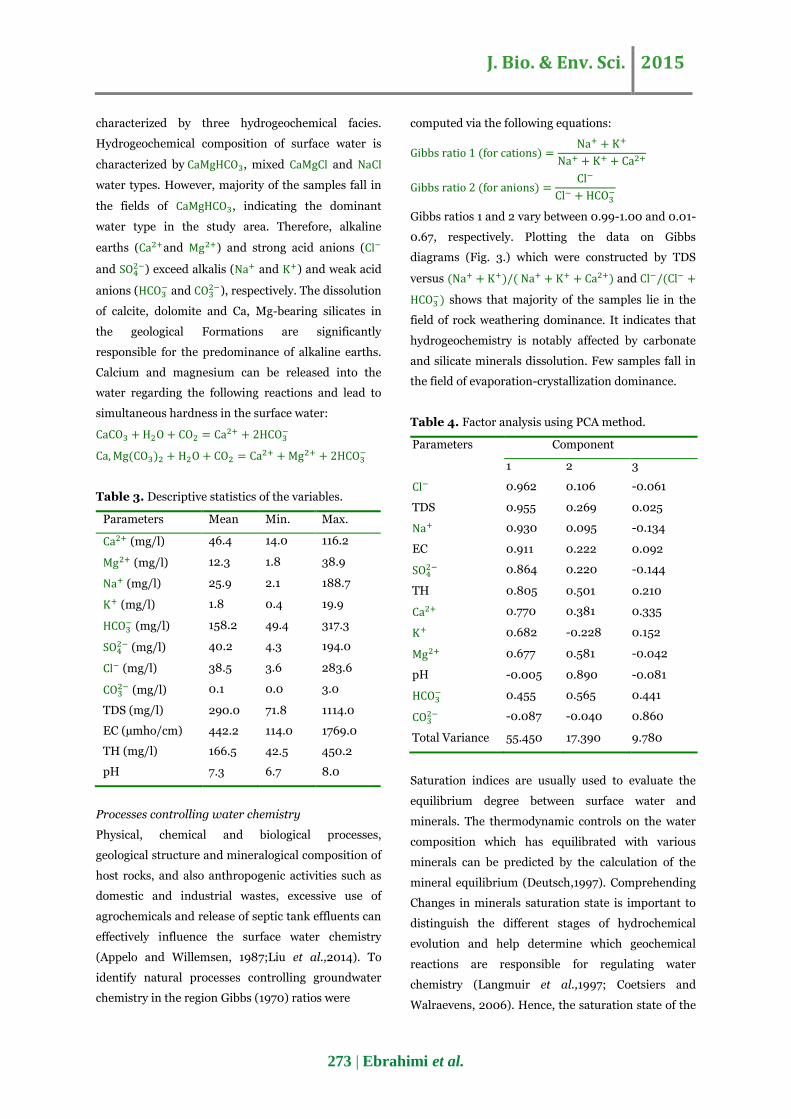
Hydrogeochemical facies
Hydrochemical facies indicate environmental
processes and/or evolution pattern of a water body.
Similarities and differences among surface water
samples is generally displayed by Piper (1944)
diagrams. Hence, the samples with similar qualities
are plotted in common groups and show the same
hydrogeochemical process. Piper diagram (Fig. 2.)
reveals that the Surface water in Gilan is
J. Bio. & Env. Sci. 2015
273 | Ebrahimi et al.
characterized by three hydrogeochemical facies.
Hydrogeochemical composition of surface water is
characterized by , mixed and
water types. However, majority of the samples fall in
the fields of , indicating the dominant
water type in the study area. Therefore, alkaline
earths ( and ) and strong acid anions (
and ) exceed alkalis ( and ) and weak acid
anions ( and
), respectively. The dissolution
of calcite, dolomite and Ca, Mg-bearing silicates in
the geological Formations are significantly
responsible for the predominance of alkaline earths.
Calcium and magnesium can be released into the
water regarding the following reactions and lead to
simultaneous hardness in the surface water:
Table 3. Descriptive statistics of the variables.
Parameters Mean Min. Max.
(mg/l) 46.4 14.0 116.2
(mg/l) 12.3 1.8 38.9
(mg/l) 25.9 2.1 188.7
(mg/l) 1.8 0.4 19.9
(mg/l) 158.2 49.4 317.3
(mg/l) 40.2 4.3 194.0
(mg/l) 38.5 3.6 283.6
(mg/l) 0.1 0.0 3.0
TDS (mg/l) 290.0 71.8 1114.0
EC (µmho/cm) 442.2 114.0 1769.0
TH (mg/l) 166.5 42.5 450.2
pH 7.3 6.7 8.0
Processes controlling water chemistry
Physical, chemical and biological processes,
geological structure and mineralogical composition of
host rocks, and also anthropogenic activities such as
domestic and industrial wastes, excessive use of
agrochemicals and release of septic tank effluents can
effectively influence the surface water chemistry
(Appelo and Willemsen, 1987;Liu et al.,2014). To
identify natural processes controlling groundwater
chemistry in the region Gibbs (1970) ratios were
computed via the following equations:
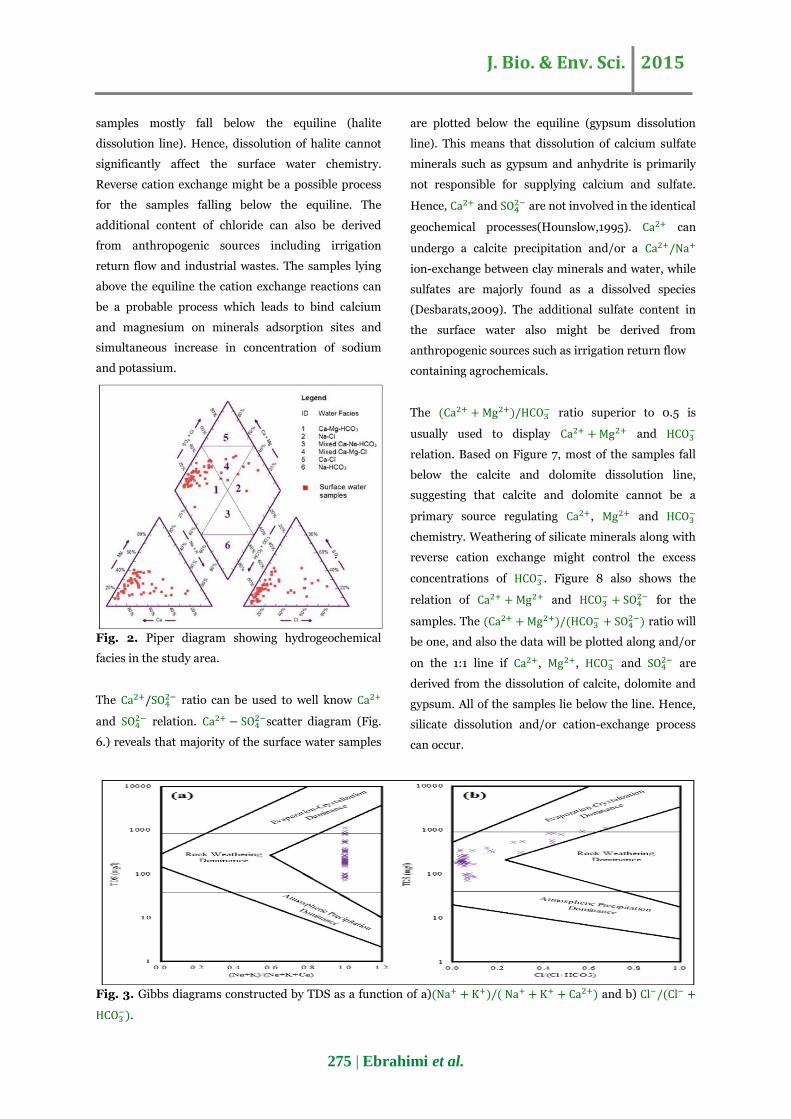
Gibbs ratios 1 and 2 vary between 0.99-1.00 and 0.01-
0.67, respectively. Plotting the data on Gibbs
diagrams (Fig. 3.) which were constructed by TDS
versus and
shows that majority of the samples lie in the
field of rock weathering dominance. It indicates that
hydrogeochemistry is notably affected by carbonate
and silicate minerals dissolution. Few samples fall in
the field of evaporation-crystallization dominance.
Table 4. Factor analysis using PCA method.
Parameters Component
1 2 3
0.962 0.106 -0.061
TDS 0.955 0.269 0.025
0.930 0.095 -0.134
EC 0.911 0.222 0.092
0.864 0.220 -0.144
TH 0.805 0.501 0.210
0.770 0.381 0.335
0.682 -0.228 0.152
0.677 0.581 -0.042
pH -0.005 0.890 -0.081
0.455 0.565 0.441
-0.087 -0.040 0.860
Total Variance 55.450 17.390 9.780
Saturation indices are usually used to evaluate the
equilibrium degree between surface water and
minerals. The thermodynamic controls on the water
composition which has equilibrated with various
minerals can be predicted by the calculation of the
mineral equilibrium (Deutsch,1997). Comprehending
Changes in minerals saturation state is important to
distinguish the different stages of hydrochemical
evolution and help determine which geochemical
reactions are responsible for regulating water
chemistry (Langmuir et al.,1997; Coetsiers and
Walraevens, 2006). Hence, the saturation state of the

J. Bio. & Env. Sci. 2015
274 | Ebrahimi et al.
groundwater was distinguished with respect to major
carbonate minerals (calcite, aragonite and dolomite)
and evaporites (halite, gypsum and anhydrite) using
the hydrogeochemical equilibrium model, Phreeqc via
the following equation (Parkhurst and Appelo,1999):
where SI is the saturation index, IAP is the ion
activity product and is the solubility product of a
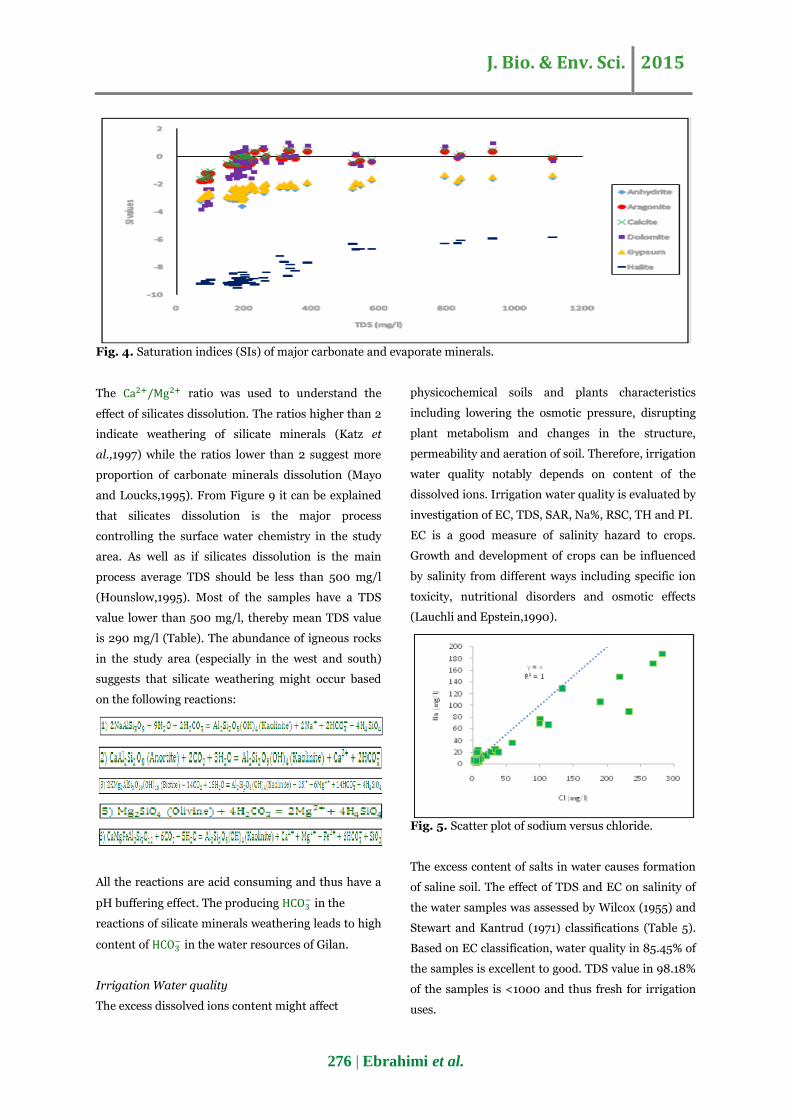
specific solid phase at given temperature. Figure 4
illustrates the saturation states of carbonate and
evaporate minerals. Regarding carbonate minerals
majority of the samples are plotted above the
saturation line while evaporate minerals
mostly fall under the saturation line ( ). Hence,
carbonate minerals primarily undergo precipitation
process while evaporate minerals are mainly
dissolved. Evaporate minerals such as gypsum and
anhydrite gradually and without precipitation
dissolve along the water flow, leading to increase in
the content of calcium and thus decrease in the
content of and
by precipitation of
carbonate minerals. Hence, Evaporites are difficultly
saturated due to lack of enough in a hydrological
system. It can thus be explained that carbonate
minerals play an important role in controlling surface
water chemistry in Gilan.
Table 5. Classifications presented for irrigation water parameters.
Index Range Water Class Samples (%)
Na% < 20 Excellent 60.01
20-40 Good 23.63
40-60 Permissible 10.9
60-80 Doubtful 5.45
> 80 Unsuitable 0
SAR < 10 Excellent (S1) 83.64
18-Oct Good (S2) 9.09
18-26 Doubtful (S3) 5.45
> 26 Unsuitable (S4) 1.81
RSC (meq/l) < 1.25 Good 1.81
1.25-2.5 Doubtful 16.36
> 2.5 Unsuitable 81.82
TDS < 1000 Fresh 98.18
1000-3000 Slightly saline 1.82
3000-10000 Moderately saline 0
10000-35000 High saline 0
TH < 75 Soft 14.55
75-150 Moderately hard 38.18
150-300 Hard 38.19
> 300 Very hard 9.09
EC < 250 Excellent 18.18
250-750 Good 67.27
750-2000 Permissible 14.54
2000-3000 Doubtful 0
> 3000 Unsuitable 0
PI ≤ 25% Critical 1.81
25% - 75% Unsuitable 5.45
≥ 75% Acceptable 92.74
Compositional relations of the major ions
The chemical composition of groundwater is
influenced by several factors such as the
mineralogical composition and physical properties of
host rock(s), residence time of groundwater
contacting with aquifer matrix and the nature of
recharge water (Dudeja et al.,2011). The
compositional relations among aqueous species can
well be understood using ionic ratios.
The relation of and can easily be identified
based on ratio. Figure 5 shows that the
J. Bio. & Env. Sci. 2015
275 | Ebrahimi et al.
samples mostly fall below the equiline (halite
dissolution line). Hence, dissolution of halite cannot
significantly affect the surface water chemistry.
Reverse cation exchange might be a possible process
for the samples falling below the equiline. The
additional content of chloride can also be derived
from anthropogenic sources including irrigation
return flow and industrial wastes. The samples lying
above the equiline the cation exchange reactions can
be a probable process which leads to bind calcium
and magnesium on minerals adsorption sites and
simultaneous increase in concentration of sodium
and potassium.
Fig. 2. Piper diagram showing hydrogeochemical
facies in the study area.
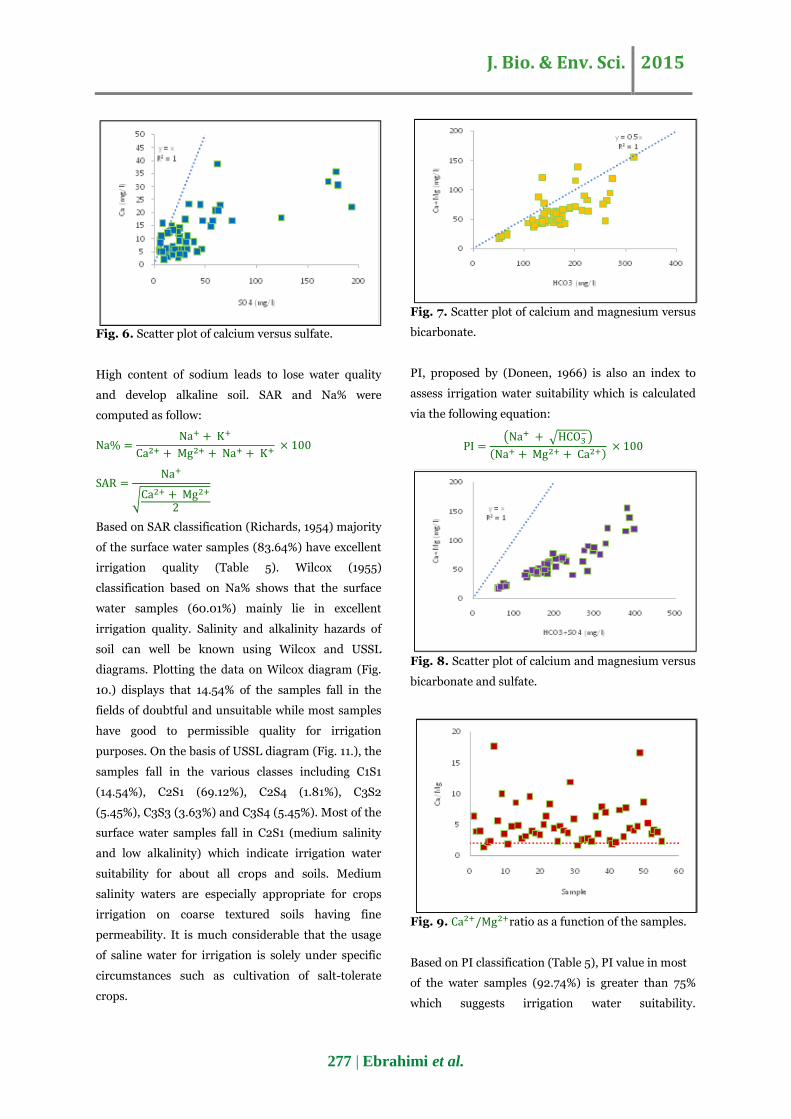
The ratio can be used to well know
and relation.
scatter diagram (Fig.
6.) reveals that majority of the surface water samples
are plotted below the equiline (gypsum dissolution
line). This means that dissolution of calcium sulfate
minerals such as gypsum and anhydrite is primarily
not responsible for supplying calcium and sulfate.
Hence, and are not involved in the identical
geochemical processes(Hounslow,1995). can
undergo a calcite precipitation and/or a
ion-exchange between clay minerals and water, while
sulfates are majorly found as a dissolved species
(Desbarats,2009). The additional sulfate content in
the surface water also might be derived from
anthropogenic sources such as irrigation return flow
containing agrochemicals.
The ratio superior to 0.5 is
usually used to display and
relation. Based on Figure 7, most of the samples fall
below the calcite and dolomite dissolution line,
suggesting that calcite and dolomite cannot be a
primary source regulating , and
chemistry. Weathering of silicate minerals along with
reverse cation exchange might control the excess
concentrations of . Figure 8 also shows the
relation of and
for the
samples. The
ratio will
be one, and also the data will be plotted along and/or
on the 1:1 line if , , and
are
derived from the dissolution of calcite, dolomite and
gypsum. All of the samples lie below the line. Hence,
silicate dissolution and/or cation-exchange process
can occur.
Fig. 3. Gibbs diagrams constructed by TDS as a function of a) and b)
.
J. Bio. & Env. Sci. 2015
276 | Ebrahimi et al.
Fig. 4. Saturation indices (SIs) of major carbonate and evaporate minerals.
The ratio was used to understand the
effect of silicates dissolution. The ratios higher than 2
indicate weathering of silicate minerals (Katz et
al.,1997) while the ratios lower than 2 suggest more
proportion of carbonate minerals dissolution (Mayo
and Loucks,1995). From Figure 9 it can be explained
that silicates dissolution is the major process
controlling the surface water chemistry in the study
area. As well as if silicates dissolution is the main
process average TDS should be less than 500 mg/l
(Hounslow,1995). Most of the samples have a TDS
value lower than 500 mg/l, thereby mean TDS value
is 290 mg/l (Table). The abundance of igneous rocks
in the study area (especially in the west and south)
suggests that silicate weathering might occur based
on the following reactions:
All the reactions are acid consuming and thus have a
pH buffering effect. The producing in the
reactions of silicate minerals weathering leads to high
content of in the water resources of Gilan.
Irrigation Water quality
The excess dissolved ions content might affect
physicochemical soils and plants characteristics
including lowering the osmotic pressure, disrupting
plant metabolism and changes in the structure,
permeability and aeration of soil. Therefore, irrigation
water quality notably depends on content of the
dissolved ions. Irrigation water quality is evaluated by
investigation of EC, TDS, SAR, Na%, RSC, TH and PI.
EC is a good measure of salinity hazard to crops.
Growth and development of crops can be influenced
by salinity from different ways including specific ion
toxicity, nutritional disorders and osmotic effects
(Lauchli and Epstein,1990).
Fig. 5. Scatter plot of sodium versus chloride.
The excess content of salts in water causes formation
of saline soil. The effect of TDS and EC on salinity of
the water samples was assessed by Wilcox (1955) and
Stewart and Kantrud (1971) classifications (Table 5).
Based on EC classification, water quality in 85.45% of
the samples is excellent to good. TDS value in 98.18%
of the samples is <1000 and thus fresh for irrigation
uses.
J. Bio. & Env. Sci. 2015
277 | Ebrahimi et al.
Fig. 6. Scatter plot of calcium versus sulfate.
High content of sodium leads to lose water quality
and develop alkaline soil. SAR and Na% were
computed as follow:
Based on SAR classification (Richards, 1954) majority
of the surface water samples (83.64%) have excellent
irrigation quality (Table 5). Wilcox (1955)
classification based on Na% shows that the surface
water samples (60.01%) mainly lie in excellent
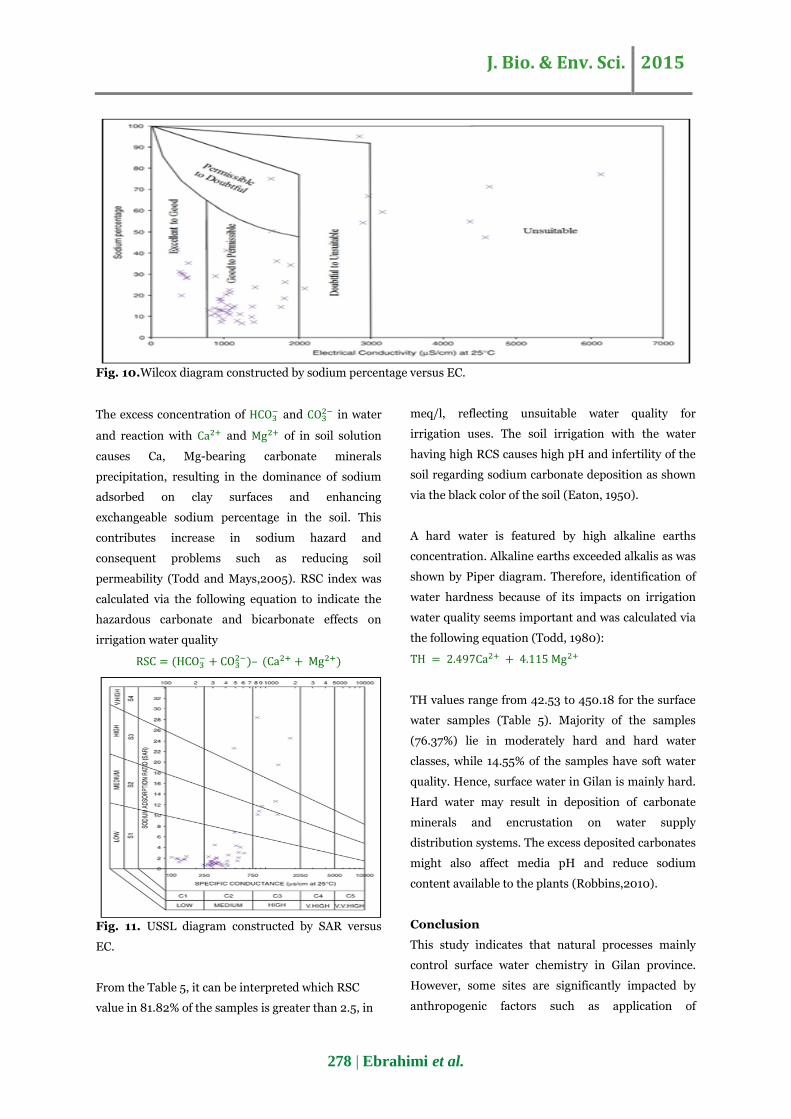
irrigation quality. Salinity and alkalinity hazards of
soil can well be known using Wilcox and USSL
diagrams. Plotting the data on Wilcox diagram (Fig.
10.) displays that 14.54% of the samples fall in the
fields of doubtful and unsuitable while most samples
have good to permissible quality for irrigation
purposes. On the basis of USSL diagram (Fig. 11.), the
samples fall in the various classes including C1S1
(14.54%), C2S1 (69.12%), C2S4 (1.81%), C3S2
(5.45%), C3S3 (3.63%) and C3S4 (5.45%). Most of the
surface water samples fall in C2S1 (medium salinity
and low alkalinity) which indicate irrigation water
suitability for about all crops and soils. Medium
salinity waters are especially appropriate for crops
irrigation on coarse textured soils having fine
permeability. It is much considerable that the usage
of saline water for irrigation is solely under specific
circumstances such as cultivation of salt-tolerate
crops.
Fig. 7. Scatter plot of calcium and magnesium versus
bicarbonate.
PI, proposed by (Doneen, 1966) is also an index to
assess irrigation water suitability which is calculated
via the following equation:
Fig. 8. Scatter plot of calcium and magnesium versus
bicarbonate and sulfate.
Fig. 9. ratio as a function of the samples.
Based on PI classification (Table 5), PI value in most
of the water samples (92.74%) is greater than 75%
which suggests irrigation water suitability.
J. Bio. & Env. Sci. 2015
278 | Ebrahimi et al.
Fig. 10.Wilcox diagram constructed by sodium percentage versus EC.
The excess concentration of and
in water
and reaction with and of in soil solution
causes Ca, Mg-bearing carbonate minerals
precipitation, resulting in the dominance of sodium
adsorbed on clay surfaces and enhancing
exchangeable sodium percentage in the soil. This
contributes increase in sodium hazard and
consequent problems such as reducing soil
permeability (Todd and Mays,2005). RSC index was
calculated via the following equation to indicate the
hazardous carbonate and bicarbonate effects on
irrigation water quality
Fig. 11. USSL diagram constructed by SAR versus
EC.
From the Table 5, it can be interpreted which RSC
value in 81.82% of the samples is greater than 2.5, in
meq/l, reflecting unsuitable water quality for
irrigation uses. The soil irrigation with the water
having high RCS causes high pH and infertility of the
soil regarding sodium carbonate deposition as shown
via the black color of the soil (Eaton, 1950).
A hard water is featured by high alkaline earths
concentration. Alkaline earths exceeded alkalis as was
shown by Piper diagram. Therefore, identification of
water hardness because of its impacts on irrigation
water quality seems important and was calculated via
the following equation (Todd, 1980):
TH values range from 42.53 to 450.18 for the surface
water samples (Table 5). Majority of the samples
(76.37%) lie in moderately hard and hard water
classes, while 14.55% of the samples have soft water
quality. Hence, surface water in Gilan is mainly hard.
Hard water may result in deposition of carbonate
minerals and encrustation on water supply
distribution systems. The excess deposited carbonates
might also affect media pH and reduce sodium
content available to the plants (Robbins,2010).
Conclusion
This study indicates that natural processes mainly
control surface water chemistry in Gilan province.
However, some sites are significantly impacted by
anthropogenic factors such as application of

J. Bio. & Env. Sci. 2015
279 | Ebrahimi et al.
agricultural fertilizers. The weathering of various
lithological formations, plays a crucial role in
providing ions content of the surface water. The mean
concentration of the major cations and anionsare in
the order of and
, respectively. Piper diagram shows
that is the major hydrogeochemical facies.
As well alkaline earths ( and ) and strong
acid anions ( and ) exceed alkalis ( and
) and weak acid anions ( and
),
respectively. Gibbs plots and ionic ratios diagrams
illustrate that the weathering of silicate minerals is
the primary natural process regulating the surface
water chemistry. Nevertheless, the dissolution of
carbonate minerals also can influence
hydrogeochemistry of the area as was shown by
saturation indices, thereby majority of the samples
are oversaturated with respect to calcite, dolomite
and aragonite while evaporites including anhydrite,
gypsum and halite mainly display unsaturation
status. The investigation of residual sodium carbonate
(RSC) and Total hardness (TH) reflect crucial
irrigation unsuitability of the surface water in
majority of the samples. However, sodium percentage
(Na%), sodium adsorption ratio (SAR), electrical
conductivity (EC), total dissolved solids (TDS) and
permeability index (PI) mostly are below the standard
levels. Hence, there is a need for the exact and
comprehensive monitoring and managing the surface
water resources in the polluted sites. The proper
management programs can be considered as an
efficient tool for preserving the precious water
resources.
References
Akter M, Sikder T, Atique Ullah AKM. 2014.
Water quality assessment of an industrial zone
polluted aquatic body in Dhaka, Bangladesh.
American Journal of Environmental Protection 3(5),
232-237.
Appelo CAJ, Willemsen A. 1987. Geochemical
calculations and observations on salt water
intrusions, I. A combined geochemical/minxing cell
model. Journal of Hydrology 94(3), 313-330.
Coetsiers M, Walraevens K. 2006. Chemical
characterization of the neogene aquifer, Belgium.
Hydrogeology Journal 14(8), 1556-1568.
Desbarats AJ. 2009. On elevated fluoride and
boron concentrations in groundwaters associated
with the Lake Saint-Martin impact structure,
Manitoba. Applied Geochemistry24(5), 915-927.
Deutsch WJ. 1997. Groundwater geochemistry:
fundamentals and applications to contamination.
CRC press.
Doneen L. 1966. Water quality requirement for
agriculture. Proceding of National Symposium.
Quality standards for natural waters. University of
Michigan, Annual Report 213-218.
Dudeja D, Bartarya SK, Biyani A. 2011.
Hydrochemical and water quality assessment of
groundwater in Doon Valley of Outer Himalaya,
Uttarakhand, India. Environmental Monitoring and
Assessment 181(1-4), 183-204.
Eaton FM. 1950. Significance of carbonates in
irrigation waters. Soil Science69(2), 123-134.
Gibbs RJ. 1970. Mechanisms controlling world
water chemistry. Science 170(3962), 1088-1090.
Hadgu LT, Nyadawa MO, Mwangi JK, Kibetu
PM, Mehari BB. 2014. Application of Water Quality
Model QUAL2K to Model the Dispersion of Pollutants
in River Ndarugu, Kenya. Computational Water,
Energy, and Environmental Engineering 3, 162-169.
Hounslow A. 1995. Water quality data: analysis and
interpretation. CRC Press.
Islam SMN, Rahman SH, Rahman MM, Adyel
TM, Yesmin RA, Ahmed MS, Kaiser N. 2011.

J. Bio. & Env. Sci. 2015
280 | Ebrahimi et al.
Excessive urbidity removal from textile effluents
using electrocoagulation technique, Journal of
Scientific Research 3(3), 557-568.
Johnson RA, Wichern DW. 1992. Applied
multivariate statistical analysis.4,Englewood Cliffs,
NJ: Prentice Hall.
Katz BG, Coplen TB, Bullen TD, Davis JH.
1997. Use of chemical and isotopic tracers to
characterize the interactions between ground water
and surface water in mantled karst. Groundwater
35(6), 1014-1028.
Langmuir D, Hall P, Drever J. 1997.
Environmental geochemistry.New Jersey,Prentice
Hall.
Lauchli A, Epstein E. 1990. Plant responses to
saline and sodic conditions. Agricultural Salinity
Assessment and Management 71, 113-137.
Liu F, Song X, Yang L, Zhang Y, Han D, Ma Y,
Bu H. 2014. Identifying the origin and geochemical
evolution of groundwater using hydrochemistry and
stable isotopes in Subei Lake Basin, Ordos energy
base, Northwestern China. Hydrology and Earth
System Sciences Discussions11(5), 5709-5745.
Mayo AL, Loucks MD. 1995. Solute and isotopic
geochemistry and ground water flow in the central
Wasatch Range, Utah. Journal of Hydrology 172(1),
31-59.
Nakhaei N, Shahidi AE. 2010. Waste water
discharge impactmodling with QUAL2k, case study:
The Zayandeh-Rood River. International
Environmental Modelling and Software Society
(IEMSS), Ottawa.
Parkhurst DL, Appelo C. 1999. User's guide to
PHREEQC (Version 2): A computer program for
speciation, batch-reaction, one-dimensional
transport, and inverse geochemical calculations.
Piper AM. 1944. A graphic procedure in the
geochemical interpretation of water-analyses.
Transactions, American Geophysical Union25, 914-
928.
Reimann C, Filzmoser P, Garrett RG. 2002.
Factor analysis applied to regional geochemical data:
problems and possibilities. Applied Geochemistry
17(3), 185-206.
Richards L. 1954. Diagnosis and improvement of
saline and alkali soils. Washington: United States
Salinity Laboratory, 160p. USDA. Agriculture
Handbook, 60.
Robbins JA. 2010. Irrigation water for greenhouses
and nurseries. University of Arkansas, Division of
Agriculture, Agriculture and Natural Resources.
Simeonov V, Simeonova P, Tsitouridou R.
2004. Chemometric quality assessment of surface
waters: two case studies. Chemical and Engineering
Ecology11(6), 449-469.
Singh KP, Malik A, Mohan D, Sinha S. 2004.
Multivariate statistical techniques for the evaluation
of spatial and temporal variations in water quality of
Gomti River (India)—a case study. Water Research.
38(18), 3980-3992.
Todd DK. 1980. Groundwater hydrology. New York.
John Wiley and Sons.
Todd DK, Mays LW. 2005. Groundwater hydrology
edition: Wiley, New Jersey.
Stewart RE, Kantrud HA. 1971. Classification of
natural ponds and lakes in the glaciated prairie
region.United State Geological Survey Publication 92.
Wilcox LV. 1955. Classification and use of irrigation
waters. United State Department of Agriculture,
Washington DC, Circular No. 969, 1-19.
Related Documents