J. Agr. Sci. Tech. (2011) Vol. 13: 727-742 727 Assessing Impacts of Land Use Change on Soil Quality Indicators in a Loessial Soil in Golestan Province, Iran S. Ayoubi 1 *, F. Khormali 2 , K. L. Sahrawat 3 , A. C. Rodrigues de Lima 4 ABSTRACT A study was conducted to determine suitable soil properties as soil quality indicators, using factor analysis in order to evaluate the effects of land use change on loessial hillslope soils of the Shastkola District in Golestan Province, northern Iran. To this end, forty surface soil (0-30 cm) samples were collected from four adjacent sites with the following land uses systems: (1) natural forest, (2) cultivated land, (3) land reforested with olive, and (4) land reforested with Cupressus. Fourteen soil chemical, physical, and biological properties were measured. Factor analysis (FA) revealed that mean weight diameter (MWD), water stable aggregates (WSA), soil organic matter (SOM), and total nitrogen (TN) were suitable for assessing the soil quality in the given ecosystem for monitoring the land use change effects. The results of analysis of variance (ANOVA) and mean comparison showed that there were significant (P< 0.01) differences among the four treatments with regard to SOM, MWD, and sand content. Clearing of the hardwood forest and tillage practices during 40 years led to a decrease in SOM by 71.5%. Cultivation of the deforested land decreased MWD by 52% and increased sand by 252%. The reforestation of degraded land with olive and Cupressus increased SOM by about 49% and 72%, respectively, compared to the cultivated control soil. Reforestation with olive increased MWD by 81% and reforestation with Cupressus increased MWD by 83.6%. The study showed that forest clearing followed by cultivation of the loessial hilly slopes resulted in the decline of the soil quality attributes, while reforestation improved them in the study area. Keywords: Factor analysis, Land use change, Reforestation, Soil quality. _____________________________________________________________________________ 1 Department of Soil Science, College of Agriculture, Isfahan University of Technology, 84156-83111, Isfahan, Islamic Republic of Iran. * Corresponding author, e-mail: [email protected] 2 Department of Soil Science, College of Agriculture, Gorgan University of Agricultural Sciences and Natural Resources, Gorgan, Islamic Republic of Iran. 3 International Crop Research Institute for the Semi Arid Tropics (ICRISAT), Patancheru 502 324, Andhra Pradesh, India. 4 Farm Technology Group, Wageningen University, P. O. Box: 17, 6700 AA Wageningen, The Netherlands. INTRODUCTION Environmental degradation caused by inappropriate land use is a worldwide problem that has attracted attention in sustainable agricultural production systems (Pierce and Larson, 1993; Zink and Farshad, 1995; Hurni, 1997; Hebel, 1998; Sanchez- Maranon et al., 2002; Vagen et al., 2006; Khormali and Nabiollahy, 2009). During the recent decades, soil quality concept has emerged and is used to assess land or soil quality under various systems (Doran and Parkin, 1994; Karlen et al., 1997; de Lima et al., 2008). Soil quality essentially means “the capacity of a soil to function” (Larson and Pierce, 1991; Doran and Parkin, 1994; Karlen et al., 1997). Larson and Pierce (1991) outlined five soil functions that may be used as the criteria for judging the soil quality: to hold and release water to plants, streams, and subsoil; to hold

Welcome message from author
This document is posted to help you gain knowledge. Please leave a comment to let me know what you think about it! Share it to your friends and learn new things together.
Transcript

J. Agr. Sci. Tech. (2011) Vol. 13: 727-742
727
Assessing Impacts of Land Use Change on Soil Quality
Indicators in a Loessial Soil in Golestan Province, Iran
S. Ayoubi1*, F. Khormali
2, K. L. Sahrawat
3, A. C. Rodrigues de Lima
4
ABSTRACT
A study was conducted to determine suitable soil properties as soil quality indicators,
using factor analysis in order to evaluate the effects of land use change on loessial hillslope
soils of the Shastkola District in Golestan Province, northern Iran. To this end, forty
surface soil (0-30 cm) samples were collected from four adjacent sites with the following
land uses systems: (1) natural forest, (2) cultivated land, (3) land reforested with olive,
and (4) land reforested with Cupressus. Fourteen soil chemical, physical, and biological
properties were measured. Factor analysis (FA) revealed that mean weight diameter
(MWD), water stable aggregates (WSA), soil organic matter (SOM), and total nitrogen
(TN) were suitable for assessing the soil quality in the given ecosystem for monitoring the
land use change effects. The results of analysis of variance (ANOVA) and mean
comparison showed that there were significant (P< 0.01) differences among the four
treatments with regard to SOM, MWD, and sand content. Clearing of the hardwood
forest and tillage practices during 40 years led to a decrease in SOM by 71.5%.
Cultivation of the deforested land decreased MWD by 52% and increased sand by 252%.
The reforestation of degraded land with olive and Cupressus increased SOM by about
49% and 72%, respectively, compared to the cultivated control soil. Reforestation with
olive increased MWD by 81% and reforestation with Cupressus increased MWD by
83.6%. The study showed that forest clearing followed by cultivation of the loessial hilly
slopes resulted in the decline of the soil quality attributes, while reforestation improved
them in the study area.
Keywords: Factor analysis, Land use change, Reforestation, Soil quality.
_____________________________________________________________________________ 1 Department of Soil Science, College of Agriculture, Isfahan University of Technology, 84156-83111,
Isfahan, Islamic Republic of Iran.
* Corresponding author, e-mail: [email protected] 2 Department of Soil Science, College of Agriculture, Gorgan University of Agricultural Sciences and
Natural Resources, Gorgan, Islamic Republic of Iran. 3 International Crop Research Institute for the Semi Arid Tropics (ICRISAT), Patancheru 502 324, Andhra
Pradesh, India. 4 Farm Technology Group, Wageningen University, P. O. Box: 17, 6700 AA Wageningen, The Netherlands.
INTRODUCTION
Environmental degradation caused by
inappropriate land use is a worldwide
problem that has attracted attention in
sustainable agricultural production systems
(Pierce and Larson, 1993; Zink and Farshad,
1995; Hurni, 1997; Hebel, 1998; Sanchez-
Maranon et al., 2002; Vagen et al., 2006;
Khormali and Nabiollahy, 2009). During the
recent decades, soil quality concept has
emerged and is used to assess land or soil
quality under various systems (Doran and
Parkin, 1994; Karlen et al., 1997; de Lima et
al., 2008). Soil quality essentially means
“the capacity of a soil to function” (Larson
and Pierce, 1991; Doran and Parkin, 1994;
Karlen et al., 1997).
Larson and Pierce (1991) outlined five soil
functions that may be used as the criteria for
judging the soil quality: to hold and release
water to plants, streams, and subsoil; to hold
_______________________________________________________________________ Ayoubi et al.
728
and release nutrients and other chemicals; to
promote and sustain root growth; to
maintain suitable soil biotic habitats; and to
respond to management and resist
degradation. It is suggested that, for
practical purposes, soil quality can be used
to judge impact on crop yield, erosion,
ground and surface water status and quality,
food and air quality (Wang et al., 2003).
The capacity of the soil to function can be
determined by soil physical, chemical, and
biological properties, also termed as soil
quality indicators (Shukla et al., 2006; Wang
and Gong, 1998). Soil properties that are
responsive to the change in the land use
dynamics on a short-term are considered as
suitable soil quality indicators (Carter et al.,
1998). A soil quality indicator is a
measurable soil property that affects the
capacity of a soil to perform a specified
function (Karlen et al., 1997). For evaluation
of soil quality, it is desirable to select
indicators that are directly related to soil
quality. If a set of attributes is selected to
represent the soil functions and if the
appropriate measurements are made, the
data may be used to assess the soil quality
(Heil and Sposito, 1997).
A large body of information is now
available that clearly shows that severe
decline in soil quality occurs along with
increased soil erosion as a result of
agricultural activities following
deforestation (Sigstad et al., 2002).
Hajabbasi et al. (1997) showed that
deforestation and clear cutting of the forest
in central Zagrous mountains (western Iran)
resulted in a lower soil quality and,
consequently, decreased productivity.
Ellingson et al. (2000) quantified soil N
dynamics: mineralization and nitrification
rates in response to the change in land use
from forest to pasture. However, they
represented the high-end extreme as a large
proportion of the above ground forest
biomass was consumed by anthropogenic
fires. Land use changes, especially
cultivation of deforested land, may rapidly
diminish soil quality. As a result, severe
degradation in soil quality may lead to a
permanent degradation of land productivity
(Kang and Juo, 1986; Nadri et al., 1996;
Islam et al., 1999; Islam and Weil, 2000b).
Due to an increasing demand for firewood,
timber, pasture, food, and residential
dwelling, the hardwood forests are being
degraded or converted to cropland at an
alarming rate in the hilly regions of Golestan
Province, during the last few decades. The
forest coverage in this province has
decreased by 32.2% (from 18 to 12.2 million
ha) in the last 30 years (Kiani et al., 2003).
This conversion of natural forest to other
uses, such as cultivation, has created serious
problems and is a main cause of the annual
destructive flooding in this area (Mosaedi,
2003; Ajami et al., 2006).
The study region is located in north-facing
slopes of Alborz Mountain Ranges and was
covered with hardwood forests of Parotia
persica and Carpinus betulus up to 40 years
ago. The parent material in the lower hill
slopes of Golestan Province are composed
of loess materials, which are very
susceptible to soil erosion and need to be
properly managed (Kiani et al., 2003).
While signs of rill, gully, and even landslide
erosion patterns induced by improper
conservation practices in the deforested land
are evident on the hill slopes (Ayoubi,
2005), degraded land has been reclaimed by
reforestation with Olea europea and
Cupressus arizonica by local farmers and
governmental organizations, during the last
30 years.
Although there are a lot of data available
on soil properties due to land use change,
little information is available for the soils
developed on the loess material in the semi-
arid region. No attempt has been made to
generate minimum data set to evaluate soil
quality changes following the deforestation
and reforestation. The objectives of this
study were to: (1) generate a minimum data
set (MDS) on soil quality indicators using
factor analysis and (2) evaluate the changes
in the selected soil quality indicators in
response to land use changes.
Assessment of Soil Quality in a Loessial Soil _____________________________________
729
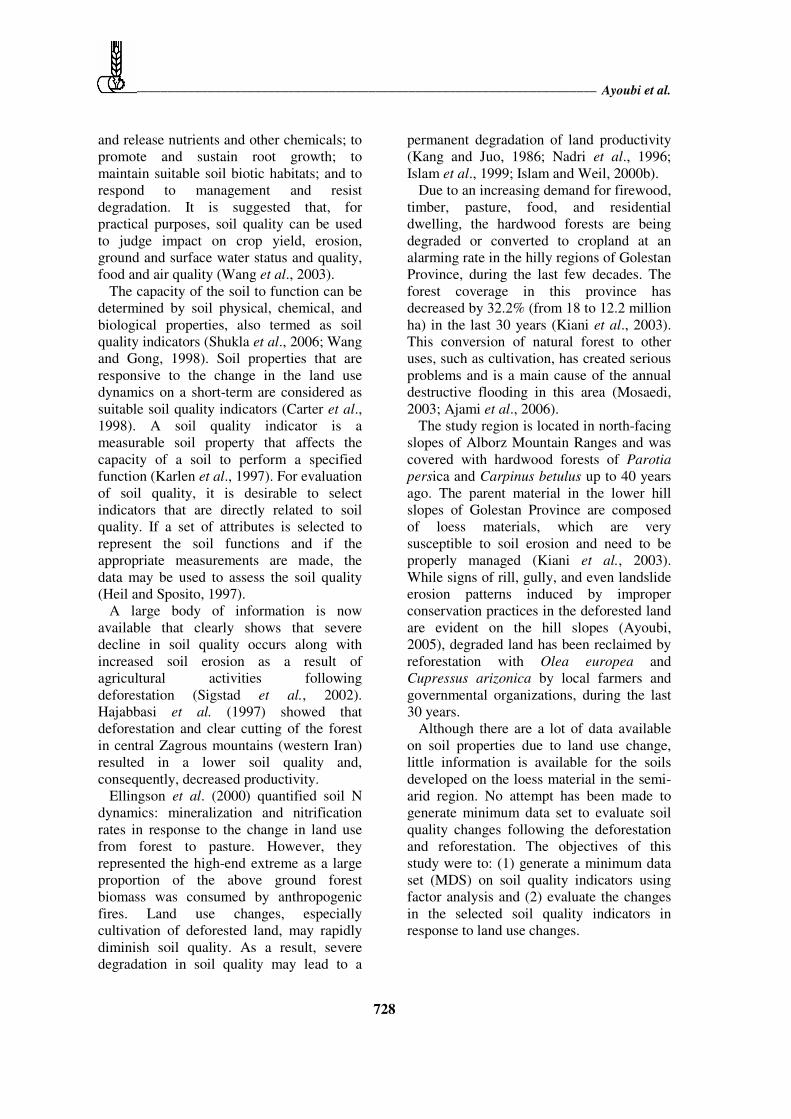
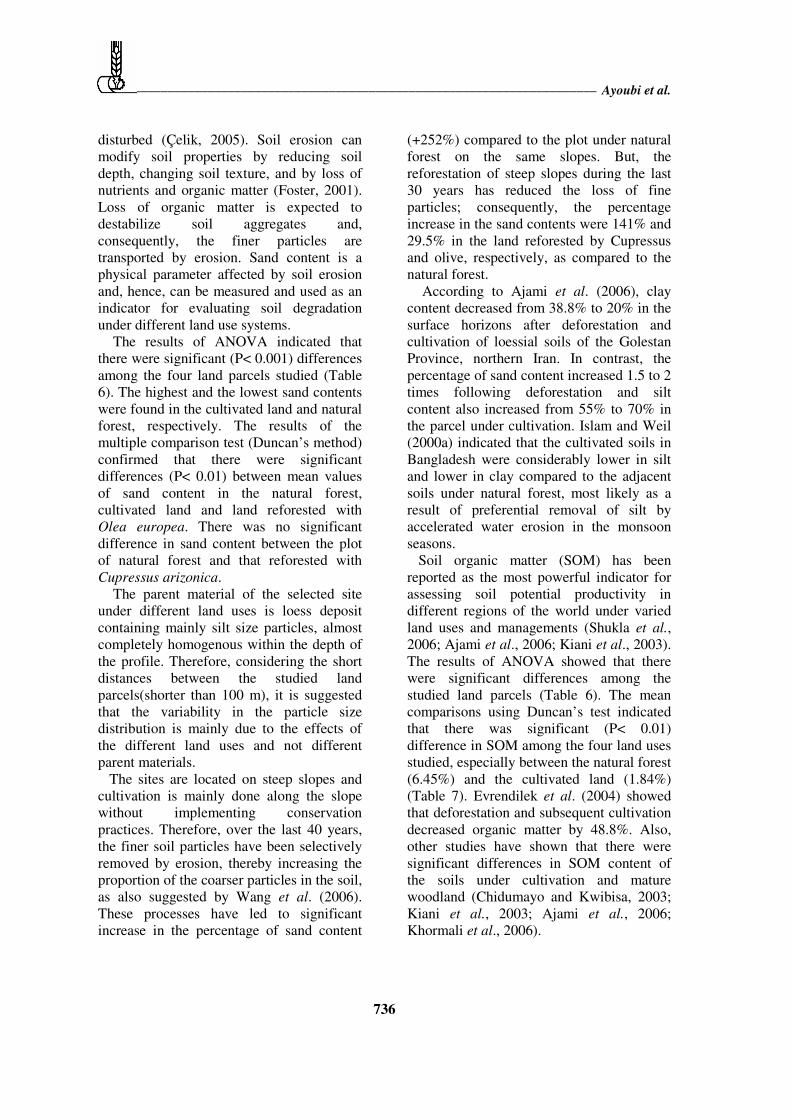
Figure 1. Location of the study site in north of Iran.
MATERIALS AND METHODS
Description of the Study Area
The study area is located between 36° 24ََ and 38° 5ََ northern latitudes, and 53° 51ََ and 56° 14ََ eastern longitudes, 10 km east
of Gorgan City, in northern Iran (Figure 1).
The parent material is composed mainly of
loess material, highly sensitive to erosion
and has a hilly physiographic landform with
20-25% slope. The average annual rainfall is
560 mm and occurs mainly from October to
April. The annual average temperature at the
site is 14.9ºC. The average elevation of the
hillslope is 320 m above sea level.
According to Soil Taxonomy (Soil Survey
Staff, 2006), the soil moisture and
temperature regimes are xeric and thermic.
The hill slopes of the study area
have been generally covered with hardwood
dominated by Parotia persica and Carpinus
betulus trees. The selected site on the steep
slopes was opened by clear cutting and
converted to farmlands, about 40 years ago.
In some areas, the reforestation with
Cupressus arizonica and Olea europea was
introduced by local farmers and
governmental organizations during the last
30 years. Details of the selected land uses
are given in Table 1. The soils of the study
area are classified as Mollisols and
Inceptisols (Soil Survey Staff, 2006) with
textures ranging from silt and silt loam to
silty clay loam in the surface of different
land uses.
The study included four adjacent land
parcels under different uses at the Shastkola:
(1) natural hardwood forest, (2) cultivated
land, (3) reforested land with Olea europea,
and (4) reforested land with Cupressus
arizonica, as in Figure 1.
Soil Sampling and Pretreatments
Surface soil samples from 0-30 cm depth
were collected in April 2005 from forty
randomly selected points in the four adjacent
land parcels, using a hand auger. In total,
160 samples were collected, air-dried and
passed through a 2 mm sieve to remove
stones, roots, and large organic residues
before conducting analyses for chemical and
physical characteristics. In order to measure
soil microbial respiration rate, 40 fresh and
undisturbed soil samples were taken from
each land parcel.
_______________________________________________________________________ Ayoubi et al.
730
Table 1. Description of the site under different land uses on losseial soil in the Gorgan Province, northern
Iran.
Land use Soil classification
(USDA, 2006)
Slope
%
Parent
material
Age of
treatment
Geomorphic
positions
Aspect
Natural Forest Typic Calcixerolls 10-25 Loess Native Back slope-
Foot slope
N-NE
Cultivated land Typic Haploxerepts 10-20 Loess 40 years Back slope-
Foot slope
N-NE
Reforested( Olea) Typic Haploxerepts 10-20 Loess 10 years Back slope-
Foot slope
N
Reforested(Cupressus) Typic Haploxerepts 10-25 Loess 30 years Back slope-
Foot slope
N-NE
Analyses of Soil Samples
Physical Properties
The soil samples collected by a cylindrical
metal sampler (core diameter 100 mm), were
oven-dried at 105° C for 24 hours and
weighed to calculate bulk density (Blake and
Hartage, 1986). Particle size distribution was
determined by the Bouyoucos hydrometer
method (Gee and Bauder, 1986). The wet
sieving method of Angers and Mehuys
(1993) was used with a set of sieves of 2.0,
1.0, 0.5, 0.25 and 0.1 mm diameter.
Approximately, 50 g of soil sieved through
4.6 mm was put on the first sieve of the set
and gently moistened to avoid a sudden
rupture of soil aggregates. The set was
sieved in distilled water at 30 oscillations
per minute for 10 minutes and the resistant
aggregate on each sieve were dried at 105°C
for 24 hours, weighted and corrected for
sand fraction to obtain the proportion of the
true aggregates. The mass of < 0.1 mm
fraction was obtained by difference. The
method of van Bevel (1949) as modified by
Kemper and Rosenau (1986) was used to
determine water stable aggregates (WSA)
and MWD.
The WSA % was calculated using
Equation (1) as follows:
100)(
)( )(×
−
−
=+
st
ssa
MM
MMWSA (1)
Where M (a+s) is the mass of resistant
aggregates plus sand (g), Ms is the mass of
the sand fraction alone (g), and Mt is the
total mass of the sieved soil (g). The MWD
was determined as follows:
∑=
=
n
i
iiWXMWD1
(2)
Where MWD is the mean weight diameter
of water stable aggregates, Xi is the mean
diameter of each size fraction (mm), and Wi
is the proportion of the total sample mass in
the corresponding size fraction after
deducing the mass stone as indicated above.
Soil erodibility factor i.e. K factor in the
Universal Soil Loss Equation, was
calculated according to Wischmeier and
Smith (1978). Available water holding
capacity (AWHC) was determined as the
difference between field capacity and
permanent wilting point (Klute and Dirksen,
1986). Water retention at field capacity (-
33kPa) and at permanent wilting point (-
1500 kPa) were determined using high-range
pressure plate extractor (Soil Moisture
Equipment Corp) equipped with a ceramic
plate.
Chemical Properties
Soil pH was measured in saturated soil
using glass electrode (Mclean, 1982) and
electrical conductivity (EC) was measured in
the saturated paste using conductivity meter
(Rhoades, 1982). Calcium carbonate
(CaCO3) was measured by the Bernard’s
calcimetric method (Chaney and Slonim,
1982). Soil organic matter (SOM) was
Assessment of Soil Quality in a Loessial Soil _____________________________________
731
determined using a wet combustion method
(Nelson and Sommers, 1982) and total
nitrogen (TN) was determined by the
Kjeldahl method (Bremner and Mulvaney,
1982).
Biological Properties
Microbial respiration rate (MR) was
measured by the closed bottle method of
Anderson (1982). Soil samples (moistened
to about 30% of filed capacity) were
transferred to a bottle with a glass test tube
containing an alkali solution (1.0N NaOH);
the bottle was closed and maintained at 25ºC
for seven days. The trapped CO2 was
calculated as a function of soil respiration by
titration of the contents of the test tube with
HCl after BaCl2 pretreatment
Statistical Analysis
Descriptive statistics in the form of mean,
standard deviation (SD), minimum,
maximum, median, coefficient of variation
(CV), distribution of normality, range,
skewness and kurtosis were determined
(Wendroth et al., 1997). The CV was used to
describe the amount of variability for each
soil parameter. Pearson linear correlations
among various soil parameters were
calculated using SPSS software (Swan and
Sandilands, 1995) and were used to establish
relationships among the soil variables.
Factor analysis was used to group the 14
soil variables into factors based on the
correlation matrix
of the variables using
FACTOR module and the principal
component
analysis method of factor
extraction in SPSS software (Brejda et al.,
2000). Principal component analysis
was
used as the method of factor extraction
because it required no prior estimates of the
amount of variation of each soil variable that
would be explained by the factors. The
maximum number of factors possible is 14,
which is equal to the number of variables.
Only factors with eigen value >1 were
retained (Brejda et al., 2000). Also, one-way
ANOVA and mean comparison using
Duncan’s test were conducted using the
SPSS software.
RESULTS AND DISCUSSION
Statistical Descriptions
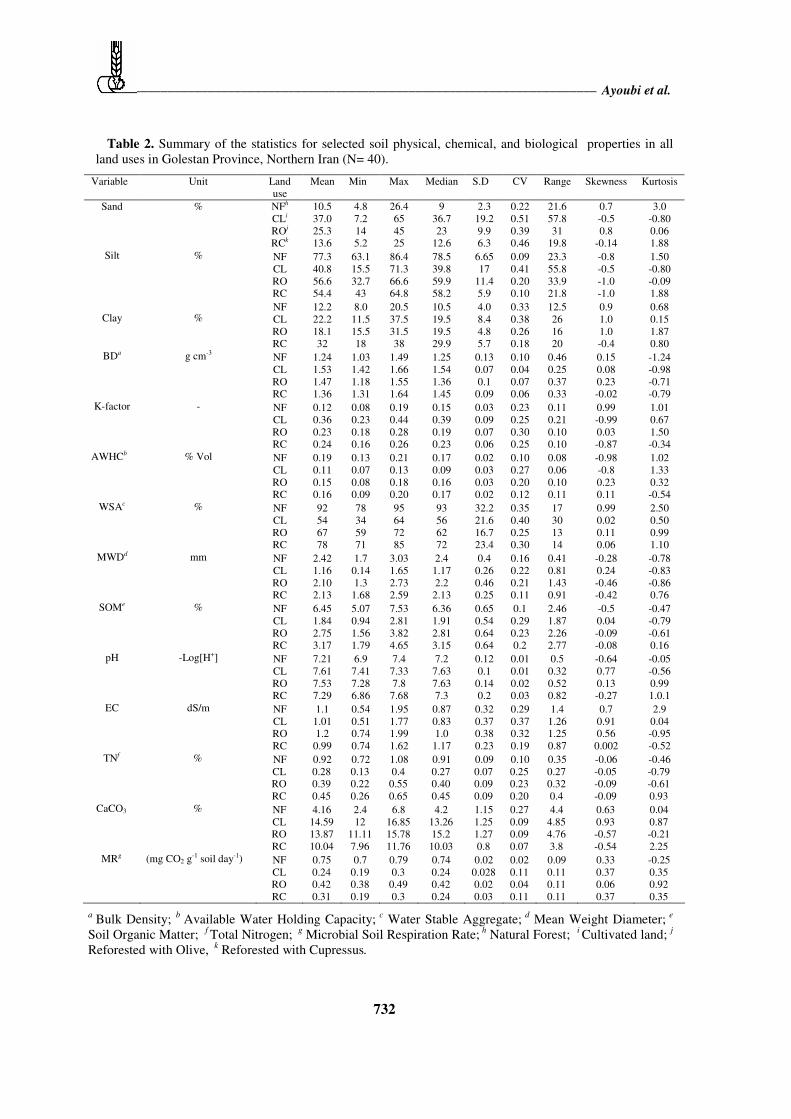
Summary of the measured soil properties
including mean, median, standard deviation,
coefficient of variation, range, skewness and
kurtosis coefficients, are given in Table 2. The
descriptive statistics of soil data suggested that
they were all normally distributed because the
skewness values were within the range of -1 to
+1 (Swan and Sandilands, 1995) (Table 2).
Some researchers, however, have suggested
that, in disturbed ecosystems, some soil
variables show skewed distributions (Nael et
al., 2004; Wang et al., 2003). Skewness values
of soil properties in the cultivated land showed
low deviation from normal distribution.
Coefficient of variation for all of the variables
was low, with the highest and lowest CV’s
related to sand (0.29-0.51) and pH (0.01-0.03),
respectively. In general, the CV values for the
selected soil properties of the cultivated land
were lower than those reported in the
literature, probably due to the homogenizing
effect of the long-term cultivation under
similar soil management practices. This
finding is also in accordance with those
reported by Paz Gonzalez et al. (2000).
Factor Analysis
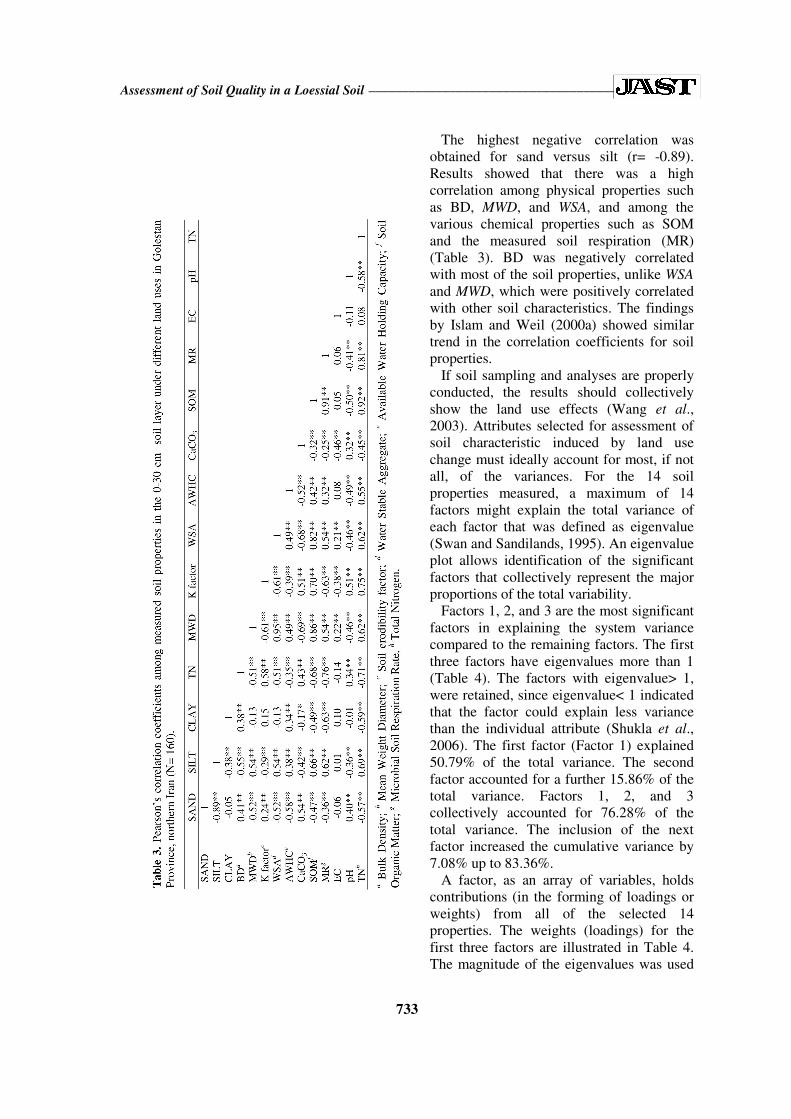
The linear correlation analysis of the 14 soil
attributes, which represent soil physical,
chemical, and biological properties for the
study area, showed a significant correlation
among 77 of the 91 soil attribute pairs (P<
0.01, and P< 0.05) (Table 3). Statistically
significant positive correlations were
obtained for the total nitrogen versus SOM,
and MWD versus WSA (r> 0.90).
_______________________________________________________________________ Ayoubi et al.
732
Table 2. Summary of the statistics for selected soil physical, chemical, and biological properties in all
land uses in Golestan Province, Northern Iran (N= 40).
Variable Unit Land
use
Mean Min Max Median S.D CV Range Skewness Kurtosis
NFh 10.5 4.8 26.4 9 2.3 0.22 21.6 0.7 3.0
CLi 37.0 7.2 65 36.7 19.2 0.51 57.8 -0.5 -0.80
ROj 25.3 14 45 23 9.9 0.39 31 0.8 0.06
Sand
%
RCk 13.6 5.2 25 12.6 6.3 0.46 19.8 -0.14 1.88
NF 77.3 63.1 86.4 78.5 6.65 0.09 23.3 -0.8 1.50
CL 40.8 15.5 71.3 39.8 17 0.41 55.8 -0.5 -0.80
RO 56.6 32.7 66.6 59.9 11.4 0.20 33.9 -1.0 -0.09
Silt
%
RC 54.4 43 64.8 58.2 5.9 0.10 21.8 -1.0 1.88
NF 12.2 8.0 20.5 10.5 4.0 0.33 12.5 0.9 0.68
CL 22.2 11.5 37.5 19.5 8.4 0.38 26 1.0 0.15
RO 18.1 15.5 31.5 19.5 4.8 0.26 16 1.0 1.87
Clay
%
RC 32 18 38 29.9 5.7 0.18 20 -0.4 0.80
NF 1.24 1.03 1.49 1.25 0.13 0.10 0.46 0.15 -1.24
CL 1.53 1.42 1.66 1.54 0.07 0.04 0.25 0.08 -0.98
RO 1.47 1.18 1.55 1.36 0.1 0.07 0.37 0.23 -0.71
BDa
g cm-3
RC 1.36 1.31 1.64 1.45 0.09 0.06 0.33 -0.02 -0.79
NF 0.12 0.08 0.19 0.15 0.03 0.23 0.11 0.99 1.01
CL 0.36 0.23 0.44 0.39 0.09 0.25 0.21 -0.99 0.67
RO 0.23 0.18 0.28 0.19 0.07 0.30 0.10 0.03 1.50
K-factor -
RC 0.24 0.16 0.26 0.23 0.06 0.25 0.10 -0.87 -0.34
NF 0.19 0.13 0.21 0.17 0.02 0.10 0.08 -0.98 1.02
CL 0.11 0.07 0.13 0.09 0.03 0.27 0.06 -0.8 1.33
RO 0.15 0.08 0.18 0.16 0.03 0.20 0.10 0.23 0.32
AWHCb
% Vol
RC 0.16 0.09 0.20 0.17 0.02 0.12 0.11 0.11 -0.54
NF 92 78 95 93 32.2 0.35 17 0.99 2.50
CL 54 34 64 56 21.6 0.40 30 0.02 0.50
RO 67 59 72 62 16.7 0.25 13 0.11 0.99
WSAc
%
RC 78 71 85 72 23.4 0.30 14 0.06 1.10
NF 2.42 1.7 3.03 2.4 0.4 0.16 0.41 -0.28 -0.78
CL 1.16 0.14 1.65 1.17 0.26 0.22 0.81 0.24 -0.83
RO 2.10 1.3 2.73 2.2 0.46 0.21 1.43 -0.46 -0.86
MWDd
mm
RC 2.13 1.68 2.59 2.13 0.25 0.11 0.91 -0.42 0.76
SOMe % NF 6.45 5.07 7.53 6.36 0.65 0.1 2.46 -0.5 -0.47
CL 1.84 0.94 2.81 1.91 0.54 0.29 1.87 0.04 -0.79
RO 2.75 1.56 3.82 2.81 0.64 0.23 2.26 -0.09 -0.61
RC 3.17 1.79 4.65 3.15 0.64 0.2 2.77 -0.08 0.16
pH -Log[H+] NF 7.21 6.9 7.4 7.2 0.12 0.01 0.5 -0.64 -0.05
CL 7.61 7.41 7.33 7.63 0.1 0.01 0.32 0.77 -0.56
RO 7.53 7.28 7.8 7.63 0.14 0.02 0.52 0.13 0.99
RC 7.29 6.86 7.68 7.3 0.2 0.03 0.82 -0.27 1.0.1
EC dS/m NF 1.1 0.54 1.95 0.87 0.32 0.29 1.4 0.7 2.9
CL 1.01 0.51 1.77 0.83 0.37 0.37 1.26 0.91 0.04
RO 1.2 0.74 1.99 1.0 0.38 0.32 1.25 0.56 -0.95
RC 0.99 0.74 1.62 1.17 0.23 0.19 0.87 0.002 -0.52
TNf % NF 0.92 0.72 1.08 0.91 0.09 0.10 0.35 -0.06 -0.46
CL 0.28 0.13 0.4 0.27 0.07 0.25 0.27 -0.05 -0.79
RO 0.39 0.22 0.55 0.40 0.09 0.23 0.32 -0.09 -0.61
RC 0.45 0.26 0.65 0.45 0.09 0.20 0.4 -0.09 0.93
CaCO3 % NF 4.16 2.4 6.8 4.2 1.15 0.27 4.4 0.63 0.04
CL 14.59 12 16.85 13.26 1.25 0.09 4.85 0.93 0.87
RO 13.87 11.11 15.78 15.2 1.27 0.09 4.76 -0.57 -0.21
RC 10.04 7.96 11.76 10.03 0.8 0.07 3.8 -0.54 2.25
MRg (mg CO2 g-1 soil day-1) NF 0.75 0.7 0.79 0.74 0.02 0.02 0.09 0.33 -0.25
CL 0.24 0.19 0.3 0.24 0.028 0.11 0.11 0.37 0.35
RO 0.42 0.38 0.49 0.42 0.02 0.04 0.11 0.06 0.92
RC 0.31 0.19 0.3 0.24 0.03 0.11 0.11 0.37 0.35
a Bulk Density;
b Available Water Holding Capacity;
c Water Stable Aggregate;
d Mean Weight Diameter;
e
Soil Organic Matter; f Total Nitrogen;
g Microbial Soil Respiration Rate;
h Natural Forest;
i Cultivated land;
j
Reforested with Olive, k Reforested with Cupressus.
Assessment of Soil Quality in a Loessial Soil _____________________________________
733
The highest negative correlation was
obtained for sand versus silt (r= -0.89).
Results showed that there was a high
correlation among physical properties such
as BD, MWD, and WSA, and among the
various chemical properties such as SOM
and the measured soil respiration (MR)
(Table 3). BD was negatively correlated
with most of the soil properties, unlike WSA
and MWD, which were positively correlated
with other soil characteristics. The findings
by Islam and Weil (2000a) showed similar
trend in the correlation coefficients for soil
properties.
If soil sampling and analyses are properly
conducted, the results should collectively
show the land use effects (Wang et al.,
2003). Attributes selected for assessment of
soil characteristic induced by land use
change must ideally account for most, if not
all, of the variances. For the 14 soil
properties measured, a maximum of 14
factors might explain the total variance of
each factor that was defined as eigenvalue
(Swan and Sandilands, 1995). An eigenvalue
plot allows identification of the significant
factors that collectively represent the major
proportions of the total variability.
Factors 1, 2, and 3 are the most significant
factors in explaining the system variance
compared to the remaining factors. The first
three factors have eigenvalues more than 1
(Table 4). The factors with eigenvalue> 1,
were retained, since eigenvalue< 1 indicated
that the factor could explain less variance
than the individual attribute (Shukla et al.,
2006). The first factor (Factor 1) explained
50.79% of the total variance. The second
factor accounted for a further 15.86% of the
total variance. Factors 1, 2, and 3
collectively accounted for 76.28% of the
total variance. The inclusion of the next
factor increased the cumulative variance by
7.08% up to 83.36%.
A factor, as an array of variables, holds
contributions (in the forming of loadings or
weights) from all of the selected 14
properties. The weights (loadings) for the
first three factors are illustrated in Table 4.
The magnitude of the eigenvalues was used
_______________________________________________________________________ Ayoubi et al.
734
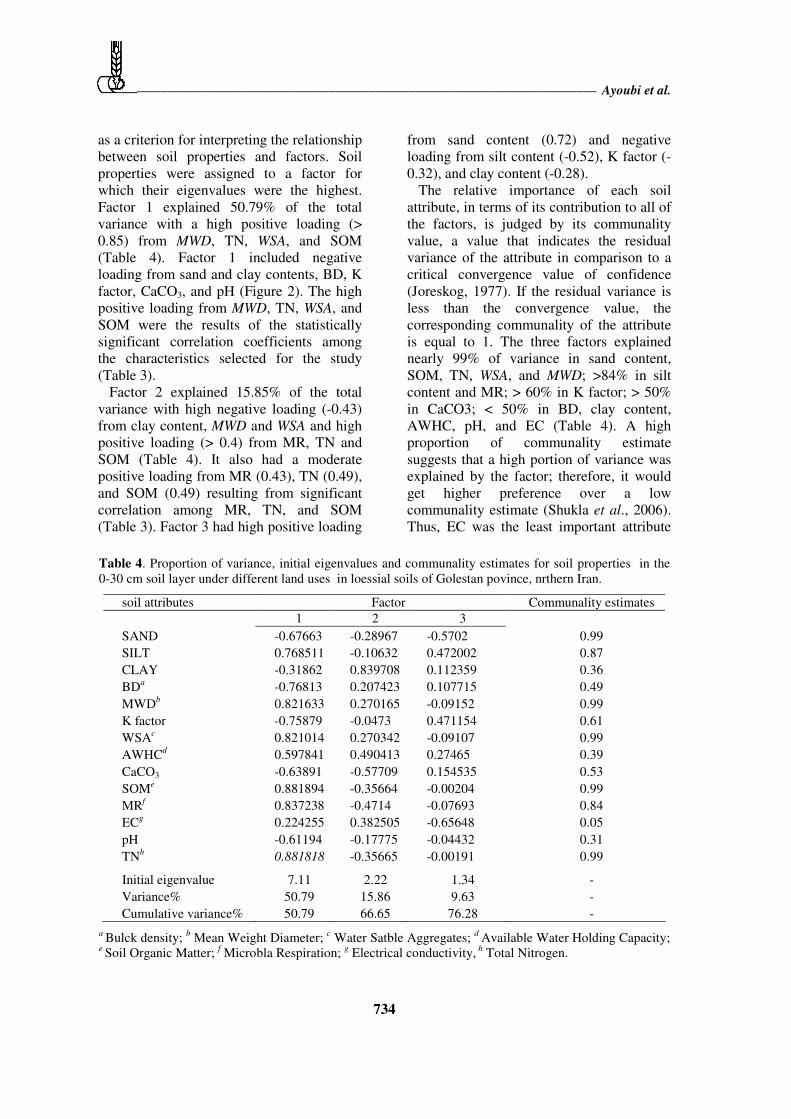
Table 4. Proportion of variance, initial eigenvalues and communality estimates for soil properties in the
0-30 cm soil layer under different land uses in loessial soils of Golestan povince, nrthern Iran.
soil attributes Factor Communality estimates
1 2 3
SAND -0.67663 -0.28967 -0.5702 0.99
SILT 0.768511 -0.10632 0.472002 0.87
CLAY -0.31862 0.839708 0.112359 0.36
BDa -0.76813 0.207423 0.107715 0.49
MWDb 0.821633 0.270165 -0.09152 0.99
K factor -0.75879 -0.0473 0.471154 0.61
WSAc 0.821014 0.270342 -0.09107 0.99
AWHCd 0.597841 0.490413 0.27465 0.39
CaCO3 -0.63891 -0.57709 0.154535 0.53
SOMe 0.881894 -0.35664 -0.00204 0.99
MRf 0.837238 -0.4714 -0.07693 0.84
ECg 0.224255 0.382505 -0.65648 0.05
pH -0.61194 -0.17775 -0.04432 0.31
TNh 0.881818 -0.35665 -0.00191 0.99
Initial eigenvalue 7.11 2.22 1.34 -
Variance% 50.79 15.86 9.63 -
Cumulative variance% 50.79 66.65 76.28 -
a Bulck density;
b Mean Weight Diameter;
c Water Satble Aggregates;
d Available Water Holding Capacity;
e Soil Organic Matter;
f Microbla Respiration;
g Electrical conductivity,
h Total Nitrogen.
as a criterion for interpreting the relationship
between soil properties and factors. Soil
properties were assigned to a factor for
which their eigenvalues were the highest.
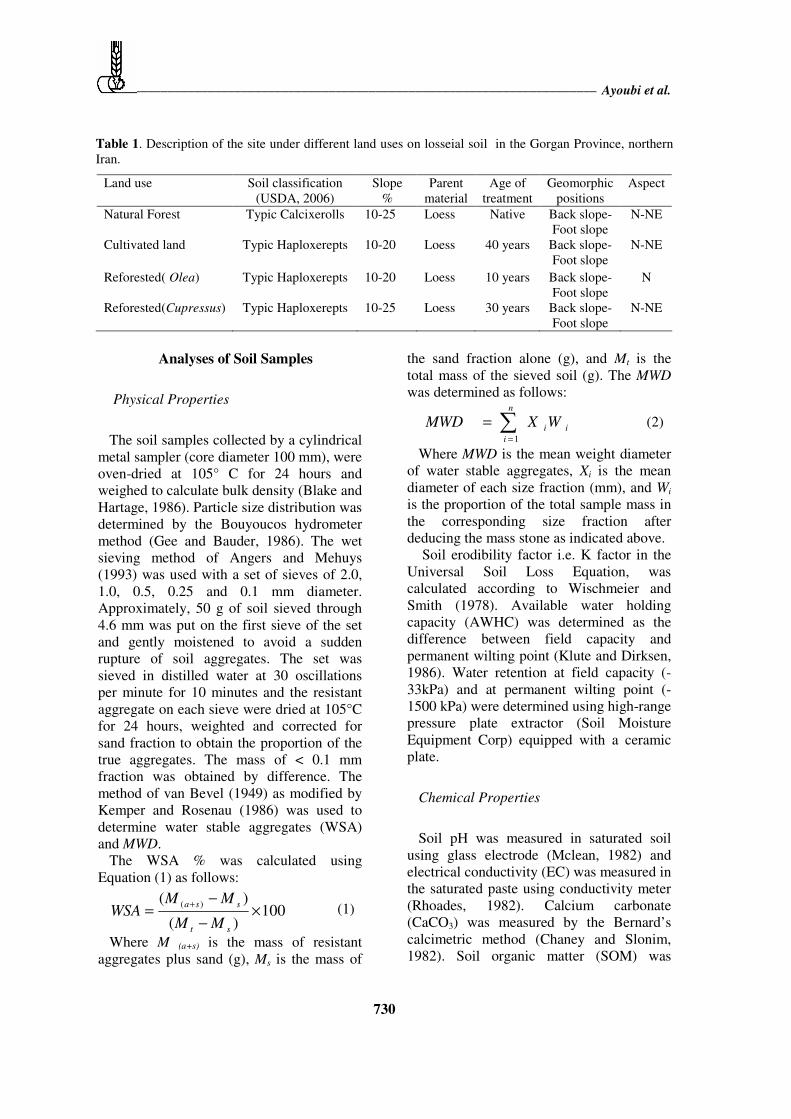
Factor 1 explained 50.79% of the total
variance with a high positive loading (>
0.85) from MWD, TN, WSA, and SOM
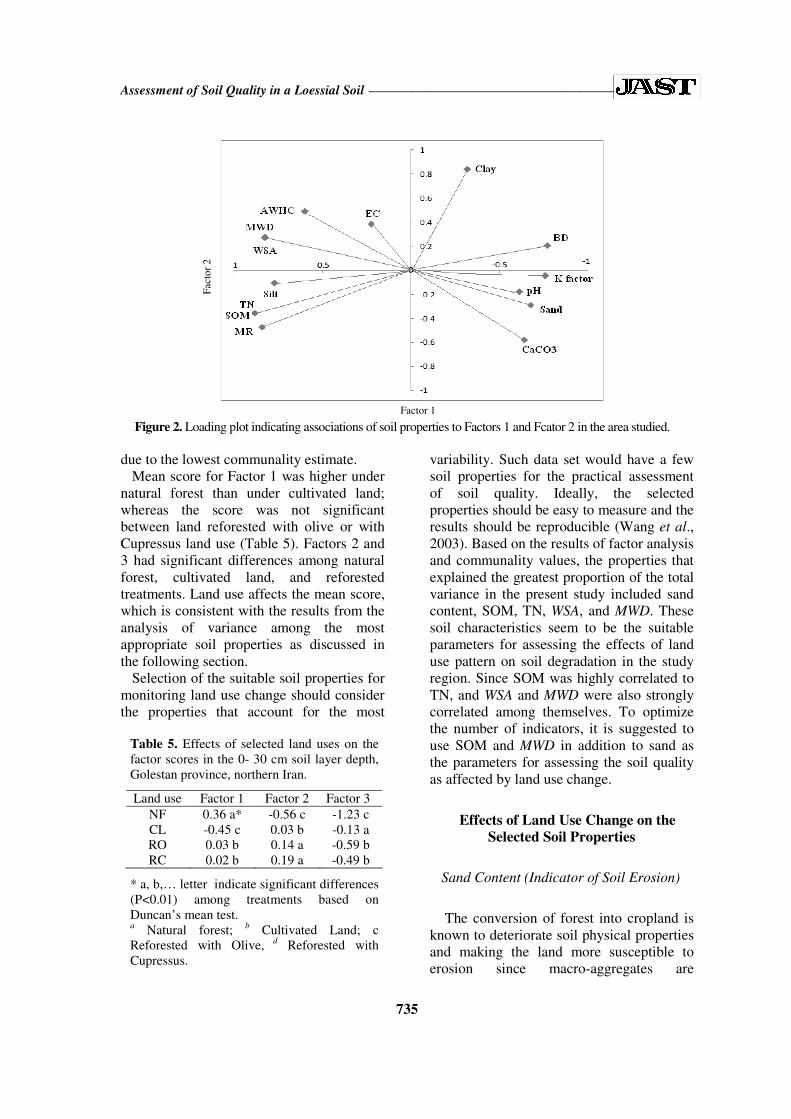
(Table 4). Factor 1 included negative
loading from sand and clay contents, BD, K
factor, CaCO3, and pH (Figure 2). The high
positive loading from MWD, TN, WSA, and
SOM were the results of the statistically
significant correlation coefficients among
the characteristics selected for the study
(Table 3).
Factor 2 explained 15.85% of the total
variance with high negative loading (-0.43)
from clay content, MWD and WSA and high
positive loading (> 0.4) from MR, TN and
SOM (Table 4). It also had a moderate
positive loading from MR (0.43), TN (0.49),
and SOM (0.49) resulting from significant
correlation among MR, TN, and SOM
(Table 3). Factor 3 had high positive loading
from sand content (0.72) and negative
loading from silt content (-0.52), K factor (-
0.32), and clay content (-0.28).
The relative importance of each soil
attribute, in terms of its contribution to all of
the factors, is judged by its communality
value, a value that indicates the residual
variance of the attribute in comparison to a
critical convergence value of confidence
(Joreskog, 1977). If the residual variance is
less than the convergence value, the
corresponding communality of the attribute
is equal to 1. The three factors explained
nearly 99% of variance in sand content,
SOM, TN, WSA, and MWD; >84% in silt
content and MR; > 60% in K factor; > 50%
in CaCO3; < 50% in BD, clay content,
AWHC, pH, and EC (Table 4). A high
proportion of communality estimate
suggests that a high portion of variance was
explained by the factor; therefore, it would
get higher preference over a low
communality estimate (Shukla et al., 2006).
Thus, EC was the least important attribute
Assessment of Soil Quality in a Loessial Soil _____________________________________
735
Figure 2. Loading plot indicating associations of soil properties to Factors 1 and Fcator 2 in the area studied.
Table 5. Effects of selected land uses on the
factor scores in the 0- 30 cm soil layer depth,
Golestan province, northern Iran.
Land use Factor 1 Factor 2 Factor 3
NF 0.36 a* -0.56 c -1.23 c
CL -0.45 c 0.03 b -0.13 a
RO 0.03 b 0.14 a -0.59 b
RC 0.02 b 0.19 a -0.49 b
* a, b,… letter indicate significant differences
(P<0.01) among treatments based on
Duncan’s mean test. a Natural forest;
b Cultivated Land; c
Reforested with Olive, d
Reforested with
Cupressus.
due to the lowest communality estimate.
Mean score for Factor 1 was higher under
natural forest than under cultivated land;
whereas the score was not significant
between land reforested with olive or with
Cupressus land use (Table 5). Factors 2 and
3 had significant differences among natural
forest, cultivated land, and reforested
treatments. Land use affects the mean score,
which is consistent with the results from the
analysis of variance among the most
appropriate soil properties as discussed in
the following section.
Selection of the suitable soil properties for
monitoring land use change should consider
the properties that account for the most
variability. Such data set would have a few
soil properties for the practical assessment
of soil quality. Ideally, the selected
properties should be easy to measure and the
results should be reproducible (Wang et al.,
2003). Based on the results of factor analysis
and communality values, the properties that
explained the greatest proportion of the total
variance in the present study included sand
content, SOM, TN, WSA, and MWD. These
soil characteristics seem to be the suitable
parameters for assessing the effects of land
use pattern on soil degradation in the study
region. Since SOM was highly correlated to
TN, and WSA and MWD were also strongly
correlated among themselves. To optimize
the number of indicators, it is suggested to
use SOM and MWD in addition to sand as
the parameters for assessing the soil quality
as affected by land use change.
Effects of Land Use Change on the
Selected Soil Properties
Sand Content (Indicator of Soil Erosion)
The conversion of forest into cropland is
known to deteriorate soil physical properties
and making the land more susceptible to
erosion since macro-aggregates are
Factor 1
Fac
tor
2
_______________________________________________________________________ Ayoubi et al.
736
disturbed (Çelik, 2005). Soil erosion can
modify soil properties by reducing soil
depth, changing soil texture, and by loss of
nutrients and organic matter (Foster, 2001).
Loss of organic matter is expected to
destabilize soil aggregates and,
consequently, the finer particles are
transported by erosion. Sand content is a
physical parameter affected by soil erosion
and, hence, can be measured and used as an
indicator for evaluating soil degradation
under different land use systems.
The results of ANOVA indicated that
there were significant (P< 0.001) differences
among the four land parcels studied (Table
6). The highest and the lowest sand contents
were found in the cultivated land and natural
forest, respectively. The results of the
multiple comparison test (Duncan’s method)
confirmed that there were significant
differences (P< 0.01) between mean values
of sand content in the natural forest,
cultivated land and land reforested with
Olea europea. There was no significant
difference in sand content between the plot
of natural forest and that reforested with
Cupressus arizonica.
The parent material of the selected site
under different land uses is loess deposit
containing mainly silt size particles, almost
completely homogenous within the depth of
the profile. Therefore, considering the short
distances between the studied land
parcels(shorter than 100 m), it is suggested
that the variability in the particle size
distribution is mainly due to the effects of
the different land uses and not different
parent materials.
The sites are located on steep slopes and
cultivation is mainly done along the slope
without implementing conservation
practices. Therefore, over the last 40 years,
the finer soil particles have been selectively
removed by erosion, thereby increasing the
proportion of the coarser particles in the soil,
as also suggested by Wang et al. (2006).
These processes have led to significant
increase in the percentage of sand content
(+252%) compared to the plot under natural
forest on the same slopes. But, the
reforestation of steep slopes during the last
30 years has reduced the loss of fine
particles; consequently, the percentage
increase in the sand contents were 141% and
29.5% in the land reforested by Cupressus
and olive, respectively, as compared to the
natural forest.
According to Ajami et al. (2006), clay
content decreased from 38.8% to 20% in the
surface horizons after deforestation and
cultivation of loessial soils of the Golestan
Province, northern Iran. In contrast, the
percentage of sand content increased 1.5 to 2
times following deforestation and silt
content also increased from 55% to 70% in
the parcel under cultivation. Islam and Weil
(2000a) indicated that the cultivated soils in
Bangladesh were considerably lower in silt
and lower in clay compared to the adjacent
soils under natural forest, most likely as a
result of preferential removal of silt by
accelerated water erosion in the monsoon
seasons.
Soil organic matter (SOM) has been
reported as the most powerful indicator for
assessing soil potential productivity in
different regions of the world under varied
land uses and managements (Shukla et al.,
2006; Ajami et al., 2006; Kiani et al., 2003).
The results of ANOVA showed that there
were significant differences among the
studied land parcels (Table 6). The mean
comparisons using Duncan’s test indicated
that there was significant (P< 0.01)
difference in SOM among the four land uses
studied, especially between the natural forest
(6.45%) and the cultivated land (1.84%)
(Table 7). Evrendilek et al. (2004) showed
that deforestation and subsequent cultivation
decreased organic matter by 48.8%. Also,
other studies have shown that there were
significant differences in SOM content of
the soils under cultivation and mature
woodland (Chidumayo and Kwibisa, 2003;
Kiani et al., 2003; Ajami et al., 2006;
Khormali et al., 2006).

Assessment of Soil Quality in a Loessial Soil _____________________________________
737
Table 6. The result of analysis of variance (ANOVA) for selected soil properties under different land
uses all treatments, Golestan province, northern Iran.
Sum of squares df Mean square F P-value
SAND Between groups 21876.01 3 7292 58.86 0.001
within groups 19448.57 157 123.87
total 41324.58 160
SOMa Between groups 402.31 3 134.1 355.16 0.001
within groups 59.28 157 0.37
total 461.6 160
MWDb Between groups 26.66 3 8.88 86.01 0.001
within groups 16.22 157 0.1
total 42.89 160
a Soil Organic Matter,
b Mean Weghit Diameter.
Table 7. Comparison of mean values of selected soil parameters under different land uses using
Duncan’s test, Goletan province, northern Iran (Duncan’s method).
Land use
Soil property Unit NFa CL
b RO
c RC
d
Sand % 10.5c* 37.0a 25.3b 13.6c
SOMe % 6.45a 1.84c 2.75b 3.17b
MWDf Mm 2.42a 1.16b 2.10a 2.13a
*a, b, c, … indicate significant differences (P< 0.01) among treatments based on Duncan’s
mean test. a Natural forest;
b Cultivated Land;
c Reforested with Olive;
d Reforested with Cupressus;
e Soil
Organic Matter, f Mean Weghit Diameter.
In this study, deforestation and cultivation of
land decreased SOM by 71.5% (Table 7).
Disturbance can alter soil temperature,
moisture, and aeration, and, thus, increase the
decomposition rate of SOM. SOM in the
forested land was higher than in the cultivated
parcel, since the soil in the first case was not
tilled or exposed to erosion. Probably, the loss
of SOM combined with greater sand content
and poorer aggregation resulted in higher bulk
density (23.4% increase) under cultivation
compared to the natural forest.
The continuous use of heavy farm
machineries can further aggravate the loss of
SOM through erosion. Similar results were
reported by Hajabbasi et al. (1997) and Çelik
(2005) who showed that deforestation and
subsequent tillage practices resulted in 20.0%
and 7.9% increase in bulk density of the
surface soil in the central Zagros Mountain
Range in Iran and southern highlands of
Turkey, respectively. This is also consistent
with the findings of other researchers (Vagen
et al., 2006; Rasiah et al., 2004; Kiani et al.,
2003). Organic matter is greatly influenced by
the land use change on the hillslope soils with
loess parent material.
In the studies by Kiani et al. (2003) and
Ajami et al. (2006), it was shown that, by the
conversion of land use from forest to
cultivation on the loess hill-slope soils of
Golestan Province, the soil organic carbon
decreased, respectively, from 4% to 1.3% and
from 7.2% to 1.2%, ,.Consequently, due to the
significant role of SOM in soil erodibility, the
K factor of the cultivated land increased by
66.7% compared to the value found for the
natural forest. Çelik (2005) reported that soil
erodibility factor of the cultivated soil was 2.4
times higher than that of the forest soil.
Reforestation of degraded land with Olea
europea and Cupressus arizonica increased
the SOM by 49.5% and 72.3%, respectively,
compared to the cultivated land; and there

_______________________________________________________________________ Ayoubi et al.
738
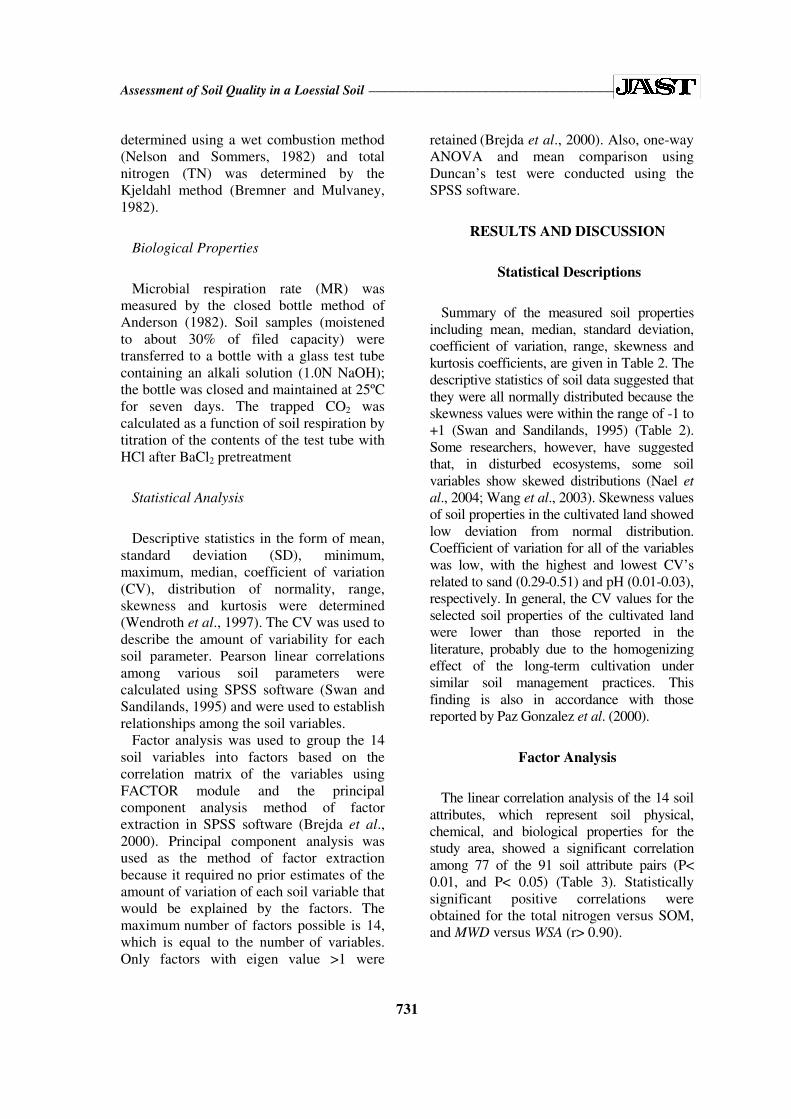
Figure 3. Mean comparisons of different
classes of aggregates in four land uses (NF:
Natural forest, RC: Reforested with Cupressus;
RO: Reforested with Olive, CL: Cultivated
land) (a, b, c, …letters indicate significant
differences among treatments based on
Duncan’s mean test, the treatments with the
same letter are not significantly different at P<
0.05)
were significant differences between the
reforested and the cultivated soils (Table 7).
These results are consistent with those
observed for the surface soils following
afforestation (Ritcher et al., 1999; Paul et al.,
2002). Moreover, following an increase in the
SOM in the land reforested by olive and
Cupressus, BD decreased to 1.47 and 1.36 g
cm-3, respectively, (Table 2) while the soil
erodibility factor (K factor) decreased by
36.1% and 33.3% compared to the cultivated
fields.
Because of the abovementioned effects of
SOM, natural forest soils had more TN,
AWHC, and MR as compared to the cultivated
soils (Table 2). Evrendilek et al. (2004) also
suggested that cultivation decreased the total
soil porosity, soil respiration rate, and nutrient-
retention capacity.
The mean weight diameter (MWD) of soil
aggregates was significantly (P< 0.001)
different among the four land uses (Table 6).
Duncan’s test showed that there were
significant differences (P< 0.01) between soils
under natural forest (2.42 mm) and under
cultivation (1.16 mm) (Table 7).
Aggregate stability depends on the
interaction between primary particles and
organic constituents to form stable aggregates,
which are influenced by various factors related
to soil environmental conditions and
management practices (Elustondo et al.,
1990). SOM plays a key role in the formation
and stabilization of soil aggregates (Lu et al.,
1998). Loss of soil organic carbon with
cultivation is related to the destruction of
macro-aggregates. There was a highly
significant correlation (0.86) between SOM
and MWD (Table 3).
The differences observed in the percentages
of the stable aggregates under various land
uses likely resulted from the differences in the
quality and quantity of SOM. Caravaca et al.
(2004) indicated that aggregate stability of
cultivated soils was significantly lower (mean
40%) than that of forested soils (mean 82%).
Findings of Çelik (2005) also indicated that
cultivation caused 61 and 52% decrease in the
MWD in the 0-10 cm and 10-20 cm soil layers,
respectively. The higher aggregation in the
forested soils might have protected SOM from
decomposition by microbial activity (Çelik,
2005; Evrendilek et al., 2004).
Figure 3 shows the distribution of the
aggregate size classes. Distribution of soil
aggregates differed significantly among
different land uses. The cultivated soils had
significantly (P< 0.01) higher mass of
aggregates in the smaller diameter classes (0.1-
0.25 mm) than the other land uses. In the 2-4.6
mm class, however, the forest soils showed
greater mass of aggregates than the cultivated
soils. The small aggregate size was found to be
a useful indicator of soil degradation.
Reforestation with olive and Cupressus in the
study area increased the proportion of larger
aggregates and reduced those of smaller ones
significantly.
CONCLUSIONS
The physical, chemical, and biological
characteristics of soils under four land uses
were measured and suitable soil quality
indicators were selected using factor analysis.
The first three factors explained about 76% of
the total variance. Communality estimates for
these three factors and correlation studies
Land use
Per
cen
tage
Assessment of Soil Quality in a Loessial Soil _____________________________________
739
showed that the most suitable indicators were
MWD, SOM, and sand content to evaluate soil
quality following land use change. The
clearing and cultivation of forest lands resulted
in the degradation of soil properties compared
to the soils under well-stocked natural forest,
Olea europea and Cupressus arizonica
reforestation. SOM and MWD size were
reduced and sand content (as indicator of soil
erosion) was increased. Reforestation with
Olea europea and Cupressus arizonica
indicated that planting of well-adapted and
fast-growing trees can gradually improve the
soil quality and rehabilitate the degraded lands.
Therefore, greater attention is needed to
conserve the soils on the hilly slopes by
preventing deforestation and through
reclamation of degraded land by establishing
appropriate forest and orchard plantations.
REFERENCES
1. Abdi, H. 2003. Factor Rotations in Factor
Analyses. In: "Encyclopedia for Research
Methods for the Social Sciences", (Eds.):
Lewis-Beck, M., Bryman, A. and Futing, T..
Sage, Thousand Oaks (CA), PP. 792-795.
2. Ajami, M., Khormali, F., Ayoubi, S. and
Omrani, R. A. 2006. Changes in Soil Quality
Attributes by Conversion of Land Use on a
Loess Hillslope in Golestan Province, Iran. 18th
International Soil Meeting (ISM) on Soil
Sustaining Life on Earth, Maintaining Soil and
Technology Proceedings, Soil Science Society
of Turkey, PP. 501-504.
3. Anderson, J. P. E. 1982. Soil Respiration. Part
2. In: "Method of Soil Analysis: Chemical
Analysis", (Eds.): Miller, R. H. and Keeney, D.
R.. Soil Science Society of America, Madison,
WI, PP. 831-872.
4. Andews, S. S., Karlen, D. L. and Mitchel J. P.
2002. A Comparison of Soil Quality Indexing
Methods for Vegetable Production Systems in
the Northern California. Agric. Eco. Syst.
Environ., 90: 24-45.
5. Angers, D. A. and Mehuys, G. R. 1993.
Aggregate Stability to Water. In: "Soil
Sampling and Methods of Analysis", (Ed.):
Carter, M. R.. Lewis Publication, Boca Raton,
PP. 651-657.
6. Ayoubi, S. 2005. Soil Attributes Prediction
Using Soil-landscape Model in Hilly Region of
Azadshahr District, Golestan Province,
Northern Iran. Gorgan University of
Agricultural Sciences and Natural Resources
Publication, GUASNR Press, P. 54.
7. Bachmann, G. and Kinzel, H. 1992.
Physiological and Ecological Aspects of the
Interactions between Plant Roots and
Rhizosphere Soil. Soil Biol. Biochem., 24:
543–552.
8. Blake, G. R. and Hartge, K. H. 1986. Bulk
Density. Part I. In: "Methods of Soil Analysis",
(Ed.): Klute, A.. ASA, Monograph, No. 9,
Madison, WI. PP. 363-376.
9. Brejda, J. I., Moorman, T. B., Karlen, D. L.
and Dao, T. H. 2000. Identification of
Regional Soil Quality Factors and Indicators. I.
Central and Southern High Plains. Soil Sci.
Soc. Am. J., 64: 2115-2124.
10. Bremner, J. M. and Mulvaney, C. S. 1982.
Nitrogen Total. Part II. In: "Methods of Soil
Analysis", (Ed.): Bu Buxton, D. R.. ASA,
Monograph, No.9, 2nd
Edition, Madison, WI,
PP. 595- 624.
11. Caravaca, F., Lax, A. and Albaladjeo, J. 2004.
Aggregate Stability and Characteristics of
Particle Size Fractions in Cultivated and Forest
Soils of Semiarid Spain. Soil Till. Res., 78: 83-
90.
12. Carter, M. R., Gregorich, E. G., Angers, D.
A., Donald, R. G., Bolinder, M. A., 1998.
Organic C and N Storage and Organic C
Fractions in Adjacent Cultivated and
Forested Soils of Eastern Canada. Soil Till.
Res. 47:253-261.
13. Çelik, I. 2005. Land Use Effects on Organic
Matter and Physical Properties of Soil in a
Southern Mediterranean Highland of Turkey.
Soil Till. Res., 83: 270- 277.
14. Chaney, R. and Slonim, S. 1982.
Determination of Calcium Carbonate Content
in Soils: Geotechnical Properties Behavior and
Performance of Calcareous Soils. In: "ASTM
STP, Vol: 777. American Society for Testing
and Materials" Demars, K. R., Chaney,
R.(Eds.), , Philadelphia, PP. 3-15.
15. Chidumayo, E. N. and Kwibisa, L. 2003.
Effect of Deforestation on Grass Biomass and
Soil Nutrient Status in Miombo Woodland,
Zambia. Agri. Ecosys. Environ., 96: 97-105.
16. Doran, J. W., Parkin, T. B., 1994. Defining
Soil Quality for a Sustainable Environment
In: “Defining and Assessing Soil Quality”
(Eds.): Doran, J. W., Coleman, D. C.,
Bezdicek, D. F., Stewart, B. A., SSSA.
Special Publication, no. 35.

_______________________________________________________________________ Ayoubi et al.
740
17. Ellingson, L., Kauffman, J. B., Cummings, D.
L., Sanford Jr, R. L. and Jaramillo, V. J. 2000.
Soil N Dynamics Associated with
Deforestation, Biomass Burning, and Pasture
Conversion in a Mexican Tropical Dry Forest.
Forest Ecol. Manag., 137: 41-51.
18. Elustondo, J., Angers, D. A., Laverdiere, M. R.
and N’dayegamiye, A. 1990. Influence de la
Culture de Mais et de la Prairie sur l’Aregation
et la Matiere Organique de Sept Soils de
Quebec. Can. J. Soil Sci., 70: 395-403.
19. Evrendilek, F., Çelik, I. and Kilic, S. 2004.
Changes in Soil Organic Carbon and other
Physical Soil Properties along Adjacent
Mediterranean Forest, Grassland, and
Cropland Ecosystems in Turkey. J. Arid
Environ., 59: 743-752.
20. Foster, G. R. 2001. Keynote: Soil Erosion
Prediction Technology for Conservation
Planning. In: "Sustaining Global Farm",
(Eds.): Stott, D. E., Mohtar R. H. and
Steinhardt, G. C., PP. 847-851.
21. Gee, G. W. and Bouder, J. W. 1986. Particle
Size Analysis. In: "Methods of Soil Analysis",
(Ed.): Klute, A., Part I. ASA, Monograph, No.
9. 2nd
Edition, Madison, WI. PP. 337-382.
22. Hajabbasi, M. A., Jalalain, A. and
Karimzadeh, H. 1997. Deforestation Effects on
Soil Physical and Chemical Properties.
Lordegan, Iran, Plant Soil, 190: 301-308.
23. Hebel, A. 1998. Soil Degradation-diagnosis,
Appraisal and Reversing Measure.
Introduction. P. 1-2. In:"Toward Sustainable
Land Use", (Ed.): Blume, H. P. et al., Vol. I,
Adv. Geo. Ecol. 31. Catena Verlag,
Reiskirchen, Germany. PP?
24. Heil, D. and Sposito, G. 1997. Chemical
Attributes and Processes Affecting Soil
Quality. In: "Soil Quality for Crop Production
and Ecosystem Health", (Eds.): Gregorich, E.
G. and Carter, M. R.. Elsevier, Amsterdam,
PP. 59-79.
25. Hurni, H. 1997. Concepts of Sustainable Land
Management. ITC. J., 3(4): 210-215.
26. Islam, K. R. and Weil, R. R. 2000a. Land Use
Effects on Soil Quality in a Tropical Forest
Ecosystem of Bangladesh. Agriculture Ecosys.
Environ., 79: 9-16.
27. Islam, K. R. and. Weil, R. R. 2000b. Soil
Quality Indicator Properties in Mid-Atlantic
Soils as Influenced by Conservation
Management. J. Soil Water Conser., 55: 2269-
2284.
28. Islam, K. R., Kamaluddin, M., Bhuiyan, M. K.
and Badruddin, A. 1999. Comparative
Performance of Exotic and Indigenous Forest
Species for Tropical Semi-Evergreen
Degraded Forest Land Reforestation in
Bangladesh. Land Dedrag. Dev., 10: 241-249.
29. Joreskog, K. 1977. Factor Analysis by Least
Squares and Maximum Likelihood Method,
volume III, In:" Statistical Methods for Digital
Computers", (Eds.): Enslein, K., Rolston, D. E.
and Wilf, H.. Wiley, New York, NY.
30. Kang, B. T. and Juo, A. S. R. 1986. Effect of
Forest Clearing on Soil Chemical Properties
and Crop Performance. In: "Land Clearing
and Development in the Tropics", (EdS.): Lal,
R., Sanchez, P. A. and Cummings, Jr., R. W..
Belkema, Rotterdam, PP. 383-394.
31. Karlen, D. L., Mausbach, M. J., Doran, J.
W., Cline, R. T., Harris, R. F., Schuman, G.
E., 1997. Soil Quality: A Concept Definition
and Framework for Evaluation. Soil Sci. Soc.
Am. J. 90:644–650.
32. Kemper, W. D. and Rosenau, R. C. 1986.
Aggregate Stability and Size Distribution. Part
I. In: "Methods of Soil Analysis", (Ed.): Klute,
A. ASA, 2nd
Edition, Monograph, No. 9.,
Madison, WI. PP. 687-734.
33. Khormali, F., Ajami, M. and Ayoubi, S. 2006.
Genesis and Micromorphology of Soils with
Loess Parent Material as Affected by
Deforestation in a Hillslope of Golestan
Province, Iran. International Soil Meeting on
Soils Sustaining Life on Earth, May 22-26,
Şanliurfa-Turkey. PP. 149-151.
34. Khormali, F. and Nabiollahi, K. 2009.
Degradation of Mollisols in Western Iran as
Affected by Land Use Change. J Agri. Sci.
Tech., 11: 363-374.
35. Kiani, F., Jalalian, A., Pashae, A. and
Khademi, H. 2003. Effects of Deforestation on
Selected Soil Quality attributes in Loess-
derived Land Forms of Golestan Province,
Northern Iran. Proceeding of the 4th
International Iran and Russian Conference,
Shahrekord, PP. 546-550.
36. Klute, A. and Dirksen, C. 1986. Hydraulic
Conductivity and Diffusivity. Part 1. In:
"Methods of Soil Analysis", (Ed.): Klute, A..
2nd
Edition, Agronomy Monograph, Vol. 9.,
American Society of Agronomy, Madison, WI,
PP. 687-734.
37. Larson, W. E. and Pierce, F. G. 1991.
Conservation and Enhancement of Soil Quality
in Evaluation for Sustainable Land
Management in the Developing World.
International Borad for Soil Research and
Assessment of Soil Quality in a Loessial Soil _____________________________________
741
Managemen,t IBSRAM Proceeding 12(2), Vol.
2, Bangkok, Thailand.
38. Larson, W. E. and Pierce, F. G. 1994. The
Dynamic of Soil Quality as a Measure of
Sustainable Management. In: "Defining Soil
Quality for a Sustainable Environment",
(Eds.): Doran, J. W. et al. Soil Sci. Soc. Am.,
Spec. Publ., No. 35., ASA, Madison, WI, PP.
37-51.
39. Likens, G. B. Bormann, F. H., Johnson, N. M.
and Fisher, D. W. 1970. Effects of Forest
Cutting and Herbicide Treatment on Nutrient
Budgets in the H Brook Watershed-ecosys.
Ecol. Monogr., 40: 23-41.
40. Lima, A. C. R., Hoogmoed, W. and Brussaard,
L. 2008. Soil Quality Assessment in Rice
Production Systems: Establishing a Minimum
Data Set. J. Environ. Qual., 37: 623-630.
41. Lu, G., Sakagami, K., Tanaka, H. and
Hamada, R. 1998. Role of Soil Organic Matter
in Stabilization of Water Aggregates in Soils
under Different Types of Land Use. Soil Sci.
Plant. Nutr., 44: 147-155.
42. Mclean, E. O. 1982. Soil pH and Lime
Requirement. Part II. In: "Methods of Soil
Analysis ", (Ed.): Page, A. L. 2nd
Edition, ASA,
Monograph, No. 9, Madison, WI, PP. 199-223.
43. Mosaedi, A. 2003. Study of Factors Increasing
Flood Damages in the North of Iran on August
2001 and 2002. European Geophysical
Society. Geophys. Res. Abst. Vol. 5, 03945.
44. Nadri, S., Cocheri, G. and Dell' Agnola, G.
1996. Biological Activity of Humus. In:
"Humic Substances in Terrestrial Ecosystems",
(Ed.): Piccolo, A.. Elsevier, Amsterdam, PP.
361-406.
45. Nael, M., Khademi, H. and Hajabassi, M. A.
2004. Response of Soil Quality Indicators and
Their Spatial Variability to Land Degradation
in Central Iran. Appl. Soil Ecol., 27: 221-232.
46. Nelson, D. W. and Sommers, L. E. 1982. Total
Carbon, Organic Carbon, and Organic Matter.
Part II. In: "Methods of Soil Analysis", (Ed.):
Buxton, D. R.. 2nd
Edition, ASA, Monograph,
No. 9, Madison, WI, PP. 539-579.
47. Patrick, J. H. and Smith, D. W. 1975. Forest
Management and Nutrient Cycling in Eastern
Hardwoods. USDA For. Serv. Res. Pap. ME-
4. Northeast For. Exp. Stat. Broomal, PA.
48. Paul, K. I., Polglase, P. J., Nyakuengama J. G.
and Khanna, P. K. 2002. Change in Soil
Carbon Following Afforestation. Forest Ecol.
Manag., 168: 241-257.
49. Paz-Gonzalez, A., Viera, S. R. and Toboada
Castro, M. T. 2000. The Effect of Cultivation
on the Spatial Variability of Selected
Properties of an Umbric Horizon. Geoderma,
97: 273-292.
50. Pierce, F. J. and Larson, W. E. 1993.
Developing Criteria to Evaluate Sustainable
Land Management.p:7-14. In: "Proceeding of
the 8th International Soil Management
Workshop: Utilization of Soil Survey
Information for Sustainable Land Use", (Ed.):
Kimble, J. M. Oregon, California, and Nevada.
USDA, Soil Conservation Service, National
Soil Survey Center, Lincoln, NE.
51. Rasiah, V., Florentine, S. K., Williams, B. L.
and Westbrooke, M. E. 2004. The Impact of
Deforestation and Pasture Abandonment on
Soil Properties in the West Tropics of
Australia. Geoderma, 120: 35-45.
52. Rhoades, J. D. 1982. Soluble Salts. Part II. In:
"Methods of Soil Analysis", (Ed.): Page, A. L.
2nd
Edition, ASA, Monograph, No. 9, Madison,
WI, PP.167-179.
53. Ritcher, D. D., Markewitz, D., Trumbore, S. E.
and Wells, C. G. 1999. Rapid Accumulation
and Turnover of Soil Carbon in a Re-
establishing Forest. Nature, 400: 56- 58.
54. Sanchez Maranon, M., Soriano, M., Delgado,
G. and Delgado, R. 2002. Soil Quality in
Mediterranean Mountain Environment. Soil
Sci. Soc. Am. J., 66: 948-958.
55. Shukla, M. K., Lal, R. and Ebinger, M. 2006.
Determining Soil Quality Indicators by Factor
Analysis. Soil Till. Res., 87: 194-204.
56. Sigstad, E., Begas, M. A., Amoroso, M. J. and
Garcia, C. I. 2002. Effects of Deforestation on
Soil Microbial Activity. Themochimica Acta,
394: 171-178.
57. Soil Survey Staff. 2006. Keys to Soil
Taxonomy. US, Department of Agriculture,
Natural Resources Conservation Service.
58. Swan, A. R. H. and Sandilands, M. 1995.
Introduction to Geological Data Analysis.
Blackwell, London. 446 PP.
59. Vagen, T. G., Andrianorofanomezana, M. A.
A. and Andrianorofanomezana, S. 2006.
Deforestation and Cultivation Effects on
Characteristics of Oxisols in the Highlands of
Madagascar. Geoderma, 131: 190-200.
60. van Bevel, C. H. M. 1949. Mean Weight
Diameter of Soil Aggregate as a Statistical
Index of Aggregation. Soil Sci. Soc. Am. Proc.,
14: 20-23.
61. Wander, M. M. and Bollero, G. A. 1999. Soil
Quality Assessment of Tillage Impact in
Illinois. Soil Sci. Soc. Am. J., 63: 961-971.
_______________________________________________________________________ Ayoubi et al.
742
62. Wang, X., Liu, M., Liu, S. and Liu, G. 2006.
Fractal Characteristics of Soils under Different
Land-use Pattern in the Arid and Semiarid
Region of the Tibetan Platue, China.
Geoderma, 134: 56-61.
63. Wang, Z., Chang, A. C., Wu, L. and Crowley,
D. 2003. Assessing the Soil Quality of Long-
term Reclaimed Wastewater-irrigated
Cropland. Geoderma, 114: 261-278.
64. Wendroth, O., Reynold, W. D., Vieira, S. R.,
Reichardt, K. and Wirth, S. 1997. Statistical
Approaches to the Analysis of Soil Quality
Data. In: "Soil Quality for Crop Production
and Ecosystem Health", (EdS.): Gregorich, E.
G. and Carter, M. R.. Elsevier, Amsterdam,
PP. 247-276.
65. Wischmeier, W. H. and. Smith, D. D. 1978.
Predicting Rainfall Erosion Losses. A Guide to
Conservation Planning. USDA, Agr. Res.
Serve. Handbook, 537 PP.
66. Zink, J. A. and Farshad, A. 1995. Issues of
Sustainability and Sustainable Land
Management. Can. J. Soil. Sci., 75: 407-412.
ارزيابي اثرتغيير كاربري اراضي روي شاخص هاي كيفيت در خاكهاي لسي استان
، ايرانگلستان
رودريگز دليما. س. ساهراوات، و ا. ل. خرمالي، ك. ايوبي، ف. ش
چكيده
ارزيابي اثر تغيير كاربري اراضي روي شاخص هاي كيفيت خاك به كمك تكنيك اين مطالعه به منظور 40به اين منظور . اضي تپه ماهوري منطقه شصت كالي استان گلستان انجام شده استتجزيه فاكتورها در ار
اراضي كشت ) 2(جنگل طبيعي، ) 1(از چهار كاربري شامل ) سانتي متر0-30(نمونه خاك از افق سطحي ) نمونه160جمعاً (اراضي جنگل كاري شده با سرو ) 4(اراضي جنگل كاري شده با زيتون و ) 3(شده، چهارده تجزيه فيزيكي، شيميايي و بيولوژيكي روي نمونه هاي خاك به روشهاي استاندارد . شت گرديدبردا
، (MWD)نتايج تجزيه فاكتورها نشان داد كه ميانگين وزني قطر خاكدانه ها . آزمايشگاهي صورت پذيرفت بهترين (TN) و ازت كل (SOM)، مقدار ماده آلي خاك (WSA)درصد خاكدانه هاي پايدار در آب
. شاخص هاي ارزيابي كيفيت خاك در منطقه مورد مطالعه براي نشان دادن اثر تغيير كاربري اراضي بودند درصد بين چهار تيمار مورد بررسي 99نتايج آناليز واريانس و مقايسه ميانگين ها نشان داد كه در سطح احتمال
طع كامل درختان طبيعي منطقه و ق. و مقدار شن اختالف معني داري وجود داردMWD , SOMبين كشت و كار باعث كاهش . ماده آلي شده است% 5/71 سال گذشته منجر به كاهش 40كشت و كار در
جنگل كاري مجدد اراضي تخريب شده . مقدار شن شده است% 252، و باعث افزايش MWDمقدار % 1/52ه آلي در مقايسه با اراضي زراعي گرديده مقدار ماد% 3/72و % 5/49با زيتون و سرو به ترتيب باعث افزايش
درصد نسبت به 6/83 و 81 در اراضي كشت شده با زيتون و سرو به ترتيب MWDهمچنين مقدار . استنتايج كلي اين تحقيق نشان داد كه قطع كامل جنگل و به تبع آن كشت و . اراضي زراعي افزايش يافته است
كاهش كيفيت خاك شده است در حاليكه جنگل كاري كار ممتد روي اراضي تپه ماهوري لسي باعث .مجدد اين اراضي كيفيت خاك را بهبود بخشيده است
Related Documents