SUPPORTING MATERIAL

SUPPORTING MATERIAL. The collaborative agenda Networks/clusters are a key vehicle to achieve innovation Proposition is that the structure of network.
Dec 31, 2015
Welcome message from author
This document is posted to help you gain knowledge. Please leave a comment to let me know what you think about it! Share it to your friends and learn new things together.
Transcript
SUPPORTING MATERIAL

The collaborative agenda Networks/clusters are a key vehicle to achieve
innovation Proposition is that the structure of network and the
position of actors within the network enable/constrain the achievement of outcomes
These connections & their topology often not fully visible
The network lens (&Social Network Analysis) helps to identify connections and relationships: Where collaboration is occurring, and Where it is not or should/could be
SNA is (1) guided by formal theory organized in mathematical terms, and (2) is grounded in the systematic analysis of empirical data
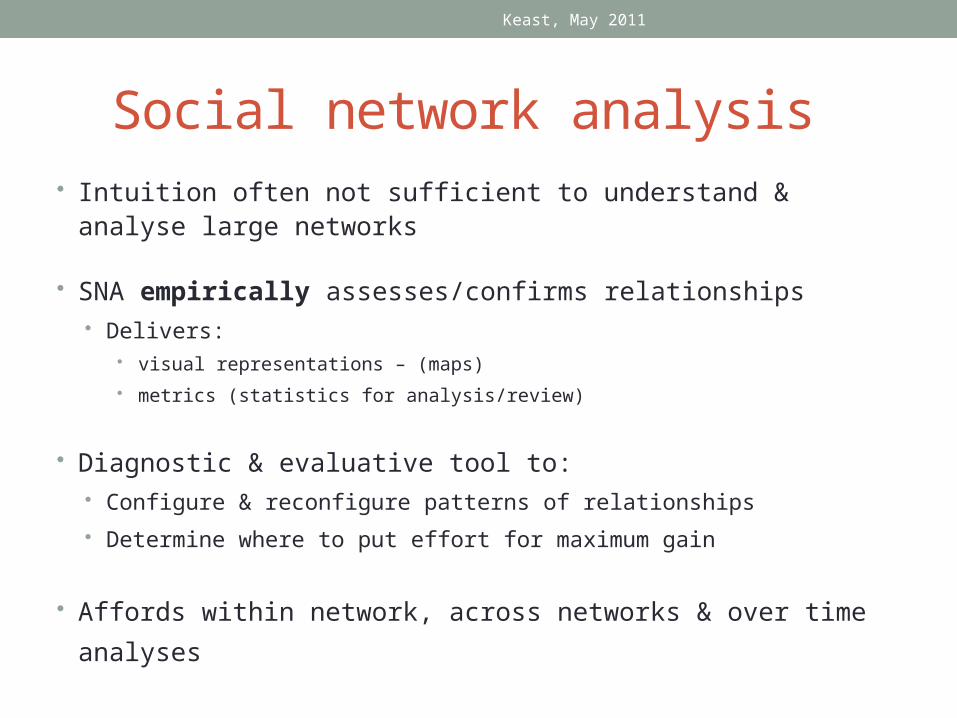
Social network analysis Intuition often not sufficient to understand & analyse large
networks
SNA empirically assesses/confirms relationships Delivers:
visual representations – (maps)
metrics (statistics for analysis/review)
Diagnostic & evaluative tool to: Configure & reconfigure patterns of relationships
Determine where to put effort for maximum gain
Affords within network, across networks & over time analyses
Keast, May 2011
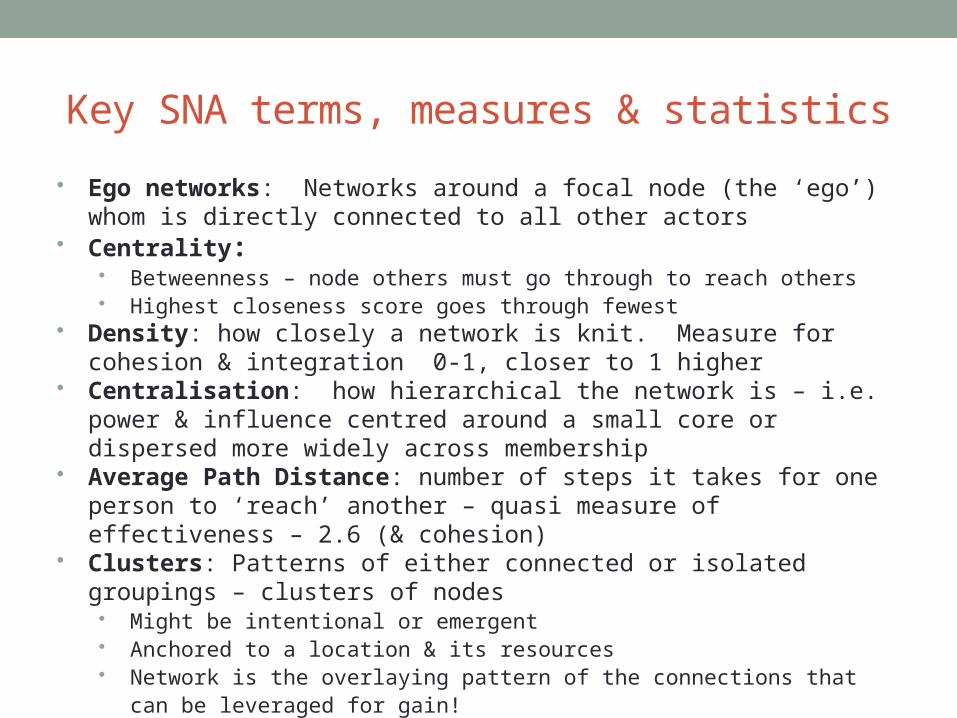
Key SNA terms, measures & statistics
Ego networks: Networks around a focal node (the ‘ego’) whom is directly connected to all other actors
Centrality: Betweenness – node others must go through to reach others Highest closeness score goes through fewest
Density: how closely a network is knit. Measure for cohesion & integration 0-1, closer to 1 higher
Centralisation: how hierarchical the network is – i.e. power & influence centred around a small core or dispersed more widely across membership
Average Path Distance: number of steps it takes for one person to ‘reach’ another – quasi measure of effectiveness – 2.6 (& cohesion)
Clusters: Patterns of either connected or isolated groupings – clusters of nodes
Might be intentional or emergent Anchored to a location & its resources Network is the overlaying pattern of the connections that can be leveraged for
gain!
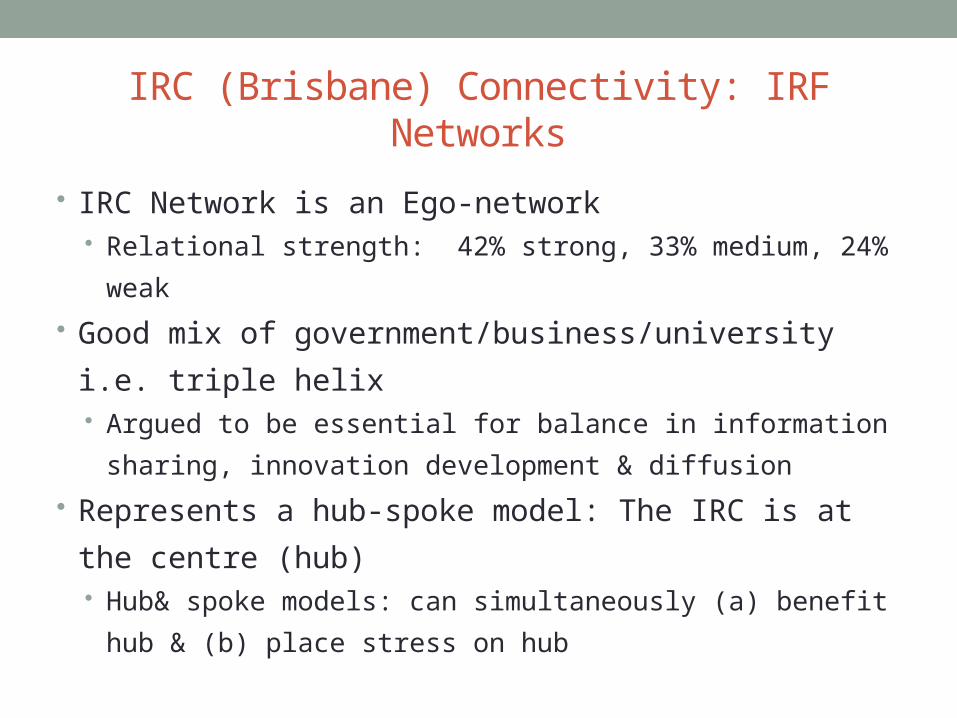
IRC (Brisbane) Connectivity: IRF Networks
IRC Network is an Ego-network Relational strength: 42% strong, 33% medium, 24% weak
Good mix of government/business/university i.e. triple
helix Argued to be essential for balance in information sharing,
innovation development & diffusion
Represents a hub-spoke model: The IRC is at the
centre (hub) Hub& spoke models: can simultaneously (a) benefit hub &
(b) place stress on hub
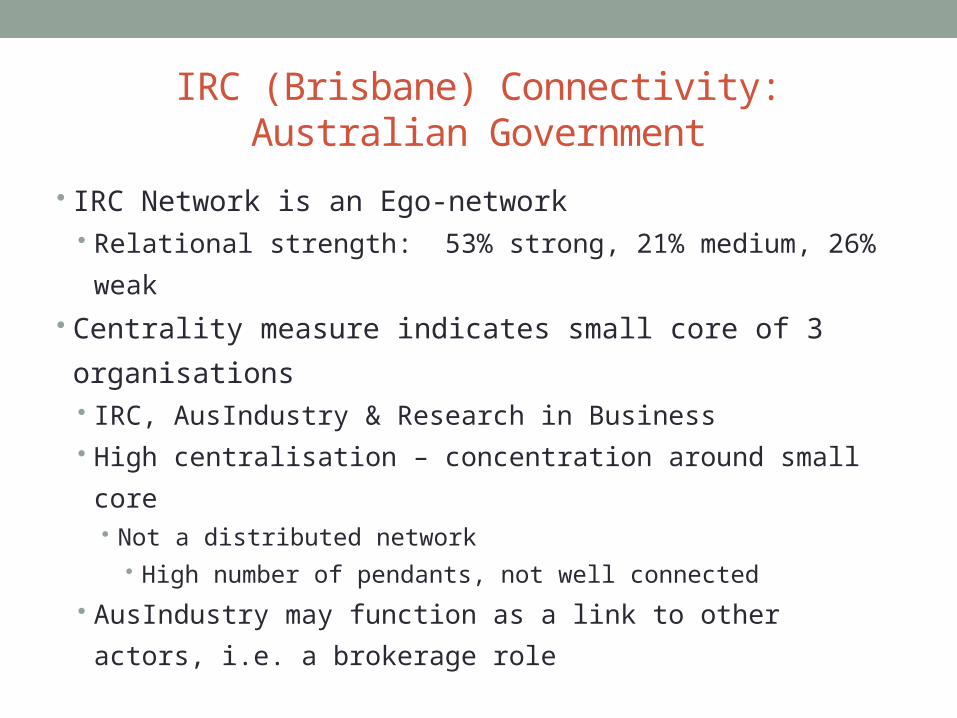
IRC (Brisbane) Connectivity:Australian Government
IRC Network is an Ego-network Relational strength: 53% strong, 21% medium, 26%
weak
Centrality measure indicates small core of 3
organisations IRC, AusIndustry & Research in Business High centralisation – concentration around small core
Not a distributed network High number of pendants, not well connected
AusIndustry may function as a link to other actors, i.e. a
brokerage role

Questions for consideration
How can AusIndustries facilitate IRC in
improving relations with actors that have
weaker ties? Could IRC function as a broker in connecting
the pendants and increase information flows
through the network?
Questions for consideration
Where are the strong relations (existing
capital)? There is no need for continual investment in strong
relationships. Effort can be focussed on increasing
‘weaker’ but important ties
What are missing relationships? Are there known actors that are not represented in
this network? Who has potential resources and can be brought
closer into the network?

IRC (Brisbane) ConnectivityQueensland government
IRC Network is an Ego-network Equal mix of relationship strengths
2 most central actors are SITIA and ETE The network appears low in density and
highly centralised Less cohesive networks perform less effective
in information sharing In high central networks, the core actor (IRC)
becomes a very important information broker
Questions for consideration
Are all the key players included in this network? Does this analysis outcome, meet the purpose
of the network? By increasing the density (facilitating ties in-between other actors) the network becomes more cohesive and can more effectively coordinate action and share information
Low density and higher number of weaker ties is an opportunity to facilitate new relations and increase information flows
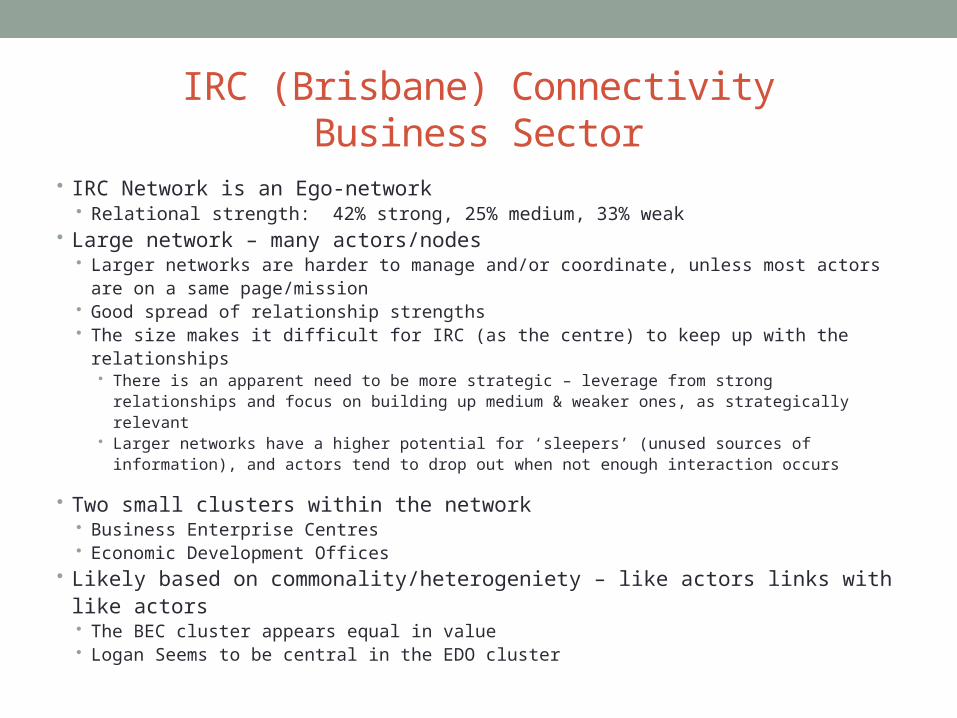
IRC (Brisbane) ConnectivityBusiness Sector
IRC Network is an Ego-network Relational strength: 42% strong, 25% medium, 33% weak
Large network – many actors/nodes Larger networks are harder to manage and/or coordinate, unless most actors are on
a same page/mission Good spread of relationship strengths The size makes it difficult for IRC (as the centre) to keep up with the relationships
There is an apparent need to be more strategic – leverage from strong relationships and focus on building up medium & weaker ones, as strategically relevant
Larger networks have a higher potential for ‘sleepers’ (unused sources of information), and actors tend to drop out when not enough interaction occurs
Two small clusters within the network Business Enterprise Centres Economic Development Offices
Likely based on commonality/heterogeniety – like actors links with like actors
The BEC cluster appears equal in value Logan Seems to be central in the EDO cluster

Questions for consideration
Larger networks are more vulnerable. Can resilience be increase by facilitating clusters within the network, such as the cluster around the Business Enterprise Centres and the Economic Development Offices?
Why is Logan central in the BEC cluster? What can IRC learn/gain from nurturing this relation?
Why are some actors, for example UKTI and BEDO, not linked into the smaller clusters? What can IRC offer to increase interrelationships for these clusters?

Conclusions The IRC overall, appears to nurture a balanced set of relations.
Approx. 43% of relations is strong and another 30% is of medium strength
Good mix of government/business/university IRC has covered the ‘Triple Helix’. This is essential for its balance in
information sharing and coordinating actions The covered networks are each Hub ‘n Spoke networks, with the IRC at the
centre. Hub ‘n Spoke models add additional stress to the actor in the centre as the main ‘glue’ for the network
To increase the health of the network, additional clusters can be facilitated to make the networks more resilient
There is an apparent potential to increase strategic relationships with more important actors, and facilitate more information sharing among actors
Across the networks, the IRC has a healthy mix of relational strengths with all the various types of stakeholders (state and federal government, business, associations, offices and universities

Conclusions (cont.) The SNA analysis provides useful initial insights into the following:
Existing network relationships and ties The structure & functioning of the networks
The maps can be used as a diagnostic tool to: Uncover ‘hidden’ relationships & patterns of connection Identify ‘missing’ relationships Configure & reconfigure networks to be ‘fit for purpose’
i.e. loose ties/cooperative relationships for information sharing (incremental innovation)? Medium – coordination (strong centralisation) (radical) Stronger ties/dense structure (core) collaboration (transformational)?
Networks & relationships are a transaction cost Relationships must be leveraged to produce outcomes Points to the need for strategic approach
• In the future, these maps can be used as evaluation tools for bench marking networks. This requires further research into the networks as the current study based on self-reported data from the ego is limited
Next steps Instructive to collect data on the various networks based
on: Questionnaires Face-to-face interviews Documents and/or reports
Additional information on types of relationships and relationships between actors will further increase the understanding of the Innovation Atlas context and environment
Social Network Analysis (considerations)
The following slides list a set of considerations for this report and additional theoretical information to explain some of the terms used. It also contains a set of ‘Self-help Questions’ that allow to start increasing the effectiveness of strategic relations
This report based on ego/self report data Benchmarking: all networks & systems are unique & contextually determined,
reflecting their people, history, foci & responsibilities Although there are some accepted models,
There are not ‘right’ or ‘correct’ patterns of connection Care should be taken with cross-case comparisons Coupling other methods e.g. Case study or interviews adds value
While SNA offers a different approach & empirical insights into structure & connections Also very useful tool to prompt good questions that stimulate genuine &
informed dialogue & planning Does this network structure support its stated purpose? Are the right organisations involved?

Building networks
Strategic Leveraging Networks & clusters based on relationships or ties:
These are a key resource that should be drawn up on leveraged to generate new outcomes – innovations, knowledge etc
Tendency to work/link with ties that already have a strong investment (existing social/relational capital that can be drawn upon for some time) (like linking with like)
This can limits access to new resources, knowledge & ideas
Instead should be more strategic in relationship use & target those ties/nodes that hold essential resources, but are weak or not in place.
Strong ties are important for coherency & joint action Weak ties are important for introducing new ideas, knowledge &
resources to the network/cluster
Reconfiguring network ties & structures
Increase the number of ties: introduce new people to the network, hold seminars – or establish particular roles to broker connections
Bridge structural holes: institutionalise or expand the roles of people who are connecting different parts of the network
Increase connective capacity: create understanding of the function of ‘position’ within the network & its benefits & constraints
Increase the flow of information/ideas: open up communication channels, increase frequency of interactions, tap into weak ties
Strengthen relationships: work together, socialise, use ICT to support/supplement personal connections
Reduce cliques: Rotate leadership/management functions
Hub & spoke models Typically the H&S holds the purpose of the
network/cluster & sets the style of interaction Intentionally created or emergent
Propensity for the most central agency/entity in the ‘hub’ to become the face Both positive & negative implications Facilitates brokerage capacity & coordination Overloaded in terms of information flows
(gatekeeper) & has the role of building & maintaining all the spoke relations – there is no/little backup, this is hard to sustain overtime
Strategic relationship building considerations
Strategic relationship building
Keast, November 2010
Building up relationships Who do you need to establish relations?
How strong does the link need to be? Borrowing on existing relationships
Where do you already have strong relations? How can you use these better/use alternative sales formats? Use these as links to other sales opportunities
Dissolving relationships Who do you have strong but not productive relations with?
How could these be ramped up ? Should they be dissolved ? Are they just habit ?
What organisational adjustments are required?
Systems and processes Behaviours & expectations Management & leadership Evaluation approaches
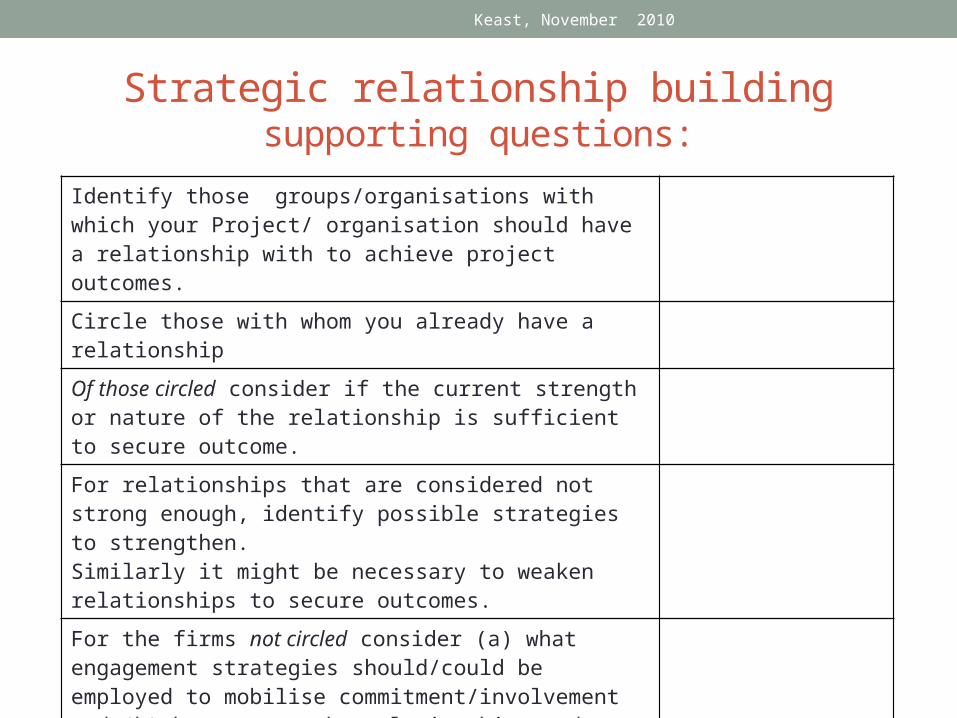
Strategic relationship buildingsupporting questions:
Keast, November 2010
Identify those groups/organisations with which your Project/ organisation should have a relationship with to achieve project outcomes.
Circle those with whom you already have a relationship
Of those circled consider if the current strength or nature of the relationship is sufficient to secure outcome.
For relationships that are considered not strong enough, identify possible strategies to strengthen. Similarly it might be necessary to weaken relationships to secure outcomes.
For the firms not circled consider (a) what engagement strategies should/could be employed to mobilise commitment/involvement and (b) how strong the relationship needs to be.
Related Documents