1 Supporting Information Photoinduced Interactions in a Pyrene-Calix[4]arene-Perylene Bisimide Dye System: Probing Ground State Conformations with Excited State Dynamics of Charge Separation and Recombination Nguyen Vân Anh, ‡ Felix Schlosser, † Michiel M. Groeneveld, ‡ Ivo H. M. van Stokkum, * § Frank Würthner,* † and René M. Williams* ‡ Molecular Photonics Group, van’t Hoff Institute for Molecular Sciences (HIMS), Universiteit van Amsterdam, Nieuwe Achtergracht 129, 1018 WV Amsterdam, The Netherlands; Institut für Organische Chemie and Röntgen Research Center for Complex Material Systems, Universität Würzburg, Am Hubland, D-97074 Würzburg, Germany and Department of Physics and Astronomy, Vrije Universiteit, de Boelelaan 1081,1081 HV Amsterdam, The Netherlands

Welcome message from author
This document is posted to help you gain knowledge. Please leave a comment to let me know what you think about it! Share it to your friends and learn new things together.
Transcript
1
Supporting Information
Photoinduced Interactions in a Pyrene-Calix[4]arene-Perylene Bisimide Dye System:
Probing Ground State Conformations with Excited State Dynamics
of Charge Separation and Recombination
Nguyen Vân Anh,‡ Felix Schlosser,† Michiel M. Groeneveld,‡ Ivo H. M. van Stokkum, *§ Frank
Würthner,*† and René M. Williams*‡
Molecular Photonics Group, van’t Hoff Institute for Molecular Sciences (HIMS), Universiteit van Amsterdam, Nieuwe
Achtergracht 129, 1018 WV Amsterdam, The Netherlands; Institut für Organische Chemie and Röntgen Research Center
for Complex Material Systems, Universität Würzburg, Am Hubland, D-97074 Würzburg, Germany and Department of
Physics and Astronomy, Vrije Universiteit, de Boelelaan 1081,1081 HV Amsterdam, The Netherlands

2
Content:
S1. Synthesis
Figure S1.1 Compound 5 (Py-c-PBI) with atom numbering.
Figure S1.2 (1H,
1H)-COSY NMR spectrum of compound 5.
Figure S1.3 (1H,
13C)-HSQC NMR spectrum of compound 5.
Figure S1.4 (1H,
13C)-HMBC NMR spectrum of compound 5.
Figure S1.5 Enhanced areas of the (1H,
13C)-HSQC spectrum of compound 5.
Figure S1.6. Enhanced areas of the (1H,
13C)-HMBC spectrum of compound 5.
Figure S1.7. Enhanced area of the (1H,
13C)-HMBC spectrum of compound 5.
S2. Photophysical properties of Py-c-PBI and Py-c
� Figure S2.1. Absorption spectra of Py-c-PBI in different solvents
� Figure S2.2. Absorption spectra of Py-c in different solvents
� Figure S2.3. Fluorescence together with absorption spectra of Py-c
� Table S2.1. Absorption coefficients and quantum yields of Py-c in seven solvents
� Figure S2.4. Cyclic voltammograms in CH2Cl2 (vs. Fc/Fc+) of Py-c-PBI and Py-c
� Table S2.2. Redox properties of the compounds Py-c-PBI and Py-c in CH2Cl2 (vs. Fc/Fc+)
� Figure S2.5. Femtosecond transient spectroscopy of Py-c-PBI in CHX
� Figure S2.6. Femtosecond transient spectroscopy of Py-c-PBI in TOL
� Figure S2.7. Femtosecond transient spectroscopy of Py-c-PBI in DCM
� Figure S2.8. Femtosecond transient spectroscopy of Py-c-PBI in ACN
� Figure S2.9. Femtosecond transient spectroscopy of Py-c-PBI in phCN
� Figure S2.10.Femtosecond transient spectroscopy of Py-c in DCM, ACN, PhCN; and THF
� Figure S2.11. Target analysis SADS of Py-c-PBI in ACN, TOL, DCM, and CHX; upon 530 nm excitation
� Figure S2.12A. 3D-representation of the data matrix (visible detection) of Py-c-PBI in THF, upon 350 nm excitation (top) and upon 530 nm excitation (bottom).
� Figure S2.12B. 3D-representation of the data matrix (NIR detection multiplied by -1) of Py-c-
PBI in THF, upon 350 nm excitation (top) and upon 530 nm excitation (bottom).
� Figure S2.13. Absorption spectra (dotted line) of Py-c-PBI in DCM (solid line) together with the sum spectrum (dash-dot line) of the two separate reference chromophores PBI-c and Py-c.
Energetics for Py-c
Table S2.3. The lifetimes of the processes occurring in Py-c extracted from global and target
analysis (excitation at 350 nm).
References
Formatted: Bullets and Numbering

3
1. Synthesis
Materials and methods
Compounds 11 and 2
2,3 were synthesized according to literature procedures. All compounds were characterized by 1H-NMR spectroscopy and high-resolution mass spectrometry (HR-MS). Solvents were purified and dried according to standard procedures.4 Column chromatography was performed with silica gel 60 (0.035 - 0.070 mm); HPLC on SiO2 columns, normal phase (NP). NMR spectra were recorded on a Bruker DMX 600 (600.1 MHz) spectrometer. Chemical shifts δ were calibrated against the residual tetrachloroethane-d2 peak (1H-NMR: δ = 6.00 ppm, 13C-NMR: δ = 74.20 ppm). Mass spectra were performed with a Bruker microTOFLC instrument.
Compound 3 (PBI-c):
Under an argon atmosphere 22.0 mg (0.031 mmol, 1 equiv.) of compound 1, 25.0 mg (0.046 mmol, 1.5 equiv.) of perylene monoimide 2 and one drop of triethylamine in toluene (0.2 mL) were heated to 105 °C for 38 h. The solvent was removed by rota-evaporation, and the resulting solid was purified by column chromatography with CH2Cl2/ethylacetate 99:1 and precipitated from CH2Cl2/methanol. Compound 3 was obtained as a light red powder (22.0 mg, 0.018 mmol, 58%). C80H87N3O10 (1250.56). Mp 119 – 122 °C. TLC (CH2Cl2): Rf = 0.24. 1
H-
NMR (600 MHz, tetrachloroethane-d2, 79 °C): δ (ppm) = 8.74 – 8.71 (m, 4H; Per-H); 8.68 – 8.66 (m, 4H; Per-H); 6.86 (bs, 2H; Ar-H); 6.81 (bs, 2H; Ar-H); 6.73 (bs, 1H; Boc-NH); 6.60 – 6.55 (m, 6H; Ar-H); 5.23 – 5.18 (m, 1H; Undecyl-CH); 4.59 and 3.26 (AX, 4H, 2J = 13.4 and 13.5 Hz; Ar-CH2-Ar); 4.52 and 3.21 (AX, 4H, 2
J = 13.3 and 13.4 Hz; Ar-CH2-Ar); 4.06 (t, 2H, 3J = 7.5 Hz;
O-CH2); 3.97 (t, 2H, 3J = 7.4 Hz; O-CH2); 3.91 (t, 4H, 3
J = 7.1 Hz; O-CH2); 2.31 – 2.25 (m, 2H; Undecyl-CH2); 2.06 – 1.92 (m, 8H + 2H; Propyl-CH2 and Undecyl-CH2); 1.57 (s, 9H; Boc-tert-Butyl-H); 1.43 – 1.34 (m, 12H; Undecyl-CH2); 1.11 (t, 6H, 3J = 7.4 Hz; Propyl-CH3); 1.08 – 1.04 (m, 6H; Propyl-CH3); 0.91 – 0.89 (m, 6H; Undecyl-CH3). HR-MS (ESI in acetonitrile/CHCl3): calcd for C80H88N3O10 [M+H]+ m/z = 1250.6470; found 1250.6464.
Compound 5 (Py-c-PBI):
To a solution of 22.0 mg (0.018 mmol) of compound 3 in 2 mL dry CH2Cl2 were added 3 mL of CF3COOH under an argon atmosphere. The mixture was stirred for 3 h at room temperature, poured into ice water and adjusted to pH > 9 with NH3 solution (25%). CH2Cl2 (50 mL) was added to the mixture and the resulting organic phase was washed with water and brine, and dried over Na2SO4. The solvent was removed by rota-evaporation and the resulting crude product 4 was dried and used for the next step without further purification.
Under an argon atmosphere 3.2 mg (0.013 mmol, 1 equiv.) of 1-pyrenecarboxylic acid, 2.6 mg (0.026 mmol, 2 equiv.) of N-methylmorpholine (NMM), 2.6 mg (0.013 mmol, 1 equiv.) of N,N′-dicyclohexylcarbodiimide (DCC) and 1.7 mg (0.013 mmol, 1 equiv.) of 1-hydroxybenzotriazole

4
(HOBt) in a 2:1 mixture of dry DMF and dry acetonitrile (0.3 mL) were stirred at room temperature for 0.5 h. A solution of 15.0 mg (0.013 mmol, 1 equiv.) of the crude product 4 in dry DMF (1.2 mL) was added, and the reaction mixture was stirred at room temperature for 5 d. The reaction mixture was filtered and CH2Cl2 (70 mL) was added to the filtrate and washed with brine and water, and dried over Na2SO4. The crude product was purified by column chromatography with CH2Cl2/ethylacetate 97:3, precipitated three times from CH2Cl2/n-hexane, and was further purified by HPLC with CH2Cl2. Compound 5 was obtained as a violet powder (8.0 mg, 5.8 µmol, 33% over two steps). C92H87N3O9 (1378.69). Mp 270 – 272 °C. TLC (CH2Cl2/ethylacetate 95:5): Rf = 0.84. 1H-NMR (600 MHz, tetrachloroethane-d2, 79 °C):5 δ (ppm) = 8.75 – 8.74 (m, 2H; H64 and H69, Per-H); 8.56 (s, 1H; H84, NH); 8.32 (bs, 2H; H63 and H70, Per-H); 8.02 – 7.99 (m, 2H; H5 and H6, Pyrenyl-H); 7.76 – 7.75 (m, 1H; H14, Pyrenyl-H); 7.71 – 7.69 (m, 1H; H12, Pyrenyl-H); 7.61 – 7.60 (m, 1H; H11, Pyrenyl-H); 7.57 – 7.54 (m, 1H; H15, Pyrenyl-H); 7.45 – 7.43 (m, 1H; H10, Pyrenyl-H); 7.33 – 7.32 (m, 1H; H16, Pyrenyl-H); 7.25 – 7.24 (m, 2H; H25 and H38, Ar-H); 7.20 – 7.19 (m, 2H; H29 and H40, Ar-H); 6.99 – 6.98 (m, 1H; H9, Pyrenyl-H); 6.95 – 6.93 (m, 2H; H30 and H39, Ar-H); 6.55 (s, 2H; H19 and H23, Ar-H); 6.50 (s, 2H; H33 and H35, Ar-H); 5.29 – 5.24 (m, 1H; H81, Undecyl-CH); 4.66 and 3.39 (AX, 4H, 2
J = 13.4 and 13.6 Hz; H43 and H44, Ar-CH2-Ar); 4.65 and 3.36 (AX, 4H, 2
J = 13.0 and 13.2 Hz; H45 and H46, Ar-CH2-Ar); 4.27 – 4.19 (m, 4H; H93 and H99, O-CH2); 3.93 (t, 2H, 3
J = 6.6 Hz; H96, O-CH2); 3.87 (t, 2H, 3
J = 6.9 Hz; H102, O-CH2); 2.34 – 2.30 (m, 2H; H82 and H83, Undecyl-CH2); 2.18 – 2.11 (m, 4H; H94 and H100, Propyl-CH2); 2.06 – 1.99 (m, 4H + 2H; H97 and H103, Propyl-CH2, and H82 and H83, Undecyl-CH2); 1.49 – 1.35 (m, 12H; H85 – H87 and H89 – H91, Undecyl-CH2); 1.25 (t, 3H, 3
J = 7.4 Hz; H98, Propyl-CH3); 1.19 (t, 3H, 3J = 7.4 Hz;
H104, Propyl-CH3); 1.05 (t, 6H, 3J = 7.4 Hz; H95 and H101, Propyl-CH3); 0.93 (t, 6H, 3
J = 7.0 Hz; H88 and H92, Undecyl-CH3).
13C-NMR (150 MHz, tetrachloroethane-d2, 79 °C):
δ (ppm) = 168.60 (C17); 164.29 (br, C74 and C76); 163.44 (Per-C); 157.99 (C27 and C42); 155.66 (C31); 153.64 (C21); 137.12 (C26 and C37); 136.31 (C28 and C41); 134.61 (Per-C); 134.21 (C20 and C22); 134.14 (C32 and C36); 133.79 (br, Per-C); 133.38 (C1); 131.86 (C4); 131.68 (C24); 131.57 (br, C64 and C69); 130.49 (C8); 130.15 (C13); 129.86 (C25 and C38); 129.58 (Per-C); 128.88 (C29 and C40); 128.51 (C34); 128.04 (Per-C); 127.91 (C12); 127.78 (C9); 127.76 (C2); 127.71 (C33 and C35); 126.96 (C10); 126.41 (Per-C); 126.38 (C15); 125.35 (C14); 125.09 (C6 or C16); 125.07 (C6 or C16); 125.01 (Per-C); 124.60 (C5); 124.44 (C19 and C23); 124.09 (C3); 123.96 (Per-C); 123.91 (C11); 123.66 (C7); 123.11 (C63 and C70); 122.46 (C30 and C39); 122.01 (br, Per-C); 120.62 (Per-C); 116.90 (Per-C); 116.70 (Per-C); 116.49 (Per-C); 78.00 (C102); 77.64 (C96); 76.79 (C93 and C99); 74.46 (Per-C); 55.21 (C81); 32.73 (C82 and C83); 31.98 (C86 or C87 and C90 or C91); 31.50 (C43 and C44); 31.43 (C45 and C46); 26.94 (C85 and C89); 23.86 (C97); 23.79 (C103); 23.28 (C94 and C100); 22.75 (C86 or C87 and C90 or C91); 14.21 (C88 and C92); 11.14 (C98); 11.00 (C104); 10.23 (C95 and C101). HR-MS (ESI in acetonitrile/CHCl3): calcd for C92H88N3O9 [M+H]+ m/z = 1378.6554; found 1378.6510.

5
Synthesis of the reference compound 7:
O
O
O
OPr
Pr
Pr
Pr
HN
O
1-pyrencarboxylic acidNMM, DCC, HOBt
DMF, CH3CNrt, 3 d, 23 %
6 7
O
O
O
OPr
Pr
Pr
Pr
NH2
Compound 6 was synthesized according to literature procedures.1,6
Compound 7 (Py-c):
Under an argon atmosphere 20 mg (0.082 mmol, 1 equiv.) of 1-pyrenecarboxylic acid, 17 mg
(0.17 mmol, 2 equiv.) of N-methylmorpholine (NMM), 17 mg (0.082 mmol, 1 equiv.) of N,N′-
dicyclohexylcarbodiimide (DCC) and 11 mg (0.082 mmol, 1 equiv.) of 1-hydroxybenzotriazole
(HOBt) in a 2:1 mixture of dry DMF and dry acetonitrile (0.5 mL) were stirred at room
temperature for 0.5 h. A solution of 50 mg (0.082 mmol, 1 equiv.) of the compound 6 in dry
DMF (1.0 mL) was added, and the reaction mixture was stirred at room temperature for 3 d. The
reaction mixture was filtered and CH2Cl2 (30 mL) was added to the filtrate and washed with brine
and water, and dried over Na2SO4. The crude product was purified by column chromatography
with CH2Cl2/methanol 99:1, precipitated two times from CH2Cl2/n-hexane, and was further
purified by HPLC with CH2Cl2. Compound 7 was obtained as a white powder (16 mg,
0.019 mmol, 23%). C57H57NO5 (836.07). Mp 127 – 128 °C. TLC (CH2Cl2): Rf = 0.55. 1H-NMR
(600 MHz, tetrachloroethane-d2, 79 °C): δ (ppm) = 8.55 – 8.54 (m, 1H; Pyrenyl-H); 8.29 – 8.28
(m, 2H; Pyrenyl-H); 8.24 – 8.19 (m, 3H; Pyrenyl-H); 8.16 – 8.09 (m, 3H; Pyrenyl-H); 7.28 (bs,
1H; NH); 7.00 – 6.54 (br, 11H; Ar-H); 4.55 and 3.25 (bs, 4H; Ar-CH2-Ar); 4.52 and 3.21 (AX,
4H, 2J = 13.4 and 13.5 Hz; Ar-CH2-Ar); 3.97 (bs, 4H; O-CH2); 3.92 (t, 2H, 3J = 7.1 Hz; O-CH2);
3.88 (t, 2H, 3J = 7.2 Hz; O-CH2); 1.99 – 1.93 (m, 8H; Propyl-CH2); 1.12 – 1.07 (m, 6H; Propyl-
CH3); 1.04 (t, 6H, 3J = 7.5 Hz; Propyl-CH3). HR-MS (ESI in acetonitrile/CHCl3): calcd for
C57H57NNaO5 [M+Na]+ m/z = 858.4134; found 858.4128.

6
Figure S1.1. Compound 5 (Py-c-PBI) with atom numbering.7
Figure S1.2. (1H,
1H)-COSY NMR spectrum of compound 5.
7
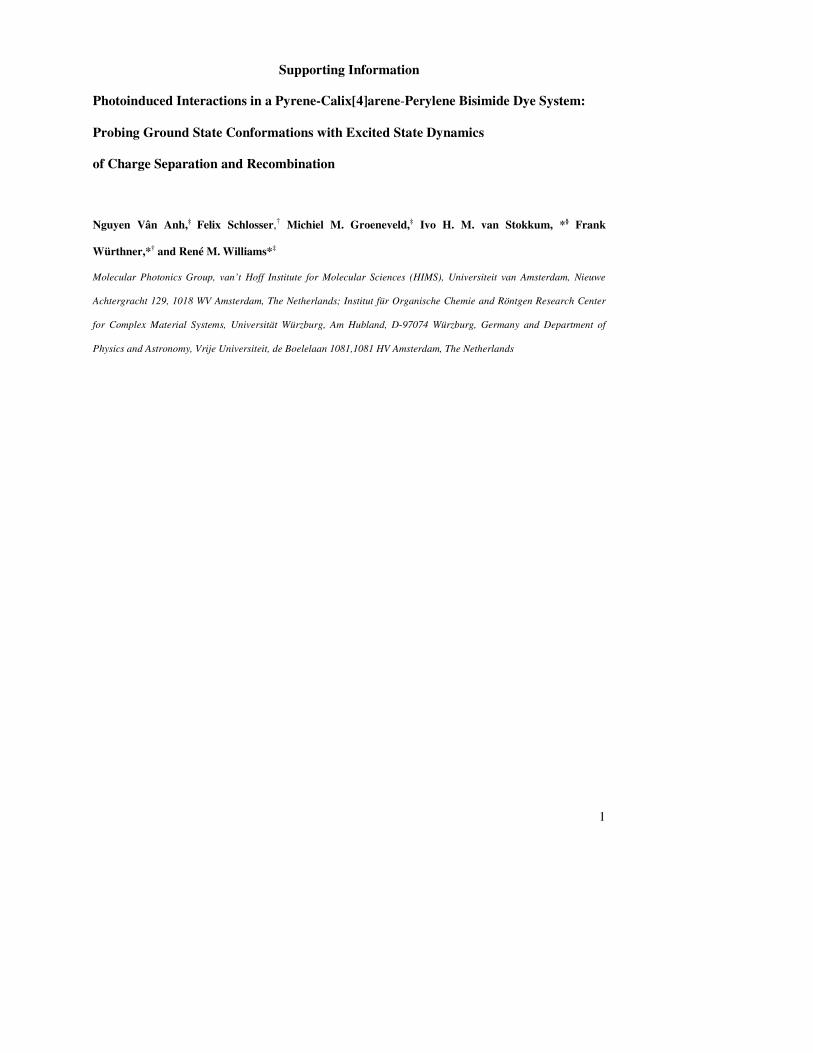
Figure S1.3 (1H,
13C)-HSQC NMR spectrum of compound 5.
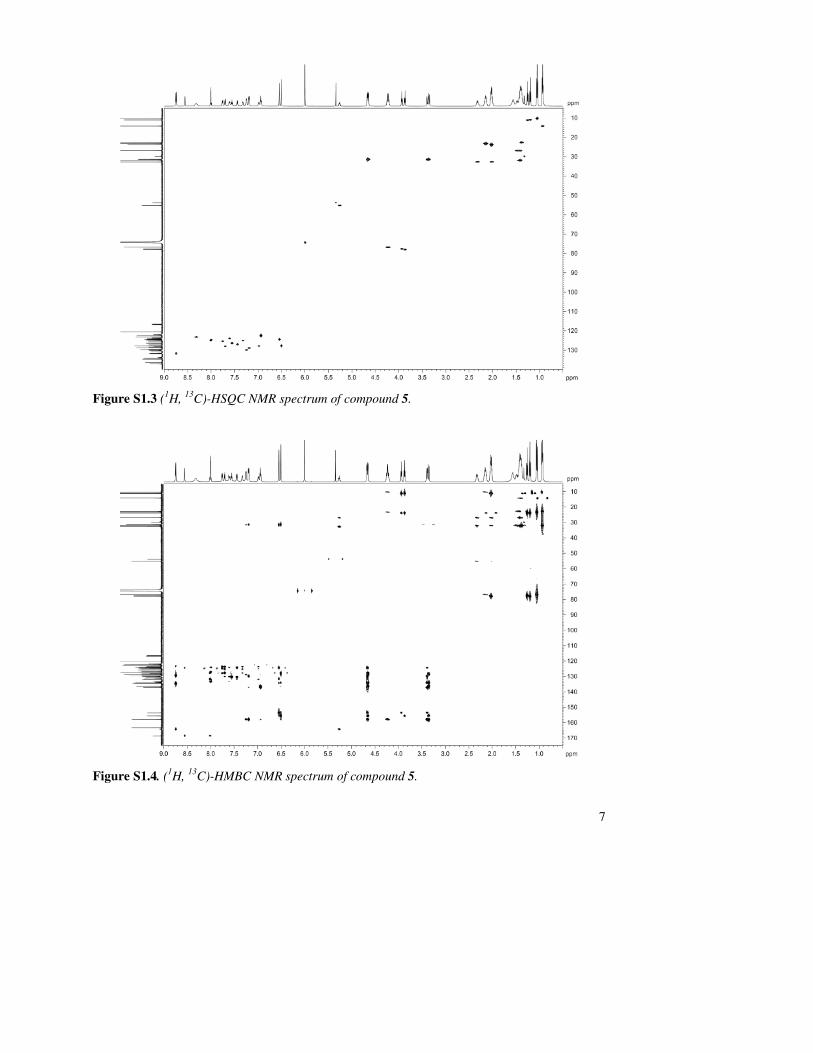
Figure S1.4. (1H,
13C)-HMBC NMR spectrum of compound 5.

8
Figure S1.5. Enhanced areas of the (1H,
13C)-HSQC spectrum of compound 5.
8

9
Figure S1.6. Enhanced areas of the (1H,
13C)-HMBC spectrum of compound 5.
8

10
Figure S1.7. Enhanced area of the (1H,
13C)-HMBC spectrum of compound 5.
8

11
2. Photophysical properties of Py-c-PBI and Py-c
Figure S2.1. Absorption spectra of Py-c-PBI in different solvents.
For solutions of the compound in toluene and in benzonitrile, the absorption spectra of the pyrene unit were observed in the region above 300 nm due to the high absorption of these solvents. Although the absorption profiles of Py-c-PBI in the solvents are similar, there are still some differences. The Figure S2.1 shows that if taking the solution of Py-c-PBI in DCM as a reference, the perylene peaks in THF, CHX and ACN have hypsochromic effects, i.e. are displaced by about 6 nm (in THF and CHX) and 2 nm (in ACN) to short wavelength whereas in phCN, there is a slight bathochromic shift (about 2 nm to longer wavelength). In the other solvents, i.e TOL and CHCl3 there is no significant difference from DCM.

12
Figure S2.2. Absorption spectra of Py-c in different solvents.
Figure S2.3. Fluorescence (dash line) (excited at 340nm) together with absorption spectra of
Py-c (solid black line).

13
Table S2.1. Absorption coefficients and quantum yields of Py-c in seven solvents.
Solv CHX TOL CHCl3 THF DCM phCN ACN
277 (38400)
279 (38400)
277 (39900)
278 (39500)
276 (39200)
λ/nm
(ε/
M-1cm-1) 342 (32100)
345 (31700)
345 (31100)
343 (31900)
345 (31700)
347 (32100)
341 (31500)
φf(a) 1.5×10⁻³ 1.2×10⁻³ 0.6×10⁻³ 1.2×10⁻³ 0.7×10⁻³ - 0.8×10⁻³
(a) excitation wavelength 320nm, excitation and emission slits are 12 nm and 2 nm, respectively.
Absorbance at excitation wavelength was 0.07 – 0.1 at room temperature.

14
-1500 -1000 -500 0 500 1000 1500
E l mV vs. Fc / Fc+
1 µA
-2000 -1500 -1000 -500 0 500 1000
E l mV vs. Fc / Fc+
0.5 µA
Figure S2.4. Cyclic voltammograms in CH2Cl2 (vs. Fc/Fc+). Left: Py-c (c = 1.8 x 10
-4 M).
Right: Py-c-PBI (c = 1.4 x 10⁻⁴
M). Scan Rate 100 mV s–1
; working electrode: Pt disc, ∅ 1 mm;
auxiliary electrode: Pt wire; reference electrode: Ag/AgCl; electrolyte: TBAHFP (0.1 M).
Table S2.2. Redox properties of the compounds Py-c-PBI and Py-c in CH2Cl2 (vs. Fc/Fc
+).
a
Vcmpdg
Ered (PBI-/PBI2-)
Ered (PBI/PBI-)
Eox (PBI/PBI+)
Eoxb
(Py/Py+)
onset of the irrev.
oxidation of the
calix[4]arene
Py-c-PBI
−1.31 −1.09 +0.90 +1.13
Py-c +0.79 +1.13
a Scan Rate 100 mV s–1; working electrode: Pt disc, ∅ 1 mm; auxiliary electrode: Pt wire; reference electrode: Ag/AgCl; electrolyte: TBAHFP (0.1 M). b Irreversible oxidation.

15
a)
b)
c)
Figure S2.5. Femtosecond transient spectroscopy of Py-c-PBI in CHX (a) λexc = 350 nm (b) λ exc
= 530nm, visible detection and (c) λexc = 530 nm, NIR detection.

16
a) b)
c) d)
Figure S2.6. Femtosecond transient spectroscopy of Py-c-PBI in TOL (a) λexc = 350 nm, vis
detection
(b) λ exc = 530 nm, visible detection (c) λexc = 350 nm, NIR detection (d) λexc = 530 nm, NIR
detection.

17
a) b)
c) d)
Figure S2.7. Femtosecond transient spectroscopy of Py-c-PBI in DCM (a) λexc = 350 nm, vis
detection and (b) λ exc = 530 nm, visible detection (c) λexc = 350 nm, NIR detection
(d) λexc = 530 nm, NIR detection.

18
a) b)
c) d)
Figure S2.8. Femtosecond transient spectroscopy of Py-c-PBI in ACN (a) λexc = 350 nm, vis
detection and (b) λ exc = 530 nm, visible detection (c) λexc = 350 nm, NIR detection
(d) λexc = 530 nm, NIR detection.

19
Figure S2.9. Femtosecond transient spectroscopy of Py-c-PBI in phCN at λexc = 530 nm, (a) vis
detection and (b) NIR detection.

20
a) b)
c) d)
Figure S2.10. Femtosecond transient spectroscopy of Py-c in (a) DCM; (b) ACN ; (c) in PhCN;
and (d) in THF; λexc = 350 nm.
The femtosecond transient absorption spectra of Py-c in some solvents show the totally different features from the Py-c-PBI system (in which pyrene unit acts as an electron donor). The absorption band at ca. 550 nm belongs to the pyrene radical anion9. In the system Py-c, the electron transfer occurs from calix[4]arene to pyrene, i.e. pyrene acts as an acceptor.

21
(a)
(b)
(c)
(d)
Figure S2.11. Target analysis SADS of Py-c-PBI in (a) ACN; (b) TOL ; (c) DCM; and (d) CHX;
upon 530 nm excitation.

22
Figure S2.12A. 3D-representation of the data matrix (visible detection) of Py-c-PBI in THF,
upon 350 nm excitation (top) and upon 530 nm excitation (bottom).

23
Figure S2.12B. 3D-representation of the data matrix (NIR detection multiplied by -1) of Py-c-
PBI in THF, upon 350 nm excitation (top) and upon 530 nm excitation (bottom).

24
Figure S2.13. Absorption spectra of Py-c-PBI in DCM (solid line) together with the sum
spectrum (dash-dot line) of the two separate reference chromophores PBI-c and Py-c.

25
Energetics for Py-c
An estimate of the Gibbs energy of photoinduced electron transfer (∆ΕΤG0) for Py-c is given here.
For the Py-c system the donor is presumed to be the 4-methoxy-N,N-dimethyl aniline (anisole is
not a good model for the donor in Py-c).
For the Py-c system, the standard electrode potentials (E0(D+./D) and E0(A/A-.) are estimated to
be +0.33 V 10 vs SCE (D/D+) and –2.09V 11 vs SCE (Py/Py-), respectively, in the reference
solvent acetonitrile with a relative permittivity εref of 37.5. The zero – zero transition energy E00
of the Py chromophore is ~ 3.26 eV.
The center-to-center distance Rcc between the donor and acceptor was determined from
geometries of Py-c optimized by using a semi-empirical AM1 method giving the value of 7.67 Å.
The effective radii of the donor (r+) and acceptor (r-) are estimated using a spherical approach12.
These values are 3.98 Å for pyrene (density 1.271 g/cm3 13), and 3.74 Å for the donor (for the
density was estimated to be 0.995 g/cm3.
Table 2. The driving force for charge separation (∆Gcs = ∆ΕΤG0), the Gibbs energy of activation
(∆G#) of the Py-c system upon Py (A) excitation in different solvents.
Solv εa nb
E00c
[Py] (eV)
∆Gcs (eV)
λ (eV)
∆G# (eV)
CHX 2.02 1.43 3.26 0.04 0.295 0.093
TOL 2.38 1.49 3.26 -0.11 0.351 0.040
CHCl3 4.86 1.44 3.26 -0.53 0.833 0.027
THF 7.58 1.41 3.26 -0.69 1.036 0.030
DCM 8.93 1.42 3.26 -0.72 1.052 0.025
phCN 25.20 1.53 3.26 -0.87 1.067 0.009
ACN 35.94 1.34 3.26 -0.89 1.338 0.037 a at 25oC [21], b
at 20oC [21]; c estimated from intersection between absorption and emission
spectra of Py, λi = 0.3 eV.

26
Table 3. The lifetimes of the processes occurring in Py-c extracted from global and target
analysis (excitation at 350 nm).
Solv τs2 (ps) τcs (ps) τcr1 (ps) τcr2 (ps)
THF 0.3 1.8 2.5 6.9
DCM 0.2 2 2 7.7
ACN 0.4 0.5 2.8 154
THF: tetrahydrofuran; DCM: dichloromethane; ACN: acetonitrile.
References
1 Prins, J.; Jollif, K. A.; Hulst, R.; Timmerman, P.; Reinhoudt, D. N. J. Am. Chem. Soc. 2000, 122, 3617-3627. 2 Kaiser, H.; Lindner, J.; Langhals, H. Chem. Ber. 1991, 124, 529-535. 3 Nagao, Y.; Naito, T.; Abe, Y.; Misono, T. Dyes Pigm. 1996, 32, 71-83. 4 Becker, H. G. O.; Berger, W.; Domschke, G. Organikum, 21. Auflage, Wiley-VCH: Weinheim, 2004. 5 The assignment of the protons was achieved on the basis of 1H, 13C, DEPT, (1H,1H)-COSY, (1H, 13C)-HSQC and (1H, 13C)-HMBC experiments. The signal for the four missing perylene-protons is very broad and between 7.9 – 6.6 ppm. 6 Podoprygorina, G.; Zang, J.; Brusko, V.; Bolte, M.; Janshoff, A.; Böhmer, V. Org. Lett. 2003, 5, 5071-5074. 7 The atom numbers were automatically generated with CS ChemDraw Ultra. 8 Regions without cross-peaks were left out for clarity.
9 Daub, J; Engl, R.; Kurzawa, J.; Miller, S. E.; Schneider, S.; Stockmann, A.; Wasielewski, M. R.; J. Phys. Chem. A, 2001,105, 5655 – 5665. 10 Zweig, A.; Lancaster, J. E.; Neglia, M. T.; Jura, W. H. J. Chem. Phys. 1964, 86, 4130-4136. 11 Handbook of photochemistry, third edition.

27
12 Oevering, H.; Paddon-Row, MN; Heppener, M.; Oliver, A. M.; Cotsaris, E.; Verhoeven, JW; Hush, N. S. J. Am. Chem. Soc. 1987, 109, 3258 – 3269. 13 Lange's Handbook of Chemistry. 70 Th Anniversary, 16th Ed.; Speight J. G.; Mcgraw-Hill Education - United States, 2005.
Related Documents


![cations Supporting information anions and organic · Supporting information Efficient modulation of photoluminescence by hydrogen bonding interactions among inorganic [MnBr4]2-anions](https://static.cupdf.com/doc/110x72/5f8c419e2fd7220f220cd9f4/cations-supporting-information-anions-and-supporting-information-efficient-modulation.jpg)