Ofgem/Ofgem E-Serve 9 Millbank, London SW1P 3GE www.ofgem.gov.uk Supplier Cost Index Methodology Last updated: 09 March 2017 Team: Monitoring, Research & Insight team Tel: 020 7901 7000 Email: [email protected] Overview: This document summarises the methodology used to calculate the Supplier Cost Index.

Welcome message from author
This document is posted to help you gain knowledge. Please leave a comment to let me know what you think about it! Share it to your friends and learn new things together.
Transcript

Ofgem/Ofgem E-Serve 9 Millbank, London SW1P 3GE www.ofgem.gov.uk
Supplier Cost Index
Methodology
Last updated: 09 March 2017 Team: Monitoring, Research & Insight team
Tel: 020 7901 7000
Email: [email protected]
Overview:
This document summarises the methodology used to calculate the Supplier Cost Index.

Supplier Cost Index
2
Contents
1. What is the Supplier Cost Index? 3 Overview 3 Calculating the Supplier Cost Index 3 What costs are included in the Supplier Cost Index? 5 Treatment of consumption 5
2. Data and methodology 7 Wholesale energy costs 7 Network charges 8 Charges associated with Government programmes 12
Appendix 1 – wholesale price assumptions 17
Supplier Cost Index
3
1. What is the Supplier Cost Index?
Overview
1.1. The Supplier Cost Index draws on publically-available information to estimate
ongoing trends in the main elements of costs that a supplier incurs in supplying a
typical domestic customer with gas and electricity. It shows whether industry costs
are rising or falling over time and what is driving this (ie the relative contribution of
wholesale prices, network charges and the charges to suppliers associated with
government programmes designed to, for example, support renewable electricity
generation and improve energy efficiency). In this way, it helps to improve
transparency as to the factors behind ongoing trends in energy bills.
1.2. The index reflects estimated expected annual costs, covering the 12 months
from the time of each update, based on the best information available at the time.
So, for example, the value of the index for January 2017 will reflect estimated costs
for the period 1 January 2017 to 31 December 2017, expressed relative to estimated
expected annual costs as of the base period (1 January 2014 to 31 December 2014).
BOX 1.1: What is an index number?
Index numbers are a way of displaying changes in a variable over time that help to
simplify comparisons. A base time period is chosen, and the value of the index at
that base is set to 100. At all other periods the value of the index number represents
the change in the series from the base period. For example, our index of suppliers’
expected costs for the coming 12 months might be set to 100 for 1 January 2015. If
suppliers’ expected costs increased by 2% in the following three months, then the
index number on 1 April 2015 would be 102.
1.3. As the estimates are forward-looking, they rely on forecasts and assumptions,
and so will be subject to uncertainty. Information on the actual costs that suppliers
incurred in previous financial years is available in the financial statements that we
require the six large energy companies to publish.
Calculating the Supplier Cost Index
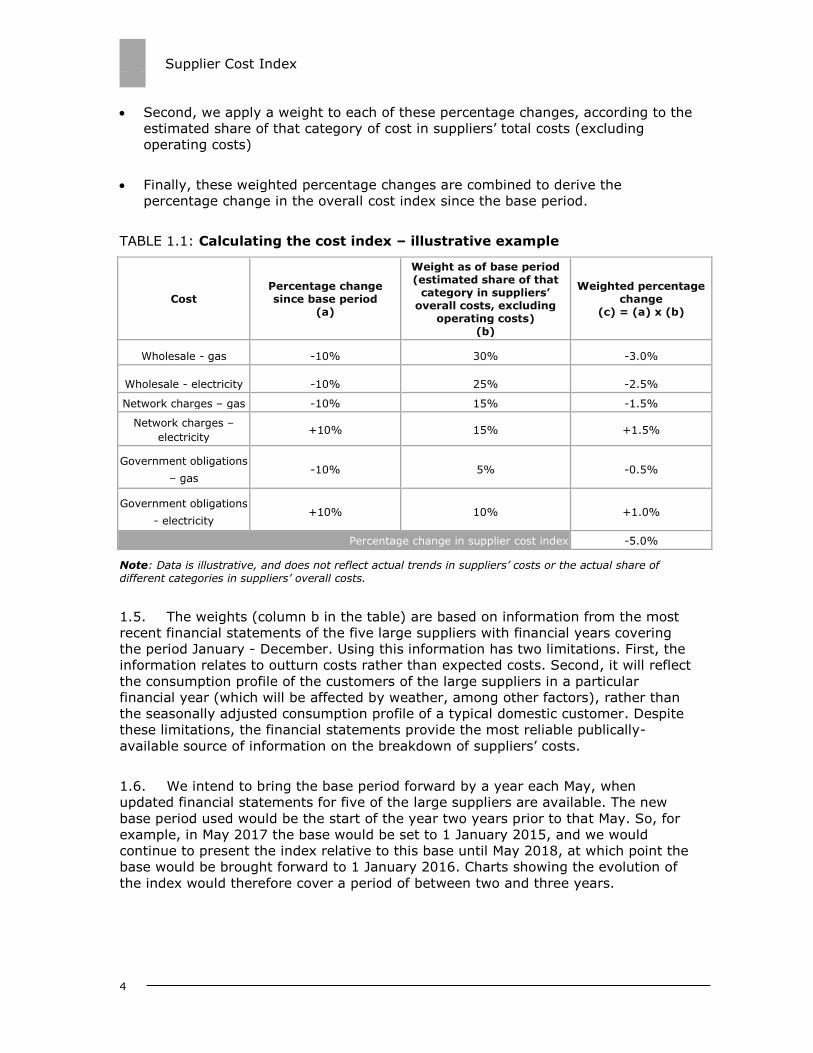
1.4. For a given month1, the cost index is calculated in three steps as follows (an
illustrative example is given in Table 1.1):
First, we estimate the percentage change relative to the base period in wholesale
costs, expected network costs and the expected costs of government obligations.
We explain how each of these elements of costs are estimated below
1 Although the index is updated on our website quarterly, it is calculated index at a monthly granularity, to provide greater insight into within-quarter trends in costs.
Supplier Cost Index
4
Second, we apply a weight to each of these percentage changes, according to the
estimated share of that category of cost in suppliers’ total costs (excluding
operating costs)
Finally, these weighted percentage changes are combined to derive the
percentage change in the overall cost index since the base period.
TABLE 1.1: Calculating the cost index – illustrative example
Cost Percentage change since base period
(a)
Weight as of base period (estimated share of that
category in suppliers’ overall costs, excluding
operating costs) (b)
Weighted percentage change
(c) = (a) x (b)
Wholesale - gas -10% 30% -3.0%
Wholesale - electricity -10% 25% -2.5%
Network charges – gas -10% 15% -1.5%
Network charges –
electricity +10% 15% +1.5%
Government obligations
– gas -10% 5% -0.5%
Government obligations
- electricity +10% 10% +1.0%
Percentage change in supplier cost index -5.0%
Note: Data is illustrative, and does not reflect actual trends in suppliers’ costs or the actual share of
different categories in suppliers’ overall costs.
1.5. The weights (column b in the table) are based on information from the most
recent financial statements of the five large suppliers with financial years covering
the period January - December. Using this information has two limitations. First, the
information relates to outturn costs rather than expected costs. Second, it will reflect
the consumption profile of the customers of the large suppliers in a particular
financial year (which will be affected by weather, among other factors), rather than
the seasonally adjusted consumption profile of a typical domestic customer. Despite
these limitations, the financial statements provide the most reliable publically-
available source of information on the breakdown of suppliers’ costs.
1.6. We intend to bring the base period forward by a year each May, when
updated financial statements for five of the large suppliers are available. The new
base period used would be the start of the year two years prior to that May. So, for
example, in May 2017 the base would be set to 1 January 2015, and we would
continue to present the index relative to this base until May 2018, at which point the
base would be brought forward to 1 January 2016. Charts showing the evolution of
the index would therefore cover a period of between two and three years.
Supplier Cost Index
5
What costs are included in the Supplier Cost Index?
1.7. The Supplier Cost Index tracks the three main categories of direct costs faced
by suppliers – the costs of wholesale energy; network charges and charges
associated with government obligations.
1.8. The index does not include suppliers' operating costs (such as the costs of
billing or metering – including the costs of the smart meter rollout). This is for two
reasons:
First, because they are largely within suppliers’ control, trends in these costs are
difficult to estimate from quarter-to-quarter using publicly-available data.
Second, we expect these costs to generally be less relevant from the perspective
of understanding pricing behaviour, because they are more likely to be supplier-
specific, and more likely to be fixed. While in the long term suppliers’ will seek to
cover their indirect costs in the prices they set, it is movements in industry
marginal costs which we would expect to primarily drive prices in a competitive
market.
1.9. We do, however, provide analysis of suppliers’ operating costs as part of our
annual analysis of the financial statements of the six large energy companies.
1.10. Note that, while the index will track broad trends in industry costs, the costs
of any one supplier may follow a different trajectory to the index. For example, the
index is based on trends in the average prices of wholesale gas and electricity
forward contracts in the month prior to the update. However in practice the approach
taken by different suppliers to purchasing energy varies considerably, with many
buying their energy on a rolling basis over longer periods of time. This means that
these suppliers will be to some extent insulated from increases in wholesale prices,
and less able to take advantage when wholesale prices fall.
1.11. Other elements of costs are also likely to vary across individual suppliers. For
example, suppliers may have some flexibility in how they meet their obligations
under government programmes. Network charges will vary between suppliers
depending on things like the regional profile of their customer base.
Treatment of consumption
1.12. The index is calculated for a customer with typical consumption, which we
have held fixed over time to increase comparability with trends in suppliers’ prices
(which are also typically expressed for a given level of consumption). Specifically, we
currently assume that annual consumption is fixed at medium typical domestic
consumption values (TDCVs) – currently 12,500kWh for gas and 3,100kWh for
electricity.
1.13. In fact, energy use will vary from one year to the next, depending on
temperatures. Energy use is also subject to long-run trends, for example as a result

Supplier Cost Index
6
of increasing energy efficiency. These trends in consumption will have a significant
impact on the size of customers’ bills, in addition to the impact of trends in prices.
Supplier Cost Index
7
2. Data and methodology
Wholesale energy costs
Wholesale market costs
2.1. The cost of buying energy is the largest element of suppliers’ costs,
accounting for around 43% of a dual fuel bill in 2015.2
2.2. Suppliers procure their energy by trading on the gas and electricity wholesale
markets. Vertically-integrated suppliers can also procure energy internally from their
upstream businesses. We use information on movements in wholesale gas and
electricity prices to estimate trends in suppliers’ expected wholesale costs for the
purposes of calculating the index.
2.3. Because wholesale gas and electricity prices can be volatile, suppliers typically
buy much of their energy requirement in advance of delivery to manage their risk – a
practice known as hedging. This raises the question of which wholesale price our
estimate of trends in expected costs should be based on, both in terms of which
products we should consider (eg energy for delivery the next day or the next month)
and at which point in time (eg the price of energy at the time of our update or the
price of energy six months prior to the update).
2.4. Approaches to hedging change over time and vary from supplier to supplier.
Suppliers also tend to use different approaches for domestic customers on different
types of tariffs. For example, energy for customers on standard variable tariffs
(SVTs) is often bought on a rolling basis over a long period of time, as much as two
or three years in advance of delivery. In contrast, suppliers are likely to purchase
energy for customers signing up to a fixed-term tariff closer to the time that tariff is
launched.
2.5. The CMA discusses the relationship between wholesale prices and suppliers’
costs in detail in its final report. It draws a distinction between forward energy
purchases made at the point at which a supplier becomes committed to supply a
customer at a given price (eg at the time of launching a fixed-term contract) and
forward purchases made before any such commitment exists (eg to reflect
anticipated demand for a SVT in a year’s time). It sets out its view that a prudent
supplier would seek to forward purchase energy to meet its contractual
commitments, so as to minimise its exposure to subsequent movements in wholesale
prices. However, by purchasing in advance of any commitment to supply at a given
price, a supplier risks paying more for wholesale energy than they could expect to
recover in a highly competitive retail market.
2 Based on CSS of large suppliers excluding SSE for financial year 2015. See this page for further details of our estimates of the breakdown of a dual fuel bill.
Supplier Cost Index
8
2.6. As a result, the CMA concluded that “historically incurred costs are not the
relevant basis on which Ofgem could infer trends in the strength of the competitive
pressure on retail prices including the SVT over time.”3 Instead, competitive prices
should reflect the opportunity cost of gas and electricity: the prevailing wholesale
prices of energy for future delivery at the point at which a supplier becomes
contractually committed to supply a customer at a given price (plus any additional
costs incurred closer to the point of delivery, for example in relation to shaping).
2.7. In the light of the CMA’s recommendation, we base the wholesale cost
element of our cost index on the price of wholesale gas and electricity contracts for
delivery in the coming 12 months as observed in the month prior to the date of the
update. In doing so, we use the following assumptions:
Wholesale prices are based on daily price assessment data taken from ICIS ESGM
report for gas and EDEM report for electricity. Prices used are the mid-points of
close-of-day bid-offer ranges for a variety of different forward products. We use
the average of these prices in the month prior to the update (eg average forward
prices in the month of December for an update in January).
We assign each of the 12 months in the year covered by the update a price based
on the average price of contracts for delivery in the coming winter and summer
seasons where available, or a combination of monthly and quarterly contracts
where a season has already begun. The specific contracts used for each month
are listed appendix 1.
Prices in each month are then weighted according to historic consumption in that
month. For electricity, estimated quarterly consumption are based on data from
government’s ‘energy trends’ publication4 for the previous calendar year. For gas,
estimated monthly consumption are based on Local Distribution Zone demand
data from National Grid5 for the same month in the previous calendar year.
We assume a split of 30% to 70% for peak to baseload contracts for electricity.
This is consistent with the value used by the CMA in calculating the wholesale
price index for the purposes of setting its prepayment price cap.
Capacity market
2.8. In addition to the costs suppliers incur purchasing electricity on the wholesale
markets, from autumn 2017 suppliers will also be required to make Capacity Market
(CM) payments. The CM was introduced as part of the government’s Electricity
Market Reform policy, and is intended to ensure that there is sufficient capacity to
meet the government’s reliability standard, by incentivising investment in generation
or demand-side response. This is needed to help secure electricity supplies for the
future, and thereby keep wholesale electricity costs down.
3 CMA Final report paragraph 18.132 4 https://www.gov.uk/government/collections/energy-trends 5 http://www2.nationalgrid.com/uk/industry-information/gas-transmission-operational-data/data-item-explorer/
Supplier Cost Index
9
2.9. Under the CM, the capacity needed in a given delivery year (running from 1st
October – 30th September) is secured through an auction four years ahead (T-4) and
another auction one year ahead (T-1) of the delivery year. In the auctions, parties
bid the price for which they would be willing to guarantee a given amount of capacity
in the event that the system is tight. The first T-4 CM auction was held in December
2014, for delivery in 2018/19. An auction for securing the entire capacity for delivery
in 2017/18 – the first year – was held in January 2017.
2.10. The aggregate payments for each delivery year are determined by the
clearing price of the auction multiplied by the agreed capacity. The regulations
require electricity suppliers to pay monthly charges to meet the cost of making these
payments to capacity providers, subject to a weighting factor outlined in The
Electricity Capacity Regulations 20146. The agreements for each auction are
published within 8 working days of auction closing by the delivery body, National
Grid7.
2.11. To estimate the expected costs to suppliers of the capacity market scheme,
we use the aggregate payment amount for a given delivery year as published by
National Grid. We derive the proportion of these payments falling to domestic
customers using an estimate of domestic electricity demand out of total demand in
peak demand periods during winter8, based on National Grid’s latest Future Energy
Scenarios9. We then calculate a monthly amount by dividing by 12 and adjusted to
reflect historic demand in each month, based on the monthly weighting factors
published by the settlement body. Finally, we divide by the total number of domestic
customers to derive a monthly £ per customer estimate of the expected costs
associated with the programme.
2.12. We add to this estimate the administration costs of the scheme, as projected
by BEIS. Trends in overall wholesale electricity costs are then derived by combining
this capacity market component with our estimates of the costs a supplier would
incur in the electricity wholesale markets.
Network charges
2.13. Suppliers are charged for the costs of building, maintaining and operating the
energy network and system infrastructure used to deliver energy to their customers.
Because the networks are largely monopoly businesses, we regulate the prices that
the network companies are able to charge by controlling the companies’ allowed
revenues. The network charges paid by suppliers vary depending on where their
customers live, what type of electricity meter they have and how much energy they
6 http://www.legislation.gov.uk/uksi/2014/2043/schedule/1/made 7 https://www.emrdeliverybody.com/CM/CMDocumentLibrary.aspx 8 We use the period of 17:30-18:00 on weekdays between November and February – as
described in National Grid’s Future Energy Scenarios – as a proxy for the use of 16:00-19:00 on the same days as described in the CM regulations. 9 http://fes.nationalgrid.com/fes-document/
Supplier Cost Index
10
use. In total, these charges accounted for approximately a quarter of a dual fuel bill
in 2015.10
2.14. Different charges apply for the high voltage/high pressure transmission
networks (which take electricity and gas around Great Britain) and the lower
voltage/lower pressure distribution networks (which connect customers to the
national transmission networks). As well as the charges to suppliers that are
considered in the Supplier Cost Index, electricity generators and gas producers will
also face charges for using the networks: it is important to note that trends in
network charges will therefore also affect suppliers’ costs indirectly via their impact
on wholesale prices.
2.15. The approach used to estimate trends in suppliers’ expected network costs for
our cost index is nearly identical to the methodology used to determine how the
network component of the prepayment price cap is set for gas customers and
electricity customers with unrestricted electricity meters (the exceptions being the
treatment of balancing system charges; the use of forecasts; and the fact that a
weighted average of regional charges is calculated). It involves combining publicly-
available charging information published by the network companies with assumptions
around domestic consumption.
Gas
2.16. Gas distribution charges in each Local Distribution Zone (LDZ) are set
annually for the period April to March by the individual network companies. Gas
transmission charges are set by National Grid twice a year, in spring and autumn.
Indicative notices are provided in advance of the new charges coming into force.
2.17. For both transmission and distribution, the charges comprise a set of
pence/kWh commodity charges and pence/kWh/day capacity charges:
To estimate total capacity charges per customer in each LDZ, we combine our
assumed level of annual domestic consumption per customer with information on
regional load factors (published by Xoserve) to produce an estimate of peak daily
load. This is then multiplied by capacity charges as reported in the most recent
charging statements. For transmission, capacity charges in each LDZ are
assumed to equal a weighted average of the charges in each exit zone within that
area (NTS exit capacity charges), as published by the gas distribution companies.
Weights are based on target capacity volumes, as published in the Gas
transporter licence conditions.
For commodity charges, we multiply assumed annual domestic consumption per
customer with the published charges (for transmission, the transportation owner
and system operator commodity charges published by National Grid and, for
distribution, the LDZ system commodity charges published by the gas distribution
companies).
10 Based on CSS of the large suppliers excluding SSE, for financial year 2015. See this page for further details of our estimates of the breakdown of a dual fuel bill.
Supplier Cost Index
11
The total annual charge per customer in each region is then calculated, before
taking a weighted average across regions, weighting according to the number of
domestic gas meter points in each region (based on data from Xoserve).
2.18. Our estimate of expected network costs is forward looking, covering the 12
month period from the time of the update. Where information on charges for future
periods is available we will therefore use this to estimate future network charges (for
example, with estimated expected network costs in July 2016 being a weighted
average of relevant charges for the current 2016-17 charging year, and for the
2017-18 charging year). Where forecasts of future network charges are not available
(ie in the period between April and the end of October, when indicative charges for
the coming year are published by the distribution companies), these will be assumed
to be equal to current charges.
Electricity
2.19. Electricity distribution charges for each Distribution Network Operator (DNO)
area are set by the distribution companies 15 months in advance of the charging
period (which runs from April to March). They comprise a unit rate paid per kWh, and
a fixed daily charge, which we combine with annual consumption and the number of
days in the year to derive an annual estimate of distribution charges per customer.
Different charges apply to customers on different types of meters: our estimates are
based on those for a customer with a standard, unrestricted meter (accounting for
around 80% of all domestic electricity customers).
2.20. Electricity transmission charges are set annually by National Grid for the
period April to March, with forecasts provided in advance of the final charges being
published. They constitute an energy consumption tariff (p/kWh), which we multiply
by an estimate of the proportion of annual consumption that takes place during peak
times (derived using profile class 1 consumption profile data provided by Elexon) to
estimate charges per customer. We scale up to account for regional losses in the
distribution system, estimated using the loss adjustment factors published by the
DNOs.
2.21. As with gas, we estimate total electricity network charges per customer by
taking a weighted average of the distribution and transmission charges across each
DNO. Weights are based on the number of unrestricted meter points in each area
less off-peak related meter points, taken from the DNOs’ Common Distribution
Charging Methodology models (see this page for further information).11
BSUoS
2.22. Balancing Services Use of System (BSUoS) charges cover the cost of services
used to balance the electricity system and internal system operator operating costs.
To calculate these charges, we use the latest annual £/MWh BSUoS charge data for
the current and following year as provided by National Grid. A £ per customer figure
11 The assumption here is that all of those off-peak related meter points will also have an unrestricted meter point (although note that this is not necessarily always the case, as some may have two rate meter points).
Supplier Cost Index
12
is then calculated using total consumption, scaled up for distribution and
transmission losses (estimated using National Grid’s transmission losses report and
the loss adjustment factors published by the DNOs respectively). The BSUoS charge
projections are sourced from National Grid’s monthly balancing services summary,
which includes projections of scheme outturn costs.
Charges associated with Government programmes
2.23. Charges to suppliers for government programmes made up about 7% of a
dual fuel bill in 2015.12 These charges fund schemes to support renewable and low
carbon generation, to support the installation of energy efficiency measures, and to
help vulnerable customers.
2.24. Note that the direct costs to suppliers in relation to these government
programmes reflect only a part of their overall impact on suppliers’ costs and
consumer bills. For example, the Energy Company Obligation supports the
installation of energy efficiency measures, which are expected to reduce energy
consumption and so lower bills.
2.25. Our approach to estimating the forward-looking costs associated with
government obligations varies from one scheme to the next. It is in all cases based
on publically-available information on either eligible suppliers’ obligations under the
scheme, or estimates of the overall scheme cost (often from published impact
assessments).
2.26. The nature of government programmes evolves over time, and a number of
suppliers’ obligations are currently undergoing changes. Given this, we are
committed to regularly reviewing our approach to estimating policy costs, ensuring
that our methodology draws on the best information available at any given point in
time. Therefore, while what we describe below is our current preferred approach to
estimating the costs of the different programmes, our approach for specific schemes
may change from one update to the next. In the event of such changes, we will
describe the methodology that has been used.
Renewables Obligation (RO)
2.27. The RO supports large-scale renewable electricity projects in the UK. It places
an obligation on UK electricity suppliers to source an increasing proportion of the
electricity they supply from renewable sources. The obligation is set annually by
Government. The obligation period runs from 1 April to 31 March and the obligation
level is published at least six months prior, by 1 October of the previous year.
Renewables Obligation Certificates (ROCs) are issued to operators of accredited
renewable generating stations for the eligible renewable electricity they generate.
ROCs can be traded between parties.
12 Based on CSS of large suppliers excluding SSE for financial year 2015. This excludes the impact of funding the warm home discount.
Supplier Cost Index
13
2.28. Suppliers can meet their annual obligation by presenting ROCs, making a
payment into a buy-out fund for each ROC that they do not present or a combination
of the two. The ‘buy-out’ price-per-ROC is set annually by Ofgem. The administration
cost of the scheme is recovered from the fund and the remainder is distributed back
to suppliers in proportion to the number of ROCs they produced in respect of their
individual obligation.
2.29. We estimate the cost of the RO scheme using the final buy-out price as a
proxy of the cost of a ROC faced by a supplier13. This buy-out price is multiplied by
the obligation level, to obtain a £/MWh cost14. This is then multiplied by our assumed
typical annual electricity consumption to arrive at a £/customer figure.
2.30. Our estimates of suppliers’ expected costs relate to the coming 12 months,
and so will generally comprise a weighted average of estimated RO costs for the
current and subsequent obligation periods. In the period before the following
charging year’s obligation level is set (ie between April and September), we base our
forecast of next year’s RO charges on the year-on-year change in the projections for
the total costs of the scheme as set out in the supplementary fiscal tables of the
Office for Budget Responsibility’s (OBR) ‘Economic and Fiscal outlook’15. In the period
after the following year’s obligation has been determined but before the buy-out
price is set (ie September to February), we use RPI forecasts prepared by the OBR to
project the following year’s buy-out price.
Energy Company Obligation (ECO)
2.31. ECO is a government scheme that requires suppliers with more than 250,000
domestic customers to deliver energy efficiency measures. The scheme was launched
in January 2013, with ECO running from January 2013 to March 2015. ECO2 is due
to end on 31 March 2017. The government has recently launched a consultation on
the future of the scheme up to 202216.
2.32. Within ECO and ECO2, suppliers are given targets for delivering energy
efficiency measures to domestic premises. These include the installation of insulation
and heating measures, a proportion of which must be delivered in rural areas or to
low income and vulnerable households. The size of a supplier’s obligation under the
scheme depends on its share of the domestic market.
13 Note that this will be an imperfect measure, as ongoing trading of ROCs can mean that the
costs incurred by a supplier in obtaining the appropriate number of ROCs may not be equal to the equivalent buy-out payment at the end of the obligation period. Additionally, the proportion of the buy-out fund that a supplier receives will affect their final cost. Nevertheless,
comparing the large suppliers’ realised RO costs per domestic customer with this approach suggests that using the buy-out price and obligation level provides a reasonable guide to trends in costs associated with the scheme. 14 DECC has recently consulted on exempting energy intensive industries from the RO and FiT schemes – if this proposal is taken forward, the RO obligation level for domestic customers will be scaled up to reflect the greater part of the obligation that they will take on. 15 http://budgetresponsibility.org.uk/efo/economic-fiscal-outlook-march-2016/ 16 https://www.gov.uk/government/uploads/system/uploads/attachment_data/file/531964/ECO_Help_to_Heat_Consultation_Document_for_publication.pdf
Supplier Cost Index
14
2.33. We estimate the expected cost of charges associated with the ECO scheme for
gas and electricity customers using information on the total projected scheme cost
taken from government impact assessments, splitting this in half, and then dividing
by the total number of gas and electricity customers of obligated suppliers,
respectively.
2.34. We note that suppliers have discretion over the timing of when they meet
their obligations during the obligation period. However, this will vary from supplier to
supplier, and is not something that we seek to reflect in our estimate of the trend in
charges associated with the ECO scheme.
Feed-in Tariffs (FiTs)
2.35. Under the FiT scheme, owners of small-scale renewable and low-carbon
electricity generation technologies are eligible to receive payments for the energy
that they generate and the electricity that they export back to the grid. To fund the
scheme, all licensed electricity suppliers are required to make payments,
proportionate to their share of the electricity supply market. These payments take
into account any payments the supplier has made to accredited installations under
the scheme.
2.36. As with ECO, to estimate the expected costs of this programme to suppliers,
we use the projected costs of the FiT programme as published in the most recent
government impact assessment, inflated accordingly to reflect current price levels
and then multiplied by the proportion of domestic consumption in total electricity
consumption17, divided by the total number of electricity customers.
Warm Home Discount (WHD)
2.37. The WHD scheme came into effect on 1 April 2011. It requires energy
suppliers with over 250,000 customers to provide direct and indirect support to fuel
poor customers over a four year period to 31 March 2015. The government recently
committed to extending it beyond that to 31 March 2021.
2.38. We estimate the cost of the WHD to customers of participating suppliers by
dividing the total anticipated cost of the scheme for each year18 by the number of
domestic gas and electricity customers of obligated suppliers, giving a £/customer
figure for a single-fuel customer. We then double this to derive a corresponding
figure for a dual-fuel customer. This approach is consistent with the way that
suppliers' obligations are calculated, according to their share of all domestic gas and
electricity customers (with dual fuel customers counted twice).
17 Based on government DUKES data. If government takes forward its proposed exemption of energy-intensive industries from the indirect costs of the FiTs scheme, these costs would be calculated based on domestic electricity consumption as a proportion of total consumption
excluding energy-intensive industries. 18https://www.ofgem.gov.uk/sites/default/files/docs/2015/03/whd_supplier_guidance_sy5_0.pdf

Supplier Cost Index
15
Contracts for Difference (CFDs)
2.39. CFDs are designed to give greater certainty and stability of revenues to low
carbon electricity generators by reducing their exposure to volatile wholesale prices,
while protecting consumers from paying for higher support costs when electricity
prices are high. The contracts are between generators and the Low Carbon Contracts
Company (LCCC). LCCC obtains the monies to make the required payments to CFD
generators via a compulsory levy on electricity suppliers. LCCC pays generators the
“difference” when the “reference price” for electricity is lower than the agreed “strike
price” set out in the CFD, and receives difference payments from CFD generators
when the reference price is higher than the strike price. The reference price is
calculated on the basis of the market price.
2.40. Suppliers are required to pay both a daily applicable Interim Levy Rate (ILR)
per MWh, as well as quarterly reserve payments to make up the Total Reserve
Amount (TRA). The ILR is determined by LCCC by dividing the total expected net
payments to generators in a given quarter by the total expected eligible supply19 in
that quarter. As the realised value of the payments to generators and eligible supply
may differ to the expected values, suppliers may make under- or over-payments,
which are then reconciled via a quarterly process. As supplier payments can be
subject to this uncertainty, the TRA is set and used to ensure that 19 times out of
20, LCCC has sufficient resources to make payments to generators.
2.41. We use the ILR to estimate the ongoing costs of the scheme. In particular, in
addition to the current quarter’s ILR, LCCC prepares forecasts of the ILR for the
coming three quarters. These rates are multiplied by an estimate of individual
consumption for each obligation period to provide a £/customer figure of the charges
suppliers face in that period. This is then totalled for the following 12 months to
derive the total per-customer charge.
2.42. Estimated consumption in each month is estimated by pro-rating total annual
consumption across the year, using historic information on quarterly electricity
consumption taken from government’s Energy Trends Statistics20.
2.43. Note that we do not take into account any impact on suppliers’ costs of non-
GB sources of renewable generation, or the cost of capital on the reserve fund. We
expect these exclusions to have only a small impact on our overall estimates of
suppliers’ CFD costs. We do, however, include the projected cost of the operating
cost levy, as published by BEIS.
Assistance for Areas with High Electricity Distribution Costs
2.44. The Assistance for Areas with High Electricity Distribution Costs (AAHEDC)
scheme was introduced in the Energy Act 2004. The scheme, previously known as
the “Hydro Benefit Scheme”, aims to reduce electricity prices in areas of high
19 Eligible supply refers to total electricity supply following the exemption of supply to electricity intensive industries. 20 https://www.gov.uk/government/statistics/energy-trends-december-2015

Supplier Cost Index
16
distribution costs and is currently specified for Northern Scotland only. Licensed
suppliers are obliged to pay to National Grid the tariff set out in their annual
Charging Statement.
2.45. The estimated cost per consumer for the scheme is calculated by multiplying
the charge per kWh, as published in the annual Charging Statement, with assumed
typical electricity consumption.
Supplier Cost Index
17
Appendix 1 – wholesale price assumptions
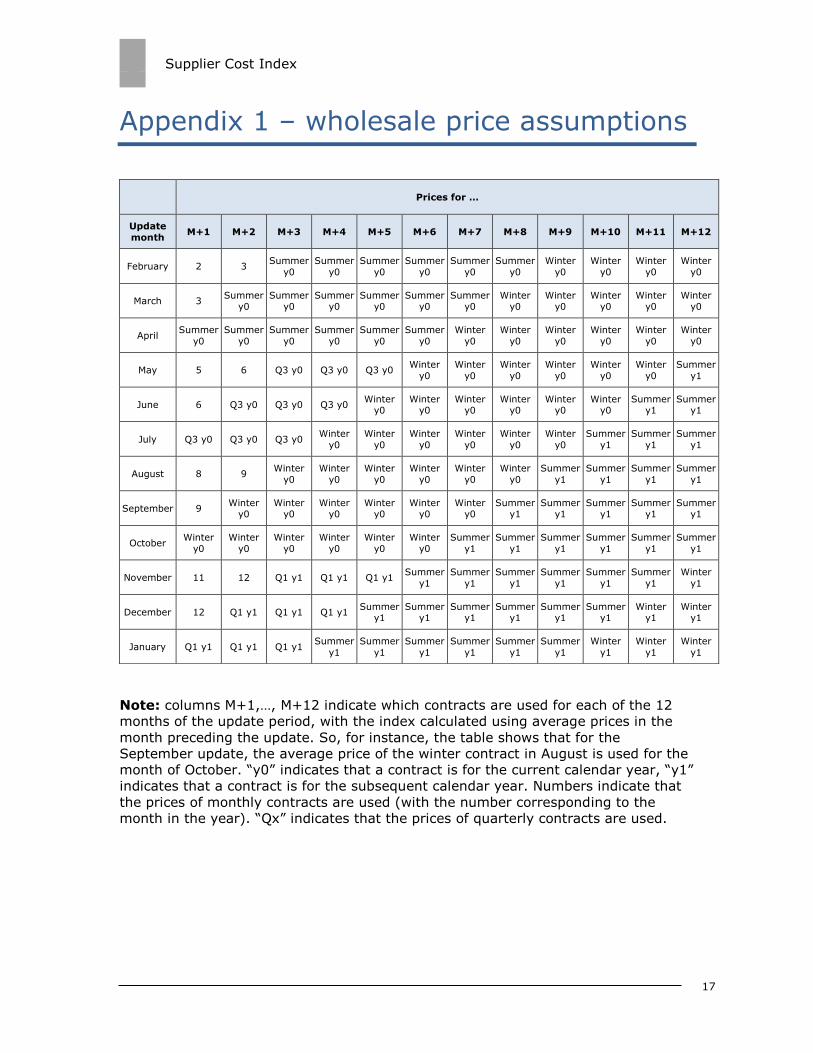
Note: columns M+1,…, M+12 indicate which contracts are used for each of the 12
months of the update period, with the index calculated using average prices in the
month preceding the update. So, for instance, the table shows that for the
September update, the average price of the winter contract in August is used for the
month of October. “y0” indicates that a contract is for the current calendar year, “y1”
indicates that a contract is for the subsequent calendar year. Numbers indicate that
the prices of monthly contracts are used (with the number corresponding to the
month in the year). “Qx” indicates that the prices of quarterly contracts are used.
Prices for …
Update
month M+1 M+2 M+3 M+4 M+5 M+6 M+7 M+8 M+9 M+10 M+11 M+12
February 2 3 Summer
y0
Summer
y0
Summer
y0
Summer
y0
Summer
y0
Summer
y0
Winter
y0
Winter
y0
Winter
y0
Winter
y0
March 3 Summer
y0 Summer
y0 Summer
y0 Summer
y0 Summer
y0 Summer
y0 Winter
y0 Winter
y0 Winter
y0 Winter
y0 Winter
y0
April Summer
y0
Summer
y0
Summer
y0
Summer
y0
Summer
y0
Summer
y0
Winter
y0
Winter
y0
Winter
y0
Winter
y0
Winter
y0
Winter
y0
May 5 6 Q3 y0 Q3 y0 Q3 y0 Winter
y0
Winter
y0
Winter
y0
Winter
y0
Winter
y0
Winter
y0
Summer
y1
June 6 Q3 y0 Q3 y0 Q3 y0 Winter
y0 Winter
y0 Winter
y0 Winter
y0 Winter
y0 Winter
y0 Summer
y1 Summer
y1
July Q3 y0 Q3 y0 Q3 y0 Winter
y0
Winter
y0
Winter
y0
Winter
y0
Winter
y0
Winter
y0
Summer
y1
Summer
y1
Summer
y1
August 8 9 Winter
y0
Winter
y0
Winter
y0
Winter
y0
Winter
y0
Winter
y0
Summer
y1
Summer
y1
Summer
y1
Summer
y1
September 9 Winter
y0 Winter
y0 Winter
y0 Winter
y0 Winter
y0 Winter
y0 Summer
y1 Summer
y1 Summer
y1 Summer
y1 Summer
y1
October Winter
y0
Winter
y0
Winter
y0
Winter
y0
Winter
y0
Winter
y0
Summer
y1
Summer
y1
Summer
y1
Summer
y1
Summer
y1
Summer
y1
November 11 12 Q1 y1 Q1 y1 Q1 y1 Summer
y1
Summer
y1
Summer
y1
Summer
y1
Summer
y1
Summer
y1
Winter
y1
December 12 Q1 y1 Q1 y1 Q1 y1 Summer
y1 Summer
y1 Summer
y1 Summer
y1 Summer
y1 Summer
y1 Winter
y1 Winter
y1
January Q1 y1 Q1 y1 Q1 y1 Summer
y1
Summer
y1
Summer
y1
Summer
y1
Summer
y1
Summer
y1
Winter
y1
Winter
y1
Winter
y1
Related Documents