Cost of Living Index Manual Published by The Council for Community and Economic Research (C2ER) Section 1: Introduction Section 2: How to Price Section 3: How to Use the Index Section 4: Appendixes Appendix 1: How the Index Was Developed Appendix 2: Sample Index Calculation Appendix 3: Sample Pricing Letters Appendix 4: Grocery Store Pricing Form Appendix 5: Pricing Survey Form (Includes All Items) Revised December 2015 P.O. Box 100127, Arlington, VA 22210 Phone: 703-522-4980, Fax: 480-393-5098 www.coli.org

Welcome message from author
This document is posted to help you gain knowledge. Please leave a comment to let me know what you think about it! Share it to your friends and learn new things together.
Transcript

Cost of Living Index
Manual
Published by
The Council for Community and Economic Research (C2ER)
Section 1: Introduction
Section 2: How to Price
Section 3: How to Use the Index
Section 4: Appendixes
Appendix 1: How the Index Was Developed
Appendix 2: Sample Index Calculation
Appendix 3: Sample Pricing Letters
Appendix 4: Grocery Store Pricing Form
Appendix 5: Pricing Survey Form (Includes All Items)
Revised December 2015
P.O. Box 100127, Arlington, VA 22210
Phone: 703-522-4980, Fax: 480-393-5098
www.coli.org
1.1
SECTION 1: INTRODUCTION
Welcome to the Cost of Living Index!
Published by the Council for Community and Economic Research (C2ER) since 1968, this survey is the premier source of data on living cost differentials among U.S. urban areas. As an active participant, your organization will receive at no cost a PDF copy of the Cost of Living Index survey each quarter.
The Cost of Living Index is a service that C2ER, the professional association of community and economic development re-searchers, makes available to all urban areas. Because C2ER offers much more than just the Cost of Living Index, we urge all participants to join C2ER and share the benefits of membership.
For more information about C2ER, write to C2ER, P.O. Box 100127, Arlington, VA 22210 or visit us on the web at www.c2er.org.
Why Not Use Free Internet Data? In recent years, several Internet sites have be-gun to offer free cost of living comparisons. For the most part, these are “black box” calculations you have no idea what data go into them, where they come from, what quality control procedures (if any) are involved, how reliable they are, what methodology was used, or what standard of living is represented. In some cases, it appears that C2ER data have been appropriated for indefensible calculations, such as creating an index for a particular city that doesn’t participate in the Index by constructing a weighted figure based on that city’s distance from three cities for which C2ER data do exist. C2ER has requested details from several such sites without receiving an acceptable response. Our requests are almost always ignored. If you don’t care how good the data are, then these sites are for you.
The Cost of Living Index is different. Our methodology, our data collection and quality control procedures, the formulas used in our calculations, and the average prices on which those calculations are based are all published.
Unlike other data providers, C2ER does not believe data users are well-served unless they understand the methodology used in the data analysis.
When your organization assumes responsibility for collecting data for the Cost of Living Index, you know you can trust the data for your area and, because data for all participating places are subjected to the same intense scrutiny in the data review phase of this project each quarter, you know you can trust the data for other places, as well.
What's In This Manual? This manual is far more than just a set of direc-tions. It’s laid out in four sections, each with its own purpose:
Introduction: This section discusses broad guidelines that govern the Cost of Living Index, outlines quality control procedures that ensure the published data are as accurate as possible, and lays out your responsibilities as a participant.
How to Price: Be sure to read this entire section carefully before you begin data collection. It presents, in detail, the “nuts and bolts” of collecting price data the procedures and specifications every participant must follow rigorously. It’s lengthy partly because some items involve complex instructions, but mainly because we’ve tried to anticipate and answer as many questions as possible about unusual situations. We’ve also included helpful tips to make pricing easier.
How to Use the Index: This section gives you the background you need to understand the Cost of Living Index and to use the data effectively and properly. You have to know what the Index does and doesn’t measure if you’re going to use it in your economic development program, in promoting your re-gion, or in dealing with inquiries about cost of living differences.

1.2
Appendices: You don’t need to study and ab-sorb the appendices as you do the first three sections, but you’ll find much of interest and probably a few items you’ll want to use right away. The appendices are a mixed lot:
A brief history of the Index, so you can see how this project has evolved over more than three decades.
A sample calculation that shows you how the raw data are converted into index numbers.
Sample letters for apartment pricing and house purchases.
A sample of the pricing survey form you will complete each quarter.
A Specific Standard Of Living The question the Cost of Living Index is designed to answer is: How do urban areas compare in the cost of maintaining a standard of living appropriate for moderately affluent professional and managerial households?
The first thing to note about this question is that it’s not at all the same as comparing average standards of living. The Index is designed to compare the costs of a particular standard of living in all areas—and it doesn’t matter wheth-er that standard of living is typical of the overall population of your area.
Over the first three decades of this project, the standard of living priced for the Index was termed a “mid-management” standard of living. That term was dropped in 1998 because it was too easily confused with “middle class,” which isn’t the same thing at all. The kind of house-hold on which the Cost of Living Index is based has the following characteristics:
The household consists of both spouses and one child. (For pricing apartments, it is as-sumed that the couple is childless or the indi-vidual is single.)
Both spouses hold college degrees; at least one has an established professional or mana-gerial career with a record of growing respon-sibility and authority, and is salaried rather
than paid by the hour. (Most executives in this category supervise other salaried employees, although some may supervise only hourly employees. Examples of the latter include partners in small CPA or law firms, tenured university faculty, and some owners of small businesses.)
Household income is in the top quintile (20%) for the area. Because salaries vary geographically as a function of living cost differences (which is a key reason this project exists), we can’t specify a particular salary range that fits all locales. However, in most parts of the country in the 21st century, the specified household will generally have an annual income between $70,000 and $100,000. The appropriate income range will be higher in traditionally high-cost places like New York, Boston, San Francisco, Los Angeles, and San Diego metropolitan areas, and it will often be somewhat lower in small metropolitan or non-metropolitan places.
Your selection of samples for all items in the Index should be guided by what’s typical for professional and managerial households in the top income quintile. Some examples:
Select only grocery and apparel stores where individuals from professional and managerial households would normally shop. Even if discount stores are a majority of your overall market, they shouldn’t be in your sample at all unless upper-income professionals and executives really shop there.
Price housing only in areas where such households would live.
Price hair care, dry cleaning, movies, and other personal services only at establishments such households patronize.
When you select the sample of establishments for each item, make sure it accurately reflects the purchasing patterns of moderately affluent professional and managerial households.
What Geographic Area Should You Cover? Earlier editions of this manual said nothing about the geographic area participants are ex-pected to cover. For more than 20 years, the In-
1.3
dex was called an “intercity index” but this term more often than not was misleading, since seldom were the data restricted to city limits.
Today, participants in federally designated Metropolitan Statistical Areas (MSAs) most often gather data for the Urbanized Area, which the Census Bureau defines as that area in an MSA where the density of residential settlement is at least 1,000 persons per square mile. Suburban participants usually cover some portion of the Urbanized Area frequently a county.
You’ll notice that this manual speaks of urban areas. This term parallels the Census Bureau’s “Urbanized Area,” but takes into account the fact that some participating areas aren’t inside MSAs. In published reports, “Urban Area” re-places the earlier “City,” reflecting this notion.
As a practical matter, you should price the ur-banized portion of your metro area or place.
For organizations in central cities of metro-politan areas, this approach means covering the entire Urbanized Area within the MSA.
For suburbs within MSAs, coverage of the service area defined, on the basis of where residents realistically purchase goods and services is appropriate, even if the result is coverage that overlaps areas covered by other participants. Samples for Scottsdale, for ex-ample, may well include establishments in Phoenix.
For participants in non-metropolitan areas, coverage of the “urban area” based on popu-lation density, rather than adherence to the city limits, is what’s intended.
Be sure the place name you use on the price report reflects the area covered.
If your report covers the entire Urbanized Area within your MSA, your place name should be your metropolitan area name (e.g., Charlotte-Gastonia-Rock Hill NC-SC MSA).
For central cities and suburban areas that cov-er no officially-defined area, city name suf-fices (e.g., Scottsdale AZ, for which samples may extend beyond the city limits).
Where pricing covers the urbanized portion of an entire county, either county name alone or city/county name should be used (e.g., “Lincoln County OR”, “Watertown-Jefferson County NY”).
Where multiple areas are covered and are known by a single geographic name, that name is appropriate (e.g., “Hampton Roads/SE Virginia,” “Quad-Cities IL-IA”).
Can Any Place Participate? For 23 years, participation in the Cost of Living Index was open to all places, regardless of size. In the late 1980s, however, several rural places with very small populations began participating, and it became apparent that adherence to the specifications in many such places wasn’t possible. There’s no doubt that small rural places offer an alternative to an urban professional or managerial standard of living that many people find attractive, but such places are qualitatively different from urban areas, and they simply don’t support the kind of urban lifestyle embodied in the Cost of Living Index.
The Committee has concluded that participation in the Index should be restricted to areas that can reasonably be considered urban and patterned its restrictions after the federal government’s distinction between urban and rural areas.
The Cost of Living Index Committee adopted the following restrictions, effective June 1991 (including modifications adopted and effective June 1999):
Participation in the Cost of Living Index is open to all places within federally designated Metropolitan Statistical Areas in the United States.
Participation by places outside MSAs is re-stricted. A city in a non-metropolitan county may participate if the county population ex-ceeds 50,000 and if the population of the city to be priced exceeds 35,000.
Acceptable documentation that the population criterion has been met includes decennial and special census tabulations.
1.4
Places that don’t meet the population criterion but were participants at the time the criterion was adopted may continue to participate. How-ever, if any such place fails to participate in two consecutive quarters, it is not eligible for further participation.
No non-metropolitan area may exceed a single county or county equivalent in geographic ex-tent unless substantial evidence is submitted that two places function as an integrated eco-nomic unit that happens to be divided by a county boundary. Such cases are rare.
How Do We Know The Data Are Ac-curate? Regardless of how conscientiously participants follow this manual, errors are inevitable. In a fairly typical area, we may find two people re-cording prices for 30 items at three grocery stores apiece, two other people calling a total of 140 establishments to obtain prices for 27 non-grocery items, and 15 sources responding by mail or fax or e-mail with information on hous-ing costs and mortgage rates. Multiply this sin-gle area by the number of participants in a typical quarter, and you’ll find 80,000-90,000 opportunities for mistakes, a McDonald’s cashier who quotes a price including sales tax, even though you expressly asked for the price without tax . . . or a grocery clerk who posts an erroneous price . . . or a homebuilder who simply decides to price the kind of home his firm normally builds, rather than follow the specifications you mailed to him.
THIS IS IMPORTANT: You are the first line of defense. While reviewing your data prior to submission, you can, and should, spot and investigate prices that for any reason look out of line. If you either correct errors or provide explanations for unusual prices, you can avoid questions during the review process and that saves time for you and the reviewers.
Over the years, the committee has developed a meticulous three-stage review process to ensure that published price data are accurate. This process is for your own protection: not only can it ferret out inadvertent errors in the report for your area; it also protects you from erroneously
high or low index figures as a result of someone else’s error.
In the first stage, each data reviewer looks for four things in the reports from his states:
Computational errors.
Atypical prices for an item.
Unexpected quarter-to-quarter shifts in aver-age item prices.
Averages that are unusually high or low with-in the region.
Questions that can’t be answered from docu-mentation you provide are referred back to you for verification or correction.
In the second stage, data reviewers review each report in detail and check any problematic price not already verified in the first stage.
After questions at this stage have been resolved, a preliminary computer run is prepared. This printout puts an asterisk beside any price more than two standard deviations from the nationwide average.
In the third and final stage, the project manager uses the preliminary printout to identify prices that seem out of line within the state or region.
As a result of such thoroughness, it’s unusual for any participant’s report to pass from submission to publication without questions. Nearly all participants can expect questions at the first stage; about 75% will be questioned at the second; and at least 25% generally receive further questions at the third. Only after all questions have been resolved is the final report prepared for publication.
Sales and Promotion Plan The cost of producing the Cost of Living Index is supported entirely by subscriptions. It has no other source of funding. For this reason, you are expected to provide subscription information to potential subscribers.
The annual subscription is $165. Single issues may be purchased for $82.50 per copy. Electronic subscriptions (Excel format) are
1.5
available for $250 (for electronic only) and $295 (for a combined print and electronic subscription). A single electronic issue is available for $95. All checks should be made payable to C2ER.
Orders may be placed by fax to the C2ER Subscription Office at 480-393-5098, using the order form inside the back cover of the Cost of Living Index, or by completing the subscription form at www.c2er.org.
Copyright Policy Each issue of the Cost of Living Index is copyrighted. Because subscription income is crucial to continued production of the Index, C2ER permits only limited republishing:
Paper Reproduction:
Making any reproductions or otherwise printing the entire Index report or any part thereof for sale is expressly prohibited without prior written permission by C2ER.
News media are permitted to use Index data in editorial form, and are permitted to reproduce tables in part to illustrate text, provided C2ER is given appropriate credit. They are granted no other reproduction rights.
Requests to reproduce Cost of Living Index data in publications not covered by the foregoing policy statements should be addressed to the director, and will be considered on a case-by-case basis.
Internet:
Participants in and subscribers to the Cost of Living Index may make available on their home pages all index data for their urban area and places for which data are presented in C2ER’s quarterly “boilerplate” press release and for no more than five ad-ditional places. Any such presentation of data must include a hypertext link to C2ER (www.coli.org).
No price data from the Cost of Living Index may be placed on the Internet without written permission from C2ER.
Internet versions of print periodicals are permitted to use Index data in editorial form, and are permitted to reproduce tables in part to illustrate text, provided C2ER is given appropriate credit.
Requests to reproduce Cost of Living Index data on the Internet in applications not covered by the three foregoing policy statements should be addressed to the director, and will be considered on a case-by-case basis.
2.1
SECTION 2: HOW TO PRICE
Your Responsibilities As A Participant
When you decide to participate in the Cost of
Living Index, you accept several obligations:
Select samples that accurately represent the
behavior of professional and executive
households in your area. This means not on-
ly selecting appropriate establishments, but
also selecting large enough samples to pro-
vide confidence that the average for each
sample is fairly close to the average you’d
have found by sampling all establishments in
your area that meet the criteria.
Know the pricing dates. While your data
reviewer will send you a reminder notice and
the price report form well before each pricing
period, occasionally an e-mail goes astray. Be
prepared to price without receiving a notice.
Pricing dates are always the second Thursday,
Friday, and Saturday of January, April, and
July unless those dates include or abut a
federal holiday. When a holiday conflicts, the
first Thursday, Friday, and Saturday of the
month are used.
Review the price data carefully before sub-
mitting them to your data reviewer. Your
review involves three elements:
Check all calculations for accuracy.
Examine the price distribution for each item
to flag and recheck any prices that look out
of line. For example, if you see milk prices
of $1.40, $1.41, $2.35, $1.38, and $1.42, it’s
a safe bet there’s a problem with the $2.35,
its probably a full gallon instead of a half-
gallon. Where atypical prices are correct,
include a note of explanation for your data
reviewer.
Maintain your own log of average prices by
quarter. Recheck prices that show unusual
quarter-to-quarter changes (for example, a
10% drop in home purchase price), and in-
clude an explanation if you find they’re cor-
rect.
Submit your report by the deadlines published
on the website. Late reports may be excluded.
If you can’t obtain one or two prices by the
deadline, submit your report and note when
the missing prices will follow. If the deadline
itself presents a problem, contact us about a
waiver.
Respond promptly to questions from your
data reviewer and the project manager.
Questions on price data are not arbitrary,
reviewers would much prefer not to have to
ask questions about the data, since every
question means extra work for them as well as
for you. When data reviewers pose questions,
they usually suggest the nature of a suspected
problem. Give them the courtesy of replying
as quickly as possible.
Since delays in responding increase the time
between data collection and publication and
are unfair to other participants, failure to re-
spond to questions on price data is grounds
for deleting a report from the database. If
you’re having problems getting the additional
information that’s been requested, let the per-
son who raised the question know.
Always reply to the person who raised the
question. If the project manager questions an
item, don’t reply to your data reviewer.
Keep all documentation until you receive
the published report for that pricing per-
iod. At any point during the data review, you
may be asked to substantiate or reexamine the
price for a particular item, and you’ll need to
have the original data available.

2.2
Respond to calls and letters requesting Cost
of Living Index data. After studying Section
3 of this manual, you should be able to handle
all but the most technical of data requests, and
you shouldn’t need to refer callers to C2ER.
GENERAL PRICING PROCEDURES
Before turning to the detailed specifications and
procedures for pricing individual items, let’s look
at some fundamentals that apply to the entire
pricing process. We’ll begin with two basic rules:
Re-price all items each quarter during the
three-day pricing period. Never assume that
a price is unchanged from the prior quarter,
and always obtain prices for the specified
dates. Prices can shift rapidly, so even a day
later can make a difference.
Price all items strictly according to the
specifications in this manual. The validity of
the Index depends on using the same standard
of living everywhere, and any departure from
the specifications is a shift in standard of
living.
Setting Up Responsibility for Pricing
To make sure that prices in your area are
collected properly and submitted on time, you
need to have someone designated to coordinate
the process. That person (quite possibly you)
should have sufficient seniority and experience to
deal on at least equal footing with those who
provide information to you. For example, calling
a general contractor to question whether a 15%
drop in her estimate of the house purchase price
is realistic.
Whoever coordinates your area’s pricing should:
Supervise other staff and/or volunteers who
collect or supply price data, ensuring that they
adhere completely to the procedures and
specifications in this manual.
Inspect the prices for each item, rechecking
any that appear to be inconsistent with the
others or with prices reported in the previous
quarter. This review should be conducted as
soon as prices have been collected: it’s much
easier to recheck a January 5 price for corn
flakes on January 7 than it is two weeks later.
Review all computations for accuracy.
Review samples each quarter to ensure that
they continue to reflect professional and
executive spending patterns. (If a theater shifts
from showing first-run films to showing older
films at discounted rates, for example, it should
be removed from the sample.)
Submit your data by the presented deadline to
your data reviewer.
Maintain a file with all raw data for each
pricing period, so questions raised in the data
review can be answered quickly and correctly.
(Keep all raw data at least until you receive
the published report for the quarter.)
How to Obtain Price Data
There are three major ways to obtain prices:
letter/fax/e-mail, phone, and personal visit. No
one method can be used efficiently for all items
and some methods are better than others for
particular items or groups of items.
Telephone is the least efficient way to price
items in the Grocery Items Index, and is the
most susceptible to erroneous reporting. Its
use is not recommended for these items.
Telephone, however, is usually the most
efficient way to obtain prices for many items
in the Transportation, Health Care, and
Miscellaneous Goods & Services Indexes.
For those items you decide to price by
telephone, set up a master form listing
contacts and telephone numbers. If you set
this form up as a word processing document
or a spreadsheet, you can make revisions
easily and produce a clean updated copy each
quarter. The person who calls for prices can
follow the list and fill in the price reported by
each respondent. Make sure the items appear
in the same sequence as on the price report.
This makes it easier for your data reviewer to
review your data.
2.3
Mail, fax, or e-mail often work well for the
two housing items. Send a letter about 10 days
before the pricing period to sources that have
agreed to cooperate in your survey. The house
purchase letter should be accompanied by a
list of house specifications for your area; the
apartment letter can include apartment
specifications in the text. Whenever you price
by mail, a postage-paid reply envelope is an
appreciated courtesy.
When you price utilities, be sure to deal with a
utility company rate engineer or supervisor
who has the expertise to follow the
specifications. Smaller cities may find a utility
company’s regional offices more helpful than
its local office.
Fax and mail sometimes work well for the
doctor and dentist items, and you have the
assurance that the specifications have been
stated properly because you sent them in
writing.
Personal visit is indisputably the best way to
collect prices for the Grocery Items Index and
the three apparel items, and is strongly
recommended. We’ve conducted comparison
tests in which the same stores are priced by
mail and by personal visit for the same dates,
and the results indicate significant gains in
accuracy with personal visit.
How Many Establishments Do You
Need to Price?
Participants in metropolitan areas must price at
least five establishments for every item that isn’t
a monopoly. Larger metropolitan areas should use
larger samples: 10 would be a reasonable sample
size if the population of the area surveyed were
over 1,000,000.
The Council for Community and Economic
Research (C2ER) requires nonmetropolitan places
to price at least three establishments for each
item, unless of course a community has fewer
than three establishments that provide the item or
service and meet the criterion of suitability for a
professional or managerial household. This
minimum applies only to small rural areas.
Any report with samples smaller than three in
nonmetropolitan areas or five in metropolitan
areas may be rejected.
Note that samples smaller than five are
acceptable when fewer than five establishments
qualify. If only two or three establishments
normally patronized by professional and
managerial households exist in an area, then a
survey of just those two or three is a 100%
sample of qualified establishments, and you
should not try to expand the sample by adding
nonqualified establishments. (If you have a
sample smaller than five for this reason, be sure
to note it on your worksheet.)
Our insistence on adequate sample size reflects
the importance of ensuring that the average price
for a sample of establishments is a reasonable
approximation of what we’d find by surveying all
appropriate establishments. Consider a sample of
three clothing stores with respective dress shirt
prices of $24.99, $22.99, and $15.99:
In a town of 50,000 people, the store with the
special may well represent a third of the
market, and the sample average of $21.293
would be close to the result we’d get from
surveying all appropriate stores.
In a metropolitan area of 500,000 people,
where perhaps 60 to 90 clothing stores would
meet our mid-management guideline, the odds
that the average of $21.293 accurately
represents the market are considerably poorer.
A larger sample is needed if we’re to make
that determination. If the special is really
representative, a valid sample of nine stores is
likely to contain three such specials—but if
the special is an isolated case, it won’t unduly
distort the average.
2.4
It bears emphasizing that five establishments is a
minimum in metropolitan areas. By no means
will a sample of five establishments always
suffice to produce accurate data. The more
establishments that offer a given commodity or
service, the larger your sample should be for that
item: if you sample 10 of 50 dry cleaning stores,
the odds are considerably better that you’ll
closely approximate the true mean than if you
sample just five. Remember, the larger your
samples, the more accurate your averages are
likely to be.
How can you tell whether your sample is large
enough? One good guideline is to examine your
price for each item over time. To illustrate how
this works, consider these hypothetical prices for
a barbershop haircut in two different urban areas
over several quarters:
MSA A: $9.20, $9.22, $9.35, $9.45, $9.60, $9.68
MSA B: $9.25, $7.90, $8.58, $9.50, $8.54, $9.75
The price data for the two areas clearly behave
quite differently. In MSA A, we see a gradual rise
over time that’s consistent with what we’d expect
as a result of inflation. In MSA B, on the other
hand, the price fluctuates erratically from one
quarter to the next. The kind of price behavior
shown for MSA B is possible but unlikely.
If we assume that “true” haircut prices in MSA B
didn’t really behave the way the sample data
suggest, there are at least three possible
explanations for the ups and downs:
The sample may not be large enough. When a
sample is too small, the effect of an atypical
price from a single establishment is magnified.
If five shops are sampled, and one of these has
just increased or lowered its price, the impact
of this change on the average price will be
relatively large and the resulting average may
not accurately represent local prices. The
larger the number of establishments in a
sample, the smaller the impact of any unusual
price.
The sample may have been changed from one
quarter to the next. While it’s not essential
that the same establishments be sampled each
quarter, gathering data from the same
establishments each time is a good idea for
two reasons. First, your prices will behave
consistently over time. Second, you get better
cooperation from your sources because they
know what you’re doing and what kind of
information you need.
If your sample is large, a change in the
establishments sampled usually won’t distort
the average significantly. In a small sample, a
change in establishments can produce wild
fluctuations from one quarter to the next.
Note that using the same sources each time
produces only consistency, it doesn’t mean
that the results accurately reflect area wide
prices. For accuracy, you need to make sure
your sample for each item is large enough to
reasonably reflect prices in your area.
The specifications may not have been followed
consistently from one quarter to the next.
When one finds price movements that look
like MSA B’s haircut prices, much of the time
it’s a good bet that somebody didn’t follow
the instructions. It’s up to the person
supervising this project for your organization
to spot and rectify departures from the
specifications.
Helpful hint: Two items tend to vary widely
within an area, doctor and dentist visits. For these
two items, you routinely should use larger
samples than you use for other items.
For most items, prices will rise gradually as a
result of inflation. Only regulated prices are likely
to remain constant for any length of time.
Downturns occur occasionally, but you should
check any unexplained downturn in non-grocery
prices to make sure it represents an actual price
movement rather than problems in your sample,
your data collection procedures, or your
calculations.
A good way to keep tabs on price trends is to
record data for several quarters on a single sheet.
A glance at the line for any item can tell you if
your pricing procedures might profit from sample
changes. If your samples are large enough and
your sources are reasonably consistent from one

2.5
quarter to the next, most of your price lines will
resemble the data shown above for MSA A.
Bargains
Because the Cost of Living Index is a “snapshot”
of how prices compare at a single point in time,
“specials” should be reported. They’re a valid
part of the cost of living at that particular time.
When you find “two-fors” or similar specials,
report the price you would pay for just one of
the item.
If peas are two for $.99, report $.50 as the
price for peas in that store.
If the first pizza is $8.99 and all additional
pizzas are $5.00, report $8.99.
Note that you should prorate when the specified
size isn’t available. If a store has no 5-lb. sacks
of potatoes but does carry the 10-lb. sacks at
$5.99, report $5.99*5/10, or $2.99, as the price
for the 5-lb. sack.
Reporting Prices
One of the most recent and innovative changes
to the cost of living data collection process is
the implementation of a new web-based Cost of
Living Index Price Collector software.
To use the web-based Cost of Living Price
Collector software follow these simple
instructions:
(1) Go to www.coli.org/participants.asp
(2) Download a hard copy or electronic
versions of the full pricing survey. Please
take note of the Helpful Hints.
(3) Click: Login Page
(4) Enter your User ID and Password to
access the site. If you've misplaced your
user id and password, please click on the
“Forgot Your Password” link.
(5) Click: Edit My Profile to update your
profile. The "primary" contact should
always be the person who is collecting
the data. The "alternate" contact may
either be your boss or a colleague who is
helping you with the data collection
process. We contact this alternate person
only if we cannot reach you with
questions or feedback.
(6) Click: Register for a Quarter to
indicate whether you plan to participate
in the pricing survey. Click on “Add
Me”, to activate your record for the
current quarter. If you do not plan to
participate, please let us know by
clicking on “No.”
(7) Click: Edit Store Names: Add the
names of the grocery stores you visited or
plan to visit.
(8) Click: Input Prices to enter your pricing
data for each category. At the end of
each question, make sure you click the
gray button bars to save your work.
When answering questions, you don't
have to finish answering your questions
in one sitting. You can come back later
and finish. Please remember to click:
Log Out when you leave a session, and
note that your link with the main
database expires if you don't do anything
for 20 minutes. In this case, you must log
on to the web site again.
(9) Click: Submit Prices to C2ER for
Review. This automatically tells your
data reviewer that she or he should begin
reviewing your answers. This also
"locks" your answers (meaning you can
no longer change them without
permission).
(10) Click 5. Run Final Report (Save &
Print). Save your report as a “html” on
your computer's hard drive. This will
provide you with a static version. You
can later open it in Microsoft Excel.
2.6
How Often Should You Price? The Cost of Living Index data is gathered 3
times a year - January, April, and July. The
index is published four times annually in May,
July, and October – the fourth issue provides an
annual average of data from the urban areas
providing a complete set of data during the year.
The annual average report is published in late
December. By participating in all three data
collection periods, your area will be included in
the annual average publication. This
publication is provided to the US Census Bureau
for publication in the Statistical Abstract of the
United States.
Reporting Procedures
About two weeks before the pricing period, the
project manager will send you a memo noting the
pricing dates, warning you of any changes in
marketing practices that could pose problems
(such as a new size of coffee that looks similar to
the size specified), and advising you of any
changes to item specifications.
All prices are subject to review by C2ER. If your
data reviewer questions a sharp drop in the
telephone price, for example, don’t expect him to
deal directly with your source to resolve the issue.
It’s your responsibility to price your own area
and to submit a complete and accurate price
report.
Note that you must complete the price report in
full:
If your report omits any prices (other than
alcoholic beverages for “dry” cities, apartment
rent in nonmetropolitan areas, and non-electric
energy where new houses are typically all-
electric), your report will be excluded from
the Index for that quarter.
Prices omitted cannot be estimated from prior
quarterly reports.
If you have unavoidable problems that will
delay submitting your report past the postmark
deadline, contact your data reviewer.
If it’s absolutely impossible for you to
participate in one quarter, notify your data
reviewer. Always try, though, to arrange for
the pricing to be done for your area.
GROCERY ITEMS INDEX
(Component Index Weight = .1324)
The Grocery Items Index contains more items
than any other component index, and accounts for
13.24% of the Composite Index. Weights for
individual items are based on Bureau of Labor
Statistics data showing that the mid-management
household spends its grocery dollar as follows:
Meats 16.25%
Dairy Products 11.80%
Produce 13.16%
Bakery Products 8.28%
Misc. Grocery Products 50.51%
Advice from merchandising consultants has
guided the choice of items, unit sizes, and brands.
To ensure uniformity, national brands are
stipulated whenever possible, and “lowest price”
is specified when no one brand or group of
comparable brands is available in all cities.
Nationwide changes in “standard” unit sizes
occur from time to time, and the size that’s most
common sometimes differs from one region to
another. When food producers switch from one
package size to another, the Cost of Living Index
Committee will make appropriate changes in the
specifications.
Pricing Grocery Items
(1) Grocery items must be priced during the
Thursday, Friday, and Saturday of the pricing
period.
(2) The best way to price grocery items is by
personal visit. C2ER has conducted tests in
which the same stores are priced by mail and by
personal visit, and has found that pricing in
person yields far more accurate results,
primarily because responding stores sometimes
fail to note items “on special” during the pricing
period.
2.7
(3) To the extent possible, do your pricing in
chain supermarkets.
Your sample may include discount stores that
have full grocery departments, but include
discount stores in your sample only if, and
not more than the extent to which,
reasonably affluent professional and
managerial households shop there.
Don’t price grocery items at stores that don’t
allow access to everyone (e.g., membership
clubs, military base exchanges).
Don’t include in your sample any store that
does not normally carry a full range of grocery
items. For example, you can’t price stores that
lack fresh produce departments or dairy
departments.
You may price grocery items in more than one
store in a chain, provided you still use a
representative sampling of chains. Larger
cities normally will price multiple stores in a
chain.
When you price multiple stores in a chain,
make sure your sample reflects the different
chains’ shares of your market. For example, if
one chain has roughly 25% of your market
and you price eight stores, two of them should
be from the one chain. You cannot, however,
price one store in a chain and then “double-
count” its prices, because prices within a
chain sometimes vary from one store to
another.
Don’t price grocery items at convenience
stores (small neighborhood stores that carry a
limited variety of items and derive their profits
mainly from selling at high mark-ups outside
normal grocery store hours) or at grocery
stores that cater to a wealthy clientele and are
known to charge substantially above-market
prices.
(4) You must price all grocery items in each
store surveyed. If an item is temporarily out of
stock, determine the price that would be charged
if it were available.
(5) You can’t use coupon discounts to determine
the price of any item unless customers can pick
up the coupons in the store for use on the same
visit. Do use the special reduced price for items
on sale during the pricing period if no coupon is
needed.
(6) Since early 1997, we’ve seen a proliferation
of grocery store “membership” cards that are
free to customers and allow customers to receive
special prices on some items. In effect, these
cards are denying to nonmembers what used to
be normal specials. Their purpose is to allow the
store to track purchasing patterns for individual
households. You should report cardholder prices
at such stores if membership is free and if the
discounted prices are available on the same visit
when one applies for a card.
(7) Where the specifications allow a choice of
brands, the brands are interchangeable. In each
store, you should price the brand with the lowest
price. It’s not intended that you price the same
brand at all stores. In pricing coffee, for
instance, you might use Folgers at one store and
Maxwell House at the next.
You may price generic products when no brand
name is required.
(8) When packaging standards change, you may
be unable to find the specified sizes for some
grocery items. When this happens, price the next
larger size (or, if there is no larger size, simply
the nearest size) that otherwise meets the
specifications, and then calculate the prorated
price for the size specified.
To prorate a price, multiply the price of the
available item by the specified size, and then
divide the result by the size actually priced.
For example, if a store has no 10-lb. sacks of
potatoes, and if the next larger size is a 15-lb.
sack at $2.29, report $2.29*10/15, or $1.5267,
for that store.
(9) There are a few “tricks to the trade” in pricing
some of the grocery items. A few pointers:
Pork sausage: Not all areas stock the 16-oz.
size. Be alert to the possibility that you may

2.8
be pricing a different size and will need to
prorate the price. If 16 oz. packages are not
available, price 12 oz if at all possible and
indicate the size
Parmesan cheese: Canisters of house brands
often look like Kraft’s canisters, so make sure
you’re pricing the proper brand. In addition,
be sure you’re pricing Parmesan cheese.
Kraft also markets less expensive “look-
alikes” such as “Italian blend.”
Lettuce: Where lettuce is sold by the head, use
the scale in the produce department to make
sure a typical head weighs about 1.25 pounds,
and prorate if it is substantially more or less
than this weight. Where lettuce is sold by the
pound, multiply the price per pound by 1.25 to
get the price for your report.
Lettuce, bananas, and potatoes: Some stores
offer deep discounts on produce verging on
spoilage. Before you record a price, ask
yourself: Would I serve this to a guest
tomorrow night?
Coffee: Packaging may be either can or brick,
whichever is less expensive. Be alert for
containers that differ slightly from the
specified 11.5-oz. size (12- and 13-oz. cans
are common), and report the size for any
deviation.
HOUSING INDEX
(Component Weight = .2804)
While attention to accuracy is expected from all
participants for all pricing, it bears emphasizing
for the two items in the Housing Index.
The monthly principal and interest payment
for a new house is by far the most important
single item in this survey: it represents 19.90%
of the Composite Index.
Monthly apartment rent accounts for 8.14% of
the total Composite Index.
Because these two items are so heavily
weighted, even a slight inaccuracy in housing
data can produce a large error in the Index.
We stress accuracy on the housing items
because there are far more possibilities for
pricing errors than in pricing, say, grocery
items:
The specifications are far more complex than
just size and brand.
You are responsible for making judgments
about what’s typical for professional and
managerial housing in your area and about
prevailing local construction practices.
To price housing accurately, you have to do
some homework. To help you make sure that the
kind of housing priced in your area is directly
comparable with what’s priced elsewhere, the
housing specifications are highly detailed.
Apartment Rent
Apartment complexes sampled should be
suitable for a childless professional and
managerial couple with household income in the
top 20% for your area. In particular, these
complexes must meet the following
specifications:
Location: Suitable for a professional or
managerial couple in terms of commuting,
shopping, entertainment needs, and
neighborhood quality.
Age: Apartment complexes should be no more
than 10 years old unless your area has no
complexes this new—in which case you
should sample only the newest complexes.
Size: 950-sq.ft. If units in your sample differ
from this size, prorate to a 950-sq.ft.-
equivalent rent, using rent per sq. ft. per
month. Do not include units smaller than 850-
sq.ft. or larger than 1,050 sq. ft.
Description: Unfurnished; two bedrooms; 1½
or two baths; stove and refrigerator furnished.
Utilities: Rent excludes all utilities except
water and sewer. If apartment rents in your
area normally include electricity and/or other
energy, ask your sources of rental data or your
local utility firms to estimate how much you
should subtract from total rent to get a
2.9
monthly rent that includes water and sewer
only.
Extra charges for optional amenities such as
carports should not be included in the reported
rent. Where such amenities are not optional,
however, they must be included in the rent
you report.
Lease term: Report monthly rent for a 12-
month lease. If 12-month leases aren’t
available, report monthly rent for the longest
available lease period less than 12 months. In
some areas, apartment rents are affected by
seasonal factors that we want to eliminate
because the Index assumes permanent
residency in an area.
Some participants may omit apartment rent.
Some nonmetropolitan areas don’t have any
apartments that are truly suitable for
professional and managerial households. You
may choose not to price this item if your area
meets both of two conditions:
It’s not within a federally-designated
Metropolitan Statistical Area.
It doesn’t have apartment complexes that meet
the specifications
When apartment rent isn’t reported, monthly
principal-and-interest payment for the house
purchase accounts for 100% of the Housing
Index and 28.04% of the Composite Index.
(Note that all participants in metropolitan
areas must price apartment rent.)
If you’re fortunate, you'll be able to get average
rent for the specified apartment from a single
source. Many metropolitan areas have real estate
research firms and/or associations of apartment
owners that conduct periodic surveys and can
readily provide the information you need. Your
next best bet is to survey apartment location
services. If you can secure the cooperation of
such sources, you’ll find it easy to conduct the
pricing by mail.
If you have to select your own sample of
apartment complexes, you’ll need to make your
own judgment about whether a given complex
meets the specifications. Consult with others on
your staff when you’re in doubt. As a rule,
apartment complexes where members of your
organization’s managerial staff live will qualify.
Be skeptical about deviations. Normally, rents
for units that meet the specifications cluster
fairly tightly. If you find a rent that’s unusually
high or low for your area, check it out and
determine whether it really belongs in the
sample. If you conclude that an exceptionally
high or low rent is correct, include an
explanation.
Similarly, you should be suspicious of any large
shift in the average from one quarter to the next.
If the average changes by more than 5%,
determine why and include a note with your
report.
House Purchase Price
The house purchase item carries 70.9% of the
weight in the Housing Index (100% in
nonmetropolitan areas that lack appropriate
apartment housing) and (with the mortgage rate)
19.90% of the weight for the Composite Index,
making it by far the most heavily weighted item
priced.
You must adhere strictly to all specifications for
the house purchase. It doesn’t matter whether
the specified house is typical of your area or
not: for the Index to be valid, we must price the
same house (with the exception of limited
regional variations discussed below)
everywhere.
It’s sometimes suggested that we should price,
in each area, the kind of housing that’s typical
for professional and managerial there, but that
would mean we’d be pricing different
standards of living in different areas, and the
result would be an Index that didn’t measure
anything.
Note that the Index uses ratios, in this case the
ratio of local to nationwide housing costs.
This ratio probably wouldn’t change much if
we used a 3,000 sq.ft. house on a ¼-acre lot
instead of a 2,400 sq.ft. house on an 8,000
2.10
sq.ft. lot. So long as the same specifications
are used everywhere, the Index measures
differences in the cost of a specific, well-
defined standard of living.
For the same reason, it doesn’t matter whether
a professional or managerial household could
qualify for a mortgage on a house meeting the
specifications for this item. In determining the
ratio of local to nationwide cost, it’s irrelevant
whether or not the specified house is
“affordable.”
Regional variations: While we insist on using
the same specifications everywhere to define the
kind of house to be priced, our specifications
have to allow for some regional variations. You
don’t need central air conditioning in Alaska or
central heating in Hawaii, for example, to
maintain the comfort level appropriate for the
specified lifestyle.
Therefore, the Index uses the concept of
comparable, rather than identical, housing
throughout the nation, allowing for variations
governed by geographic location and local
homebuilding practices. Basements are
common in some areas, but rare in others.
Central air conditioning is essential in some
climates, but unnecessary in others. Exterior
wall materials, style (for instance, ranch vs.
two-story), and similar elements vary with local
market preferences. Insulation standards reflect
differences in temperature ranges, demand for
energy-conserving features, and local
ordinances. Such regional variations in the kind
of house appropriate for professional and
managerial households have a direct bearing on
housing price differences among areas which is
precisely what the Housing Index is designed to
measure.
Because local and regional variations in
construction practices and housing features are
important, it’s your responsibility to make
sure that specifications for which local
judgment is required are updated
periodically to reflect changes in local
practice. A review of these “local option”
specifications with local builders once every
year or so should suffice.
Note: Specifications that do not expressly
permit local judgment must be followed
regardless of local practice.
Specifications: Here are the specifications to
use in determining the full purchase price of
the house:
(1) Location: Good subdivision or other area
convenient for schools and shopping, within an
area offering full municipal services; water,
sewer, police and fire protection; area typical
for professional and managerial households in
top income quintile.
Subdivisions/neighborhoods sampled should
be suitable for the social needs of the
professional and managerial households in the
top 20% of households on income.
In large metropolitan areas where commuting
time is an important factor in choosing a
home, price houses within 60 minutes
commuting time at rush hour from the central
business district.
(2) Lot size: 8,000 sq. ft. (The lot requirement is
waived altogether for the Borough of Manhattan
in New York City, and may be waived with the
concurrence of the Cost of Living Index project
manager for other areas that entirely lack single-
family detached homes.)
(3) Living area: 2,400 sq. ft. (Excluding
garage).
If new homes in your area typically have
basements, any fully finished basement space
is included in the 2,400 sq. ft. living area.
Partly finished or unfinished basement space
is not considered living area. (Fully finished
basement space is comparable to other rooms
in the house in terms of finish, for example
carpeted if the house is carpeted and is part of
the area centrally heated and/or air-
conditioned.)
(4) General house description: Single-family
detached house; newly built and not previously
2.11
occupied. The house conforms with Marshall
& Swift’s rating of “Very Good Quality” as set
forth in its Residential Cost Handbook. The
house is built in a high-quality tract or
development and is often individually designed
and custom-built or of comparable quality.
Special attention has been given to exterior and
interior details. Irregular shapes and angles will
be common, as will large eaves and overhangs.
Basic features:
4 bedrooms
2 full baths
Living room
Dining room
Kitchen with built-in cabinetry and cooking
island
Finished family room
One fireplace (if standard in your area)
Utility room
Attached two-car garage.
(In Manhattan and any other areas that lack
single-family housing, condominiums otherwise
meeting these specifications are substituted.)
(5) Age: Newly built; not previously occupied.
You can determine the purchase price for the
specified house in two ways:
Price real houses. Be sure your sources report
selling price, rather than asking price. The
best way to get the proper construction quality
is to contact your local homebuilders
association and ask for names of builders who
are building homes of the specified quality.
Except in the largest metropolitan areas, such
homes are almost always custom homes rather
than spec homes. When you have your list,
call the builders and ask if they have any
model homes open; and if they do, actually
visit a few of these models to make sure they
meet the specifications. Walk through the
models to make sure. Once you’ve qualified
the builders, you can contact them each
quarter and determine the current price or
price per sq. ft. for the models that meet C2ER
specifications.
It’s unlikely that you’ll find homes of exactly
2,400 sq.ft. on lots of exactly 8,000 sq.ft. If
the size of either the house or the lot differs
appreciably (50 sq.ft. of living area could
easily alter the price by $2,750) from the
specifications:
Determine how much a comparable
unimproved lot in the same neighborhood
or subdivision would sell for.
Subtract that price from the total price of
the property. This gives you the value of
the dwelling alone.
Prorate the lot price to an 8,000-sq.ft.-
equivalent price.
Prorate the dwelling price to a 2,400-sq.ft.
equivalent price.
Add the two prorated prices to obtain the
price to report.
If you can’t find new houses that meet the
specifications, determine what such a house
would cost if it were to be built in your area.
Builders and developers generally can
determine this figure easily when you give
them the detailed specifications. Be sure to
include the lot price, don’t report construction
cost only.
The insistence on new housing isn’t capricious.
Homeownership costs include periodic
maintenance (painting, roof repairs, and so on),
which generally are nil when the house is new,
but rise with the age of the house. This is why
buyers pay a premium for a house that hasn’t
been previously occupied. Since the Index
contains no item representing home
maintenance costs, the cost of homeownership is
understated when resale housing is priced.
(6) Type of construction: Conventionally built
on site; not prefabricated or modular
construction.
(7) Style: Stipulate whatever style or mix of
styles is most common for new homes in your
2.12
area (for example, one-story “ranch,” two-story,
or split-level).
(8) Basement: Specify how much of the living
area, if any, is fully finished basement space
served by the central heating/cooling system.
Also specify that amount of basement space
other than fully finished space.
If new homes in your area typically do not
have basements, specify “no basement.”
Surveys have shown marked regional
variations on this point, a high percentage of
new homes with basements in northern and
northeastern states, and less than half with
basements in western states.
Fully finished basement space seldom exceeds
500 sq.ft.
(9) Heating and air conditioning: Determine the
most prevalent type of central heating and water
heating being installed in new houses in your
area, gas, oil, or electric. Use this in your
housing specifications and in your energy
specifications.
Most new houses have central air
conditioning. Wide regional climatic
variations, and even variations within some
large metropolitan areas, affect whether
central air conditioning is the norm for an
area. If central air conditioning is installed in
most new houses in your area, include it in
your housing specifications.
(10) Detailed house specifications: The
following specifications must be used in
addition to specifications 1-9 above:
(a) Exterior walls: material most commonly
used in your area (brick veneer, stucco,
wood siding, etc.).
(b) Roof structure: gable.
(c) Roof cover: asphalt shingle.
(d) Foundation: poured concrete, 8 inches.
(e) Gutters and downspouts: material
standard for your area.
(f) Floors: hardwood floors in living room,
dining room, and family room; standard
grade carpeting in bedrooms; ceramic tile
floor and wainscot in bathrooms; ceramic
tile in kitchen and utility room.
(g) Walls: taped and painted dry wall,
insulated for high energy-efficiency.
(h) Ceilings: dry wall, insulated for high
energy-efficiency.
(i) Trim: stock.
(j) Closets: hall, bedrooms, kitchen, linen.
(k) Windows: ample natural lighting.
(l) Electric wiring: as required by local
code.
(m) Electric fixtures: good, average; good
luminous fixtures in kitchen and bath areas.
(n) Appliances: built-in range, oven,
cooking surface, dishwasher, and garbage
disposal.
(o) Landscaping: lawn and some near-house
shrubbery practical for your area.
(p) Plumbing: 14 high-quality white or
colored plumbing fixtures with one
plumbing rough-in.
Note that it’s up to you to determine what to
specify as typical of your area for detailed
specifications a, e, k, and o. Use your best
judgment, based on discussions with local
builders and other knowledgeable sources, to
decide what to stipulate about location and
“standard local practice” for those items that
vary from one region to another. Remember that
what you specify for items subject to local
variations must reflect professional and
managerial preferences in your area.
Determining full purchase price for the
house: Once you’ve settled on current
specifications for the items that take local
practices into account, prepare these
specifications for distribution to your sample of
house price sources.

2.13
Homebuilders, mortgage bankers, appraisers,
savings and loan officers, and Realtors (in areas
where the Multiple Listing Service lists new
homes) make good sources. The Internet is also
fast becoming a potential resource as the
National Association of Homebuilders
(www.nahb.org) begins to help its members gain
advertise new homes on line. Ask each source to
provide the current full purchase price a buyer
would have to pay in your area to buy a house
and lot meeting these specifications. Where no
such houses exist, determine how much a buyer
would have to pay for such a house if it were to
be built.
If you’re in a metropolitan area, survey at
least five people who know your local
new house market well. (An exception
occurs when a single source, such as a real
estate research firm, maintains
comprehensive data and can provide a
reliable price based on a large number of
transactions. If you’re lucky enough to
have such a source, you don’t need to
survey any further. But do include an
explanation on your price report form so
your report won’t be deleted because of
insufficient sample size.)
If you’re not in a metropolitan area, a
sample of three or more is required, unless
you have fewer than three sources
available, in which case you need to
include an explanation on your price
report.
Once you have all your price data, calculate the
average full house purchase price. Round to the
nearest dollar, not to the nearest hundred dollars
or thousand dollars, because rounding at higher
levels than the nearest dollar can distort your
city’s Housing Index.
Don’t wait until the last minute to ask your
sources for current housing prices. If you enlist
the help of several respondents in advance, and
then send them a letter a week or so before the
pricing dates, they’ll have time to compile the
information and mail it back to you.
Before you submit your report, review the
data critically.
Like apartment rents, house purchase prices
generally fall within a fairly narrow range. If
one price is substantially above or below the
others, recheck it and find out why.
If one source shows a price much higher or
lower than in the previous quarter, recheck to
determine what accounts for the shift.
The more closely you edit your own data, the
fewer questions will be raised in the review
process after you submit your report.
Mortgage Rate
Complete the “Mortgage Quotations” section of
the price report immediately following the
pricing period. On the Monday after the pricing
dates, call your local lenders to determine rates
in effect as of close of business on the previous
Friday.
Because the array of mortgage alternatives is
complex, you must obtain several bits of
information from each lender before we can
calculate monthly principal-and-interest
payments using the effective mortgage interest
rate. These are shown in the “Mortgage
Quotations” section of the price report. Your
data reviewer will calculate both the effective
mortgage rate and the resulting monthly
principal-and-interest payment.
Several mortgage options that evolved in the
early 1980s would distort housing cost
differentials, and therefore can’t be priced. The
two kinds of mortgages you can use are:
Conventional fixed-rate mortgage:
traditional level-payment mortgage with fixed
(unchanging) interest rate and fixed monthly
principal-and-interest payments over the entire
life of the loan. This is the preferred option.
Use it whenever it’s available.
Price a 30-year conventional fixed-rate
mortgage. For each lender, report the stated
rate, the number of discount points charged to
the buyer (one point equals one percent of the
2.14
amount financed), and the loan origination (or
application) fee. When the division of points
between purchaser and seller is negotiable,
report what your sources inform you is the
most typical number of points paid by the
buyer.
Do not obtain mortgage quotations from a
newspaper or Internet sites. These sources
often contain artificially low rates designed to
lure customers, but may not actually be
available on the day you call.
Adjustable rate mortgage: flexible mortgage
plan in which the interest rate can be adjusted
periodically during the term of the loan.
Report this option only if conventional fixed-
rate mortgages are unavailable from any
lender in your market.
In addition to stated rate, points, and
origination fee, you must report the cap and
ceiling for each adjustable rate mortgage.
The cap is the maximum amount by which
the interest rate on an adjustable rate
mortgage may be raised at any one time.
The cap and the frequency with which the
interest rate can be changed must be
reported for all ARMs. (There is no cap on a
conventional fixed-rate mortgage.)
The ceiling is the maximum interest rate
that can be charged on the mortgage. The
ceiling must be reported for all ARMs.
(There is no ceiling on a conventional
fixed-rate mortgage.)
Do not price an adjustable rate mortgage
(ARM) from any lender who offers a 30-
year conventional fixed-rate mortgage.
If you must use an adjustable rate mortgage,
obtain the rate for a five-year ARM (no
change in interest rate for the first five years
of the loan).
If neither a conventional fixed-rate
mortgage nor a five-year ARM is offered,
then obtain the rate for a three-year ARM.
Only if conventional fixed-rate, five-year
ARM, and three-year ARM are not available
may you use a one-year ARM.
Report only one type of loan from each
lender. When you can obtain a conventional
fixed-rate quotation, don’t ask for ARM
quotations. When you must use an ARM, use
only the first you can obtain among the three
types listed above.
All mortgages must be first mortgages, and
must meet the following restrictions:
(a) FHA/VA mortgages and bond-backed
mortgages are prohibited.
(b) Negative amortization (a rising loan
balance because payments are insufficient to
cover interest) is prohibited.
(c) Balloon payments (large payments due at
maturity) are prohibited.
(d) Shared appreciation mortgages (equity
participation by lender) are prohibited.
(e) Assumed mortgages are prohibited.
(f) Graduated payment mortgages, which
offset lower initial payments with higher
payments later in the life of the loan, are
prohibited.
(g) Savings accounts pledged to the lender and
used to reduce monthly payments are
prohibited.
(h) Land contracts, where the lender retains
title to the property until the loan is fully paid,
are prohibited.
(i) Wraparound mortgages, in which the seller
keeps the original low-rate mortgage and the
buyer makes payments to the seller, who
forwards a portion to the lender holding the
original mortgage, are prohibited.
You may obtain mortgage rates from savings
and loan associations, banks, and mortgage
lenders. Don’t obtain quotations from builders
or real estate agents.
Check with residential mortgage loan officers
on the Monday following the pricing period to

2.15
obtain the rates in effect as of close of business
on the Friday during the pricing period. Tell
each that the down payment is 25% and the
term of the loan is 30 years. Ask each for the
best generally available interest rate for a
conventional fixed-rate mortgage.
Do not enter the average interest rate or the
monthly house payment on the price report form.
Your data reviewer will calculate these two
items.
Be sure to resurvey all sources on purchase
price and mortgage data each quarter. This is
essential to reflect rapidly changing housing
prices and interest rates. Keep track of prices
quoted by each source so you can check
immediately if one firm reports a price that
differs significantly from what it reported in the
previous quarter. Do not accept a statement that
there has been no change from the previous
quarter.
Taxes and insurance: Note that real estate
taxes and insurance are not included in the
monthly payment. The Cost of Living Index
Advisory Board has studied the entire issue of
tax burdens in an effort to find some way to
determine actual differences reliably, but has
found no method that would suffice. Three
independent studies over the years have likewise
concluded that there is no feasible way to
incorporate tax burdens into the Index.
Insurance costs pose similar problems.
The Advisory Board believes any attempt to
include taxes and insurance in the house
payment would yield unreliable data that
wouldn’t accurately reflect differences in
housing costs and would reduce the Index’s
usefulness as a reliable measure of differentials
among urban areas in the costs of consumer
goods and services.
UTILITIES INDEX
(Component Index Weight = .1031)
The Utilities Index is based on three items:
electricity, other home energy, and telephone
service.
Electricity and Other Home Energy
Once you’ve found out how much the house
specified costs, the next question is how much a
family buying that new home will spend for
energy when it moves in.
Two basic steps are involved in arriving at
monthly energy costs. First, we determine how
much energy of each type is used. Then we price
that amount of energy at current rates.
Determining Consumption
C2ER has developed a computer model that
incorporates local weather data from the
National Oceanographic & Atmospheric
Administration and assumes high levels of
energy efficiency typical of new home
consumption to generate energy consumption
figures for specified house. Using this model is
mandatory for all Cost of Living Index
participants.
You have to answer three questions about
what’s typical of new homes in your area:
Does it use natural gas for central heating?
Does it use natural gas for water heating?
Does it use natural gas for cooking?
Your answers to these questions determine the
mix of appliances used in the model. If you
answer “no” to all three, the new home in your
area is all electric (unless you’re in one of the
few areas using heating oil). Once you’ve
answered these questions, we won’t change the
mix of natural gas and electric appliances unless
you tell us that what’s typical for new homes in
your area has changed.
Determining Energy Costs
In addition to providing the consumption data,
C2ER generates the cost data. To do this, we
need two inputs from you the first time you
participate:
The base rate schedule for each utility. State
public utility commissions usually establish

2.16
base rates. These rates are in effect for a
period ranging from six months to several
years.
If the published basic rate schedule contains
different rates for “summer” and “winter,” we
need to know which months are included in
each season. Check to see if the base rate
schedule itself contains this information, if it
doesn’t, find out and add that information to
the rate schedule.
The current adjustment factors. To
compensate for changes in the utilities’ costs
of acquiring fuel, public utility commissions
typically allow utilities to pass on to
consumers any changes (either up or down) in
their costs of acquiring fuel. For electricity,
the most common adjustments are the fuel
cost adjustment factor and the power cost
recovery factor; for natural gas, it’s the
purchased gas adjustment factor. There may
be others, and they should be included in your
report. (Do not include taxes or franchise
fees.)
If more than one electric or natural gas
utility serves homes in the area your
report covers, and if one has more than
70% of the market, we need only data for
that one provider. If no single company
serves more than 70% of the market, we
need data for the two that have the largest
market shares, and we need to know
approximately what those shares are.
After the first time you participate using the
C2ER model, subsequent quarters are easier still.
You can download the utility rates worksheet
that shows the base rate schedule and
adjustment factors used in the previous quarter
from our website. You need to send this to your
energy utility contacts with a request that they
either update the rate schedules and adjustment
factors or confirm that those are unchanged
from your previous report. Submit your revised
or verified utility data with your price report
each quarter.
While participants in the Cost of Living Index
no longer are directly involved in obtaining
consumption data, there are a few points about
the home energy items of which you need to be
aware:
Why don’t we use a utility-calculated
“average residential bill”? Consumption for
the average residence may differ substantially
from consumption in a new 2,400-sq.ft. house,
especially where many residences are
apartments. Generally, single-family homes
use more energy than apartments because they
are larger and contain more people.
Why not price the same amount of
consumption everywhere? Utility
representatives and Index participants
sometimes suggest that it would be easier if a
fixed amount of electricity (say, 1,000 kwh)
and a fixed amount of natural gas (say, 3 mcf),
and then priced these amounts everywhere.
After all, they note, we price a fixed amount
sausage. Why not do the same with
electricity?
In the case of grocery items or most other
kinds of goods and services covered by the
Index, the standard of living is established by
the weight assigned. The quantity of pork
products that represents a professional or
managerial standard of living isn’t affected by
location.
But when we come to home energy
consumption, we’re dealing with the question
of how much energy is required to maintain
comfort levels appropriate for households in
the kind of home priced for the housing
component. Here the Index must be sensitive
to geographic differentials. Clearly, there are
vast differences between, say, Birmingham,
which averages 2,863 heating degree-days and
1,881 cooling degree-days per year, and San
Diego, which averages 1,284 heating degree-
days and 842 cooling degree-days per year.
Maintaining the same level of comfort will
use far more energy in Birmingham. A
comparison of unit costs for energy wouldn’t
capture the difference in total costs. It’s
essential that the Index measure total cost of
energy consumption, rather than unit cost, to

2.17
provide an accurate picture of living cost
differentials among areas.
Other Energy
Some houses that meet the house purchase
specifications use forms of energy other than
electricity and natural gas, fuel oil for example.
Restrict these additional energy sources to forms
of energy normally used in new homes in your
area. For example, don’t report fuel oil if new
homes in your area use only electricity and
natural gas.
Most energy use other than electricity and
natural gas is seasonal. Determine the typical
annual consumption of fuel oil or any other
source of energy used in the C2ER-specified
house, and then divide that amount by 12 rather
than by the number of months such
supplemental fuels are used. Calculate the
current cost for the resulting average monthly
consumption, and enter the average monthly
consumption and cost figures in the space
provided in on the price report.
Telephone
The price you report for monthly residential
telephone service should reflect a typical
professional or managerial household’s normal
monthly telephone usage for everyday living.
Assume that the telephone instruments are
owned by the user. Do not include instrument
lease costs.
The price you report must include monthly
base rate, the federal long distance access fee,
any other mandatory monthly charges (such as
a “911” fee in many areas), the Touchtone fee,
and all taxes. Don’t include optional features
such as call-forwarding and call-waiting.
Include the line maintenance fee only if it’s
mandatory; exclude it if it’s optional.
Telephone rates can be complicated. Rates
differ from one telephone company to the next,
and a single company may have different rates
for different communities within its service
area. It may take a bit of effort to obtain an
accurate price. The following variations are
common:
A high basic rate with free calling within a
large service area.
A low basic rate with a limited free calling
area.
A low basic rate with a minimum number of
free calls, plus message unit charges for each
call over the minimum, and with unit charges
varying as a function of the distances over
which, and the time of day at which, calls are
made.
As with energy consumption, you should report
the current price for average monthly
“consumption” by a family of three for phone
calls within your locality, the area in which most
of a household’s everyday activity occurs.
Exclude long distance calls beyond the area
within which most of a household’s routine
everyday activity occurs.
Where the consumer can choose among base
rates, price the base rate that allows the widest
geographic coverage and the most non-toll
calls.
Exclude long distance calls beyond the area
within which a family’s routine activities
normally occur.
If your area’s basic rate covers all normal
everyday calls, you can use the rates the
telephone company quotes for a private
residential line with Touchtone service,
including all taxes and all mandatory monthly
fees.
If that price doesn’t cover routine calling
activity, then price on the basis of 100 local
calls per month.
If that, too, proves impracticable, obtain a
sample of phone bills for professional and
managerial households and determine the
additional cost of local calling.
When you call the telephone company for rates,
ask for the different components of the bill
separately. Make taxes the last item you

2.18
request, so you can ask for taxes on the items
you’ve just listed.
Note that telephone service is one of the few
items that typically doesn’t change price from
quarter to quarter. When your telephone price
does change, please include a note of
explanation on your price report.
TRANSPORTATION INDEX
(Component Index Weight = .1116)
The Transportation Index includes two items:
tire balancing, and gasoline.
Tire Balancing: Price the average cost of
balancing all four wheels of an American-made
automobile.
You may contact tire stores, automobile
mechanics, and service stations.
As a rule, you don’t want to include new car
dealerships in your sample because their
prices tend to be higher. Presumably,
professionals and executives have enough
sense to have a routine procedure done where
it’s not inordinately expensive.
Price computer balancing where it’s available. If
computer balancing isn’t available, price spin
balance. Don’t price establishments that have
neither computer nor spin balance.
If whether the tire is on or off the car affects the
price, obtain the price for balancing with the tire
on the car.
Gasoline: Price the cost of one gallon of regular
unleaded gasoline (not premium unleaded).
Include all taxes, whether or not they’re part of
the stated pump price.
Use self-service pumps where available.
When a discount is offered for cash payment
or debit card payment, report the discounted
price.
Record each price to tenths of a cent (e.g.,
$1.289), and round the average to the nearest
tenth of a cent. If you omit the third decimal
place, a “9” will be assumed.
HEALTH CARE INDEX
(Component Index Weight = .0436)
The Health Care Index includes five items:
Optometrist visit, doctor visit, dentist visit,
prescription and non-prescription medications.
Please price all exams for patients without
insurance as this is the only way to truly
compare costs.
Optometrist Visit: Full vision eye exam for
established adult patient. Please price only
optometrist. Please be sure NOT to price
ophthalmologists as their rates are significantly
higher. Eye exam should include eye
examination, eyeglass prescription, glaucoma
test and dilation exam. Dilation is not always
part of the exam so you may need to verify that
it has been included in the reported price.
Doctor Visit: Report the average fee charged
for American Medical Association procedure
99213 for a patient without insurance. The
figure to report is the total fee for the
procedure—not just the amount billed to the
insurer or the amount of the co-payment.
This procedure is a general practitioner’s
routine examination, typically about 15 minutes
for an established patient with a problem of low
to moderate severity (for example, a periodic
examination of a patient under treatment for
high blood pressure). The duration and the
degree of severity distinguish this procedure
from AMA procedures 99212 and 99214.
Note that the patient is an established patient.
Many physicians have a higher charge for a
patient’s initial visit to cover paperwork and
time involved in setting up new records and
recording a medical history. Be sure to report
the price for subsequent visits, not for initial
visit.
Price this item by telephoning or faxing a
sample of doctors or by contacting the local
medical society.
Dentist Visit: Report the average fee charged
for American Dental Association procedures
01110 (adult teeth cleaning). Please report the
2.19
full price you would be paying if you do not
have dental insurance.
Be sure the price is for an established patient
rather than for an initial visit.
Price this item by telephoning or faxing a
sample of dentists or by contacting the local
dental society.
WARNING! Fees for doctors and dentists tend
to vary within an urban area far more than do
prices for most other items. This means you
need larger samples to make sure that your
sample average comes close to the average
you’d get by surveying all doctors or dentists in
your area who meet the specifications. If you’re
sampling five establishments for most items,
you should sample 8-10 doctors and 8-10
dentists.
Advil: This item may be priced at a grocery
store or any other outlet. The tablets are round
and have an orange/red coating. Be sure to get
the 200mg 100 tablets and please avoid pricing
gel-caps or caplets. Also be careful, it is only for
pain relief not cold, sinus, etc.
Lantus Solostar Insulin 1 Carton, 5 pens:
This is a widely sold prescription drug for type I
and type II diabetes. Please price at local
pharmacies in grocery stores or other retail
outlets and ask a pharmacist for the price of this
item without insurance coverage. Please don’t
price for any other size carton.
MISCELLANEOUS GOODS &
SERVICES INDEX
(Component Index Weight = .3289)
The Miscellaneous Goods & Services Index
covers a wide range of categories of consumer
spending on goods and services, including food
away from home, personal care, apparel,
household operations, reading, entertainment,
and alcoholic beverages.
Price each item in the Miscellaneous Goods &
Services Index at a minimum of five
establishments (three outside metropolitan
areas) unless your area has fewer that offer an
item. If an item isn’t available at all in your
area, report the price for that item in the nearest
community where it is available or, if it’s more
reflective of what professional and executive
households in your area would do, price by
catalogue, making sure to include shipping and
handling charges.
When you select your samples of
establishments, make sure they reflect
professional and managerial shopping patterns
in your area. You can include discount stores
(Wal-Mart, K-mart, etc.) only to the extent that
such households would be expected to use them.
If you include three discount stores in a sample
of five stores for tennis balls, for example,
you’re giving the discounters a 60% share of the
professional and managerial market for that
item. That’s okay if it’s a realistic picture of
such households’ shopping patterns in your area.
In most areas, however, we’d expect such
households to shop discount stores only
occasionally Where that’s the case, discount
stores shouldn’t be more than 20% of the
sample.
Hamburger Sandwich: Report the average
price of a McDonald’s Quarter-Pounder with
cheese if possible. Don’t assume that the price is
identical for all McDonald’s restaurants in your
area.
If your area doesn’t have even one McDonald’s
restaurant, report the average price at “fast
food” restaurants for a hamburger sandwich
with a ¼-pound (before cooking) all-beef patty,
cheese, pickle, onion, mustard, and ketchup.
Be sure each price you get excludes sales tax.
More than many other chains, McDonald’s often
quotes prices that include sales tax unless you
clearly specify otherwise.
Pizza: Report the average price of an 11"-12"
thin crust regular cheese pizza (no extra cheese)
at Pizza Hut and/or Pizza Inn.
Don’t price home delivery, price for
consumption in the restaurant.
2.20
Don’t assume that the price is identical at all
restaurants within a chain in your area.
Price Pizza Hut and Pizza Inn if possible. If
your area has at least one, but less than five
(three outside metropolitan areas), price all
restaurants in these two chains. Don’t expand
your sample by adding restaurants that aren’t
in these chains.
On your price report form, indicate which
chain is quoting each price. Just jot “PH” or
“PI” by each price.
If your area has no restaurants in either of
these chains, then price the specified pizza at
restaurants suitable for family dining in the
restaurant.
Fried Chicken: Report the average price of a
fried chicken drumstick and thigh at Kentucky
Fried Chicken and/or Church’s Fried Chicken.
Report the price with or without “extras”
(mashed potatoes, biscuits, etc.), whichever is
lower.
Be sure your reported price is the total for the
two specified pieces, and not the cost per
piece.
Use only Kentucky Fried Chicken and
Church’s Fried Chicken if possible. If these
two chains together have fewer than five
restaurants in your area (three outside
metropolitan areas), price however many there
are. Don’t expand your sample by adding
other restaurants.
If your area has no restaurants in either chain,
then price the drumstick and thigh at
restaurants suitable for family dining.
Man’s Barbershop Haircut: Report the
average price of a “barbershop” or “standard”
haircut at regular barbershops. Don’t include
styling, razor cuts, and so forth.
Price only at regular barbershops. Don’t price
styling salons and barber colleges.
Woman’s Shampoo, Trim, and Blow-Dry:
Report the average price for shoulder-length or
medium hair, based on beauty shops that
professionals and executives in your area
patronize. Specify no style change.
Price only in beauty salons. Don’t price beauty
schools or individuals working in their homes.
Price only salons that accept appointments.
Price only salons that allow the client to select
her beautician.
These limitations on the salons you may include
in your sample are designed to eliminate
“assembly-line” operations. In a metropolitan
area, you need to confirm any reported price
below $15 to make sure it’s from an
establishment that mid-management executives
patronize, meets the three tests above, and
includes all three components—shampoo, trim,
and blow-dry.
Toothpaste: Report the average price for a 6
oz.-6.4 oz. tube of Crest brand or Colgate brand
toothpaste. (While this item isn’t part of the
grocery items index, you can include it on your
grocery store pricing list.)
Shampoo: Report the average price for a 12.5
or 15 oz. container of Alberto VO5 Shampoo. If
15 oz is not available, please price 12.5 oz.
(This is another item you can price easily in
grocery stores.)
Dry Cleaning: Report the average cash-and-
carry price for dry cleaning a man’s two-piece
suit. Price several establishments to reduce the
undue effect of any “specials.”
Man’s Dress Shirt: Report the average price
for a man's pinpoint cotton/polyester blend dress
shirt (white, long sleeves, plain collar). If you
need to specify size, use any size from 15/32 to
16/34.
You may price shirts on special, but don’t
price irregulars or seconds.
Be careful to select stores where professional
and managerial households normally shop.
Don’t over represent discount stores in your
sample.
2.21
Boys’ Jeans: Please price blue denim jeans,
regular, relaxed or loose fit in sizes 8 to 20.
You should be pricing name brands such as
Levi's, Lee, or Wrangler. You can find this item
at large department stores such as Macy’s or JC
Penney. Please price button fly or zip and report
the lowest price. Please make sure that you do
not price irregulars or damaged merchandise.
Woman’s Slacks: Please price name brands,
twill women’s khakis (regular sizes, misses 4-
14). Examples of “name brands” include
Dockers, Lee and other similar. Appropriate
items can be found at department and specialty
stores such as Macy’s, JC Penny’s, or other
large department stores. Pants must be at least
95% cotton, but may contain up to 5% Lycra or
other material. Please do not price irregulars,
damaged merchandise or shorts.
Major Appliance Repair: Report the average
base price, including any minimum labor charge
but excluding parts, for a home service call for
clothes washing machine repair. (This is the
amount you would pay for someone to tell you
the washing machine would work just fine if
you’d plug it in.) You may use Sears, J.C.
Penney, Montgomery Ward, General Electric,
and so on, as well as independent repair
establishments.
Newspaper Subscription: Report the cost for a
home-delivery daily-and-Sunday subscription to
the newspaper professional and managerial
households in your area normally choose for
state, regional, and national news.
If your area is a suburb of a large city, use the
average price for major daily-and-Sunday
newspapers in that central city (e.g., New York
Times, San Francisco Chronicle, Washington
Post, Houston Chronicle, Chicago Tribune,
Seattle Post-Intelligencer).
If your area is a smaller metropolitan area or
is outside a metropolitan area, the odds are
that your local newspaper doesn’t meet the
specifications. Few newspapers published in
rural areas feature the depth and variety of
reporting that professionals and executives
demand. In most such areas, the newspaper
you should price is published in the nearest
major metropolitan area.
As a case in point, Galveston—50 miles
from Houston, and in a separate PMSA—
has its own daily-and-Sunday paper. To
meet the requirement for state, regional, and
national coverage, however, Galveston
would have to report the Houston
Chronicle.
If your local paper meets the coverage
criterion but doesn’t publish seven days per
week, you must include the cost of home
delivery of another paper for the seventh day.
If there is no other paper for which home
delivery is available, then use the
newsstand price for the seventh day for
the most reasonable substitute (USA
Today is the fallback option).
If your paper publishes seven days per
week except for federal holidays (or some
similar variation), calculate the annual
cost of substituting on the missing days
and add it to your rate.
The price report offers two choices of
subscription periods—cost for 52 weeks, and
cost per year. Report only one of these
options—and note that they’re not quite the
same thing. (Monthly cost, based on 4.348
weeks per month, appears in the published
report.)
If a paper is running a “special,” you should
report it only if the discount is available to
current subscribers. Discounts available only to
new subscribers aren’t allowed.
Movie: Report the average adult admission for
showings of first-run films (recent releases)
between 6 p.m. and 10 p.m. on Saturday at
indoor movie theaters. Don’t use discount
admission prices unless they’re available for all
evening showings.
Be sure your sample of theaters is appropriate
for professional and managerial households.
2.22
Be sure the theater is showing first-run
movies. (A look at the theater ads in a
newspaper from the nearest major metropolitan
area is a good guide to what movies are
currently “first-run.” And any film that’s
advertised on national television as now
showing in theaters is a first-run film.) In
smaller communities, you may need to price
admission prices at the nearest theater that
qualifies, even if it’s outside your immediate
area.
Bowling: Report the average price for one line
of evening bowling at non-league rates on
Saturday between 6 p.m. and 10 p.m. Don’t
include equipment rental in the price. If bowling
is priced by the hour, divide the hourly charge
by 5.5 to obtain the price per line.
Tennis Balls: Report the average price for one
can of three Wilson or Penn brand extra-duty
tennis balls. This item can be found in
department stores, sporting goods stores,
drugstores, and discount stores. Don’t over
represent any one type of store in your sample.
Veterinary Services: Please price exam only,
without vaccines, blood work, grooming, etc.
The exam is for a yearly check-up of a healthy
4-year-old dog. Animal hospitals are a good
source for prices and animal shelters are a good
source for phone numbers of local vets, etc.
Most receptionists will be able to give you this
information over the phone easily.
Alcoholic Beverages: Where competitive
pricing of alcoholic beverages exists, price
several establishments and average the results.
Where prices are set by the state and are the
same by law at all outlets, you need price only
one establishment.
Alcoholic beverage prices include all federal,
state, and local liquor taxes. Don’t include
separately stated sales taxes in the price.
If your area is “dry,” price the three alcoholic
beverage items in the nearest place you can buy
alcoholic beverages.
Beer: Report the average price for a six-pack of
Heineken’s beer in 12-ounce containers.
Exclude deposit, if any. Do not price 12-packs
or cases and then report a prorated price.
Wine: Report the average price for a 1.5-liter
bottle of white table wine. It may be pinot
grigio, Chablis blanc, or other white table wine
of your choice. The basic rule of thumb for this
items is, ‘Would you serve it in your home?’
Price only blends—don’t price vintage years,
which are more expensive.
3.1
SECTION 3: HOW TO USE THE INDEX
Once you’ve invested the time, effort, and re-sources to collect price data, you want to be able to use the results properly. In this section, we’ll look at the concepts and theory that un-derlie the Cost of Living Index, and we’ll see how it compares with some other measures.
What’s An Index Number? An index number is simply a percentage of some “base” number that serves as a standard for comparisons.
In the Cost of Living Index, the base with which each urban area is compared is the average for all participating urban areas in that particular quarter. Thus, if two Metropolitan Statistical Areas (MSAs) have indexes of 115.0 and 90.0, their respective mid-management living costs are 115% of and 90% of the average for all areas participating in that quarter, which means that the former’s costs are 15% above the average for all participating areas, while the latter’s are 10% below the average.
Calculating Differences between Areas
The most common application of the Cost of Living Index is not to compare an area with the average for all participating places, but rather to compare, say, MSA #1 and MSA #2. People don’t move from an area to the nationwide average; they move from one place to another, and they want to know the differences between those two places.
You can’t compare living costs for two areas by subtracting the index for one from the index for the other. In the example above, MSA #1 isn’t 25% more expensive than MSA #2. To determine how much more or less expensive MSA #1 is than MSA #2, subtract MSA #2’s index from MSA #1’s, divide the result by MSA #2’s index, and multiply the answer by 100%:
[((115.0-90.0)/90.0)*100%] = (25.0/90.0)*100% = 28% When we compare MSA #1 with MSA #2, we find that MSA #1 is approximately 28% more
expensive (“approximately” because the Index is based on sampling).
Note that if we reverse the order and compare MSA #2 with MSA #1, we do not find that MSA #2 is 28% less expensive. Why? Because the denominator in the fraction changes. Com-paring MSA #2 to MSA #1:
[(90.0-115.0)/115.0)*100%] = (-25.0)/115.0)*100% = -0.22*100% = 22%
In our example, then, MSA #1 is about 28% more expensive than MSA #2, and MSA #2 is about 22% less expensive than MSA #1.
When you make such calculations, always re-member that fairly small differences don’t indi-cate any measurable difference, and may not even correctly show which area is more expen-sive. If two MSAs have respective indexes of 102.0 and 104.5, the MSA with the higher index in actuality could have a slightly lower cost of living than the one with the lower index.
Why aren’t small differences significant? There are many potential sources of error, both sam-pling error and non-sampling error. Further, be-cause the Index is based on non-probability samples, we can’t specify a precise confidence interval. As a rule of thumb, however, it seems like a reasonable guide not to treat differences of 4% or less in the Composite Index as signifi-cant. For the component indexes, 5% is probab-ly a safer level.
Theory The Cost of Living Index is designed to provide the best possible measure of relative differences among urban areas in the cost of consumer goods and services appropriate for professional and managerial households in the top income quintile.
The Cost of Living Index rests on the premise that prices collected at a specified time, in strict conformance with standard specifications, provide a sound basis for constructing a
3.2
reasonably accurate gauge of relative differences in the cost of consumer goods and services.
Data published for the first three quarters is based on prices submitted by all participating areas. Beginning in February 2008, C2ER began publishing an annual average survey compiled from data submitted in those previous quarters. For urban areas where we have data less than three pricing periods, we developed estimated prices in order to have a complete set of observations. Thus, to calculate the annual average index, we use the actual and estimated prices as our observations to calculate an annual average price for each item. We do not weight any of the prices based on when we observe them. Thus, first pricing period prices receive the same weight in the calculation as third pricing period prices. Then, from the annual average price for each item, we calculate the index using the same BLS Consumer Expenditure Survey weights that we would for any other pricing period. Consumer expenditures cover an almost limit-less range of goods and services, and no index of consumer buying can encompass all of them. Since we can’t price everything, what do we do? The standard approach, used in the Cost of Living Index, is to divide consumer expenditures into categories, and then select items that represent those categories. The items used in the Cost of Living Index thus are surrogates for entire categories of consumer spending. For this approach to work, price differences among urban areas for the items in the Index must accurately reflect differences for the categories they represent.
The Cost of Living Index consists of six major categories: grocery items, housing, utilities, transportation, health care, and miscellaneous goods and services. These major categories in turn are composed of subcategories, each of which is represented by one or more items in the Cost of Living Index. Separate component indexes are published for each of the six major categories.
Note that we’re not concerned with the extent to which consumers actually purchase the individual items in the Cost of Living Index. The 57 items have been chosen solely to show inter-area price differences in the categories they represent. What’s important, in calculating the Cost of Living Index, is the ratio of an urban area’s average price to the average price of the same item nationwide. When we use a pound of whole frying chicken to represent poultry products, we’re assuming that if an area’s price for this item is 10% above the na-tionwide average, its prices for poultry products as a whole also are about 10% above the na-tionwide average.
How much the ratio for each item contributes to the Cost of Living Index is determined by the distribution of consumer expenditures among the categories covered by the Cost of Living Index. The share of consumer spending devoted to the category each item represents determines that category’s importance, or weight, in the Cost of Living Index.
The Cost of Living Index Committee has adopted the weights shown in this manual largely on the basis of data from the U.S. Bu-reau of Labor Statistics’ 2007 Consumer Expenditure Survey, using the data on the proportional distribution of expenditures by households in which the reference person has a professional or managerial occupation and by households in the upper quintile of income.
It’s important to understand that the weights are what define the standard of living. In housing, for example, homeownership accounts for 79.22% of the housing index, while rental occupancy accounts for 20.77%. If we were to use the same price data to construct an index for clerical workers, we’d assign considerably less weight to homeownership costs and correspondingly more weight to renting, since clerical workers are more likely than professionals and executives to rent their housing.
Why Are the Weights Identical Everywhere?
In published Cost of Living Index reports, the numbers above the index data at the top of each column show the weight each component index
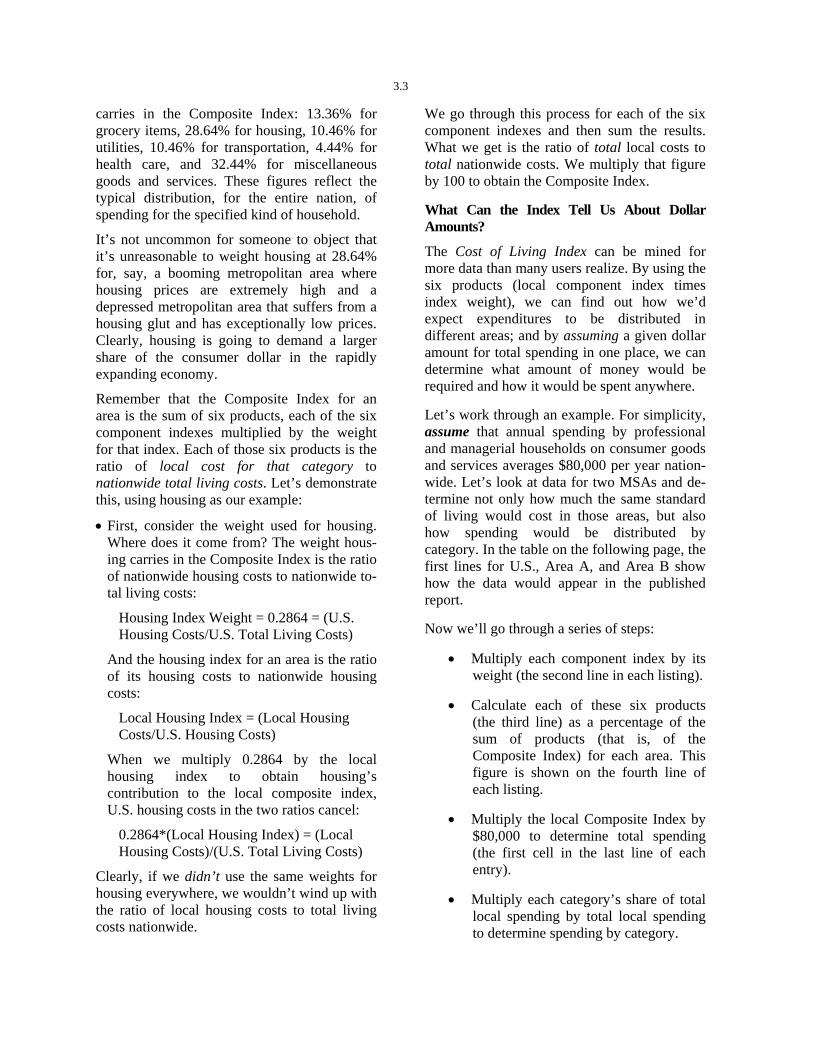
3.3
carries in the Composite Index: 13.36% for grocery items, 28.64% for housing, 10.46% for utilities, 10.46% for transportation, 4.44% for health care, and 32.44% for miscellaneous goods and services. These figures reflect the typical distribution, for the entire nation, of spending for the specified kind of household.
It’s not uncommon for someone to object that it’s unreasonable to weight housing at 28.64% for, say, a booming metropolitan area where housing prices are extremely high and a depressed metropolitan area that suffers from a housing glut and has exceptionally low prices. Clearly, housing is going to demand a larger share of the consumer dollar in the rapidly expanding economy.
Remember that the Composite Index for an area is the sum of six products, each of the six component indexes multiplied by the weight for that index. Each of those six products is the ratio of local cost for that category to nationwide total living costs. Let’s demonstrate this, using housing as our example:
First, consider the weight used for housing. Where does it come from? The weight hous-ing carries in the Composite Index is the ratio of nationwide housing costs to nationwide to-tal living costs:
Housing Index Weight = 0.2864 = (U.S. Housing Costs/U.S. Total Living Costs)
And the housing index for an area is the ratio of its housing costs to nationwide housing costs:
Local Housing Index = (Local Housing Costs/U.S. Housing Costs)
When we multiply 0.2864 by the local housing index to obtain housing’s contribution to the local composite index, U.S. housing costs in the two ratios cancel:
0.2864*(Local Housing Index) = (Local Housing Costs)/(U.S. Total Living Costs)
Clearly, if we didn’t use the same weights for housing everywhere, we wouldn’t wind up with the ratio of local housing costs to total living costs nationwide.
We go through this process for each of the six component indexes and then sum the results. What we get is the ratio of total local costs to total nationwide costs. We multiply that figure by 100 to obtain the Composite Index.
What Can the Index Tell Us About Dollar Amounts?
The Cost of Living Index can be mined for more data than many users realize. By using the six products (local component index times index weight), we can find out how we’d expect expenditures to be distributed in different areas; and by assuming a given dollar amount for total spending in one place, we can determine what amount of money would be required and how it would be spent anywhere.
Let’s work through an example. For simplicity, assume that annual spending by professional and managerial households on consumer goods and services averages $80,000 per year nation-wide. Let’s look at data for two MSAs and de-termine not only how much the same standard of living would cost in those areas, but also how spending would be distributed by category. In the table on the following page, the first lines for U.S., Area A, and Area B show how the data would appear in the published report.
Now we’ll go through a series of steps:
Multiply each component index by its weight (the second line in each listing).
Calculate each of these six products (the third line) as a percentage of the sum of products (that is, of the Composite Index) for each area. This figure is shown on the fourth line of each listing.
Multiply the local Composite Index by $80,000 to determine total spending (the first cell in the last line of each entry).
Multiply each category’s share of total local spending by total local spending to determine spending by category.

3.4
If our professional/managerial standard of liv-ing costs an average of $80,000 per year nationwide (after taxes), then such a household moving from Area B to Area A could expect to spend about $18,080 per year more for con-sumer goods and services. Its housing costs would rise by about $19,790 per year, its health care costs would grow by about $656, and its spending for miscellaneous goods and services
would increase by roughly $1,596. Lower costs for grocery items, utilities, and transportation wouldn’t offset the increases in other catego-ries.
Cost of Living Index: First Quarter 2007
Composite Grocery
Items Housing Utilities Transportation
Health Care
Misc. Goods & Services
U.S.
Indexes 100.0 100.0 100.0 100.0 100.0 100.0 100.0
Weights 1.00 0.13 0.28 0.10 0.10 0.04 0.35
Products 100.0 13.0 28.0 10.0 10.0 4.0 35.0
% of Product 100.0 13.0% 28.0% 10.0% 10.0% 4.0% 35.0%
Sum Spending $80,000.00 $10,400.00 $22,400.00 $8,000.00 $8,000.00 $3,200.00 $28,000.00
Area A
Indexes 120.2 95.8 165.5 72.7 100.8 126.5 110.1
Weights 1.00 0.13 0.28 0.10 0.10 0.04 0.35
Products 120.2 12.5 48 7.3 9.1 5.1 38.5
% of Product 100.0% 10.4% 39.9% 6.0% 7.5% 4.2% 32.1%
Sum Spending $96,160.00 $10,000.64 $38,367.84 $5,769.60 $7,212.00 $4,038.72 $30,867.36
Area B
Indexes 97.6 102.3 80.2 103.0 107.3 106.0 104.4
Weights 1.00 0.13 0.28 0.10 0.10 0.04 0.35
Products 97.6 13.3 23.3 10.3 9.7 4.2 36.5
% of Product 100.0% 13.6% 23.8% 10.6% 9.9% 4.3% 37.4%
Sum Spending $78,080.00 $10,618.88 $18,583.04 $8,276.48 $7,729.92 $3,357.44 $29,201.92
Coverage of Living Costs
The Cost of Living Index isn’t designed to cover all living costs. Two important restric-tions apply:
The Cost of Living Index is location-specific, focusing on expenditures made by people living in each participating area. Among the kinds of expenditures it expressly excludes are:
Life insurance, for which rates generally are not a function of location;
Hotel rates and taxi fares, which usually are expenses for visitors rather than residents; and
Charitable donations, which are not affected by place of residence.
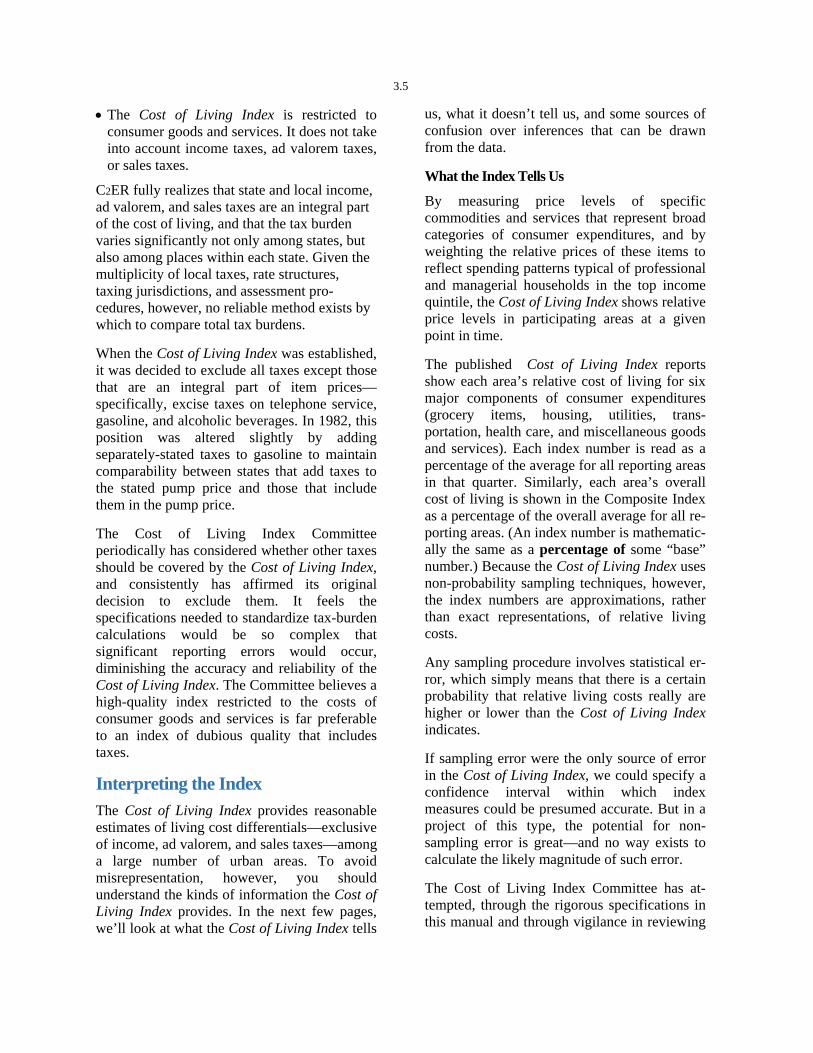
3.5
The Cost of Living Index is restricted to consumer goods and services. It does not take into account income taxes, ad valorem taxes, or sales taxes.
C2ER fully realizes that state and local income, ad valorem, and sales taxes are an integral part of the cost of living, and that the tax burden varies significantly not only among states, but also among places within each state. Given the multiplicity of local taxes, rate structures, taxing jurisdictions, and assessment pro-cedures, however, no reliable method exists by which to compare total tax burdens.
When the Cost of Living Index was established, it was decided to exclude all taxes except those that are an integral part of item prices—specifically, excise taxes on telephone service, gasoline, and alcoholic beverages. In 1982, this position was altered slightly by adding separately-stated taxes to gasoline to maintain comparability between states that add taxes to the stated pump price and those that include them in the pump price.
The Cost of Living Index Committee periodically has considered whether other taxes should be covered by the Cost of Living Index, and consistently has affirmed its original decision to exclude them. It feels the specifications needed to standardize tax-burden calculations would be so complex that significant reporting errors would occur, diminishing the accuracy and reliability of the Cost of Living Index. The Committee believes a high-quality index restricted to the costs of consumer goods and services is far preferable to an index of dubious quality that includes taxes.
Interpreting the Index The Cost of Living Index provides reasonable estimates of living cost differentials—exclusive of income, ad valorem, and sales taxes—among a large number of urban areas. To avoid misrepresentation, however, you should understand the kinds of information the Cost of Living Index provides. In the next few pages, we’ll look at what the Cost of Living Index tells
us, what it doesn’t tell us, and some sources of confusion over inferences that can be drawn from the data.
What the Index Tells Us
By measuring price levels of specific commodities and services that represent broad categories of consumer expenditures, and by weighting the relative prices of these items to reflect spending patterns typical of professional and managerial households in the top income quintile, the Cost of Living Index shows relative price levels in participating areas at a given point in time.
The published Cost of Living Index reports show each area’s relative cost of living for six major components of consumer expenditures (grocery items, housing, utilities, trans-portation, health care, and miscellaneous goods and services). Each index number is read as a percentage of the average for all reporting areas in that quarter. Similarly, each area’s overall cost of living is shown in the Composite Index as a percentage of the overall average for all re-porting areas. (An index number is mathematic-ally the same as a percentage of some “base” number.) Because the Cost of Living Index uses non-probability sampling techniques, however, the index numbers are approximations, rather than exact representations, of relative living costs.
Any sampling procedure involves statistical er-ror, which simply means that there is a certain probability that relative living costs really are higher or lower than the Cost of Living Index indicates.
If sampling error were the only source of error in the Cost of Living Index, we could specify a confidence interval within which index measures could be presumed accurate. But in a project of this type, the potential for non-sampling error is great—and no way exists to calculate the likely magnitude of such error.
The Cost of Living Index Committee has at-tempted, through the rigorous specifications in this manual and through vigilance in reviewing

3.6
the quarterly data, to minimize the three major sources of non-sampling error:
Relative prices for a given component of con-sumer expenditures can be biased if the items representing that component don’t display price differentials typical of the differential for that component as a whole. Therefore the Committee has selected the items in the Cost of Living Index on the basis that they adequately reflect differentials for the range of expenditures they represent.
Establishments selected for pricing in a given area may not accurately represent prices for that area. The Committee has dealt with this potential source of error in two ways: by in-troducing the concept of a professional/mana-gerial household in the top income quintile as a guideline for selecting establishments and neighborhoods; and by stipulating a mini-mum sample size. The Committee also en-courages participants to ensure price representativeness by expanding their samples beyond the requisite minimum.
Pricing errors can occur through inattention to specifications (such as pricing a smaller box of corn flakes than is stipulated), through misunderstanding of the specifications (such as including the garage in the 2,400-sq.ft. living area specified for the house purchase item), and through establishment error (such as a grocery store that mismarks an item price). For this reason, the Cost of Living Index Committee members who review the data routinely question atypical prices that may represent some form of pricing error, and more often than not ask a participant to recheck selected prices that could be erroneous.
It’s the Committee’s opinion that error from these three sources is minimal, and that the Cost of Living Index in fact presents a reasonable approximation of geographic differentials in the cost of consumer goods and services for the specified standard of living.
What the Index Doesn’t Tell Us
Because of sampling error and non-sampling error, index numbers shown in the published reports don’t represent actual percentage differ-ences among areas. The Cost of Living Index simply isn’t that precise. Therefore, it’s not valid to calculate the ratio of two area indexes and conclude that the price differential between those two areas is exactly the arithmetic result. Because the index numbers are approximations, the differences are also approximations. Small differences between areas may not represent significant—or even actual—differences in living costs. Larger differences do permit an inference of substantial real differences.
For example, if MSA #1’s Composite Index is 105.6 and MSA #2’s is 107.6, you can’t conclude that there’s a significant difference—or even that living costs are higher in MSA #2 than in MSA #1. The difference is so small that if living costs could be determined more accurately, MSA #2 might turn out to be a bit less expensive. You can conclude from these data that any real differences are slight.
To continue the example, suppose that MSA #3 has a Composite Index of 100.0 and MSA #4’s Composite Index is 120.0. Clearly there’s a significant and large cost-of-living differential—but that differential isn’t exactly 20%, and should not be so represented.
The use of index data as completely accurate determinations of living cost differentials is one common misinterpretation of the Cost of Living Index. A second is construction of time series data.
The Cost of Living Index does not measure changes over time in the relative cost of living for any area. Each quarterly report is unique, and you can’t compare data from different quarters. Here’s why:
The number and the mix of participants in the report changes from one quarter to the next. If the list of participants were always the same, and if those areas accurately reflected the entire nation, then one could construct a time series showing, for example, that MSA #1 was 5.6% above the U.S. average in the
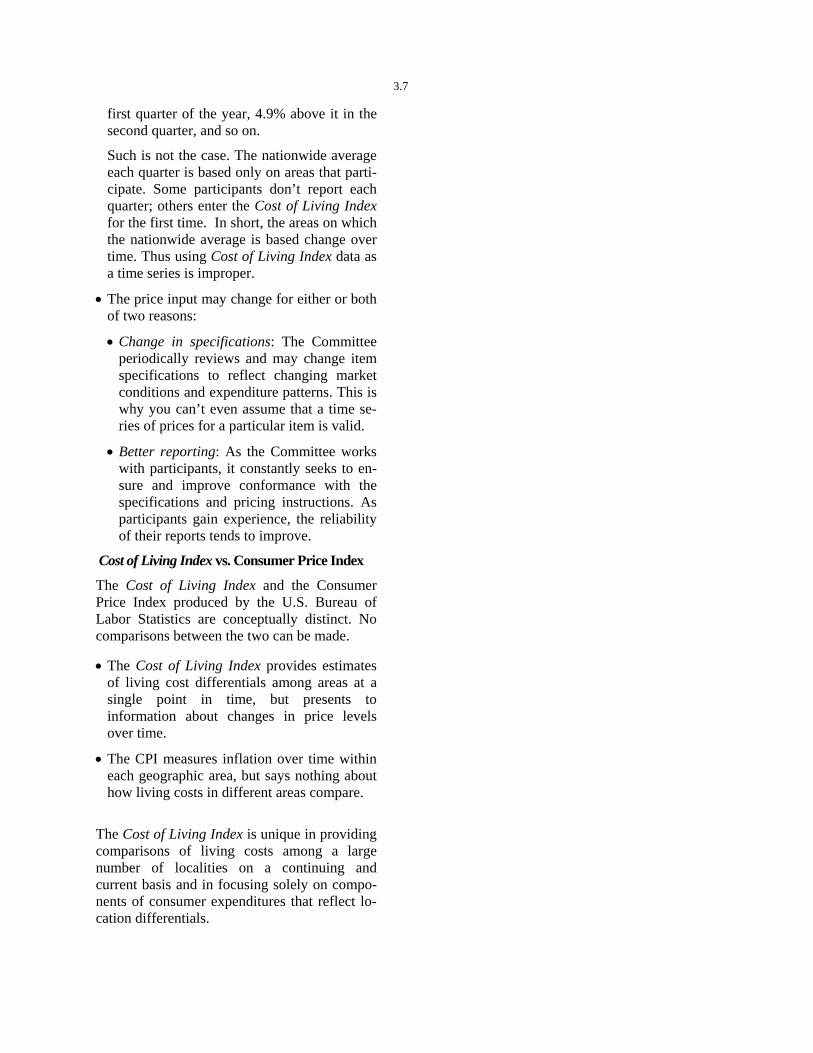
3.7
first quarter of the year, 4.9% above it in the second quarter, and so on.
Such is not the case. The nationwide average each quarter is based only on areas that parti-cipate. Some participants don’t report each quarter; others enter the Cost of Living Index for the first time. In short, the areas on which the nationwide average is based change over time. Thus using Cost of Living Index data as a time series is improper.
The price input may change for either or both of two reasons:
Change in specifications: The Committee periodically reviews and may change item specifications to reflect changing market conditions and expenditure patterns. This is why you can’t even assume that a time se-ries of prices for a particular item is valid.
Better reporting: As the Committee works with participants, it constantly seeks to en-sure and improve conformance with the specifications and pricing instructions. As participants gain experience, the reliability of their reports tends to improve.
Cost of Living Index vs. Consumer Price Index
The Cost of Living Index and the Consumer Price Index produced by the U.S. Bureau of Labor Statistics are conceptually distinct. No comparisons between the two can be made.
The Cost of Living Index provides estimates of living cost differentials among areas at a single point in time, but presents to information about changes in price levels over time.
The CPI measures inflation over time within each geographic area, but says nothing about how living costs in different areas compare.
The Cost of Living Index is unique in providing comparisons of living costs among a large number of localities on a continuing and current basis and in focusing solely on compo-nents of consumer expenditures that reflect lo-cation differentials.

SECTION 4: APPENDICES Appendix 1: How the Index Was Developed The Council for Community and Economic Research (C2ER) first considered the possibility of constructing an instrument to measure living cost differences among urban areas throughout the nation at its 1966 annual conference. Then, as now, the need for such an analytical tool was clear. A small committee of knowledgeable and imaginative C2ER members was assigned the task of developing a feasible project and then guiding it through the debugging stages. Their success has been rewarded by widespread acceptance of the Cost of Living Index. Pilot testing that established the feasibility of the project began in the second quarter of 1967, when chambers of commerce across the country were invited to participate by collecting price data at a specified time for a variety of items meeting well-defined criteria. In the last three quarters of 1967, data were assembled, published alphabetically by state and place, and distributed to participants and to C2ER members. By evaluating the results of the early price surveys and making modifications as necessary to ensure accuracy in reporting, the project committee developed an intercity cost of living index that made its debut in the first quarter of 1968. The Cost of Living Index has been published quarterly since that time. In 1968, the first year of publication, the average quarterly report presented data for 147 urban areas. Participation rose gradually during the 1970s, topping 200 for the first time in 1978. By 1986, average quarterly participation had risen above 250; since 1990, it has consistently ex-ceeded 300. As of 1999, areas covered in the Cost of Living Index represented more than 70% of the urban U.S. population, including more than 80% of the population in the 50 largest metropolitan areas.
Since its inception, the Cost of Living Index has been governed by the Cost of Living Index Committee, which is responsible for ensuring the accuracy and reliability of the Index. This changed in 2003 when the Cost of Living Advisory Board was created. From time to time, this committee has introduced changes in procedures and item specifications to reflect changing market conditions and to enhance the usefulness of the data.
For the most part, these modifications have been minor. Substantive revisions have been made on only two occasions - January 1979 and January 1982.
In the 1979 revisions, the committee updated weights in response to new data on consumer expenditure patterns, broadened the Index’s coverage of expenditure components, and adopted refinements in the procedures for calculating the Index.
In the 1982 revisions, it expanded coverage
to incorporate previously untapped compo-nents of consumer expenditures, increased the number of items priced for some previ-ously-covered components to provide a bet-ter base for measuring those categories, and revamped the weighting structure to reflect the broader Index coverage.
The weighting is updated annually, ever December. The committee continues to monitor new data and changing market conditions to ensure that the Index reliably shows differences among urban areas in the cost of consumer goods and services.
C2ER is particularly indebted to two gentlemen who formulated the Cost of Living Index and guided its preparation in its early years: Richard G. Harb of the Louisville Chamber of Commerce and DeVer Sholes of the Chicago Association of Commerce and Industry.

APPENDIX 2: SAMPLE INDEX CALCULATION This appendix presents a sample calculation of the component indexes and the composite index for a hypothetical city. Prices shown do not necessarily bear any relation to actual prices at any particular time. The item weights and component index weights are those that are actually used in calculating Cost of Living Index data for the year of 2007 publications. For each component index, the price reported for an item in a given area is expressed as a percentage of the average for all reporting areas, and that percentage is multiplied by the item weight to produce that item’s contribution to its component index. The contributions of all items in a component index are summed to produce the component index number. Component index numbers in turn are multiplied by their weights to generate their contributions to the Composite Index, which is the sum of the component index contributions.
Price in MSA A All-Places Average
MSA A as % of Average
Contribution to Component Index Weight
Item
Grocery Items Index T-bone steak 5.92 5.87 100.8518 0.031121 3.1386%
Ground beef 1.88 1.73 108.6705 0.031121 3.3819%
Sausage 3.03 2.84 106.6901 0.037510 4.0019%
Frying chicken 0.98 0.81 120.9877 0.036480 4.4136%
Tuna 0.79 0.83 95.1807 0.035243 3.3545%
Milk 1.65 1.47 112.2449 0.034522 3.8749%
Eggs 0.99 1.03 96.1165 0.008141 0.7825%
Margarine 0.78 0.78 100.0000 0.004288 0.4288%
Parmesan cheese 4.02 3.59 111.9777 0.065746 7.3621%
Potatoes 2.59 2.07 125.1208 0.030524 3.8192%
Bananas 0.58 0.45 128.8889 0.056884 7.3317%
Lettuce 0.97 0.89 108.9888 0.026154 2.8505%
Bread 0.65 0.70 92.8571 0.085120 7.9040%
Orange juice 2.49 2.50 99.6000 0.016255 1.6190% Coffee 3.59 3.38 106.2130 0.036501 3.8769%
Sugar 1.42 1.38 102.8986 0.035140 3.6159%
Corn flakes 2.59 2.31 112.1212 0.038438 4.3097%
Sweet peas 0.59 0.65 90.7692 0.012675 1.1505%
Peaches 1.58 1.46 108.2192 0.013836 1.4973%
Kleenex 1.08 1.11 97.2973 0.051628 5.0233%
Washing powder 3.51 3.89 90.2314 0.051628 4.6585%
Crisco 2.32 2.72 85.2941 0.017765 1.5153%
Frozen Food 2.69 2.63 102.2814 0.099643 10.1916%
Frozen corn 0.86 0.74 116.2162 0.012675 1.4730%
Potate Chips 0.28 0.33 84.8485 0.078015 6.6195%
Coke 1.29 1.28 100.7813 0.052947 5.3361%
Grocery items index 103.5307%
Grocery items index rounded for publication 103.5%
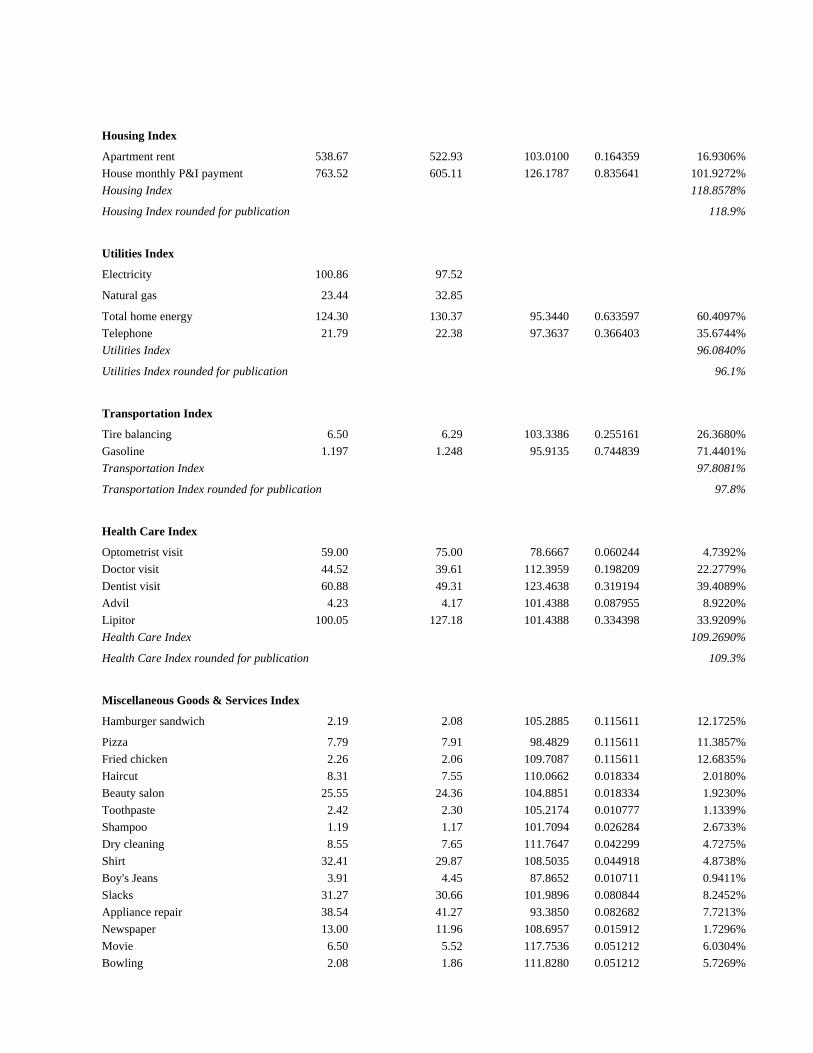
Housing Index Apartment rent 538.67 522.93 103.0100 0.164359 16.9306%
House monthly P&I payment 763.52 605.11 126.1787 0.835641 101.9272%
Housing Index 118.8578%
Housing Index rounded for publication 118.9%
Utilities Index
Electricity 100.86 97.52
Natural gas 23.44 32.85
Total home energy 124.30 130.37 95.3440 0.633597 60.4097%
Telephone 21.79 22.38 97.3637 0.366403 35.6744%
Utilities Index 96.0840%
Utilities Index rounded for publication 96.1%
Transportation Index
Tire balancing 6.50 6.29 103.3386 0.255161 26.3680%
Gasoline 1.197 1.248 95.9135 0.744839 71.4401%
Transportation Index 97.8081%
Transportation Index rounded for publication 97.8%
Health Care Index
Optometrist visit 59.00 75.00 78.6667 0.060244 4.7392%
Doctor visit 44.52 39.61 112.3959 0.198209 22.2779%
Dentist visit 60.88 49.31 123.4638 0.319194 39.4089%
Advil 4.23 4.17 101.4388 0.087955 8.9220%
Lipitor 100.05 127.18 101.4388 0.334398 33.9209%
Health Care Index 109.2690%
Health Care Index rounded for publication 109.3%
Miscellaneous Goods & Services Index
Hamburger sandwich 2.19 2.08 105.2885 0.115611 12.1725%
Pizza 7.79 7.91 98.4829 0.115611 11.3857%
Fried chicken 2.26 2.06 109.7087 0.115611 12.6835%
Haircut 8.31 7.55 110.0662 0.018334 2.0180%
Beauty salon 25.55 24.36 104.8851 0.018334 1.9230%
Toothpaste 2.42 2.30 105.2174 0.010777 1.1339%
Shampoo 1.19 1.17 101.7094 0.026284 2.6733%
Dry cleaning 8.55 7.65 111.7647 0.042299 4.7275%
Shirt 32.41 29.87 108.5035 0.044918 4.8738%
Boy's Jeans 3.91 4.45 87.8652 0.010711 0.9411%
Slacks 31.27 30.66 101.9896 0.080844 8.2452%
Appliance repair 38.54 41.27 93.3850 0.082682 7.7213%
Newspaper 13.00 11.96 108.6957 0.015912 1.7296%
Movie 6.50 5.52 117.7536 0.051212 6.0304%
Bowling 2.08 1.86 111.8280 0.051212 5.7269%
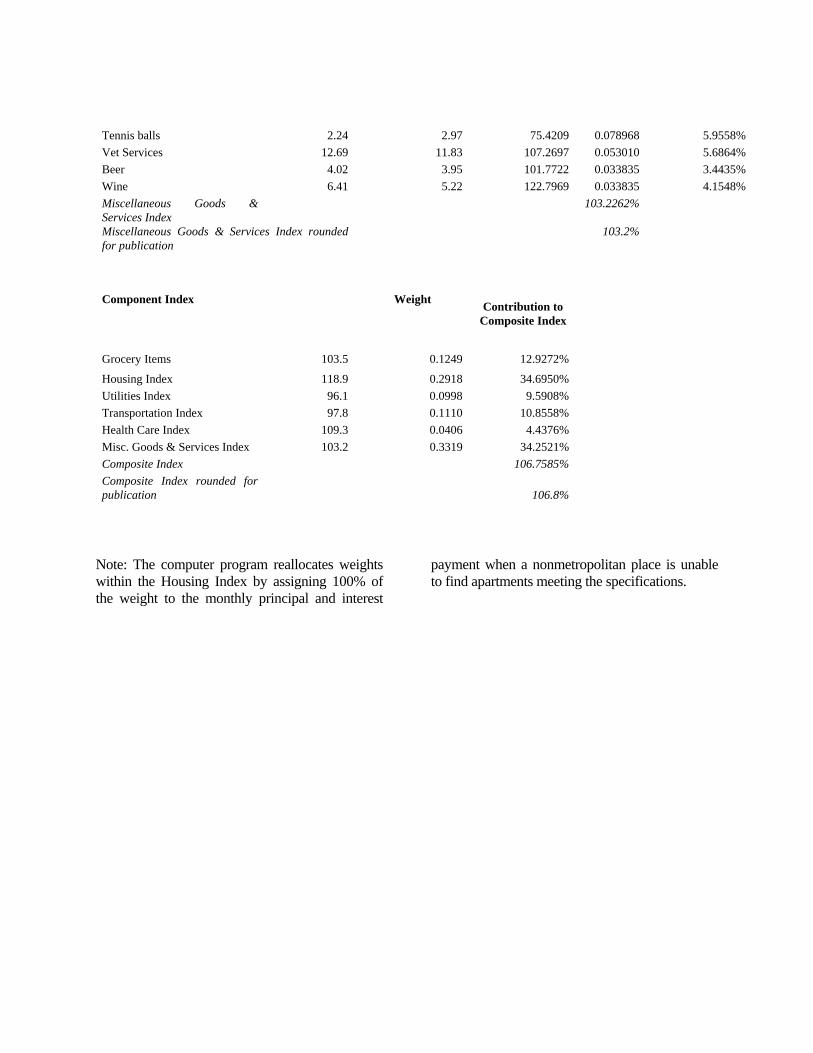
Tennis balls 2.24 2.97 75.4209 0.078968 5.9558%
Vet Services 12.69 11.83 107.2697 0.053010 5.6864%
Beer 4.02 3.95 101.7722 0.033835 3.4435%
Wine 6.41 5.22 122.7969 0.033835 4.1548%
Miscellaneous Goods & Services Index
103.2262%
Miscellaneous Goods & Services Index rounded for publication
103.2%
Component Index Weight
Contribution to Composite Index
Grocery Items 103.5 0.1249 12.9272% Housing Index 118.9 0.2918 34.6950% Utilities Index 96.1 0.0998 9.5908% Transportation Index 97.8 0.1110 10.8558% Health Care Index 109.3 0.0406 4.4376% Misc. Goods & Services Index 103.2 0.3319 34.2521% Composite Index 106.7585% Composite Index rounded for publication
106.8%
Note: The computer program reallocates weights within the Housing Index by assigning 100% of the weight to the monthly principal and interest
payment when a nonmetropolitan place is unable to find apartments meeting the specifications.
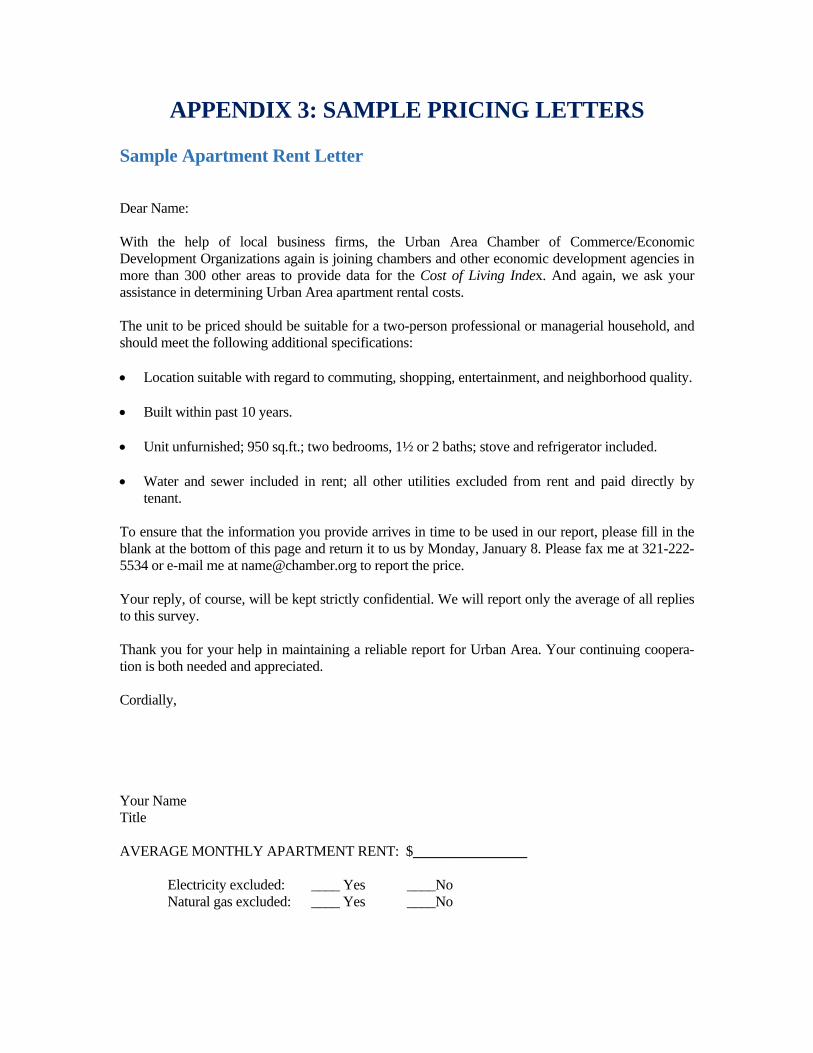
APPENDIX 3: SAMPLE PRICING LETTERS Sample Apartment Rent Letter Dear Name: With the help of local business firms, the Urban Area Chamber of Commerce/Economic Development Organizations again is joining chambers and other economic development agencies in more than 300 other areas to provide data for the Cost of Living Index. And again, we ask your assistance in determining Urban Area apartment rental costs. The unit to be priced should be suitable for a two-person professional or managerial household, and should meet the following additional specifications: Location suitable with regard to commuting, shopping, entertainment, and neighborhood quality. Built within past 10 years. Unit unfurnished; 950 sq.ft.; two bedrooms, 1½ or 2 baths; stove and refrigerator included. Water and sewer included in rent; all other utilities excluded from rent and paid directly by
tenant. To ensure that the information you provide arrives in time to be used in our report, please fill in the blank at the bottom of this page and return it to us by Monday, January 8. Please fax me at 321-222-5534 or e-mail me at [email protected] to report the price. Your reply, of course, will be kept strictly confidential. We will report only the average of all replies to this survey. Thank you for your help in maintaining a reliable report for Urban Area. Your continuing coopera-tion is both needed and appreciated. Cordially, Your Name Title AVERAGE MONTHLY APARTMENT RENT: $________________
Electricity excluded: ____ Yes ____No Natural gas excluded: ____ Yes ____No
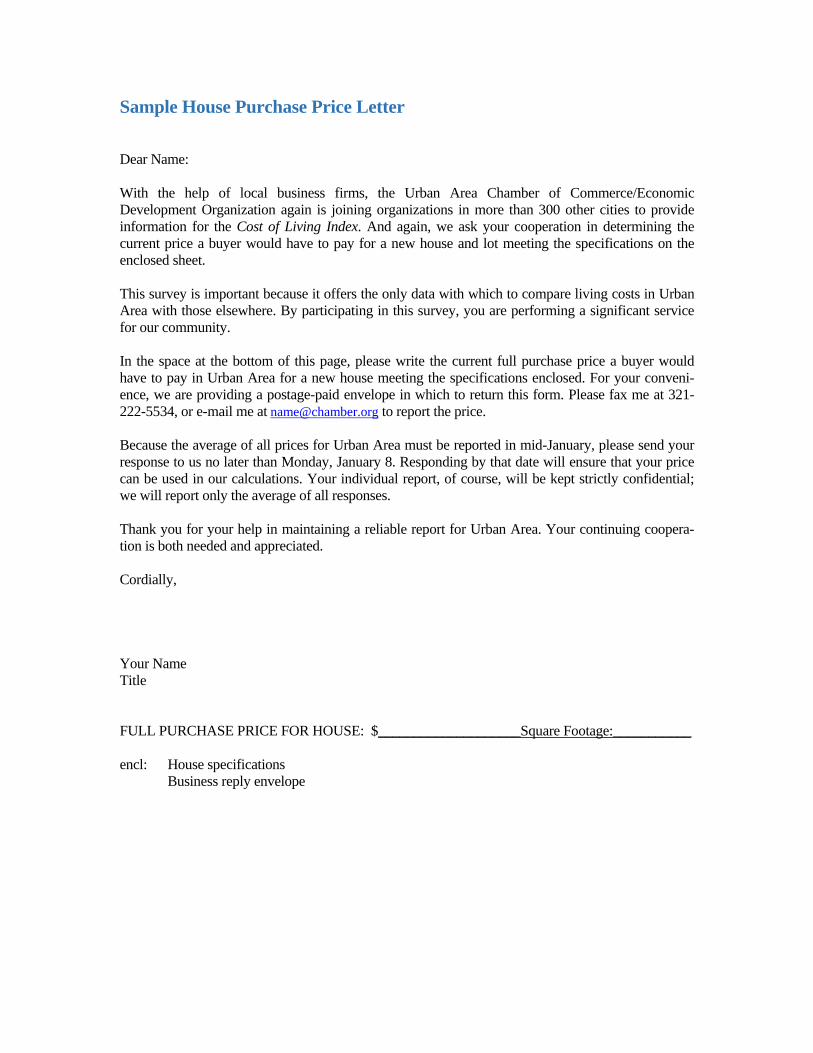
Sample House Purchase Price Letter Dear Name: With the help of local business firms, the Urban Area Chamber of Commerce/Economic Development Organization again is joining organizations in more than 300 other cities to provide information for the Cost of Living Index. And again, we ask your cooperation in determining the current price a buyer would have to pay for a new house and lot meeting the specifications on the enclosed sheet. This survey is important because it offers the only data with which to compare living costs in Urban Area with those elsewhere. By participating in this survey, you are performing a significant service for our community. In the space at the bottom of this page, please write the current full purchase price a buyer would have to pay in Urban Area for a new house meeting the specifications enclosed. For your conveni-ence, we are providing a postage-paid envelope in which to return this form. Please fax me at 321-222-5534, or e-mail me at [email protected] to report the price. Because the average of all prices for Urban Area must be reported in mid-January, please send your response to us no later than Monday, January 8. Responding by that date will ensure that your price can be used in our calculations. Your individual report, of course, will be kept strictly confidential; we will report only the average of all responses. Thank you for your help in maintaining a reliable report for Urban Area. Your continuing coopera-tion is both needed and appreciated. Cordially, Your Name Title FULL PURCHASE PRICE FOR HOUSE: $____________________Square Footage:___________ encl: House specifications
Business reply envelope
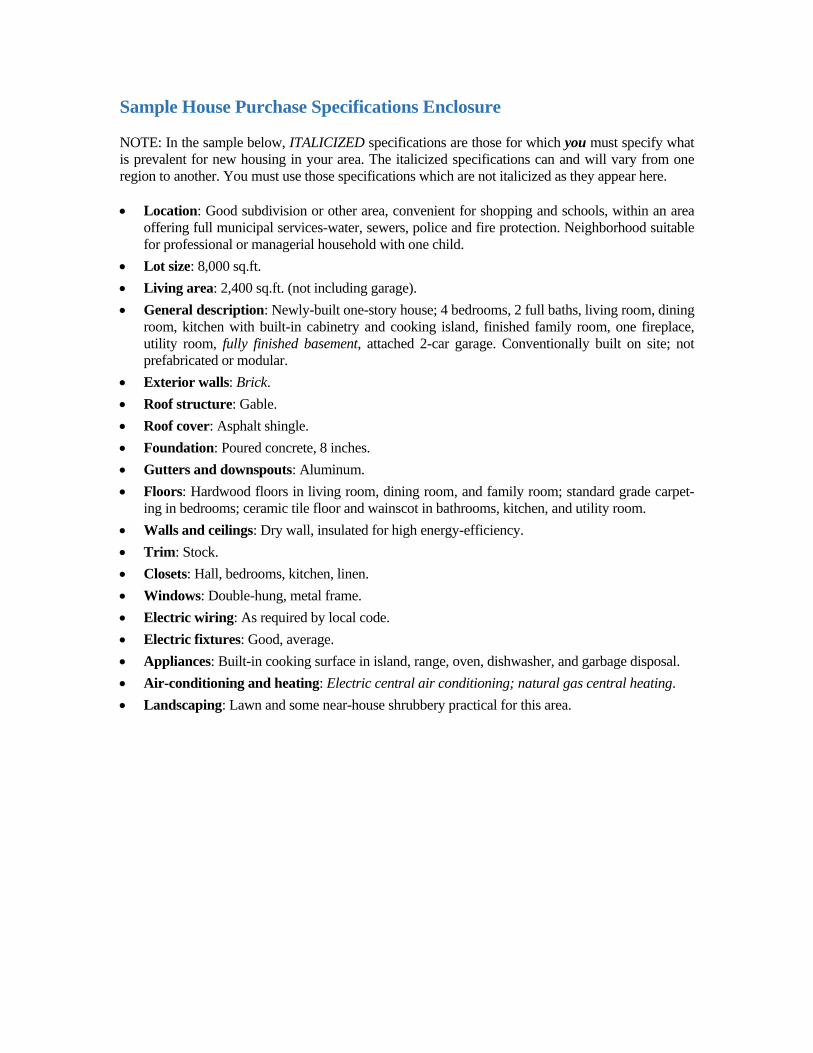
Sample House Purchase Specifications Enclosure NOTE: In the sample below, ITALICIZED specifications are those for which you must specify what is prevalent for new housing in your area. The italicized specifications can and will vary from one region to another. You must use those specifications which are not italicized as they appear here. Location: Good subdivision or other area, convenient for shopping and schools, within an area
offering full municipal services-water, sewers, police and fire protection. Neighborhood suitable for professional or managerial household with one child.
Lot size: 8,000 sq.ft.
Living area: 2,400 sq.ft. (not including garage).
General description: Newly-built one-story house; 4 bedrooms, 2 full baths, living room, dining room, kitchen with built-in cabinetry and cooking island, finished family room, one fireplace, utility room, fully finished basement, attached 2-car garage. Conventionally built on site; not prefabricated or modular.
Exterior walls: Brick.
Roof structure: Gable.
Roof cover: Asphalt shingle.
Foundation: Poured concrete, 8 inches.
Gutters and downspouts: Aluminum.
Floors: Hardwood floors in living room, dining room, and family room; standard grade carpet-ing in bedrooms; ceramic tile floor and wainscot in bathrooms, kitchen, and utility room.
Walls and ceilings: Dry wall, insulated for high energy-efficiency.
Trim: Stock.
Closets: Hall, bedrooms, kitchen, linen.
Windows: Double-hung, metal frame.
Electric wiring: As required by local code.
Electric fixtures: Good, average.
Appliances: Built-in cooking surface in island, range, oven, dishwasher, and garbage disposal.
Air-conditioning and heating: Electric central air conditioning; natural gas central heating.
Landscaping: Lawn and some near-house shrubbery practical for this area.
Related Documents