1 Supplementary Figure S1. Density distribution plots for the constructed pGRS according to the obesity status in study population 1. (A) Density is distribution plot for normal weight and children with obesity. (B) Density distribution plot with the inclusion of overweight individuals. Supplementary Figure S2. Bar plot showing the number of normal weight, overweight and children with obesity according to each quartile of the pGRS in the study population 1.

Welcome message from author
This document is posted to help you gain knowledge. Please leave a comment to let me know what you think about it! Share it to your friends and learn new things together.
Transcript
1
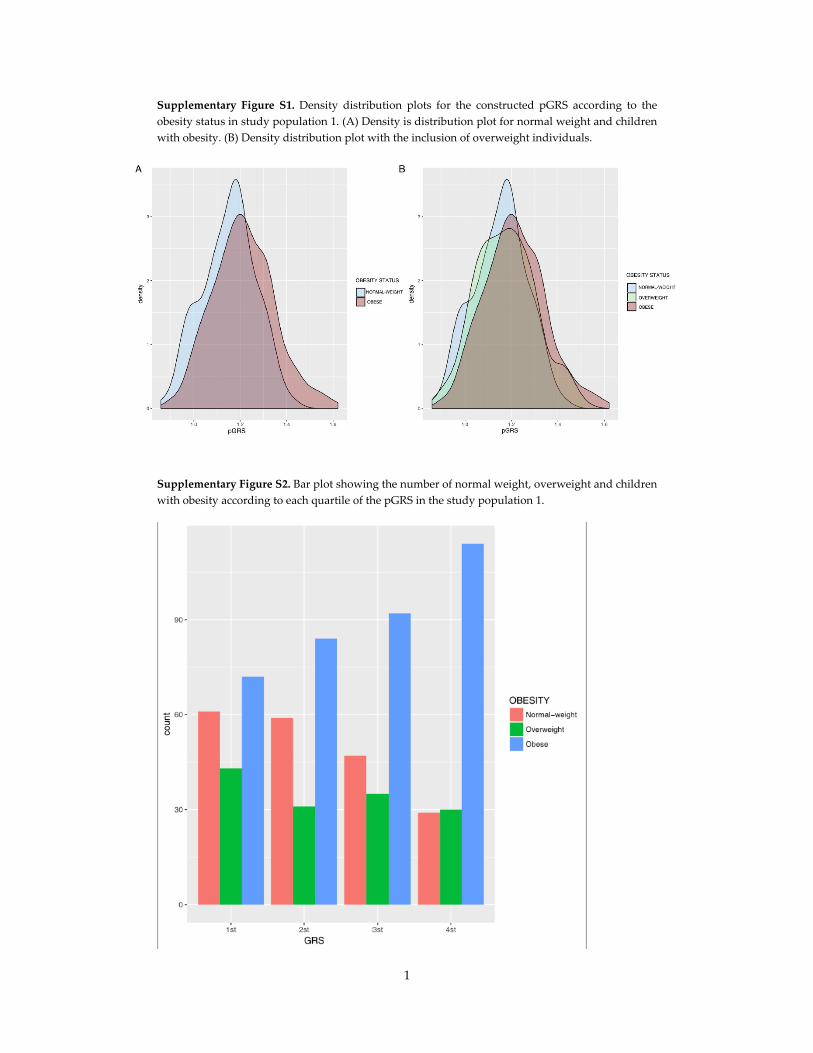
Supplementary Figure S1. Density distribution plots for the constructed pGRS according to the
obesity status in study population 1. (A) Density is distribution plot for normal weight and children
with obesity. (B) Density distribution plot with the inclusion of overweight individuals.
Supplementary Figure S2. Bar plot showing the number of normal weight, overweight and children
with obesity according to each quartile of the pGRS in the study population 1.
2
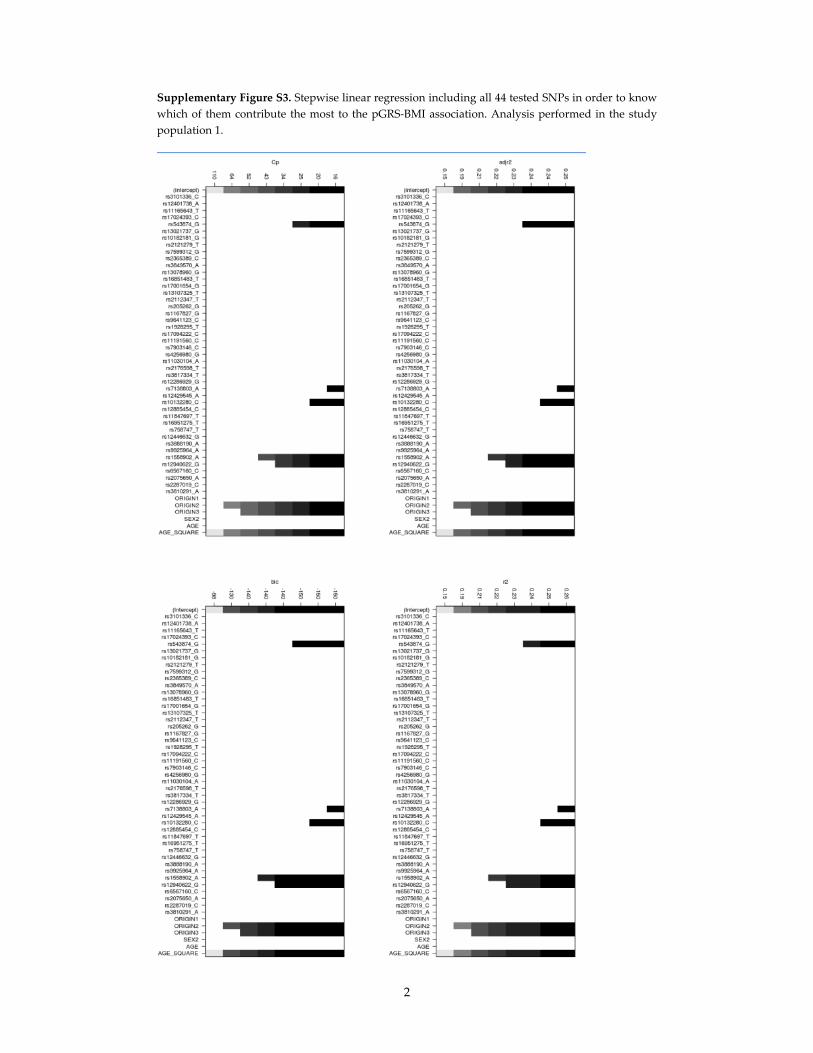
Supplementary Figure S3. Stepwise linear regression including all 44 tested SNPs in order to know
which of them contribute the most to the pGRS‐BMI association. Analysis performed in the study
population 1.
3
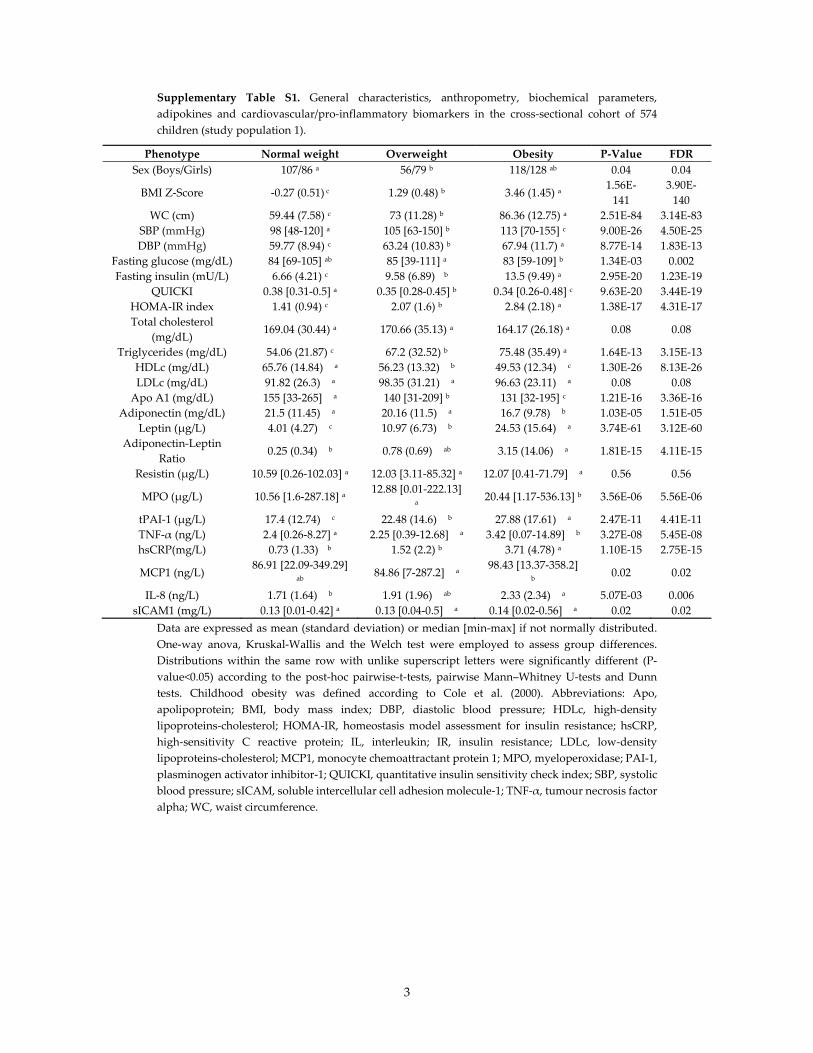
Supplementary Table S1. General characteristics, anthropometry, biochemical parameters,
adipokines and cardiovascular/pro‐inflammatory biomarkers in the cross‐sectional cohort of 574
children (study population 1).
Phenotype Normal weight Overweight Obesity P‐Value FDR
Sex (Boys/Girls) 107/86 a 56/79 b 118/128 ab 0.04 0.04
BMI Z‐Score ‐0.27 (0.51) c 1.29 (0.48) b 3.46 (1.45) a 1.56E‐
141
3.90E‐
140
WC (cm) 59.44 (7.58) c 73 (11.28) b 86.36 (12.75) a 2.51E‐84 3.14E‐83
SBP (mmHg) 98 [48‐120] a 105 [63‐150] b 113 [70‐155] c 9.00E‐26 4.50E‐25
DBP (mmHg) 59.77 (8.94) c 63.24 (10.83) b 67.94 (11.7) a 8.77E‐14 1.83E‐13
Fasting glucose (mg/dL) 84 [69‐105] ab 85 [39‐111] a 83 [59‐109] b 1.34E‐03 0.002
Fasting insulin (mU/L) 6.66 (4.21) c 9.58 (6.89) b 13.5 (9.49) a 2.95E‐20 1.23E‐19
QUICKI 0.38 [0.31‐0.5] a 0.35 [0.28‐0.45] b 0.34 [0.26‐0.48] c 9.63E‐20 3.44E‐19
HOMA‐IR index 1.41 (0.94) c 2.07 (1.6) b 2.84 (2.18) a 1.38E‐17 4.31E‐17
Total cholesterol
(mg/dL) 169.04 (30.44) a 170.66 (35.13) a 164.17 (26.18) a 0.08 0.08
Triglycerides (mg/dL) 54.06 (21.87) c 67.2 (32.52) b 75.48 (35.49) a 1.64E‐13 3.15E‐13
HDLc (mg/dL) 65.76 (14.84) a 56.23 (13.32) b 49.53 (12.34) c 1.30E‐26 8.13E‐26
LDLc (mg/dL) 91.82 (26.3) a 98.35 (31.21) a 96.63 (23.11) a 0.08 0.08
Apo A1 (mg/dL) 155 [33‐265] a 140 [31‐209] b 131 [32‐195] c 1.21E‐16 3.36E‐16
Adiponectin (mg/dL) 21.5 (11.45) a 20.16 (11.5) a 16.7 (9.78) b 1.03E‐05 1.51E‐05
Leptin (μg/L) 4.01 (4.27) c 10.97 (6.73) b 24.53 (15.64) a 3.74E‐61 3.12E‐60
Adiponectin‐Leptin
Ratio 0.25 (0.34) b 0.78 (0.69) ab 3.15 (14.06) a 1.81E‐15 4.11E‐15
Resistin (μg/L) 10.59 [0.26‐102.03] a 12.03 [3.11‐85.32] a 12.07 [0.41‐71.79] a 0.56 0.56
MPO (μg/L) 10.56 [1.6‐287.18] a 12.88 [0.01‐222.13]
a 20.44 [1.17‐536.13] b 3.56E‐06 5.56E‐06
tPAI‐1 (μg/L) 17.4 (12.74) c 22.48 (14.6) b 27.88 (17.61) a 2.47E‐11 4.41E‐11
TNF‐α (ng/L) 2.4 [0.26‐8.27] a 2.25 [0.39‐12.68] a 3.42 [0.07‐14.89] b 3.27E‐08 5.45E‐08
hsCRP(mg/L) 0.73 (1.33) b 1.52 (2.2) b 3.71 (4.78) a 1.10E‐15 2.75E‐15
MCP1 (ng/L) 86.91 [22.09‐349.29]
ab 84.86 [7‐287.2] a
98.43 [13.37‐358.2] b
0.02 0.02
IL‐8 (ng/L) 1.71 (1.64) b 1.91 (1.96) ab 2.33 (2.34) a 5.07E‐03 0.006
sICAM1 (mg/L) 0.13 [0.01‐0.42] a 0.13 [0.04‐0.5] a 0.14 [0.02‐0.56] a 0.02 0.02
Data are expressed as mean (standard deviation) or median [min‐max] if not normally distributed.
One‐way anova, Kruskal‐Wallis and the Welch test were employed to assess group differences.
Distributions within the same row with unlike superscript letters were significantly different (P‐
value<0.05) according to the post‐hoc pairwise‐t‐tests, pairwise Mann–Whitney U‐tests and Dunn
tests. Childhood obesity was defined according to Cole et al. (2000). Abbreviations: Apo,
apolipoprotein; BMI, body mass index; DBP, diastolic blood pressure; HDLc, high‐density
lipoproteins‐cholesterol; HOMA‐IR, homeostasis model assessment for insulin resistance; hsCRP,
high‐sensitivity C reactive protein; IL, interleukin; IR, insulin resistance; LDLc, low‐density
lipoproteins‐cholesterol; MCP1, monocyte chemoattractant protein 1; MPO, myeloperoxidase; PAI‐1,
plasminogen activator inhibitor‐1; QUICKI, quantitative insulin sensitivity check index; SBP, systolic
blood pressure; sICAM, soluble intercellular cell adhesion molecule‐1; TNF‐α, tumour necrosis factor
alpha; WC, waist circumference.
4
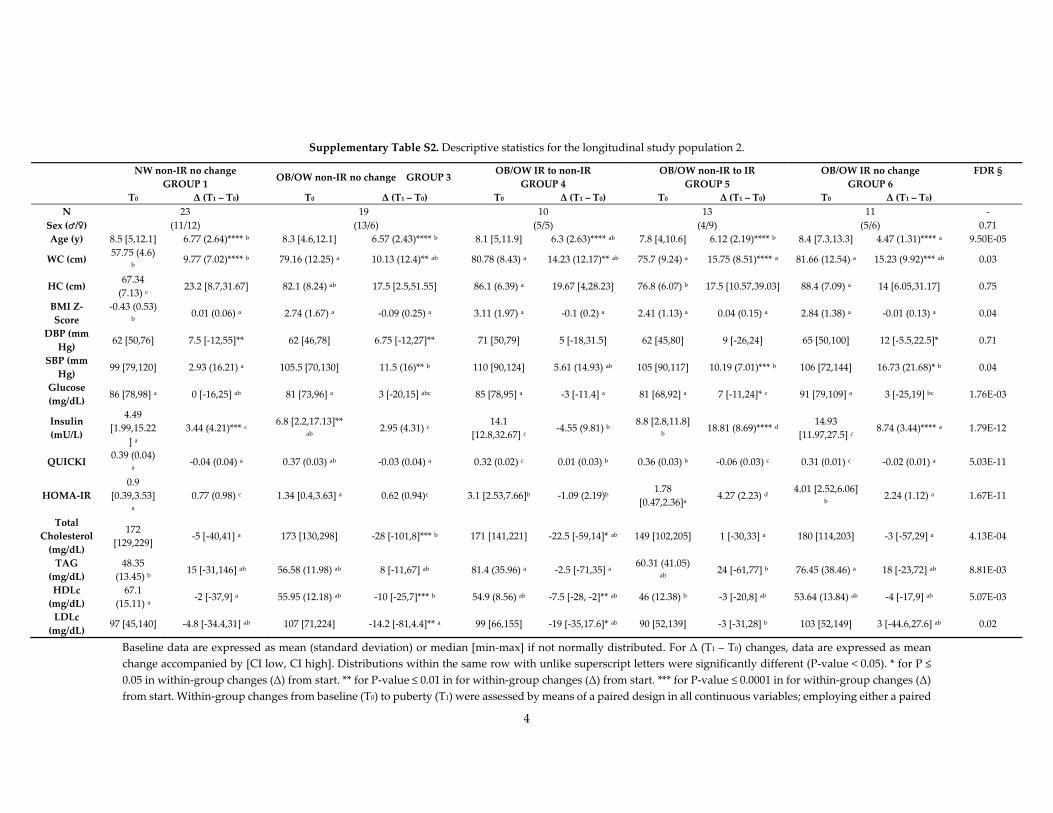
Supplementary Table S2. Descriptive statistics for the longitudinal study population 2.
NW non‐IR no change
GROUP 1 OB/OW non‐IR no change GROUP 3
OB/OW IR to non‐IR
GROUP 4
OB/OW non‐IR to IR
GROUP 5
OB/OW IR no change
GROUP 6
FDR §
T0 Δ (T1 – T0) T0 Δ (T1 – T0) T0 Δ (T1 – T0) T0 Δ (T1 – T0) T0 Δ (T1 – T0)
N 23 19 10 13 11 ‐
Sex (♂/♀) (11/12) (13/6) (5/5) (4/9) (5/6) 0.71
Age (y) 8.5 [5,12.1] 6.77 (2.64)**** b 8.3 [4.6,12.1] 6.57 (2.43)**** b 8.1 [5,11.9] 6.3 (2.63)**** ab 7.8 [4,10.6] 6.12 (2.19)**** b 8.4 [7.3,13.3] 4.47 (1.31)**** a 9.50E‐05
WC (cm) 57.75 (4.6)
b 9.77 (7.02)**** b 79.16 (12.25) a 10.13 (12.4)** ab 80.78 (8.43) a 14.23 (12.17)** ab 75.7 (9.24) a 15.75 (8.51)**** a 81.66 (12.54) a 15.23 (9.92)*** ab 0.03
HC (cm) 67.34
(7.13) c 23.2 [8.7,31.67] 82.1 (8.24) ab 17.5 [2.5,51.55] 86.1 (6.39) a 19.67 [4,28.23] 76.8 (6.07) b 17.5 [10.57,39.03] 88.4 (7.09) a 14 [6.05,31.17] 0.75
BMI Z‐
Score
‐0.43 (0.53) b
0.01 (0.06) a 2.74 (1.67) a ‐0.09 (0.25) a 3.11 (1.97) a ‐0.1 (0.2) a 2.41 (1.13) a 0.04 (0.15) a 2.84 (1.38) a ‐0.01 (0.13) a 0.04
DBP (mm
Hg) 62 [50,76] 7.5 [‐12,55]** 62 [46,78] 6.75 [‐12,27]** 71 [50,79] 5 [‐18,31.5] 62 [45,80] 9 [‐26,24] 65 [50,100] 12 [‐5.5,22.5]* 0.71
SBP (mm
Hg) 99 [79,120] 2.93 (16.21) a 105.5 [70,130] 11.5 (16)** b 110 [90,124] 5.61 (14.93) ab 105 [90,117] 10.19 (7.01)*** b 106 [72,144] 16.73 (21.68)* b 0.04
Glucose
(mg/dL) 86 [78,98] a 0 [‐16,25] ab 81 [73,96] a 3 [‐20,15] abc 85 [78,95] a ‐3 [‐11.4] a 81 [68,92] a 7 [‐11,24]* c 91 [79,109] a 3 [‐25,19] bc 1.76E‐03
Insulin
(mU/L)
4.49
[1.99,15.22
] a 3.44 (4.21)*** c
6.8 [2.2,17.13]** ab
2.95 (4.31) c 14.1
[12.8,32.67] c ‐4.55 (9.81) b
8.8 [2.8,11.8] b
18.81 (8.69)**** d 14.93
[11.97,27.5] c 8.74 (3.44)**** a 1.79E‐12
QUICKI 0.39 (0.04)
a ‐0.04 (0.04) a 0.37 (0.03) ab ‐0.03 (0.04) a 0.32 (0.02) c 0.01 (0.03) b 0.36 (0.03) b ‐0.06 (0.03) c 0.31 (0.01) c ‐0.02 (0.01) a 5.03E‐11
HOMA‐IR
0.9
[0.39,3.53] a
0.77 (0.98) c 1.34 [0.4,3.63] a 0.62 (0.94)c 3.1 [2.53,7.66]b ‐1.09 (2.19)b 1.78
[0.47,2.36]a 4.27 (2.23) d
4.01 [2.52,6.06] b
2.24 (1.12) a 1.67E‐11
Total
Cholesterol
(mg/dL)
172
[129,229] ‐5 [‐40,41] a 173 [130,298] ‐28 [‐101,8]*** b 171 [141,221] ‐22.5 [‐59,14]* ab 149 [102,205] 1 [‐30,33] a 180 [114,203] ‐3 [‐57,29] a 4.13E‐04
TAG
(mg/dL)
48.35
(13.45) b 15 [‐31,146] ab 56.58 (11.98) ab 8 [‐11,67] ab 81.4 (35.96) a ‐2.5 [‐71,35] a
60.31 (41.05) ab
24 [‐61,77] b 76.45 (38.46) a 18 [‐23,72] ab 8.81E‐03
HDLc
(mg/dL)
67.1
(15.11) a ‐2 [‐37,9] a 55.95 (12.18) ab ‐10 [‐25,7]*** b 54.9 (8.56) ab ‐7.5 [‐28, ‐2]** ab 46 (12.38) b ‐3 [‐20,8] ab 53.64 (13.84) ab ‐4 [‐17,9] ab 5.07E‐03
LDLc
(mg/dL) 97 [45,140] ‐4.8 [‐34.4,31] ab 107 [71,224] ‐14.2 [‐81,4.4]** a 99 [66,155] ‐19 [‐35,17.6]* ab 90 [52,139] ‐3 [‐31,28] b 103 [52,149] 3 [‐44.6,27.6] ab 0.02
Baseline data are expressed as mean (standard deviation) or median [min‐max] if not normally distributed. For Δ (T1 – T0) changes, data are expressed as mean
change accompanied by [CI low, CI high]. Distributions within the same row with unlike superscript letters were significantly different (P‐value < 0.05). * for P ≤
0.05 in within‐group changes (Δ) from start. ** for P‐value ≤ 0.01 in for within‐group changes (Δ) from start. *** for P‐value ≤ 0.0001 in for within‐group changes (Δ)
from start. Within‐group changes from baseline (T0) to puberty (T1) were assessed by means of a paired design in all continuous variables; employing either a paired
5
t‐test or a Wilcoxon signed‐rank test. Between‐group differences were assessed by the one‐way ANOVA, Kruskal‐Wallis or Welch tests to the computed delta values
(T1–T0) for each continuous measurement. § refers to FDR for between group Delta comparisons. Abbreviations: BMI, body mass index; CI, confidence interval;
DBP, diastolic blood pressure; FDR, false discovery rate; HC, hip circumference, HDLc, high‐density lipoproteins‐cholesterol; HOMA‐IR, homeostasis model
assessment for insulin resistance; LDLc, low‐density lipoproteins‐cholesterol; QUICKI, quantitative insulin sensitivity check index; SBP, systolic blood pressure;
TAG, triglycerides; WC, waist circumference.
6
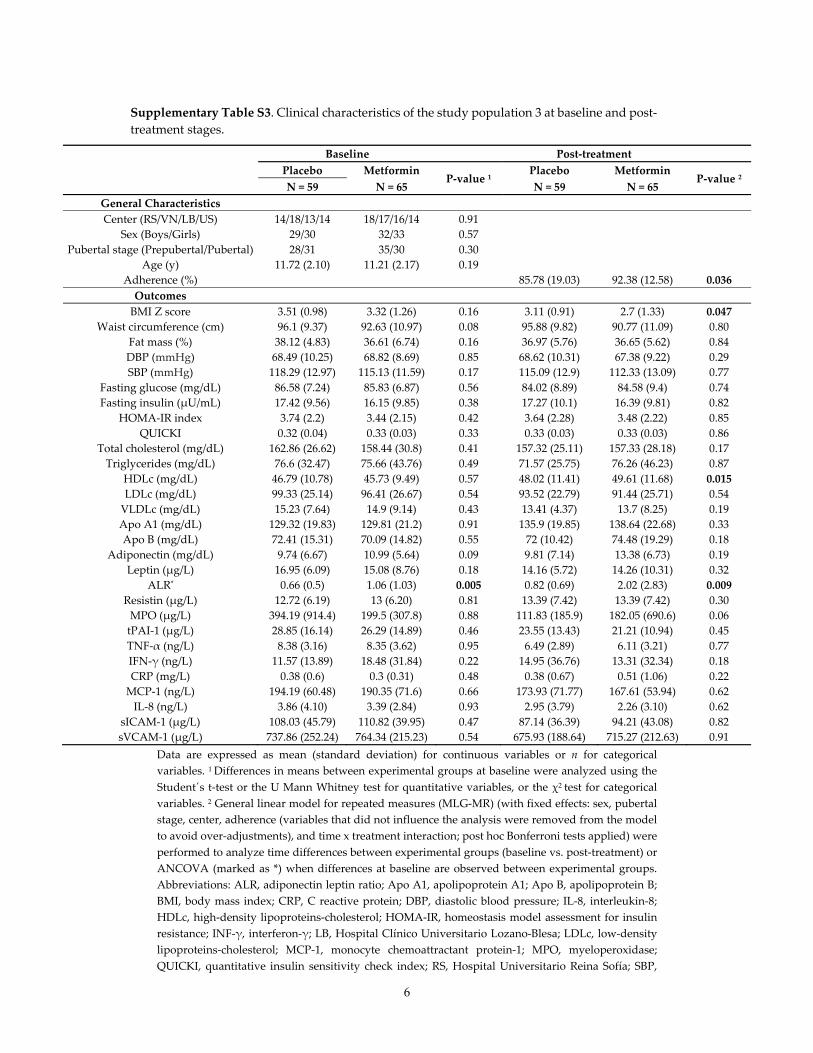
Supplementary Table S3. Clinical characteristics of the study population 3 at baseline and post‐
treatment stages.
Baseline Post‐treatment
Placebo Metformin
P‐value 1 Placebo Metformin
P‐value 2 N = 59 N = 65 N = 59 N = 65
General Characteristics
Center (RS/VN/LB/US) 14/18/13/14 18/17/16/14 0.91
Sex (Boys/Girls) 29/30 32/33 0.57
Pubertal stage (Prepubertal/Pubertal) 28/31 35/30 0.30
Age (y) 11.72 (2.10) 11.21 (2.17) 0.19
Adherence (%) 85.78 (19.03) 92.38 (12.58) 0.036
Outcomes
BMI Z score 3.51 (0.98) 3.32 (1.26) 0.16 3.11 (0.91) 2.7 (1.33) 0.047
Waist circumference (cm) 96.1 (9.37) 92.63 (10.97) 0.08 95.88 (9.82) 90.77 (11.09) 0.80
Fat mass (%) 38.12 (4.83) 36.61 (6.74) 0.16 36.97 (5.76) 36.65 (5.62) 0.84
DBP (mmHg) 68.49 (10.25) 68.82 (8.69) 0.85 68.62 (10.31) 67.38 (9.22) 0.29
SBP (mmHg) 118.29 (12.97) 115.13 (11.59) 0.17 115.09 (12.9) 112.33 (13.09) 0.77
Fasting glucose (mg/dL) 86.58 (7.24) 85.83 (6.87) 0.56 84.02 (8.89) 84.58 (9.4) 0.74
Fasting insulin (μU/mL) 17.42 (9.56) 16.15 (9.85) 0.38 17.27 (10.1) 16.39 (9.81) 0.82
HOMA‐IR index 3.74 (2.2) 3.44 (2.15) 0.42 3.64 (2.28) 3.48 (2.22) 0.85
QUICKI 0.32 (0.04) 0.33 (0.03) 0.33 0.33 (0.03) 0.33 (0.03) 0.86
Total cholesterol (mg/dL) 162.86 (26.62) 158.44 (30.8) 0.41 157.32 (25.11) 157.33 (28.18) 0.17
Triglycerides (mg/dL) 76.6 (32.47) 75.66 (43.76) 0.49 71.57 (25.75) 76.26 (46.23) 0.87
HDLc (mg/dL) 46.79 (10.78) 45.73 (9.49) 0.57 48.02 (11.41) 49.61 (11.68) 0.015
LDLc (mg/dL) 99.33 (25.14) 96.41 (26.67) 0.54 93.52 (22.79) 91.44 (25.71) 0.54
VLDLc (mg/dL) 15.23 (7.64) 14.9 (9.14) 0.43 13.41 (4.37) 13.7 (8.25) 0.19
Apo A1 (mg/dL) 129.32 (19.83) 129.81 (21.2) 0.91 135.9 (19.85) 138.64 (22.68) 0.33
Apo B (mg/dL) 72.41 (15.31) 70.09 (14.82) 0.55 72 (10.42) 74.48 (19.29) 0.18
Adiponectin (mg/dL) 9.74 (6.67) 10.99 (5.64) 0.09 9.81 (7.14) 13.38 (6.73) 0.19
Leptin (μg/L) 16.95 (6.09) 15.08 (8.76) 0.18 14.16 (5.72) 14.26 (10.31) 0.32
ALR* 0.66 (0.5) 1.06 (1.03) 0.005 0.82 (0.69) 2.02 (2.83) 0.009
Resistin (μg/L) 12.72 (6.19) 13 (6.20) 0.81 13.39 (7.42) 13.39 (7.42) 0.30
MPO (μg/L) 394.19 (914.4) 199.5 (307.8) 0.88 111.83 (185.9) 182.05 (690.6) 0.06
tPAI‐1 (μg/L) 28.85 (16.14) 26.29 (14.89) 0.46 23.55 (13.43) 21.21 (10.94) 0.45
TNF‐α (ng/L) 8.38 (3.16) 8.35 (3.62) 0.95 6.49 (2.89) 6.11 (3.21) 0.77
IFN‐γ (ng/L) 11.57 (13.89) 18.48 (31.84) 0.22 14.95 (36.76) 13.31 (32.34) 0.18
CRP (mg/L) 0.38 (0.6) 0.3 (0.31) 0.48 0.38 (0.67) 0.51 (1.06) 0.22
MCP‐1 (ng/L) 194.19 (60.48) 190.35 (71.6) 0.66 173.93 (71.77) 167.61 (53.94) 0.62
IL‐8 (ng/L) 3.86 (4.10) 3.39 (2.84) 0.93 2.95 (3.79) 2.26 (3.10) 0.62
sICAM‐1 (μg/L) 108.03 (45.79) 110.82 (39.95) 0.47 87.14 (36.39) 94.21 (43.08) 0.82
sVCAM‐1 (μg/L) 737.86 (252.24) 764.34 (215.23) 0.54 675.93 (188.64) 715.27 (212.63) 0.91
Data are expressed as mean (standard deviation) for continuous variables or n for categorical
variables. 1 Differences in means between experimental groups at baseline were analyzed using the
Student´s t‐test or the U Mann Whitney test for quantitative variables, or the χ2 test for categorical
variables. 2 General linear model for repeated measures (MLG‐MR) (with fixed effects: sex, pubertal
stage, center, adherence (variables that did not influence the analysis were removed from the model
to avoid over‐adjustments), and time x treatment interaction; post hoc Bonferroni tests applied) were
performed to analyze time differences between experimental groups (baseline vs. post‐treatment) or
ANCOVA (marked as *) when differences at baseline are observed between experimental groups.
Abbreviations: ALR, adiponectin leptin ratio; Apo A1, apolipoprotein A1; Apo B, apolipoprotein B;
BMI, body mass index; CRP, C reactive protein; DBP, diastolic blood pressure; IL‐8, interleukin‐8;
HDLc, high‐density lipoproteins‐cholesterol; HOMA‐IR, homeostasis model assessment for insulin
resistance; INF‐γ, interferon‐γ; LB, Hospital Clínico Universitario Lozano‐Blesa; LDLc, low‐density
lipoproteins‐cholesterol; MCP‐1, monocyte chemoattractant protein‐1; MPO, myeloperoxidase;
QUICKI, quantitative insulin sensitivity check index; RS, Hospital Universitario Reina Sofía; SBP,
7
systolic blood pressure; sICAM‐1, soluble intercellular adhesion molecule‐1, sVCAM‐1, soluble
vascular adhesion molecule‐1; TNF‐α, tumor necrosis factor‐α; tPAI‐1, total plasminogen activator
inhibitor‐1; US, Hospital Universitario de Santiago de Compostela; VLDLc, very low‐density
lipoproteins‐cholesterol; VN, Hospital Universitario Virgen de las Nieves.
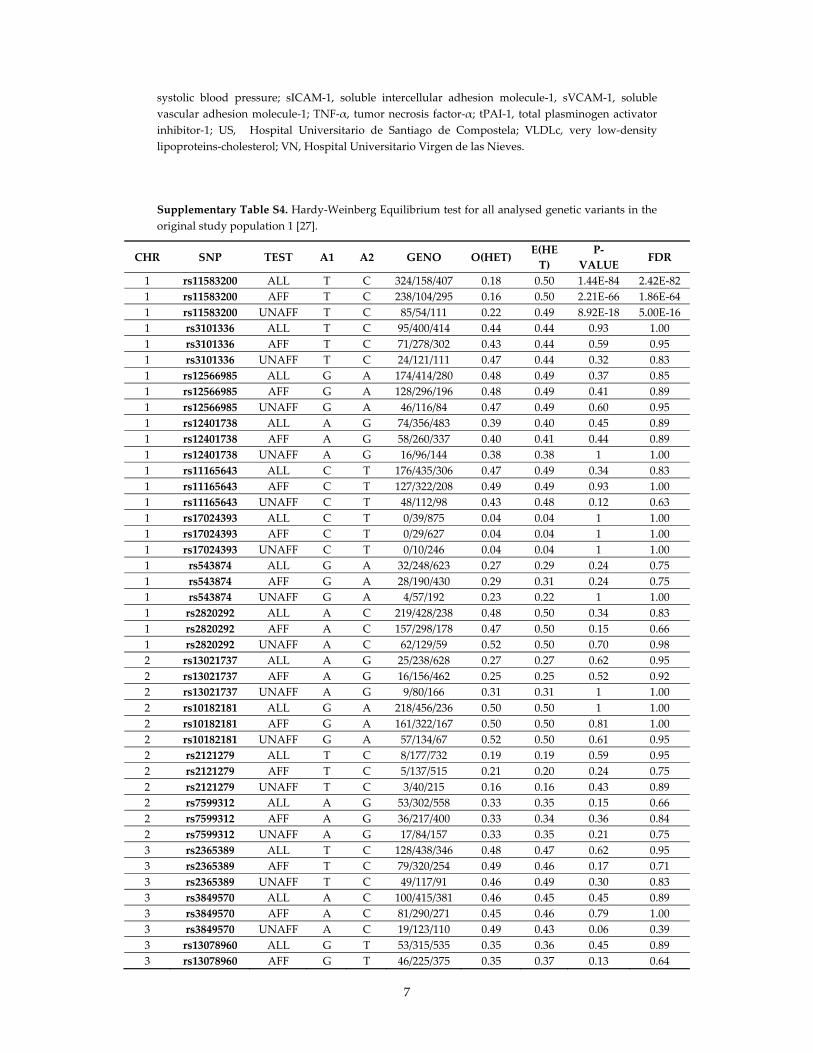
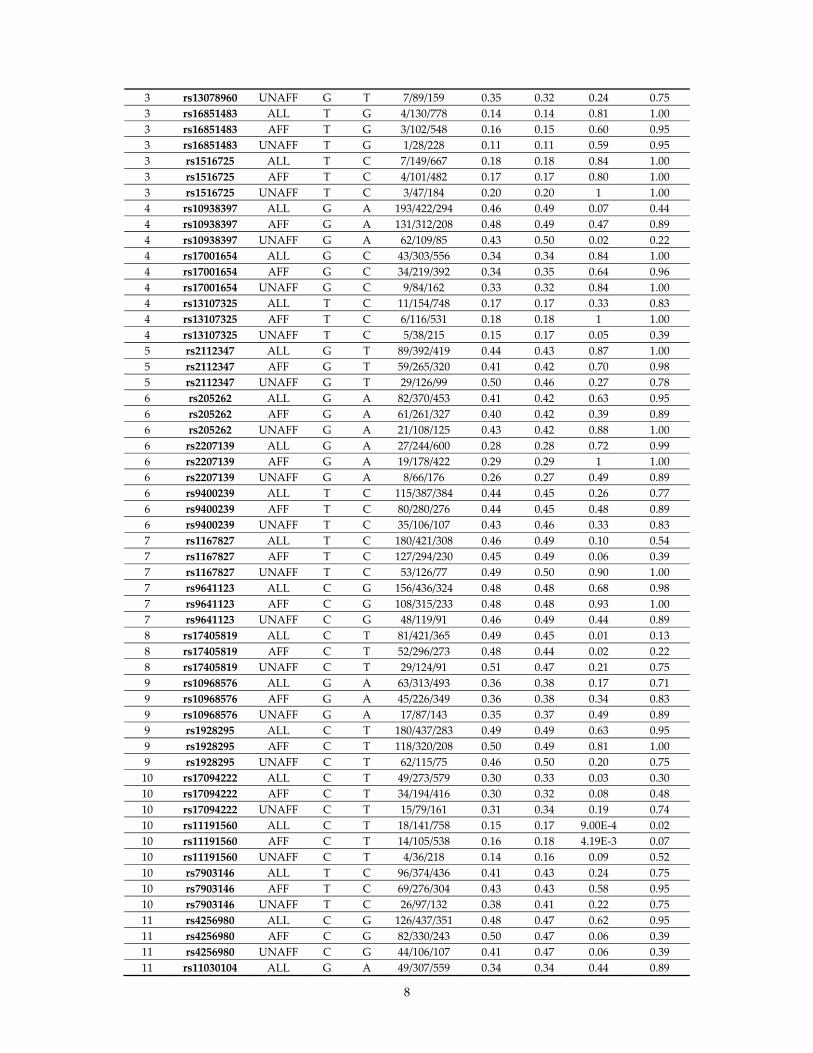
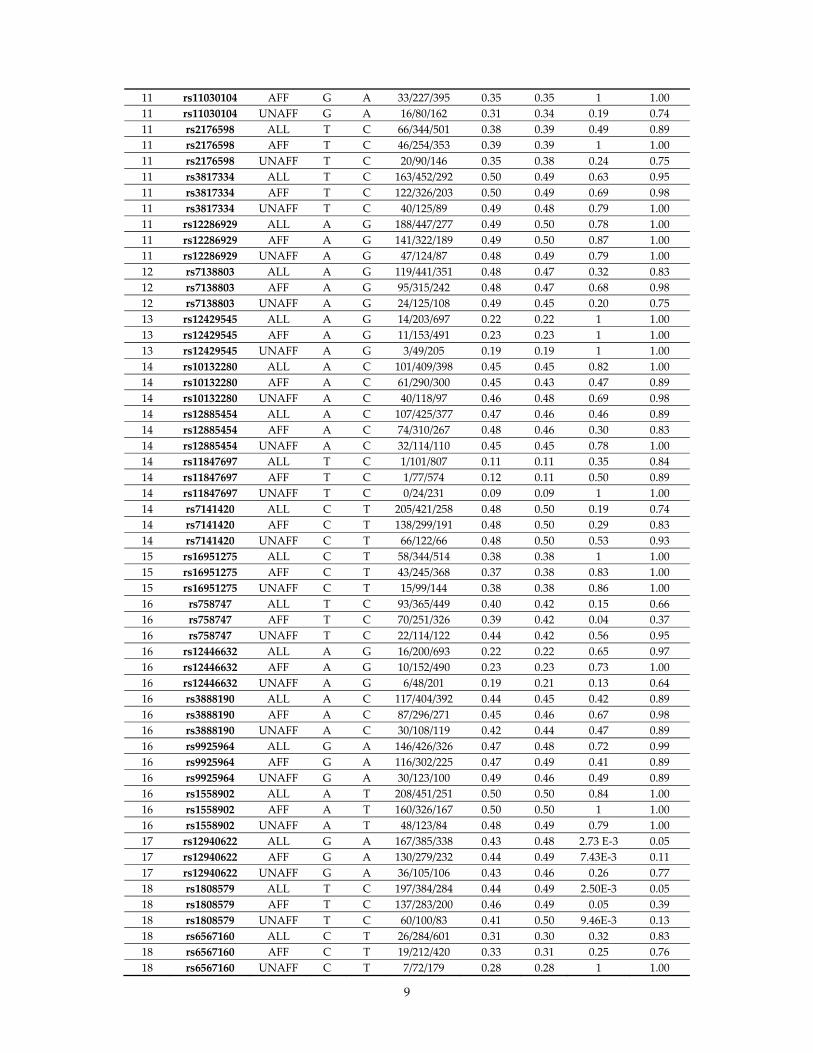
Supplementary Table S4. Hardy‐Weinberg Equilibrium test for all analysed genetic variants in the
original study population 1 [27].
CHR SNP TEST A1 A2 GENO O(HET) E(HE
T)
P‐
VALUE FDR
1 rs11583200 ALL T C 324/158/407 0.18 0.50 1.44E‐84 2.42E‐82
1 rs11583200 AFF T C 238/104/295 0.16 0.50 2.21E‐66 1.86E‐64
1 rs11583200 UNAFF T C 85/54/111 0.22 0.49 8.92E‐18 5.00E‐16
1 rs3101336 ALL T C 95/400/414 0.44 0.44 0.93 1.00
1 rs3101336 AFF T C 71/278/302 0.43 0.44 0.59 0.95
1 rs3101336 UNAFF T C 24/121/111 0.47 0.44 0.32 0.83
1 rs12566985 ALL G A 174/414/280 0.48 0.49 0.37 0.85
1 rs12566985 AFF G A 128/296/196 0.48 0.49 0.41 0.89
1 rs12566985 UNAFF G A 46/116/84 0.47 0.49 0.60 0.95
1 rs12401738 ALL A G 74/356/483 0.39 0.40 0.45 0.89
1 rs12401738 AFF A G 58/260/337 0.40 0.41 0.44 0.89
1 rs12401738 UNAFF A G 16/96/144 0.38 0.38 1 1.00
1 rs11165643 ALL C T 176/435/306 0.47 0.49 0.34 0.83
1 rs11165643 AFF C T 127/322/208 0.49 0.49 0.93 1.00
1 rs11165643 UNAFF C T 48/112/98 0.43 0.48 0.12 0.63
1 rs17024393 ALL C T 0/39/875 0.04 0.04 1 1.00
1 rs17024393 AFF C T 0/29/627 0.04 0.04 1 1.00
1 rs17024393 UNAFF C T 0/10/246 0.04 0.04 1 1.00
1 rs543874 ALL G A 32/248/623 0.27 0.29 0.24 0.75
1 rs543874 AFF G A 28/190/430 0.29 0.31 0.24 0.75
1 rs543874 UNAFF G A 4/57/192 0.23 0.22 1 1.00
1 rs2820292 ALL A C 219/428/238 0.48 0.50 0.34 0.83
1 rs2820292 AFF A C 157/298/178 0.47 0.50 0.15 0.66
1 rs2820292 UNAFF A C 62/129/59 0.52 0.50 0.70 0.98
2 rs13021737 ALL A G 25/238/628 0.27 0.27 0.62 0.95
2 rs13021737 AFF A G 16/156/462 0.25 0.25 0.52 0.92
2 rs13021737 UNAFF A G 9/80/166 0.31 0.31 1 1.00
2 rs10182181 ALL G A 218/456/236 0.50 0.50 1 1.00
2 rs10182181 AFF G A 161/322/167 0.50 0.50 0.81 1.00
2 rs10182181 UNAFF G A 57/134/67 0.52 0.50 0.61 0.95
2 rs2121279 ALL T C 8/177/732 0.19 0.19 0.59 0.95
2 rs2121279 AFF T C 5/137/515 0.21 0.20 0.24 0.75
2 rs2121279 UNAFF T C 3/40/215 0.16 0.16 0.43 0.89
2 rs7599312 ALL A G 53/302/558 0.33 0.35 0.15 0.66
2 rs7599312 AFF A G 36/217/400 0.33 0.34 0.36 0.84
2 rs7599312 UNAFF A G 17/84/157 0.33 0.35 0.21 0.75
3 rs2365389 ALL T C 128/438/346 0.48 0.47 0.62 0.95
3 rs2365389 AFF T C 79/320/254 0.49 0.46 0.17 0.71
3 rs2365389 UNAFF T C 49/117/91 0.46 0.49 0.30 0.83
3 rs3849570 ALL A C 100/415/381 0.46 0.45 0.45 0.89
3 rs3849570 AFF A C 81/290/271 0.45 0.46 0.79 1.00
3 rs3849570 UNAFF A C 19/123/110 0.49 0.43 0.06 0.39
3 rs13078960 ALL G T 53/315/535 0.35 0.36 0.45 0.89
3 rs13078960 AFF G T 46/225/375 0.35 0.37 0.13 0.64
8
3 rs13078960 UNAFF G T 7/89/159 0.35 0.32 0.24 0.75
3 rs16851483 ALL T G 4/130/778 0.14 0.14 0.81 1.00
3 rs16851483 AFF T G 3/102/548 0.16 0.15 0.60 0.95
3 rs16851483 UNAFF T G 1/28/228 0.11 0.11 0.59 0.95
3 rs1516725 ALL T C 7/149/667 0.18 0.18 0.84 1.00
3 rs1516725 AFF T C 4/101/482 0.17 0.17 0.80 1.00
3 rs1516725 UNAFF T C 3/47/184 0.20 0.20 1 1.00
4 rs10938397 ALL G A 193/422/294 0.46 0.49 0.07 0.44
4 rs10938397 AFF G A 131/312/208 0.48 0.49 0.47 0.89
4 rs10938397 UNAFF G A 62/109/85 0.43 0.50 0.02 0.22
4 rs17001654 ALL G C 43/303/556 0.34 0.34 0.84 1.00
4 rs17001654 AFF G C 34/219/392 0.34 0.35 0.64 0.96
4 rs17001654 UNAFF G C 9/84/162 0.33 0.32 0.84 1.00
4 rs13107325 ALL T C 11/154/748 0.17 0.17 0.33 0.83
4 rs13107325 AFF T C 6/116/531 0.18 0.18 1 1.00
4 rs13107325 UNAFF T C 5/38/215 0.15 0.17 0.05 0.39
5 rs2112347 ALL G T 89/392/419 0.44 0.43 0.87 1.00
5 rs2112347 AFF G T 59/265/320 0.41 0.42 0.70 0.98
5 rs2112347 UNAFF G T 29/126/99 0.50 0.46 0.27 0.78
6 rs205262 ALL G A 82/370/453 0.41 0.42 0.63 0.95
6 rs205262 AFF G A 61/261/327 0.40 0.42 0.39 0.89
6 rs205262 UNAFF G A 21/108/125 0.43 0.42 0.88 1.00
6 rs2207139 ALL G A 27/244/600 0.28 0.28 0.72 0.99
6 rs2207139 AFF G A 19/178/422 0.29 0.29 1 1.00
6 rs2207139 UNAFF G A 8/66/176 0.26 0.27 0.49 0.89
6 rs9400239 ALL T C 115/387/384 0.44 0.45 0.26 0.77
6 rs9400239 AFF T C 80/280/276 0.44 0.45 0.48 0.89
6 rs9400239 UNAFF T C 35/106/107 0.43 0.46 0.33 0.83
7 rs1167827 ALL T C 180/421/308 0.46 0.49 0.10 0.54
7 rs1167827 AFF T C 127/294/230 0.45 0.49 0.06 0.39
7 rs1167827 UNAFF T C 53/126/77 0.49 0.50 0.90 1.00
7 rs9641123 ALL C G 156/436/324 0.48 0.48 0.68 0.98
7 rs9641123 AFF C G 108/315/233 0.48 0.48 0.93 1.00
7 rs9641123 UNAFF C G 48/119/91 0.46 0.49 0.44 0.89
8 rs17405819 ALL C T 81/421/365 0.49 0.45 0.01 0.13
8 rs17405819 AFF C T 52/296/273 0.48 0.44 0.02 0.22
8 rs17405819 UNAFF C T 29/124/91 0.51 0.47 0.21 0.75
9 rs10968576 ALL G A 63/313/493 0.36 0.38 0.17 0.71
9 rs10968576 AFF G A 45/226/349 0.36 0.38 0.34 0.83
9 rs10968576 UNAFF G A 17/87/143 0.35 0.37 0.49 0.89
9 rs1928295 ALL C T 180/437/283 0.49 0.49 0.63 0.95
9 rs1928295 AFF C T 118/320/208 0.50 0.49 0.81 1.00
9 rs1928295 UNAFF C T 62/115/75 0.46 0.50 0.20 0.75
10 rs17094222 ALL C T 49/273/579 0.30 0.33 0.03 0.30
10 rs17094222 AFF C T 34/194/416 0.30 0.32 0.08 0.48
10 rs17094222 UNAFF C T 15/79/161 0.31 0.34 0.19 0.74
10 rs11191560 ALL C T 18/141/758 0.15 0.17 9.00E‐4 0.02
10 rs11191560 AFF C T 14/105/538 0.16 0.18 4.19E‐3 0.07
10 rs11191560 UNAFF C T 4/36/218 0.14 0.16 0.09 0.52
10 rs7903146 ALL T C 96/374/436 0.41 0.43 0.24 0.75
10 rs7903146 AFF T C 69/276/304 0.43 0.43 0.58 0.95
10 rs7903146 UNAFF T C 26/97/132 0.38 0.41 0.22 0.75
11 rs4256980 ALL C G 126/437/351 0.48 0.47 0.62 0.95
11 rs4256980 AFF C G 82/330/243 0.50 0.47 0.06 0.39
11 rs4256980 UNAFF C G 44/106/107 0.41 0.47 0.06 0.39
11 rs11030104 ALL G A 49/307/559 0.34 0.34 0.44 0.89
9
11 rs11030104 AFF G A 33/227/395 0.35 0.35 1 1.00
11 rs11030104 UNAFF G A 16/80/162 0.31 0.34 0.19 0.74
11 rs2176598 ALL T C 66/344/501 0.38 0.39 0.49 0.89
11 rs2176598 AFF T C 46/254/353 0.39 0.39 1 1.00
11 rs2176598 UNAFF T C 20/90/146 0.35 0.38 0.24 0.75
11 rs3817334 ALL T C 163/452/292 0.50 0.49 0.63 0.95
11 rs3817334 AFF T C 122/326/203 0.50 0.49 0.69 0.98
11 rs3817334 UNAFF T C 40/125/89 0.49 0.48 0.79 1.00
11 rs12286929 ALL A G 188/447/277 0.49 0.50 0.78 1.00
11 rs12286929 AFF A G 141/322/189 0.49 0.50 0.87 1.00
11 rs12286929 UNAFF A G 47/124/87 0.48 0.49 0.79 1.00
12 rs7138803 ALL A G 119/441/351 0.48 0.47 0.32 0.83
12 rs7138803 AFF A G 95/315/242 0.48 0.47 0.68 0.98
12 rs7138803 UNAFF A G 24/125/108 0.49 0.45 0.20 0.75
13 rs12429545 ALL A G 14/203/697 0.22 0.22 1 1.00
13 rs12429545 AFF A G 11/153/491 0.23 0.23 1 1.00
13 rs12429545 UNAFF A G 3/49/205 0.19 0.19 1 1.00
14 rs10132280 ALL A C 101/409/398 0.45 0.45 0.82 1.00
14 rs10132280 AFF A C 61/290/300 0.45 0.43 0.47 0.89
14 rs10132280 UNAFF A C 40/118/97 0.46 0.48 0.69 0.98
14 rs12885454 ALL A C 107/425/377 0.47 0.46 0.46 0.89
14 rs12885454 AFF A C 74/310/267 0.48 0.46 0.30 0.83
14 rs12885454 UNAFF A C 32/114/110 0.45 0.45 0.78 1.00
14 rs11847697 ALL T C 1/101/807 0.11 0.11 0.35 0.84
14 rs11847697 AFF T C 1/77/574 0.12 0.11 0.50 0.89
14 rs11847697 UNAFF T C 0/24/231 0.09 0.09 1 1.00
14 rs7141420 ALL C T 205/421/258 0.48 0.50 0.19 0.74
14 rs7141420 AFF C T 138/299/191 0.48 0.50 0.29 0.83
14 rs7141420 UNAFF C T 66/122/66 0.48 0.50 0.53 0.93
15 rs16951275 ALL C T 58/344/514 0.38 0.38 1 1.00
15 rs16951275 AFF C T 43/245/368 0.37 0.38 0.83 1.00
15 rs16951275 UNAFF C T 15/99/144 0.38 0.38 0.86 1.00
16 rs758747 ALL T C 93/365/449 0.40 0.42 0.15 0.66
16 rs758747 AFF T C 70/251/326 0.39 0.42 0.04 0.37
16 rs758747 UNAFF T C 22/114/122 0.44 0.42 0.56 0.95
16 rs12446632 ALL A G 16/200/693 0.22 0.22 0.65 0.97
16 rs12446632 AFF A G 10/152/490 0.23 0.23 0.73 1.00
16 rs12446632 UNAFF A G 6/48/201 0.19 0.21 0.13 0.64
16 rs3888190 ALL A C 117/404/392 0.44 0.45 0.42 0.89
16 rs3888190 AFF A C 87/296/271 0.45 0.46 0.67 0.98
16 rs3888190 UNAFF A C 30/108/119 0.42 0.44 0.47 0.89
16 rs9925964 ALL G A 146/426/326 0.47 0.48 0.72 0.99
16 rs9925964 AFF G A 116/302/225 0.47 0.49 0.41 0.89
16 rs9925964 UNAFF G A 30/123/100 0.49 0.46 0.49 0.89
16 rs1558902 ALL A T 208/451/251 0.50 0.50 0.84 1.00
16 rs1558902 AFF A T 160/326/167 0.50 0.50 1 1.00
16 rs1558902 UNAFF A T 48/123/84 0.48 0.49 0.79 1.00
17 rs12940622 ALL G A 167/385/338 0.43 0.48 2.73 E‐3 0.05
17 rs12940622 AFF G A 130/279/232 0.44 0.49 7.43E‐3 0.11
17 rs12940622 UNAFF G A 36/105/106 0.43 0.46 0.26 0.77
18 rs1808579 ALL T C 197/384/284 0.44 0.49 2.50E‐3 0.05
18 rs1808579 AFF T C 137/283/200 0.46 0.49 0.05 0.39
18 rs1808579 UNAFF T C 60/100/83 0.41 0.50 9.46E‐3 0.13
18 rs6567160 ALL C T 26/284/601 0.31 0.30 0.32 0.83
18 rs6567160 AFF C T 19/212/420 0.33 0.31 0.25 0.76
18 rs6567160 UNAFF C T 7/72/179 0.28 0.28 1 1.00
10
19 rs29941 ALL G A 38/364/435 0.43 0.39 3.47E‐5 0.00
19 rs29941 AFF G A 29/262/309 0.44 0.39 4.69E‐4 0.01
19 rs29941 UNAFF G A 9/101/126 0.43 0.38 0.05 0.39
19 rs2075650 ALL G A 13/123/776 0.13 0.15 5.00E‐4 0.01
19 rs2075650 AFF G A 9/90/555 0.14 0.15 0.03 0.30
19 rs2075650 UNAFF G A 4/33/219 0.13 0.15 0.06 0.39
19 rs2287019 ALL T C 33/246/634 0.27 0.28 0.15 0.66
19 rs2287019 AFF T C 26/176/451 0.27 0.29 0.10 0.54
19 rs2287019 UNAFF T C 7/70/181 0.27 0.27 1 1.00
19 rs3810291 ALL G A 98/398/411 0.44 0.44 0.93 1.00
19 rs3810291 AFF G A 79/286/289 0.44 0.45 0.54 0.94
19 rs3810291 UNAFF G A 18/111/122 0.44 0.41 0.36 0.84
Each SNP has three entries showing results for either ALL individuals, AFF (overweight and children
with obesity) or UNAFF (normal‐BMI children only). Hardy Weinberg analysis was performed with
the exact test described and implemented by Wigginton et al. (2005). Abbreviations; CHR,
chromosome; SNP, single nucleotide polymorphism; A1, minor allele; A2, alternative allele; GENO,
genotype counts; O(HET), observed heterozygosity; E(HET), expected heterozygosity; FDR, Hardy
Weinberg false discovery rate.
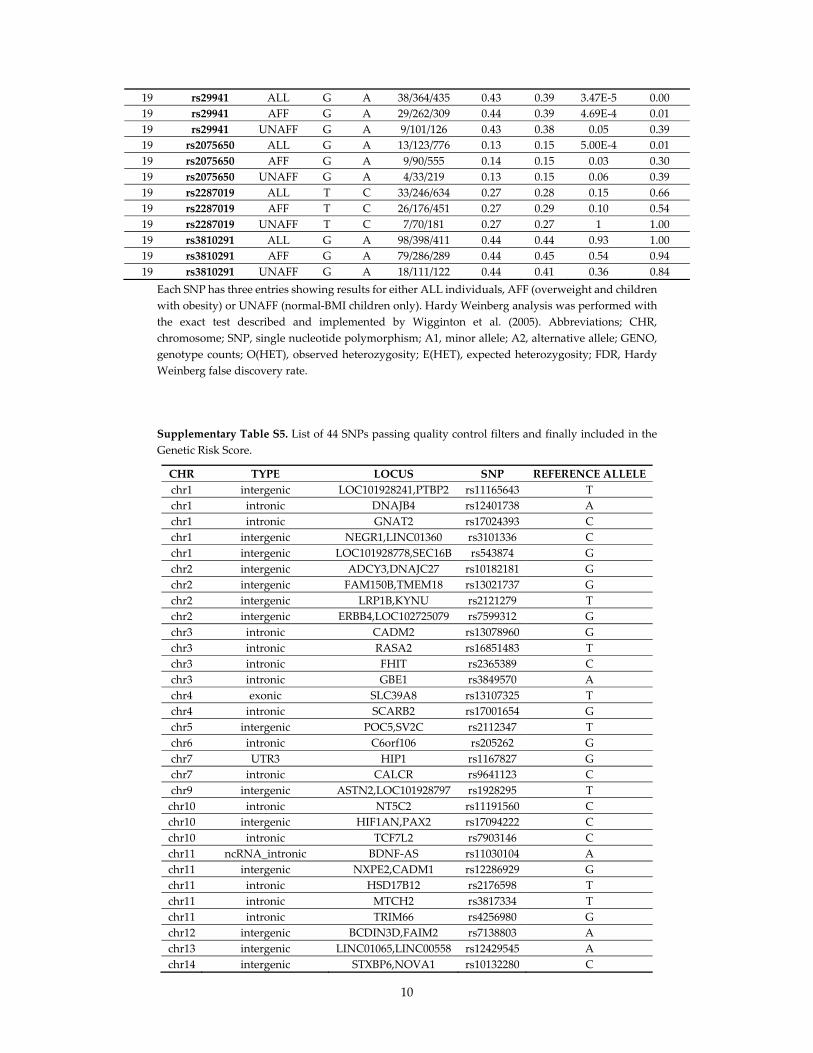
Supplementary Table S5. List of 44 SNPs passing quality control filters and finally included in the
Genetic Risk Score.
CHR TYPE LOCUS SNP REFERENCE ALLELE
chr1 intergenic LOC101928241,PTBP2 rs11165643 T
chr1 intronic DNAJB4 rs12401738 A
chr1 intronic GNAT2 rs17024393 C
chr1 intergenic NEGR1,LINC01360 rs3101336 C
chr1 intergenic LOC101928778,SEC16B rs543874 G
chr2 intergenic ADCY3,DNAJC27 rs10182181 G
chr2 intergenic FAM150B,TMEM18 rs13021737 G
chr2 intergenic LRP1B,KYNU rs2121279 T
chr2 intergenic ERBB4,LOC102725079 rs7599312 G
chr3 intronic CADM2 rs13078960 G
chr3 intronic RASA2 rs16851483 T
chr3 intronic FHIT rs2365389 C
chr3 intronic GBE1 rs3849570 A
chr4 exonic SLC39A8 rs13107325 T
chr4 intronic SCARB2 rs17001654 G
chr5 intergenic POC5,SV2C rs2112347 T
chr6 intronic C6orf106 rs205262 G
chr7 UTR3 HIP1 rs1167827 G
chr7 intronic CALCR rs9641123 C
chr9 intergenic ASTN2,LOC101928797 rs1928295 T
chr10 intronic NT5C2 rs11191560 C
chr10 intergenic HIF1AN,PAX2 rs17094222 C
chr10 intronic TCF7L2 rs7903146 C
chr11 ncRNA_intronic BDNF‐AS rs11030104 A
chr11 intergenic NXPE2,CADM1 rs12286929 G
chr11 intronic HSD17B12 rs2176598 T
chr11 intronic MTCH2 rs3817334 T
chr11 intronic TRIM66 rs4256980 G
chr12 intergenic BCDIN3D,FAIM2 rs7138803 A
chr13 intergenic LINC01065,LINC00558 rs12429545 A
chr14 intergenic STXBP6,NOVA1 rs10132280 C
11
chr14 intergenic PRKD1,G2E3 rs11847697 T
chr14 intergenic LINC01551,PRKD1 rs12885454 C
chr15 intronic MAP2K5 rs16951275 T
chr16 intergenic GPRC5B,GPR139 rs12446632 G
chr16 intronic FTO rs1558902 A
chr16 upstream;downstream ATP2A1;ATP2A1‐AS1 rs3888190 A
chr16 UTR5 NLRC3 rs758747 T
chr16 intronic KAT8 rs9925964 A
chr17 intronic RPTOR rs12940622 G
chr18 intergenic PMAIP1,MC4R rs6567160 C
chr19 intronic TOMM40 rs2075650 A
chr19 intronic QPCTL rs2287019 C
chr19 UTR3 ZC3H4 rs3810291 A
Abbreviations; CHR, chromosome; SNP, single nucleotide polymorphism.
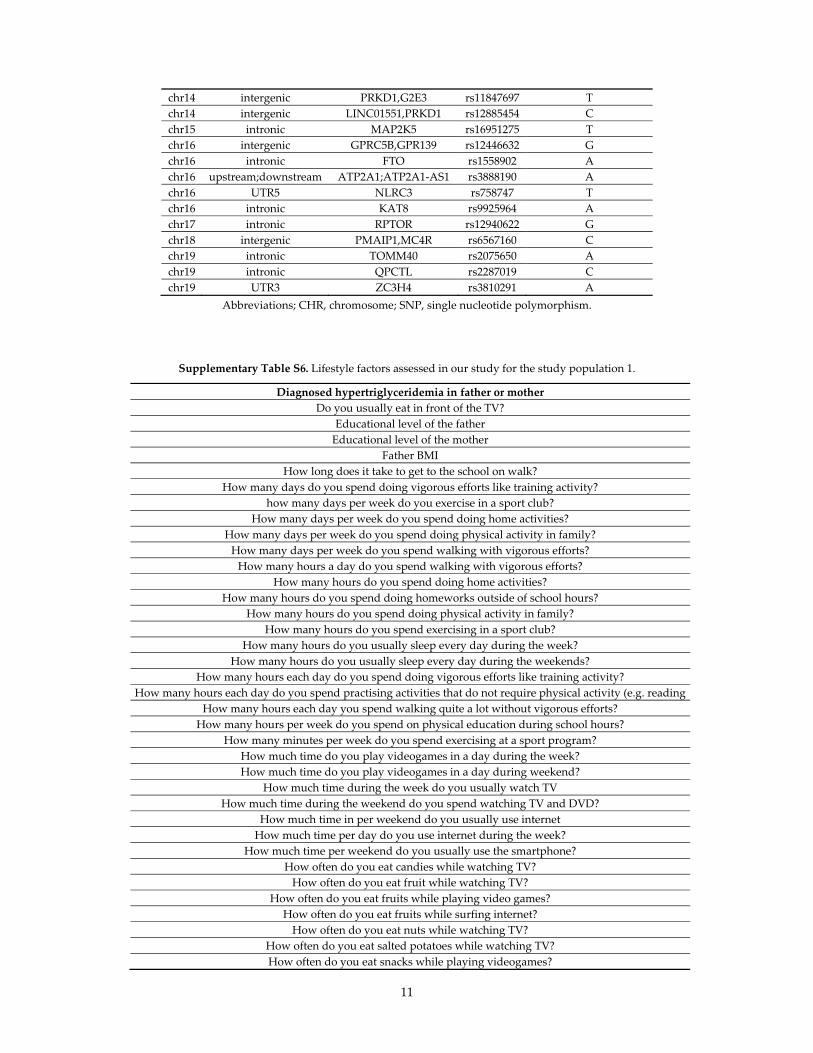
Supplementary Table S6. Lifestyle factors assessed in our study for the study population 1.
Diagnosed hypertriglyceridemia in father or mother
Do you usually eat in front of the TV?
Educational level of the father
Educational level of the mother
Father BMI
How long does it take to get to the school on walk?
How many days do you spend doing vigorous efforts like training activity?
how many days per week do you exercise in a sport club?
How many days per week do you spend doing home activities?
How many days per week do you spend doing physical activity in family?
How many days per week do you spend walking with vigorous efforts?
How many hours a day do you spend walking with vigorous efforts?
How many hours do you spend doing home activities?
How many hours do you spend doing homeworks outside of school hours?
How many hours do you spend doing physical activity in family?
How many hours do you spend exercising in a sport club?
How many hours do you usually sleep every day during the week?
How many hours do you usually sleep every day during the weekends?
How many hours each day do you spend doing vigorous efforts like training activity?
How many hours each day do you spend practising activities that do not require physical activity (e.g. reading
How many hours each day you spend walking quite a lot without vigorous efforts?
How many hours per week do you spend on physical education during school hours?
How many minutes per week do you spend exercising at a sport program?
How much time do you play videogames in a day during the week?
How much time do you play videogames in a day during weekend?
How much time during the week do you usually watch TV
How much time during the weekend do you spend watching TV and DVD?
How much time in per weekend do you usually use internet
How much time per day do you use internet during the week?
How much time per weekend do you usually use the smartphone?
How often do you eat candies while watching TV?
How often do you eat fruit while watching TV?
How often do you eat fruits while playing video games?
How often do you eat fruits while surfing internet?
How often do you eat nuts while watching TV?
How often do you eat salted potatoes while watching TV?
How often do you eat snacks while playing videogames?
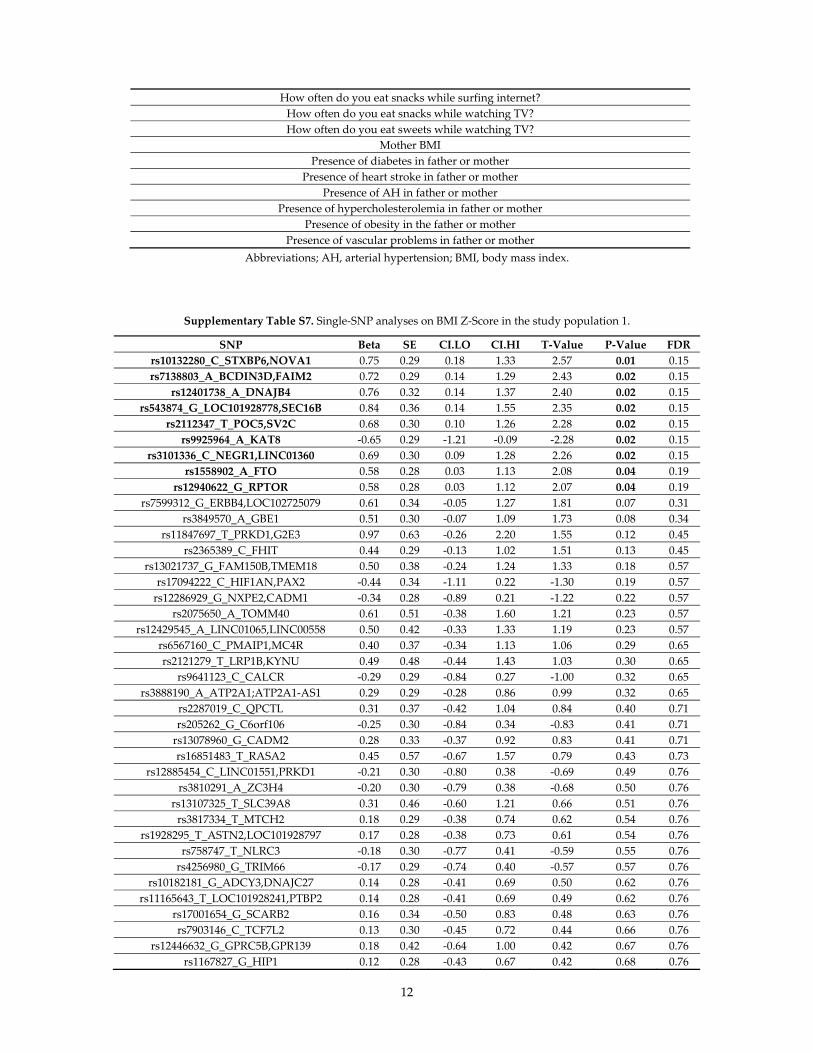
12
How often do you eat snacks while surfing internet?
How often do you eat snacks while watching TV?
How often do you eat sweets while watching TV?
Mother BMI
Presence of diabetes in father or mother
Presence of heart stroke in father or mother
Presence of AH in father or mother
Presence of hypercholesterolemia in father or mother
Presence of obesity in the father or mother
Presence of vascular problems in father or mother
Abbreviations; AH, arterial hypertension; BMI, body mass index.
Supplementary Table S7. Single‐SNP analyses on BMI Z‐Score in the study population 1.
SNP Beta SE CI.LO CI.HI T‐Value P‐Value FDR
rs10132280_C_STXBP6,NOVA1 0.75 0.29 0.18 1.33 2.57 0.01 0.15
rs7138803_A_BCDIN3D,FAIM2 0.72 0.29 0.14 1.29 2.43 0.02 0.15
rs12401738_A_DNAJB4 0.76 0.32 0.14 1.37 2.40 0.02 0.15
rs543874_G_LOC101928778,SEC16B 0.84 0.36 0.14 1.55 2.35 0.02 0.15
rs2112347_T_POC5,SV2C 0.68 0.30 0.10 1.26 2.28 0.02 0.15
rs9925964_A_KAT8 ‐0.65 0.29 ‐1.21 ‐0.09 ‐2.28 0.02 0.15
rs3101336_C_NEGR1,LINC01360 0.69 0.30 0.09 1.28 2.26 0.02 0.15
rs1558902_A_FTO 0.58 0.28 0.03 1.13 2.08 0.04 0.19
rs12940622_G_RPTOR 0.58 0.28 0.03 1.12 2.07 0.04 0.19
rs7599312_G_ERBB4,LOC102725079 0.61 0.34 ‐0.05 1.27 1.81 0.07 0.31
rs3849570_A_GBE1 0.51 0.30 ‐0.07 1.09 1.73 0.08 0.34
rs11847697_T_PRKD1,G2E3 0.97 0.63 ‐0.26 2.20 1.55 0.12 0.45
rs2365389_C_FHIT 0.44 0.29 ‐0.13 1.02 1.51 0.13 0.45
rs13021737_G_FAM150B,TMEM18 0.50 0.38 ‐0.24 1.24 1.33 0.18 0.57
rs17094222_C_HIF1AN,PAX2 ‐0.44 0.34 ‐1.11 0.22 ‐1.30 0.19 0.57
rs12286929_G_NXPE2,CADM1 ‐0.34 0.28 ‐0.89 0.21 ‐1.22 0.22 0.57
rs2075650_A_TOMM40 0.61 0.51 ‐0.38 1.60 1.21 0.23 0.57
rs12429545_A_LINC01065,LINC00558 0.50 0.42 ‐0.33 1.33 1.19 0.23 0.57
rs6567160_C_PMAIP1,MC4R 0.40 0.37 ‐0.34 1.13 1.06 0.29 0.65
rs2121279_T_LRP1B,KYNU 0.49 0.48 ‐0.44 1.43 1.03 0.30 0.65
rs9641123_C_CALCR ‐0.29 0.29 ‐0.84 0.27 ‐1.00 0.32 0.65
rs3888190_A_ATP2A1;ATP2A1‐AS1 0.29 0.29 ‐0.28 0.86 0.99 0.32 0.65
rs2287019_C_QPCTL 0.31 0.37 ‐0.42 1.04 0.84 0.40 0.71
rs205262_G_C6orf106 ‐0.25 0.30 ‐0.84 0.34 ‐0.83 0.41 0.71
rs13078960_G_CADM2 0.28 0.33 ‐0.37 0.92 0.83 0.41 0.71
rs16851483_T_RASA2 0.45 0.57 ‐0.67 1.57 0.79 0.43 0.73
rs12885454_C_LINC01551,PRKD1 ‐0.21 0.30 ‐0.80 0.38 ‐0.69 0.49 0.76
rs3810291_A_ZC3H4 ‐0.20 0.30 ‐0.79 0.38 ‐0.68 0.50 0.76
rs13107325_T_SLC39A8 0.31 0.46 ‐0.60 1.21 0.66 0.51 0.76
rs3817334_T_MTCH2 0.18 0.29 ‐0.38 0.74 0.62 0.54 0.76
rs1928295_T_ASTN2,LOC101928797 0.17 0.28 ‐0.38 0.73 0.61 0.54 0.76
rs758747_T_NLRC3 ‐0.18 0.30 ‐0.77 0.41 ‐0.59 0.55 0.76
rs4256980_G_TRIM66 ‐0.17 0.29 ‐0.74 0.40 ‐0.57 0.57 0.76
rs10182181_G_ADCY3,DNAJC27 0.14 0.28 ‐0.41 0.69 0.50 0.62 0.76
rs11165643_T_LOC101928241,PTBP2 0.14 0.28 ‐0.41 0.69 0.49 0.62 0.76
rs17001654_G_SCARB2 0.16 0.34 ‐0.50 0.83 0.48 0.63 0.76
rs7903146_C_TCF7L2 0.13 0.30 ‐0.45 0.72 0.44 0.66 0.76
rs12446632_G_GPRC5B,GPR139 0.18 0.42 ‐0.64 1.00 0.42 0.67 0.76
rs1167827_G_HIP1 0.12 0.28 ‐0.43 0.67 0.42 0.68 0.76
13
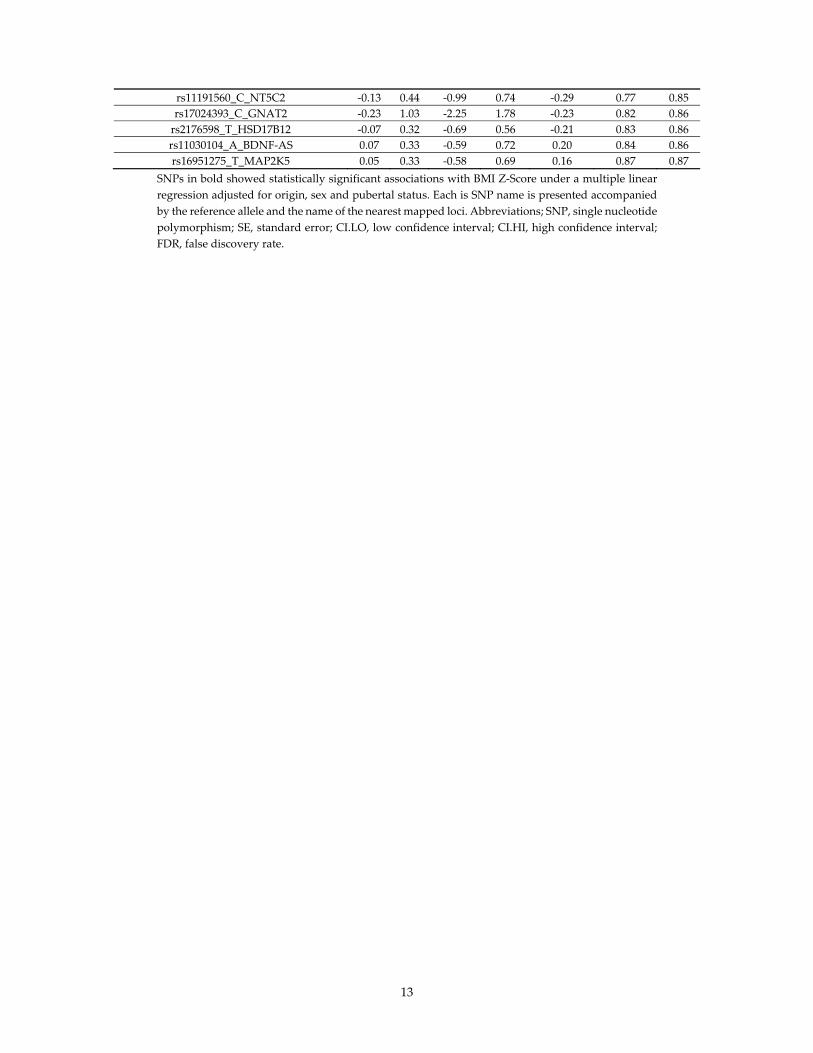
rs11191560_C_NT5C2 ‐0.13 0.44 ‐0.99 0.74 ‐0.29 0.77 0.85
rs17024393_C_GNAT2 ‐0.23 1.03 ‐2.25 1.78 ‐0.23 0.82 0.86
rs2176598_T_HSD17B12 ‐0.07 0.32 ‐0.69 0.56 ‐0.21 0.83 0.86
rs11030104_A_BDNF‐AS 0.07 0.33 ‐0.59 0.72 0.20 0.84 0.86
rs16951275_T_MAP2K5 0.05 0.33 ‐0.58 0.69 0.16 0.87 0.87
SNPs in bold showed statistically significant associations with BMI Z‐Score under a multiple linear
regression adjusted for origin, sex and pubertal status. Each is SNP name is presented accompanied
by the reference allele and the name of the nearest mapped loci. Abbreviations; SNP, single nucleotide
polymorphism; SE, standard error; CI.LO, low confidence interval; CI.HI, high confidence interval;
FDR, false discovery rate.
14
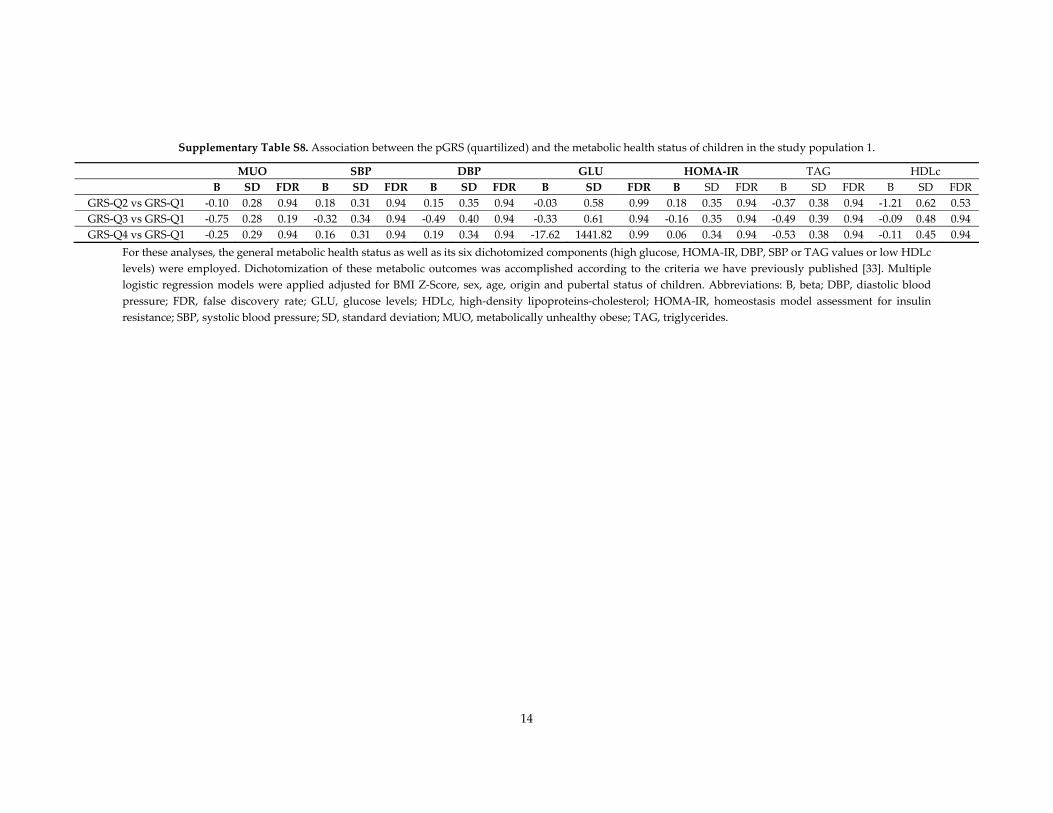
Supplementary Table S8. Association between the pGRS (quartilized) and the metabolic health status of children in the study population 1.
MUO SBP DBP GLU HOMA‐IR TAG HDLc
B SD FDR B SD FDR B SD FDR B SD FDR B SD FDR B SD FDR B SD FDR
GRS‐Q2 vs GRS‐Q1 ‐0.10 0.28 0.94 0.18 0.31 0.94 0.15 0.35 0.94 ‐0.03 0.58 0.99 0.18 0.35 0.94 ‐0.37 0.38 0.94 ‐1.21 0.62 0.53
GRS‐Q3 vs GRS‐Q1 ‐0.75 0.28 0.19 ‐0.32 0.34 0.94 ‐0.49 0.40 0.94 ‐0.33 0.61 0.94 ‐0.16 0.35 0.94 ‐0.49 0.39 0.94 ‐0.09 0.48 0.94
GRS‐Q4 vs GRS‐Q1 ‐0.25 0.29 0.94 0.16 0.31 0.94 0.19 0.34 0.94 ‐17.62 1441.82 0.99 0.06 0.34 0.94 ‐0.53 0.38 0.94 ‐0.11 0.45 0.94
For these analyses, the general metabolic health status as well as its six dichotomized components (high glucose, HOMA‐IR, DBP, SBP or TAG values or low HDLc
levels) were employed. Dichotomization of these metabolic outcomes was accomplished according to the criteria we have previously published [33]. Multiple
logistic regression models were applied adjusted for BMI Z‐Score, sex, age, origin and pubertal status of children. Abbreviations: B, beta; DBP, diastolic blood
pressure; FDR, false discovery rate; GLU, glucose levels; HDLc, high‐density lipoproteins‐cholesterol; HOMA‐IR, homeostasis model assessment for insulin
resistance; SBP, systolic blood pressure; SD, standard deviation; MUO, metabolically unhealthy obese; TAG, triglycerides.

15
Related Documents