SUPPLEMENTAL DATA Supplemental Table I. Sequence and annealing temperatures of the primers used in this work. Supplemental Figure 1. Analysis of AtBGAL10 activity. A. β-Galactosidase activity against XLLG in flowers and developing siliques. Proteins were extracted from one wild type sample (black) and two replicates of bgal10-1 (white). Error bars show standard deviations. B. β-Galactosidase activity against XLLG of 4 Pichia pastoris clones transformed with empty vector and 20 clones transformed with AtBGAL10. C. MALDI- TOF/TOF spectrum of the ion at 1247 m/z units produced by digestion of XLLG with secreted proteins from Pichia transformed with AtBGAL10, as shown in Figure 1F. Error bars show standard deviations. Only fragments resulting from breaks of glycosidic bonds have been labeled with their size and losses (Pent for pentose, Hex for hexose and H 2 O for losses that include the reducing end). Grey labels show putative products of double cleavages of XXLG. In the upper left corner the structures of XXLG and XLXG show the expected ions resulting from fragmentation between the central glucose residues. The ion at 659 m/z, diagnostic of XXLG is much more abundant than the 773 m/z ion (grey triangles), suggesting that XLXG is, at most, a minor component. It might not be present since several double and triple fragmentations can produce ions of 773 m/z units from XXLG (one is shown by dotted lines). D. Gel electrophoresis of secreted proteins from three Pichia clones transformed with empty vector and three clones transformed with AtBGAL10. Proteins extracts are the same used for activity assays in Figure 1D. The sizes of marker proteins are indicated to the left. Black arrowheads indicate putative AtBGAL10 bands. E. MALDI-TOF of a 24 h digestion of XLLG at 1.5 mM with Columbia protein extract. Digestion products are indicated by triangles and labeled with possible structures and m/z of the corresponding ion. Putative products of transglycosylation by α-xylosidase are indicated as +Xyl. F. MALDI-TOF/TOF spectrum of the ion at 1247 m/z units from E. G. MALDI-TOF/TOF spectrum of the 1277 m/z ion in the digestion of XLLG with bgal10 protein extract shown in Figure 1G. The structure of GLLG is shown with the sizes of the different products of single cleavages. A red triangle shows the expected position of the fragment resulting from a pentose cleavage. H. MALDI-TOF/TOF spectrum of the 821 m/z ion from the digestion in Figure 1G. Symbols are as in F. Supplemental Figure 2. Phylogenetic tree of AtBGAL10 and close homologs from 23 species with sequenced genomes. The clade where AtBGAL10 and its putative orthologs are located is shown in grey. Bootstrap values based on 500 replicates are shown next to each node. Gene annotations for species other than rice and Arabidopsis are taken from Phytozome V7.0 database (www.phytozome.net). Supplemental Figure 3. Xyloglucan composition. A Xyloglucan composition in stems of bgal10-1 and bgal10-2 mutants. Alcohol-insoluble cell wall residues were obtained from two samples of wild type (black), bgal10-1 (white) or bgal10-2 stems (grey). Xyloglucan was extracted with endoglucanase and peak areas from three MALDI-TOF spectra were quantified to estimate standard deviations, presented as error bars. The proportion of acetylated subunits corresponds to the area above the horizontal lines. B. Xyloglucan

Welcome message from author
This document is posted to help you gain knowledge. Please leave a comment to let me know what you think about it! Share it to your friends and learn new things together.
Transcript

SUPPLEMENTAL DATA
Supplemental Table I. Sequence and annealing temperatures of the primers used in this work.
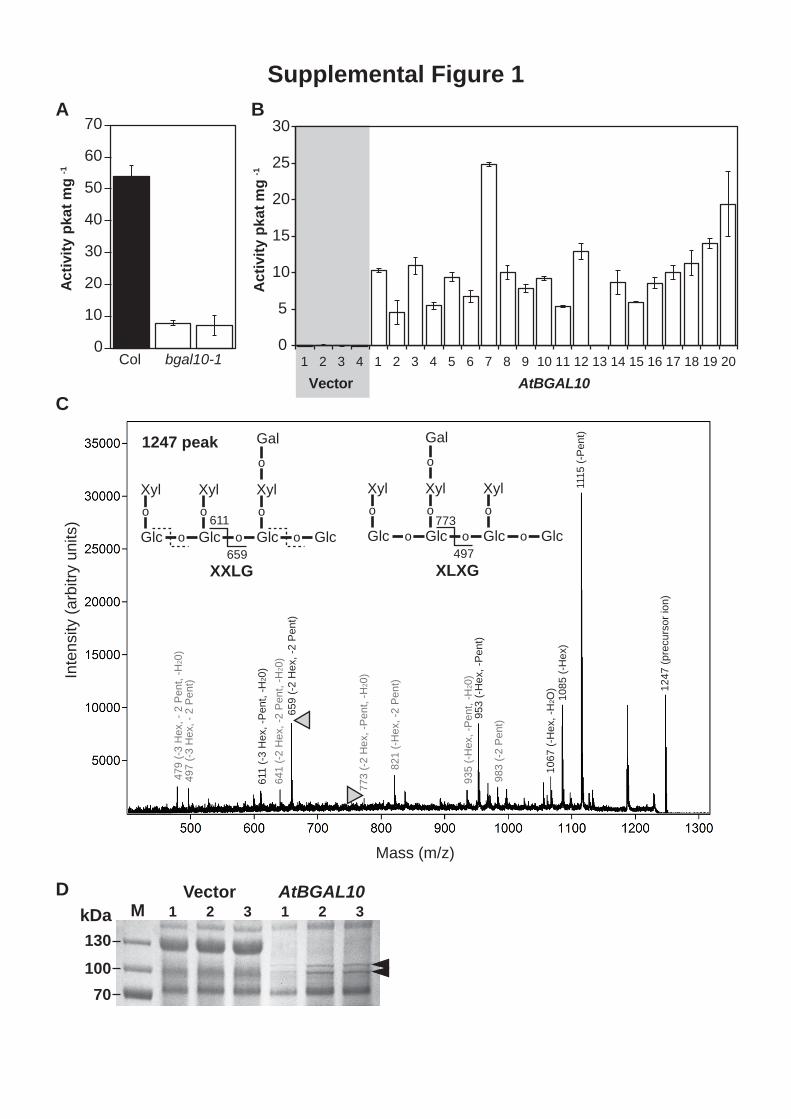
Supplemental Figure 1. Analysis of AtBGAL10 activity. A. β-Galactosidase activity against XLLG in
flowers and developing siliques. Proteins were extracted from one wild type sample (black) and two replicates
of bgal10-1 (white). Error bars show standard deviations. B. β-Galactosidase activity against XLLG of 4
Pichia pastoris clones transformed with empty vector and 20 clones transformed with AtBGAL10. C. MALDI-
TOF/TOF spectrum of the ion at 1247 m/z units produced by digestion of XLLG with secreted proteins from
Pichia transformed with AtBGAL10, as shown in Figure 1F. Error bars show standard deviations. Only
fragments resulting from breaks of glycosidic bonds have been labeled with their size and losses (Pent for
pentose, Hex for hexose and H2O for losses that include the reducing end). Grey labels show putative products
of double cleavages of XXLG. In the upper left corner the structures of XXLG and XLXG show the expected
ions resulting from fragmentation between the central glucose residues. The ion at 659 m/z, diagnostic of
XXLG is much more abundant than the 773 m/z ion (grey triangles), suggesting that XLXG is, at most, a
minor component. It might not be present since several double and triple fragmentations can produce ions of
773 m/z units from XXLG (one is shown by dotted lines). D. Gel electrophoresis of secreted proteins from
three Pichia clones transformed with empty vector and three clones transformed with AtBGAL10. Proteins
extracts are the same used for activity assays in Figure 1D. The sizes of marker proteins are indicated to the
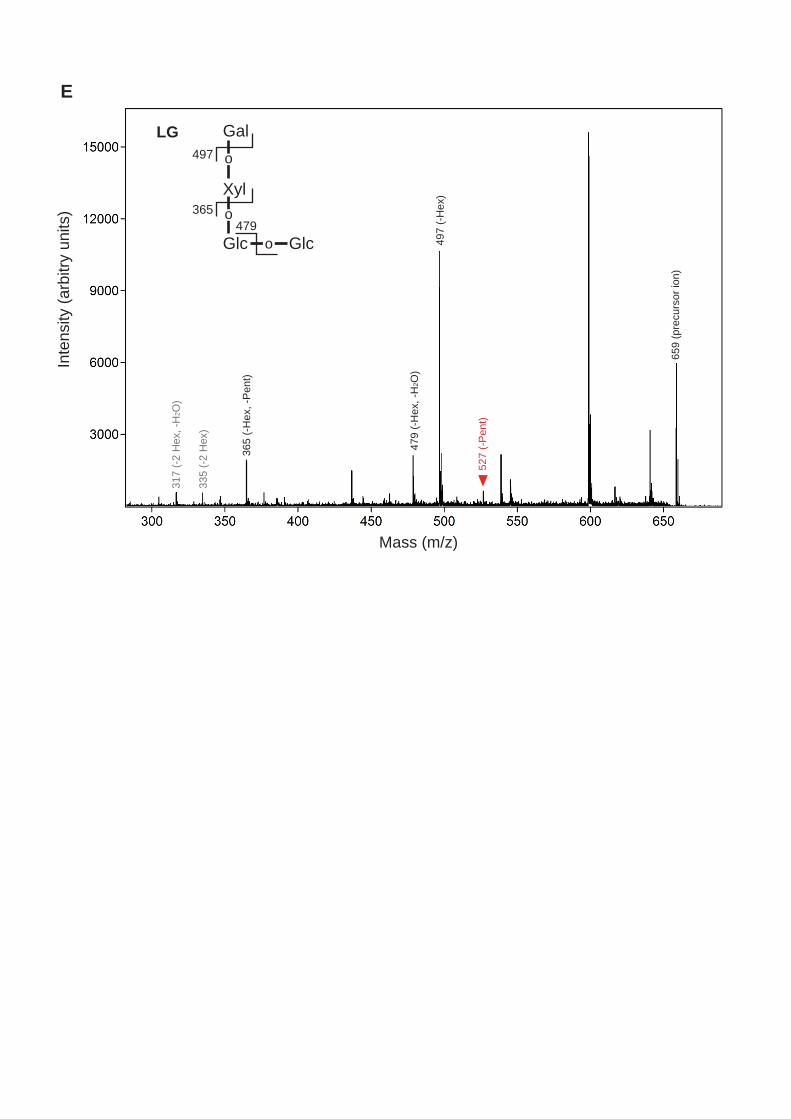
left. Black arrowheads indicate putative AtBGAL10 bands. E. MALDI-TOF of a 24 h digestion of XLLG at
1.5 mM with Columbia protein extract. Digestion products are indicated by triangles and labeled with possible
structures and m/z of the corresponding ion. Putative products of transglycosylation by α-xylosidase are
indicated as +Xyl. F. MALDI-TOF/TOF spectrum of the ion at 1247 m/z units from E. G. MALDI-TOF/TOF
spectrum of the 1277 m/z ion in the digestion of XLLG with bgal10 protein extract shown in Figure 1G. The
structure of GLLG is shown with the sizes of the different products of single cleavages. A red triangle shows
the expected position of the fragment resulting from a pentose cleavage. H. MALDI-TOF/TOF spectrum of
the 821 m/z ion from the digestion in Figure 1G. Symbols are as in F.
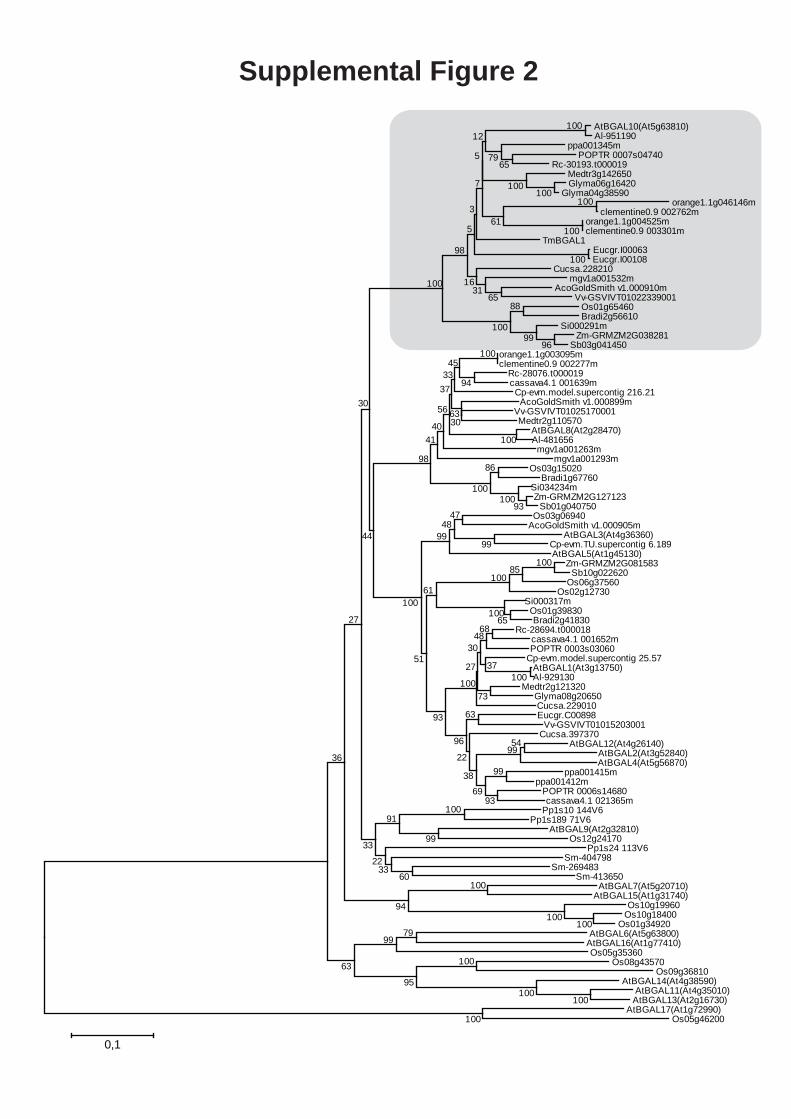
Supplemental Figure 2. Phylogenetic tree of AtBGAL10 and close homologs from 23 species with
sequenced genomes. The clade where AtBGAL10 and its putative orthologs are located is shown in grey.
Bootstrap values based on 500 replicates are shown next to each node. Gene annotations for species other than
rice and Arabidopsis are taken from Phytozome V7.0 database (www.phytozome.net).
Supplemental Figure 3. Xyloglucan composition. A Xyloglucan composition in stems of bgal10-1 and
bgal10-2 mutants. Alcohol-insoluble cell wall residues were obtained from two samples of wild type (black),
bgal10-1 (white) or bgal10-2 stems (grey). Xyloglucan was extracted with endoglucanase and peak areas from
three MALDI-TOF spectra were quantified to estimate standard deviations, presented as error bars. The
proportion of acetylated subunits corresponds to the area above the horizontal lines. B. Xyloglucan
composition in elongated siliques. MALDI-TOF spectra correspond to Columbia xyloglucan and three
independent extractions of bgal10-1 xyloglucan. Characteristic peaks of bgal10 xyloglucan are indicated in
grey. C. Xyloglucan subunits observed during short endoglucanase digestions of bgal10-1 cell wall residues.
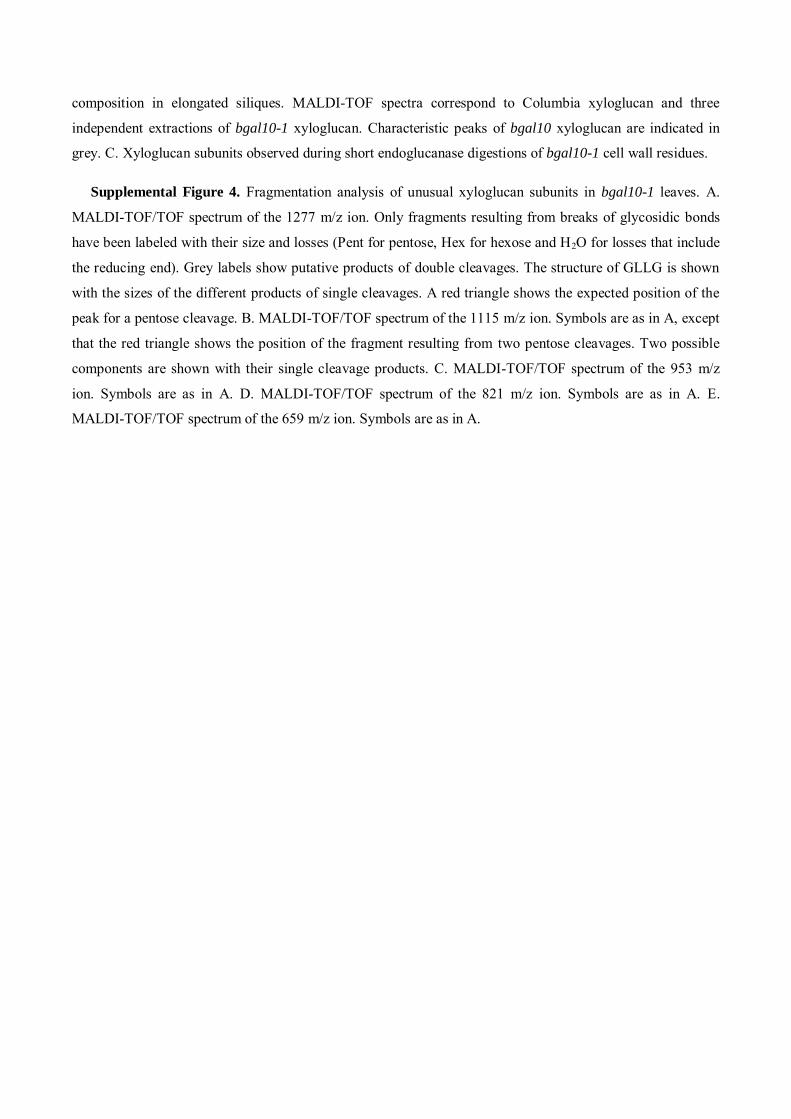
Supplemental Figure 4. Fragmentation analysis of unusual xyloglucan subunits in bgal10-1 leaves. A.
MALDI-TOF/TOF spectrum of the 1277 m/z ion. Only fragments resulting from breaks of glycosidic bonds
have been labeled with their size and losses (Pent for pentose, Hex for hexose and H2O for losses that include
the reducing end). Grey labels show putative products of double cleavages. The structure of GLLG is shown
with the sizes of the different products of single cleavages. A red triangle shows the expected position of the
peak for a pentose cleavage. B. MALDI-TOF/TOF spectrum of the 1115 m/z ion. Symbols are as in A, except
that the red triangle shows the position of the fragment resulting from two pentose cleavages. Two possible
components are shown with their single cleavage products. C. MALDI-TOF/TOF spectrum of the 953 m/z
ion. Symbols are as in A. D. MALDI-TOF/TOF spectrum of the 821 m/z ion. Symbols are as in A. E.
MALDI-TOF/TOF spectrum of the 659 m/z ion. Symbols are as in A.

Supplemental Table I. Sequence and annealing temperatures of the primers used in this work.
Purpose Name Sequence Annealing
Absence of insertion gal10-1
BGAL10-1L GCCTACTCTGTTGCTCGGTTTT 58ºC
BGAL10-1R CACCGCCTTGTCATTTTTATCA
Presence of insertion gal10-1
BGAL10-1L GCCTACTCTGTTGCTCGGTTTT 58ºC
SYN-LB CATCTGAATTTCATAACCAATCTCGA
Absence of insertion gal10-2
BGAL10-2L GCAACTCTTGGACAAGAAGCAA 58ºC
BGAL10-2R GCCATAAATCTCTCGCATTCCT
Presence of insertion gal10-2
BGAL10-2L GCAACTCTTGGACAAGAAGCAA 58ºC
SALK-LB GATTTCGGAACCACCATCAAAC
Absence of insertion Atxyl1-2
XYL1-2L TTTATGGTTCGCATCCGATGTA 58ºC
XYL1-2R CAAGAACCGTGGTCCATGTCTA
Presence of insertion Atxyl1-2
XYL1-2L TTTATGGTTCGCATCCGATGTA 58ºC
GABI-LB CCATATTGACCATCATACTCATTGC
Promoter BGAL10
PRGAL10L1 TTGGGTAATTGGGGGTGTTTTA 58ºC
PRGAL10R1 CGTCGTACTTCCCTCGAGTGTT
BGAL10 heterologous expression
BGAL10L1 GGTACCGCGAATGTATCCTACGACCAC 56ºC
BGAL10R1 GCGGCCGCCACCACCGATACTTTCCTTTTG
Supplemental Figure 1B
C
Inte
nsity
(arb
itry
units
)
Mass (m/z)
1247 peak
1247
(pre
curs
or io
n)
1115
(-P
ent)
1085
(-H
ex)
953
(-H
ex, -
Pen
t)
659
(-2
Hex
, -2
Pen
t)
983
(-2
Pen
t)
773
(-2
Hex
, -P
ent,
-H20
)
821
(-H
ex, -
2 P
ent)
935
(-H
ex, -
Pen
t, -H
20)
641
(-2
Hex
, -2
Pen
t, -H
20)
611
(-3
Hex
, -P
ent,
-H20
)
497
(-3
Hex
, - 2
Pen
t)47
9 (-
3 H
ex, -
2 P
ent,
-H20
)
Glc Glc Glc Glc
Xyl Xyl Xyl
Gal
659oo o
o611
o o
o
Glc Glc Glc Glc
Xyl Xyl Xyl
Gal
497oo o
o773
o o
o
XXLG XLXG10
67 (-
Hex
, -H
2O)
0
5
10
15
20
25
30
1 2 3 4 1 2 3 4 5 6 7 8 9 10 11 12 13 14 15 16 17 18 19 20
Act
ivity
pka
t mg
-1
Vector AtBGAL10
D
70100
130kDa M 1 2 3 1 2 3
Vector AtBGAL10
A
0
10
20
30
40
50
60
70
Act
ivity
pka
t mg
-1
Col bgal10-1

G
Mass (m/z)
Inte
nsity
(arb
itry
units
)
E
Glc Glc Glc Glc
Xyl Xyl
GalGal
659oo o
o641
o
o o
983
1115
1097
GLLG
1277
(pre
curs
or io
n)
1115
(-H
ex)
1097
(-H
ex, -
H2O
)
983
(-H
ex, -
Pen
t)
659
(-3
Hex
, -P
ent)
641
(-3
Hex
, -P
ent,
-H2O
)
821
(-2
Hex
, -P
ent)
953
(-2
Hex
)93
5 (-
2 H
ex, -
H2O
)
803
(-2
Hex
, -P
ent,
-H2O
)
689
(-2
Hex
, -2
Pen
t)
479
(-4
Hex
, - P
ent,
-H2O
)49
7 (-
4 H
ex, -
Pen
t)
114
1 (-
Pen
t)
Mass (m/z)
Inte
nsity
(arb
itry
units
)
XXLGXLXG1247
XXLG + Xyl1379
XXXGXLG +Xyl
1085
XLGGXXG
953
XXG791
GXGLG659 GLG
821
GXLGGLXGLLG1115
F 1247 peak
1115
124765
9
773
1085
1067
953
821
479

Mass (m/z)
Inte
nsity
(arb
itry
units
)
H
Glc Glc Glc
Xyl
Gal
o o
o
o659
641527
GLG
659
(-H
ex)
641
(-H
ex, -
H2O
)
689
(-P
ent) 82
1 (p
recu
rsor
ion)
527
(-H
ex, -
Pen
t)
479
(-2
Hex
, -H
2O)
497
(-2
Hex
)
Supplemental Figure 2
AtBGAL10(At5g63810) Al-951190
ppa001345m POPTR 0007s04740
Rc-30193.t000019 Medtr3g142650 Glyma06g16420
Glyma04g38590 orange1.1g046146m
clementine0.9 002762m orange1.1g004525m clementine0.9 003301m
TmBGAL1 Eucgr.I00063 Eucgr.I00108
Cucsa.228210 mgv1a001532m
AcoGoldSmith v1.000910m Vv-GSVIVT01022339001
Os01g65460 Bradi2g56610
Si000291m Zm-GRMZM2G038281
Sb03g041450 orange1.1g003095m clementine0.9 002277m
Rc-28076.t000019 cassava4.1 001639m Cp-evm.model.supercontig 216.21 AcoGoldSmith v1.000899m
Vv-GSVIVT01025170001 Medtr2g110570
AtBGAL8(At2g28470) Al-481656 mgv1a001263m
mgv1a001293m Os03g15020
Bradi1g67760 Si034234m Zm-GRMZM2G127123
Sb01g040750 Os03g06940
AcoGoldSmith v1.000905m AtBGAL3(At4g36360)
Cp-evm.TU.supercontig 6.189 AtBGAL5(At1g45130)
Zm-GRMZM2G081583 Sb10g022620
Os06g37560 Os02g12730
Si000317m Os01g39830 Bradi2g41830
Rc-28694.t000018 cassava4.1 001652m POPTR 0003s03060
Cp-evm.model.supercontig 25.57 AtBGAL1(At3g13750) Al-929130
Medtr2g121320 Glyma08g20650 Cucsa.229010 Eucgr.C00898
Vv-GSVIVT01015203001 Cucsa.397370
AtBGAL12(At4g26140) AtBGAL2(At3g52840) AtBGAL4(At5g56870)
ppa001415m ppa001412m
POPTR 0006s14680 cassava4.1 021365m
Pp1s10 144V6 Pp1s189 71V6
AtBGAL9(At2g32810) Os12g24170
Pp1s24 113V6 Sm-404798
Sm-269483 Sm-413650
AtBGAL7(At5g20710) AtBGAL15(At1g31740)
Os10g19960 Os10g18400
Os01g34920 AtBGAL6(At5g63800)
AtBGAL16(At1g77410) Os05g35360
Os08g43570 Os09g36810
AtBGAL14(At4g38590) AtBGAL11(At4g35010)
AtBGAL13(At2g16730) AtBGAL17(At1g72990)
Os05g46200100
100
100
100
100
100
100
100
100
100
100
96
100
99
100
93100
95
79
88
100
100
100
65
99
100
86
100
100
61
65
79
65100
85
100
31
12
5
7
16
3
5
98
99
94
100
100
94
63
99
3063
4533
37
56
4041
98
60
91
3322
36
33
27
5499
30
44
4748
99
99
9369
63
38
61100
22
96
51
93
73
6848
37
30
27
100
0,1

0.00
0.05
0.10
0.15
0.20
0.25
0.30
0.35
Rel
ativ
e ab
unda
nce
Ion species
XXXG(1085)
XXLGXLXG(1247)
XXFG(1393)
XLFG(1555)
XLLG(1409)
GLLG(1277)
GLXGGXLGLLG
(1115)
LGGXG(659)
XXG(791)
XLGLXG
GXXG(953)
GLG(821)
A
B C
1550 1800m/z
Inte
nsity
XLLGG1571
XLLGG-Ac1613
XLFGG-Ac1759
XLFG-Ac1597
XLFG1555
600 1600
659 821 953 1115 12771157 1319
bgal10-1
bgal10-1
bgal10-1
Columbia
Inte
nsity
m/z
Supplemental Figure 3

Mass (m/z)
Inte
nsity
(arb
itry
units
)In
tens
ity (a
rbitr
y un
its)
Mass (m/z)
B
A
1115
(pre
curs
or io
n)
983
(-P
ent)
953
(-H
ex)
821
(-H
ex, -
Pen
t)
689
(-1
Hex
, -2
Pen
t)
659
(-2
Hex
, -P
ent)
803
(-H
ex, -
Pen
t, -H
20)
641
(-2
Hex
, - P
ent,
-H20
)
497
(-3
Hex
, - P
ent)
479
(-3
Hex
, - P
ent,
-H20
)
935
(-H
ex, -
H2O
)
Glc Glc Glc Glc
Xyl Xyl
GalGal
659oo o
o641
o
o o
983
1115
1097
GLLG
Glc Glc Glc Glc
Xyl Xyl
Gal
497oo o
o641
o
o
821
953
935983
GLXG
Glc Glc Glc
Xyl Xyl
Gal
659o o
o479
o
o
821
953
935
Galo
LLG
1277
(pre
curs
or io
n)
1115
(-H
ex)
1097
(-H
ex, -
H2O
)
983
(-H
ex, -
Pen
t)
659
(-3
Hex
, -P
ent)
641
(-3
Hex
, -P
ent,
-H2O
)
821
(-2
Hex
, -P
ent)
953
(-2
Hex
)93
5 (-
2 H
ex, -
H2O
)
803
(-2
Hex
, -P
ent,
-H2O
)
689
(-2
Hex
, -2
Pen
t)
479
(-4
Hex
, - P
ent,
-H2O
)49
7 (-
4 H
ex, -
Pen
t)
114
1 (-
Pen
t)
851
(-2
Pen
t)
773
(-2
Hex
, -H
20)
791
(-2
Hex
)
Supplemental Figure 4

Mass (m/z)
Inte
nsity
(arb
itry
units
)
D
C
Glc Glc Glc
Xyl
Gal
o o
o
o659
641527
GLG
659
(-H
ex)
641
(-H
ex, -
H2O
)
689
(-P
ent)
821
(pre
curs
or io
n)
527
(-H
ex, -
Pen
t)
479
(-2
Hex
, -H
2O)
497
(-2
Hex
)
821
(-P
ent)
953
(pre
curs
or io
n)
791
(-H
ex)
659
(-H
ex, -
Pen
t)
773(
-Hex
, -H
2O)
479
(-2
Hex
, -P
ent,
-H2O
) 49
7 (-
2 H
ex, -
Pen
t)
641
(-H
ex, -
Pen
t, -H
2O)
689
(-2
Pen
t)
611
(-2
Hex
, -H
2O)
689
(-H
ex, -
2 P
ent)
XLG
Glc Glc Glc
Xyl
Gal
o o
o
o791
773659
Xylo821
LXG
Glc Glc Glc
Xyl
Gal
o o
o
o791
773821
Xylo659
479
497
Glc Glc Glc
Xyl
o o
o773
Xylo821
Glc o791
479
497
GXXG
Inte
nsity
(arb
itry
units
)
Mass (m/z)
E
659
(pre
curs
or io
n)
497
(-H
ex)
365
(-H
ex, -
Pen
t)
479
(-H
ex, -
H2O
)
LG
Glc Glc
Xyl
Gal
o
o
o497
479365
527
(-P
ent)
317
(-2
Hex
, -H
2O)
335
(-2
Hex
)
Related Documents