Welcome message from author
This document is posted to help you gain knowledge. Please leave a comment to let me know what you think about it! Share it to your friends and learn new things together.
Transcript


SPOKESPERSON Name: Wayne Shen Title: Vice President Tel: +886-3-5786005 Email: [email protected] DEPUTY SPOKESPERSON Name: Ann Lai Title: Investor Relations Manager Tel: +886-3-5786005 Email: [email protected] SUNPLUS HEADQUATERS 19, Innovation 1st Road, Hsinchu Science Park, Hsinchu 300, Taiwan Tel: +886-3-5786005 Fax: +886-3-5786006 http://www.sunplus.com COMMON SHARES TRANSFER AGENT China Trust Commercial Bank Corporate Trust Operation and service Department 5F, 83, Sec. 1, Chung-Ching S. Rd. Taipei 100, Taiwan Tel: +886-2-2181-1911 http://www.chinatrust.com.tw AUDITORS Company: Deloitte & Touche Name: Hung-Peng Lin, Shu-Chieh Huang 6F, 2, Prosperity Road 1, Hsinchu Science Park, Hsinchu 300, Taiwan Tel: +886-3-5780899 http://www.tw.deloitte.com GDR DEPOSITARY BANK Company: The Bank of New York 101 Barclay Street New York, N.Y. 10286, USA Tel: +1-212-815-2476 http://www.adrbny.com Please refer to London Stock Exchange official website for Sunplus’ Market Price. http://www.londonstockexchange.com

I
TABLE OF CONTENT I. LETTER TO SHAREHOLDERS .............................................................................................................1 II. COMPANY PROFILE.............................................................................................................................3
2.1 Foundation of Sunplus............................................................................................................. 3 2.2 Milestones............................................................................................................................... 3
III. CORPORATE GOVERNANCE...............................................................................................................5 3.1 Organization............................................................................................................................ 5 3.2 Directors, Supervisors, and Management Team ....................................................................... 7 3.3 Corporate Governance Implementation .................................................................................. 14 3.4 Audit Fees: Not Applicable..................................................................................................... 18 3.5 Replacement of Auditors........................................................................................................ 19 3.6 Chairman, Presidents, and Managers in Charge of Finance and Accounting Who Held a Position
in Sunplus’ Independent Audit Firm or Its Affiliates during 2007: None .................................... 19 3.7 Net Change in Shareholding and Net Changes in Shares Pledged by Directors, Supervisors,
Management, and Shareholders with 10% Shareholding or More............................................ 20 3.8 Top 10 Shareholders & Related Parties Defined in Article 6 of Taiwan GAAP.......................... 21 3.9 Long-term Investment Ownership........................................................................................... 22
IV. CAPITAL & SHARES...........................................................................................................................23 4.1 Capitalization......................................................................................................................... 23 4.2 Issuance of Corporate Bonds: None....................................................................................... 27 4.3 Preferred Shares: None......................................................................................................... 27 4.4 Issuance of GDR................................................................................................................... 28 4.5 Employee Stock Options Plan................................................................................................ 29
V. FINANCIAL PLAN & IMPLEMENTATION.............................................................................................30 VI. BUSINESS HIGHLIGHT.......................................................................................................................31
6.1 Business Activities................................................................................................................. 31 6.2 Market and Sales Status........................................................................................................ 32 6.3 Personnel Structure............................................................................................................... 37 6.4 Environmental Protection & Expenditures............................................................................... 37 6.5 Employees ............................................................................................................................ 37 6.6 Important Contracts ............................................................................................................... 38
VII. FINANCIAL STATEMENTS..................................................................................................................39 7.1 Condensed Financial Statement and Auditors’ Opinions ......................................................... 39 7.2 Financial Analysis.................................................................................................................. 41 7.3 Supervisor’s Report ............................................................................................................... 44 7.4 Financial Statement & Independent Auditors’ Report .............................................................. 45 7.5 Consolidated Financial Statements ........................................................................................ 93 7.6 Financial Difficulties............................................................................................................. 145
VIII. FINANCIAL ANALYSIS......................................................................................................................146 8.1 Financial Status................................................................................................................... 146 8.2 Operational Results ............................................................................................................. 146 8.3 Cash Flow........................................................................................................................... 147 8.4 Major Capital Expenditure.................................................................................................... 147 8.5 Long-Term Investment......................................................................................................... 148 8.6 Risk Management................................................................................................................ 148 8.7 Other Remarks.................................................................................................................... 149
IX. SPECIAL NOTES ..............................................................................................................................150 9.1 Affiliates .............................................................................................................................. 150 9.2 Private Placement Securities ............................................................................................... 159 9.3 Status of Sunplus Common Shares/GDRs Acquired, Disposed of, or Held by Subsidiaries .... 160 9.4 Special Notes...................................................................................................................... 160 9.5 Any Events Impact to Shareholders’ Equity and Share Price ................................................. 160

II
PLEASE READ FOLLOWING NOTICE BEFORE USING THIS REPORT Readers are advised that the original version of the repots financial is in Chinese. If there is any conflict between these financial statements and the Chinese version or any difference in the interpretation of the two versions, the Chinese-language report shall prevail. In addition, certain of our financial information have been published in accordance with requirements of the Republic of China Securities and Futures Commission and are presented in conformity with accounting principles generally accepted in the Republic of China. Readers should be cautioned that these accounting principles differ in many material respects from accounting principles generally accepted in other countries. The materials and information provided on this report have been issued by Sunplus and are posted solely for informational purposes and is not an offer to buy or sell or a solicitation of an offer to buy or sell any securities issued by us or otherwise.
1
I. LETTER TO SHAREHOLDERS
Financial Results Sunplus revenue in 2008 totaled NT$6,093 million with 34% year-on-year decline since the end demand and ICs shipment slowed down due to the economic crisis. The gross profits in 2008 were NT$2,358 million and the R&D expense totaled NT$1,533 million while the SG&A expenses were NT$309 million. The operating net profits summed up NT$517million in 2008. Including disposal gain of NT$246million; settlement compensation income of NT$108million; long-term investment loss of NT$930 million by equity-method; loss on inventory provision of NT$ 120 million and so on, the non-operating net losses totaled NT$357 million. The income before tax were NT$160 million, and the net income after tax were almost break-even which the earning per share for 2008 was NT$0.01.
Products and Technologies Sunplus delivers IC solutions for multimedia home applications including DVD/VCD player, LCD TV, digital TV, and DVB-Terrestrial set-top-box. We keep investing in new technologies and products while the R&D expense were 25% of total revenue in 2008. Sunplus has great success on delivering DVB-T/ATSC/DTMB DTV IC solutions; meanwhile, we collected about 10% revenue from licensing DTV IPs in 2008 which revealed Sunplus’ R&D capability and leading position on DTV technologies. In the future, we will continue developing cutting-edge technologies and offering highly value-added IC solutions.
Organization Sunplus is mainly supported by the Home Entertainment Business Unit which includes the IC design center and system development center. The IC design engineers and system application engineers work closely so that Sunplus could deliver the total solutions to help customers launch their end products with faster time-to-market and better cost-performance. At the end of February, 2009, the Sunplus’ workforce numbered 573 people, including 393 R&D staff, which accounts for 69% of the total employees. In order to going through the economic crisis, we would not expand the manpower in 2009 but we definitely will sustain product R&D and market promotion by leveraging the available resources.
Core Competing Advantage Sunplus, with its R&D expertise and plentiful reusable IPs such as video/audio technologies, micro-processor and DSP, has a good opportunity to win the market by differentiating product designs and optimizing cost structure. Sunplus also raises the entry barrier by involving the cutting-edge SoC design deeply, since the complicated SoC designs benefit the capable companies with economic scale like Sunplus. The most important is that Sunplus and its IC design subsidiaries focus on different IC applications for better flexibility and efficiency by re-organization, but can be pulled together to grip the new customers and markets because of the group synergy.
Competition, Relevant Regulations, and Global Economics Today, Sunplus is quite successful and leading on home entertainment IC technologies, on the other hand, we have to face the competition from other top-tiers. In order to standing out, Sunplus has been accumulating abundant intellectual properties related to audio/video technologies and developing the sales channels and strategic partnership with customers aggressively. Staring from 2009, Sunplus will adopt the newly released “Statement of Financial Accounting Standards” No. 10, “Accounting for Inventory”, that the inventories should be evaluated by categories and marked down by the market value. The adoption of mentioned accounting statement won’t impact Sunplus extremely for we are quite cautious with inventory management and has booked the reasonable provision for inventory losses quarterly. Although the demands of high-end consumer applications such as large-sized digital TV were stricken by the global economic crisis, the demands of set-up-box will keep growing for many

2
countries are going to switch off the analog broadcasting channels. And we have faith that Sunplus should win the final battle since the customers shall pick up the quality products with better cost performance like Sunplus.
Outlook The economic debacle starting from sub-prime mortgage crisis in America has cooled down the consumer IC demand in 2007 though questionable 2009. However, we will keep evaluating the business opportunities conservatively, allocating the available resources preciously, doing cost down aggressively and focusing on our core technologies in the gloom until the bearish market turns to be more optimistic. While the concept of “digital home” is becoming the ideal life style, the demands of digital home applications will be growing in the coming few years, especially because of the analog switching off. Sunplus will keep launching home entertainment IC products for digital TV, set-top-box, BD player and DVD with the highly value-added system solutions to our customers, as well as making the better return of equities for our shareholders. We would like to thank you for the long-term support with our sincere wishes. All the best, Chairman& CEO,

3
II. COMPANY PROFILE 2.1 Foundation of Sunplus
Sunplus was founded in August 3, 1990. 2.2 Milestones
Please refer to page 23 Section 4.1 for Capitalization. Please refer to page 150 Section 9.1 for Sunplus’ affiliates. 1990.08 Sunplus Technology was founded. 1993.05 Obtained approval from the SIPA to move into Hsinchu Science Park. 1993.10 The Company moved into Hsinchu Science Park. 1994.09 Company started in-house wafer circuit probe testing. 1995.12 Groundbreaking for the construction of Sunplus’ office building, located in 19, Innovation First
Road, Hsinchu Science Park. 1996.04 Evaluated as “The most productive IC design company” by Hsinchu SIPA. 1997.01 Grand opening of Sunplus’ office building. 1997.09 Sunplus Technology was IPO on the Over-The-Counter stock market. 2000.01 Sunplus was listed on the main board of the Taiwan Stock Exchange (TSE). 2000.06 Received certificate of ISO 9001 Quality Assessment by RWTUV. 2000.09 Reorganized into three new business unit, Consumer center, Multimedia center, and production
center; and the BOD appointed Mr. Yarn-Chen Chen as the president. 2000.12 Sunplus received the “Distinguished Achieved Award” from Hsinchu SIPA. 2001.03 Sunplus successfully launched Global Depositary Receipts on the London Stock Exchange. 2001.12 Completed the Grandtech merger and announced the company’s reorganization. 2002.01 Established a subsidiary in Shanghai, China to provide better service to customers in Mainland. 2002.12 Implemented ERP system successfully to enhance company‘s operating efficiency and
competence. 2002.06 Purchased a new office building (B-building) at Science Park. 2002.07 Sponsored the new Innovation Park and Parking Lot at Science Park, Hsinchu. 2003.02 Licensed 32-bit core IP from MIPS Technology for next-generation consumer electronic products. 2003.04 Completed acquisition of Oak Optical Storage Business and spin-off a new venture, Sunext
Technology to focus on next generation Blue Ray ODD controller. 2003.05 Licensed MPEG-4 video compression technology from DivX Networks to create DivX certified IC
solution for consumer electronic products. 2003.06 Announced reorganization by altering the Product Business Unit Systems to Functional Business
Unit Systems. 2003.07 Licensed PanelLink DVI core IP from Silicon Image to develop dual-mode LCD controller
solutions. 2003.08 Aligned to joint-develop System-on-the-chips (SoC) solutions and deliver broad portfolio of digital
media solutions with Silicon Image. 2003.08 Established a new milestone for monthly sales over NT$1 billion. 2003.12 Won ”Innovation Product Award 2003” and “R&D Performance Award 2003” from Hsinchu SIPA. 2003.12 The net sales for 2003 reached NT11.1 billion as landmark. 2004.09 Received certificate of ISO 14000 Quality Assessment. 2004.12 MFP SoC with 4800dpi image quality won “Innovation Product Award 2004” from Hsinchu SIPA. 2004.12 Won “R&D Performance Award 2004” from Hsinchu SIPA. 2005.06 Announced the first 32-bit processor core S+core® with Sunplus-owned instruction set
architecture 2005.06 Launched USB2.0-to-Serial ATA bridge solution. 2005.08 Announced the joint-development of the next-generation of optical mouse solution with Agilent
Technology. 2005.08 Applied MPEG-4 image controlling technology to the first IP cam with resolution up to 1M pixel in
the worldwide. 2005.08 Completed the merger with the 3G team of information & communication research lab ITRI and
started the development of 3G cellular communication ICs. 2005.09 Established a new milestone of monthly sales up to NT$1.899 billion as record high.

4
2005.10 Mass production of the PHS mobile baseband processor. 2005.11 Sunplus announced the worldwide first DVD ICs certificated by DivX Ultra. 2005.12 Announced reorganization by altering the Functional Business Unit System to Product Business
Unit System and the resolved to spin off the LCD IC business. Mr. Chou-Chye Huang was appointed to CEO of Sunplus.
2006.03 Completed the spin-off of the LCD IC business into Orise Technology Co., Ltd. 2006.12 Completed the spin-off of Controller & Peripheral Business Unit into Sunplus Innovation
Technology Inc. 2006.12 Completed the spin-off of the Personal Entertainment Business Unit and Advanced Business Unit
into Sunplus mMobile Inc. 2006.12 Approved return of capital NT$5.11 billion by shareholders’ extraordinary general meeting. 2006.12 Established a new record high with 2006 profit after tax, NT$2.97 billion. 2007.02 Licensed digital TV SoC IP to Silicon Image, Inc. with US$40 million for license fee. 2007.03 Completed the return of capital with outstanding shares afterward 512,953,665 shares 2007.04 Sunplus mMobile, the subsidiary of Sunplus, spun-off its multimedia center into Sunplus mMedia
Inc. 2007.09 Sunplus 32-bits processor core S+core® won the “National Invention and Creation Award” from
TIPO, Ministry of Economics Affairs 2007.10 Presented World's first DVD SoC solution with DivX HD playability 2007.10 Established a new subsidiary, Sunplus Core Technology, with Sunplus S+core® team and ITRI
PAC DSP team. 2007.12 Highly integrated SoC SPG290 with interactive game and education function won the “Innovation
Product Award 2007” from Hsinchu SIPA. 2007.12 Received certificate of IECQ 080000 for hazardous substance process management. 2007.12 Established a new subsidiary, Sunplus Prof-tek Technology, in Shenzhen 2007.12 Participated Sunext capital increase of NT$670million. 2008.01 Established a new subsidiary, Sunmedia Technology, in Chengdu. 2008.03 Licensed hyper-sensitization GPS technology from CORE Corporation. 2008.03 Sunext licensed optical storage technology to Broadcom Corporation with license income up to
US$38million. 2008.03 Launched first DTMB demodulator for China digital broadcasting TV system among Taiwanese IC
design companies. 2008.04 Established new subsidiary Sunplus APP Technology in Beijing, to follow up Sunplus University
Program in China 2008.11 Finished to buy-back Sunplus mMedia Inc. of 7,450 million shares 2009.01 Presented Sunplus wide range of DTV IC solutions from entry-level to high-end at International
CES 2009 2009.03 Sunplus mMobile Inc. spun-off its Communication Center to HT mMobile Inc. 2009.03 Joint-promoted with DTS next generation DVD SoC delivering the ultimate audio entertainment
experience

5
III. Corporate Governance 3.1 Organization 3.1.1 Organization Chart
Legal & IP DivisionFinance & AccountingDivisionAdministration CenterHome Entertainment
Business Unit
Internal Auditor
Supervisors
ShareholdersMeeting
Chairman Office
CEO Office
Chairman
Board of DirectorsMeeting
CEO

6
3.1.2 Major Corporate Functions Department Job Description
Chairman Office (1) Planning company’s strategic alliance (2) Planning and executing investment plan (3) Arranging Board of Directors Meeting
CEO Office
(1) Establishing company’s operational policy, strategies, and goals (2) Auditing and improving the operation performance (3) Communicating with investor/ public and press (4) Executing and managing the strategic alliance worldwide (5) Planning company’s business plans and strategic investments
Internal Auditor
(1) Executing internal routine auditing plan (2) Routine auditing of subsidiaries (3) Case Auditing (4) Re-certification auditing of self-examination (5) Establishing of internal control system
Manufacture Department (1) Testing the company IC products (2) Maintaining testing software and facility
Home Entertainment BU (HE)
(1) Developing world-class audio and video solution (2) Managing sales channels and distributors (3) Marketing and developing business worldwide (4) Managing production, material control. International trading affairs (5) Developing and managing quality assurance system
Administration Center
(1) General administration (2) Human resources management (3) Establishing& managing information service, and promoting productivity (4) Assisting corporation in the automating and reengineering of business
process, and promoting competitiveness (5) Strategy management to supporting the company growth
Finance & Accounting Division (1) Finance, accounting operation and capital, assets management (2) Arranging annual shareholders meeting
Legal & IP Division
(1) In charge of legal and IP affairs (2) Managing the project procedures and documents (3) Protecting and managing documents (4) Purchasing, protecting, and managing books and periodicals (5) Contract & IP management

7
3.2 Directors, Supervisors, and Management Team 3.2.1 Directors & Supervisors
2009.03.02, Unit: shares Share holding When Elected
Current Shareholding
Spouse & Minor Shareholding Title Name Date
Elected Initial Date
Elected Term of Office
Amount % Amount % Amount %
Educational Background Positions Currently held in Other Companies (Note2)
Chairman & CEO Chou-Chye Huang 2006.06.09 1990.07.09 3 years 160,058,422 16.85 92,737,817 15.54 919,873 0.15
M.S. Electrical Engineering, National Tsing Hua University
Chairman: Sunplus, RUSSELL Holdings, Global Techplus capital Inc., TECHPLUS Capital (SAMOA), VENTURPLUS Group Inc., VENTURPLUS Mauritius Inc., VENTURPLUS Cayman Inc., Shanghai Sunplus, Sunplus HK , Sunplus Venture Capital, Lin Shih Investment, Weiying Investment, Sunplus Management Consulting, Giantplus Holding, Giantplus (SAMOA) Holding, KunShan Giantplus, Giantplus, Waveplus, Waveplus Holdings, Generalplus International (SAMOA), Sunplus Innovation Technology, Sunplus mMobile, Generalplus (Mauritius), Generalplus (Shenzhen), Sunext, Sunext Optoelectronics (Shanghai), Great Sun, Sunext (Mauritius), Orise, Sunplus mMedia, Shin-heng Investment, Sunplus Core, Sunplus Prof-tek, Sunmedia, Generalplus, Sunplus APP, Sunplus mMobile SA, Sunplus mMobile Ltd., Sunplus mMobile holding, Bright Sunplus mMobile Inc., Director: Jet Focus, Shenzhen Giantplus Optoelec. Display, Goldkey Technology, Avl Technology, Hsinchu Golf Club, Spring Foundation of NCTU, Li-Shin Hosipital Research Foundation, Pan Wen Yuan Foundation, Taiwan Express, Sinocon Foundation,
Director Yarn-Chen Chen 2006.06.09 1990.07.09 3 years 32,673,433 3.44 19,008,245 3.18 2,962,755 0.50
M.S. Computer & Electrical Engineering, University of California Santa Barbara
Director: Sunplus,Jet Focus, Shanghai Sunplus, Sunplus venture capital, Lin-Shin Investment, Weiying Investment, Sunplus Management Consulting, Sunplus mMedia, Sunext, Sunext Optoelectronics (Shanghai), Glodkey, Ability Enterprise, Sunplus mMobile,
Director Bing-Huang Shih 2006.06.09 1990.07.09 3 years 15,503,360 1.63 6,315,505 1.06 1,696,085 0.28
M.S. Electrical Engineering, National Taiwan University
Director: Sunplus, Sunplus Venture Capital, Lin Shih Investment, Weiying Investment, Sunplus Management Consulting, Shanghai Sunplus, Beijing Golden Global View, Global View, Orise, Sunplus Innovation Technology, Sunplus mMobile, Sunext, Generalplus, Sunplus mMedia, Sunplus Core
Director
Min-Sheng Lee (Ritek Corp. Representative of Legal Entity)
2006.06.09 2000.05.31 3 years 5,012,149 0.53 2,904,036 0.49 0 0.00 National Taichung Institute of Technology
Director: Kunshan protek, Kunshan Protek optoelectronics, Ritdisplay, Sunplus, Supervisor: Huanchin Investment, HuaShiDeKe Co., Ltd.
Independent Director Po-Young Chu 2006.06.09 2006.06.09 3 years 0 0.00 1,736 0.00 4,053 0.00 PhD., Purdue University, USA Director: Sunplus, Chilisin Electronics
Supervisor
Feng, Chu-Chien (Global View Co., Ltd. Representative of Legal Entity)
2006.06.09 1990.07.09 3 years 24,774,377 2.61 10,038,049 1.68 0 0.00 EE of National Chiao-Tung University
Director: Reti Corp., Ming- Chun Tech, Radiantek Supervisor: Sunplus, Giantplus, Waveplus
Note 1: Please refer to the list of affiliate companies for the full names of other companies. Note 2: None of the Company’s directors and supervisors holds shares under others’ names. Note 3: None of the Company’s directors and supervisors is within second-degree of consanguinity, such as a spouse or relative, to each other.
8
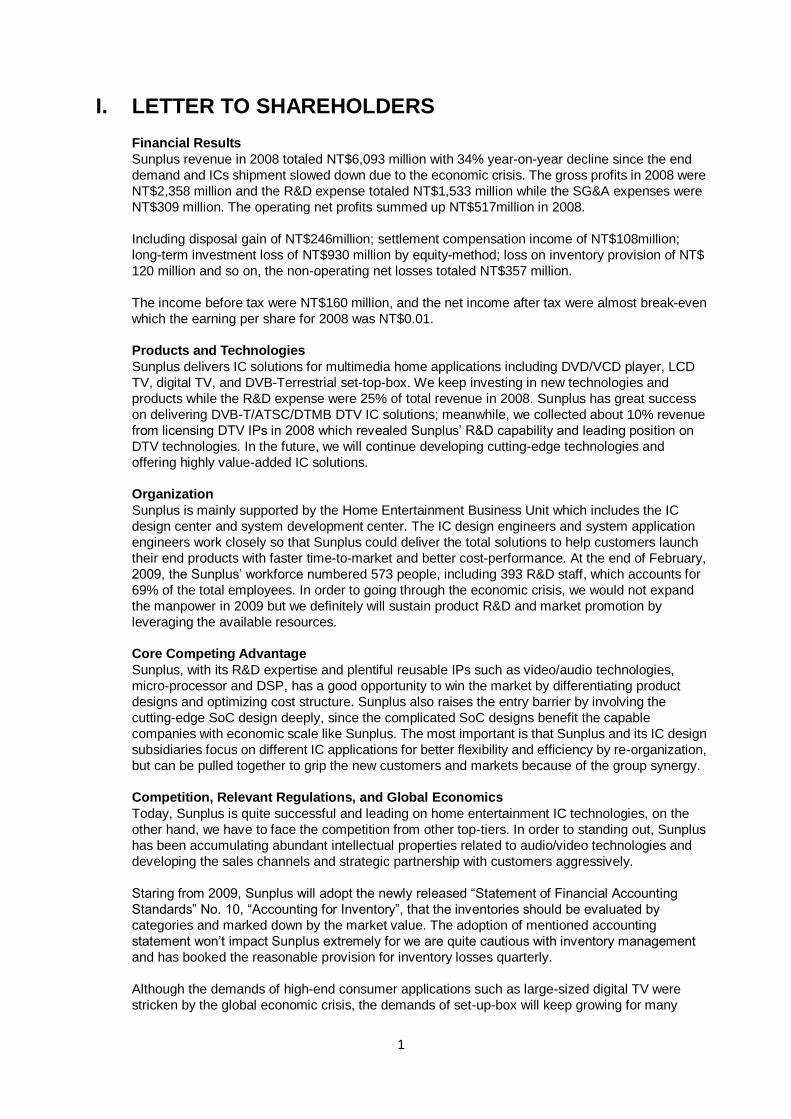
3.2.2 Directors and Supervisors' Qualifications and Independence Analysis
2009.03.02
With over 5 years of working experience and one of the following professional
requirements Independent status (Note 2)
Criteria Name (Note 1)
An instructor of higher position in a department of commerce, law, finance, accounting, or other departments related to the Company’s business in a public or private college or university
A judge, public prosecutor, attorney, certified public accountant, or other professional or technical specialist who has passed a national examination and been awarded a certificate in a profession necessary for the Company’s business
With an experience in commerce, law, finance, accounting, or other specialties necessary to the Company’s business
1 2 3 4 5 6 7 8 9 10
Numbers of other public companies concurrently serving as an independent director
Chou-Chye Huang
Yarn-Chen Chen Bing-Huang Shih Po-Young Chu 1 Min-Sheng Lee (Ritek Corp. Representative of Legal Entity)
Feng, Chu-Chien (Global View Co., Ltd. Representative of Legal Entity)
Note 1: The amount of columns depends on the actual circumstance. Note 2: “”indicates the director or supervisor meeting a criteria during its term of office and two years before being elected.
(1) Not an employee of the Company or its affiliates. (2) Not a director or supervisor of the Company or its affiliates. (This does not apply, however, in case where the position is an
independent director of the Company, its parent company, or a subsidiary in which the Company holds, directly or indirectly, more than 50% of shares.)
(3) Not the shareholder (with its relatives or under others’ names) who holds more than 1% shareholding of the total issued shares or ranked as the Top 10 shareholders.
(4) Not a spouse, relative within the second-degree of consanguinity, or the lineal relative within the fifth-degree of consanguinity of any of the persons in the preceding three paragraphs.
(5) Not a director, supervisor, or employee of a corporate shareholder that directly holds 5% or more of the total number of the Company’s issued shares or that holds shares ranked as Top 5 in holdings.
(6) Not a director, supervisor, officer, or shareholder holding 5% or more of the shares, of a specified company or institution, which has financial or business relationship with the Company.
(7) Not a professional individual, owner, partner, director, supervisor, or officer (and a spouse thereof) of a sole proprietorship, partnership, company, or institution which provides commercial, legal, financial, accounting, and so on, services or consultation to the Company or to its affiliates.
(8) Not a spouse or a relative within the second-degree of consanguinity to other directors of the Company. (9) Not been a person of any condition as defined in Article 30 of the Company Law. (10) Not a governmental, juridical person or its representative as defined in Article 27 of the Company Law.
9
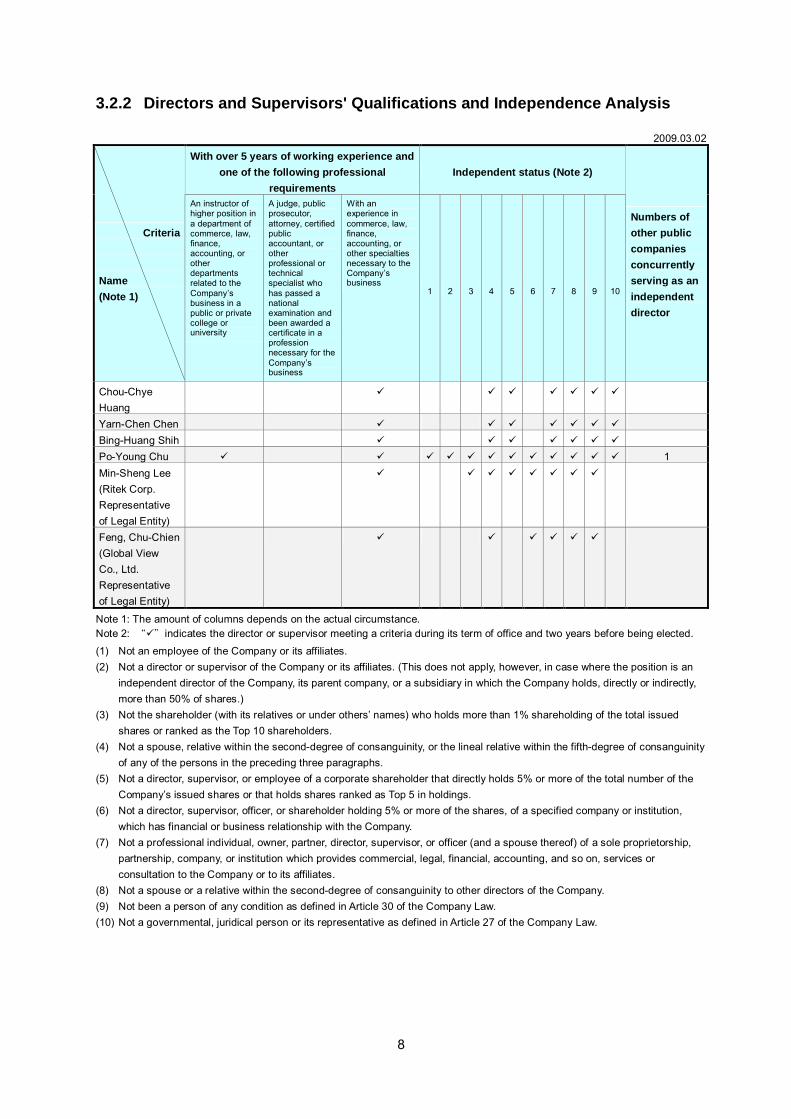
3.2.3 Major Shareholders of Sunplus’ Shareholders as Legal Entities (A) Global View’s Top 10 Shareholders
2009.03.02 Shareholder Holding (%)
Sunplus Technology 11.95 Meng-Huei Lin 8.23 The Hong Kong and Shanghai Banking Corporation Limited, Taipei Branch 7.71 Jhih-Yuan Chou 5.95 Sin-Lin Liao 4.66 HSBC 3.95 Citibank as trustee for First Securities 3.01 Kun-Ting Huang 2.72 Sing-Fei Ma 2.13 Yun-Long Hunag 1.91
(B) Ritek’s Top 10 Shareholders
2009.03.02 Shareholder Holding (%)
Chwei-Jing Yeh 1.40 The Northern Trust Company as trustee for Sanford C. Bernstein & Co. Delaware Business Trust-Emerging Markets Value Series 1.10
HSBC in custody for Taiwan Opportunity Fund 1.09 Chung Fu Investment* 0.98 Wei-Fen Yang 0.96 Citibank in custody for Taiwan Drive Partner Fund 0.88 Citibank in custody for Emerging Markets Evaluation Fund 0.84 Jen-Tai Yen 0.68 Standard Chartered in custody for Germany West European Bank 0.59 Platinum Asia Fund 0.56
* Note: Chung-fu investment’s legal entity shareholder: Ritek Corp holding 100%

10
3.2.4 Management Team 2009.03.02, Unit: shares
Current Shareholding Spouse’s & Minor’s Shareholding
Title
Name
Effective Date
Amount % Amount % Educational Background Positions Currently held in Other Companies
Chairman & CEO Chou-Chye Huang 1990.07.09 92,737,817 15.54 919,873 0.15 M.S. Electrical Engineering, National Tsing Hua University
Chairman: Sunplus, RUSSELL Holdings, Global Techplus capital Inc., TECHPLUS Capital (SAMOA), VENTURPLUS Group Inc., VENTURPLUS Mauritius Inc., VENTURPLUS Cayman Inc., Shanghai Sunplus, Sunplus HK , Sunplus Venture Capital, Lin Shih Investment, Weiying Investment, Sunplus Management Consulting, Giantplus Holding, Giantplus (SAMOA) Holding, KunShan Giantplus, Giantplus, Waveplus, Waveplus Holdings, Generalplus International (SAMOA), Sunplus Innovation Technology, Sunplus mMobile, Generalplus (Mauritius),Generalplus (Shenzhen), Sunext, Sunext Optoelectronics (Shanghai), Great Sun, Sunext (Mauritius), Orise, Sunplus mMedia, Shin-heng Investment, Sunplus Core, Sunplus Prof-tek, Sunmedia,Generalplus, Sunplus APP, Sunplus mMobile SA, Sunplus mMobile Ltd., Sunplus mMobile holding, Bright Sunplus mMobile Inc., Director: Jet Focus, Shenzhen Giantplus Optoelec. Display, Goldkey Technology, Avl Technology, Hsinchu Golf Club, Spring Foundation of NCTU, Li-Shin Hosipital Research Foundation, Pan Wen Yuan Foundation, Taiwan Express, Sinocon Foundation,
BU President Oh-Jung Ou 2001.12.25 1,550,866 0.26 510,604 0.09 B.S. Electrical Engineering, Chung Yuan Christian University None
Vice President Steven Huang 2004.05.07 592,937 0.10 9,240 0.00 EMBA, Technology & Innovation Management (TIM), National Chengchi University
None
Vice President Wen-Kuan Chen 2005.11.07 327,080 0.05 1,522 0.00 M.S. Electrical Engineering, National Cheng Kung University None
VP Wayne Shen 2005.12.01 1,089,558 0.18 275,279 0.05 EMBA, Technology Management, National Chiao-Tung University Supervisor of Sunplus Venture Capital
Director of Finance & Accounting Division Piper Hung 2007.11.05 50,000 0.01 0 0.00 Bachelor, Accounting, Tamkang
University None
Note1: Please refer to investment list for the full name of other companies. Note2: None of the management holds the company shares under others’ account. Note3: None of management team, Board of Directors and Supervisors is second-degree of consanguinity relatives of above management

11
3.2.5 Remuneration to Directors, Supervisors, Presidents, and Vice Presidents (A) Remuneration to Directors
Units: NT$K, shares
Remuneration to Directors Remuneration to Directors who hold a Concurrent Post in the Company
Salary (A) (Note 2) Pension
Bonus from Profit
Distribution (C) (Note 3)
Allowance (D) (Note 4)
(A)+(B)+(C)+(D) of 2008 Net
Income (Note 11)
Salary, Bonus, etc. (E) (Note 5)
Employee Bonus from Profit Distribution (F)
(Note 6)
Stock Option (G)
(Note 7)
(A)+(B)+(C)+(D) +(E)+(F)+(G) in 2008 Net
Income (Note 11)
Sunplus
Consolidated
Subsidiaries (N
ote 8)
Title Name (Note 1)
Sunplus
Consolidated
Subsidiaries (N
ote 8)
Sunplus
Consolidated
Subsidiaries (N
ote 8)
Sunplus
Consolidated
Subsidiaries (N
ote 8)
Sunplus
Consolidated
Subsidiaries (N
ote 8)
Sunplus
Consolidated
Subsidiaries (N
ote 8)
Sunplus
Consolidated
Subsidiaries (N
ote 8)
Cash
Bonus
Stock B
onus
Cash
Bonus
Stock B
onus
Sunplus
Consolidated
Subsidiaries (N
ote 8)
Sunplus
Consolidated
Subsidiaries (N
ote 8) Remuneration
from Long-term Investments
Except Subsidiaries
(Note 12)
Chairman Chou-Chye Huang
Director Yarn-Chen Chen Director Bing-Huang Shih
Ritek Corp.
Director Min-Sheng Lee, Representative of Legal Entity
Independent Director Po-Young Chu
0 0 0 0 0 0 114,000 155,000 1.36% 0.20% 8,191,692 12,887,354 91,704 171,996 0 0 0 957,000 100.16% 10.87% 0
Numbers of Directors
(A)+(B)+(C)+(D) (A)+(B)+(C)+(D)+(E)+(F)+(G) Remuneration to Directors Sunplus (Note 9)
Consolidated Subsidiaries (Note 10)
Sunplus (Note 9)
Consolidated Subsidiaries (Note 10)
Under NT$2,000,000 Chou-Chye Huang, Yarn-Chen Chen, Bing-Huang Shih, Po-Young Chu, Ritek, Min-sheng Lee
Chou-Chye Huang, Yarn-Chen Chen, Bing-Huang Shih, Po-Young Chu, Ritek, Min-sheng Lee
Yarn-Chen Chen, Bing-Huang Shih, Po-Young Chu, Ritek, Min-sheng Lee
Bing-Huang Shih, Po-Young Chu, Ritek, Min-sheng Lee
NT$2,000,000~NT$5,000,000 Yarn-Chen Chen NT$5,000,000~NT$10,000,000 Chou-Chye Huang
Note 1: Names of directors shall be disclosed separately (name of juridical-person shareholders and their representatives shall be disclosed separately), and the remuneration shall be disclosed in total amount. If a director concurrently serves as a president or vice president, his/her remuneration shall be disclosed accordingly in this table and table (C). Note 2: It indicates the remuneration to directors, including salary, allowance, pension, bonus, rewards, and etc.) in the most recent fiscal year. Note 3: It indicates the remuneration to directors from profit distribution in the most recent fiscal year according to the proposal submitted by BOD to shareholders’ meeting for approval. Note 4: It indicates the expenses generated from directors’ business (including transportation fees, social activity fees, allowances, dormitories, company cars, and etc.) in the most recent fiscal year. If the Company provides a house, car/other transportation, or other allowances to directors, the relevant payments, calculated at actual cost or fair value, shall be disclosed. The remuneration paid to the company drivers shall be disclosed but not included in the remuneration to directors. Note 5: It indicates the salaries, allowances, pensions, severance pay, bonuses, rewards, transportation fees, social activity fees, dormitories, cars, and etc., to directors who hold concurrently posts in the Company (including presidents, vice presidents, managers, or other employees). If the Company provides a house, car/other transportation, or other allowances to directors, the relevant payments, calculated at actual cost or fair value, shall be disclosed. The remuneration paid to the company drivers shall be disclosed but not included in the remuneration to directors. Note 6: It indicates the employee bonuses (including cash and stock) paid to directors who hold concurrently posts in the Company (including presidents, vice presidents, managers, or other employees). The amount of employee bonus according to the proposal of profit distribution submitted by BOD to shareholders’ meeting for approval in the most recent fiscal year shall be disclosed. If there is no such proposal yet, the stock bonus may be calculated according to the stock bonus last year. The amount of stock bonus for public companies shall be calculated at fair value, which means the closing price on the balance sheet date. For private companies, the amount of stock bonus shall be calculated based on the net value on the last day in the fiscal year when the profit distributed. Note 7: It indicates the employee stock options (excluding those has been executed) offered to the directors who concurrently hold posts in the Company (including presidents, vice presidents, managers, or other employees). The relevant information shall be disclosed in this table and table 15. Note 8: The total amount remuneration paid to the Company’s directors by all the companies in the consolidated financial statements (including Sunplus) shall be disclosed. Note 9: It indicates the numbers of directors classified by the amount of their remuneration paid by Sunplus. The amount of remuneration paid to juridical-person shareholders shall be distributed equally to each representative, and then they shall also be classified according to the amount. If the Company is willing to disclose the names of directors in each classification, the title of column shall be changed to “Names of Directors”. Note 10: It indicates the numbers of directors classified by the amount of their remuneration paid by all the companies in the consolidated financial statements (including Sunplus). If the Company is willing to disclose the names of directors in each classification, the title of column shall be changed to “Names of Directors”. Note 11: It indicates the net income in the most recent fiscal year. Note 12: a. Whether the Company’s directors receive remuneration from other long-term investments except subsidiaries shall be disclosed as “Yes” or “No”. b. If “Yes”, the amount of remuneration may be disclosed voluntarily and be included into column G and H; also, the title of the column shall be change to “All the Long-term Investments”. c. The remuneration indicated here means the salaries, allowances, bonuses, and other relevant rewards paid by from other long-term investments except subsidiaries. ※The remuneration disclosed here shall not be used for taxation purpose because those are calculated on a different basis.

12
(B) Remuneration to Supervisors Unit: NT$, shares
Remuneration to Supervisors
Salary (A) (Note 2) Pension (B)
Bonus from Profit Distribution (C)
(Note 3)
Allowance (D) (Note 4)
(A)+(B)+(C) +(D) of Net Income
(Note 8)
Title Name (Note 1) Sunplus
Consolidated
Subsidiaries (N
ote 5)
Sunplus
Consolidated
Subsidiaries (N
ote 5)
Sunplus
Consolidated
Subsidiaries (N
ote 5)
Sunplus
Consolidated
Subsidiaries (N
ote 5)
Sunplus
Consolidated
Subsidiaries (N
ote 5)
Remuneration from Long-term Investments
Except Subsidiaries (Note 9)
Global View Co., Ltd. Supervisor Chu-Chien Feng
(Global View Co., Ltd. Representative of Legal Entity) 0 0 0 0 0 0 24,000 24,000 0.29% 0.03% No
(A)+(B)+(C) Remuneration to Supervisors
Sunplus(Note 6) Consolidated Subsidiaries of Sunplus(D) (Note 7) Under NT$2,000,000 Global View Co., Ltd., Chu-Chien Feng Global View Co., Ltd., Chu-Chien Feng
※The remuneration disclosed here shall not be used for taxation purpose because those are calculated on a different basis.
Note 1: Names of supervisors, juridical-person shareholders and their representatives shall be disclosed separately, and the remuneration shall be disclosed in total amount. Note 2: It indicates the remuneration to supervisors, including salary, allowance, pension, bonus, rewards, and etc., in the most recent fiscal year. Note 3: It indicates the remuneration from profit distribution in the most recent fiscal year according to the proposal submitted by BOD to shareholders’ meeting for approval. Note 4: It indicates the expenses generated from supervisors’ business (including transportation fees, social activity fees, allowances, dormitories, company cars, and etc.) in the most recent fiscal year. If the Company provides a house, car/other transportation, or other allowances to supervisors, the relevant payments, calculated at actual cost or fair value, shall be disclosed. The remuneration paid to the company drivers shall be disclosed but not included in the remuneration to directors. Note 5: The total amount remuneration paid to the Company’s supervisors by all the companies in the consolidated financial statements (including Sunplus) shall be disclosed. Note 6: It indicates the numbers of supervisors classified by the amount of their remuneration paid by Sunplus. If the Company is willing to disclose the names of supervisors in each classification, the title of column shall be changed to “Names of Supervisors”. Note 7: It indicates the numbers of supervisors classified by the amount of their remuneration paid by all the companies in the consolidated financial statements (including Sunplus). If the Company is willing to disclose the names of supervisors in each classification, the title of column shall be changed to “Names of Supervisors”. Note 8: It indicates the net income in the most recent fiscal year. Note 9: a. Whether the Company’s supervisors receive remuneration from other long-term investments except subsidiaries shall be disclosed as “Yes” or “No”. b. If “Yes”, the amount of remuneration may be disclosed voluntarily and be included into column D; also, the title of the column shall be change to “All the Long-term Investments”. c. The remuneration indicated here means the salaries, allowances, bonuses, and other relevant rewards paid by from other long-term investments except subsidiaries.
13
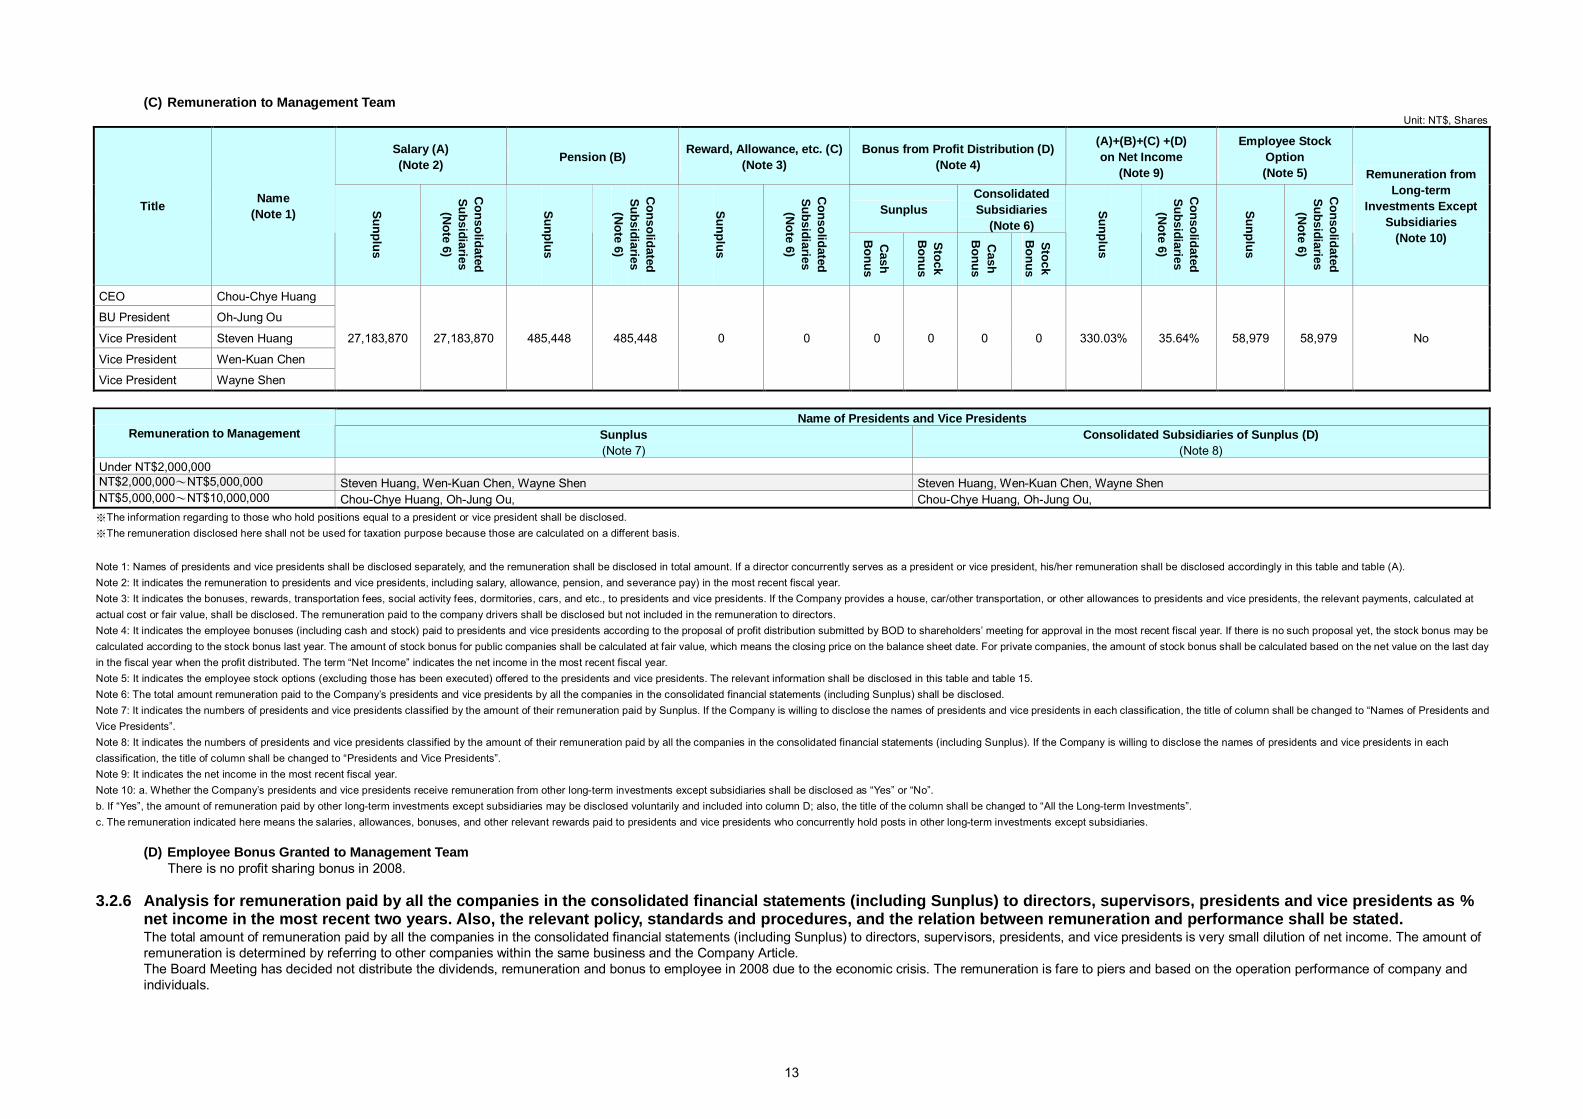
(C) Remuneration to Management Team Unit: NT$, Shares
Salary (A) (Note 2) Pension (B) Reward, Allowance, etc. (C)
(Note 3) Bonus from Profit Distribution (D)
(Note 4)
(A)+(B)+(C) +(D) on Net Income
(Note 9)
Employee Stock Option (Note 5)
Sunplus Consolidated Subsidiaries
(Note 6) Title Name
(Note 1) Sunplus
Consolidated
Subsidiaries (N
ote 6)
Sunplus
Consolidated
Subsidiaries (N
ote 6)
Sunplus
Consolidated
Subsidiaries (N
ote 6)
Cash
Bonus
Stock B
onus
Cash
Bonus
Stock B
onus
Sunplus
Consolidated
Subsidiaries (N
ote 6)
Sunplus
Consolidated
Subsidiaries (N
ote 6)
Remuneration from Long-term
Investments Except Subsidiaries
(Note 10)
CEO Chou-Chye Huang
BU President Oh-Jung Ou
Vice President Steven Huang
Vice President Wen-Kuan Chen
Vice President Wayne Shen
27,183,870 27,183,870 485,448 485,448 0 0 0 0 0 0 330.03% 35.64% 58,979 58,979 No
Name of Presidents and Vice Presidents
Remuneration to Management Sunplus (Note 7)
Consolidated Subsidiaries of Sunplus (D) (Note 8)
Under NT$2,000,000 NT$2,000,000~NT$5,000,000 Steven Huang, Wen-Kuan Chen, Wayne Shen Steven Huang, Wen-Kuan Chen, Wayne Shen NT$5,000,000~NT$10,000,000 Chou-Chye Huang, Oh-Jung Ou, Chou-Chye Huang, Oh-Jung Ou, ※The information regarding to those who hold positions equal to a president or vice president shall be disclosed. ※The remuneration disclosed here shall not be used for taxation purpose because those are calculated on a different basis.
Note 1: Names of presidents and vice presidents shall be disclosed separately, and the remuneration shall be disclosed in total amount. If a director concurrently serves as a president or vice president, his/her remuneration shall be disclosed accordingly in this table and table (A). Note 2: It indicates the remuneration to presidents and vice presidents, including salary, allowance, pension, and severance pay) in the most recent fiscal year. Note 3: It indicates the bonuses, rewards, transportation fees, social activity fees, dormitories, cars, and etc., to presidents and vice presidents. If the Company provides a house, car/other transportation, or other allowances to presidents and vice presidents, the relevant payments, calculated at actual cost or fair value, shall be disclosed. The remuneration paid to the company drivers shall be disclosed but not included in the remuneration to directors. Note 4: It indicates the employee bonuses (including cash and stock) paid to presidents and vice presidents according to the proposal of profit distribution submitted by BOD to shareholders’ meeting for approval in the most recent fiscal year. If there is no such proposal yet, the stock bonus may be calculated according to the stock bonus last year. The amount of stock bonus for public companies shall be calculated at fair value, which means the closing price on the balance sheet date. For private companies, the amount of stock bonus shall be calculated based on the net value on the last day in the fiscal year when the profit distributed. The term “Net Income” indicates the net income in the most recent fiscal year. Note 5: It indicates the employee stock options (excluding those has been executed) offered to the presidents and vice presidents. The relevant information shall be disclosed in this table and table 15. Note 6: The total amount remuneration paid to the Company’s presidents and vice presidents by all the companies in the consolidated financial statements (including Sunplus) shall be disclosed. Note 7: It indicates the numbers of presidents and vice presidents classified by the amount of their remuneration paid by Sunplus. If the Company is willing to disclose the names of presidents and vice presidents in each classification, the title of column shall be changed to “Names of Presidents and Vice Presidents”. Note 8: It indicates the numbers of presidents and vice presidents classified by the amount of their remuneration paid by all the companies in the consolidated financial statements (including Sunplus). If the Company is willing to disclose the names of presidents and vice presidents in each classification, the title of column shall be changed to “Presidents and Vice Presidents”. Note 9: It indicates the net income in the most recent fiscal year. Note 10: a. Whether the Company’s presidents and vice presidents receive remuneration from other long-term investments except subsidiaries shall be disclosed as “Yes” or “No”. b. If “Yes”, the amount of remuneration paid by other long-term investments except subsidiaries may be disclosed voluntarily and included into column D; also, the title of the column shall be changed to “All the Long-term Investments”. c. The remuneration indicated here means the salaries, allowances, bonuses, and other relevant rewards paid to presidents and vice presidents who concurrently hold posts in other long-term investments except subsidiaries.
(D) Employee Bonus Granted to Management Team There is no profit sharing bonus in 2008.
3.2.6 Analysis for remuneration paid by all the companies in the consolidated financial statements (including Sunplus) to directors, supervisors, presidents and vice presidents as %
net income in the most recent two years. Also, the relevant policy, standards and procedures, and the relation between remuneration and performance shall be stated. The total amount of remuneration paid by all the companies in the consolidated financial statements (including Sunplus) to directors, supervisors, presidents, and vice presidents is very small dilution of net income. The amount of remuneration is determined by referring to other companies within the same business and the Company Article. The Board Meeting has decided not distribute the dividends, remuneration and bonus to employee in 2008 due to the economic crisis. The remuneration is fare to piers and based on the operation performance of company and individuals.
14
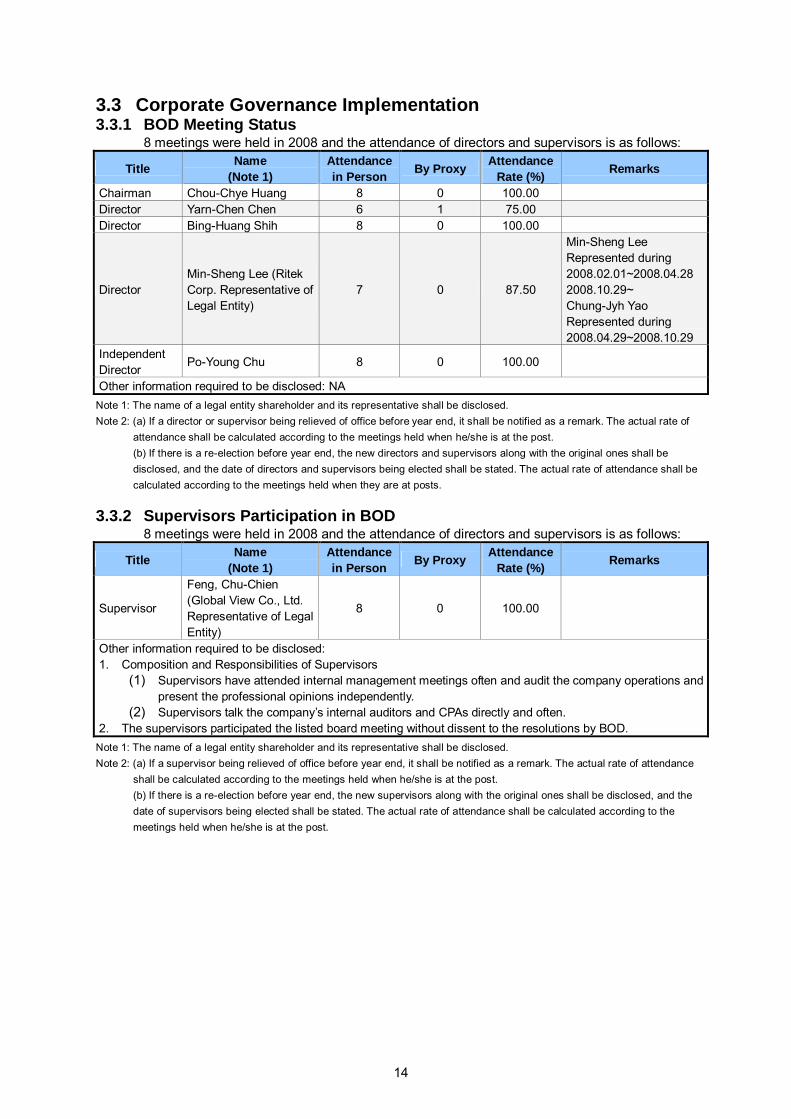
3.3 Corporate Governance Implementation 3.3.1 BOD Meeting Status
8 meetings were held in 2008 and the attendance of directors and supervisors is as follows:
Title Name (Note 1)
Attendance in Person By Proxy Attendance
Rate (%) Remarks
Chairman Chou-Chye Huang 8 0 100.00 Director Yarn-Chen Chen 6 1 75.00 Director Bing-Huang Shih 8 0 100.00
Director Min-Sheng Lee (Ritek Corp. Representative of Legal Entity)
7 0 87.50
Min-Sheng Lee Represented during 2008.02.01~2008.04.28 2008.10.29~ Chung-Jyh Yao Represented during 2008.04.29~2008.10.29
Independent Director Po-Young Chu 8 0 100.00
Other information required to be disclosed: NA Note 1: The name of a legal entity shareholder and its representative shall be disclosed. Note 2: (a) If a director or supervisor being relieved of office before year end, it shall be notified as a remark. The actual rate of
attendance shall be calculated according to the meetings held when he/she is at the post. (b) If there is a re-election before year end, the new directors and supervisors along with the original ones shall be disclosed, and the date of directors and supervisors being elected shall be stated. The actual rate of attendance shall be calculated according to the meetings held when they are at posts.
3.3.2 Supervisors Participation in BOD
8 meetings were held in 2008 and the attendance of directors and supervisors is as follows:
Title Name (Note 1)
Attendance in Person By Proxy Attendance
Rate (%) Remarks
Supervisor
Feng, Chu-Chien (Global View Co., Ltd. Representative of Legal Entity)
8 0 100.00
Other information required to be disclosed: 1. Composition and Responsibilities of Supervisors
(1) Supervisors have attended internal management meetings often and audit the company operations and present the professional opinions independently.
(2) Supervisors talk the company’s internal auditors and CPAs directly and often. 2. The supervisors participated the listed board meeting without dissent to the resolutions by BOD.
Note 1: The name of a legal entity shareholder and its representative shall be disclosed. Note 2: (a) If a supervisor being relieved of office before year end, it shall be notified as a remark. The actual rate of attendance
shall be calculated according to the meetings held when he/she is at the post. (b) If there is a re-election before year end, the new supervisors along with the original ones shall be disclosed, and the date of supervisors being elected shall be stated. The actual rate of attendance shall be calculated according to the meetings held when he/she is at the post.

15
3.3.3 Corporate Governance Implementation as Required by Taiwan Financial Supervisory Commission Item Implementation Status Reason of Non-Implementation
1. Shareholding Structure & Shareholders’ Rights (1) The way handling shareholders’ suggestions or
disputes (2) The Company’s possession of major shareholders
list and the list of ultimate owners of these major shareholders
(3) Risk management mechanism and fire wall between the Company and its affiliates
(1) Sunplus has designated specialists to handle shareholders’ suggestions or disputes.
(2) The information regarding major shareholders, directors, supervisors, and other important matters which might cause changes in holding, is disclosed periodically so that the Company could know well about major shareholders and the ultimate owners of them.
(3) Sunplus has set relevant guidelines to manage risks concerning dealings and contact with affiliates.
Not Applicable
2. Composition and Responsibilities of the BOD (1) Independent directors (2) Regular evaluation of external auditors’
independency
(1) Sunplus has one independent director. (2) Auditors’ independence is evaluated at the end of every
year and the engagement of auditors would be submitted to BOD for approval.
Not Applicable
3. Communication channel with Stakeholders Sunplus maintains good relations with banks, suppliers, and other relevant parties. Sunplus, with a principle of honesty, provides sufficient information about the Company’s operations and defends the Company’s lawful rights and interests.
4. Information Disclosure (1) Establishment of corporate website to disclose
information regarding the Company’s financials, business, and corporate governance status
(2) Other information disclosure channels (ex. English website, appointing responsible people to handle information collection and disclosure, appointing spokesman, webcasting investors conference)
Sunplus has established corporate website, managed by relevant departments, to disclose and collect information. Also, Sunplus announces financial results and corporate governance status, and releases company news after investor conferences quarterly.
Not Applicable
5. Operations of the Company’s Nomination Committee, Compensation Committee, or Other Committees of BOD
Not established yet There is no need to establish such committees because the Company’s directors and supervisors are absolutely capable and our internal system is clear.
6. If the Company has established corporate governance policies based on TSE “Corporate Governance Best Practice Principles”, please describe discrepancy between the policies and their implementation. Sunplus does not establish other principles of corporate governance; all of our rules and procedures are based on laws and regulations stipulated by authorities in charge, and amended every year in response to inner/outer changes.
7. Other important information to facilitate better understanding of the Company’s corporate governance (such as human rights, employee rights, employee

16
Item Implementation Status Reason of Non-Implementation wellness, community participation, social contribution, community service, investor relations, supplier relations, shareholders’ rights, customer relations, the implementation of risk management policies and risk evaluation measures, the implementation of consumers/customers protection policies, and purchasing insurance for directors and supervisors. ): None
8. If the Company has a self corporate governance evaluation or has authorized any other professional organization to conduct such evaluation, the evaluation results, major deficiency or suggestion, and improvement are stated as follows: None
3.3.4 Please describe the Company’s policy and implementation of social responsibilities (such as environment
protection, community participation, contribution to community, social service, charity, consumer rights, human rights and other social responsibilities): The Company takes corporate image seriously and realizes it could be destroyed in one day. Sunplus also take our long-term operation, employee wellness, shareholders’ rights and interests as our most essential responsibilities. The Company will keep doing our best to be dutiful for our social responsibilities.
3.3.5 Other Corporate Governance Policies
None 3.3.6 Other Matters Needed to Improve the Company’s Implementation of Corporate Governance
None
17
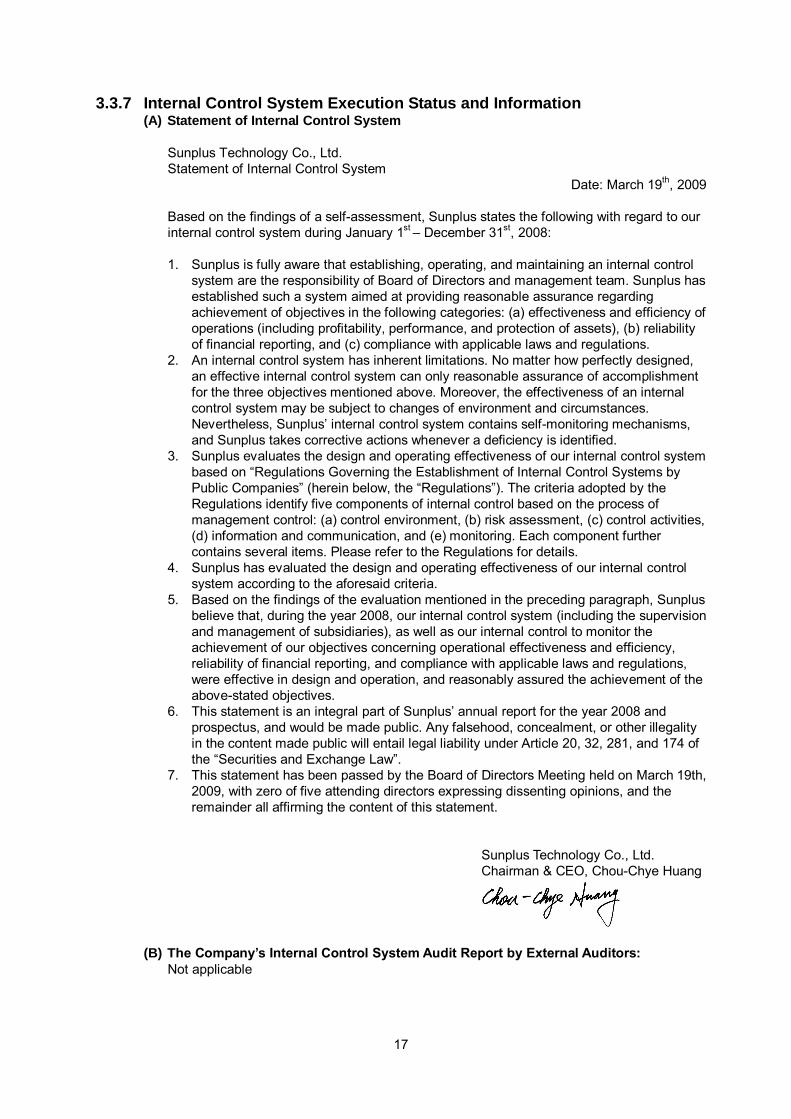
3.3.7 Internal Control System Execution Status and Information (A) Statement of Internal Control System
Sunplus Technology Co., Ltd. Statement of Internal Control System
Date: March 19th, 2009 Based on the findings of a self-assessment, Sunplus states the following with regard to our internal control system during January 1st – December 31st, 2008: 1. Sunplus is fully aware that establishing, operating, and maintaining an internal control
system are the responsibility of Board of Directors and management team. Sunplus has established such a system aimed at providing reasonable assurance regarding achievement of objectives in the following categories: (a) effectiveness and efficiency of operations (including profitability, performance, and protection of assets), (b) reliability of financial reporting, and (c) compliance with applicable laws and regulations.
2. An internal control system has inherent limitations. No matter how perfectly designed, an effective internal control system can only reasonable assurance of accomplishment for the three objectives mentioned above. Moreover, the effectiveness of an internal control system may be subject to changes of environment and circumstances. Nevertheless, Sunplus’ internal control system contains self-monitoring mechanisms, and Sunplus takes corrective actions whenever a deficiency is identified.
3. Sunplus evaluates the design and operating effectiveness of our internal control system based on “Regulations Governing the Establishment of Internal Control Systems by Public Companies” (herein below, the “Regulations”). The criteria adopted by the Regulations identify five components of internal control based on the process of management control: (a) control environment, (b) risk assessment, (c) control activities, (d) information and communication, and (e) monitoring. Each component further contains several items. Please refer to the Regulations for details.
4. Sunplus has evaluated the design and operating effectiveness of our internal control system according to the aforesaid criteria.
5. Based on the findings of the evaluation mentioned in the preceding paragraph, Sunplus believe that, during the year 2008, our internal control system (including the supervision and management of subsidiaries), as well as our internal control to monitor the achievement of our objectives concerning operational effectiveness and efficiency, reliability of financial reporting, and compliance with applicable laws and regulations, were effective in design and operation, and reasonably assured the achievement of the above-stated objectives.
6. This statement is an integral part of Sunplus’ annual report for the year 2008 and prospectus, and would be made public. Any falsehood, concealment, or other illegality in the content made public will entail legal liability under Article 20, 32, 281, and 174 of the “Securities and Exchange Law”.
7. This statement has been passed by the Board of Directors Meeting held on March 19th, 2009, with zero of five attending directors expressing dissenting opinions, and the remainder all affirming the content of this statement.
Sunplus Technology Co., Ltd. Chairman & CEO, Chou-Chye Huang
(B) The Company’s Internal Control System Audit Report by External Auditors: Not applicable

18
3.3.8 Regulatory Authorities’ Legal Penalties to the Company, and the Company’s Resulting Punishment on Its Employees: None
3.3.9 Major Resolutions by the Shareholders’ Meetings and the Board of
Directors Meetings Date Decision Maker Case Result
2008.07.29 Board Meeting 1. To accept 2008 1H financial
statements 2. To decide the ex-dividend date
Approved as proposed without dissent.
2008.08.15 Board Meeting
1. To accept 2008 1H consolidated financial statements.
2. To adjust the distribution rate of stock and cash dividends from 2007 profit distribution.
Approved as proposed without dissent.
1. To accept 3Q2008 financial statements
2. To accept 3Q2008 consolidated financial statements
Approved as proposed without dissent.
2008.10.29 Board Meeting
3. To acquire stake of Sunplus mMedia Inc. as long-term investment
Except Chairman Chou-Chye Huang and director Bin-Huang Shih gave up voting due to conflict of interests, the other directors approved as proposed without dissent.
2009.02.10 Board Meeting 1. To discuss the date and agenda of
2009 shareholders’ meeting 2. To discuss the treasury stock write-off
Approved as proposed without dissent
2009.02.20 Board Meeting 1. To discuss the spin-off of Sunplus mMobile inc.
Approved as proposed without dissent
2009.03.19 Board Meeting
1. To accept 2008 financial statements. 2. To accept 2008 consolidated financial
statements. 3. To revise the agenda of 2008
shareholders’ meeting 4. To discuss profits distribution of 2008
Approved as proposed without dissent.
3.3.10 Content of Directors’ or Shareholders’ Dissent View on Record or in
Writing Regarding Resolutions approved by BOD Meeting: None 3.3.11 Information Regarding the Relief and Resignation of Personnel
Responsible for Preparing Financial Reports
3.4 Audit Fees: Not Applicable

19
3.5 Replacement of Auditors 3.5.1 Ex-auditors
Date discharged 2008.March.31 Reason Internal transference by the audit firm, Deloitte & Touche Any different opinions than an unqualified opinion in recent 2 years
An qualified opinion in 20081H and 20071H for the un-audited long-term investment’ P&L
Any different opinions against issuer None Remarks Not Applicable
3.5.2 Current Auditors
Audit Firm Deloitte & Touche Name of Auditor Shu-Chieh Huang, Hung-Peng Lin Date of Appointment 2008.March.31 Any different opinions against ex-auditors
None
3.6 Chairman, Presidents, and Managers in Charge of Finance and
Accounting Who Held a Position in Sunplus’ Independent Audit Firm or Its Affiliates during 2007: None

20
3.7 Net Change in Shareholding and Net Changes in Shares Pledged by Directors, Supervisors, Management, and Shareholders with 10% Shareholding or More
3.7.1 Net Change in Shareholding and Net Changes in Shares Pledged by
Directors, Supervisors, Management, and Shareholders with 10% Shareholding or More
Unit: Shares
2008 Ended of March 2nd, 2009
Title Name Shareholding Change
Shares Pledged
Shareholding Change
Shares Pledged
Chairman Chou-Chye Huang 4,414,723 20,271,221 0 0 Director Bing Huang Shih 117,645 0 0 0 Director Yarn–Chen Chen 904,875 0 0 0 Director Ritek Corp. 138,244 0 0 0 Director Po-Young Chu 82 0 0 0 Supervisor Global View Co., Ltd. (897,146) (1,502,222) 0 0 BU President Oh-Jung Ou (180,016) 0 (230,000) 0 VP Steven Huang 142,513 0 0 0 VP Wen-Kuan Chen 145,094 0 (120,000) 0 VP Wayne Shen (10,989) 0 0 0 Finance & Accounting Director Piper Hung 50,000 0 0 0
3.7.2 Stock Trade
Name (Note 1)
Tranfer Reason
Transaction Date
Name of Counter
Party Nature of Relationship Amount of
Shares Transaction
Price
- - - - - - - 3.7.3 Shares Pledge with Related Parties
Name (Note1)
Reason of Pledge
(Note2)
Date of Change
Name of Counter
Party
Nature of Relationship
Amount of Shares
Percentage of Shareholding
Percentage of Shares
Pledge
Transaction Price
- - - - - - - - -

21
3.8 Top 10 Shareholders & Related Parties Defined in Article 6 of Taiwan GAAP
Current shareholding Shareholding under Spouse & Minor
Shareholding under others’ name Relationship with related-parties
Name Amount of Shares Holding % Amount of
Shares Holding % Amount of Shares Holding % Name Relationship
Chou-Chye Huang 92,737,817 15.54 919,873 0.15 - - - - Yarn–Chen Chen 19,008,245 3.18 2,962,755 0.50 - - - - China Trust Bank in custody for Sunplus employee shareholding trust
13,056,347 2.19 - - - - - -
De-Zhong Liu 13,045,795 2.19 2,006,943 0.34 - - - - Global View Co., Ltd. 10,038,049 1.68 - - - - Bin-Huang Shih Board Director of Global View Chu-Chien Feng (representative of Global View) - - - - - -
Chih-Hao King 9,378,660 1.57 - - - - - Wen-Qin Lee 7,362,756 1.23 - - - - - Bing Huang Shih 6,315,505 1.06 1,696,085 0.28 - - Global View Board Director Chartered Bank in custody for West-Europe Germany Bank special account of social rescue activities
4,575,963 0.77 - - - - - -
Lin-Shih Investment 3,559,996 0.60 - - - - - -

22
3.9 Long-term Investment Ownership 2008.12.31; Unit: thousand shares, %
Sunplus Investment Shareholding of Director,
Supervisor, Management or Subsidiary
Synthetic Shareholding Long-term Investments(Note)
Amount of Shares Holding % Amount of
Shares Holding% Amount of Shares Holding %
Giantplus Technology 84,652 21 12,377 3 97,029 24 Orise Technology 72,090 55 865 1 72,955 56 Generalplus Technology 27,942 41 15,573 23 43,515 64 Global View Technology 13,568 11 500 0 14,068 11 Goldkey Technology 1,702 12 1,866 13 3,56 25 Waveplus Technology 1,302 41 914 28 2,216 69 Sunext Technology 78,995 79 15,925 16 94,920 95 Sunplus mMedia Inc. 64,500 78 12,876 16 77,376 94 Ritek Corp. 5,000 0 3,915 0 8,915 0 Sunplus Core Technology 8,898 57 4,000 26 12,898 83 Sunplus Innovation Technology 22,660 84 452 2 23,112 86 Sunplus mMobile Inc. 120,000 91 3,797 3 123,797 94
Note: Except companies listed above, all other long-term investments are held by the parent company.

23
IV. Capital & Shares 4.1 Capitalization
2009.03.02 Authorized capital Issued capital Remark
Month/Year Price (NT$)
Shares (Thousand
shares)
Amount (NT$M)
Shares (Thousand
Shares)
Amount (NT$M) Funding (NT$K) Funding
except cash Note
08/1990 10 2,300 23 620 6.2 Cash Offering 6,200 None Not IPO yet 08/1990 10 2,300 23 1,150 11.5 Cash Offering 5,300 None Not IPO yet 03/1992 10 2,300 23 2,300 23 Cash Offering 11,500 None Not IPO yet
12/1993 10 6,000 60 6,000 60 Cash Offering 20,900 Capitalization of Profits 16,100 None Not IPO yet
09/1994 10 19,800 198 19,800 198 Cash Offering 60,000 Capitalization of Profits 78,000 None Not IPO yet
06/1995 10 39,600 396 39,600 396 Capitalization of Profits 198,000 None 06/28/1995 SFC No. 37335 06/1996 10 64,360 643.6 64,360 643.6 Capitalization of Profits 247,600 None 06/26/1996 SFC No. 40155 06/1997 10 105,500 1,055 105,500 1,055 Capitalization of Profits 411,400 None 06/10/1997 SFC No.46641 06/1998 10 184,000 1,840 184,000 1,840 Capitalization of Profits 785,000 None 06/ 08/1998 SFC No.49408 06/1999 10 269,120 2,691.2 269,120 2,691.2 Capitalization of Profits 851,200 None 06/23/1999 SFC No.57760 06/2000 10 600,000 6,000 370,000 3,700 Capitalization of Profits 1,008,800 None 06/03/2000 SFC No.48003 09/2000 10 600,000 6,000 390,000 3,900 Cash Offering for GDR 200,000 None 09/18/2000 SFC No 72620 06/2001 10 700,000 7,000 534,000 5,340 Capitalization of Profits 1,440,000 None 06/27/2001 SFC No 40791 12/2001 10 700,000 7,000 544,742 5,447 Merger from Grandtech 10,742 None 12/12/2001 SFC No 173137
06/2002 10 1,000,000 10,000 694,950 6,949,5 Capitalization of Profits 957,334 And Capital Surplus 544,742 None 05/30/2002 SFC No.129546
07/2003 10 1,000,000 10,000 777,504 7,775.0 Capitalization of Profits 130,590 And Capital Surplus 694,950 None 05/22/2003 SFC No.0920122560
06/2004 10 1,000,000 10,000 875,254 8,752.5 Capitalization of Profits 355,500 And Capital Surplus 622,004 None 06/15/2004 SFC No.0930126644
07/2005 10 1,050,000 10,500 945,570 9,455.7 Capitalization of Profits 487,576 And Capital Surplus 175,051 Employee Stock Option 40,529
None 07/11/2005 FSC No. 0940127940 TSE No.09400288741
11/2005 10 1,050,000 10,500 948,147 9,481.5 Employee Stock Option 25,772 None TSE No.09400340711 03/2006 10 1,050,000 10,500 948,730 9,487.3 Employee Stock Option 5,825 None TSE No.09500052761 06/2006 10 1,050,000 10,500 949,784 9,497.8 Employee Stock Option 10,547 None TSE No.09500116511

24
Authorized capital Issued capital Remark
Month/Year Price (NT$)
Shares (Thousand
shares)
Amount (NT$M)
Shares (Thousand
Shares)
Amount (NT$M) Funding (NT$K) Funding
except cash Note
06/2006 10 1,200,000 12,000 1,021,358 10,213.6 Capitalization of Profits 508,844 And Capital Surplus 189,230 Employee Stock Option 17,660
None FSC No.0950126238
11/2006 10 1,200,000 12,000 1,022,777 10,227.8 Employee Stock Option 14,195 None TSE No.0950030505
01/2007 10 1,200,000 12,000 512,212 5,122.1 Capital Reduction 5,114,358 Employee Stock Option 8,703 None FSC No.0950159014
03/2007 10 1,200,000 12,000 512,954 5,129.5 Employee Stock Option 7,418 None TSE No.0960005441
09/2007 10 1,200,000 12,000 554,240 5,542.4 Capitalization of Profits 288,622 And Capital Surplus 102,415 Employee Stock Option 21,825
None FSC No.0960038299
11/2007 10 1,200,000 12,000 556,051 5,560.5 Employee Stock Option 18,115 None TSE No.0960037136 03/2008 10 1,200,000 12,000 556,750 5,567.5 Employee Stock Option 6,990 None TSE No.09700075761 05/2008 10 1,200,000 12,000 556,893 5,568.9 Employee Stock Option 1,427 None TSE No.09700142371
09/2008 10 1,200,000 12,000 598,203 5,982.0 Capitalization of Profits 301,637 And Capital Surplus 111,092 Employee Stock Option 368
None FSC No.0970036239
02/2009 10 1,200,000 12,000 596,910 5,969.0 Treasury Stock write-off 12,929 None TSE No.0980003591
2009.03.02 Unit: Shares Authorized Capital Shares
Type Issued Shares Un-issued Shares Total Remark
Common share 596,909,919 603,090,081 1,200,000,000
Shelf Registration Shares Expected to Issue Issued Shares Type
Total Shares Amount Amount Price Objective and Expected Benefit of Issued Shares
Expected time of Un-issued Shares
Remark
- - - - - - - -
25
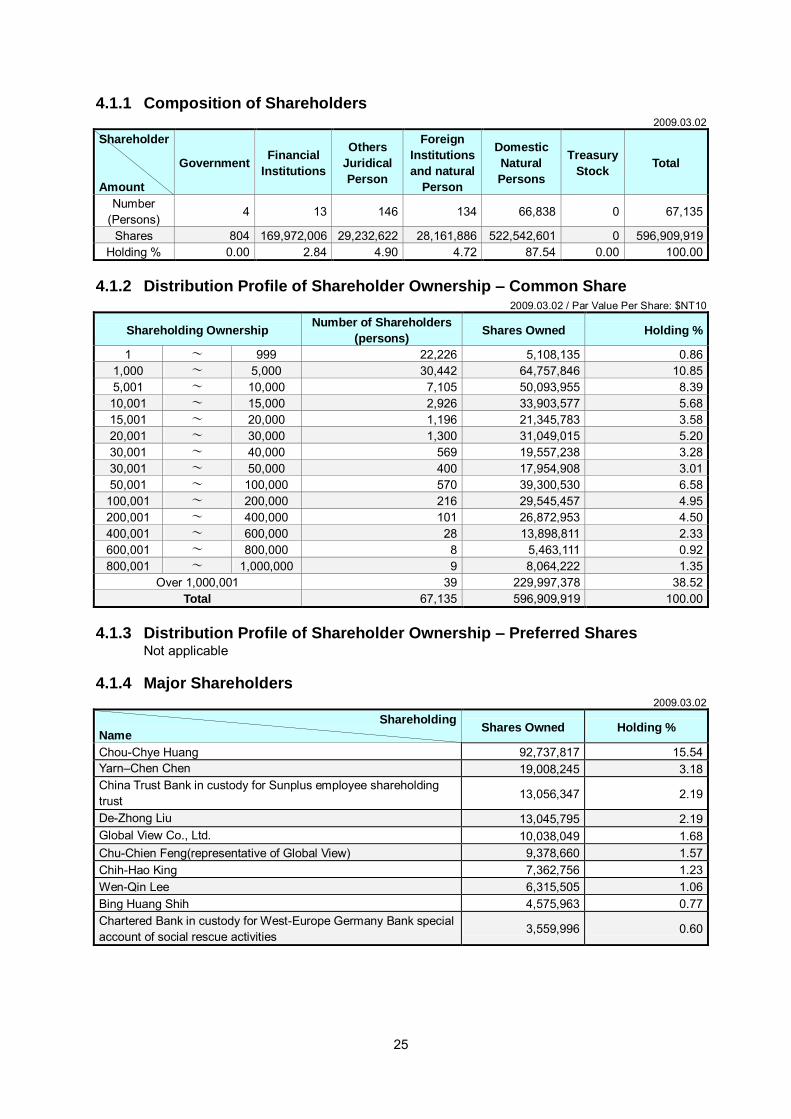
4.1.1 Composition of Shareholders 2009.03.02
Shareholder
Amount
Government Financial Institutions
Others Juridical Person
Foreign Institutions and natural
Person
Domestic Natural Persons
Treasury Stock Total
Number (Persons) 4 13 146 134 66,838 0 67,135
Shares 804 169,972,006 29,232,622 28,161,886 522,542,601 0 596,909,919 Holding % 0.00 2.84 4.90 4.72 87.54 0.00 100.00
4.1.2 Distribution Profile of Shareholder Ownership – Common Share
2009.03.02 / Par Value Per Share: $NT10
Shareholding Ownership Number of Shareholders (persons) Shares Owned Holding %
1 ~ 999 22,226 5,108,135 0.86 1,000 ~ 5,000 30,442 64,757,846 10.85 5,001 ~ 10,000 7,105 50,093,955 8.39 10,001 ~ 15,000 2,926 33,903,577 5.68 15,001 ~ 20,000 1,196 21,345,783 3.58 20,001 ~ 30,000 1,300 31,049,015 5.20 30,001 ~ 40,000 569 19,557,238 3.28 30,001 ~ 50,000 400 17,954,908 3.01 50,001 ~ 100,000 570 39,300,530 6.58
100,001 ~ 200,000 216 29,545,457 4.95 200,001 ~ 400,000 101 26,872,953 4.50 400,001 ~ 600,000 28 13,898,811 2.33 600,001 ~ 800,000 8 5,463,111 0.92 800,001 ~ 1,000,000 9 8,064,222 1.35
Over 1,000,001 39 229,997,378 38.52 Total 67,135 596,909,919 100.00
4.1.3 Distribution Profile of Shareholder Ownership – Preferred Shares
Not applicable 4.1.4 Major Shareholders
2009.03.02 Shareholding
Name Shares Owned Holding %
Chou-Chye Huang 92,737,817 15.54 Yarn–Chen Chen 19,008,245 3.18 China Trust Bank in custody for Sunplus employee shareholding trust 13,056,347 2.19
De-Zhong Liu 13,045,795 2.19 Global View Co., Ltd. 10,038,049 1.68 Chu-Chien Feng(representative of Global View) 9,378,660 1.57 Chih-Hao King 7,362,756 1.23 Wen-Qin Lee 6,315,505 1.06 Bing Huang Shih 4,575,963 0.77 Chartered Bank in custody for West-Europe Germany Bank special account of social rescue activities 3,559,996 0.60

26
4.1.5 Net Worth, Earnings, Dividends, and Market Price Per Share Year
Item 2007 2008
Highest 109.00 50.50 Lowest 35.40 9.91 Market Price Average 62.03 28.43 Before Distribution 23.14 18.31 Net Worth After Distribution 20.58 Note 1 Weighted Average Shares 584,195,128 593,326,431
Before Adjustment 3.53 0.01 Earnings Per Share Earnings Per
Share(Note 2) After Adjustment 3.28 Note 1
Cash Dividends 2.992 Note 1 From Retained Earnings 0.2999 Note 1
Stock Dividends From Capital Surplus 0.1999 Note 1
Dividends Per Share
Accumulated Undistributed Dividends - Note 1 Price/Earnings Ratio (Note 3) 17.57 2,843.00 Price/Dividend Ratio (Note 4) 24.82 Note 1 Return on Investment Cash Dividends Yield Rate (Note 5) 4% Note 1
Note 1: Pending shareholders’ approval Note 2: Retroactively adjusted for stock dividends and stock bonus to employees Note 3: price/Earnings ratio=average market price/earnings per share Note 4: price/dividends ratio=Average market price/cash dividends per share Note 5: cash dividends yield rate=cash dividend per share/average market price per share 4.1.6 Dividend Policy
(A) Dividend policy in the “Article of Incorporation” Our dividend policy is made according to regulations set forth in the “Company Law” and the “Article of Incorporation”. The dividends can be in the form of cash or stock, which depends on the status of company’s capital, financial structure, operational needs, retained earnings and industrial environment. The dividend policy for this year will follow the aforementioned rules and maintain the policy of cash dividend with stock dividend, while cash part shall not be less than 10% of the total dividend.
(B) Stock dividends: The Board Meeting proposed not to distribute the profits of 2008
(C) Expected Variation: None 4.1.7 Impact to Profits and EPS Resulting from Dividend Distribution
Due to no official financial guidance for 2008, there is no related information to disclose. 4.1.8 Profits Distributed as Employee Bonus and Directors and Supervisors’
Compensation (A) Regulations Concerning Bonus to Employees, Directors, and Supervisors in the
“Article of Incorporation” The Company’s “Articles of Incorporation” provides that Company appropriates earnings every year as follows: (1) legal reserve equivalent to 10% of the net income of the latest completed year less any accumulated deficit in prior years except the amount of legal reserve are over the capital, and (2) special reserve equivalent to the debit balance of any accounts shown in the shareholders' equity section of the balance sheet, other than the deficit. In addition, any distribution of the remaining earnings, will be made as follow: (i) up to 6% of the par value of the outstanding capital stock will first be paid/distributed as dividends,

27
(ii) 1.5% and at least 1% of the remaining distributable earnings after (i) is distributed as remuneration to directors and supervisors and as bonus to employees, respectively. The balance of the current year net income after all the foregoing appropriations and distributions plus the accumulated balance of the un-appropriated prior years’ earnings may be distributed as additional dividend. It is the Company’s policy that cash dividends shall be at least 10% of total dividends paid/distributed. Stock dividend will be distributed in lieu of cash dividends when the minimum cash dividend distributable is less than NT$0.5 per share. A special reserve equivalent to the debit balance of any account shown in the shareholder equity section of the balance sheets, other than the deficit, is made from retained earnings pursuant to existing regulations promulgated by the ROC Securities and Futures Commission (SFC). The special reserve is adjusted accordingly based on the balance of such accounts at year-end.
(B) BOD Proposal to Distribute 2007 Profits as Bonus to Employees, Directors, and Supervisors The Board Meeting proposed not to distribute the profits of 2008
(C) Bonus to Employees, Directors, and Supervisors Last Year Approval by shareholders’ meeting at June 30th, 2008, the distribution of 2007 profits as bonus to employees, directors, and supervisors is as follows:
Amount (NT$K) Bonus to Employees in Stock $135,000 Bonus to Employees in Cash 15,000 Bonus to Directors& Supervisors in Cash 23,090 Total $173,090 The distribution is the same as the proposal submitted by BOD meeting on April 29th, 2008.
4.1.9 Buyback Program: None 4.2 Issuance of Corporate Bonds: None 4.3 Preferred Shares: None

28
4.4 Issuance of GDR 2008.12.31
Issuing Date
Item
March 16, 2001
Issuing Date March 16, 2001 Issuance & Listing London Stock Exchange Listed Total Amount US$191,400,000 Offering Price per Unit US$9.57 Issued Units 14,715,305.5
Underlying Securities Offering 20,000,000 new shares of common stock of par value NT$10
Common Shares Represented 28,599,953 Common Shares Rights and Obligations of GDR holders Same as those of common share holders Trustee NA Depositary Bank The Bank of New York Custodian Bank International Commercial Bank of China GDRs Outstanding 457,246 units
Apportionment of the expenses for the issuance and maintenance
All fees and expenses related to issuance of GDRs were borne to the selling shareholders and Sunplus, while the maintenance expenses such as annual listing fees, information disclosure fees and other expenses were borne by Sunplus
Terms and Conditions in the Deposit Agreement and Custody Agreement -
Highest US$2.84 Lowest US$0.62 Closing price per GDRs 2008 Average US$1.77
29
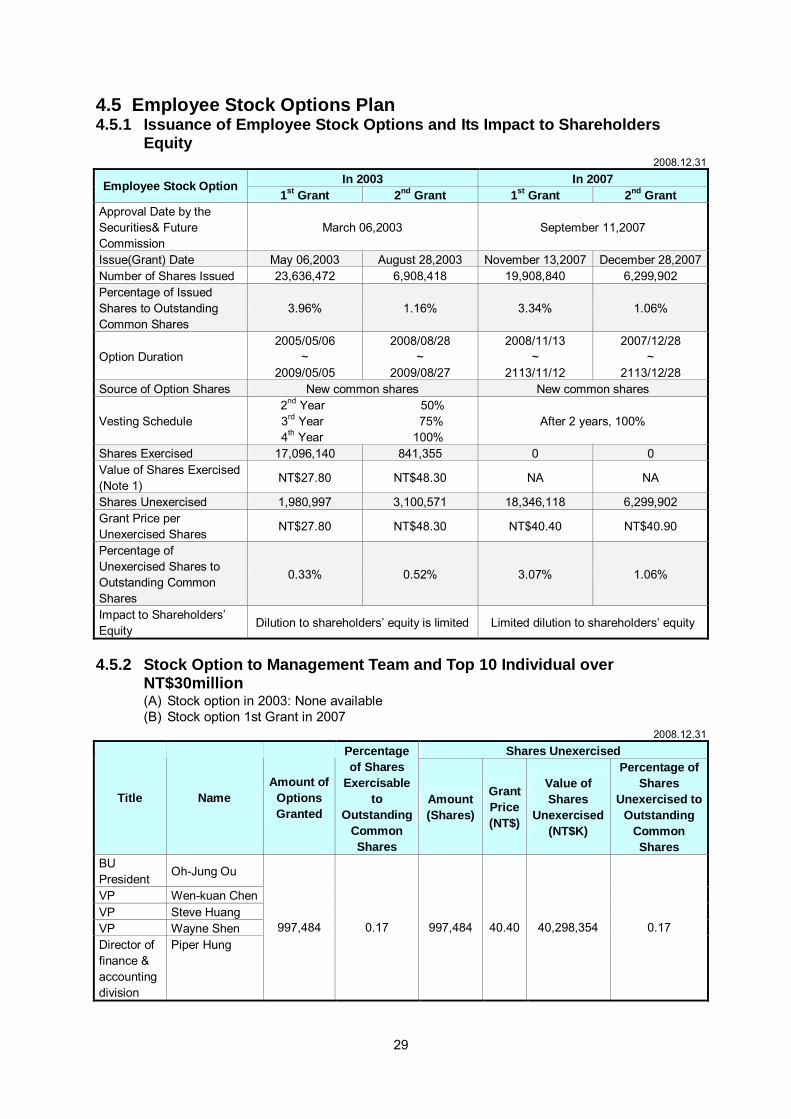
4.5 Employee Stock Options Plan 4.5.1 Issuance of Employee Stock Options and Its Impact to Shareholders
Equity 2008.12.31
In 2003 In 2007 Employee Stock Option 1st Grant 2nd Grant 1st Grant 2nd Grant
Approval Date by the Securities& Future Commission
March 06,2003 September 11,2007
Issue(Grant) Date May 06,2003 August 28,2003 November 13,2007 December 28,2007 Number of Shares Issued 23,636,472 6,908,418 19,908,840 6,299,902 Percentage of Issued Shares to Outstanding Common Shares
3.96% 1.16% 3.34% 1.06%
Option Duration 2005/05/06
~ 2009/05/05
2008/08/28 ~
2009/08/27
2008/11/13 ~
2113/11/12
2007/12/28 ~
2113/12/28 Source of Option Shares New common shares New common shares
Vesting Schedule 2nd Year 50% 3rd Year 75% 4th Year 100%
After 2 years, 100%
Shares Exercised 17,096,140 841,355 0 0 Value of Shares Exercised (Note 1) NT$27.80 NT$48.30 NA NA
Shares Unexercised 1,980,997 3,100,571 18,346,118 6,299,902 Grant Price per Unexercised Shares NT$27.80 NT$48.30 NT$40.40 NT$40.90
Percentage of Unexercised Shares to Outstanding Common Shares
0.33% 0.52% 3.07% 1.06%
Impact to Shareholders’ Equity Dilution to shareholders’ equity is limited Limited dilution to shareholders’ equity
4.5.2 Stock Option to Management Team and Top 10 Individual over
NT$30million (A) Stock option in 2003: None available (B) Stock option 1st Grant in 2007
2008.12.31 Shares Unexercised
Title Name Amount of
Options Granted
Percentage of Shares
Exercisable to
Outstanding Common Shares
Amount (Shares)
Grant Price (NT$)
Value of Shares
Unexercised (NT$K)
Percentage of Shares
Unexercised to Outstanding
Common Shares
BU President Oh-Jung Ou
VP Wen-kuan Chen VP Steve Huang VP Wayne Shen Director of finance & accounting division
Piper Hung 997,484 0.17 997,484 40.40 40,298,354 0.17

30
(C) Stock option 2nd Grant in 2007 2008.12.31
Shares Unexercised
Title Name Amount of
Options Granted
Percentage of Shares
Exercisable to
Outstanding Common Shares
Amount (Shares)
Grant Price (NT$)
Value of Shares
Unexercised (NT$K)
Percentage of Shares
Unexercised to Outstanding
Common Shares
BU President Oh-Jung Ou
VP Wen-kuan Chen VP Steve Huang VP Wayne Shen Director of finance & accounting division
Piper Hung 377,994 0.06 377,994 40.90 15,459,955 0.06
4.5.3 Mergers and Acquisitions: Not applicable V. Financial Plan & Implementation
Not Applicable

31
VI. Business Highlight 6.1 Business Activities 6.1.1 Business Scope
(A) Major Business 1. CC01080 Manufacturing of electronic component 2. I501010 Product Designing 3. F401010 International Trading 4. I301010 Software Design Services 5. I301020 Data Processing Services 6. ICs R&D, Manufacture, Test, Sale 7. ICs module R&D, Manufacture, Test, Sale 8. Application software R&D, Sale 9. IPs R&D, Sale 10. Trading Business and Agency Business of ICs
(B) Product Segments and Sales Amount
Sales of 2008 Product Categories Amount (NT$K) Percentage (%)
Multimedia IC 5,272,661 87 Others 820,518 13 Total 6,093,179 100
(C) Product Lines
1. Multimedia IC: IC solutions for multimedia home applications, such as DVD/VCD, LCD TV, Digital TV, pocket TV, and set-top-box.
2. Others: Including ASIC and intellectual properties.
(D) New Products 1. Highly-integrated digital TV solution 2. HDMI DVD player IC 3. Blue-ray Disc player IC 4. Portable and Car DVD IC 5. Set-top-box 6. DTV IC solutions 7. Pocket TV IC 8. Digital photo frame IC 9. GPS IC
6.1.2 Industry Overview
(A) Supply Chain In the product development flow, Sunplus focuses on IC design, system design, wafer testing and sales services but out-sources most of the manufacturing including mask making, wafer fabrication, wafer sawing, packaging and final testing. The infrastructure of semiconductor industry in Taiwan is very efficient; we have foundries like TSMC, UMC, etc., and backend assembly and testing houses such ASE, SPIL and KYEC. Since those factories are located in Hsinchu Science Park or nearby, the “Cluster” effect could enable high production efficiency. Our products are shipped to end customers through distributors, so the major customers of Sunplus are distributors. The end customers’ manufactories are located in Taiwan, HK and Mainland China, and the end products after assembly are sold to North America and Europe, or other emerging countries per different applications.
(B) Market Trend and Competition
1. Multimedia IC: Our multimedia ICs are based on DSP and RISC hardware technologies. By collocating with different image processing and voice processing algorithm, these technologies can process complicated mathematic operations, which can be applied to

32
applications like DVD/VCD、set-top-box, LCD TV, digital TV, and etc. At present, our main competitors are Zoran, Trident, Mediatek, ALi, Morning-Star, ALi and Novatek.
2. Others: Sunplus also provides ASICs and IP products. 6.1.3 Technology and Development
(A) R&D expenditure in 2006 and 2007 NT$K
Year Item 2008
Expense 1,532,685 Percentage to Revenue 25%
(B) R&D Accomplishment
1. DTMB set-up-box IC solutions 2. MPEG2 decoding and servo control technology for DVD player SoC 3. MPEG4 decoding technology for DSC, DVD player 4. HDMI DVD IC 5. JPEG decoding for Digital photo frame 6. DVB-Terrestrial technology for set-top-box and pocket TV 7. TV codec technology for video player, TV game consoles, LCD TV, and digital TV
(C) Business Plan
Sunplus has been focused on consumer IC design since start-up. After the re-grouping in 2006, our main product lines are multimedia home IC solutions and IPs development. The coming analog switch-off to digital broadcasting will boost the demand for digital TV, LCD TV, and set-top-box, which could be the next cash cow to Sunplus. In the future, with the concept of “digital home” becoming the ideal and desired life style, the home entertainment IC market will be very potential and highly growing in the following years. Sunplus will keep developing cutting-edge technologies and target for the world’s leading multimedia SoC provider.
6.2 Market and Sales Status 6.2.1 Market Analysis
(A) Market Analysis by Region 2007 Sales Area
Amount (NT$K) Percentage (%) Hong Kong 8,012,713 86,96 Taiwan 407,117 4.42 Others 794,229 8.62 Total 9,214,059 100.00
(B) Market Share
According to the statistics provided by Taiwan Semiconductor Industry Association, the revenue of Taiwan IC design companies reached NT$399.7 billion, and Sunplus took around 2.3% market share with 2007 revenue of NT$9,214 million.
(C) Demand, Supply, and Growth
Multimedia IC: The product applications of our multimedia ICs include DVD/VCD player, DVB-T STB, LCD TV, and etc. The demand for multimedia home products keeps growing due to “digital home” life style getting popular. Especially, the European and North American countries have scheduled to switch off the analogy broadcasting channels. The analog switch-off to digital broadcasting trigger the demands of set-up-box and digital TV. In the coming few years, the large panel and high definition digital TV will be the main stream in the market. In addition to the developed countries like North America and Europe, developing countries like China and India are also very potential markets.
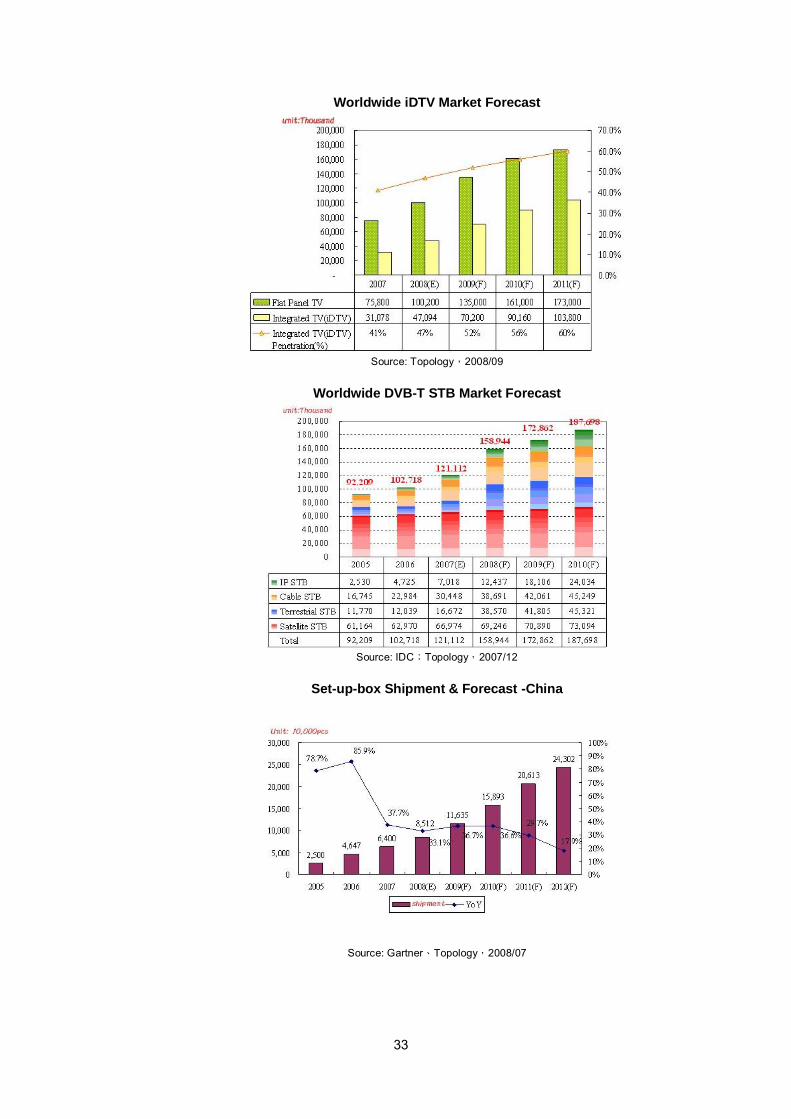
33
Worldwide iDTV Market Forecast
Source: Topology,2008/09
Worldwide DVB-T STB Market Forecast
Source: IDC;Topology,2007/12
Set-up-box Shipment & Forecast -China
Source: Gartner、Topology,2008/07

34
DVD Recorder Shipment & Forecast
BD Player/Recorder/PS3 Shipment& Forecast (Unit: million Pcs)
0
5
10
15
20
25BD player PS3 Recorder
BD player 0.3 2 5 11.3 22.5
PS3 1.84 9.38 12 15 15.25
Recorder 0 0.3 1.4 2.4 3.6
2006 2007 2008(E) 2009(F) 2010(F)
Source: Topology,2008/07
(D) Competition and Long-term Business Strategy
1. Competition Analysis (a) Accumulation and impartation of the experience of the R&D team
Eight engineers established Sunplus in 1990. They are the center of Sunplus management team. Each of them has accumulated almost twenty years of experience in new product development, technology management, and marketing. The invaluable experience has been deliberately passed on to the next generation of engineers. This continuity in the conveyance of experience has resulted in fewer complaints from customers and more rapid professional growth in our new employees. Consequently, the labor turn over rate remains relatively low compared to other IC design houses. End of February 28th, 2009, Sunplus has totaled 312 patents in Taiwan, 190 patents in P.R.C., 157 patents in U.S.A.
(b) Focus on high-level consumer IC market, enlarge the distance from competitors Since the IC market is extremely competitive and stagnation is an ever-present trap, we keep on bringing in a large number of R&D resources to develop new high-level consumer products and widening the distance between us and other competitors. Sunplus’ numerous product lines give us a tremendous advantage over our competitors. We are the kind of customer that prized by most wafer foundries because our wafer demand does not fluctuate when a few products are eliminated. Due to our steady stream orders to our wafer suppliers, we enjoy more

35
consistent wafer supply during peak seasons over our competitors. This also allows us to keep our wafer costs at a competitive rate.
(c) Strategic cooperation with upper stream and down stream factories In recent years, Sunplus has increased cooperation between our upper stream and down stream factories. We believe that this new strategic and more dynamic cooperation relationship will bring positive contributions to our production and marketing in the long term.
(d) Maintain long-term and stable cooperative relationship with customers Consumer electronic products rely on IC to raise their added-on value; consequently the manufacturers and brand-names choose their IC suppliers with extreme caution by evaluating their product specification, features, delivery term, yield rate, and sales service. IC design houses have to work in coordination with customers to build up long-term relationship and facilitate the cooperation. Sunplus is always devoted itself to cutting-edge technology development and have accumulated IC design expertise. We also adopted distributors as expanding sales channels to reach more customers with strongly support and best service. Till today, we have sustained a strong relationship with a lot of end-product manufacturers worldwide.
2. Advantages
(a) Sunplus offers high value-added products to enable customer to win the market. (b) The revolution of semiconductor process technology accelerates the popularity of
consumer electronic products. (c) The growing demand for SoC complicates IC product development and raises the
entry barrier, which benefits IC design companies with rich resources like Sunplus. (d) Sunplus has strong IC design capability to meet customers’ requirements for time to
market and costs reduction. (e) Sunplus has built up long-term relationship with wafer foundries due to our steady
demand for wafers, and therefore we can get stable supply and lower prices from wafer foundries.
3. Disadvantages
(a) The consumer cut off budget because of the global economic crisis and bearish economics.
(b) Product life cycles are becoming shorter and shorter. (c) SoC design and integration of features and functions, which developing products
costs are a lot more than before, has become the trend of IC design. (d) The competition is getting fiercer since IC design industry enjoys high profits.
4. Business Strategy
(a) Developing new and high value-added products. (b) Process migration to make per wafer productivity higher and drive cost down. (c) Expanding strategic partnership with clients to create win-win situation. (d) Collaboration with partners to broaden IP licensing sources.

36
6.2.2 Product Applications and Development Flow (A) Product Applications
Multimedia IC: IC solutions for DVD/VCD player, LCD TV, digital TV, set-top-box, and other multimedia home applications. Others: ASICs and IP products.
(B) IC Development Flow
Product Spec.Product Spec.
IC Design& Layout
IC Design& Layout
System Design& Coding
System Design& Coding
Tape OutTape Out
Mask Making
Wafer Foundry
WaferC.P. Testing
WaferC.P. Testing
Packaging
Final Testing
After SalesService
After SalesService
Product Spec.Product Spec.
IC Design& Layout
IC Design& Layout
System Design& Coding
System Design& Coding
Tape OutTape Out
Mask Making
Wafer Foundry
WaferC.P. Testing
WaferC.P. Testing
Packaging
Final Testing
After SalesService
After SalesService
In the product development flow, Sunplus focuses on IC design, system design, wafer testing and sales services but out-sources most aspects of the manufacturing including mask making, wafer fabrication, wafer sawing, packaging, and final testing.
6.2.3 Major Suppliers
The major materials are wafers. Sunplus’ main foundry contractors are local or overseas wafer manufacturers, such as TSMC. Wafer supplements are sufficient and stable.
6.2.4 Major Customers and Suppliers in the Recent Two Years
(A) Major Customers NT$K
2007 2008 Customer Sales Amount % of Total Sales Customer Sales Amount % of Total Sales
A 3,071,671 33 A 1,672,714 27 B 2,308,230 25 B 1,417,376 23
(B) Major Supplier
NT$K 2007 2008
Supplier Purchasing Value
% of Total Purchasing Supplier Purchasing
Value % of Total
Purchasing A 2,439,671 78 A 1,629,147 65 B 527,781 17 B 840,009 33
6.2.5 Production
Unit: Thousand Pcs, NT$K Year
Product 2007 2008
Major Products Capacity Output Value Capacity Output Value Multimedia IC - 106,049 5,147,505 - 102,086 4,573,992 Others - 1,912 108,568 - 343 24,309
Total - 107,961 5,256,073 - 102,429 4,598,301 Note: Sunplus out-sourced production to wafer foundries, so there is no capacity limitation.

37
6.2.6 Sales Unit: Thousand Pcs; NT$K
2007 2008 Local Export Local Export
Year
Product Quantity Sales Quantity Sales Quantity Sales Quantity Sales Multimedia IC 1,840 183,129 101,917 7,926,405 4,629 583,374 79,067 4,689,287 Others 322 223,988 1,019 880,537 361 297,973 696 522,545
Total 2,172 407,117 102,936 8,806,942 4,990 881,347 79,763 5,211,832 6.3 Personnel Structure
Year 2007 2008 R&D 397 396 Production 80 75 Administration 110 105
Workforce Structure by Job Function
Total 587 576 Average Age 32.8 33.1 Average Years Served 4.1 4.3
Ph.D. 2.2% 2.8% Master 62.8% 64.9% Bachelor 23.3% 22.6% Other Higher Education 7.7% 6.7% High School 4.0% 3.0%
Workforce Structure by Education Degree
Total 100.0% 100.0% 6.4 Environmental Protection & Expenditures 6.4.1 Environmental Protection
Sunplus does not violate any EPA regulation regarding pollutants and environmental protection. Sunplus is working hard for environmental sustainability and ISO-14001 and IECQ080000 certified.
6.4.2 Working Environment
(A) Allocate sole-duty organization and employees to execute the matters concerning to environment security and sanitation management according to Laws.
(B) Examine the working environment regularly to maintain the security of environment and equipments.
(C) Review the working environment and set up related devices with a standard higher than regulation.
(D) Hold the physical examination for new employees and the regular health examination for employees on the job with higher perception than laws.
6.5 Employees 6.5.1 Employee Welfare
We strive to provide a clean and supportive environment for our employees. We established an Employee Welfare Committee to operate welfare activities including emergency aid, educational grants, book purchase subsidies, social club activities and overseas trips. We also comply with the Labor Standards Law to conduct labor insurance and retirement system programs, and participation with the National Health Insurance plan according to the National Health Insurance Act. Moreover, we also handle group insurance and insurance for family dependants to ensure security for our employees. In 1996 we adopted a new system, which allowed our employees to be awarded with company stock.

38
6.5.2 Pension Plan Sunplus has a pension plan for all regular employees, which provides benefits according to the Labor Standard Law. The Company makes monthly contributions, equal to 2% of salaries, to the pension fund, which is administered by a pension fund monitoring committee. The contributions are deposited in the committee’s name in the Central Trust of China. Since July 1, 2005, employees who choose Labor Pension Act Implementation Rules of the Labor Pension, the Company makes monthly contributions, equal to 6% of salaries to the personal pension fund of Bureau of Labor Insurance.
6.5.3 Other Affairs
Sunplus have smooth commutation channels with employees. Employees could address their opinions to management team directly. All operations are base on the Labor Standard Law. Sunplus’ labor relations are outstanding. We are proud to say that there has not been a single loss resulting from a labor dispute since the establishment of the company.
6.5.4 Training
The Company provides 205 person-times of external professional training courses & 67coures for internal training. (Skipped the list of course)
6.5.5 Loss from Controversy between Labor and Management
None 6.6 Important Contracts
Contract Counter Party Term Content Restriction
Lease of Land Hsinchu Science Park Administration
1995/8/01- 2021/12/31 Lease of Land self-use
IP Licensing Silicon Image Inc. 2007/2/02~ Licensing DTV IPs to Silicon image (license fee US$48m in total) NA

39
VII. Financial Statements 7.1 Condensed Financial Statement and Auditors’ Opinions 7.1.1 Condensed Balance Sheet
NT$K Year
Item 2004 2005 2006 2007 2008
Current Assets 10,854,116 12,545,989 10,317,882 4,315,996 2,837,092 Long-term Investment 3,812,212 4,647,317 7,044,292 8,189,460 7,445,768 Fixed Assets 1,480,297 1,561,258 1,307,777 940,134 836,326 Intangible Assets 1,122,172 1,044,784 1,044,058 841,899 551,787 Other Assets 837,852 572,650 751,258 1,380,877 1,260,233 Total Assets 18,106,649 20,371,998 20,425,267 15,668,366 12,931,206
Before Distribution 2,337,695 3,749,300 2,587,433 2,472,048 1,731,341 Current Liabilities After Distribution 4,137,208 5,691,112 4,690,418 3,898,782 (Note3) Long-term Liabilities 0 0 0 0 0 Other Liabilities 504,820 633,679 453,761 313,195 249,443
Before Distribution 2,842,515 4,382,979 3,041,194 2,785,243 1,980,784 Total Liabilities After Distribution 4,642,028 6,324,791 5,14,179 4,211,977 (Note3) Capital Stock 8,752,544 9,487,296 10,236,476 5,567,505 5,982,028 Capital Surplus 1,604,261 1,520,461 1,366,696 1,553,917 1,587,558
Before Distribution 5,341,422 5,452,688 5,974,727 5,644,622 3,924,634 Retain Earnings After Distribution 3,054,333 3,002,032 3,583,120 63,135 (Note3) Unrealized Gain (Loss) on Financial Merchandise (Note 3)
0 (285,085) (34,466) 185,415 149,639
Cumulative translation adjustments (49,030) (9,775) 17,206 63,135 (561,966)
Unrealized Net Loss on the Costs of Pensions 0 0 0 0 0
Before Distribution 15,264,134 15,989,019 17,384,073 12,883,123 10,950,422 Total Equity After Distribution 13,464,621 14,047,207 15,281,088 11,456,389 (Note3)
Note1: Figures are audited for the past-5 years Note2: The statements after 2006 are followed Taiwan GAAP Article-34&35 Note3: Profits of 2007& 2008 have not been distributed yet

40
7.1.2 Condensed Income Statement NT$K
Year Item
2004 2005 2006 2007 2008
Net Sales 18,940,056 18,781,122 17,076,426 9,214,059 6,093,179 Gross Profit 5,943,206 6,120,397 5,727,373 3,912,226 2,357,964 Income from Operation 2,926,528 2,584,005 2,175,746 1,606,196 516,709 Non-operating Income (Gain) 235,259 196,783 1,216,492 1,108,159 727,781 Non-operating Expense (Loss) 528,358 403,094 272,655 417,873 1,084,466 Income From Operations of Continued Segments-Before Tax 2,633,429 2,377,694 3,119,583 2,296,482 160,024
Income From Operations of Continued Segments-After Tax 2,737,691 2,398,355 3,005,304 2,061,502 8,383
Income From Operations of Discontinued Segments 0 0 0 0 0
Extraordinary Gain (Loss) 0 0 0 0 0 Cumulative Effect of Changes in Accounting Principles 0 0 (32,609) 0 0
Net Income 2,737,691 2,398,355 2,972,695 2,061,502 8,383 EPS 3.15 2.56 2.94 3.53 0.01 Adjusted EPS 3.10 2.53 2.92 3.52 0.01 7.1.3 Auditors’ Opinions
Year CPA Audit Opinion
2004 Hung-Peng Lin Hung-Wen Huang An unqualified opinion
2005 Hung-Peng Lin Hung-Wen Huang An unqualified opinion
2006 Hung-Wen Huang Shu-Chieh Huang An unqualified opinion with expletory
2007 Hung-Wen Huang Shu-Chieh Huang An unqualified opinion
2008 Hung-Peng Lin Shu-Chieh Huang An unqualified opinion with expletory

41
7.2 Financial Analysis 7.2.1 Financial Analysis (Standalone)
Year Item 2004 2005 2006 2007 2008
Debts ratio (%) 15.70 21.51 14.89 17.78 15.32 Capital Structure Analysis Long-term fund to fixed assets (%) 1,031.15 1,007.21 1,329.28 1,370.35 1,309.35
Current ratio (%) 473.80 334.62 398.77 174.59 163.87 Quick ratio (%) 329.25 243.74 327.00 121.29 100.11
Liquidity Analysis
Times interest earned (times) 589.21 401.76 191.28 140.63 819.56 Average collection turnover (times) 6.81 5.80 6.81 6.17 6.12 Average collection days 54 63 54 59 60 Average inventory turnover (times) 5.33 4.10 5.02 4.05 3.69 Average payment turnover (times) 7.48 5.34 5.25 5.36 5.85 Average inventory turnover days 68 89 73 90 99 Fixed assets turnover (times) 12.79 11.83 13.06 9.8 7.29
Operating Performance Analysis
Total assets turnover (times) 1.05 0.92 0.84 0.59 0.47 Return on total assets (%) 15.79 12.49 14.63 11.49 0.18 Return on stockholders’ equity (%) 18.69 15.35 17.81 13.62 0.07
Operating income 33.44 27.24 21.25 28.85 8.64 % to Paid-in capital Profit before tax 30.09 25.06 30.48 41.25 2.68
Profit after tax to net sales (%) 14.45 12.77 17.41 22.37 0.14 Earnings per share (NT$) 2.93 2.56 2.94 3.53 0.01
Profitability Analysis
EPS after dilution 2.88 2.53 2.92 3.52 0.01 Cash flow ratio (%) 74.10 116.80 161.20 103.20 120.99 Cash flow adequacy ratio (%) 101.15 121.83 111.58 110.94 129.07 Cash Flow Cash flow reinvestment ratio (%) 3.57 15.84 11.87 3.58 5.81 Operating leverage 1.62 1.80 2.06 2.05 4.05 Leverage Financial leverage 1.00 1.00 1.00 1.00 1.04
Variation Analysis 1. Times interest earned, Return on total assets, Return on stockholders’ equity, EPS & EPS after dilution
decline due to less profits in 2008. 2. Turnover Fixed assets &Total assets declined due to less revenue in 2008. 3. Operating income and Profit before tax to Paid-in capital, Profit after tax to net sales declined and Operating
leverage increased due to less operating profits and more non- operating losses. 4. Cash flow reinvestment ratio increased because of less cash dividends.

42
1. Capital Structure Analysis (1) Debts ratio = Total Liabilities/Total Assets (2) Long term fund to fixed assets = (Shareholders equity + Long term Liabilities)/Net
Properties 2. Liquidity Analysis
(1) Current Ratio = Current Assets/Current Liabilities (2) Quick Ratio = (Current Assets – Inventories – Prepaid
Expenses)/Current Liabilities (3) Times Interest Earned = Earnings before Interest and Taxes/Interest
Expenses 3. Operating Performance Analysis
(1) Average Turnover Collection Turnover = Net Sales/Average Trade Receivables (2) Average Turnover Collection Days = 365/Receivables Turnover rate (3) Average Inventory Turnover = Cost of Sales/Average Inventory (4) Average Inventory Turnover Days = 365/Average Inventory Turnover (5) Average Payment Turnover = Cost of Sales/average Trade Payables (6) Fixed Assets Turnover = Net sales/Net Properties (7) Total Assets Turnover = Net Sales/Total Assets
4. Profitability Analysis
(1) Return on Total Assets = {Net Income + Interest Expense*(1-Effective tax rate)}/Average Total Assets
(2) Return Ratio on Stockholders’ Equity = Net Income/Average Stockholders’ Equity (3) Profit after Tax to Net Sales = Net Income/Net Sales (4) Earnings Per Shares = (Net Income- Preferred Stock Dividend)/
Weighted Average Number of Shares Outstanding
5. Cash Flow
(1) Cash Flow Rate = Net Cash Provided by Operating Activities/Current Liabilities
(2) Cash Flow Adequacy Ratio = Five-Year Cash from Sum of Operations /(Five-Year capital expenditure +inventory increase+ cash dividend)
(3) Cash flow reinvestment ratio = (Net operation cash Flow - cash dividend)/(Fixed Assets+ Long-term Investment+ Other assets+ working capital)
6. Leverage
(1) Operating Leverage = (Net Sales - Operating expenses & cost)/Operating Benefit
(2) Financial Leverage = Operating Benefit/(Operating benefit –Interest cost)

43
7.2.2 Financial Analysis (Consolidated) Year
Item 2005 2006 2007 2008
Debts ratio (%) 32.86 27.01 33.05 28.72 Capital Structure Analysis Long-term fund to fixed assets (%) 368.62 763.97 751.52 777.78
Current ratio (%) 243.55 287.46 194.68 217.01 Quick ratio (%) 178.37 212.95 142.86 142.5 Liquidity Analysis Times interest earned (times) 30.79 34.76 29.58 2.49 Average collection turnover (times) 6.41 5.77 5.07 5.21 Average collection days 57 64 72 70.06 Average inventory turnover (times) 5.28 4.82 3.86 3.9 Average payment turnover (times) 5.95 5.04 5.14 7.34 Average inventory turnover days 70 76 95 93.59 Fixed assets turnover (times) 6.24 12.06 10.76 10.03
Operating Performance Analysis
Total assets turnover (times) 1.01 1.11 0.96 0.92 Return on total assets (%) 11.25 12.28 9.09 0.76 Return on stockholders’ equity (%) 15.74 18.49 12.58 0.58
Operating income 29.10 24.17 26.62 -10.77 % to Paid-in capital Profit before tax 26.13 31.69 41.12 2.28 Profit after tax to net sales (%) 9.08 11.24 10.03 0.48 Earnings per share (NT$) 2.56 2.94 3.53 0.01
Profitability Analysis
Return on total assets (%) 2.53 2.92 3.52 0.01 Cash flow ratio (%) 69.30 73.20 48.90 18.07 Cash flow adequacy ratio (%) 124.25 134.33 133 125.3 Cash Flow Cash flow reinvestment ratio (%) 15.26 11.93 6.64 Note1 Operating leverage 2.10 2.48 3.39 Note2 Leverage Financial leverage 1 1 1 Note2
Variation Analysis 1. “Times interest earned” declined due to more interest expense and less income before tax 2. “Average payment turnover” increased due to less cost of good sold 3. “Total assets turnover” declined due to less revenue. 4. “Return on total assets”& “Return on stockholders’ equity” declined due to less income after tax. 5. Cash flow ratio, Cash flow adequacy ratio and Cash flow reinvestment ratio declined due to less cash flow-
in from operating activities. 6. Operating leverage and Financial leverage declined due to operating losses.
Note1: Figures not listed because cash flow in from operating activities are less than cash dividends. Note2: Figures not listed due to operating losses.

44
7.3 Supervisor’s Report
Supervisor’s Report Sunplus’ Board has submitted the 2008 business report, financial statements, and the proposal for allocation 2008 profits. The Deloitte & Touche CPA firm has audited the financial statements, and issued an audit report. I, Sunplus’ supervisor, have reviewed the 2008 business report, financial statements, and the proposal for allocation 2008 profits, and verify that they comply with the Company Law and relevant regulations. According to Article 219 of the Company Law, I hereby submit this report.
To Sunplus 2009 Annual General Shareholders’ Meeting Sunplus Technology Co., Ltd. Supervisor:
Chu-Chien Feng
(Global View Technology Co., Ltd. Representative of Legal Entity)
March 26, 2009

45
7.4 Financial Statement & Independent Auditors’ Report Financial Statements for the Years Ended December 31, 2008 and 2007 and Independent Auditors’ Report The Board of Directors and Shareholders Sunplus Technology Company Limited We have audited the accompanying balance sheets of Sunplus Technology Company Limited as of December 31, 2008 and 2007, and the related statements of income, changes in shareholders’ equity and cash flows for the years then ended. These financial statements are the responsibility of the Company’s management. Our responsibility is to express an opinion on these financial statements based on our audits. We conducted our audits in accordance with the Rules Governing the Audit of Financial Statements by Certified Public Accountants and auditing standards generally accepted in the Republic of China. Those rules and standards require that we plan and perform the audit to obtain reasonable assurance about whether the financial statements are free of material misstatement. An audit includes examining, on a test basis, evidence supporting the amounts and disclosures in the financial statements. An audit also includes assessing the accounting principles used and significant estimates made by management, as well as evaluating the overall financial statement presentation. We believe that our audits provide a reasonable basis for our opinion. In our opinion, the financial statements referred to above present fairly, in all material respects, the financial position of Sunplus Technology Company Limited as of December 31, 2008 and 2007, and the results of its operations and its cash flows for the years then ended, in conformity with the Guidelines Governing the Preparation of Financial Reports by Securities Issuers, requirements of the Business Accounting Law and Guidelines Governing Business Accounting relevant to financial accounting standards, and accounting principles generally accepted in the Republic of China. As disclosed in Note 3 to the accompanying financial statements, the Accounting Research and Development Foundation issued Interpretation 2007-052, which requires companies to recognize bonuses paid to employees, directors and supervisors as compensation expenses beginning January 1, 2008. These bonuses were previously recorded as appropriations from earnings. The Company also adopted the newly released Statement of Financial Accounting Standards No. 39, “Share-based Payment” to account for employee stock options. We have also audited the consolidated financial statements of Sunplus Technology Company Limited and subsidiaries as of and for the years ended December 31, 2008 and 2007 and have issued an unqualified opinion thereon with an explanatory paragraph in each of our reports dated February 27, 2009 and January 25, 2008, respectively. Deloitte & Touche February 27, 2009
Notice to Readers
The accompanying financial statements are intended only to present the financial position, results of operations and cash flows in accordance with accounting principles and practices generally accepted in the Republic of China and not those of any other jurisdictions. The standards, procedures and practices to audit such financial statements are those generally accepted and applied in the Republic of China . For the convenience of readers, the auditors’ report and the accompanying financial statements have been translated into English from the original Chinese version prepared and used in the Republic of China. If there is any conflict between the English version and the original Chinese version or any difference in the interpretation of the two versions, the Chinese-language auditors’ report and financial statements shall prevail.

46
SUNPLUS TECHNOLOGY COMPANY LIMITED BALANCE SHEETS DECEMBER 31, 2008 AND 2007 (In Thousands of New Taiwan Dollars, Except Par Value) 2008 2007 2008 2007 ASSETS Amount % Amount % LIABILITIES AND SHAREHOLDERS’ EQUITY Amount % Amount % CURRENT ASSETS CURRENT LIABILITIES
Cash $914,057 7 $681,285 4 Short-term loans (Note 13) $647,600 5 $500,000 3 Available-for-sale financial assets - current (Notes 2 and 8) 191,094 2 637,874 4 Accounts payable 307,210 2 954,884 6 Notes and accounts receivable, net (Notes 2, 5 and 21) 476,287 4 1,513,452 10 Income tax payable (Notes 2 and 18) 365,454 3 362,981 3 Other receivables (Note 21)
151,890 1 165,851 1 Financial liabilities at fair value through profit or loss – current
(Notes 2 and 4) - - 2,222 - Inventories, net (Notes 2 and 6) 896,749 7 1,104,001 7 Deferred royalty income - current (Notes 2, 11 and 21) 12,428 - 22,287 - Deferred income tax - current (Notes 2 and 18) 166,159 1 143,413 1 Deferred gain on intercompany transactions (Note 2) - - 736 - Other current assets 40,856 - 70,120 1 Other current liabilities (Notes 2 and 7) 398,649 3 628,938 4
Total current assets 2,837,092 22 4,315,996 28 Total current liabilities 1,731,341 13 2,472,048 16
LONG-TERM INVESTMENTS OTHER LIABILITIES
Equity-method investments (Notes 2 and 7) 7,090,528 55 7,513,385 48 Deferred income - noncurrent, net of current portion (Notes 2, 11 and 21) 37,995 - 3,223 - Financial assets at fair value through profit or loss – noncurrent Accrued pension liability (Notes 2 and 4) 162,122 1 167,676 1 (Notes 2 and 14) 60,395 1 62,949 - Available-for-sale financial assets – noncurrent (Notes 2 and 8) 157,562 1 472,843 3 Guarantee deposits 151,053 1 247,023 2 Financial assets carried at cost (Notes 2 and 9) 35,556 1 35,556 -
Total other liabilities 249,443 2 313,195 2 Total long-term investments 7,445,768 58 8,189,460 52
Total liabilities 1,980,784 15 2,785,243 18 PROPERTIES (Notes 2, 10 and 21)
Cost SHAREHOLDERS’ EQUITY (Notes 2, 15 and 16) Buildings 688,983 5 688,983 4 Capital stock - NT$10.00 par value Auxiliary equipment 184,963 2 179,140 1 Authorized - 1,200,000 thousand shares Machinery and equipment 414,508 3 378,667 2 Issued and outstanding - 598,203 thousand shares in 2008 Testing equipment 373,482 3 402,639 3 and 556,750 thousand shares in 2007 5,982,028 46 5,567,505 35 Transportation equipment 2,463 - 5,573 - Capital surplus Furniture and fixtures 123,058 1 128,706 1 Additional paid-in capital - share issuance in excess of par 710,751 5 817,768 5 Leasehold improvements 459 - 459 - Treasury stock transactions 68,645 1 60,171 1
Total cost 1,787,916 14 1,784,167 11 Merger and others 808,162 6 675,978 4 Less: Accumulated depreciation 951,590 8 844,033 5 Retained earnings
Legal reserve 2,333,642 18 2,127,492 14 Net properties 836,326 6 940,134 6 Special reserve - - 17,260 -
Unappropriated earnings 1,590,992 13 3,499,870 22 INTANGIBLE ASSETS, NET (Notes 2 and 11) 551,787 4 841,899 5 Other Cumulative translation adjustments 149,639 1 63,135 1 OTHER ASSETS Unrealized gain (loss) on financial assets (561,966) (4) 185,415 1
Assets leased to others, net (Notes 2 and 21) 251,118 2 262,360 2 Treasury stock (at cost) - 4,853 thousand shares in 2008 Deferred charges and others (Notes 2 and 12) 252,208 2 270,144 2 and 4,683 thousand shares in 2007 (131,471) (1) (131,471) (1) Deferred income tax - noncurrent (Notes 2 and 18) 756,907 6 848,373 5
Total shareholders’ equity 10,950,422 85 12,883,123 82 Total other assets 1,260,233 10 1,380,877 9
TOTAL $12,931,206 100 $15,668,366 100 TOTAL $12,931,206 100 $15,668,366 100 The accompanying notes are an integral part of the financial statements. (With Deloitte & Touche audit report dated February 27, 2009)
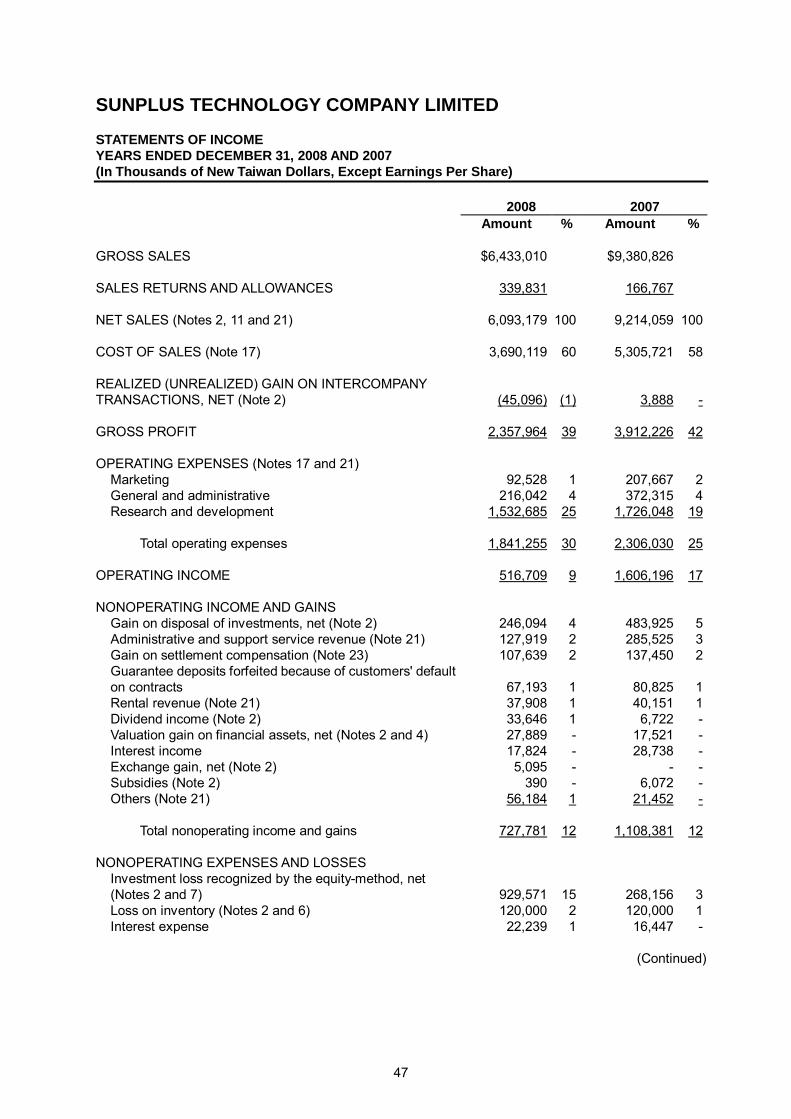
47
SUNPLUS TECHNOLOGY COMPANY LIMITED STATEMENTS OF INCOME YEARS ENDED DECEMBER 31, 2008 AND 2007 (In Thousands of New Taiwan Dollars, Except Earnings Per Share) 2008 2007 Amount % Amount % GROSS SALES $6,433,010 $9,380,826 SALES RETURNS AND ALLOWANCES 339,831 166,767 NET SALES (Notes 2, 11 and 21) 6,093,179 100 9,214,059 100 COST OF SALES (Note 17) 3,690,119 60 5,305,721 58 REALIZED (UNREALIZED) GAIN ON INTERCOMPANY TRANSACTIONS, NET (Note 2) (45,096) (1) 3,888 - GROSS PROFIT 2,357,964 39 3,912,226 42 OPERATING EXPENSES (Notes 17 and 21)
Marketing 92,528 1 207,667 2 General and administrative 216,042 4 372,315 4 Research and development 1,532,685 25 1,726,048 19
Total operating expenses 1,841,255 30 2,306,030 25
OPERATING INCOME 516,709 9 1,606,196 17 NONOPERATING INCOME AND GAINS
Gain on disposal of investments, net (Note 2) 246,094 4 483,925 5 Administrative and support service revenue (Note 21) 127,919 2 285,525 3 Gain on settlement compensation (Note 23) 107,639 2 137,450 2 Guarantee deposits forfeited because of customers' default on contracts 67,193 1 80,825 1 Rental revenue (Note 21) 37,908 1 40,151 1 Dividend income (Note 2) 33,646 1 6,722 - Valuation gain on financial assets, net (Notes 2 and 4) 27,889 - 17,521 - Interest income 17,824 - 28,738 - Exchange gain, net (Note 2) 5,095 - - - Subsidies (Note 2) 390 - 6,072 - Others (Note 21) 56,184 1 21,452 -
Total nonoperating income and gains 727,781 12 1,108,381 12
NONOPERATING EXPENSES AND LOSSES
Investment loss recognized by the equity-method, net (Notes 2 and 7) 929,571 15 268,156 3 Loss on inventory (Notes 2 and 6) 120,000 2 120,000 1 Interest expense 22,239 1 16,447 -
(Continued)

48
SUNPLUS TECHNOLOGY COMPANY LIMITED STATEMENTS OF INCOME YEARS ENDED DECEMBER 31, 2008 AND 2007 (In Thousands of New Taiwan Dollars, Except Earnings Per Share) 2008 2007 Amount % Amount %
Valuation loss on financial liabilities, net (Notes 2 and 4) $960 - $2,222 - Exchange loss, net (Note 2) - - 6,490 - Others (Note 2) 11,696 - 4,780 - Total nonoperating expenses and losses 1,084,466 18 418,095 4
INCOME BEFORE INCOME TAX 160,024 3 2,296,482 25 INCOME TAX EXPENSE (Notes 2 and 18) 151,641 3 234,980 3 NET INCOME $8,383 - $2,061,502 22 2008 2007 Before
Income Tax
After Income
Tax
Before Income
Tax
After Income
Tax EARNINGS PER SHARE (Note 19)
Basic $0.27 $0.01 $3.66 $3.28 Diluted $0.27 $0.01 $3.65 $3.27
The pro forma net income and earnings per share (EPS) on the assumption that the Company’s stock held by its subsidiary is treated as an investment instead of treasury stock are shown as follows (Note 16): 2008 2007 Before
Income Tax
After Income
Tax
Before Income
Tax
After Income
Tax NET INCOME $168,498 $16,857 $2,309,325 $2,074,345 BASIC EPS
Based on weighted-average shares Outstanding - 596,886 thousand shares in 2008 and 631,831 thousand shares in 2007 $0.28 $0.03 $3.65 $3.28
DILUTED EPS
Based on weighted-average shares Outstanding - 596,890 thousand shares in 2008 and 633,518 thousand shares in 2007 $0.28 $0.03 $3.65 $3.27
The accompanying notes are an integral part of the financial statements. (With Deloitte & Touche audit report dated February 27, 2009) (Concluded)

49
SUNPLUS TECHNOLOGY COMPANY LIMITED STATEMENTS OF CHANGES IN SHAREHOLDERS' EQUITY YEARS ENDED DECEMBER 31, 2008 AND 2007 (In Thousands of New Taiwan Dollars, Unless Stated Otherwise)
Others (Notes 2, 15 and 16)
Capital Stock Issued and
Outstanding Capital Surplus (Notes 2 15 and 16) Unrealized (Note15) Additional Retained Earnings (Note 15) Cumulative Valuation Total Shares Paid-in Capital Treasury Long-term Unappropriated Translation (Loss) Gain on Treasury Shareholders' (Thousands) Amount in Excess of Par Stock Investments Merger Total Legal Reserve Special Reserve Earnings Total Adjustments Financial Assets Stock Equity BALANCE, JANUARY 1, 2007 1,023,648 $10,236,476 $768,390 $47,328 $393,555 $157,423 $1,366,696 $1,830,223 $294,860 $3,849,644 $5,974,727 $17,206 $(34,466) $(176,566) $17,384,073
Cancellation of common shares (511,436) (5,114,357) - - - - - - - - - - 45,095 (5,069,262)
Appropriation of prior year’s earnings: Legal reserve - - - - - - - 297,269 - (297,269) - - - - - Special reserve - - - - - - - - (277,600) 277,600 - - - - - Bonus to employees - stock 13,500 135,000 - - - - - - - (135,000) (135,000 - - - - Bonus to employees - cash - - - - - - - - - (15,000) (15,000) - - - (15,000) Remuneration to directors and supervisors - - - - - - - - - (39,688) (39,688) - - - (39,688) Stock dividends - NT$0.29822 per share 15,362 153,622 - - - - - - - (153,622) (153,622) - - - - Cash dividends - NT$3.97620 per share - - - - - - - - - (2,048,297) (2,048,297) - - - (2,048,297)
Capital stock transferred from capital surplus 10,241 102,415 (102,415) - - - (102,415) - - - - - - - -
Issuance of shares upon exercise of employee stock options 5,435 54,349 151,793 - - - 151,793 - - - - - - - 206,142
Adjustment arising from changes in percentage of ownership of investees - - - - 167,595 - 167,595 - - - - - - - 167,595
Adjustment of capital surplus - others - - - - (42,595) - (42,595) - - - - - - - (42,595)
Net income in 2007 - - - - - - - - - 2,061,502 2,061,502 - - - 2,061,502
Translation adjustments on long-term investments - - - - - - - - - - - 45,929 - - 45,929
Cash dividends received by subsidiaries from the Company - - - 12,843 - - 12,843 - - - - - - - 12,843
Adjustment for changes in shareholders’ equities in equity-method investees - - - - - - - - - - - - 232,446 - 232,446
Valuation loss on available-for-sale financial assets - - - - - - - - - - - - (12,565) - (12,565)
BALANCE, DECEMBER 31, 2007 556,750 5,567,505 817,768 60,171 518,555 157,423 1,553,917 2,127,492 17,260 3,499,870 5,644,622 63,135 185,415 (131,471) 12,883,123
Appropriation of prior year’s earnings Legal reserve - - - - - - - 206,150 - (206,150) - - - - - Special reserve - - - - - - - - (17,260) 17,260 - - - - - Bonus to employees - stock 13,500 135,000 - - - - - - - (135,000) (135,000) - - - - Bonus to employees - cash - - - - - - - - - (15,000) (15,000) - - - (15,000) Remuneration to directors and supervisors - - - - - - - - - (23,090) (23,090) - - - (23,090) Stock dividends - NT$0.29990 per share 16,665 166,637 - - - - - - - (166,637) (166,637) - - - - Cash dividends - NT$2.49920 per share - - - - - - - - - (1,388,644) (1,388,644) - - - (1,388,644) Capital stock transferred from capital surplus 11,109 111,092 (111,092) - - - (111,092) - - - - - - - - Issuance of shares upon exercise of employee stock options 179 1,794 4,075 - - - 4,075 - - - - - - - 5,869 Adjustment arising from changes in percentage of ownership of investees - - - - 134,100 - 134,100 - - - - - - 134,100 Adjustment of capital surplus - others - - - (1,916) - (1,916) - - - - - - - (1,916) Net income in 2008 - - - - - - - - 8,383 8,383 - - - 8,383 Translation adjustments on long-term investments - - - - - - - - - - - 86,504 - - 86,504
Cash dividends received by subsidiaries from the Company - - - 8,474 - - 8,474 - - - - - - - 8,474
Adjustment for changes in shareholders’ equities in equity-method investees - - - - - - - - - - - - (468,807) - (468,807) Valuation loss on available-for-sale financial assets - - - - - - - - - - - - (278,574) - (278,574) BALANCE, DECEMBER 31, 2008 598,203 $5,982,028 $710,751 $68,645 $650,739 $157,423 $1,587,558 $2,333,642 $ - $1,590,992 $3,924,634 $149,639 $(561,966) $(131,471) $10,950,422 The accompanying notes are an integral part of the financial statements. (With Deloitte & Touche audit report dated February 27, 2009)

50
SUNPLUS TECHNOLOGY COMPANY LIMITED STATEMENTS OF CASH FLOWS YEARS ENDED DECEMBER 31, 2008 AND 2007 (In Thousands of New Taiwan Dollars) 2008 2007 CASH FLOWS FROM OPERATING ACTIVITIES
Net income $8,383 $ 2,061,502 Adjustments to reconcile net income to net cash provided by operating activities:
Depreciation and amortization 730,003 820,440 Gain on disposal of properties and deferred charges (167) (2,627) Valuation gain on financial instruments (24,584) (15,299) Investment loss recognized by the equity-method investees, net 929,571 268,156 Cash dividends received from equity-method investees 236,037 110,280 Gain on disposal of investments, net (246,094) (483,925) Write off of properties - 2,024 Cumulative translation adjustments of capital return by equity-method 1,262 - Realized (unrealized) gain on intercompany transactions, net 45,096 (3,888) Realized royalty income (20,919) (22,171) Deferred income tax assets 68,720 (245,116) Accrued pension liability (2,554) (6,480) Net changes in operating assets and liabilities
Held-for-trading financial instruments (2,222) - Notes and accounts receivable 1,037,165 (40,185) Other receivables 88,230 60,731 Inventories 207,252 411,704 Other current assets 29,264 64,893 Accounts payable (647,674) (334,833) Income tax payable (71,796) 262,520 Other current liabilities (270,180) (356,614)
Net cash provided by operating activities 2,094,793 2,551,112
CASH FLOWS FROM INVESTING ACTIVITIES
Proceeds of the: Disposal of financial assets at fair value through profit or loss 30,840 199,563 Disposal of equity-method investments 93,085 42,929 Disposal of available-for-sale financial assets 3,645,023 10,639,468 Disposal of financial assets carried at cost - 402,799 Disposal of properties and deferred charges 1,402 6,129 Return of capital by investee 157,101 - Return of capital on available-for-sale financial assets - 8,179 Capital reduction on financial assets carried at cost - 27,742
Acquisition of: Equity-method investments (1,126,958) (1,039,193) Available-for-sale financial assets (2,987,000) (8,035,800) Properties (80,618) (174,223)
(Continued)

51
SUNPLUS TECHNOLOGY COMPANY LIMITED STATEMENTS OF CASH FLOWS YEARS ENDED DECEMBER 31, 2008 AND 2007 (In Thousands of New Taiwan Dollars) 2008 2007
Increase in intangible assets $(53,084) $(322,658) Increase in deferred charges and others (172,577) (129,562)
Net cash provided by (used in) investing activities (492,786) 1,625,373
CASH FLOWS FROM FINANCING ACTIVITIES
Increase in short-term loans 147,600 222,943 Decrease in guarantee deposits (95,970) (114,180) Remuneration paid to directors and supervisors (38,090) (54,688) Cash dividends (1,388,644) (2,048,297) Proceeds of the exercise of stock options 5,869 206,142 Capital reduction - (5,101,466)
Net cash used in financing activities (1,369,235) (6,889,546)
NET INCREASE (DECREASE) IN CASH 232,772 (2,713,061) CASH BEGINNING OF YEAR 681,285 3,394,346 CASH END OF YEAR $914,057 $681,285 SUPPLEMENTAL CASH FLOW INFORMATION:
Income tax paid $128,468 $154,639 Interest paid $17,634 $16,447
NONCASH INVESTING AND FINANCING ACTIVITIES:
Reclassification of properties into deferred charges and others $35,157 $281,485 Reclassification of equity-method investments into other current liabilities $38,030 $103,081 Reclassification of properties into rental assets $- $66,909
PARTIAL CASH INVESTING AND FINANCING ACTIVITIES:
Acquisition of properties $82,479 $165,672 Decrease (increase) in payables for equipments purchased (1,861) 8,551 Cash paid $80,618 $174,223
The accompanying notes are an integral part of the financial statements. (With Deloitte & Touche audit report dated February 27, 2009) (Concluded)

52
SUNPLUS TECHNOLOGY COMPANY LIMITED NOTES TO FINANCIAL STATEMENTS YEARS ENDED DECEMBER 31, 2008 AND 2007 (In Thousands of New Taiwan Dollars, Unless Stated Otherwise) 1. ORGANIZATION AND OPERATIONS
Sunplus Technology Company Limited (the “Company”) was established in August 1990 and moved into the Hsinchu Science-Based Industrial Park in October 1993. It researches, develops, designs, tests, and sells high-quality, high value-added consumer integrated circuits (ICs). Its products are based on core technology in such areas as multimedia audio/video, single-chip microcontroller and digital signal processor. These technologies are used to develop hundreds of products including various ICs: Liquid crystal display, microcontroller, multimedia and application specific.
The Company’s shares have been listed on the Taiwan Stock Exchange since January 2000. Some of the Company’s shares have been issued in the form of Global Depository Receipts (GDRs), which have been listed on the London Stock Exchange since March 2001 (refer to Note 15).
As of December 31, 2008 and 2007, the Company had 576 and 587 employees, respectively.
2. SUMMARY OF SIGNIFICANT ACCOUNTING POLICIES
Basis of Presentation The accompanying financial statements have been prepared in conformity with the Guidelines Governing the Preparation of Financial Reports by Securities Issuers, the Business Accounting Law, Guidelines Governing Business Accounting and accounting principles generally accepted in the Republic of China (ROC). Under these guidelines and principles, the Company is required to make certain estimates and assumptions that could affect the amounts of allowance for doubtful accounts, allowance for sales returns and discounts, allowance for inventory devaluation, property depreciation, amortization of intangible assets, and deferred charges impairment loss on assets and pension expenses. Actual results could differ from these estimates. The Company’s significant accounting policies are summarized as follows:
Current/Noncurrent Assets and Liabilities Current assets are cash (unrestricted) and other assets primarily held for trading purposes or to be converted to cash, consumed or sold within one year from the balance sheet date. Current liabilities are those to be settled within one year from the balance sheet date and those held primarily for trading purposes. All other assets and liabilities are classified as noncurrent.
Financial Assets/Liabilities at Fair Value Through Profit or Loss Financial instruments at fair value through profit or loss have two categories: (1) held for trading and (2) designated on initial recognition as at fair value through profit or loss. These financial instruments are initially recorded at fair value with transaction costs that are directly attributable to the acquisition. When financial instruments are subsequently measured at fair value, the changes in fair value are recognized as earnings. A regular way purchase or sale of financial assets is recognized and derecognized using trade date accounting. Derivatives that do not meet the criteria for hedge accounting are treated as financial assets or liabilities held for trading. When the fair value is positive, the derivative is treated as a financial asset; when the fair value is negative, the derivative is treated as a financial liability. The fair values of those instruments without quoted market prices in an active market are based on valuation techniques incorporating estimates and assumptions that are consistent with prevailing market conditions. Hybrid instruments are designated at fair value through profit or loss.

53
Available-for-sale Financial Assets Investments designated as available-for-sale financial assets include open-end mutual funds and listed stock. Investments classified as available-for-sale financial assets are initially recognized at fair value plus transaction costs that are directly attributed to investment acquisition. When available-for-sale financial assets subsequently measured at fair value, the changes in fair value are reported as a separate component of shareholders’ equity. The accumulated gains or losses are recognized when the financial asset is derecognized from the balance sheet. A regular way purchase or sale of financial assets is recognized and derecognized using trade date accounting. The recognition, derecognition and the fair value bases of available-for-sale financial assets are similar to those of financial assets at FVTPL. Cash dividends are recognized as investment income upon resolution of the shareholders of an investee but are accounted for as reductions of the original investment cost if these dividends are declared on the earnings of the investees attributable to periods before the purchase of the investments. Stock dividends received are recorded as an increase in the number of shares held and do not affect investment income. The cost per share is recalculated on the basis of the new number of shares after the receipt of stock dividends. The fair values of open-end mutual funds are based on their net asset value at the balance sheet date; listed stock is the closing price as of the balance sheet date. If there is objective evidence that a financial asset is impaired as of the balance sheet date, a loss is recognized. If the impairment loss decreases, the impairment loss is reversed to the extent of the decrease and recorded as an adjustment to shareholders’ equity. Revenue Recognition and Allowance for Doubtful Accounts Sales are recognized when titles to products and risks of ownerships are transferred to customers, primarily upon shipment, since the earnings process is substantially completed and revenue is realized or realizable. The Company does not recognize sales upon delivery of materials to subcontractors because the ownership over the materials is not transferred. An allowance is provided for any sales returns and discounts, which are estimated on the basis of historical experience and any known factors that would affect the allowance. Such provisions are deducted from sales in the year the products are sold. Sales are determined at fair market value, taking into account related sales discounts agreed to by the Company and its customers. Since the receivables from sales are collectible within one year and sales transactions are frequent, the fair value of receivables equals to the nominal amount of cash to be received. An allowance for doubtful accounts is provided on the basis of a review of the collectibility of accounts receivable. The Company assesses the probability of collections of accounts receivable by examining the aging analysis of the outstanding receivables and assessing the value of the collateral provided by customers. Inventories Inventories consist of raw materials, work-in-process, finished goods and merchandise, which are stated at the lower of cost or market value. Inventories are recorded at standard costs and adjusted to approximate weighted-average cost at the end of the period. Market value is based on the replacement cost of raw materials and net realizable value of work-in-process, finished goods and merchandise. Scrap and slow-moving items are recognized as allowance for losses. Financial Assets Carried at Cost Investments without quoted market prices in an active market and whose fair value cannot be reliably measured, such as nonpublicly traded stocks, are carried at their original cost. The accounting treatment for cash and stock dividends arising from financial assets carried at cost is the same as that for available-for-sale financial assets.

54
If there is objective evidence of financial asset impairment, a loss is recognized. This impairment loss is irreversible. Equity-method Investments Investments in share of stock of companies in which the Company owns at least 20% of the outstanding voting shares or exercises significant influence on their operating and financial policy decisions are accounted for by the equity method. Pursuant to the revised Statement of Financial Accounting Standards, the cost of an investment shall be analyzed and the cost of investment in excess of the fair value of identifiable net assets acquired, representing goodwill, shall not be amortized and instead shall be tested for impairment annually. If the recognized carrying value of the investment plus any advances to the investee are reduced to zero, the Company will discontinue recognizing its investment loss. But if the Company (a) guarantees the investee’s obligations of an investee or commits to provide financial support to an investee or (b) if the investee’s losses are temporary and evidence sufficiently shows imminent return to profitability, the Company will continue to recognize its investment loss. This credit balance on the carrying value of a long-term investment and advances are credited to other current liabilities in the balance sheets. On the balance sheet date, the Company evaluates investments for any impairment. An impairment loss is recognized and charged to current income if the investment carrying amount as of the balance sheet date exceeds the expected recoverable amount. For those investees over which the Company has significant influence, the assessment of impairment is based on carrying value. For those investees over which the Company holds a controlling interest, the assessment of impairment is based on an estimation of the value in use of the cash-generating units of the consolidated investees. Cash dividends are recognized on the ex-dividend date, which are treated as a reduction of investment cost. Stock dividends are not recognized as an increase in investment but are recorded as an increase in the number of shares. If an investee issues additional shares and the Company subscribes for these shares at a percentage different from its current equity, the resulting increase is credited to capital surplus. If a decrease results, the decrease is debited to capital surplus. But if capital surplus is not enough for debiting purposes, the decrease is debited to unappropriated retained earnings. Profits from downstream transactions with an equity-method investee are eliminated in proportion to the Company’s percentage of ownership in the investee; however, if the Company has control over the investee, all the profits are eliminated. Profits from upstream transactions with an equity-method investee are eliminated in proportion to the Company’s percentage of weighted-average ownership in the investee. For those investees over which the Company holds a controlling interest, gains or losses on sales between equity method investees are deferred in proportion to the Company’s percentage of weighted-average ownership in the investee. For those investees over which the Company does not hold a controlling interest, gains or losses on sales between equity method investees are deferred in proportion of the Company’s percentage of multiplication of weighted-average ownership in the investees. All of these deferred gains and losses are realized upon resale of products to third parties. Properties and Rental Assets Properties and rental assets are stated at cost less accumulated depreciation. Major additions, renewals and betterments are capitalized, while maintenance and repairs are expensed in the period incurred. On the balance sheet date, the Company evaluates properties and rental assets for any impairment. If impairment is identified, the Company will determine the recoverable amount of the assets. The carrying amount in excess of the expected recoverable amount is recognized as impairment loss and charged to current income. If the recoverable amount increases, the subsequent reversal of

55
impairment loss will be recognized as gain. However, the increased carrying amount of an asset due to a reversal of impairment loss should not exceed the carrying amount that would have been determined (net of depreciation) had no impairment loss been recognized for the assets in prior years. Depreciation is computed using the straight-line method over service lives initially estimated as follows: buildings - 7 to 55 years; auxiliary equipment - 3 to 10 years; machinery and equipment - 4 to 5 years; testing equipment - 2 to 4 years; transportation equipment - 4 to 6 years; furniture and fixtures - 2 to 11 years; leasehold improvements - 3 years; and rental assets - 7 to 55 years. Properties and rental assets still in use beyond their initially estimated service lives are depreciated over their newly estimated service lives. Upon the sale or disposal of properties and rental assets, the related cost and accumulated depreciation are removed from the accounts, and any gain or loss is credited or charged to current income. Intangible Assets Intangible assets consist of technology license fees and patents, which are booked at the acquisition cost and amortized using the straight-line method over 1 to 15 years and 5 to 18 years, respectively. Pursuant to the statement of Financial Accounting Standards No. 37 “Intangible Assets” Expenditures arising from research activities and those related to development activities that do not meet the criteria for capitalization are charged to expense when incurred. On the balance sheet date, the Company evaluates intangible assets for any impairment. If impairment is identified, the Company will evaluate the recoverable amount of such assets. The carrying amount in excess of the expected recoverable amount is recognized as impairment loss and charged to current income. If the recoverable amount increases in the future, the subsequent reversal of impairment loss will be recognized as a gain. However, the increased carrying amount of an asset due to a reversal of impairment loss should not exceed the carrying amount that would have been determined (net of amortization), had no impairment loss been recognized for the asset in prior years. Deferred Charges Deferred charges are mainly costs of software and system design, which are booked at the installation or acquisition cost. The amounts are amortized over 1 to 5 years, using the straight-line method. Please refer to the accounting policy on intangible assets for the accounting for impairment of deferred charges. Government Subsidies Amounts received by the Company from the government for the sponsorship of the development of certain products are recognized as subsidy income when realized or as deferred income when unrealized. Pension Costs The Company has two types of pension plans: Defined benefit and defined contribution. Under the defined benefit pension plans, the related net periodic pension costs are recorded on the basis of actuarial calculations. For employees under the defined contribution pension plans, the related net periodic pension costs are recorded on the basis of the Corporation’s required monthly contributions to employees’ personal pension accounts over the employees’ service periods. Stock-based Compensation Employee stock options granted on or after January 1, 2008 are accounted for under Statement of Financial Accounting Standards (“Statement” or SFAS) No. 39 - “Share-based Payment.” Under the statement, the value of the stock options granted, which is equal to the best available estimate of the number of stock options expected to vest multiplied by the grant-date fair value, is expensed on a

56
straight-line basis over the vesting period, with a corresponding adjustment to capital surplus - employee stock options. The estimate is revised if subsequent information indicates that the number of stock options expected to vest differs from previous estimates. Employee stock options granted between January 1, 2004 and December 31, 2007 were accounted for under the interpretations issued by the Accounting Research and Development Foundation (ARDF). The Company adopted the intrinsic value method, under which compensation cost was recognized on a straight-line basis over the vesting period. The Company did not grant or revise stock options for 2008. Treasury Stock The reacquisition of issued stock is accounted for by the cost method. Under this method, the reacquisition cost is debited to the treasury stock account. Treasury stock is shown as a deduction to arrive at shareholders’ equity. The Company accounts for its stock held by its subsidiaries as treasury stock. The recorded cost of these treasury stocks is based on the carrying value of the investments as shown in the subsidiaries’ book. The resulting gain on investment from cash dividends appropriated to subsidiaries is credited to capital surplus. When the treasury shares are retired, the capital stock and paid-in capital based on the existing equity are debited. If the treasury shares are retired at a price lower than its par value and the Company paid-in capital, the deficiency is credited to paid-in capital from treasury stock. If the treasury shares are retired at a price in excess of its par value and paid-in capital, the excess is debited to paid-in capital from treasury stock. If the balance in paid-in capital from treasury stock is insufficient to absorb the deficiency, the remainder is recorded as a reduction of retained earnings. Income Tax The Company applies the intra-period and inter-period tax allocations method. Under these methods, deferred income taxes are recognized for the tax effects of deductible temporary differences and unused tax credits. A valuation allowance is recognized if it is more likely than not that some portion or all of the deferred tax asset will not be realized. A deferred tax asset or liability is classified as current or noncurrent according to the classification of the related asset or liability. If a deferred tax asset or liability cannot be related to an asset or liability in the financial statements, it is classified as current or noncurrent based on the basis of the expected realization date. Tax credits for certain purchases of machinery, equipment and technology, research and development expenditures and personnel training are recognized in the current period. Adjustments of prior years’ tax liabilities are added to or deducted from the current year’s tax expense. Income tax (10%) on unappropriated earnings generated annually since 1998 is recorded as expense in the year when the shareholders approve the retention of earnings. The Company adopt consolidation income tax filing with Sunplus mMobile Inc. and Sunplus Innovation Technology Inc. The income taxes payable differences between consolidated and the sum of individual are adjusted in the Company’s account receivable or account payable. Foreign-currency Transactions Nonderivative foreign-currency transactions are recorded in New Taiwan dollars at the rates of exchange in effect when the transactions occur. Exchange differences arising from settlement of foreign-currency assets and liabilities are recognized in profit or loss. At the balance sheet date, foreign-currency monetary assets and liabilities are revalued using prevailing exchange rates and the exchange differences are recognized in profit or loss. At the balance sheet date, foreign-currency nonmonetary assets (such as equity instruments) and liabilities that are measured at fair value are revalued using prevailing exchange rates, with the exchange differences treated as follows:
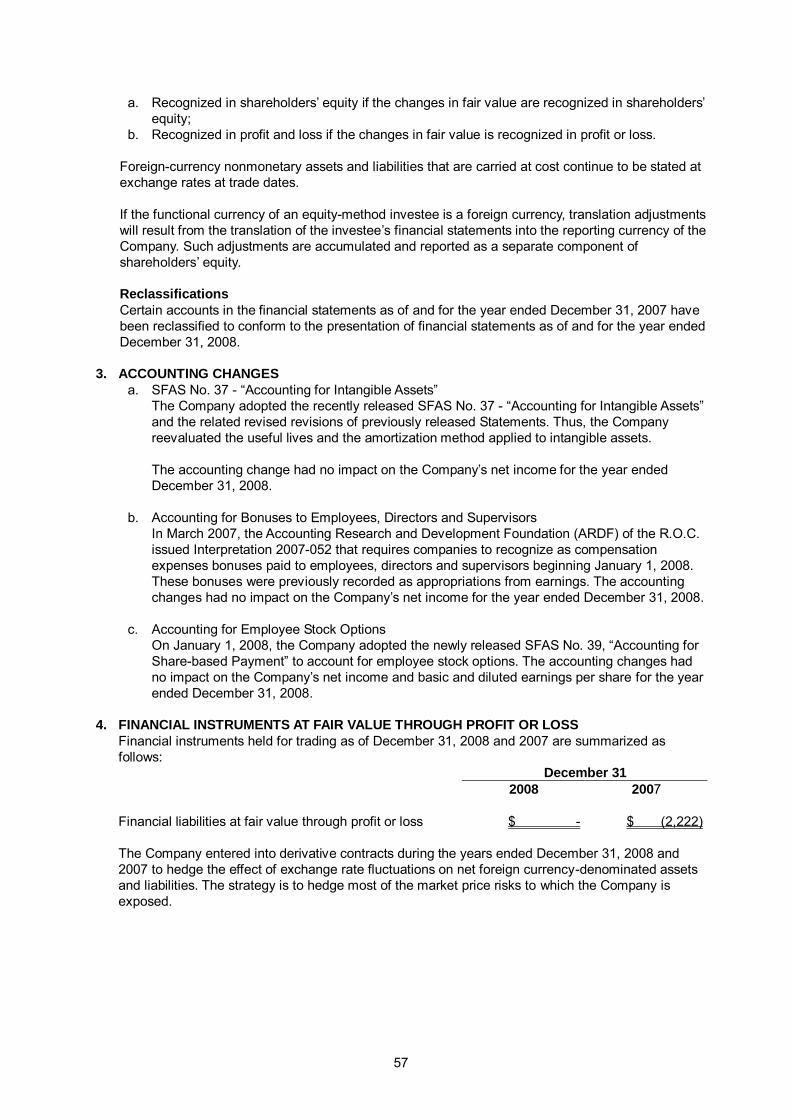
57
a. Recognized in shareholders’ equity if the changes in fair value are recognized in shareholders’ equity;
b. Recognized in profit and loss if the changes in fair value is recognized in profit or loss.
Foreign-currency nonmonetary assets and liabilities that are carried at cost continue to be stated at exchange rates at trade dates. If the functional currency of an equity-method investee is a foreign currency, translation adjustments will result from the translation of the investee’s financial statements into the reporting currency of the Company. Such adjustments are accumulated and reported as a separate component of shareholders’ equity. Reclassifications Certain accounts in the financial statements as of and for the year ended December 31, 2007 have been reclassified to conform to the presentation of financial statements as of and for the year ended December 31, 2008.
3. ACCOUNTING CHANGES
a. SFAS No. 37 - “Accounting for Intangible Assets” The Company adopted the recently released SFAS No. 37 - “Accounting for Intangible Assets” and the related revised revisions of previously released Statements. Thus, the Company reevaluated the useful lives and the amortization method applied to intangible assets. The accounting change had no impact on the Company’s net income for the year ended December 31, 2008.
b. Accounting for Bonuses to Employees, Directors and Supervisors
In March 2007, the Accounting Research and Development Foundation (ARDF) of the R.O.C. issued Interpretation 2007-052 that requires companies to recognize as compensation expenses bonuses paid to employees, directors and supervisors beginning January 1, 2008. These bonuses were previously recorded as appropriations from earnings. The accounting changes had no impact on the Company’s net income for the year ended December 31, 2008.
c. Accounting for Employee Stock Options On January 1, 2008, the Company adopted the newly released SFAS No. 39, “Accounting for Share-based Payment” to account for employee stock options. The accounting changes had no impact on the Company’s net income and basic and diluted earnings per share for the year ended December 31, 2008.
4. FINANCIAL INSTRUMENTS AT FAIR VALUE THROUGH PROFIT OR LOSS
Financial instruments held for trading as of December 31, 2008 and 2007 are summarized as follows:
December 31 2008 2007
Financial liabilities at fair value through profit or loss $ - $ (2,222)
The Company entered into derivative contracts during the years ended December 31, 2008 and 2007 to hedge the effect of exchange rate fluctuations on net foreign currency-denominated assets and liabilities. The strategy is to hedge most of the market price risks to which the Company is exposed.

58
The Company did not have outstanding forward exchange contracts as of December 31, 2008. As of December 31 2007, outstanding forward exchange contracts were as follows:
December 31, 2007 Currency Maturity Contract Amount (in Thousands)
Sell forward exchange contracts
US$ to NT$ November 16, 2007 - January 10, 2008 US$10,000
Net gains and net losses arising from financial instruments held for trading were $2,344 thousand and $2,741 thousand for the years ended December 31, 2008 and 2007, respectively. Financial instruments designated at fair value through profit or loss were as follows:
Principal Amount
(in Thousands) Carrying Amount Maturity
2008 Inverse floaters: Time deposits with floating interest rate indexed to LIBOR rates
$ 5,000 $ 162,122 April 2014
2007 Inverse floaters: Time deposits with floating interest rate indexed to LIBOR rates
$ 6,000 $ 167,676 September 2010 - April 2014
Net losses and net gains arising from financial assets designated at fair value through profit or loss were $25,286 thousand and $24,606 thousand for the years ended December 31, 2008 and 2007, respectively. As a holder of the above products, the Company will lose part of the principals if it breaks the related contracts before maturity, as stipulated in the principal and profit guarantee terms of the contracts.
5. NOTES AND ACCOUNTS RECEIVABLE December 31 2008 2007
Notes and accounts receivable - other $549,051 $1,541,604 Notes and accounts receivable - related parties 19,148 50,041 568,199 1,591,645 Deduct: Allowance for doubtful accounts 56,912 78,193 Deduct: Allowance for sales returns and discounts 35,000 -
$476,287 $1,513,452
Allowance for doubtful accounts movement: Years Ended December 31 2008 2007 Balance, beginning of year $78,193 $54,193 Add: Provision for doubtful accounts - 24,000 Deduct: Amounts written off 21,281 - Balance, end of year $56,192 $78,193

59
6. INVENTORIES, NET December 31 2008 2007
Finished goods and merchandise $349,823 $692,537 Work-in-process 300,858 509,036 Raw materials 345,392 125,329 996,073 1,326,902 Deduct: Allowance for losses 99,324 222,901 $896,749 $1,104,001
Allowance for losses movement:
Years Ended December 31 2008 2007
Balance, beginning of year $222,901 $339,073 Add: Provision for losses 120,000 120,000 Deduct: Amounts written off 243,577 236,172 Balance, end of year $99,324 $222,901
7. EQUITY-METHOD INVESTMENTS December 31 2008 2007
Amount % of
Ownership Amount % of
Ownership
Giantplus Technology Co., Ltd. $1,870,627 21 $1,171,730 32 Orise Technology Co., Ltd. 1,245,799 55 1,220,404 57 Sunplus mMedia 708,757 78 - - Sunplus Venture Capital Co., Ltd. 624,889 100 652,367 100 Lin Shih Investment Co., Ltd. 607,241 100 657,300 100 Generalplus Technology Corp. 475,292 41 461,612 45 Ventureplus Group Inc. 428,478 100 349,593 100 Russell Holdings Limited 419,813 100 651,954 100 Sunplus Innovation Technology Inc. 392,361 84 347,675 91 Sunext Technology Co., Ltd. 244,058 79 - - Sunplus Core Technology Co., Ltd. 17,857 57 44,721 58 Waveplus Technology Co., Ltd. 16,742 41 22,433 43 Goldkey Technology Corp. 16,584 12 18,447 15 Global Techplus Capital Inc. 7,852 100 6,235 100 Wei-Young Investment Inc. 5,167 100 8,725 100 Sunplus Technology (H.K.) Co., Ltd. 4,817 100 - - Sunplus Management Consulting Inc. 4,194 100 4,224 100 Sunplus mMobile Inc. - - 989,985 91
7,090,528 6,607,405 (Continued)

60
December 31 2008 2007
Amount % of
Ownership Amount % of
Ownership Prepayment
Sunext Technology Co., Ltd $- $670,000 Giantplus Technology Co., Ltd. - 235,980
- 905,980 $7,090,528 $7,513,385 Credit balance on carrying value of long-term investments (recorded as other current liabilities)
Sunplus mMobile Inc. $141,111 91 $- Sunext Technology Co., Ltd. - 98,717 16 Sunplus Technology (H.K.) Co., Ltd. - 4,364 100
$141,111 $103,081
(Concluded)
As of December 31, 2008 and 2007, the Company and its subsidiaries collectively owned 25% and 32% of Goldkey Technology Corp., Ltd., respectively and 57% of Sunext Technology Co., Ltd. as of December 31, 2007. Thus, these investments were accounted for by the equity method. The consolidated financial statements as of and for the years ended December 31, 2008 and 2007 had included all subsidiaries. Movements of the difference between the cost of investment and the Company’s share in investees’ net assets allocated to goodwill for the year ended December 31, 2008 were as follows:
2008
Balance, Beginning
of Year Increase
Balance, End of Year
Goodwill $ - $ 155,506 $ 155,506 The Company obtained shares of Sunplus mMedia Inc. in November, 2008. in which Sunplus mMobile Inc. had invested by equity method. As of December 31, 2008 the Company held 78% of Sunplus mMedia Inc. The financial statements used as basis for calculating the carrying values of the equity-method investments and the related investment gains and losses in 2008 and 2007 had all been audited, except those of Global Techplus Inc. and Sunplus Management Consulting Inc.. The Company’s management believed that had financial statements of Global Techplus Inc. and Sunplus Management Consulting Inc. been audited, there would have been no material effect on the Company’s financial statements. The investment incomes (losses) of investees were as follows:
Years Ended December 31 2008 2007
Giantplus Technology Co., Ltd. $57,999 $184,805 Orise Technology Co., Ltd. 146,333 198,836 Sunplus mMedia Inc. (28,867) -
(Continued)
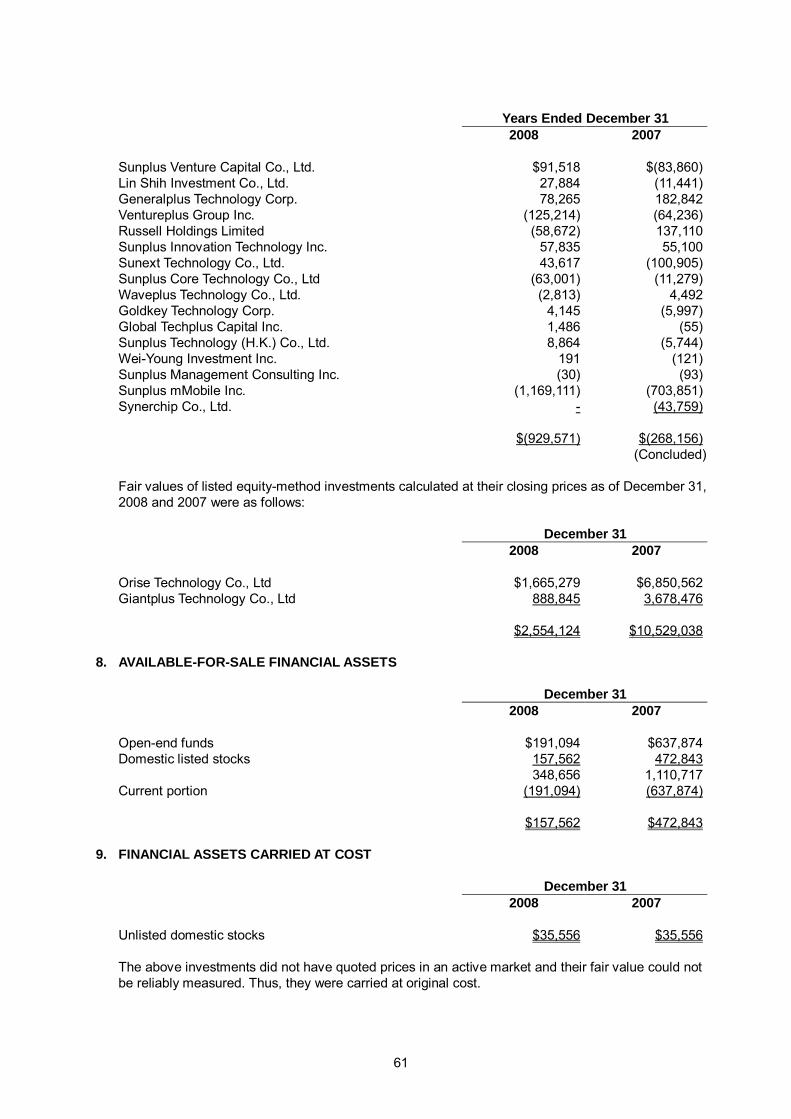
61
Years Ended December 31 2008 2007
Sunplus Venture Capital Co., Ltd. $91,518 $(83,860) Lin Shih Investment Co., Ltd. 27,884 (11,441) Generalplus Technology Corp. 78,265 182,842 Ventureplus Group Inc. (125,214) (64,236) Russell Holdings Limited (58,672) 137,110 Sunplus Innovation Technology Inc. 57,835 55,100 Sunext Technology Co., Ltd. 43,617 (100,905) Sunplus Core Technology Co., Ltd (63,001) (11,279) Waveplus Technology Co., Ltd. (2,813) 4,492 Goldkey Technology Corp. 4,145 (5,997) Global Techplus Capital Inc. 1,486 (55) Sunplus Technology (H.K.) Co., Ltd. 8,864 (5,744) Wei-Young Investment Inc. 191 (121) Sunplus Management Consulting Inc. (30) (93) Sunplus mMobile Inc. (1,169,111) (703,851) Synerchip Co., Ltd. - (43,759)
$(929,571) $(268,156)
(Concluded)
Fair values of listed equity-method investments calculated at their closing prices as of December 31, 2008 and 2007 were as follows:
December 31 2008 2007
Orise Technology Co., Ltd $1,665,279 $6,850,562 Giantplus Technology Co., Ltd 888,845 3,678,476
$2,554,124 $10,529,038 8. AVAILABLE-FOR-SALE FINANCIAL ASSETS December 31 2008 2007
Open-end funds $191,094 $637,874 Domestic listed stocks 157,562 472,843 348,656 1,110,717 Current portion (191,094) (637,874)
$157,562 $472,843 9. FINANCIAL ASSETS CARRIED AT COST December 31 2008 2007
Unlisted domestic stocks $35,556 $35,556
The above investments did not have quoted prices in an active market and their fair value could not be reliably measured. Thus, they were carried at original cost.

62
10. PROPERTIES Year Ended December 31, 2008
Buildings Auxiliary
Equipment
Machinery and
Equipment Testing
Equipment Transportation
Equipment
Furniture and
Fixtures Leasehold
Improvements Prepayment Total
Cost
Balance, beginning of
year $688,983 $179,140 $378,667 $402,639 $5,573 $128,706 $459 $- $1,784,167
Increase - 5,823 35,948 37,933 - 2,775 - - 82,479
Decrease - - 107 6,522 3,110 5,213 - - 14,952
Reclassification - - - (60,568) - (3,210) - - (63,778)
Balance, end of year 688,983 184,963 414,508 373,482 2,463 123,058 459 - 1,787,916
Accumulated depreciation
Balance, beginning of
year 104,528 127,925 262,980 249,336 5,101 93,769 394 - 844,033
Depreciation 20,161 13,468 53,645 49,348 195 13,075 32 - 149,924
Decrease - - 103 5,515 3,110 5,018 - - 13,746
Reclassification (11,242) - - (16,189) - (1,190) - - (28,621)
Balance, end of year 113,447 141,393 316,522 276,980 2,186 100,636 426 - 951,590
Balance, end of year, net $ 575,536 $ 43,570 $ 97,986 $ 96,502 $ 277 $ 22,422 $ 33 $ - $ 836,326 Year Ended December 31, 2007
Buildings Auxiliary
Equipment
Machinery and
Equipment Testing
Equipment Transportation
Equipment
Furniture and
Fixtures Leasehold
Improvements Prepayment Total
Cost
Balance, beginning of
year $758,822 $165,573 $549,878 $1,032,437 $ 5,573 $152,842 $459 $328 $2,665,912
Increase - 13,689 30,409 102,674 - 18,900 - - 165,672
Decrease - 122 201,620 17,606 - 5,954 - 328 225,630
Reclassification (69,839) - - (714,866) - (37,082) - - (821,787)
Balance, end of year 688,983 179,140 378,667 402,639 5,573 128,706 459 - 1,784,167
Accumulated depreciation
Balance, beginning of
year 87,297 110,190 405,767 648,514 4,813 101,225 329 - 1,358,135
Depreciation 20,161 17,849 58,731 65,520 288 16,781 65 - 179,395
Decrease - 114 201,518 12,914 - 5,558 - - 220,104
Reclassification (2,930) - - (451,784) - (18,679) - - (473,393)
Balance, end of year 104,528 127,925 262,980 249,336 5,101 93,769 394 - 844,033
Balance, end of year, net $ 584,455 $ 51,215 $115,687 $153,303 $ 472 $34,937 $ 65 $ - $940,134

63
11. INTANGIBLE ASSETS
Year Ended December 31, 2008
Technology License Fee Patents Total
Cost Balance, beginning of year $2,576,007 $97,849 $2,673,856 Increase 53,084 - 53,084 Balance, end of year 2,629,091 97,849 2,726,940 Accumulated amortization Balance beginning of year 1,805,759 26,198 1,831,957 Amortization expense 337,652 5,544 343,196 Balance, end of year 2,143,411 31,742 2,175,153 $485,680 $66,107 $551,787
Year Ended December 31, 2007
Technology License Fee Patents Total
Cost Balance, beginning of year $2,253,349 $97,849 $2,351,198 Increase 322,658 - 322,658 Balance, end of year 2,576,007 97,849 2,673,856 Accumulated amortization Balance beginning of year 1,326,486 20,654 1,347,140 Amortization expense 479,273 5,544 484,817 Balance, end of year 1,805,759 26,198 1,831,957
770,248 71,651 841,899
Intangible assets consisted of fees paid to Oak Technology (“Oak”) for the Company to use Oak’s technology on light storage solutions to develop SOC DVD/VCD (system on a chip digital compact disk/video compact disk) players and to buy the rights on video processing technology to develop DTV products.
The Company also authorized Sunext Technology (equity-method investee) to research, design and manufacture products using Oak’s technology in exchange for royalty income (shown under “gross sales” in the income statements and as “deferred royalty income” in the balance sheets).
12. DEFERRED CHARGES AND OTHERS December 31 2008 2007
Software and system design, net $242,946 $259,638 Golf club membership fees 7,800 7,800 Refundable deposits 1,462 2,706
$252,208 $270,144

64
13. SHORT-TERM LOANS December 31 2008 2007
Working capital loans - US$4,500 thousand, annual interest rate from 1.81%- 3.24% in 2008; annual interest rate from 2.65%-2.78% in 2007 $ 647,600 $ 500,000
14. PENSION PLAN
The Company’s pension plan under the Labor Pension Act is a defined contribution plan. The rate of contribution by an employer to employees’ personal pension accounts should not be less than 6% of each employee’s monthly salary or wage. The Company has made monthly contributions to employees’ personal pension accounts and recognized pension costs of $30,192 thousand and $28,891 thousand for the years ended December 31, 2008 and 2007, respectively. Before the promulgation of the Act, the Company has had a defined benefit pension plan under the Labor Standards Law. Under this plan, employees should receive either a series of pension payments with a defined annuity or a lump sum that is payable immediately on retirement and is equivalent to 2 base units for each of the first 15 years of service and 1 base unit for each year of service thereafter. The total retirement benefit is subject to a maximum of 45 units. The pension plan provides benefits based on the length of service and the average basic salary of the employee’s final six months of service. In addition, the Company makes monthly contributions, equal to 2% of salaries, to a pension fund, which is administered by a fund monitoring committee. The fund is deposited in the committee’s name in the Bank of Taiwan as the survivor entity. The Company recognized pension costs of $3,643 thousand and $1,619 thousand for the years ended December 31, 2008 and 2007, respectively. Defined benefit pension fund balances were $103,810 thousand and $94,474 thousand as of December 31, 2008 and 2007, respectively. Other information on the defined benefit pension plan is as follows:
a. Components of net pension costs Year Ended December 31 2008 2007
Service costs $2,713 $2,437 Interest costs 4,060 3,726 Projected return on plan assets (2,990) (3,233) Amortization (140) (1,311) Net pension costs $3,643 $1,619
b. Reconciliation of the fund status of the plan and accrued pension costs
December 31 2008 2007
Benefit obligation Vested benefit obligation $- $- Non-vested benefit obligation 47,466 49,144 Accumulated benefit obligation 47,466 49,144 Additional benefits based on future salaries 84,322 86,217 Projected benefit obligation 131,788 135,361 Fair value of plan assets (106,100) (96,363) Funded status 25,688 38,998

65
December 31 Unrecognized net transition obligation (2,347) (2,837) Unrecognized net gain 37,054 26,788 Accrued pension liability $60,395 $62,949 Vested benefit $- $-
c. Actuarial assumptions Discount rate used in determining present values 2.50% 3.00% Future salary increase rate 6.00% 6.50% Expected rate of return on plan assets 2.50% 3.00% 15. SHAREHOLDERS’ EQUITY
a. Capital stock The shareholders’ approved a capital reduction by canceling 511,436 thousand issued and outstanding shares, amounting to $ 5,114,357 thousand, on December 8, 2006. All related actions, including the decrease in the number of issued and outstanding shares and capital return were completed on March 26, 2007. The effective date of capital reduction was January 25, 2007. The share was returned at about NT$5.00; thus, the capital reduction ratio was about 50% of share par value.
b. Employee stock option plan
On March 6, 2003 (2003 option plan) and September 11, 2007 (2007 option plan), the Securities and Futures Bureau approved the Company’s adoption of an employee stock option plan. The plan provides for the grant of 30,000 thousand options and 25,000 thousand options in 2003 and 2007 plan, respectively, with each unit representing one common share. The option rights are granted to qualified employees of the Company and subsidiaries. A total of 55,000 thousand common shares have been reserved for issuance. The options are valid for six years and exercisable at certain percentages after the second anniversary of the grant date. Stock option rights are granted at an exercise price equal to the closing price of the Company’s common shares listed on the Taiwan Stock Exchange on the grant date. All options had been granted or canceled as of December 31, 2008. Outstanding option rights were as follows:
2003 Option Plan 2008 2007
Unit (in Thousands)
Weighted- average
Price (NT$) Unit (in
Thousands)
Weighted- average
Price (NT$)
Beginning outstanding balance 5,154 $47.07 18,399 $27.12 Options issued 243 40.34 302 44.81 Options exercised (179) 32.70 (5,435) 37.93 Options canceled (136) (8,112) Ending outstanding balance 5,082 5,154
2007 Option Plan 2008 2007
Unit (in Thousands)
Weighted- average
Price (NT$) Unit (in
Thousands)
Weighted- average
Price (NT$)
Beginning outstanding balance 25,000 $47.58 - $- Options granted - - 25,000 47.58 Options issued 1,209 40.52 - -

66
2007 Option Plan 2008 2007
Unit (in Thousands)
Weighted- average
Price (NT$) Unit (in
Thousands)
Weighted- average
Price (NT$) Options canceled (1,563) - - - Ending outstanding balance 24,646 25,000
The number of shares and exercise prices of outstanding option have been adjusted to reflect the appropriations of dividends, cash dividends and issuance of capital stock specified under the Plans.
As of December 31, 2008, the outstanding and exercisable options were as follows:
2003 Option Plan Options Outstanding Options Exercisable
Exercise Price (NT$)
Number of Options (in Thousands)
Weighted- average
Remaining Contractual Life (Years)
Weighted- average Exercise
Price (NT$)
Number of Options (in Thousands)
Weighted- average Exercise
Price (NT$)
$27.8 1,981 0.35 $27.8 1,981 $27.8 $48.3 3,101 0.66 48.3 3,101 48.3
2007 Option Plan Options Outstanding Options Exercisable
Exercise Price (NT$)
Number of Options (in Thousands)
Weighted- average
Remaining Contractual Life (Years)
Weighted- average Exercise
Price (NT$)
Number of Options (in Thousands)
Weighted- average Exercise
Price (NT$)
$40.4 18,346 4.87 $40.4 - $40.4 $40.9 6,300 4.99 40.9 - 40.9
The pro forma information for the years ended December 31, 2008 and 2007 assuming employee stock options granted before December 31, 2007 were accounted for under SFAS No. 39 is as follows:
Years Ended December 31 2008 2007
Net income Net income as reported $8,383 $2,061,502 Pro forma net income (loss) $(253,942) $2,028,306
Earnings per share (EPS; in New Taiwan dollars)
Basic EPS as reported $0.01 $3.28 Pro forma basic EPS $(0.43) $3.23 Diluted EPS as reported $0.01 $3.27 Pro forma diluted EPS $(0.43) $3.22
c. Global depositary receipts
In March 2001, the Company issued 20,000 thousand units of Global Depositary Receipts (GDRs), representing 40,000 thousand common shares consisting of newly issued and originally outstanding shares. The GDRs are listed on the London Stock Exchange (code: SUPD) with an issuance price of US$9.57 per unit. As of December 31, 2008, the outstanding 457 thousand units of GDRs represented 914 thousand common shares.

67
d. Capital surplus
Under ROC regulations, capital surplus may be used to offset deficit, and only the capital surplus from the issue of stock in excess of par value (including the stock issued for new capital and mergers and surplus arising from treasury stocks transactions) may be transferred to capital as stock dividend; this transfer is restricted to a certain percentage based on shareholders’ ownership. Also, the capital surplus from long-term investments may not be used for any purpose.
e. Appropriation of earnings and dividends
The Company’s Articles of Incorporation provide that the following should be appropriated from annual net income less any accumulated deficit: (a) 10% as legal reserve; and (b) special reserve equivalent to the debit balance of any accounts shown in the shareholders' equity section of the balance sheet, other than deficit. The distribution of any remaining earnings will be as follows: (i) up to 6% of paid-in capital as dividends; and (ii) 1.5% as remuneration to directors and supervisors and at least 1% as bonus to employees. The employees may include, with the approval of the Company’s board of directors, those of the Company’s subsidiaries.
The current year’s net income less all the foregoing appropriations and distributions plus the unappropriated prior years’ earnings may be distributed as additional dividends. It is the Company’s policy that cash dividends should be at least 10% of total dividends distributed. However, cash dividends will not be distributed if these dividends are less than NT$0.5 per share.
For the years ended December 31, 2008, the bonus to employees and remuneration to directors and supervisors, representing 25% and 1.5%, respectively, of net income had to be accrued on the basis of past experiences. However, based on the Company’s Articles of Incorporation, the bonus and remuneration should be appropriated first from paid-in capital. Thus, the Company did not accrue any bonus and remuneration expenses. If the actual amounts approved by the shareholders differ from the board of directors’ proposed amounts, the differences are recorded in the year of shareholders’ resolution as a change in accounting estimate.
If bonus shares are resolved to be distributed to employees, the number of shares is determined by dividing the amount of bonus by the closing price (after considering the effect of cash and stock dividends) of the shares of the day preceding the shareholders’ meeting.
Under regulations promulgated by the Securities and Futures Bureau, a special reserve equivalent to the debit balance of any account shown in the shareholders’ equity section of the balance sheet (for example, unrealized loss on financial assets and cumulative translation adjustments) should be made from unappropriated retained earnings. The special reserve is allowed to be appropriated to the extent that the debit balance of such accounts is reversed.
Under the ROC Company Law, legal reserve should be appropriated until the reserve equals the Company’s paid-in capital. This reserve may be used to offset a deficit. In addition, when the reserve exceeds 50% of the Company’s paid-in capital, the excess portion that is over 25% of the excess may be distributed as stock dividend and bonus if the Company has no deficit.
Under the Integrated Income Tax System, which took effect on January 1, 1998, ROC resident shareholders are allowed to have tax credits for the income tax paid by the Company on earnings generated since January 1, 1998. An imputation credit account (ICA) is maintained by the Company for such income tax and the tax credit allocated to each resident shareholder. The maximum credit available for allocation to each resident shareholder cannot exceed the ICA balance on the dividend distribution date.
The appropriations for the earnings of 2007 and 2006 were approved in the shareholders’ meetings on June 13, 2008 and June 15, 2007, respectively. The appropriations, including dividends, were as follows:

68
For Fiscal Year 2007 For Fiscal Year 2006
Appropriation of Earnings
Dividends Per Share
(NT$) Appropriation of Earnings
Dividends Per Share
(NT$)
Legal reserve $206,150 $297,269 Special reserve (17,260) (277,600) Bonus to employees - stock 135,000 135,000 Bonus to employees - cash 15,000 15,000 Remuneration of directors and supervisors 23,090 39,688 Stock dividends 166,637 $0.29990 153,622 $0.29822 Cash dividends 1,388,644 2.49920 2,048,297 3.97620
$1,917,261 $2,411,276
The shareholders also resolved the transfer of $111,092 thousand of capital surplus to paid-in capital in the shareholders’ meeting on June 13, 2008. As of February 27, 2009, the Board of Directors had not resolved the appropriation for earnings of 2008. Information the bonus to employees, directors and supervisors is available on the Market Observation Post System website of the Taiwan Stock Exchange.
Unrealized Gain or Loss on Financial Instruments For the years ended December 31, 2008 and 2007, the movements of unrealized gain or loss on financial instruments were as follows:
Available- for-sale
Financial Assets
Equity-method Investments Total
Year ended December 31, 2008 Balance, beginning of year $(160,003) $345,418 $185,415 Sales for the year (122,842) - (122,842) Recognized in shareholders’ equity (155,732) (468,807) (624,539) Balance, end of year $(438,577) $(123,389) $(561,966) Year ended December 31, 2007 Balance, beginning of year $(147,438) $112,972 $(34,466) Recognized in shareholders’ equity (12,565) 232,446 219,881 Balance, end of year $(160,003) $345,418 $185,415
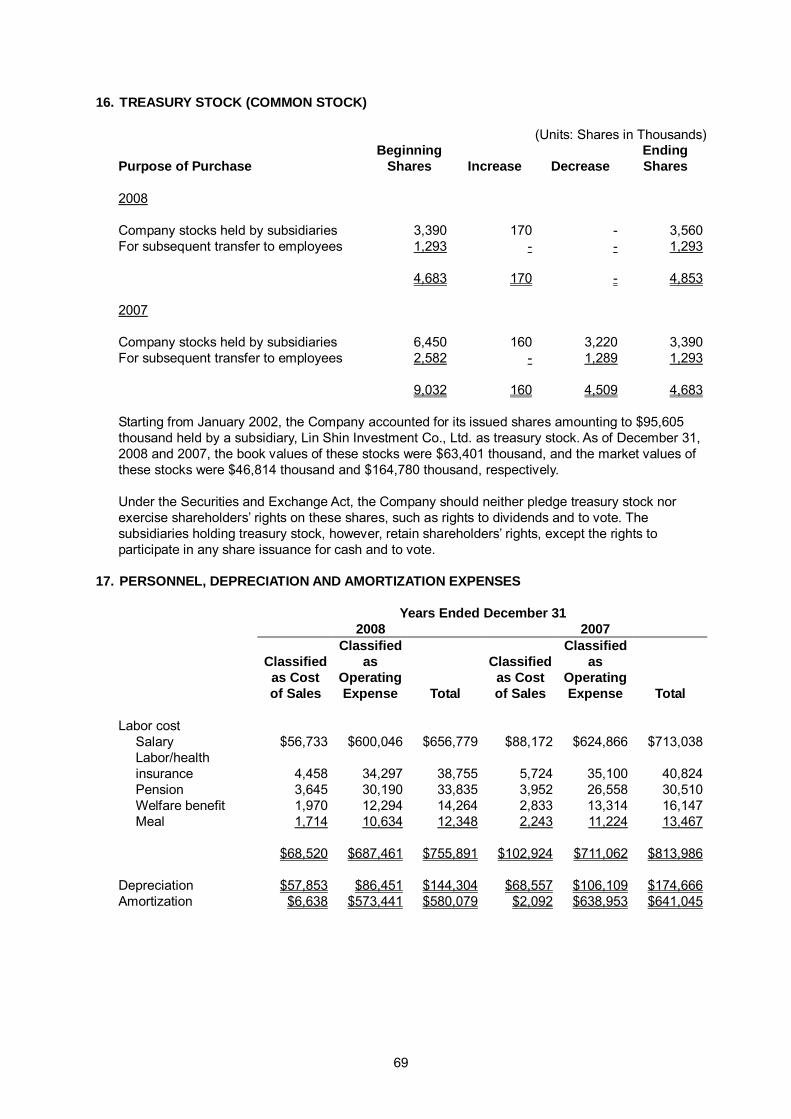
69
16. TREASURY STOCK (COMMON STOCK)
(Units: Shares in Thousands)
Purpose of Purchase Beginning
Shares Increase Decrease Ending Shares
2008
Company stocks held by subsidiaries 3,390 170 - 3,560 For subsequent transfer to employees 1,293 - - 1,293
4,683 170 - 4,853
2007
Company stocks held by subsidiaries 6,450 160 3,220 3,390 For subsequent transfer to employees 2,582 - 1,289 1,293
9,032 160 4,509 4,683
Starting from January 2002, the Company accounted for its issued shares amounting to $95,605 thousand held by a subsidiary, Lin Shin Investment Co., Ltd. as treasury stock. As of December 31, 2008 and 2007, the book values of these stocks were $63,401 thousand, and the market values of these stocks were $46,814 thousand and $164,780 thousand, respectively.
Under the Securities and Exchange Act, the Company should neither pledge treasury stock nor exercise shareholders’ rights on these shares, such as rights to dividends and to vote. The subsidiaries holding treasury stock, however, retain shareholders’ rights, except the rights to participate in any share issuance for cash and to vote.
17. PERSONNEL, DEPRECIATION AND AMORTIZATION EXPENSES Years Ended December 31 2008 2007
Classified as Cost of Sales
Classified as
Operating Expense Total
Classified as Cost of Sales
Classified as
Operating Expense Total
Labor cost
Salary $56,733 $600,046 $656,779 $88,172 $624,866 $713,038 Labor/health insurance 4,458 34,297 38,755 5,724 35,100 40,824 Pension 3,645 30,190 33,835 3,952 26,558 30,510 Welfare benefit 1,970 12,294 14,264 2,833 13,314 16,147 Meal 1,714 10,634 12,348 2,243 11,224 13,467
$68,520 $687,461 $755,891 $102,924 $711,062 $813,986
Depreciation $57,853 $86,451 $144,304 $68,557 $106,109 $174,666 Amortization $6,638 $573,441 $580,079 $2,092 $638,953 $641,045

70
18. INCOME TAX a. A reconciliation of income tax expense on income before income tax at statutory rate and
current income tax expense before tax credits is shown below: 2008 2007
Income tax expense on income before income tax at statutory rate (25%) $39,996 $574,120 Tax effects of adjustments:
Tax-exempt income - (232,383) Permanent differences 155,250 (55,403) Temporary differences 18,218 (10,319) Tax effects of consolidation income tax filing (203,660) -
Income tax expense before tax credits $9,804 $276,015
b. Income tax expense consisted of the following:
Income tax expense before tax credits $9,804 $276,015 Additional tax at 10% on unappropriated earnings - 28,382 Investment tax credits - (150,673) Net change in deferred income tax assets 68,720 (245,116) Adjustment of prior years’ income tax expense 54,676 326,372 Additional income tax under the Alternative Minimum Tax Act 18,441 -
$151,641 $234,980
c. Deferred income tax assets were as follows: December 31 2008 2007
Current: Investment tax credits $299,193 $124,921 Temporary differences 7,947 18,492
307,140 143,413 Deduct: Valuation allowance 140,981 -
$166,159 $143,413
Noncurrent: Investment tax credits $939,119 $967,358 Temporary differences 17,063 9,183 956,182 976,541 Deduct: Valuation allowance 199,275 128,168
$756,907 $848,373

71
As of December 31, 2008, investment tax credits were as follows:
Regulatory Basis of Tax Credits Items
Total Creditable Amounts
Remaining Creditable Amounts
Expiry Year
$3,606 $3,606 2009 1,005 1,005 2011
$4,611 $4,611
Statute for Upgrading Industries
Purchase of machinery and equipment
$295,587 $295,587 2009 415,235 415,235 2010 257,859 257,859 2011 265,020 265,020 2012
Statute for Upgrading Industries
Research and development expenditures
$1,233,701 $1,233,701
d. The profits generated from the following expansion and construction projects are exempt from income tax:
Project Tax Exemption Period
Sixth expansion January 1, 2006 to December 31, 2009 Ninth expansion January 3, 2007 to January 2, 2012 Tenth expansion August 31, 2006 to August 30, 2011 Eleventh expansion January 1, 2008 to December 31, 2012
The tax returns through 2005 have been assessed by the tax authorities. The Company disagreed with the tax authorities’ assessment of its 2003, 2004 and 2005 tax returns and thus applied for an administrative remedy of these returns. Nevertheless, the Company has made a provision for the income tax assessed by the tax authorities for conservatism purposes.
e. Integrated income tax information is as follows:
December 31 2008 2007
Shareholders’ imputation credit account $74,942 $41,267 Unappropriated earnings until 1997 $452,310 $452,310
The expected and actual creditable tax ratios for the 2008 and 2007 earnings were 6.58% and 4.41%, respectively. The imputation credits allocated to shareholders of the Company is based on the balance of the ICA as of the date of dividend distribution. The expected creditable ratio for the 2008 earnings may be adjusted, depending on the ICA balance on the date of dividend distribution.
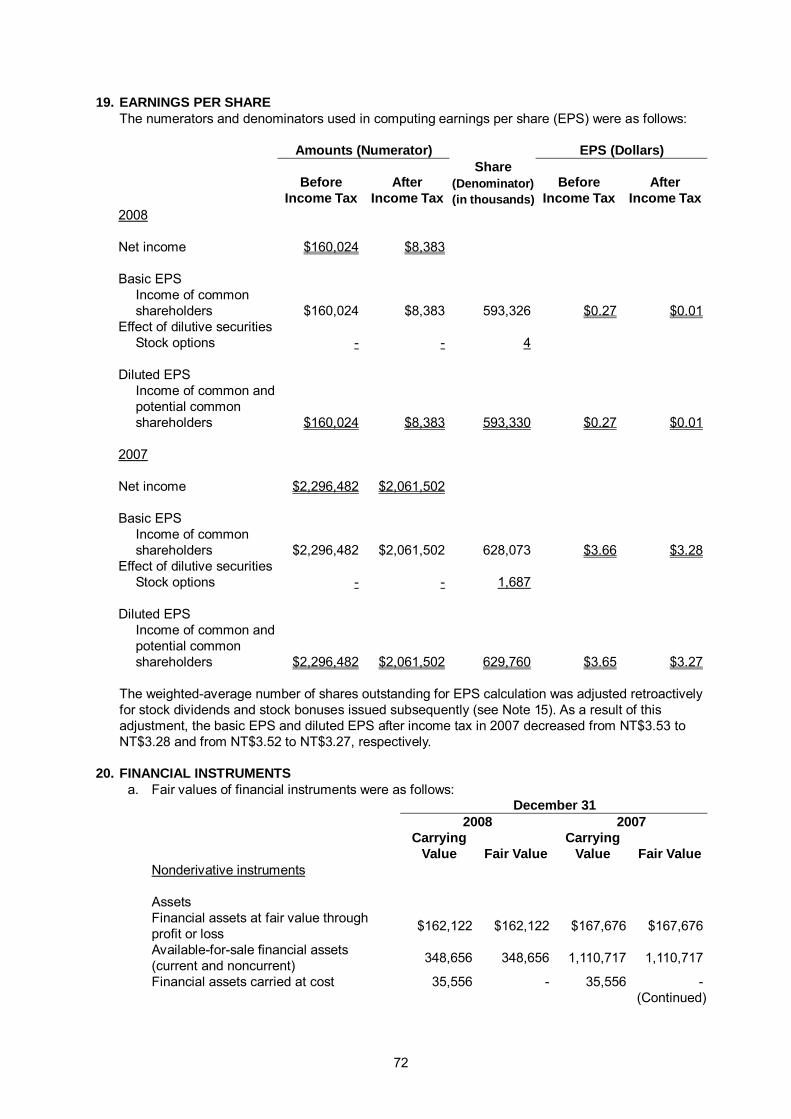
72
19. EARNINGS PER SHARE The numerators and denominators used in computing earnings per share (EPS) were as follows:
Amounts (Numerator) EPS (Dollars) Share
Before Income Tax
After Income Tax
(Denominator) (in thousands)
Before Income Tax
After Income Tax
2008
Net income $160,024 $8,383
Basic EPS Income of common shareholders $160,024 $8,383 593,326 $0.27 $0.01
Effect of dilutive securities Stock options - - 4
Diluted EPS Income of common and potential common shareholders $160,024 $8,383 593,330 $0.27 $0.01
2007
Net income $2,296,482 $2,061,502
Basic EPS
Income of common shareholders $2,296,482 $2,061,502 628,073 $3.66 $3.28
Effect of dilutive securities Stock options - - 1,687
Diluted EPS
Income of common and potential common shareholders $2,296,482 $2,061,502 629,760 $3.65 $3.27
The weighted-average number of shares outstanding for EPS calculation was adjusted retroactively
for stock dividends and stock bonuses issued subsequently (see Note 15). As a result of this adjustment, the basic EPS and diluted EPS after income tax in 2007 decreased from NT$3.53 to NT$3.28 and from NT$3.52 to NT$3.27, respectively.
20. FINANCIAL INSTRUMENTS
a. Fair values of financial instruments were as follows: December 31 2008 2007 Carrying
Value Fair Value Carrying
Value Fair Value Nonderivative instruments
Assets Financial assets at fair value through profit or loss $162,122 $162,122 $167,676 $167,676
Available-for-sale financial assets (current and noncurrent) 348,656 348,656 1,110,717 1,110,717
Financial assets carried at cost 35,556 - 35,556 - (Continued)
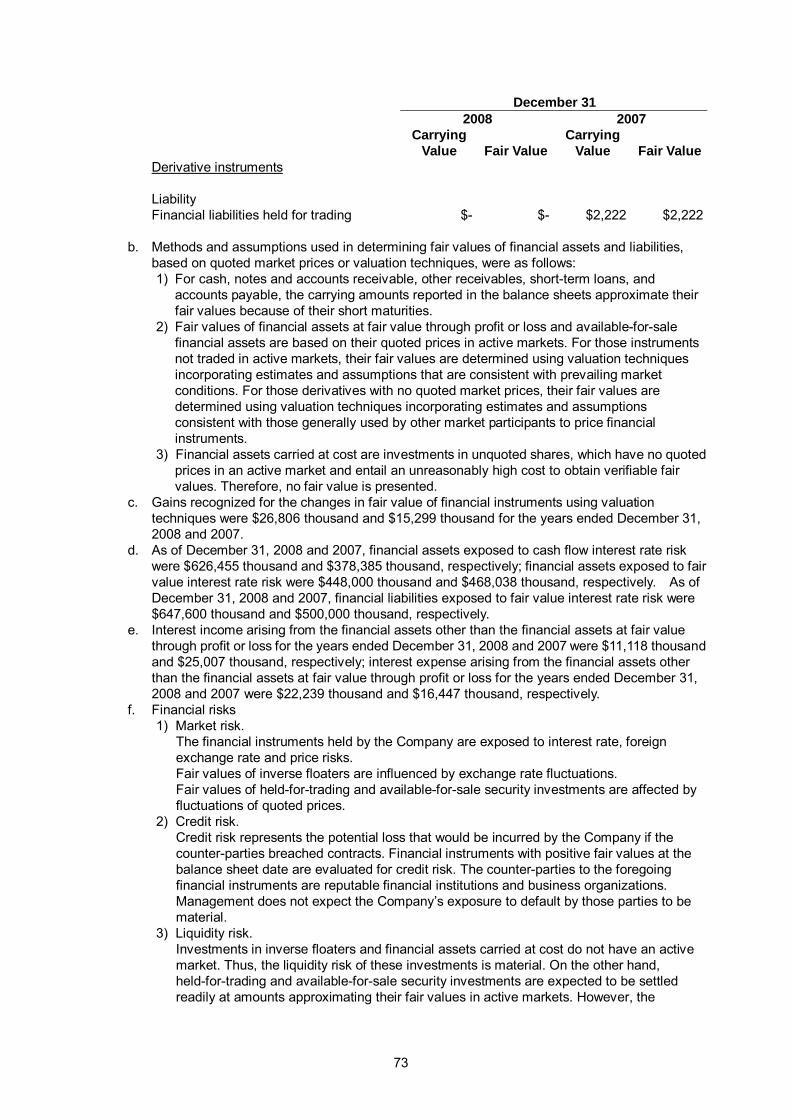
73
December 31 2008 2007
Carrying Value Fair Value
Carrying Value Fair Value
Derivative instruments Liability Financial liabilities held for trading $- $- $2,222 $2,222
b. Methods and assumptions used in determining fair values of financial assets and liabilities,
based on quoted market prices or valuation techniques, were as follows: 1) For cash, notes and accounts receivable, other receivables, short-term loans, and
accounts payable, the carrying amounts reported in the balance sheets approximate their fair values because of their short maturities.
2) Fair values of financial assets at fair value through profit or loss and available-for-sale financial assets are based on their quoted prices in active markets. For those instruments not traded in active markets, their fair values are determined using valuation techniques incorporating estimates and assumptions that are consistent with prevailing market conditions. For those derivatives with no quoted market prices, their fair values are determined using valuation techniques incorporating estimates and assumptions consistent with those generally used by other market participants to price financial instruments.
3) Financial assets carried at cost are investments in unquoted shares, which have no quoted prices in an active market and entail an unreasonably high cost to obtain verifiable fair values. Therefore, no fair value is presented.
c. Gains recognized for the changes in fair value of financial instruments using valuation techniques were $26,806 thousand and $15,299 thousand for the years ended December 31, 2008 and 2007.
d. As of December 31, 2008 and 2007, financial assets exposed to cash flow interest rate risk were $626,455 thousand and $378,385 thousand, respectively; financial assets exposed to fair value interest rate risk were $448,000 thousand and $468,038 thousand, respectively. As of December 31, 2008 and 2007, financial liabilities exposed to fair value interest rate risk were $647,600 thousand and $500,000 thousand, respectively.
e. Interest income arising from the financial assets other than the financial assets at fair value through profit or loss for the years ended December 31, 2008 and 2007 were $11,118 thousand and $25,007 thousand, respectively; interest expense arising from the financial assets other than the financial assets at fair value through profit or loss for the years ended December 31, 2008 and 2007 were $22,239 thousand and $16,447 thousand, respectively.
f. Financial risks 1) Market risk.
The financial instruments held by the Company are exposed to interest rate, foreign exchange rate and price risks. Fair values of inverse floaters are influenced by exchange rate fluctuations. Fair values of held-for-trading and available-for-sale security investments are affected by fluctuations of quoted prices.
2) Credit risk. Credit risk represents the potential loss that would be incurred by the Company if the counter-parties breached contracts. Financial instruments with positive fair values at the balance sheet date are evaluated for credit risk. The counter-parties to the foregoing financial instruments are reputable financial institutions and business organizations. Management does not expect the Company’s exposure to default by those parties to be material.
3) Liquidity risk. Investments in inverse floaters and financial assets carried at cost do not have an active market. Thus, the liquidity risk of these investments is material. On the other hand, held-for-trading and available-for-sale security investments are expected to be settled readily at amounts approximating their fair values in active markets. However, the

74
Company also has some equity-method investments with no quoted market prices in an active market, which are expected to have material liquidity risk.
21. RELATED-PARTY TRANSACTIONS
The Company’s related parties were as follows: a. Giantplus Technology Co., Ltd. (“Giantplus”) - equity-method investee b. Waveplus Technology Co., Ltd. (“Waveplus”) - equity-method investee c. Sunext Technology Co., Ltd. (“Sunext”) - 79% subsidiary d. Sunplus Core Technology Inc. (“Sunplus Core”) - 57% subsidiary e. Generalplus Technology Inc. (“Generalplus”) - equity-method investee f. Coolsand Technologies SARL (“Coolsand”) - equity-method investee of Russel Holding Ltd. g. Lin Shin Technology Co., Ltd. (“Lin Shin”) - equity-method investee of Russel Holding Ltd. h. Sunplus Innovation Technology Inc. (“Sunplus Innovation”) - 84% subsidiary i. Sunplus mMobile Inc. (“Sunplus mMobile”) - 91% subsidiary j. Sunplus Technology (H.K.) Co., Ltd. (“Sunplus H.K.”) - 100% subsidiary k. Orise Technology Co., Ltd. (“Orise”) - 55% subsidiary l. Sunplus mMedia Inc. (“Sunplus mMedia”) - 78% subsidiary m. Sunplus Technology (Shanghai) Co., Ltd. (“Sunplus Shanghai”) - 99% indirect subsidiary n. Sunplus Prof-tek (Shenzhen) Co., Ltd. (“Sunplus Prof-tek”) - 100% indirect subsidiary o. Sun Media Technology Co., Ltd. (“Sun Media”) - 100% indirect subsidiary p. Sunplus mMobile Limited - 100% indirect subsidiary q. Others - please refer to Note 24 for related parties that did not have business transactions with
the Company in the current period.
The transactions with the foregoing parties in addition to those disclosed in other notes are summarized as follows:
Years Ended December 31 2008 2007 Amount % Amount %
Sales: Orise $74,271 1 $59,084 1 Sunplus mMedia 59,323 1 26,306 - Generalplus 27,509 1 47,290 1 Sunext 23,979 1 22,184 - Coolsand 20,973 - 117,049 1 Sunplus mMobile 16,768 - 8,267 - Sunplus Innovation 13,063 - 24,954 - Lin Shih 5,432 - 3,954 - Sunplus Core 3,346 - - - Waveplus 248 - 6,623 -
$244,912 4 $315,711 3
The collection terms for products sold to related parties were similar to those for third parties. The products sold to related parties were custom-made; thus, the related selling prices were not comparable with those for third parties.
Years Ended December 31 2008 2007 Amount % Amount %
Operating expense Sunplus Prof-tek $61,296 3 $- - Sunplus Shanghai 21,218 1 - - Sunplus Core 8,064 1 - - Sun Media 5,755 - - -

75
Years Ended December 31 2008 2007 Amount % Amount %
Sunplus H.K. 3,131 - - - Sunext 1,310 - 387 -
100,774 5 387 -
The support transaction prices were negotiated and thus not comparable with those in the market. Years Ended December 31 2008 2007 Amount % Amount %
Nonoperating income and gains Sunplus mMedia $82,908 12 $129,751 12 Sunplus mMobile 60,008 8 136,348 12 Sunplus Core 9,398 1 4,695 - Generalplus 8,052 1 10,350 1 Sunext 7,529 1 8,329 1 Sunplus Innovation 7,431 1 16,963 2 Orise 4,787 1 14,892 1 Giantplus 1,447 - 2,964 - Waveplus 550 - - - Lin Shin 273 - 572 - Coolsand - - 36 -
$182,383 25 $324,900 29
Nonoperating income and gains included rental income and support transaction prices that were negotiated and thus not comparable with those in the market. The rental income referred to the Company’s lease of offices to Sunplus mMobile, Sunplus mMedia and Sunplus Core. The Company transferred the book value of these leased offices to assets leased to others; this book value was based on the ratio of the area of the leased offices to the total area of the building. The following receivables as well as other transactions between the Company and the related parties were based on normal terms.
December 31 2008 2007 Amount % Amount %
Notes and accounts receivable: Orise $7,880 2 $11,554 1 Sunplus mMedia 5,059 1 3,572 - Generalplus 2,380 1 4,152 - Sunplus mMobile 1,644 - 9 - Sunplus Innovation 1,179 - 803 - Sunext 445 - - - Waveplus 264 - - - Sunplus Core 225 - - - Lin shin 72 - 1,019 - Coolsand - - 28,932 2
$19,148 4 $50,041 3
Other receivables Sunplus mMedia $5,596 4 $13,500 8 Sunplus mMobile 4,601 4 7,407 4 Sunplus Core 771 - 1,255 1

76
December 31 2008 2007 Amount % Amount %
Orise 473 - 3,355 2 Sunplus Innovation 376 - 1,708 1 Generalplus 327 - 499 - Lin Shih 221 - 103 - Sunext 143 - 4,546 3 Waveplus 3 - - - Giantplus - - 8 -
$12,511 8 $32,381 19
Deferred royalty income (current and noncurrent) Sunplus Core $47,200 93 $- - Sunext 1,729 4 22,917 90 Orise 1,282 2 2,381 9
$50,211 99 $25,298 99 December 31 2008 2007
Endorsement/guarantee provided: Sunext $630,000 $760,000 Sunplus mMobile 577,293 80,887 Sunplus Shanghai 306,000 329,825 Sunplus mMedia 227,000 479,443 Sunplus Innovation 130,000 323,550 Sunplus Core 60,000 - Generaplplus 30,000 - Waveplus 20,000 20,000 Lin shin 10,000 -
$1,990,293 $1,993,705 Years Ended December 31 2008 2007 Amount % Amount %
Properties and intangible assets: Proceeds of the disposal of properties:
Sunplus mMobile Limited $700 51 $- - Sunplus mMobile 74 5 253 4 Sunplus Core 55 4 743 12 Sunplus mMedia 28 2 2,972 48 Sunplus Innovation 11 1 952 16 Generalplus - - 524 9 Orise - - 291 5
$868 63 $5,735 94
Acquisition of fixed assets: Sunplus Innovation $200 - $- - Sunplus mMedia 15 - - -
$215 - $- -

77
Compensation of directors, supervisors and management personnel:
Year Ended December 31 2008 2007
Salaries $29,356 $25,570 Special compensation 138 258 Bonus - 45,932
$29,494 $71,760
The compensation of directors, supervisors and management personnel for the year ended December 31, 2007 included the bonuses appropriated from earnings for 2007 which had been approved by shareholders in their annual meeting held in 2008.
22. SIGNIFICANT LONG-TERM OPERATING LEASES
The Company leases land from the Science-Based Industrial Park Administration under renewable agreements expiring in July 2015, December 2020 and 2021, with annual rentals aggregating $7,862 thousand.
Future annual minimum rentals under the leases are as follows: Year Amount 2009 $7,862 2010 7,862 2011 7,862 2012 7,862 2013 7,862 2014 and thereafter 40,557
$79,867 23. GAIN ON SETTLEMENT COMPENSATION
In February 2003, the Company bought optoelectronic storage department of Oak Technology, Inc. (Oak Technology Inc. merged with Zoran Company) and acquired its related patent. Therefore, in the settlement of the patent authorization between Mediatek and Zoran, the Company and its subsidiary, Sunext, are able to use Mediatek Inc.’s patents of PC optoelectronic storage, Mediatek authorizing this using right of the patent to Zoran, and can obtain part of solatium.
24. ADDITIONAL DISCLOSURES
Following are the additional disclosures required for the Company and its investees by the Securities and Futures Bureau:
a. Endorsement/guarantee provided: Table 1 (attached) b. Marketable securities held: Table 2 (attached) c. Marketable securities acquired and disposed of at costs or prices of at least NT$100 million or
20% of the paid-in capital: Table 3 (attached) d. Acquisition of long-term investments costs of at least NT$100 million or 20% of the paid-in
capital: Table 4 (attached) e. Total purchase from or sale to related parties amounting to at least NT$100 million or 20% of
the paid-in capital: Table 5 (attached) f. Receivable from related parties amounting to at least NT$100 million or 20% of the paid-in
capital: Table 6 (attached) g. Names, locations, and related information of investees on which the Company exercises
significant influences: Table 7 (attached) h. Forward exchange contracts of investee company: Table 8 (attached) i. Investment in Mainland China: Table 9 (attached)

78
25. SEGMENT INFORMATION a. Industry: The Company only manufactures and sells value-added consumer integrated circuits
(ICs). b. Geographic information: Not applicable. c. Export sales:
Year Ended December 31
Area 2008 2007 Southeast Asia $4,953,791 $8,015,173 Others 516,704 791,769
$5,470,495 $8,806,942
d. Sales to customer representing at least 10% of net sales: Years Ended December 31 2008 2007
Customer Amount % Amount %
A $1,672,714 27 $3,071,671 33 B 1,417,376 23 2,308,230 25

79
TABLE 1 SUNPLUS TECHNOLOGY COMPANY LIMITED ENDORSEMENT/GUARANTEE PROVIDED YEAR ENDED DECEMBER 31, 2008 (In Thousands of New Taiwan Dollars, Unless Stated Otherwise)
Counter-party No. Endorsement/
Guarantee Provider Name Nature of Relationship
Limits on Each Counter-party’s Endorsement/
Guarantee Amounts
Maximum Balance for the
Period Ending Balance
Value of Collateral Property, Plant, or
Equipment
Percentage of Accumulated Amount of Collateral to Net Equity of the
Latest Financial Statement
Maximum Collateral/ Guarantee Amounts
Allowable 0 Sunplus Technology
Company Limited Sunext Technology Co., Ltd. 79% Subsidiary $1,095,042
(Note 1) $760,000 $630,000 $- 5.75% $2,190,084
(Note 2) Sunplus mMobile Inc. 91% Subsidiary 1,095,042
(Note 1) 577,293 577,293 - 5.27% 2,190,084
(Note 2) Sunplus Technology (Shanghai)
Co., Ltd. 99% Indirect subsidiary
1,095,042 (Note 1)
329,825 306,000 - 2.79% 2,190,084 (Note 2)
Sunplus mMedia Inc. 78% Subsidiary 1,095,042 (Note 1)
479,442 227,000 - 2.07% 2,190,084 (Note 2)
Sunplus Innovation Technology Inc.
84% Subsidiary 1,095,042 (Note 1)
323,550 130,000 - 1.19% 2,190,084 (Note 2)
Sunplus Core Technology Inc. 57% Subsidiary 1,095,042 (Note 1)
60,000 60,000 - 0.55% 2,190,084 (Note 2)
Generalplus Technology Inc. Equity-method investee
1,095,042 (Note 1)
30,000 30,000 - 0.27% 2,190,084 (Note 2)
Waveplus Technology Co., Ltd. Equity-method investee
1,095,042 (Note 1)
20,000 20,000 - 0.18% 2,190,084 (Note 2)
Lin Shin Technology Co., Ltd. Indirect equity-method investee
1,095,042 (Note 1)
10,000 10,000 - 0.09% 2,190,084 (Note 2)
1 Sunplus mMedia Inc. Sunplus mMobile Inc. Equity-method investee of Sunplus mMobile Inc.
127,362 (Note 3)
120,000
-
- - 254,725 (Note 4)
Note 1: For each transaction entity, the amount should not exceed 10% of the endorsement/guarantee provider’s net equity. Note 2: The amount should not exceed 20% of the endorsement/guarantee provider’s net equity. Note 3: For each transaction entity, the amount should not exceed 10% of the endorsement/guarantee provider’s net equity based on the latest audited or reviewed financial statements. Note 4: The amount should not exceed 20% of the endorsement/guarantee provider’s net equity based on the latest audited or reviewed financial statements.
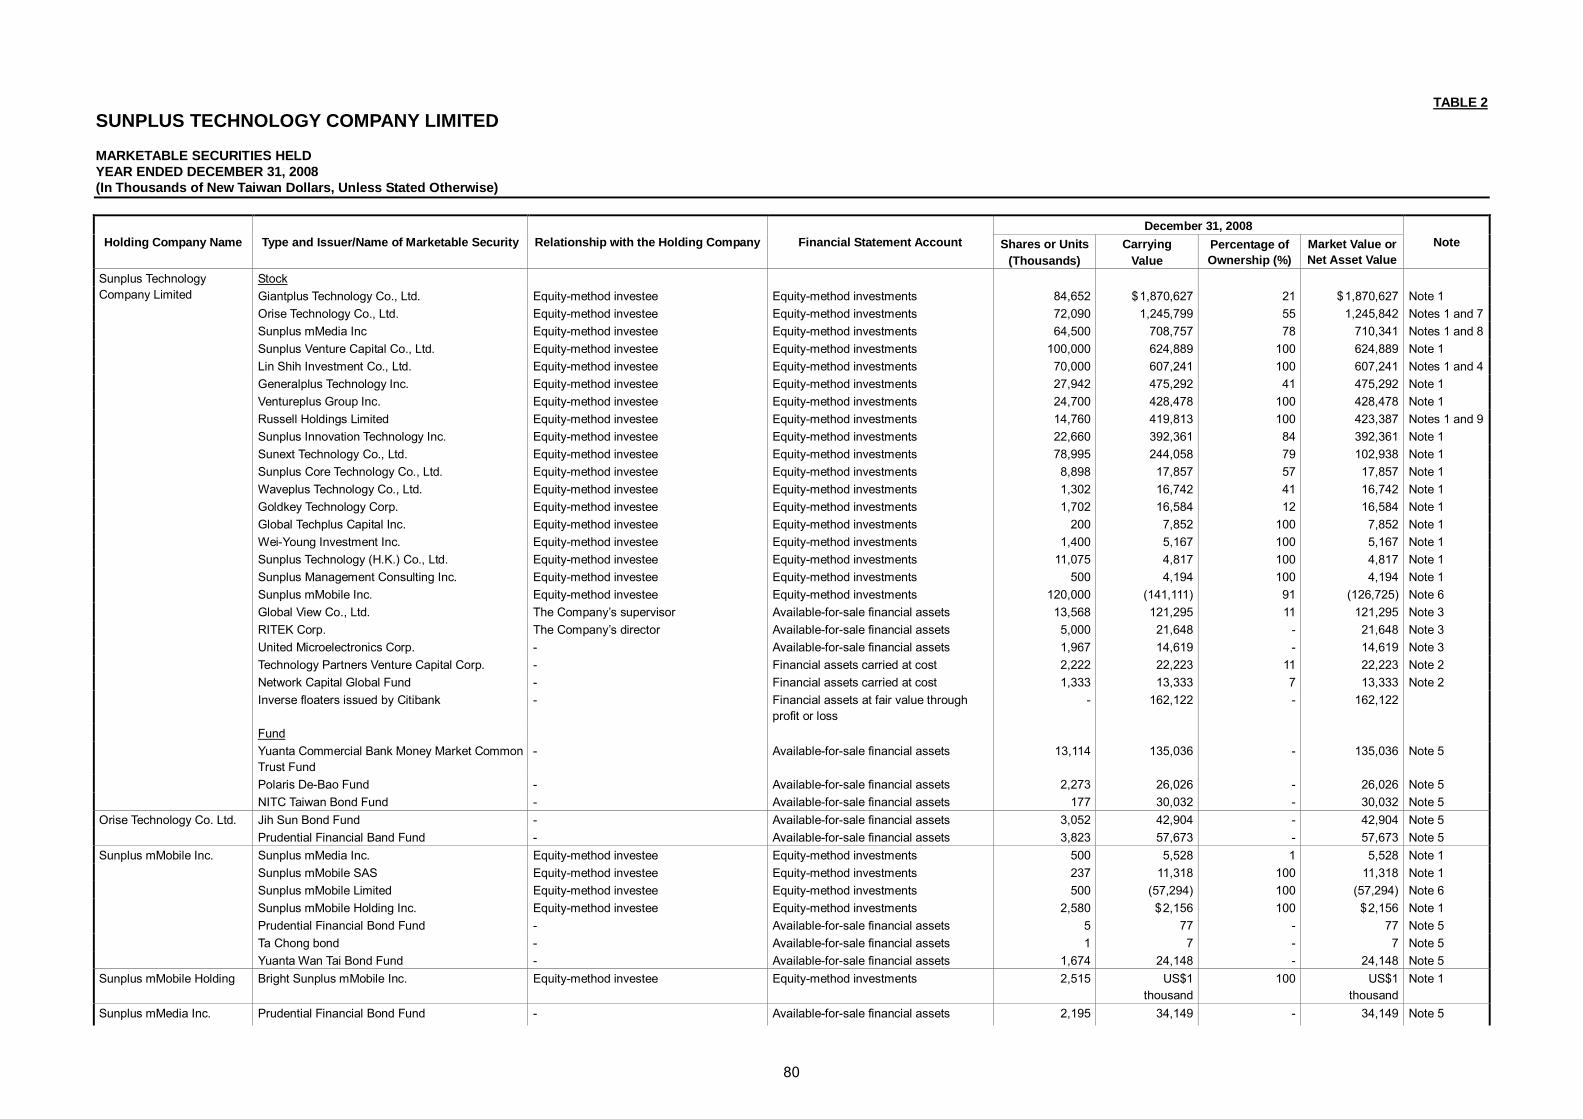
80
TABLE 2 SUNPLUS TECHNOLOGY COMPANY LIMITED MARKETABLE SECURITIES HELD YEAR ENDED DECEMBER 31, 2008 (In Thousands of New Taiwan Dollars, Unless Stated Otherwise)
December 31, 2008 Holding Company Name Type and Issuer/Name of Marketable Security Relationship with the Holding Company Financial Statement Account Shares or Units
(Thousands) Carrying
Value Percentage of Ownership (%)
Market Value or Net Asset Value
Note
Stock Giantplus Technology Co., Ltd. Equity-method investee Equity-method investments 84,652 $ 1,870,627 21 $ 1,870,627 Note 1 Orise Technology Co., Ltd. Equity-method investee Equity-method investments 72,090 1,245,799 55 1,245,842 Notes 1 and 7 Sunplus mMedia Inc Equity-method investee Equity-method investments 64,500 708,757 78 710,341 Notes 1 and 8 Sunplus Venture Capital Co., Ltd. Equity-method investee Equity-method investments 100,000 624,889 100 624,889 Note 1 Lin Shih Investment Co., Ltd. Equity-method investee Equity-method investments 70,000 607,241 100 607,241 Notes 1 and 4 Generalplus Technology Inc. Equity-method investee Equity-method investments 27,942 475,292 41 475,292 Note 1 Ventureplus Group Inc. Equity-method investee Equity-method investments 24,700 428,478 100 428,478 Note 1 Russell Holdings Limited Equity-method investee Equity-method investments 14,760 419,813 100 423,387 Notes 1 and 9 Sunplus Innovation Technology Inc. Equity-method investee Equity-method investments 22,660 392,361 84 392,361 Note 1 Sunext Technology Co., Ltd. Equity-method investee Equity-method investments 78,995 244,058 79 102,938 Note 1 Sunplus Core Technology Co., Ltd. Equity-method investee Equity-method investments 8,898 17,857 57 17,857 Note 1 Waveplus Technology Co., Ltd. Equity-method investee Equity-method investments 1,302 16,742 41 16,742 Note 1 Goldkey Technology Corp. Equity-method investee Equity-method investments 1,702 16,584 12 16,584 Note 1 Global Techplus Capital Inc. Equity-method investee Equity-method investments 200 7,852 100 7,852 Note 1 Wei-Young Investment Inc. Equity-method investee Equity-method investments 1,400 5,167 100 5,167 Note 1 Sunplus Technology (H.K.) Co., Ltd. Equity-method investee Equity-method investments 11,075 4,817 100 4,817 Note 1 Sunplus Management Consulting Inc. Equity-method investee Equity-method investments 500 4,194 100 4,194 Note 1 Sunplus mMobile Inc. Equity-method investee Equity-method investments 120,000 (141,111) 91 (126,725) Note 6 Global View Co., Ltd. The Company’s supervisor Available-for-sale financial assets 13,568 121,295 11 121,295 Note 3 RITEK Corp. The Company’s director Available-for-sale financial assets 5,000 21,648 - 21,648 Note 3 United Microelectronics Corp. - Available-for-sale financial assets 1,967 14,619 - 14,619 Note 3 Technology Partners Venture Capital Corp. - Financial assets carried at cost 2,222 22,223 11 22,223 Note 2 Network Capital Global Fund - Financial assets carried at cost 1,333 13,333 7 13,333 Note 2 Inverse floaters issued by Citibank - Financial assets at fair value through
profit or loss - 162,122 - 162,122
Fund Yuanta Commercial Bank Money Market Common Trust Fund
- Available-for-sale financial assets 13,114 135,036 - 135,036 Note 5
Polaris De-Bao Fund - Available-for-sale financial assets 2,273 26,026 - 26,026 Note 5
Sunplus Technology Company Limited
NITC Taiwan Bond Fund - Available-for-sale financial assets 177 30,032 - 30,032 Note 5 Jih Sun Bond Fund - Available-for-sale financial assets 3,052 42,904 - 42,904 Note 5 Orise Technology Co. Ltd. Prudential Financial Band Fund - Available-for-sale financial assets 3,823 57,673 - 57,673 Note 5 Sunplus mMedia Inc. Equity-method investee Equity-method investments 500 5,528 1 5,528 Note 1 Sunplus mMobile SAS Equity-method investee Equity-method investments 237 11,318 100 11,318 Note 1 Sunplus mMobile Limited Equity-method investee Equity-method investments 500 (57,294) 100 (57,294) Note 6 Sunplus mMobile Holding Inc. Equity-method investee Equity-method investments 2,580 $ 2,156 100 $ 2,156 Note 1 Prudential Financial Bond Fund - Available-for-sale financial assets 5 77 - 77 Note 5 Ta Chong bond - Available-for-sale financial assets 1 7 - 7 Note 5
Sunplus mMobile Inc.
Yuanta Wan Tai Bond Fund - Available-for-sale financial assets 1,674 24,148 - 24,148 Note 5 Sunplus mMobile Holding Bright Sunplus mMobile Inc. Equity-method investee Equity-method investments 2,515 US$1
thousand 100 US$1
thousand Note 1
Sunplus mMedia Inc. Prudential Financial Bond Fund - Available-for-sale financial assets 2,195 34,149 - 34,149 Note 5

81
December 31, 2008 Holding Company Name Type and Issuer/Name of Marketable Security Relationship with the Holding Company Financial Statement Account Shares or Units
(Thousands) Carrying
Value Percentage of Ownership (%)
Market Value or Net Asset Value
Note
Capital Income Fund - Available-for-sale financial assets 1,759 27,040 - 27,040 Note 5 Yuanta Wan Tai Bond Fund - Available-for-sale financial assets 3,466 50,014 - 50,014 Note 5 NITC Taiwan Bond Fund - Available-for-sale financial assets 1,081 15,729 - 15,729 Note 5 Stock Goldkey Technology Corp. Equity-method investee Equity-method investments 1,866 18,198 13 18,198 Note 1 Waveplus Technology Co., Ltd. Equity-method investee Equity-method investments 522 6,709 16 6,709 Note 1 Sunext Technology Co., Ltd. Equity-method investee Equity-method investments 6,499 8,500 7 8,500 Note 1 Generalplus Technology Inc. Equity-method investee Equity-method investments 12,653 215,210 19 215,210 Note 1 Sunplus Core Technology Co., Ltd. Equity-method investee Equity-method investments 2,000 4,013 13 4,013 Note 1 Sunplus mMobile Inc. Equity-method investee Equity-method investments 3,055 12,112 2 (3,683) Note 1 Sunplus mMedia Inc. Equity-method investee Equity-method investments 2,483 31,457 3 31,457 Note 1 Sunplus Innovation Technology Inc. Equity-method investee Equity-method investments 452 6,619 2 6,619 Note 1 Sunplus Technology Company Limited Parent company Available-for-sale financial assets 3,560 46,814 1 46,814 Note 3 Ability Enterprise Co., Ltd. - Available-for-sale financial assets 5,120 105,480 1 105,480 Note 3 RITEK Corp. - Available-for-sale financial assets 833 3,608 - 3,608 Note 3 Elite Advanced Laser Corp. - Available-for-sale financial assets 667 6,666 1 6,666 Note 3 AIPTEK International Inc. - Available-for-sale financial assets 199 1,022 - 1,022 Note 3 Radiant Innovation Inc. - Available-for-sale financial assets 1,933 27,346 8 27,346 Note 3 Minton Optic Industry Co., Ltd. - Financial assets carried at cost 4,272 79,643 7 79,643 Note 2 NCTU Spring Venture Capital Co., Ltd. - Financial assets carried at cost 2,000 - 6 - Note 2 GemFor Tech. Co., Ltd. - Financial assets carried at cost 831 10,685 6 10,685 Note 2 MaxEmil Photonics Corporation - Financial assets carried at cost 426 8,273 2 8,273 Note 2 WayTech Development Inc. - Financial assets carried at cost 1,500 - 5 - Note 2 Miracle Technology Co., Ltd. - Financial assets carried at cost 1,295 13,940 9 13,940 Note 2 Socle Technology Corp. - Financial assets carried at cost 250 6,250 - 6,250 Note 2 Glokie Technology Corp. - Financial assets carried at cost 2,300 23,000 14 23,000 Note 2 Genius Vision Digital Co., Ltd. - Financial assets carried at cost 600 6,000 13 6,000 Note 2
Lin Shih Investment Co., Ltd.
Lingri Technology Co., Ltd. - Financial assets carried at cost 304 3,040 19 3,040 Note 2 Stock Jet Focus Limited Equity-method investee Equity-method investments 4,794 US$(350)
thousand 44 US$(350)
thousand Note 6
Synerchip Co., Ltd. Equity-method investee Equity-method investments 4,236 US$667 thousand
25 US$667 thousand
Note 1
Sunext Technology Co., Ltd. Equity-method investee Equity-method investments 855 US$2,124 thousand
1 US$34 thousand
Note 1
Shang-Hai Fudan Microelectronics Company Limited
- Available-for-sale financial assets 7,280 US$301 thousand
- US$301 thousand
Note 3
InveStar Excelsus Venture Capital (Int’l), Inc., LDC - Financial assets carried at cost - US$- thousand
19 US$- thousand
Note 2
OZ Optics Ltd. - Financial assets carried at cost 1,000 US$250 thousand
8 US$250 thousand
Note 2
Aicent, Inc. - Financial assets carried at cost 1,000 US$500 thousand
2 US$500 thousand
Note 2
Ortega InfoSystem, Inc. - Financial assets carried at cost 2,557 US$500 thousand
- US$500 thousand
Note 2
Asia B2B on line Inc. - Financial assets carried at cost 1,000 US$- thousand
3 US$- thousand
Note 2
Russell Holdings Limited
Asia Tech Taiwan Venture Fund - Financial assets carried at cost - US$2,590 thousand
5 US$2,590 thousand
Note 2

82
December 31, 2008 Holding Company Name Type and Issuer/Name of Marketable Security Relationship with the Holding Company Financial Statement Account Shares or Units
(Thousands) Carrying
Value Percentage of Ownership (%)
Market Value or Net Asset Value
Note
Ether Precision Inc. - Financial assets carried at cost 1,250 US$500 thousand
1 US$500 thousand
Note 2
Innobrige Venture Fund ILP - Financial assets carried at cost - US$1,400 thousand
- US$1,400 thousand
Note 2
Visualon Inc. - Financial assets carried at cost 377 US$200 thousand
3 US$200 thousand
Note 2
Azalea Networks Inc. - Financial assets carried at cost 850 US$1,150 thousand
2 US$1,150 thousand
Note 2
Stock Joing Technology Co., Ltd. Equity-method investee Equity-method investments 3,400 $ - 39 $ - Note 1 Waveplus Technology Co., Ltd. Equity-method investee Equity-method investments 387 4,973 12 4,973 Note 1 Sunext Technology Co., Ltd. Equity-method investee Equity-method investments 8,571 11,169 9 11,169 Note 1 Han Young Technology Co., Ltd. Equity-method investee Equity-method investments 420 1,780 70 1,780 Note 1 Generalplus Technology Inc. Equity-method investee Equity-method investments 2,920 49,672 4 49,672 Note 1 Orise Technology Co., Ltd. Equity-method investee Equity-method investments 865 14,478 1 14,478 Note 1 Sunplus Core Technology Co., Ltd. Equity-method investee Equity-method investments 2,000 4,013 13 4,013 Note 1 Sunplus mMobile Inc. Equity-method investee Equity-method investments 142 2,100 - (175) Note 1 Sunplus mMedia Inc. Equity-method investee Equity-method investments 10,000 109,845 12 109,845 Note 1 King Yuan Electronics Co., Ltd. - Available-for-sale financial assets 2,435 16,696 - 16,696 Note 3 AIPTEK International Inc. - Available-for-sale financial assets 1,172 6, 013 1 6, 013 Note 3 Ability Enterprise Co., Ltd. - Available-for-sale financial assets 3,674 75,680 - 75,680 Note 3 Radiant Innovation Inc. - Available-for-sale financial assets 742 10,498 3 10,498 Note 3 Elite Advanced Laser Corp. - Available-for-sale financial assets 166 1,663 - 1,663 Note 3 eWave System, Inc. - Financial assets carried at cost 1,833 - 22 - Note 2 Softchina Venture Capital Corp. - Financial assets carried at cost 407 - 8 - Note 2 Information Technology Total Services - Financial assets carried at cost 51 - - - Note 2 Book4u Company Limited - Financial assets carried at cost 9 - - - Note 2 VenGlobal International Fund - Financial assets carried at cost 1 - 3 - Note 2 Simple Act Inc. - Financial assets carried at cost 1,900 19,000 10 19,000 Note 2 Feature Integration Technology Inc. - Financial assets carried at cost 1,850 24,237 6 24,237 Note 2 Chiabon Venture Capital Co., Ltd. - Financial assets carried at cost 5,000 50,000 5 50,000 Note 2 Cyberon Corporation - Financial assets carried at cost 1,170 13,691 18 13,691 Note 2 WayTech Development Inc. - Financial assets carried at cost 1,000 - 4 - Note 2 Miracle Technology Co., Ltd. - Financial assets carried at cost 1,303 $ 14,025 9 $ 14,025 Note 2 Socle Technology Corp. - Financial assets carried at cost 550 13,750 1 13,750 Note 2 MaxEmil Photonics Corp. - Financial assets carried at cost 419 12,485 2 12,485 Note 2 Minton Optic Industry Co., Ltd. - Financial assets carried at cost 5,000 75,000 8 75,000 Note 2 Capella Micro System, Inc. - Financial assets carried at cost 630 9,450 3 9,450 Note 2 Smec Media & Entertainment Corp. - Financial assets carried at cost 2,000 6,667 7 6,667 Note 2 VISCO Inc. - Financial assets carried at cost 2,130 22,365 5 22,365 Note 2
Sunplus Venture Capital Co., Ltd.
Azalea Networks Inc - Financial assets carried at cost 280 12,923 1 12,923 Note 2 Stock Generalplus Technology
Inc. Generalplus International (Samoa) Inc. Subsidiary of Generalplus Technology Inc. Equity-method investments 3,090 11,174 100 11,174 Note 1 Stock Generalplus International
(Samoa) Inc. Generalplus (Mauritius) Inc. Subsidiary of Generalplus International (Samoa) Inc.
Equity-method investments 3,090 US$340 thousand
100 US$340 thousand
Note 1
Stock Generalplus (Mauritius) Inc. Generalplus Technology (Shenzhen) Co., Ltd. Subsidiary of Generalplus (Mauritius) Inc. Equity-method investments - US$263
thousand 100 US$263
thousand Note 1

83
December 31, 2008 Holding Company Name Type and Issuer/Name of Marketable Security Relationship with the Holding Company Financial Statement Account Shares or Units
(Thousands) Carrying
Value Percentage of Ownership (%)
Market Value or Net Asset Value
Note
Generalplus Technology (Hong Kong) Co., Ltd. Subsidiary of Generalplus (Mauritius) Inc. Equity-method investments - US$77 thousand
100 US$77 thousand
Note 1
Stock Sunext Technology Co., Ltd. Great Sun Corp. Subsidiary of Sunext Technology Co., Ltd. Equity-method investments 1 ,750 36,697 100 36,697 Note 1
Stock Great Sun Corp. Sunext (Mauritius) Inc. Subsidiary of Great Sun Corp. Equity-method investments 750 US$119
thousand 100 US$119
thousand Note 1
Stock Sunext (Mauritius) Inc. Sunext Technology (Shanghai) Co., Ltd. Subsidiary of Sunext (Mauritius) Inc. Equity-method investments - US$118
thousand 100 US$118
thousand Note 1
Stock Waveplus Technology Co., Ltd. Waveplus Holding Ltd. Subsidiary of Waveplus Technology Co.,
Ltd. Equity-method investments 1,000 (51) 100 (51) Note 6
Stock Waveplus Holding Ltd. Waveplus Design, Inc. Subsidiary of Waveplus Holding Ltd. Equity-method investments 1,000 US$-
thousand 100 US$-
thousand Note 1
Stock Ventureplus Group Inc. Ventureplus Mauritius Inc. Subsidiary of Ventureplus Group Inc. Equity-method investments 24,700 US$13,068
thousand 100 US$13,068
thousand Note 1
Stock Ventureplus Mauritius Inc. Ventureplus Cayman Inc. Subsidiary of Ventureplus Mauritius Inc. Equity-method investments 24,700 US$13,072
thousand 100 US$13,072
thousand Note 1
Stock Sunplus Technology (Shanghai) Co., Ltd. Subsidiary of Ventureplus Cayman Inc. Equity-method investments - US$8,894
thousand 99 US$8,894
thousand Note 1
Sunplus Pro-tek Technology (Shenzhen) Co., Ltd. Subsidiary of Ventureplus Cayman Inc. Equity-method investments - US$2,255 thousand
100 US$2,255 thousand
Note 1
SunMedia Technology Co., Ltd. Subsidiary of Ventureplus Cayman Inc. Equity-method investments - US$1,545 thousand
100 US$1,545 thousand
Note 1
Ventureplus Cayman Inc. .
Sunplus App Technology Co., Ltd. Subsidiary of Ventureplus Cayman Inc. Equity-method investments - US$364 thousand
80 US$364 thousand
Note 1
Wei-Young Investment Inc. UNIWILL Co., Ltd. - Available-for-sale financial assets 508 3,052 - 3,052 Note 3 Global Techplus Capital Inc. Techplus Capital Samoa Inc. Global Techplus Capital Inc. Equity-method investments - US$-
thousand 100 US$-
thousand Note 1
Note 1: The net asset value was based on audit financial data. Note 2: The market value is based on carrying value as of December 31, 2008. Note 3: The market value is based on the closing price as of December 31, 2008. Note 4: The investment carrying value excluded the carrying value of $63,401 thousand of the shares of Sunplus Technology Company Limited held by its subsidiary. Note 5: The market value was based on the net asset value of fund as of December 31, 2008. Note 6: The credit balance on the carrying value of the equity-method investment is reported as other current liabilities. Note 7: Includes deferred credits $43 thousand. Note 8: Includes deferred credit $1,584 thousand. Note 9: Includes deferred credit $3,574 thousand. Note 10: As of December 31, 2008, the above marketable securities, except the carrying value $44,505 of the Sunplus Technology Company Limited holding by Lin Shih Investment Co., Ltd., had not been pledged or mortgaged.
(Concluded)

84
TABLE 3 SUNPLUS TECHNOLOGY COMPANY LIMITED MARKETABLE SECURITIES ACQUIRED AND DISPOSED OF AT COSTS OR PRICES OF AT LEAST NT$100 MILLION OR 20% OF THE PAID-IN CAPITAL YEAR ENDED DECEMBER 31, 2008 (In Thousands of New Taiwan Dollars, Unless Stated Otherwise)
Beginning Balance Acquisition Disposal Ending Balance Company Name Name/Type and Issuer of
Marketable Security Financial Statement Account Units (Thousands) Amount Units
(Thousands) Amount Units (Thousands) Amount Carrying
Value Gain (Loss) on Disposal
Units (Thousands)
Amount (Note 1)
Cathay Bond Fund Available-for-sale financial assets - $- 10,549 $125,000 10,549 $125,238 $125,000 $238 - $- Sunext Technology Co., Ltd. Equity-method investments 12,600 (98,717) 74,270 820,705 7,875
(Note 6) - - - 78,995 244,058
(Note 3) Giantplus Technology Co., Ltd. Equity-method investments 76,317 1,171,730 6,685 235,980 - - - - 84,652
(Note 5) 1,870,627
(Note 3) JF TAIWAN Bond Available-for-sale financial assets - - 15,769 245,000 15,769 245,494 245,000 494 - - NITC Taiwan Bond Fund Available-for-sale financial assets - - 26,860 386,000 26,800 386,737 386,000 737 - - NITC Bond Fund Available-for-sale financial assets 1,496 250,000 1,766 299,000 3,085 519,480 519,000 480 177 30,032 Tasihin Lucky Fund Available-for-sale financial assets 30,224 315,000 31,961 334,000 62,186 649,000 650,356 1,356 - - Polaris De-Bao Fund Available-for-sale financial assets - - 11,963 136,000 9,690 110,461 110,000 461 2,273 26,026 IBT 1699 Bond Fund Available-for-sale financial assets - - 30,308 384,000 30,308 387,007 384,000 3,007 - - ING Taiwan Select Bond Fund Available-for-sale financial assets - - 25,660 299,000 25,660 299,182 299,000 182 - - Prudential Financial Bond Fund Available-for-sale financial assets - - 10,146 152,000 101,46 152,563 152,000 563 - - Polaris De-Li Fund Available-for-sale financial assets - - 19,294 299,000 19,294 299,189 299,000 189 - - Harvatek Corp. Available-for-sale financial assets 4,896 37,489
(Note 2) - - 4,896 202,883 37,489
(Note 2) 165,394 - -
Yuanta Commer Cial Bank Money Market Common Trust Fund
Available-for-sale financial assets - - 13,114 135,000 - - - - 13,114 135,036
Sunplus Technology Company Limited
Sunplus mMedia Inc. Equity-method investments - - 64,500 752,579 - - - - 64,500 708,757 (Note 3)
Jih Sun Bond NITC Taiwan Bond Fund
Available-for-sale financial assets Available-for-sale financial assets
5,031 6,731
69,606 96,369
49,227 43,559
685,667 628,798
51,206 50,290
713,794 726,875
712,419 725,146
1,375 1,729
3,052 -
42,904 -
Fubon Chi-Hsiang Fund Available-for-sale financial assets 6,334 78,703 26,094 352,612 32,428 432,249 431,298 951 - - Tasihin Lucky Fund Available-for-sale financial assets 1,731 18,046 18,409 193,174 20,140 211,886 211,215 671 - - Prudential Financial Bond Fund Available-for-sale financial assets 6,956 103,256 35,656 533,020 38,789 580,020 578,751 1,269 3,823 57,673 Capital Income Fund Available-for-sale financial assets - - 10,006 152,595 10,006 153,095 152,595 500 - - IBT 1699 Bond Fund Available-for-sale financial assets 5,166 65,080 11,894 151,259 17,060 217,089 216,324 765 - - Hua Nan Phoenix Bond Fund Available-for-sale financial assets - - 12,300 190,130 12,300 190,480 190,130 350 - - Yuanta Wan-Tai Bond Fund Available-for-sale financial assets - - 9,644 138,104 9,644 138,412 138,104 308 - - UPAMC Global Fixed Income Selection Fund
Available-for-sale financial assets 10,068 157,799 4,077 64,000 14,145 222,247 221,762 485 - -
Polaris De-Li Fund Available-for-sale financial assets - - 19,576 302,359 19,576 303,004 302,359 645 - -
Orise Technology Co. Ltd.
ING Taiwan Bond Fund Available-for-sale financial assets 1,834 28,078 10,255 157,503 12,089 185,945 185,575 370 - - Polaris De-Bao Fund Polaris De-Li Fund
Available-for-sale financial assets Available-for-sale financial assets
- -
- -
14,326 14,006
162,000 216,000
14,326 14,006
162,620 216,618
162,000 216,000
620 618
- -
- -
Ta Chong Bond Available-for-sale financial assets - - 9,609 128,700 9,609 129,042 128,700 342 - -
Generalplus Technology Inc.
PCA Wall Pool Fund Available-for-sale financial assets - - 13,067 167,700 13,067 168,155 167,700 455 - - Taiwan Nano Electro-Optical Technology Co., Ltd.
Available-for-sale financial assets 3,994 46,595 (Note 2)
- - 3,994 128,206 46,595 (Note 2)
81,611 - - Sunplus Venture Capital Co., Ltd.
Sunplus mMedia Inc. Equity-method investments - - 10,000 116,679 - - - - 10,000 109,845 (Note 3)
Ta Chong Bond Available-for-sale financial assets 19,442 257,316 - - 19,442 258,137 257,316 821 - - Sunplus mMedia Inc. Prudential Financial Bond Fund Available-for-sale financial assets 2,668 39,604 4,175 62,500 6,843 102,907 102,000 907 - -

85
Beginning Balance Acquisition Disposal Ending Balance Company Name Name/Type and Issuer of
Marketable Security Financial Statement Account Units (Thousands) Amount Units
(Thousands) Amount Units (Thousands) Amount Carrying
Value Gain (Loss) on Disposal
Units (Thousands)
Amount (Note 1)
Stock Great Sun Corp. Sunext Design, Inc. Equity-method investments 1,000 US$932
thousand - - 1,000 US$9,881
thousand US$40
thousand US$9,841 thousand
- -
Sunplus Innovation Technology Inc.
Dresdner Bond Dam Fund Available-for-sale financial assets - $- 13,337 $158,000 13,337 $158,522 $158,000 $522 - $-
Sunplus mMobile Inc. Sunplus mMedia Inc. Equity-method investments 75,000 1,157,851 - - 74,500 867,000 851,667 15,333 (Note 4)
500 5,528 (Note 3)
Note 1: Includes the valuation gains (losses) on financial assets. Note 2: Excludes the valuation gains (losses) on financial assets. Note 3: The carrying value of the equity-method investment as of December 31, 2008. Note 4: To be reported as capital surplus under an interpretation issued by the Accounting Research and Development Foundation. Note 5: Includes stock dividends. Note 6: Offset of deficit against capital.
Concluded)

86
TABLE 4 SUNPLUS TECHNOLOGY COMPANY LIMITED ACQUISITION OF LONG-TERM INVESTMENTS COSTS OF AT LEAST NT$100 MILLION OR 20% OF THE PAID-IN CAPITAL DECEMBER 31, 2008 (In Thousands of New Taiwan Dollars, Unless Stated Otherwise)
Prior Transaction of Company Related Counter-party Company Name Types of Property Transaction Date
Transaction Amount
(Payment)/ Sale Term
Counter-party Nature of Relationships Ownership Relationships Transfer Date Amount
Price Reference
Purpose of Acquisition
Other Terms
Sunext Technology Co., Ltd. 97.1 $670,000 $(670,000) Note 1 Equity-method investee
- - - $- Note 1 Equity-method investee -
Sunext Technology Co., Ltd. 97.12 150,705 (150,705) Note 2 Equity-method investee
- - - - Note 2 Equity-method investee
-
Giantplus Technology Co., Ltd. 97.1 235,980 (235,980) Note 1 Equity-method investee
- - - - Note 1 Equity-method investee
-
Sunplus Technology Company Limited
Sunplus mMedia Inc. 97.11 752,579 (752,579) Sunplus mMobile Inc. Equity-method investee
Note 3 Equity-method investee
Note 3 903,000 Note 4 Equity-method investee
-
Sunplus Venture Capital Co., Ltd.
Sunplus mMedia Inc. 97.11 116,679 (116,679) Sunplus mMobile Inc. Equity-method investee
Note 3 Equity-method investee
Note 3 140,000 Note 4 Equity-method investee
-
Sunplus mMobile Inc. Sunplus mMedia Inc. 97.11 869,258 867,000 Sunplus Technology Company Limited and Sunplus Venture Capital Co., Ltd.
Equity-method investee
- - - - Note 4 Equity-method investee
-
Note 1: Issuance of common stock for cash. Note 2: The selling prices were negotiated with agreement. Note 3: It was based on the net book value on spun-off date, Sunplus mMobile spun off its personal entertainment BU to establish a subsidiary, Sunplus mMedia in April 2007. Note 4: It was based on the net book value on trading date and supported by other auditor about price rationality.

87
TABLE 5 SUNPLUS TECHNOLOGY COMPANY LIMITED TOTAL PURCHASE FROM OR SALE TO RELATED PARTIES AMOUNTING TO AT LEAST NT$100 MILLION OR 20% OF THE PAID-IN CAPITAL YEAR ENDED DECEMBER 31, 2008 (In Thousands of New Taiwan Dollars, Unless Stated Otherwise)
Transaction Details Non-arm’s Length Transaction
Note/Account Payable or Receivable Company Name Related Party Nature of Relationship
Purchase/Sale Amount % to Total Payment Terms Unit Price Payment Terms
Ending Balance % to Total
Note
AU Optronics (Labuan) Corporation Subsidiary of AU Optronics Corp. Sale $ 1,771,765 39 Net 120 days from monthly closing dates in principle.
Note Note $ 584,316 61 -
AU Optronics Corp. The subsidiary of AUO is the Director of Orise Technology Co., Ltd.
Sale 114,550 3 Net 120 days from monthly closing dates in principle.
Note Note 20,115 2 -
Kunshan Giantplus Optoelectronics Technology Co., Ltd.
Subsidiary of Giantplus Technology Co., Ltd.
Sale 272,183 5 Net 45 days from monthly closing dates in principle.
Note Note 21,543 2 -
Orise Technology Co., Ltd.
Giantplus Technology Co., Ltd. Equity-method investee of Sunplus Technology Co., Ltd.
Sale 213,157 5 Net 45 days from monthly closing dates in principle.
Note Note 18,711 2 -
Note: The price and collection terms for products sold to related parties were similar to those for third parties.
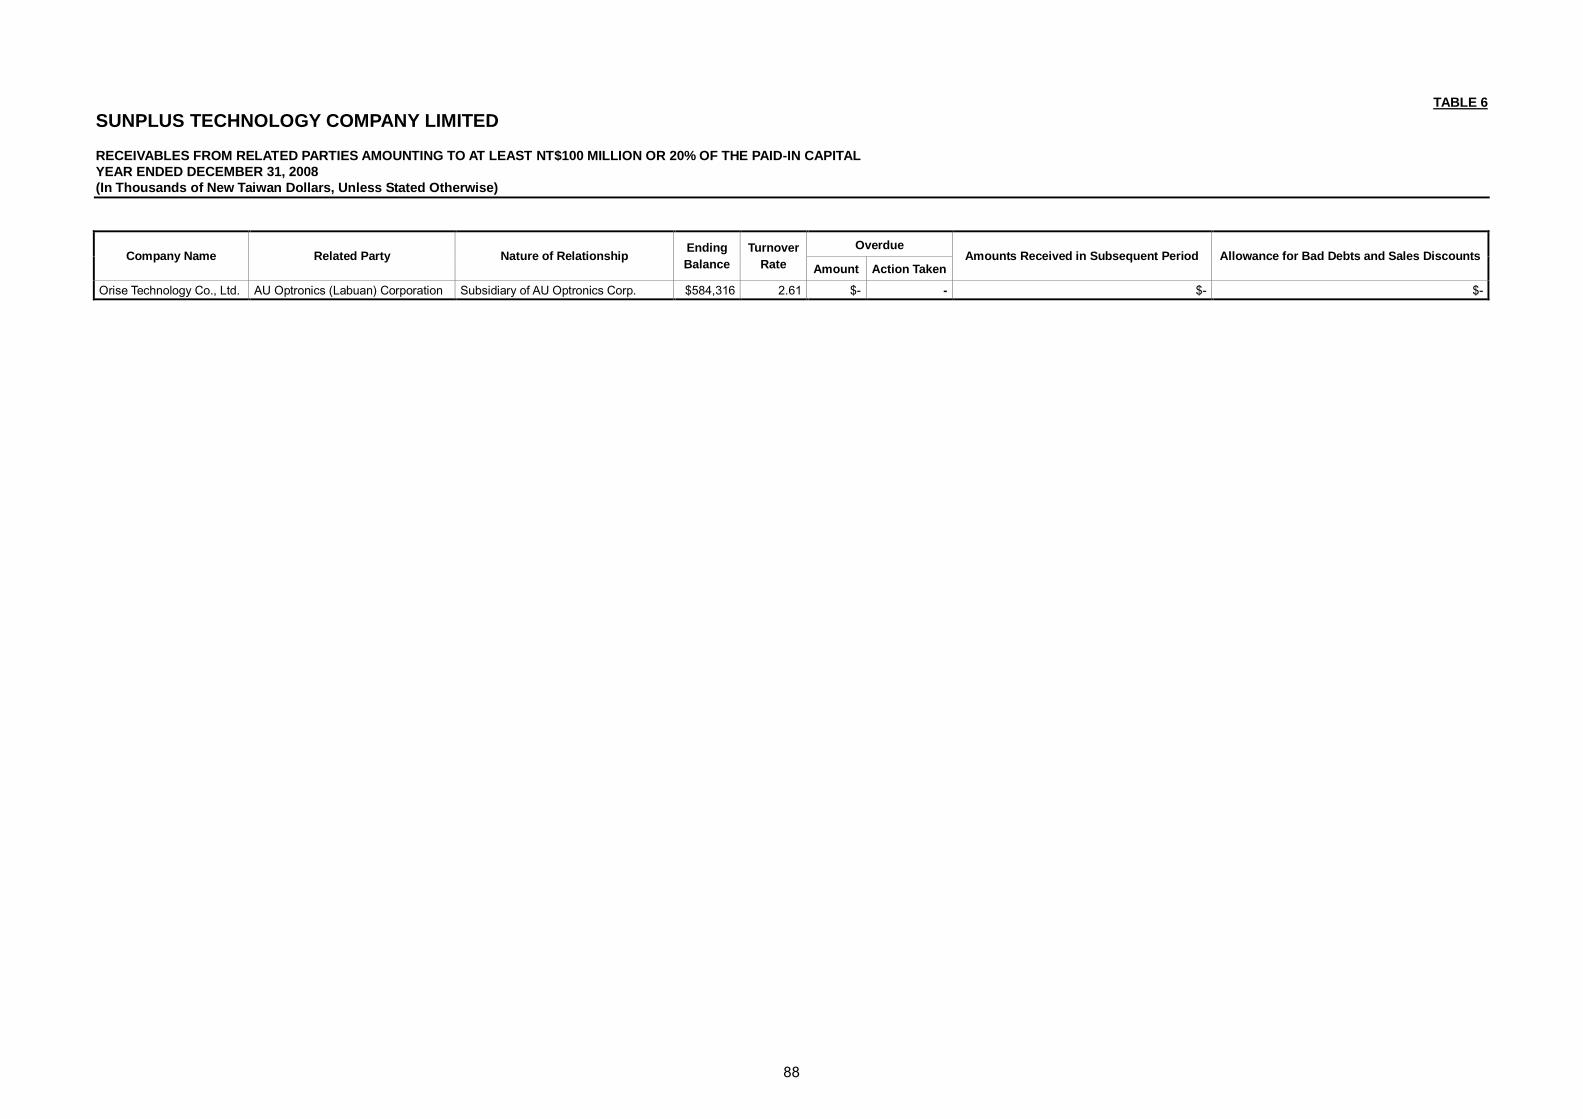
88
TABLE 6 SUNPLUS TECHNOLOGY COMPANY LIMITED RECEIVABLES FROM RELATED PARTIES AMOUNTING TO AT LEAST NT$100 MILLION OR 20% OF THE PAID-IN CAPITAL YEAR ENDED DECEMBER 31, 2008 (In Thousands of New Taiwan Dollars, Unless Stated Otherwise)
Overdue Company Name Related Party Nature of Relationship Ending
Balance Turnover
Rate Amount Action Taken Amounts Received in Subsequent Period Allowance for Bad Debts and Sales Discounts
Orise Technology Co., Ltd. AU Optronics (Labuan) Corporation Subsidiary of AU Optronics Corp. $584,316 2.61 $- - $- $-

89
TABLE 7 SUNPLUS TECHNOLOGY COMPANY LIMITED NAMES, LOCATIONS, AND RELATED INFORMATION OF INVESTEES ON WHICH THE COMPANY EXERCISES SIGNIFICANT INFLUENCES YEAR ENDED DECEMBER 31, 2008 (In Thousands of New Taiwan Dollars, Unless Stated Otherwise)
Investment Amount Balance as of December 31, 2008 Investor Investee Location Main Businesses and
Products December 31, 2008
December 31, 2007
Shares (Thousands)
Percentage of Ownership
Carrying Value
Net Income (Loss) of the
Investee
Investment Gain (Loss) Note
Giantplus Technology Co., Ltd. Tofen Chen, Miaoli, Taiwan Manufacture of TN/STN LCDs and LCD modules
$881,314 $881,314 84,652 21 $1,870,627 $307,601 $57,999 Investee
Orise Technology Co., Ltd. Hsinchu, Taiwan Design of ICs 816,719 834,092 72,090 55 1,245,799 265,446 146,333 Subsidiary Sunplus mMedia Inc. Hsinchu , Taiwan Design of ICs 752,579 - 64,500 78 708,757 (364,758) (28,867) Subsidiary Sunplus Venture Capital Co., Ltd. Hsinchu, Taiwan Investment 999,982 999,982 100,000 100 624,889 91,518 91,518 Subsidiary Lin Shih Investment Co., Ltd. Hsinchu, Taiwan Investment 699,988 699,988 70,000 100 607,241 36,358 27,884 Subsidiary Generalplus Technology Inc. Hsinchu, Taiwan Design of ICs 146,000 146,000 27,942 41 475,292 189,683 78,265 Subsidiary Ventureplus Group Inc. Belize Investment US$ 24,700
thousand US$ 19,250
thousand 24,700 100 428,478 (125,214) (125,214) Subsidiary
Russell Holdings Limited Cayman Islands, British West Indies.
Investment US$ 14,760 thousand
US$ 19,260 thousand
14,760 100 419,813 (55,098) (58,672) Subsidiary
Sunplus Innovation Technology Inc. Hsinchu, Taiwan Design of ICs 308,000 308,000 22,660 84 392,361 65,882 57,835 Subsidiary Sunext Technology Co., Ltd. Hsinchu, Taiwan Design and sale of ICs 946,705 796,000 78,995 79 244,058 61,338 43,617 Subsidiary Sunplus Core Technology Co., Ltd. Hsinchu, Taiwan Design of ICs 105,470 56,000 8,898 57 17,857 (123,362) (63,001) Subsidiary Waveplus Technology Co., Ltd. Hsinchu, Taiwan Design and sale of ICs 35,517 35,517 1,302 41 16,742 (3,649) (2,813) Subsidiary Goldkey Technology Corp. Taipei, Taiwan Design of ICs 25,541 32,836 1,702 12 16,584 34,980 4,145 Investee Global Techplus Capital Inc. Seychelles Investment US$200
thousand US$200
thousand 200 100 7,852 1,486 1,486 Subsidiary
Wei-Young Investment Inc. Hsinchu, Taiwan Investment 14,000 14,000 1,400 100 5,167 191 191 Subsidiary Sunplus Technology (H.K.) Co., Ltd. Kowloon Bay, Hong Kong International trade HK$ 11,075
thousand HK$ 11,075
thousand 11,075 100 4,817 8,864 8,864 Subsidiary
Sunplus Management Consulting Inc.
Hsinchu, Taiwan Management 5,000 5,000 500 100 4,194 (30) (30) Subsidiary
Sunplus Technology Company Limited
Sunplus mMobile Inc. Hsinchu, Taiwan Design of ICs 1,680,000 1,680,000 120,000 91 (141,111) (1,274,350 ) (1,169,111) Subsidiary Goldkey Technology Corp. Taipei, Taiwan Design of ICs 18,402 26,400 1,866 13 18,198 34,980 4,547 Investee Sunext Technology Co., Ltd. Hsinchu, Taiwan Design and sale of ICs 369,316 369,316 6,499 7 8,500 61,338 4,140 Subsidiary Waveplus Technology Co., Ltd. Hsinchu, Taiwan Design and sale of ICs 91,726 91,726 522 16 6,709 (3,649) (1,127) Subsidiary Sunplus Core Technology Co., Ltd. Hsinchu, Taiwan Design of ICs 20,000 20,000 2,000 13 4,013 (123,362) (18,751) Subsidiary SunPlus mMobile Inc. Hsinchu, Taiwan Design of ICs 42,770 65,898 3,055 2 12,112 (1,274,350 ) (35,044) Subsidiary SunPlus mMedia Inc. Hsinchu, Taiwan Design of ICs 34,755 17,147 2,483 3 31,457 (364,758) (6,310) Subsidiary Sunplus Innovation Technology Inc. Hsinchu, Taiwan Design of ICs 6,234 5,684 452 2 6,619 65,882 1,065 Subsidiary
Lin Shih Investment Co., Ltd.
Generalplus Technology Inc. Hsinchu, Taiwan Design of ICs 65,000 65,000 12,653 19 215,210 189,683 35,446 Subsidiary Joing Technology Co., Ltd. Hsinchu, Taiwan Design of ICs 51,000 51,000 3,400 39 - - - Investee Sunext Technology Co., Ltd. Hsinchu, Taiwan Design and sale of ICs 385,709 360,000 8,571 9 11,169 61,338 5,373 Subsidiary Han Young Technology Co., Ltd. Taipei, Taiwan Design of ICs 4,200 4,200 420 70 1,780 - - Subsidiary Waveplus Technology Co., Ltd. Hsinchu, Taiwan Design and sale of ICs 76,016 76,016 387 12 4,973 (3,649) (836) Subsidiary Orise Technology Co, Ltd. Hsinchu, Taiwan Design of ICs 10,800 10,800 865 1 14,478 265,446 1,723 Subsidiary Sunplus Core Technology Co., Ltd. Hsinchu, Taiwan Design of ICs 20,000 20,000 2,000 13 4,013 (123,362) (18,751) Subsidiary Generalplus Technology Inc. Hsinchu, Taiwan Design of ICs 15,000 15,000 2,920 4 49,672 189,683 8,168 Subsidiary SunPlus mMobile Inc. Hsinchu, Taiwan Design of ICs 1,988 1,988 142 - 2,100 (1,274,350 ) (1,402) Subsidiary
Sunplus Venture Capital Co., Ltd.
Sunplus mMedia Inc. Hsinchu , Taiwan Design of ICs 116,679 - 10,000 12 109,845 (364,758) (4,487) Subsidiary Russell Holdings Limited Jet Focus Limited Cayman Islands, British West
Indies Investment US$6,050
thousand US$6,050 thousand
4,794 44 US$(350) thousand
US$(618) thousand
US$- thousand
Investee

90
Investment Amount Balance as of December 31, 2008 Investor Investee Location Main Businesses and
Products December 31, 2008
December 31, 2007
Shares (Thousands)
Percentage of Ownership
Carrying Value
Net Income (Loss) of the
Investee
Investment Gain (Loss) Note
Synerchip Co., Ltd. Mauritius Investment US$3,070 thousand
US$2,070 thousand
4,236 25 US$667 thousand
US$(4,930 ) thousand
US$(1,458 ) thousand
Investee
Sunext Technology Co., Ltd. Hsinchu, Taiwan Design and sale of ICs US$2,119 thousand
US$- thousand
855 1 US$2,124 thousand
61,338 US$8 thousand
Subsidiary
Sunext Technology Co., Ltd.
Great Sun Corp. SAMOA Investment US$1,750 thousand
US$1,750 thousand
1,750 100 $36,697 $264,368 $264,368 Subsidiary
Great Sun Corp. Sunext (Mauritius) Inc. Mauritius Investment US$750 thousand
US$750 thousand
750 100 US$119 thousand
US$(105) Thousand
US$(105) thousand
Subsidiary
Sunext (Mauritius) Inc. Sunext Technology (Shanghai) Co., Ltd.
Shanghai, China Design of software US$750 thousand
US$750 thousand
- 100 US$118 thousand
US$(106) thousand
US$(106) thousand
Subsidiary
Ventureplus Group Inc. Ventureplus Mauritius Inc. Mauritius Investment US$24,700 thousand
US$19,250 thousand
24,700 100 US$13,068 thousand
US$(3,975) thousand
US$(3,975) thousand
Subsidiary
Ventureplus Mauritius Inc. Ventureplus Cayman Inc. Cayman Islands, British West Indies
Investment US$24,700 thousand
US$19,250 thousand
24,700 100
US$13,072 thousand
US$(3,975) thousand
US$(3,975) Thousand
Subsidiary
Sunplus Technology (Shanghai) Co., Ltd.
Shanghai, China Manufacture and sale of ICs. US$17,000 thousand
US$17,000 thousand
- 99 US$8,894 thousand
US$(111) thousand
US$(109) thousand
Subsidiary
Sunplus Prof-tek Technology (Shenzhen) Co., Ltd.
Shenzhen, China Development, manufacture and sale of ICs
US$4,250 thousand
US$2,250 thousand
- 100 US$2,255 thousand
US$(2,195) thousand
US$(2,195) thousand
Subsidiary
Sun Media Technology Co., Ltd. Chengdu, China Development, manufacture and sale of ICs
US$3,000 thousand
US$- thousand
- 100 US$1,545 thousand
US$(1,587) thousand
US$(1,587 ) thousand
Subsidiary
Ventureplus Cayman Inc.
Sunplus App Technology Co., Ltd. Beijing, China Development, manufacture and sale of ICs
US$450 thousand
- - 80 US$364 thousand
US$(103) thousand
US$(83) thousand
Subsidiary
Waveplus Technology Co., Ltd.
Waveplus Holding Ltd. Mauritius Investment US$500 thousand
US$500 thousand
1,000 100 (51) (2,050) (2,050) Subsidiary
Waveplus Holding Ltd. Waveplus Design, Inc. U.S.A. Design of WLANs US$500 thousand
US$500 thousand
1,000 100 - - - Subsidiary
Generalplus Technology Inc.
Generalplus International (SAMOA) Inc.
SAMOA Investment US$3,090 thousand
US$1,090 thousand
3,090 100 11,174 (64,195) (64,195) Subsidiary
Generalplus International (SAMOA) Inc.
Generalplus (Mauritius) Inc. Mauritius Investment US$3,090 thousand
US$1,090 thousand
3,090 100 US$340 thousand
US$(2,036) thousand
US$(2,036) thousand
Subsidiary
Generalplus (Mauritius) Inc.
Generalplus Technology (Shenzhen) Co., Ltd.
Shenzhen, China After-sales service US$2,700 thousand
US$700 thousand
- 100 US$263 thousand
US$(1,925) thousand
US$(1,925) thousand
Subsidiary
Generalplus Technology (Hong Kong) Inc.
Hong Kong Sales US$390 thousand
US$390 thousand
- 100 US$77 thousand
US$(117) thousand
US$(117) thousand
Subsidiary
Sunplus mMedia Inc. Hsinchu, Taiwan Design of ICs 7,000 1,050,000 500 1 5,528 (364,758) (299,722) Subsidiary Sunplus mMobile SAS France Design of ICs EUR237
thousand EUR-
thousand 237 100 11,318 360 360 Subsidiary
Sunplus mMobile Limited United Kingdom Design of ICs GBP500 thousand
GBP- thousand
500 100 (57,294) (99,527) (99,527) Subsidiary
Sunplus mMobile Inc.
Sunplus mMobile Holding Inc. SAMOA Investment US$2,580 thousand
- 2,580 100 2,156
(79,273)
(79,273)
Subsidiary
Sunplus mMobile Holding Inc.
Bright Sunplus mMobile Inc. Mauritius Research and development of Intellectual Property Rights
US$2,515 thousand
- 2,515 100 US$1 thousand
US$(2,514) thousand
US$(2,514) thousand
Subsidiary
Global Techplus Capital Inc.
Techplus Capital Samoa Inc. SAMOA Investment US$- thousand
US$150 thousand
- 100 US$- thousand
US$- thousand
US$- thousand
Subsidiary
(Concluded)
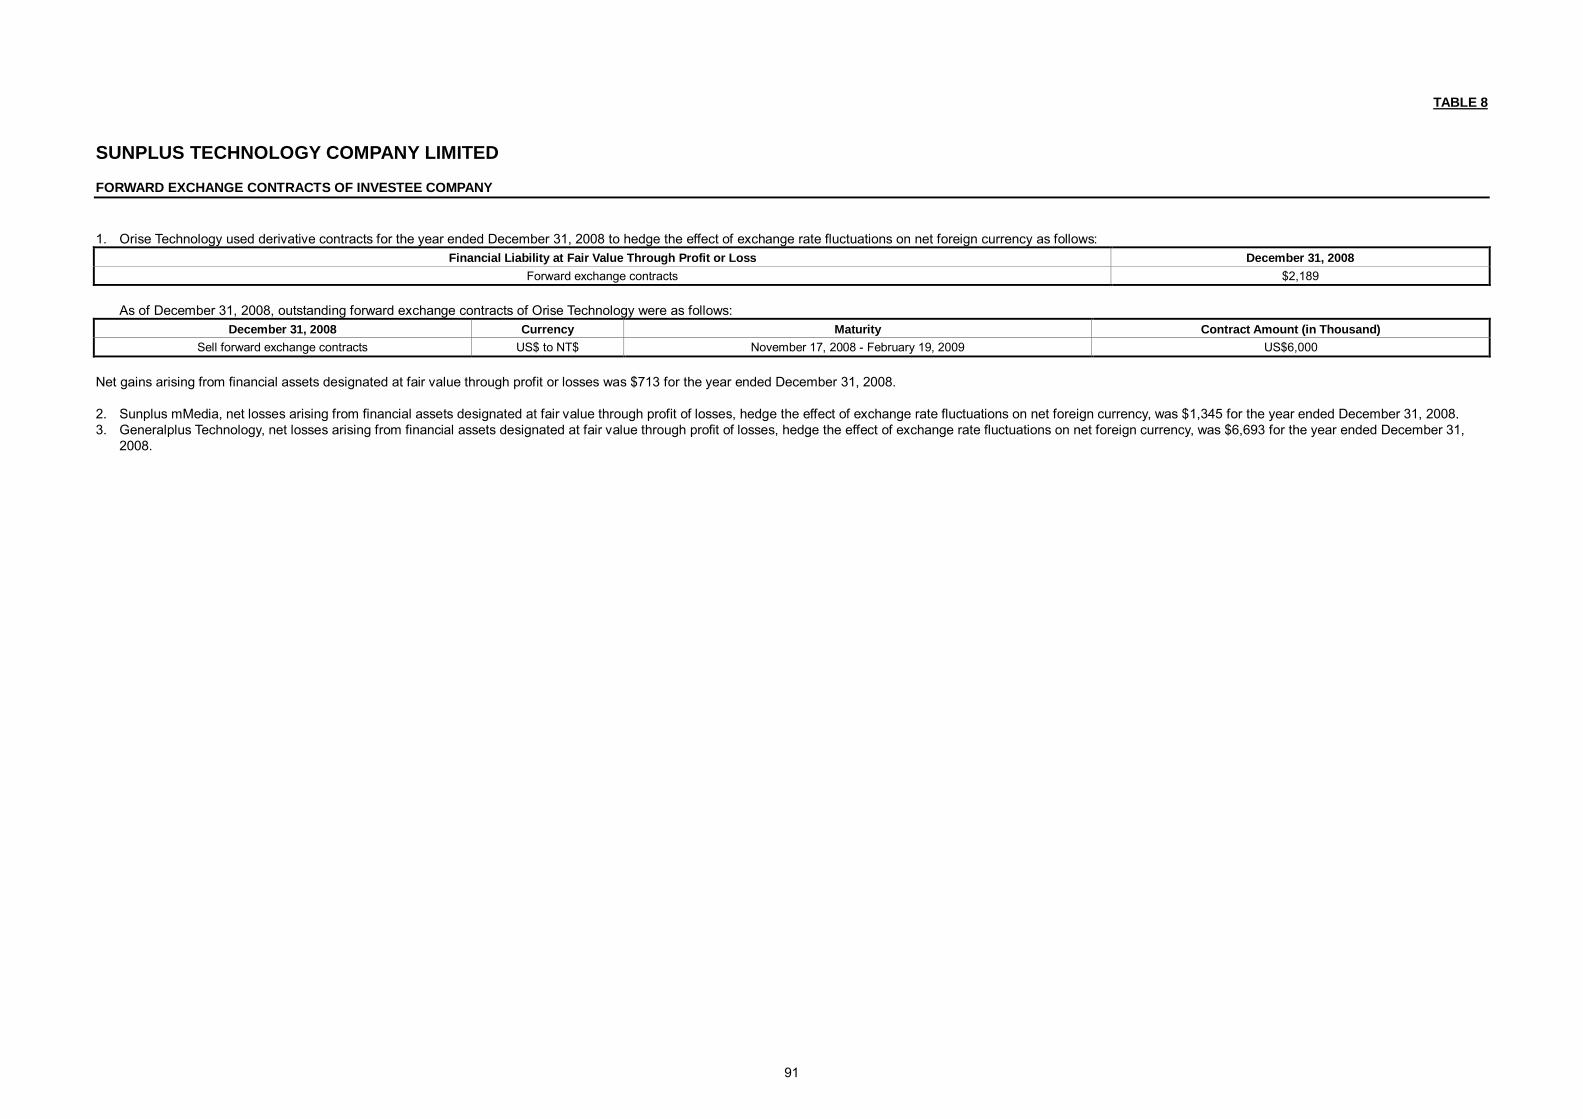
91
TABLE 8 SUNPLUS TECHNOLOGY COMPANY LIMITED FORWARD EXCHANGE CONTRACTS OF INVESTEE COMPANY 1. Orise Technology used derivative contracts for the year ended December 31, 2008 to hedge the effect of exchange rate fluctuations on net foreign currency as follows:
Financial Liability at Fair Value Through Profit or Loss December 31, 2008 Forward exchange contracts $2,189
As of December 31, 2008, outstanding forward exchange contracts of Orise Technology were as follows:
December 31, 2008 Currency Maturity Contract Amount (in Thousand) Sell forward exchange contracts US$ to NT$ November 17, 2008 - February 19, 2009 US$6,000
Net gains arising from financial assets designated at fair value through profit or losses was $713 for the year ended December 31, 2008. 2. Sunplus mMedia, net losses arising from financial assets designated at fair value through profit of losses, hedge the effect of exchange rate fluctuations on net foreign currency, was $1,345 for the year ended December 31, 2008. 3. Generalplus Technology, net losses arising from financial assets designated at fair value through profit of losses, hedge the effect of exchange rate fluctuations on net foreign currency, was $6,693 for the year ended December 31,
2008.

92
TABLE 9 SUNPLUS TECHNOLOGY COMPANY LIMITED INVESTMENT IN MAINLAND CHINA YEAR ENDED DECEMBER 31, 2008 (In Thousands of New Taiwan Dollars, Unless Stated Otherwise)
Investment Flows
Investee Company Name Main Businesses and Products
Total Amount of
Paid-in Capital
Investment Type
Accumulated Outflow of
Investment from Taiwan as of
January 1, 2008
Outflow Inflow
Accumulated Outflow of
Investment from Taiwan as of
December 31, 2008
% Ownership of Direct or
Indirect Investment
Investment Loss
Carrying Value as of
December 31, 2008
Accumulated Inward Remittance of Earnings as of
December 31, 2008
Sunplus Technology (Shanghai) Co., Ltd.
Manufacturing and sale of consumer ICs US$17,200 thousand
Note 1 US$17,000 thousand
US$- thousand
US$- thousand
US$17,000 thousand
99 US$(109) thousand
US$8,894 thousand
US$- thousand
Sunplus Prof-tek (Shenzhen) Co., Ltd.
Development and sale of computer software. Service of System Integration
US$4,250 thousand
Note 1 US$2,250 thousand
US$2,000 thousand
US$- thousand
US$4,250 thousand
100 US$(2,195)
thousand US$2,255 thousand
US$- thousand
Sun Media Technology Co., Ltd.
Manufacturing and sale of computer software. Service of System Integration
US$3,000 thousand
Note 1 US$- thousand
US$3,000 thousand
US$- thousand
US$3,000 thousand
100 US$(1,587)
thousand US$1,545 thousand
US$- thousand
Sunplus App Technology Co., Ltd.
Manufacturing and sale of computer software. Service of System Integration and information management education
RMB3,750 thousand
Note 1 US$- thousand
US$450 thousand
US$- thousand
US$450 thousand
80 US$(83)
thousand US$364
thousand US$-
thousand
Accumulated Investment in Mainland China as of December 31, 2008 Investment Amounts Authorized by Investment Commission, MOEA Upper Limit on Investment US$24,700 thousand US$52,800 thousand $6,570,253
Note 1: The Company invested in company located in Mainland China indirectly through the investing company in the third country.

93
7.5 Consolidated Financial Statements Consolidated Financial Statements for the Years Ended December 31, 2008 and 2007 and Independent Auditors’ Report
REPRESENTATION LETTER The entities to be included in the combined financial statements of Sunplus Technology Company
Limited and subsidiaries as of and for the year ended December 31, 2008, which will be prepared in
conformity with the Criteria Governing the Preparation of Affiliation Reports, Consolidated Business
Reports and Consolidated Financial Statements of Affiliated Enterprises, are the same as the entities
included in the consolidated financial statements prepared in conformity with the revised R.O.C.
Statement of Financial Accounting Standards No. 7 - “Consolidated Financial Statements.” In addition,
the information needed to be disclosed in the combined financial statements is included in the
consolidated financial statements. Thus, Sunplus Technology Company Limited and subsidiaries did not
prepare a separate set of combined financial statements.
Very truly yours, SUNPLUS TECHNOLOGY COMPANY LIMITED By
CHOU-CHIEH HUANG Chairman February 27, 2009

94
INDEPENDENT AUDITORS’ REPORT The Board of Directors and Shareholders Sunplus Technology Company Limited We have audited the accompanying consolidated balance sheets of Sunplus Technology Company Limited and subsidiaries (collectively, the “Company”) as of December 31, 2008 and 2007, and the related consolidated statements of income, changes in shareholders’ equity and cash flows for the years then ended. These consolidated financial statements are the responsibility of the Company’s management. Our responsibility is to express an opinion on these consolidated financial statements based on our audits. We conducted our audits in accordance with the Rules Governing the Audit of Financial Statements by Certified Public Accountants and auditing standards generally accepted in the Republic of China. Those rules and standards require that we plan and perform the audit to obtain reasonable assurance about whether the consolidated financial statements are free of material misstatement. An audit includes examining, on a test basis, evidence supporting the amounts and disclosures in the consolidated financial statements. An audit also includes assessing the accounting principles used and significant estimates made by management, as well as evaluating the overall consolidated financial statement presentation. We believe that our audits provide a reasonable basis for our opinion. In our opinion, the consolidated financial statements referred to above present fairly, in all material respects, the consolidated financial position of Sunplus Technology Company Limited and subsidiaries as of December 31, 2008 and 2007, and the results of their operations and their cash flows for the years then ended, in conformity with Guidelines Governing the Preparation of Financial Reports by Securities Issuers, and accounting principles generally accepted in the Republic of China. As disclosed in Note 3 to the accompanying financial statements, the Accounting Research and Development Foundation issued Interpretation 2007-052, which requires companies to recognize bonuses paid to employees, directors and supervisors as compensation expenses beginning January 1, 2008. These bonuses were previously recorded as appropriations from earnings. The Company also adopted the newly released Statement of Financial Accounting Standards No. 39, “Share-based Payment” to account for employee stock options. Deloitte & Touche February 27, 2009
Notice to Readers The accompanying consolidated financial statements are intended only to present the financial position, results of operations and cash flows in accordance with accounting principles and practices generally accepted in the Republic of China and not those of any other jurisdictions. The standards, procedures and practices to audit such consolidated financial statements are those generally accepted and applied in the Republic of China. For the convenience of readers, the auditors’ report and the accompanying consolidated financial statements have been translated into English from the original Chinese version prepared and used in the Republic of China. If there is any conflict between the English version and the original Chinese version or any difference in the interpretation of the two versions, the Chinese-language auditors’ report and consolidated financial statements shall prevail.

95
SUNPLUS TECHNOLOGY COMPANY LIMITED AND SUBSIDIARIES CONSOLIDATED BALANCE SHEETS DECEMBER 31, 2008 AND 2007 (In Thousands of New Taiwan Dollars, Except Par value) 2008 2007 2008 2007 ASSETS Amount % Amount % LIABILITIES AND SHAREHOLDERS’ EQUITY Amount % Amount % CURRENT ASSETS CURRENT LIABILITIES
Cash $3,476,092 20 $3,162,998 15 Short-term loans (Notes 13 and 24) $2,422,610 14 $1,951,478 9 Certificates of deposits - restricted (Note 24) 13,647 - 23,265 - Commercial paper payable (Notes 14 and 24) - - 69,882 - Financial assets at fair value through profit or loss - current (Notes 2 and 4) 2,189 - 12 - Notes and accounts payable (Note 23) 845,460 5 2,198,489 11 Available-for-sale financial assets - current (Notes 2 and 8) 442,835 3 1,702,260 8 Income tax payable (Notes 2 and 20) 437,699 2 454,535 2 Notes and accounts receivable, net (Note 2) Financial liabilities at fair value through profit or loss - current (Notes 2 and 4) - - 5,392 -
Related parties (Note 23) 645,101 4 1,035,771 5 Bonus payable to employees and remuneration payable to directors and Others (Note 5) 1,608,520 9 2,919,352 14 supervisors (Note 17) 115,357 1 - -
Other receivables (Note 23) 244,892 1 234,299 1 Long-term bank loans - current portion (Note 15 ) - - 150,000 1 Inventories, net (Notes 2 and 6) 2,815,509 16 2,903,298 14 Other current liabilities (Note 23) 693,329 4 1,508,501 7 Deferred income tax - current (Notes 2 and 20) 360,760 2 224,193 1 Other current assets 187,169 1 133,716 1 Total current liabilities 4,514,455 26 6,338,277 30
Total current assets 9,796,714 56 12,339,264 59 OTHER LIABILITIES Deferred income - noncurrent 3,575 - - -
LONG-TERM INVESTMENTS Accrued pension liability (Notes 2 and 16) 179,040 1 183,002 1 Equity-method investments (Notes 2 and 7) 1,927,312 11 1,255,508 6 Guarantee deposits 355,519 2 413,378 2 Prepaid long-term investments 66,148 - 252,296 1 Financial assets at fair value through profit or loss - noncurrent (Notes 2 and 4) 162,122 1 167,676 1 Total other liabilities 538,134 3 596,380 3 Available-for-sale financial assets - noncurrent (Notes 2 and 8) 363,633 2 1,209,194 6 Financial assets carried at cost (Notes 2 and 9) 688,205 4 715,098 3 Total liabilities 5,052,589 29 6,934,657 33
Total long-term investments 3,207,420 18 3,599,772 17 SHAREHOLDERS' EQUITY
PROPERTIES (Notes 2 and 10) Capital stock - NT$10.00 par value (parent company's equity; Notes 2, 17 and 18) Cost Authorized - 1,200,000 thousand shares
Buildings 1,110,055 6 1,279,476 6 Issued and outstanding - 598,203 thousand shares in 2008 and 556,750 Auxiliary equipment 184,964 1 179,140 1 thousand shares in 2007 5,982,028 34 5,567,505 26 Machinery and equipment 552,758 3 431,988 2 Capital surplus Testing equipment 728,077 4 737,392 4 Additional paid-in capital - share issuance in excess of par 710,751 4 817,768 4 Transportation equipment 9,364 - 10,806 - Treasury stock transactions 68,645 - 60,171 - Furniture and fixtures 279,112 2 294,213 1 Merger and others 808,162 5 675,978 3 Leasehold improvements 86,438 1 71,406 - Retained earnings Other equipment 31,030 - 18,403 - Legal reserve 2,333,642 13 2,127,492 10
Total cost 2,981,798 17 3,022,824 14 Special reserve - - 17,260 - Less: Accumulated depreciation 1,384,485 8 1,157,683 5 Unappropriated earnings 1,590,992 9 3,499,870 17 Prepayments and construction-in-progress 14,877 - 3,964 - Others Cumulative translation adjustments 149,639 1 63,135 -
Net properties 1,612,190 9 1,869,105 9 Unrealized valuation (loss) gain on financial assets (561,966) (3) 185,415 1 Treasury stock (at cost) - 4,853 thousand shares in 2008 and 4,683 thousand
INTANGIBLE ASSETS, NET (Notes 2 and 11) 1,632,022 9 1,924,581 9 shares in 2007 (131,471) (1) (131,471) - Total equity attributed to shareholders of the parent 10,950,422 62 12,883,123 61 OTHER ASSETS
Rental assets (Note 2) 303,991 2 117,519 1 MINORITY INTEREST (Note 2) 1,588,877 9 1,163,593 6 Deferred charges and others (Notes 2 and 12) 266,612 2 282,878 1 Deferred income tax - noncurrent (Notes 2 and 20) 772,939 4 848,254 4 Total shareholders' equity 12,539,299 71 14,046,716 67
Total other assets 1,343,542 8 1,248,651 6 TOTAL $17,591,888 100 $20,981,373 100 TOTAL $17,591,888 100 $20,981,373 100 The accompanying notes are an integral part of the consolidated financial statements. (With Deloitte & Touche audit report dated February 27, 2009)

96
SUNPLUS TECHNOLOGY COMPANY LIMITED AND SUBSIDIARIES CONSOLIDATED STATEMENTS OF INCOME YEARS ENDED DECEMBER 31, 2008 AND 2007 (In Thousands of New Taiwan Dollars, Except Earnings Per Share) 2008 2007 Amount % Amount % GROSS SALES $16,595,438 $20,401,266 SALES RETURNS AND ALLOWANCES (417,638) (294,296) NET SALES (Notes 2 and 23) 16,177,800 100 20,106,970 100 COST OF SALES (Notes 19 and 23) 11,164,512 69 13,166,937 66 REALIZED (UNREALIZED) GAIN ON INTERCOMPANY TRANSACTIONS, NET (Note 2) (284) - 181 - GROSS PROFIT 5,013,004 31 6,940,214 34 OPERATING EXPENSES (Notes 19 and 23)
Marketing 267,985 2 535,359 3 General and administrative 754,199 5 657,403 3 Research and development 4,634,900 28 4,265,468 21
Total operating expenses 5,657,084 35 5,458,230 27
OPERATING INCOME (LOSS) (644,080) (4) 1,481,984 7 NONOPERATING INCOME AND GAINS
Gain on disposal of investments, net (Note 2) 720,765 5 567,346 3 Gain on settlement compensation (Note 26) 107,639 1 137,450 1 Dividend income (Note 2) 86,973 1 244,992 1 Rental revenue 79,780 1 20,888 - Guarantee deposits forfeited because of customers' default on contracts 67,193 - 80,825 - Interest income 58,780 - 60,632 - Exchange gain, net (Note 2) 47,420 - 8,839 - Valuation gain on financial assets (Notes 2 and 4) 22,040 - 17,634 - Investment income recognized by the equity-method, net (Notes 2 and 7) 17,147 -
91,000 1
Others (Note 23) 71,773 - 52,540 -
Total nonoperating income and gains 1,279,510 8 1,282,146 6 NONOPERATING EXPENSES AND LOSSES
Loss on inventory (Note 2) 325,080 2 293,966 2 Interest expense 91,204 1 80,097 - Impairment loss (Note 2) 64,030 - 80,505 -
(Continued)

97
SUNPLUS TECHNOLOGY COMPANY LIMITED AND SUBSIDIARIES CONSOLIDATED STATEMENTS OF INCOME YEARS ENDED DECEMBER 31, 2008 AND 2007 (In Thousands of New Taiwan Dollars, Except Earnings Per Share) 2008 2007 Amount % Amount %
Valuation loss on financial liabilities (Notes 2 and 4) $2,436 - $5,393 - Loss on disposal of properties (Note 2) 524 - 9,480 - Others 16,025 - 5,609 -
Total nonoperating expenses and losses 499,299 3 475,050 2
INCOME BEFORE INCOME TAX 136,131 1 2,289,080 11 INCOME TAX (Notes 2 and 20) 58,501 1 272,443 1 CONSOLIDATED NET INCOME $77,630 - $2,016,637 10 ATTRIBUTABLE TO
Shareholders of the parent $8,383 - $2,061,502 10 Minority interest 69,247 - (44,865) -
$77,630 - $2,016,637 10
2008 2007 Before
Income Tax
After Income
Tax
Before Income
Tax
After Income
Tax CONSOLIDATED EARNINGS PER SHARE (Note 21)
Basic $ 0.11 $ 0.01 $ 3.72 $ 3.28 Diluted $ 0.11 $ 0.01 $ 3.71 $ 3.27
The accompanying notes are an integral part of the consolidated financial statements. (With Deloitte & Touche audit report dated February 27, 2009) (Concluded)

98
SUNPLUS TECHNOLOGY COMPANY LIMITED AND SUBSIDIARIES
CONSOLIDATED STATEMENTS OF CHANGES IN SHAREHOLDERS' EQUITY
YEARS ENDED DECEMBER 31, 2008 AND 2007
(In Thousands of New Taiwan Dollars, Unless Stated Otherwise)
Equity Attributable to Shareholders of the Parent
Capital Stock Issued and
Outstanding (Note 17) Capital Surplus (Notes 2 and 17) Retained Earnings (Notes 2 and 17) Others (Notes 2 and 18)
Shares
(Thousands) Amount
Additional Paid-in Capital
in Excess of Par
Treasury Stock
Transactions Long-term
Investments Merger Total Legal Reserve Special Reserve
Unappropriated Earnings Total
Cumulative Translation
Adjustments
Gain on Financial Assets
Unrealized Valuation (Loss) Treasury Stock Total
Minority Interest (Note 2)
Total Shareholder's
Equity
BALANCE, JANUARY 1, 2007 1,023,648 $10,236,476 $768,390 $47,328 $393,555 $157,423 $1,366,696 $1,830,223 $294,860 $3,849,644 $5,974,727 $17,206 $(34,466 ) $(176,566) $17,384,073 $639,376 $18,023,449 Cancellation of common shares (511,436) (5,114,357) - - - - - - - - - - - 45,095 (5,069,262) - (5,069,262) Appropriation of prior year's earnings:
Legal reserve - - - - - - - 297,269 - (297,269) - - - - - - - Special reserve - - - - - - - - (277,600) 277,600 - - - - - - - Bonus to employees - stock 13,500 135,000 - - - - - - - (135,000) (135,000) - - - - - - Bonus to employees - cash - - - - - - - - - (15,000) (15,000) - - - (15,000) - (15,000) Remuneration to directors and supervisors - - - - - - - - - (39,688) (39,688) - - - (39,688) - (39,688) Stock dividends - NT$0.29822 per share 15,362 153,622 - - - - - - - (153,622) (153,622) - - - - - - Cash dividends - NT$3.97620 per share - - - - - - - - - (2,048,297) (2,048,297) - - - (2,048,297) - (2,048,297)
Capital stock transferred from capital surplus 10,241 102,415 (102,415 ) - - - (102,415) - - - - - - - - - - Issuance of shares upon exercise of employee stock options 5,435 54,349 151,793 - - - 151,793 - - - - - - - 206,142 - 206,142 Consolidated net income (loss) in 2007 - - - - - - - - - 2,061,502 2,061,502 - - - 2,061,502 (44,865) 2,016,637 Translation adjustments on long-term investments - - - - - - - - - - - 45,929 - - 45,929 4,095 50,024 Cash dividends received by subsidiaries from the Company - - - 12,843 - - 2,843 - - - - - - - 12,843 - 12,843 Adjustment arising from changes in percentage of ownership of investees - - - - 167,595 - 167,595 - - - - - - - 167,595 (120,533) 47,062 Adjustment of capital surplus - others - - - - (42,595) - (42,595) - - - - - - - (42,595) - (42,595) Adjustment for changes in shareholders' equities in equity-method investees - - - - - - - - - - - - (12) (12) - (12) Valuation loss on available-for-sale financial assets - - - - - - - - - - - - 219,893 - 219,893 148 220,041 Subsidiaries' distribution of cash dividends to minority interests - - - - - - - - - - - - - - - (19,707) (19,707) Increase in minority interest - - - - - - - - - - - - - - - 705,079 705,079 BALANCE, DECEMBER 31, 2007 556,750 5,567,505 817,768 60,171 518,555 157,423 1,553,917 2,127,492 17,260 3,499,870 5,644,622 63,135 185,415 (131,471) 12,883,123 1,163,593 14,046,716 Appropriation of prior year's earnings:
Legal reserve - - - - - - - 206,150 - (206,150) - - - - - - - Special reserve - - - - - - - - (17,260) 17,260 - - - - - - - Bonus to employees - stock 13,500 135,000 - - - - - - - (135,000) (135,000) - - - - - - Bonus to employees - cash - - - - - - - - - (15,000) (15,000) - - - (15,000) - (15,000) Remuneration to directors and supervisors - - - - - - - - - (23,090) (23,090) - - - (23,090) - (23,090) Stock dividends - NT$0.29990 per share 16,665 166,637 - - - - - - - (166,637) (166,637) - - - - - - Cash dividends - NT$2.49920 per share - - - - - - - - - (1,388,644) (1,388,644) - - - - - (1,388,644)
Capital stock transferred from capital surplus 11,109 111,092 (111,092) - - - (111,092) - - - - - - - - - - Issuance of shares upon exercise of employee stock options 179 1,794 4,075 - - - 4,075 - - - - - - - 5,869 - 5,869 Consolidated net income in 2008 - - - - - - - - - 8,383 ,383 - - - 8,383 69,247 77,630 Translation adjustments on long-term investments - - - - - - - - - - - 86,504 - - 86,504 (7,888) 78,616 Cash dividends received by subsidiaries from the Company - - - 8,474 - - 8,474 - - - - - - - 8,474 - 8,474 Adjustment arising from changes in percentage of ownership of investees - - - - 134,100 - - - - - - - - - 134,100 339,417 473,517 Adjustment of capital surplus - others - - - - (1,916) - - - - - - - - - (1,916) - (1,916) Valuation loss on available-for-sale financial assets - - - - - - - - - - - - (747,381 ) - (747,381) 863 (746,518) Subsidiaries' distribution of cash dividends to minority interests - - - - - - - - - - - - - - - (79,973) (79,973) Increase in minority interest - - - - - - - - - - - - - - - 103,618 103,618 BALANCE, DECEMBER 31, 2008 598,203 $5,982,028 $710,751 $68,645 $650,739 $157,423 $1,587,558 $2,333,642 $- $1,590,992 $3,924,634 $149,639 $(561,966) $(131,471) $10,950,422 $1,588,877 $12,539,299 The accompanying notes are an integral part of the consolidated financial statements. (With Deloitte & Touche audit report dated February 27, 2009)

99
SUNPLUS TECHNOLOGY COMPANY LIMITED AND SUBSIDIARIES CONSOLIDATED STATEMENTS OF CASH FLOWS YEARS ENDED DECEMBER 31, 2008 AND 2007 (In Thousands of New Taiwan Dollars) 2008 2007 CASH FLOWS FROM OPERATING ACTIVITIES
Net income attributable to shareholders of the parent $8,383 $2,061,502 Net income (loss) attributable to the minority interest 69,247 (44,865) Adjustments to reconcile the consolidated net income to net cash provided by operating activities:
Depreciation and amortization 1,271,990 1,225,700 Realized (unrealized) gains on intercompany
transactions, net 284 (181) Cash dividends received from equity-method investees 115,496 68,669 Gain on disposal of investments, net (720,765) (543,500) Impairment loss 64,030 80,505 Investment gain recognized by the equity-method, net (17,147) (91,000) Valuation gain on financial instruments (26,773) (12,241) Loss on disposal of properties and deferred charges 5,554 7,835 Deferred income tax (61,252) (307,918) Accrued pension liability (3,962) (3,900) Deferred pension cost 653 (653) Net changes in operating assets and liabilities
Held-for-trading financial assets (5,280) - Notes and accounts receivable 1,701,502 29,022 Other receivables 96,476 24,583 Inventories 87,789 1,008,599 Other current assets (54,404) 47,160 Notes and accounts payable (1,353,029) (725,706) Income tax payable (91,105) 315,151 Bonus payable to employees and remuneration payable to employees, directors and supervisors 115,357 - Other current liabilities (387,211) (40,836)
Net cash provided by operating activities 815,833 3,097,926
CASH FLOWS FROM INVESTING ACTIVITIES
Decrease in certificates of deposits - restricted 9,618 56,463 Proceeds of the:
Disposal of financial assets designated at fair value through profit or loss 30,840 199,563 Disposal of equity-method investments 396,193 - Disposal of available-for-sale financial assets 9,971,642 16,545,659 Disposal of financial assets carried at cost 76,819 424,932 Properties and deferred expenses 1,905 10,917 Capital return on available-for-sale financial assets - 8,179 Capital return on financial assets carried at cost - 89,213 Capital return by equity-method investee 15,294 -
Acquisition of: Equity-method investments (15,214) - Prepaid long-term investments (64,781) (235,980)
(Continued)

- 100 -
SUNPLUS TECHNOLOGY COMPANY LIMITED AND SUBSIDIARIES CONSOLIDATED STATEMENTS OF CASH FLOWS YEARS ENDED DECEMBER 31, 2008 AND 2007 (In Thousands of New Taiwan Dollars) 2008 2007
Available-for-sale financial assets $(8,311,772) $(14,705,063) Financial assets carried at cost (69,969) (23,822) Properties (288,187) (363,787)
Increase in intangible assets (794,516) (517,280) Increase in deferred charges and others (178,399) (179,230)
Net cash provided by investing activities 779,473 1,309,764
CASH FLOWS FROM FINANCING ACTIVITIES
Increase in short-term loans 471,132 422,270 Decrease in commercial paper payable (69,882) (29,998) Decrease in long-term bank loans (150,000) (60,000) Decrease in guarantee deposits (57,859) (14,744) Remuneration paid to directors and supervisors and bonus paid to employees (38,090) (54,688) Cash dividends paid on common stock (1,468,617) (2,068,004) Proceeds of the exercise of stock options 5,869 206,142 Dividends received by subsidiaries from the parent 8,474 12,843 Capital reduction by Sunplus Technology Company Limited - (5,069,262) Increase in minority interest 23,459 705,079
Net cash used in financing activities (1,275,514) (5,950,362)
NET INCREASE ( DECREASE) IN CASH 319,792 (1,542,672) CASH, BEGINNING OF YEAR 3,162,998 4,743,863 EFFECT OF EXCHANGE RATE CHANGES (9,066) (38,193) EFFECT OF CHANGE OF CONSOLIDATED ENTITIES 2,368 - CASH, END OF YEAR $3,476,092 $3,162,998 SUPPLEMENTAL CASH FLOW INFORMATION:
Income tax paid $219,025 $196,383 Interest paid $71,562 $78,480
NONCASH INVESTING AND FINANCING ACTIVITIES:
Reclassification of properties into rental assets $176,751 $117,519 Reclassification of properties into deferred charges and others $46,434 $281,484 Reclassification of long-term investments into credit balance on the carrying value of long-term investments $129 $5,547 Current portion of long-term bank loans $- $150,000
(Continued)

- 101 -
SUNPLUS TECHNOLOGY COMPANY LIMITED AND SUBSIDIARIES CONSOLIDATED STATEMENTS OF CASH FLOWS YEARS ENDED DECEMBER 31, 2008 AND 2007 (In Thousands of New Taiwan Dollars) 2008 2007 PARTIAL CASH INVESTING ACTIVITIES:
Acquisition of properties $279,743 $334,893 Decrease in payables to contractors and equipment suppliers 8,444 28,894 Cash paid $288,187 $363,787 - - Acquisition of intangible assets $401,959 $938,241 Decrease (increase) in other current liabilities 418,826 (420,961) Increase in minority interest (26,269) - Cash paid $794,516 $ 517,280 - - Sale of equity-method investments $(428,993) $- Increase in other receivables 32,800 -
Cash received $(396,193) $- The accompanying notes are an integral part of the consolidated financial statements. (With Deloitte & Touche audit report dated February 27, 2009)
(Concluded)
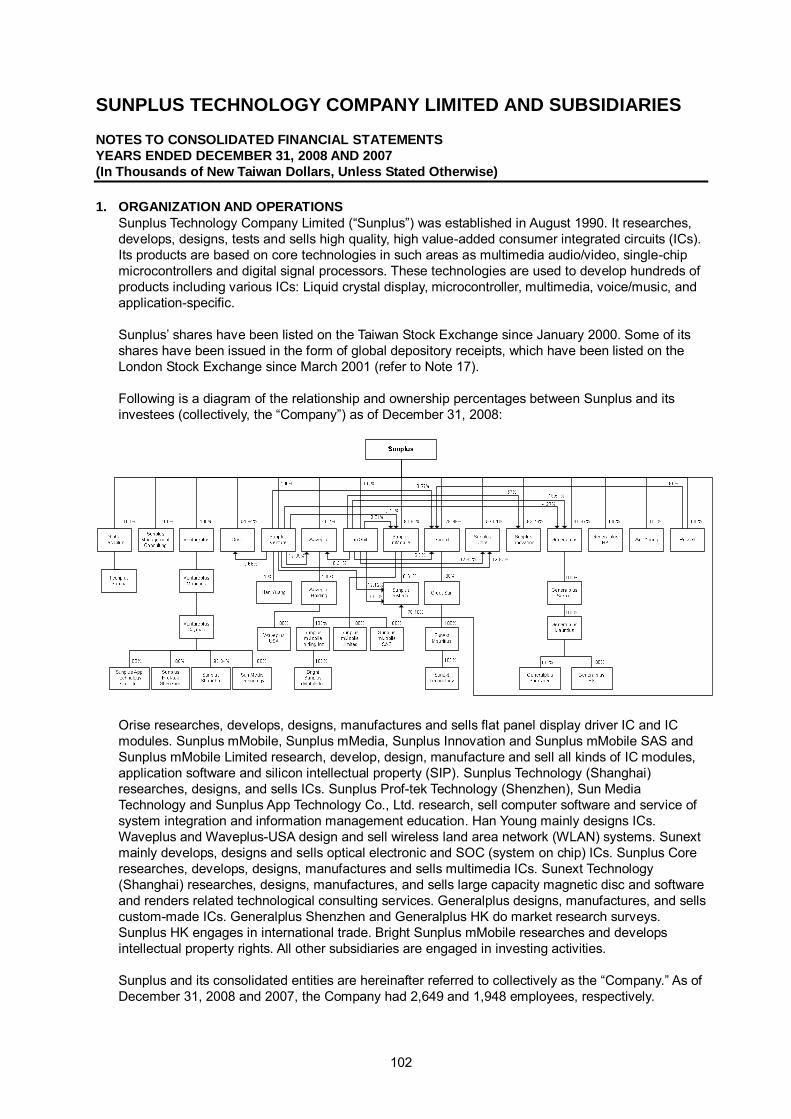
102
SUNPLUS TECHNOLOGY COMPANY LIMITED AND SUBSIDIARIES NOTES TO CONSOLIDATED FINANCIAL STATEMENTS YEARS ENDED DECEMBER 31, 2008 AND 2007 (In Thousands of New Taiwan Dollars, Unless Stated Otherwise) 1. ORGANIZATION AND OPERATIONS
Sunplus Technology Company Limited (“Sunplus”) was established in August 1990. It researches, develops, designs, tests and sells high quality, high value-added consumer integrated circuits (ICs). Its products are based on core technologies in such areas as multimedia audio/video, single-chip microcontrollers and digital signal processors. These technologies are used to develop hundreds of products including various ICs: Liquid crystal display, microcontroller, multimedia, voice/music, and application-specific. Sunplus’ shares have been listed on the Taiwan Stock Exchange since January 2000. Some of its shares have been issued in the form of global depository receipts, which have been listed on the London Stock Exchange since March 2001 (refer to Note 17). Following is a diagram of the relationship and ownership percentages between Sunplus and its investees (collectively, the “Company”) as of December 31, 2008:
Orise researches, develops, designs, manufactures and sells flat panel display driver IC and IC modules. Sunplus mMobile, Sunplus mMedia, Sunplus Innovation and Sunplus mMobile SAS and Sunplus mMobile Limited research, develop, design, manufacture and sell all kinds of IC modules, application software and silicon intellectual property (SIP). Sunplus Technology (Shanghai) researches, designs, and sells ICs. Sunplus Prof-tek Technology (Shenzhen), Sun Media Technology and Sunplus App Technology Co., Ltd. research, sell computer software and service of system integration and information management education. Han Young mainly designs ICs. Waveplus and Waveplus-USA design and sell wireless land area network (WLAN) systems. Sunext mainly develops, designs and sells optical electronic and SOC (system on chip) ICs. Sunplus Core researches, develops, designs, manufactures and sells multimedia ICs. Sunext Technology (Shanghai) researches, designs, manufactures, and sells large capacity magnetic disc and software and renders related technological consulting services. Generalplus designs, manufactures, and sells custom-made ICs. Generalplus Shenzhen and Generalplus HK do market research surveys. Sunplus HK engages in international trade. Bright Sunplus mMobile researches and develops intellectual property rights. All other subsidiaries are engaged in investing activities. Sunplus and its consolidated entities are hereinafter referred to collectively as the “Company.” As of December 31, 2008 and 2007, the Company had 2,649 and 1,948 employees, respectively.

- 103 -
2. SIGNIFICANT ACCOUNTING POLICIES
Basis of Presentation The accompanying financial statements have been prepared in conformity with the Guidelines Governing the Preparation of Financial Reports by Securities Issuers and accounting principles generally accepted in the Republic of China (ROC). Under these guidelines and principles, the Company is required to make certain estimates and assumptions that could affect the amounts of allowance for doubtful accounts, allowance for sales returns and discounts, allowance for inventory devaluation, property depreciation, amortization of intangible assets, impairment loss on assets, pension expenses and the bonus to employees, directors and supervisors. Actual results could differ from these estimates. For the convenience of readers, the accompanying consolidated financial statements have been translated into English from the original Chinese version prepared and used in the R.O.C. If there is any conflict between the English version and the original Chinese version or any difference in the interpretation of the two versions, the Chinese-language consolidated financial statements shall prevail. The Company’s significant accounting policies are summarized as follows: Principles of Consolidation The accompanying consolidated financial statements include the accounts of all directly and indirectly majority owned subsidiaries of Sunplus, and the accounts of investees in which Sunplus’ ownership percentage is less than 50% but in which Sunplus has a controlling interest. All significant intercompany balances and transactions are eliminated upon consolidation. The consolidated entities as of December 31, 2008 and 2007 were as follows:
% of Ownership as of
December 31 Investor Investee 2008 2007 Remark
Sunplus Global Techplus 100.00 100.00 -
Sunplus Management Consulting
100.00 100.00 -
Ventureplus 100.00 100.00 - Orise 54.94 56.71 - Sunplus Venture 100.00 100.00 - Waveplus 40.70 43.41 Sunplus and the Subsidiaries held
69.10% ownership of Waveplus. Lin Shih 100.00 100.00 - Sunplus mMobile 90.91 90.91 - Sunext 78.99 15.75 As of December 31, 2007, Sunplus
and the Subsidiaries held 57.41% owner- ship of Sunext.
Sunplus Core 57.04 58.00 - Sunplus Innovation 83.76 90.91 - Generalplus 40.87 44.83 Sunplus and the Subsidiaries held
63.65% ownership of Generalplus. Sunplus HK 100.00 100.00 - Wei-Young 100.00 100.00 - Russell 100.00 100.00 - Sunplus mMedia 78.18 - As of December 31, 2007, Sunplus
and the Subsidiaries held 87.47% ownership of Sunplus mMedia.
Global Techplus Techplus Samoa 100.00 100.00 - Ventureplus Ventureplus Mauritius 100.00 100.00 - Ventureplus Mauritius Ventureplus Cayman 100.00 100.00 -

- 104 -
% of Ownership as of
December 31 Investor Investee 2008 2007 Remark Ventureplus Cayman Sunplus Shanghai 98.84 98.84 -
Sunplus Prof-tek Shenzhen
100.00 100.00 Newly established.
Sun Media Technology Co., Ltd.
100.00 - Newly established.
Sunplus App Technology Co., Ltd.
80.00 - Newly established.
Sunplus Venture Han Yuang 70.00 70.00 - Sunext 8.57 20.00 Sunplus and the Subsidiaries held
94.92% owner- ship of Sunext. Waveplus 12.90 12.90 Sunplus and the Subsidiaries held
69.10% ownership of Waveplus. Generalplus 4.27 4.68 Sunplus and the Subsidiaries held
63.65% owner- ship of Generalplus. Orise 0.66 0.67 Sunplus and the Subsidiaries held
55.60% ownership of Orise. Sunplus Core 12.82 21.00 Sunplus and the subsidiaries held
82.68% ownership of Sunplus Core. Sunplus mMobile 0.11 0.11 Sunplus and Subsidiaries held
93.33% ownership of Sunplus mMobile
Sunplus mMedia 12.12 - Sunplus and the Subsidiaries held 93.92% ownership of Sunplus mMedia.
Lin Shih Generalplus 18.51 20.30 Sunplus and the Subsidiaries held 63.65% ownership of Generalplus.
Sunext 6.50 21.66 Sunplus and the Subsidiaries held 94.92% ownership of Sunext.
Waveplus 16.31 17.40 Sunplus and the Subsidiaries held 69.10% ownership of Waveplus.
Sunplus Core 12.82 21.00 Sunplus and the subsidiaries held 82.68% ownership of Sunplus Core.
Sunplus mMedia 3.01 1.48 Sunplus and Subsidiaries held 93.92% ownership of Sunplus mMedia.
Sunplus mMobile 2.31 3.57 Sunplus and the Subsidiaries held 93.33% ownership of Sunplus mMobile.
Sunplus Innovation 1.67 1.68 Sunplus and the Subsidiaries held 85.43% ownership of Sunplus Innovation.
Waveplus Waveplus Holding 100.00 100.00 - Waveplus Holding Waveplus USA 100.00 100.00 - Sunext Great Sun 100.00 100.00 - Great Sun Sunext Mauritius 100.00 100.00 - Sunext USA - 100.00 In February 2008, Great Sun
disposed of Sunext USA; thus; Sunext ceased to be a consolidated entity from then on.
Sunext Mauritius Sunext (Shanghai) 100.00 100.00 - Sunplus mMobile Sunplus mMedia 0.61 90.91 Sunplus and the subsidiaries held
93.92% ownership of Sunplus mMedia
Sunplus mMobile Holding Inc.
100.00 - Newly established.

- 105 -
% of Ownership as of
December 31 Investor Investee 2008 2007 Remark
Sunplus mMobile SAS 100.00 - Newly established. Sunplus mMobile
Limited 100.00 - Newly established.
Sunplus mMobile Holding Inc.
Bright Sunplus mMobile Inc.
100.00 - Newly established.
Generalplus Generalplus Samoa 100.00 100.00 - Generalplus Samoa Generalplus Mauritius 100.00 100.00 - Generalplus Mauritius
Generalplus Shenzhen 100.00 100.00 -
Generalplus HK 100.00 100.00 - Russell Sunext 0.86 - Sunplus and the subsidiaries held
94.92% ownership of Sunext Minority interest in subsidiaries is presented as a separate component of shareholders’ equity. In their meeting on February 20, 2009, the board of Sunplus mMobile (SmM) approved the spin-off of its communication business unit (BU) by decreasing SmM’s capital to establish HT mMobile Inc. (“HT mMobile”). The carrying value of this BU was $189,867 thousand as of December 31, 2008. SmM’s shareholders of Sunplus mMobile will own HT mMobile in the same proportion of their ownership of SmM.The board will propose the approval of this spin-off at the SmM shareholders’ meeting on March 10, 2009. Significant accounting policies are summarized as follows: Current/Noncurrent Assets and Liabilities Current assets cash (unrestricted) and other assets primarily held for the purpose of being traded or to be converted to cash, consumed or sold within one year from the balance sheet date. Current liabilities are those to be settled within one year from the balance sheet date and those primarily for the purpose of being traded. All other assets and liabilities are classified as noncurrent. Financial Assets/Liabilities at Fair Value Through Profit or Loss Financial instruments at fair value through profit or loss have two categories: (1) held for trading and (2) designated on initial recognition as at fair value through profit or loss. These financial instruments are initially recorded at fair value with transaction costs that are directly attributable to the acquisition. When financial instruments are subsequently measured at fair value, the changes in fair value are recognized as earnings. A regular way purchase or sale of financial assets is recognized and derecognized using trade date accounting. Derivatives that do not meet the criteria for hedge accounting are treated as financial assets or liabilities held for trading. When the fair value is a positive amount, the derivative is treated as a financial asset; when the fair value is a negative amount, the derivative is treated as a financial liability. The fair values of those instruments without quoted market prices in an active market is based on valuation techniques incorporating estimates and assumptions that are consistent with prevailing market conditions. Hybrid instruments are designated at fair value through profit or loss. Revenue Recognition and Allowance for Doubtful Accounts Sales are recognized when titles and risks of ownerships are transferred to customers, primarily upon shipment, since the earning process is substantially completed and revenue is realized or realizable. The Company does not recognize sales upon delivery of materials to subcontractors because the ownership over the materials is not transferred.

- 106 -
An allowance is provided for any sales returns and discounts, which are estimated on the basis of historical experience and any known factors that would affect the allowance. Such provisions are deducted from sales in the year the products are sold. Sales are determined at fair market value, taking into account related sales discounts agreed to by the Company and its customers. Since the receivables from sales are collectible within one year and sales transactions are frequent, the fair value of receivables equals to the nominal amount of cash to be received. An allowance for doubtful accounts is provided on the basis of a review of the collectibility of accounts receivable. The Company assesses the probability of collections of accounts receivable by examining the aging analysis of the outstanding receivables and assessing the value of the collateral provided by customers. Inventories Inventories consist of raw materials, work-in-process, finished goods and merchandise, which are stated at the lower of cost or market value. Sunplus, Generaplus, Sunext, Orise, Sunplus Innovation, Sunplus mMobile and Sunplus mMedia which inventories are recorded at standard costs and adjusted to approximate weighted-average cost at the end of the period. Other subsidiaries inventories are recorded at weighted-average cost Market value is based on replacement cost for raw materials and net realizable value for work-in-process, finished goods and merchandise. Scrap and slow-moving items are recognized as allowance for losses. Available-for-sale Financial Assets Investments designated as available-for-sale financial assets include open-end mutual funds and listed stock. Investments classified as available-for-sale financial assets are initially recognized at fair value plus transaction costs that are directly attributed to investment acquisition. When available-for-sale financial assets subsequently measured at fair value, the changes in fair value are reported as a separate component of shareholders’ equity. The accumulated gains or losses are recognized when the financial asset is derecognized from the balance sheet. A regular way purchase or sale of financial assets is recognized and derecognized using trade date accounting. The recognition, derecognition and the fair value bases of available-for-sale financial assets are similar to those of financial assets at FVTPL. Cash dividends are recognized as investment income upon resolution of the shareholders of an investee but are accounted for as reductions of the original investment cost if these dividends are declared on the earnings of the investees attributable to periods before the purchase of the investments. Stock dividends received are recorded as an increase in the number of shares held and do not affect investment income. The cost per share is recalculated on the basis of the new number of shares after the receipt of stock dividends. The fair values of open-end mutual funds are based on their net asset value at the balance sheet date; listed stock is the closing price as of the balance sheet date. If there is objective evidence that a financial asset is impaired as of the balance sheet date, a loss is recognized. If the impairment loss decreases, the impairment loss is reversed to the extent of the decrease and recorded as an adjustment to shareholders’ equity. Financial Assets Carried at Cost Investments without quoted market prices in an active market and whose fair value cannot be reliably measured, such as nonpublicly traded stocks, are carried at their original cost. The accounting treatment for cash and stock dividends arising from financial assets carried at cost is the same as that for available-for-sale financial assets. If there is objective evidence of financial asset impairment, a loss is recognized. This impairment loss is irreversible.

- 107 -
Equity-method Investments Investments in share of stock of companies in which the Company owns at least 20% of the outstanding voting shares or exercises significant influence on their operating and financial policy decisions are accounted for by the equity method. If an investee is identified as significantly impaired, the carrying amount of the investment in excess of its recoverable amount is recognized as impairment loss. For those investees over which the Company exercises significant influence on their operating and financial decisions, the assessment of impairment is based on carrying value. When the Company’s share in losses of an equity-method investee equals its investment in that investee plus any advances made to the investee, the Company discontinues applying the equity method. The Company continues to recognize its share in losses of the investee if (a) the Company commits to provide further financial support to the investee or (b) the losses of the investee are considered to be temporary and sufficient evidence shows imminent return to profitability. When the Company subscribes for its investee’s newly issued shares at a percentage different from its percentage of ownership in the investee, the Company records the change in its equity in the investee’s net assets as an adjustment to investments, with a corresponding amount credited or charged to capital surplus. When the adjustment should be debited to capital surplus, but the capital surplus arising from long-term investments is insufficient, the shortage is debited to retained earnings. Profits from downstream transactions with an equity-method investee are eliminated in proportion to the company’s percentage of ownership in the investee. Profits from upstream transactions with an equity-method investee are eliminated in proportion to the Company’s percentage of ownership in the investee. Gains or losses on sales between equity method investees are deferred in proportion to the Company’s percentage of multiplication of weighted-average ownership in the investees. All of these deferred gains and losses are realized upon resale of products to third parties. Properties and Rental Assets Properties and rental assets are stated at cost less accumulated depreciation. Major additions, renewals and betterments are capitalized, while maintenance and repairs are expensed in the period incurred. On the balance sheet date, the Company evaluates properties and rental assets for any impairment. If impairment is identified, the Company will determine the recoverable amount of the assets. The carrying amount in excess of the expected recoverable amount is recognized as impairment loss and charged to current income. If the recoverable amount increases, the subsequent reversal of impairment loss will be recognized as gain. However, the increased carrying amount of an asset due to a reversal of impairment loss should not exceed the carrying amount that would have been determined (net of depreciation) had no impairment loss been recognized for the assets in prior years. Depreciation is computed using the straight-line method over service lives initially estimated as follows: buildings - 7 to 55 years; auxiliary equipment - 3 to 10 years; machinery and equipment - 1 to 10 years; testing equipment - 1 to 5 years; transportation equipment - 4 to 10 years; furniture and fixtures - 1 to 11 years; leasehold improvements - 1 to 10 years; other equipment - 3 to 5 years and assets leased to others - 5 to 20 years. Properties and rental assets still in use beyond their initially estimated service lives are depreciated over their newly estimated service lives. Upon the sale or disposal of properties and rental assets, the related cost and accumulated depreciation are removed from the accounts, and any gain or loss is credited or charged to current income. Intangible Assets Intangible assets consist of technology license fees, patents, land grant, technological Know-how and software booked at the acquisition cost, which are amortized using the straight-line method over

- 108 -
1 to 15 years, 5 to 18 years, 50 years, 5 years, and 1 to 5 years, respectively. Prior to January 1, 2006, the difference between the acquisition cost and the Company’s proportionate share in the investee’s equity was amortized by the straight-line method. Effective January 1, 2006, pursuant to the revised Statement of Financial Accounting Standard (“SFAS”) No. 5, “Long-term Investments Accounted for by Equity Method”, the acquisition cost is analyzed, and the acquisition cost in excess of the Company’s share of the fair value of the identifiable net assets acquired is recognized as goodwill. Such goodwill is not amortized but instead is tested for impairment annually or whenever there are indications that the investments are impaired. Pursuant to the statement of Financial Accounting Standards No. 37 “Intangible Assets” Expenditures arising from research activities and those related to development activities that do not meet the criteria for capitalization are charged to expense when incurred. On the balance sheet date, the Company evaluates intangible assets for any impairment. If impairment is identified, the Company will evaluate the recoverable amount of such assets. The carrying amount in excess of the expected recoverable amount is recognized as impairment loss and charged to current income. If the recoverable amount increases in the future, the subsequent reversal of impairment loss will be recognized as a gain. However, the increased carrying amount of an asset due to a reversal of impairment loss should not exceed the carrying amount that would have been determined (net of amortization), had no impairment loss been recognized for the asset in prior years. Deferred Charges Deferred charges are mainly costs of software and system design, which are booked at the installation or acquisition cost. The amounts are amortized over 1 to 10 years, using the straight-line method. Please refer to the accounting policy of intangible assets for accounting for the accounting for impairment of deferred charges. Stock-based Compensation Employee stock options granted on or after January 1, 2008 are accounted for under Statement of Financial Accounting Standards (“Statement” or SFAS) No. 39, “Accounting for Share-based Payment.” Sunplus and Orise under the statement, the value of the stock options granted, which is equal to the best available estimate of the number of stock options expected to vest multiplied by the grant-date fair value, is expensed on a straight-line basis over the vesting period, with a corresponding adjustment to capital surplus - employee stock options. The estimate is revised if subsequent information indicates that the number of stock options expected to vest differs from previous estimates. Other subsidiaries cannot reliably measure the fair value of the stock options granted at the measurement date; consequently, the stock options granted are initially measured at their intrinsic value and then adjusted at each reporting date for any change in intrinsic value until the date of final settlement. The services received are recognized based on the number of stock options that ultimately vest or, where applicable, are ultimately exercised. Employee stock options granted between January 1, 2004 and December 31, 2007 were accounted for under the interpretations issued by the Accounting Research and Development Foundation (ARDF). The Company adopted the intrinsic value method, under which compensation cost was recognized on a straight-line basis over the vesting period. Government Subsidies Amounts received by the Company from the government for the sponsorship of the development of certain products are recognized as subsidy income when realized or as deferred income when unrealized. Pension Costs
- 109 -
The Company has two types of pension plans: Defined benefit and defined contribution. Under the defined benefit pension plans, the related net periodic pension costs are recorded on the basis of actuarial calculations. For employees under the defined contribution pension plans, the related net periodic pension costs are recorded on the basis of the Company’s required monthly contributions to employees’ personal pension accounts over the employees’ service periods. Treasury Stock The reacquisition of issued stock is accounted for by the cost method. Under this method, the reacquisition cost is debited to the treasury stock account. Treasury stock is shown as a deduction to arrive at shareholders’ equity. The Company accounts for its stock held by its subsidiaries as treasury stock. The recorded cost of these treasury shares is based on the carrying value of the investments as shown in the subsidiaries’ book. The resulting gain on investment from cash dividends appropriated to subsidiaries is credited to capital surplus. When the treasury shares are retired, the capital stock and paid-in capital based on the existing equity are debited. If the treasury shares are retired at a price lower than its par value and paid-in capital, the deficiency is credited to paid-in capital from treasury stock. If the treasury shares are retired at a price in excess of its par value and paid-in capital, the excess is debited to paid-in capital from treasury stock. If the balance in paid-in capital from treasury stock is insufficient to absorb the deficiency, the remainder is recorded as a reduction of retained earnings. Income Tax The Company applies the inter-period and intra-period income tax allocation method. Under this method, deferred income taxes are recognized for the tax effects of deductible temporary differences unused loss carryforward and unused tax credits. Valuation allowances are provided to the extent, if any, that it is more likely than not that deferred income tax assets will not be realized. A deferred tax asset or liability is classified as current or noncurrent in accordance with the classification of its related asset or liability. However, if a deferred income tax asset or liability does not relate to an asset or liability in the financial statements, then it is classified as either current or noncurrent based on the expected length of time before it is realized or settled. Tax credits for certain purchases of machinery, equipment and technology, research and development expenditures, personnel training and investments in important technology-based enterprise are recognized in the current period. Adjustments of prior years’ tax liabilities are added to or deducted from the current year’s tax expense. Income tax (10%) on unappropriated earnings generated annually since 1998 is recorded as expense in the year when the shareholders approve the retention of earnings. The Company adopt consolidation income tax filing with Sunplus mMobile Inc. and Sunplus Innovation Technology Inc. The income taxes payable differences between consolidated and the sum of individual are adjusted in the company’s account receivable or account payable. Foreign-currency Transactions ROC Statement of Financial Accounting Standards No. 14 - “Accounting for Foreign-currency Translation and Translation of Foreign Statements,” applies to foreign subsidiaries that use their local currencies as their functional currencies. The consolidated financial statements of foreign subsidiaries are translated into New Taiwan dollars at the following exchange rates: Assets and liabilities - current exchange rate on the balance sheet date; shareholders’ equity - historical rates; and income and expenses - average rate for the year. The resulting translation adjustments are recorded as a separate component of shareholders’ equity. Non-derivative foreign-currency transactions are recorded in New Taiwan dollars at the rates of exchange in effect when the transactions occur. Exchange differences arising from settlement of foreign-currency assets and liabilities are recognized in profit or loss.

- 110 -
At the balance sheet date, foreign-currency monetary assets and liabilities are revalued using prevailing exchange rates and the exchange differences are recognized in profit or loss. At the balance sheet date, foreign-currency nonmonetary assets (such as equity instruments) and liabilities that are measured at fair value are revalued using prevailing exchange rates, with the exchange differences treated as follows:
a. Recognized in shareholders’ equity if the changes in fair value are recognized in shareholders’ equity;
b. Recognized in profit and loss if the changes in fair value is recognized in profit or loss. Foreign-currency nonmonetary assets and liabilities that are carried at cost continue to be stated at exchange rates at trade dates. If the functional currency of an equity-method investee is a foreign currency, translation adjustments will result from the translation of the investee’s financial statements into the reporting currency of the Company. Such adjustments are accumulated and reported as a separate component of shareholders’ equity. Reclassifications Certain accounts in the consolidated financial statements as of and for the year ended December 31, 2007 have been reclassified to conform to the presentation of consolidated financial statements as of and for the year ended December 31, 2008.
3. ACCOUNTING CHANGES
a. Statement of Financial Accounting Standards (“Statement” or SFAS) No. 37 - “Accounting for Intangible Assets” The Company adopted the recently released SFAS No. 37 - “Accounting for Intangible Assets” and the related revised revisions of previously released Statements. Thus, the Company re-evaluate the useful lives and the amortization method applied to intangible assets. The accounting changes had no impact on the Company’s consolidated net income for the year ended December 31, 2008.
b. ARDF Interpretation 96-052, “Accounting for Bonuses to Employees, Directors and
Supervisors” In March 2007, the ARDF issued an interpretation that requires companies to recognize as compensation expenses bonuses paid to employees, directors and supervisors beginning January 1, 2008. These bonuses were previously recorded as appropriations from earnings. The adoption of this interpretation resulted in a decrease of $105,095 thousand in consolidated net income and a decrease of $0.18 in basic and diluted earnings per share for the year ended December 31, 2008.
c. Accounting for Employee Stock Options
On January 1, 2008, the Company adopted the newly released SFAS No. 39, “Accounting for Share-based Payment” to account for employee stock options. The accounting changes had no impact on the Company’s consolidated net income for the year ended December 31, 2008. The Accounting Research and Development Foundation of the R.O.C. revised Statement of Financial Accounting Standards No. 10, “Accounting for Inventories” (SFAS No. 10) in November 2007, which requires inventories to be stated at the lower of cost or net realizable value item by item. Inventories are recorded by the specific identification method, first-in, first-out method or weighted average method. The last-in, first-out method is no longer permitted. The revised SFAS No. 10 should be applied to financial statements for the fiscal

- 111 -
years beginning on or after January 1, 2009. Early adoption is permitted. 4. FINANCIAL INSTRUMENTS AT FAIR VALUE THROUGH PROFIT OR LOSS December 31 2008 2007
Financial assets at fair value through profit or loss Forward exchange contracts $2,189 $112 Financial liability at fair value through profit or loss Forward exchange contracts $- $5,392
The Company entered into derivative contracts during the years ended December 31, 2008 and 2007 to hedge the effect of exchange rate fluctuations on net foreign currency-denominated assets and liabilities. The strategy is to hedge most of the market price risks to which the Company is exposed. The strategy is to hedge most of the market price risks to which the Company is exposed. As of December 31, 2008 and 2007, outstanding forward exchange contracts were as follows:
December 31, 2008 Currency Maturity Contract Amount
(in Thousand) Sell forward exchange contracts
US$ to NT$ November 17, 2008 - February 19, 2009 US$6,000
December 31, 2007 Currency Maturity Contract Amount
(in Thousand) Sell forward exchange contracts
US$ to NT$ November 16, 2007 - February 27, 2008 US$32,500
Net losses arising from financial instruments held for trading were $4,981 thousand and $5,799 thousand for the years ended December 31, 2008 and 2007, respectively.
Other information on the financial instruments designated at fair value through profit or loss is as follows:
Principal Amount
(in Thousands) Carrying Amount Maturity
2008
Inverse floaters: Time deposits with floating interest rate indexed to LIBOR rates
$5,000 $162,122 April 2014
2007
Inverse floaters: Time deposits with floating interest rate indexed to LIBOR rates
$6,000 $167,676 September 2010 - April 2014
Net gains arising from financial assets designated at fair value through profit or loss were $25,286 thousand and $24,606 thousand for the years ended December 31, 2008 and 2007, respectively.
As a holder of the above products, the Company will lose part of the principals if it breaks the related contracts before maturity, as stipulated in the principal and profit guarantee terms of the contracts.

- 112 -
5. NOTES AND ACCOUNTS RECEIVABLE - OTHERS December 31 2008 2007
Notes receivable $100 $4,043 Accounts receivable 1,703,460 3,002,881 Deduct: Allowance for doubtful accounts 59,113 87,572 Deduct: Allowance for sales returns and discounts 35,927 -
$1,608,520 $ 2,919,352
Allowance for doubtful accounts movement: Years Ended December 31 2008 2007
Balance, beginning of year $87,572 $55,213 Add: Provision for doubtful accounts 1,768 32,465 Deduct: Amounts written off 21,281 41 Deduct: Reversal of provision 8,946 65 Balance, end of year $59,113 $87,572
6. INVENTORIES December 31 2008 2007
Finished goods and merchandise $1,509,373 $1,733,068 Work in process 1,008,761 1,188,669 Raw materials 714,084 456,396 3,232,218 3,378,133 Deduct: Allowance for losses 416,709 474,835
$2,815,509 $2,903,298
Allowance for losses movement: Years Ended December 31 2008 2007
Balance, beginning of year $474,835 $450,001 Add: Provision for losses 325,080 288,404 Deduct: Amounts written off 383,206 263,570 Balance, end of year $416,709 $474,835

- 113 -
7. EQUITY-METHOD INVESTMENTS December 31 2008 2007
Amount % of
Ownership Amount % of
Ownership Equity method investment
Giantplus Technology Co., Ltd. $1,870,627 21 $1,171,730 32 Goldkey Technology Corp. 34,782 24 38,675 32 Synerchip Co., Ltd. 21,903 25 45,103 24
$1,927,312 $1,255,508
Credit balance on carrying value of long-term investments
Jet Focus Ltd. $11,493 44 $11,364 44
The carrying value of the investments accounted for by the equity method and the related investment income (losses) were based on the investees’ audited financial statements for the same reporting years as those of the Company. The investment incomes (losses) of investees were as follows:
Years Ended December 31 2008 2007
Giantplus Technology Co., Ltd. $57,999 $184,805 Goldkey Technology Corp. 8,694 (12,573) Synerchip Co., Ltd. (49,546) (64,090) Jet Focus Ltd. - (17,142)
$17,147 $91,000
Fair values of listed equity-method investments calculated at their closing prices as of December 31, 2008 and 2007 were as follows:
December 31 2008 2007
Giantplus Technology, Co., Ltd. $888,845 $3,678,476 8. AVAILABLE-FOR-SALE FINANCIAL ASSETS December 31 2008 2007
Open-end funds $442,835 $1,702,260 Listed stocks 363,633 1,209,194 806,468 2,911,454 Current portion (442,835) (1,702,260)
$363,633 $1,209,194 9. FINANCIAL ASSETS CARRIED AT COST December 31 2008 2007
Domestic unlisted stocks $688,205 $715,098

- 114 -
The above investments did not have quoted prices in an active market and their fair value could not be reliably measured. Thus, they were carried at original cost.
10. PROPERTIES December 31 2008 2007
Accumulated depreciation Buildings $163,519 $147,302 Auxiliary equipment 141,393 127,925 Machinery and equipment 403,373 294,261 Testing equipment 440,775 369,418 Transportation equipment 6,009 8,072 Furniture and fixtures 172,162 181,050 Leasehold improvements 43,300 20,727 Other equipment 13,954 8,928
$1,384,485 $1,157,683 11. INTANGIBLE ASSETS, NET December 31 2008 2007
Technology license fees $1,229,574 $1,726,297 Goodwill 246,270 19,757 Patents 66,107 71,651 Software 41,308 50,702 Land grant 36,559 34,688 Technological know-how 12,204 20,833 Deferred pension cost - 653
$1,632,022 $1,924,581
Intangible assets consisted of fees paid to Oak Technology (“Oak”) for the Company to use Oak’s technology on light storage solutions to develop SOC DVD/VCD (system on a chip digital compact disk/video compact disk) players and the fee paid to Royal Philips Electronics (“Philips”) for the Company to use Philips’ technology on Optical Disc Drive (ODD) semiconductor technology. Technological know-how includes the knowledge of CD-RW, Combo, Recordable-DVD, WLAN and Gate Way SOC. Movements of the difference between the cost of investment and the Company’s share in investees’ net assets allocated to goodwill for the years ended December 31, 2008 and 2007 were as follows:
Year Ended December 31 2008 2007
Cost Balance, beginning of year $19,757 $- Amount recognized on business combinations 226,513 19,757 Balance, end of year 246,270 19,757
Accumulated impairment losses Balance, at beginning of year - - Impairment losses recognized - - Balance, end of year - -
Carrying amount $246,270 $19,757

- 115 -
12. DEFERRED CHARGES AND OTHERS December 31 2008 2007
Software and system design, net $246,532 $259,649 Refundable deposits 11,673 14,712 Certificates of golf club membership 7,800 7,800 Others 607 1,370
$266,612 $282,878 13. SHORT-TERM LOANS
December 31 2008 2007 Working capital loans - 2008: Annual interest rate from 2.12%-3.80%; 2007: Annual interest rate from 2.60% to 2.84% $943,880 $338,800 Working capital loans - 2008: US$4,500 thousand, annual interest rate from 1.81%-3.24%; 2007: Annual interest rate at 2.65%-2.78% 647,600 500,000 Working capital loans - 2008: Annual interest rate from 2.76%-3.90%; 2007: Annual interest rate from 2.97%-3.38% 488,000 900,000 Working capital loans - 2008: US$6,822 thousand, annual interest rate at 4.82%-7.83%; 2007: US$6,403 thousand, annual interest rate from 5.61%-6.17% 224,130 207,678 Working capital loans - 2008: Annual interest rate at 2.95%-3.20% 109,000 - Working capital loans - 2008: Annual interest rate at 2.59%-3.24%; 2007: Annual interest rate at 3.03% 10,000 5,000 $2,422,610 $1,951,478
14. COMMERCIAL PAPER PAYABLE December 31, 2007
Secured by guarantees issued by financial institutions - 2007: Repayable by January 2008, annual interest rate at 1.75% $70,000
Discount on commercial paper (118) $69,882 15. LONG-TERM LOANS December 31, 2007
Credit loans: Repayable by April 2008, annual interest rate 2007 at 3.15% $100,000
Secured loans: Repayable in monthly installment, starting from January 2007 to October 2008, annual interest rate at 2.84% 50,000
150,000 Current portion (150,000)
$- 16. PENSION PLAN

- 116 -
The Company’s pension plan under the Labor Pension Act is a defined contribution plan. The rate of contribution by an employer to employees’ personal pension accounts should not be less than 6% of each employee’s monthly salary or wage. The Company has made monthly contributions to employees’ personal pension accounts and recognized pension costs of $88,633 thousand and $73,518 thousand for the years ended December 31, 2008 and 2007, respectively. Before the promulgation of the Act, the Company has had a defined benefit pension plan under the Labor Standards Law. Under this plan, employees should receive either a series of pension payments with a defined annuity or a lump sum that is payable immediately on retirement and is equivalent to 2 base units for each of the first 15 years of service and 1 base unit for each year of service thereafter. The total retirement benefit is subject to a maximum of 45 units. The pension plan provides benefits based on the length of service and the average basic salary of the employee’s final nine months of service. In addition, the Company makes monthly contributions, equal to 2% of salaries, to a pension fund, which is administered by a fund monitoring committee. The fund is deposited in the committee’s name in the Bank of Taiwan as the survivor entity. The Company recognized pension costs of $11,885 thousand and $11,812 thousand for the years ended December 31, 2008 and 2007, respectively. The service periods of employees of the departments spun off by the Sunplus will be included in their periods of service to Orise, Sunplus Innovation and Sunplus mMobile and spun off by the Sunplus mMobile will be included in their periods of service to Sunplus mMedia. The related pension costs will be paid by the Sunplus, Orise, Sunplus Innovation, Sunplus mMobile and Sunplus mMedia (collectively, the “five companies”) in proportion to the employees’ periods of service to the five companies. Other information on the defined pension plan is as follows (including Sunplus, Orise, Generalplus, Sunplus Innovation, Sunplus mMobile and Sunplus mMedia in 2008 and 2007):
a. Components of net pension costs Years Ended December 31 2008 2007
Service costs $4,923 $4,900 Interest costs 8,194 7,641 Projected return on plan assets (3,338) (3,506) Amortization 376 (1,368) Net pension costs $10,155 $7,667
b. Reconciliation of the fund status of the plan and accrued pension costs
December 31 2008 2007
Benefit obligation Vested benefit obligation $- $- Non-vested benefit obligation 103,393 101,080 Accumulated benefit obligation 103,393 101,080 Additional benefits based on future salaries 180,270 172,088 Projected benefit obligation 283,663 273,168
Funded status 162,496 169,889 Unrecognized net transition obligation (24,715) (26,291) Unrecognized net gain (loss) 39,979 38,038 Additional liability - 653
Accrued pension liability $177,760 $182,289
Vested benefit $- $-

- 117 -
c. Actuarial assumptions
Discount rate used in determining present values 2.5% 3.00% Future salary increase rate 4.75%-6.00% 5.25%-6.50% Expected rate of return on plan assets 2.5% 3.00%
17. PARENT’S SHAREHOLDERS’ EQUITY
a. Capital stock Sunplus’ shareholders approved a capital reduction by canceling 511,436 thousand issued and outstanding shares, amounting to $5,114,357 thousand, on December 8, 2006. All related actions, including the decrease in the number of issued and outstanding shares and the actual capital return, were completed in March, 2007. The effective date of capital reduction was January 25, 2007. The shares had a par value of about NT$5.00 on the capital return date; thus, the capital reduction ratio was about 50% of share par value.
b. Employee stock option plan
On March 6, 2003 (2003 option plan) and September 11, 2007 (2007 option plan), the Securities and Futures Bureau approved the Sunplus’ adoption of an employee stock option plan. The plan provides for the grant of 30,000 thousand options and 25,000 thousand options in 2003 and 2007 plan, respectively, with each unit representing one common share. The option rights are granted to qualified employees of the Company and subsidiaries. A total of 55,000 thousand common shares have been reserved for issuance. The options are valid for six years and exercisable at certain percentages after the second anniversary of the grant date. Stock option rights are granted at an exercise price equal to the closing price of the Sunplus’ common shares listed on the Taiwan Stock Exchange on the grant date. All options had been granted or canceled as of December 31, 2008. Outstanding option rights were as follows:
2003 Option Plan 2008 2007
Unit (in Thousands)
Weighted- average
Price (NT$) Unit
(in Thousands)
Weighted- average
Price (NT$)
Beginning outstanding balance 5,154 $47.07 18,399 $27.12 Options granted 243 40.34 302 44.81 Options exercised (179) 32.70 (5,435) 37.93 Options canceled (136) (8,112) Ending outstanding balance 5,082 5,154
2008 Option Plan 2008 2007
Unit (in Thousands)
Weighted- average
Price (NT$) Unit (in
Thousands)
Weighted- average
Price (NT$)
Beginning outstanding balance 25,000 $47.58 - $ - Options granted - - 25,000 47.58 Options issued 1,209 40.52 - - Options cancelled (1,563) - Ending outstanding balance 24,646 25,000
The number of shares and exercise prices of outstanding option have been adjusted to reflect the appropriations of dividends, stock bonuses and issuance of capital stock specified under the Plans.

- 118 -
As of December 31, 2008, the outstanding and exercisable options were as follows:
2003 Option Plan Options Outstanding Options Exercisable
Exercise Price (NT$)
Number of Options (in Thousands)
Weighted- average
Remaining Contractual Life (Years)
Weighted- average Exercise
Price (NT$)
Number of Options (in Thousands)
Weighted- average Exercise
Price (NT$) $27.8 1,981 0.35 $27.8 1,981 $27.8 48.3 3,101 0.66 48.3 3,101 48.3
2007 Option Plan Options Outstanding Options Exercisable
Exercise Price (NT$)
Number of Options (in Thousands)
Weighted- average
Remaining Contractual Life (Years)
Weighted- average Exercise
Price (NT$)
Number of Options (in Thousands)
Weighted- average Exercise
Price (NT$)
$40.4 18,346 4.87 $40.4 - $40.4 40.9 6,300 4.99 40.9 - 40.9 The pro forma information for the years ended December 31, 2008 and 2007 assuming employee stock options granted before December 31, 2007 were accounted for under SFAS No. 39 is as follows:
2008 2007
Net income attributable to shareholders of the parent Net income as reported $8,383 $2,061,502 Pro forma net income (loss) $(302,747) $2,010,343
Consolidated earnings per share (EPS; in New Taiwan dollars)
Basic EPS as reported $0.01 $3.28 Pro forma basic EPS $(0.51) $3.20 Diluted EPS as reported $0.01 $3.27 Pro forma diluted EPS $(0.51) $3.19
c. Global depositary receipts (GDRs)
In March 2001, Sunplus issued 20,000 thousand units of Global Depositary Receipts (GDRs), representing 40,000 thousand common shares consisting of newly issued and originally outstanding shares. The GDRs are listed on the London Stock Exchange (code: SUPD) with an issuance price of US$9.57 per unit. As of December 31, 2008, the outstanding 457 thousand units of GDRs represented 914 thousand common shares.
d. Capital surplus
Under ROC regulations, capital surplus may be used to offset deficit, and only the capital surplus from the issue of stock in excess of par value (including the stock issued for new capital and mergers and surplus arising from treasury stocks transactions) may be transferred to capital as stock dividend; this transfer is restricted to a certain percentage based on shareholders’ ownership. Also, the capital surplus from long-term investments may not be used for any purpose.
e. Appropriation of earnings and dividends
Sunplus’ Articles of Incorporation provide that the following should be appropriated from annual
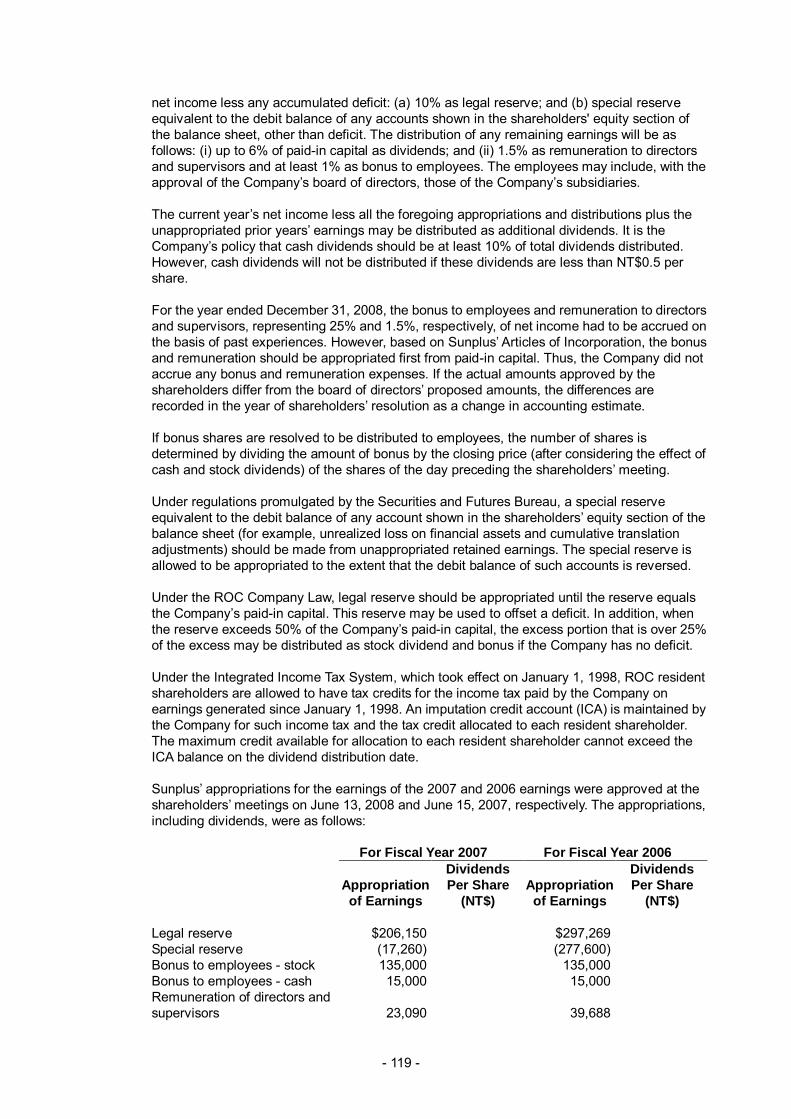
- 119 -
net income less any accumulated deficit: (a) 10% as legal reserve; and (b) special reserve equivalent to the debit balance of any accounts shown in the shareholders' equity section of the balance sheet, other than deficit. The distribution of any remaining earnings will be as follows: (i) up to 6% of paid-in capital as dividends; and (ii) 1.5% as remuneration to directors and supervisors and at least 1% as bonus to employees. The employees may include, with the approval of the Company’s board of directors, those of the Company’s subsidiaries. The current year’s net income less all the foregoing appropriations and distributions plus the unappropriated prior years’ earnings may be distributed as additional dividends. It is the Company’s policy that cash dividends should be at least 10% of total dividends distributed. However, cash dividends will not be distributed if these dividends are less than NT$0.5 per share. For the year ended December 31, 2008, the bonus to employees and remuneration to directors and supervisors, representing 25% and 1.5%, respectively, of net income had to be accrued on the basis of past experiences. However, based on Sunplus’ Articles of Incorporation, the bonus and remuneration should be appropriated first from paid-in capital. Thus, the Company did not accrue any bonus and remuneration expenses. If the actual amounts approved by the shareholders differ from the board of directors’ proposed amounts, the differences are recorded in the year of shareholders’ resolution as a change in accounting estimate. If bonus shares are resolved to be distributed to employees, the number of shares is determined by dividing the amount of bonus by the closing price (after considering the effect of cash and stock dividends) of the shares of the day preceding the shareholders’ meeting. Under regulations promulgated by the Securities and Futures Bureau, a special reserve equivalent to the debit balance of any account shown in the shareholders’ equity section of the balance sheet (for example, unrealized loss on financial assets and cumulative translation adjustments) should be made from unappropriated retained earnings. The special reserve is allowed to be appropriated to the extent that the debit balance of such accounts is reversed. Under the ROC Company Law, legal reserve should be appropriated until the reserve equals the Company’s paid-in capital. This reserve may be used to offset a deficit. In addition, when the reserve exceeds 50% of the Company’s paid-in capital, the excess portion that is over 25% of the excess may be distributed as stock dividend and bonus if the Company has no deficit. Under the Integrated Income Tax System, which took effect on January 1, 1998, ROC resident shareholders are allowed to have tax credits for the income tax paid by the Company on earnings generated since January 1, 1998. An imputation credit account (ICA) is maintained by the Company for such income tax and the tax credit allocated to each resident shareholder. The maximum credit available for allocation to each resident shareholder cannot exceed the ICA balance on the dividend distribution date. Sunplus’ appropriations for the earnings of the 2007 and 2006 earnings were approved at the shareholders’ meetings on June 13, 2008 and June 15, 2007, respectively. The appropriations, including dividends, were as follows:
For Fiscal Year 2007 For Fiscal Year 2006
Appropriation of Earnings
Dividends Per Share
(NT$) Appropriation of Earnings
Dividends Per Share
(NT$)
Legal reserve $206,150 $297,269 Special reserve (17,260) (277,600) Bonus to employees - stock 135,000 135,000 Bonus to employees - cash 15,000 15,000 Remuneration of directors and supervisors 23,090 39,688

- 120 -
Stock dividends 166,637 $0.29990 153,622 $0.29822 Cash dividends 1,388,644 2.49920 2,048,297 3.97620 $1,917,261 $2,411,276
The shareholders also resolved the transfer of $111,092 thousand of capital surplus to paid-in capital in the shareholders’ meeting on June 13, 2008. As of February 27, 2009, the Board of Directors had not resolved the appropriation for earnings of 2008. Information on the bonus to employees, directors and supervisors is available on the Market Observation Post System website of the Taiwan Stock Exchange. Unrealized Gain or Loss on Financial Instruments For the years ended December 31, 2008 and 2007 movement of unrealized gain or loss on financial instrument were as follows:
Available-for-sale Financial Assets
Equity-method Investments
Total
Year ended December 31, 2008
Balance, beginning of year $185,414 $1 $185,415 Sales for the year (122,842) - (122,842) Recognized in shareholders’ equity (624,539) - (624,539) Balance, end of year $(561,967) $1 $(561,966)
Year ended December 31, 2007
Balance, beginning of year $(34,479) $13 $(34,466) Recognized in shareholders’ equity 219,893 (12) 219,881 Balance, end of year $185,414 $1 $185,415
18. TREASURY STOCK
(Units: Shares in Thousands)
Purpose of Purchase Beginning
Shares Increase Decrease Ending Shares
Year ended December 31, 2008
Stocks of Lin Shih Investment Co., Ltd. held by subsidiaries 3,390 170 - 3,560 For subsequent transfer to employees 1,293 - - 1,293
4,683 170 - 4,853
Year ended December 31, 2007
Stocks of Lin Shih Investment Co., Ltd. held by subsidiaries 6,450 160 3,220 3,390 For subsequent transfer to employees 2,582 - 1,289 1,293
9,032 160 4,509 4,683

- 121 -
Starting from January 2002, Sunplus accounted for its issued stocks amounting to $95,605 thousand held by a subsidiary, Lin Shin Investment Co., Ltd., as treasury stock. As of December 31, 2008 and 2007, the book values of these stocks were $63,401 thousand and the market values of these stocks were $46,814 thousand and $164,780 thousand, respectively. Under the Securities and Exchange Act, Sunplus should neither pledge treasury stock nor exercise shareholders’ rights on these shares, such as rights to dividends and to vote. Holders of the shares of Lin Shih Investment Co., Ltd., however, retain shareholders’ rights, except the rights to participate in any share issuance for cash and to vote.
19. PERSONNEL, DEPRECIATION AND AMORTIZATION EXPENSES
Years Ended December 31 2008 2007
Classified as Cost of Sales
Classified as Operating Expense Total
Classified as Cost of Sales
Classified as Operating Expense Total
Labor cost Salary $164,655 $2,211,859 $2,376,514 $195,727 $1,890,369 $2,086,096 Labor/health insurance 11,045 149,805 160,850 12,922 98,967 111,889 Pension 9,173 91,345 100,518 8,284 77,391 85,675 Welfare benefit 4,541 26,854 31,395 5,148 50,561 55,709 Meal 4,163 38,239 42,402 4,202 30,181 34,383 Others 393 6,533 6,926 280 2,989 3,269
$193,970 $2,524,635 $2,718,605 $226,563 $2,150,458 $2,377,021
Depreciation $62,155 $266,759 $328,914 $76,034 $263,497 $339,531 Amortization $7,165 $927,378 $934,543 $2,760 $880,735 $883,495
20. INCOME TAX
a. A reconciliation of income tax expense on income before income tax at statutory rate and current income tax expense before tax credits is shown below:
2008 2007
Income tax expense before tax credits Domestic $107,097 $464,297 Foreign 232 -
107,329 464,297 Net change in deferred income taxes
Domestic (53,953) (313,407) Foreign (7,299) 5,489
Investment tax credits used (60,624) (243,798) Loss carry forwards used (1,450 ) (13,195) Adjustment of prior years’ income tax expense 7,649 333,430 Income tax (10%) on undistributed earnings 34,102 39,627 Additional income tax under the Alternative Minimum Tax Act 32,747 - Income tax expense $58,501 $272,443
b. Deferred income tax assets consisted of the following:
December 31 2008 2007
Current:

- 122 -
Loss carryforwards $81,166 $92,047 Investment tax credits 416,021 207,172 Temporary differences 83,671 109,652 Deduct: Valuation allowance 220,098 184,678
$360,760 $224,193
Noncurrent: Loss carryforwards $649,415 $814,036 Investment tax credits 1,773,738 1,391,491 Temporary differences 26,674 21,742 Deduct: Valuation allowance 1,676,888 1,379,015
$772,939 $848,254
On January 6, 2009, the Legislative Yuan of the Republic of China passed the amendment of Article 39 of the Income Tax Law, which extends the operating losses carryforward period from five years to ten years. The Company recalculated deferred tax assets according to the amended Article. As of December 31, 2008, investment tax credits were as follows:
Regulatory Basis of Tax Credits Items
Total Creditable Amounts
Remaining Creditable Amounts
Expiry Year
$102,580 $102,042 2013
101,500 101,500 2014 183,002 183,002 2015 44,047 44,047 2016
176,327 176,327 2017
Income Tax Law Loss carryforwards
123,663 123,663 2018 $731,119 $730,581
$3,606 $3,606 2009 Statute for Upgrading Industries
Purchase of machinery and equipment
1,005 1,005 2011
$4,611 $4,611
$344,105 $344,105 2009 551,246 507,510 2010
722,856 707,242 2011
Statute for Upgrading Industries
Research and development expenditures
623,793 623,793 2012 $2,242,000 $2,182,650
$86 $86 2009 33 33 2010
209 209 2011
Statute for Upgrading Industries
Personnel training expenditures
140 140 2012 $468 $468 Statute for Upgrading Industries
Investments in important technology-based
$2,030 $2,030 2010
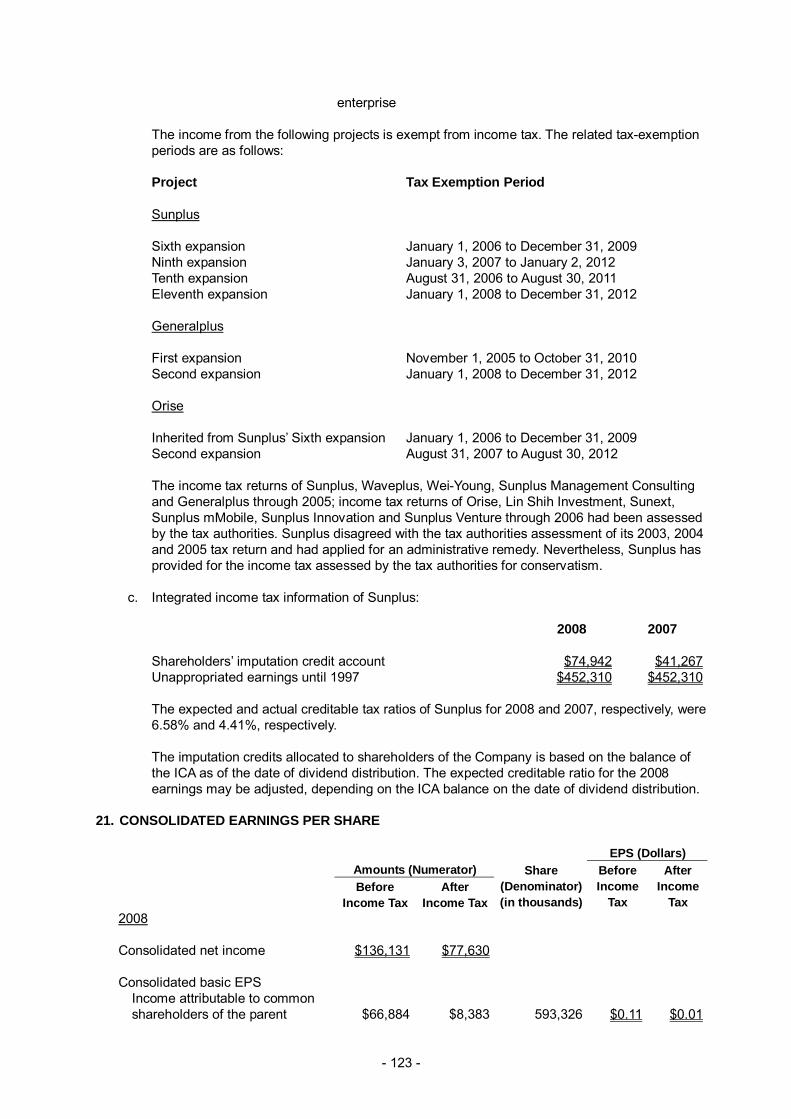
- 123 -
enterprise The income from the following projects is exempt from income tax. The related tax-exemption periods are as follows:
Project Tax Exemption Period
Sunplus Sixth expansion January 1, 2006 to December 31, 2009 Ninth expansion January 3, 2007 to January 2, 2012 Tenth expansion August 31, 2006 to August 30, 2011 Eleventh expansion January 1, 2008 to December 31, 2012 Generalplus First expansion November 1, 2005 to October 31, 2010 Second expansion January 1, 2008 to December 31, 2012 Orise Inherited from Sunplus’ Sixth expansion January 1, 2006 to December 31, 2009 Second expansion August 31, 2007 to August 30, 2012
The income tax returns of Sunplus, Waveplus, Wei-Young, Sunplus Management Consulting and Generalplus through 2005; income tax returns of Orise, Lin Shih Investment, Sunext, Sunplus mMobile, Sunplus Innovation and Sunplus Venture through 2006 had been assessed by the tax authorities. Sunplus disagreed with the tax authorities assessment of its 2003, 2004 and 2005 tax return and had applied for an administrative remedy. Nevertheless, Sunplus has provided for the income tax assessed by the tax authorities for conservatism.
c. Integrated income tax information of Sunplus:
2008 2007
Shareholders’ imputation credit account $74,942 $41,267 Unappropriated earnings until 1997 $452,310 $452,310
The expected and actual creditable tax ratios of Sunplus for 2008 and 2007, respectively, were 6.58% and 4.41%, respectively. The imputation credits allocated to shareholders of the Company is based on the balance of the ICA as of the date of dividend distribution. The expected creditable ratio for the 2008 earnings may be adjusted, depending on the ICA balance on the date of dividend distribution.
21. CONSOLIDATED EARNINGS PER SHARE EPS (Dollars) Amounts (Numerator)
Before
Income Tax After
Income Tax
Share (Denominator) (in thousands)
Before Income
Tax
After Income
Tax 2008
Consolidated net income $136,131 $77,630
Consolidated basic EPS
Income attributable to common shareholders of the parent $66,884 $8,383 593,326 $0.11 $0.01
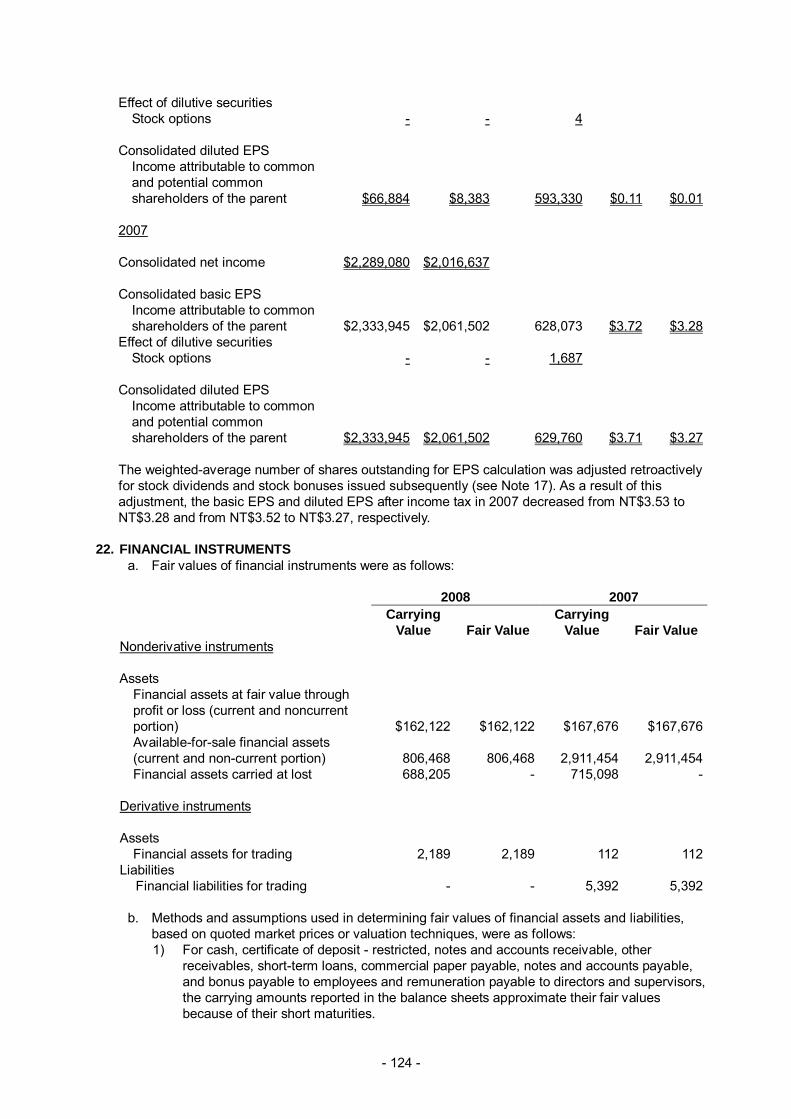
- 124 -
Effect of dilutive securities Stock options - - 4
Consolidated diluted EPS
Income attributable to common and potential common shareholders of the parent $66,884 $8,383 593,330 $0.11 $0.01
2007
Consolidated net income $2,289,080 $2,016,637
Consolidated basic EPS
Income attributable to common shareholders of the parent $2,333,945 $2,061,502 628,073 $3.72 $3.28
Effect of dilutive securities Stock options - - 1,687
Consolidated diluted EPS
Income attributable to common and potential common shareholders of the parent $2,333,945 $2,061,502 629,760 $3.71 $3.27
The weighted-average number of shares outstanding for EPS calculation was adjusted retroactively for stock dividends and stock bonuses issued subsequently (see Note 17). As a result of this adjustment, the basic EPS and diluted EPS after income tax in 2007 decreased from NT$3.53 to NT$3.28 and from NT$3.52 to NT$3.27, respectively.
22. FINANCIAL INSTRUMENTS
a. Fair values of financial instruments were as follows: 2008 2007 Carrying
Value Fair Value Carrying
Value Fair Value Nonderivative instruments
Assets
Financial assets at fair value through profit or loss (current and noncurrent portion) $162,122 $162,122 $167,676 $167,676 Available-for-sale financial assets (current and non-current portion) 806,468 806,468 2,911,454 2,911,454 Financial assets carried at lost 688,205 - 715,098 -
Derivative instruments
Assets
Financial assets for trading 2,189 2,189 112 112 Liabilities
Financial liabilities for trading - - 5,392 5,392
b. Methods and assumptions used in determining fair values of financial assets and liabilities, based on quoted market prices or valuation techniques, were as follows: 1) For cash, certificate of deposit - restricted, notes and accounts receivable, other
receivables, short-term loans, commercial paper payable, notes and accounts payable, and bonus payable to employees and remuneration payable to directors and supervisors, the carrying amounts reported in the balance sheets approximate their fair values because of their short maturities.

- 125 -
2) Fair values of financial assets at fair value through profit or loss and available-for-sale financial assets are based on their quoted prices in active markets. For those instruments not traded in active markets, their fair values are determined using valuation techniques incorporating estimates and assumptions that are consistent with prevailing market conditions.
3) Financial assets carried t cost had no quoted prices in an active market and their fair value could not be reliably measured.
4) Fair value of long-term loans is estimated using the present value of future cash flows discounted by the interest rates the Company may obtain for similar loans (e.g., similar maturities). The fair values of the Company’s long-term bank loans are also their carrying values because they bear floating interest rates.
c. Gains recognized for the changes in fair value of financial instruments using valuation
techniques were $19,604 thousand and $12,241 thousand for the years ended December 31, 2008 and 2007.
d. As of December 31, 2008 and 2007, financial assets exposed to cash flow interest rate risk
were $1,702,007 thousand and $1,217,112 thousand, respectively; financial assets exposed to fair value interest rate risk were $1,930,847 thousand and $1,681,022 thousand, respectively; As of December 31, 2008 and 2007; financial liabilities exposed to fair value interest rate risk were $1,815,610 thousand and $908,682 thousand, respectively, and financial liabilities exposed to cash flow interest rate risk were $607,000 thousand and $1,262,678 thousand, respectively.
e. Interest income arising from the financial assets other than the financial assets at fair value
through profit or loss for the years ended December 31, 2008 and 2007 were $52,074 thousand and $56,902 thousand, respectively; interest expense arising from the financial assets other than the financial assets at fair value through profit or loss for the years ended December 31, 2008 and 2007 were $91,204 thousand and $80,097 thousand, respectively.
f. Financial risks
1) Market risk. The financial instruments held by the Company are exposed to interest rate, foreign exchange rate and price risks. Fair values of inverse floaters are influenced by exchange rate fluctuations. Fair values of held-for-trading and available-for-sale security investments are affected by fluctuations of quoted prices.
2) Credit risk. The Company will incur a loss if the counter-parties or third-parties breach the contracts, which are affected by such factors as the concentrations of counter parties, components of financial instruments, contract amounts, and the receivables on the contracts. Thus, contracts with positive fair values on the balance sheet date are evaluated for credit risk. As of December 31, 2008 and 2007, credit risks of the financial assets, except those approximate to their carrying values, were as follows:
2008 2007 Carrying
Amount Credit Risk
Carrying Amount
Credit Risk
Held-for-trading financial assets Forward exchange contracts $2,189 $2,189 $112 $112
3) Liquidity risk. Investments in inverse floaters and financial assets carried at cost do not have an active market. Thus, the liquidity risk of these investments is material. On the other hand, held-for-trading and available-for-sale security investments are expected to be settled readily at amounts approximating their fair values in active markets.
4) Cash flow interest rate risk. Partial short-term loans and long-term bank loans bear floating interest rates. Thus, the fluctuations of market interest rates will affect the Company’s future cash flows.

- 126 -
23. RELATED-PARTY TRANSACTIONS The Company’s related parties were as follows:
a. Global View Co., Ltd. (“Global View”) - the supervisor of Sunplus and Waveplus. b. Giantplus Technology Co., Ltd. (“Giantplus”) - equity -method investee. c. Kunshan Giantplus Optoelectronics Technology Co., Ltd. (“Kunshan Giantplus”) - 100%
indirect Subsidiary of Giantplus. d. Lin Shin Technology Co., Ltd. (“Lin Shin”) - equity method indirect investee of Russell Holding
Ltd. e. Synerchip Co., Ltd. (“Synerchip”) - equity method investee of Russell Holding Ltd. f. Coolsand Technologies SARL (“Coolsand”) - equity method indirect investee of Russell
Holding Ltd. g. AU Optronics Corp. (“AUO”) - the subsidiary of AUO is the director of Orise. h. AU Optronics (Labuan) Corporation (AUL) - the subsidiary of AUO i. NXP B.V., (NXP) - the director of Sunext. (Note) j. NXP Semiconductors Taiwan Ltd. (NXP Taiwan) - the subsidiary of NXP. (Note) k. Zhuang, Hui-zhen - a spouse of the president. l. Huang, Zhou-fu - a collateral relative by blood within two generations of the president. m. Others - please refer to Note 27 for related parties that do not have business transactions with
the Company in the current period.
Note: As of December 31, 2008, NXP and NXP Taiwan were no longer related parties because NXP, which sold off its entire holding in NXP Taiwan, resigned as director of Sunext. The transactions made with these two parties as of and for the year ended December 31, 2008 are disclosed only for reference. The transactions with the foregoing parties in addition to those disclosed in other notes are summarized as follows:
Years Ended December 31 2008 2007 Amount % Amount %
Sales AUL $1,771,765 11 $1,307,777 6 Kunshan Giantplus 272,716 2 341,382 2 Giantplus 216,236 2 110,150 - AUO 114,550 - 334,850 2 Coolsand 20,973 - 117,049 1 Lin Shin 5,432 - 3,954 - Global View 58 - -
$2,401,730 15 $2,215,162 11
The price and collection terms for products sold to related parties were similar to those for third parties.
Years Ended December 31 2008 2007 Amount % Amount %
Purchase and subcontract costs NXP Taiwan $79,379 - $216,478 - AUO - - 278 -
$79,379 - $216,756 -
The products purchased from related parties were custom-made; thus, the related purchasing prices were not comparable with those for third parties. The payment term is 45 days after receiving products.

- 127 -
Years Ended December 31 2008 2007 Amount % Amount %
Operating expense NXP $124,396 2 $181,941 3 Giantplus 496 - 5,143 - Synerchip 473 - - - Global View 10 - - - Zhuang, Hui-zhen - - 1,961 - Huang, Zhou-fu - - 1,923 - AUO - - 35 -
$125,375 2 $191,003 3
The terms of rental payments and the collections on lease contracts with related parties were similar to those with third parties. The following transactions between the Company and the related parties were based on normal terms.
Years Ended December 31 2008 2007 Amount % Amount %
Nonoperating income and gains Giantplus $1,447 - $2,964 - Lin Shin 273 - 572 - Coolsand - - 36 -
$1,720 - $3,572 -
The transaction prices were negotiated and were thus not comparable with those in the market. December 31 2008 2007 Amount % Amount %
Notes and accounts receivable AUL $584,316 26 $774,862 20 Kunshan Giantplus 21,667 1 115,132 3 AUO 20,335 1 88,347 2 Giantplus 18,711 1 27,767 - Lin Shin 72 - 1,019 - Coolsand - 28,932 1 645,101 29 1,036,059 26 Less: Allowance for doubtful accounts - - 288 -
$645,101 29 $1,035,771 26
Other receivables Lin Shin $211 - $103 - Giantplus - - 8 -
$211 - $111 - December 31 2008 2007 Amount % Amount %

- 128 -
Notes and accounts payable Giantplus $119 - $- - NXP Taiwan - - 5,545 -
$119 - $5,545 -
Other current liabilities NXP $- - $54,641 4 AUO - - 219 -
$- - $54,860 4
Purchase of intangible assets Lin Shin $25,281 6 $- -
Compensation of directors, supervisors and management personnel:
Year Ended December 31 2008 2007 Salaries $82,446 $60,022 Incentives 308 501 Special compensation Bonus 15,081 84,217 $97,835 $144,740
The compensation of directors, supervisors and management personnel for the year ended December 31, 2007 included the bonuses appropriated from earnings for 2007 which had been approved by shareholders in their annual meeting held in 2008.
24. PLEDGED OR MORTGAGED ASSETS
Certain assets pledged or mortgaged as collateral for purchase and commercial paper payable were as follows:
December 31 2008 2007
Subsidiary’s holding of Sunplus’ stock $44,505 $146,016 Pledged time deposits 13,647 23,265
$58,152 $169,281 25. SIGNIFICANT LONG-TERM OPERATING LEASES
Sunplus Sunplus leases land from the Science-Based Industrial Park Administration under renewable agreements expiring in July 2015, December 2020 and 2021, with annual rentals aggregating $7,862 thousand. Future annual minimum rentals under the leases are as follows:
Year Amount
2009 $7,862 2010 7,862 2011 7,862 2012 7,862

- 129 -
2013 7,862 2014 and thereafter 40,557
$79,867
Orise Orise leases factories from Anpec Electronics Corporation under renewable agreements expiring in April 2011, with annual rentals aggregating $15,751 thousand. Future annual minimum rentals under the leases are as follows:
Year Amount 2009 $15,751 2010 15,751 2011 3,938 $35,440
26. GAIN ON SETTLEMENT COMPENSATION
In February 2003, the Company bought optoelectronic storage department of Oak Technology, Inc. (Oak Technology Inc. merged with Zoran Company) and acquired its related patent. Therefore, in the settlement of the patent authorization between Mediatek and Zoran, the Company and its subsidiary, Sunext, are able to use Mediatek Inc.’s patents of PC optoelectronic storage, Mediatek authorizing this using right of the patent to Zoran, and can obtain part of solatium.
27. ADDITIONAL DISCLOSURES
Following are the additional disclosures required for the Company and its investees by the Securities and Futures Bureau:
a. Endorsement/guarantee provided: Table 1 (attached) b. Marketable securities held: Table 2 (attached) c. Marketable securities acquired and disposed of at costs or prices of at least NT$100 million or
20% of the paid-in capital: Table 3 (attached) d. Acquisition of long-term investments costs of at least NT$100 million or 20% of the paid-in
capital: Table 4 (attached) e. Total purchase from or sale to related parties amounting to at least NT$100 million or 20% of
the paid-in capital: Table 5 (attached) f. Receivable from related parties amounting to at least NT$100 million or 20% of the paid-in
capital: Table 6 (attached) g. Names, locations, and related information of investees on which the Company exercises
significant influences: Table 7 (attached) h. Investment in Mainland China: Table 8 (attached) i. Intercompany relationships and significant intercompany transactions: Table 9 (attached)
28. SEGMENT INFORMATION
a. Industry information: The Company only manufactures and sells value-added consumer integrated circuits.
b. Geographic information:
In 2008 and 2007, 90% of the Company’s revenue was generated in Taiwan and 90% of identifiable assets were located in Taiwan.

- 130 -
c. Export sales:
Area 2008 2007 Asia $10,485,056 $14,972,878 Others 555,040 784,798 $11,040,096 $15,757,676
d. Sales to customer representing at least 10% of net sales:
2008 2007
Customer Amount % Amount % A $2,023,691 13 $3,419,127 17 B and subsidiary 1,886,315 12 1,642,627 8 C 1,704,998 11 2,454,955 12

131
TABLE 1 SUNPLUS TECHNOLOGY COMPANY LIMITED ENDORSEMENT/GUARANTEE PROVIDED YEAR ENDED DECEMBER 31, 2008 (In Thousands of New Taiwan Dollars, Unless Stated Otherwise)
Counter-party
No. Endorsement/Guarantee Provider Name Nature of Relationship
Limits on Each Counter-party’s Endorsement/
Guarantee Amounts
Maximum Balance for the Period
Ending Balance
Value of Collateral Property, Plant, or
Equipment
Percentage of Accumulated Amount of Collateral to Net
Equity of the Latest Financial Statement
Maximum Collateral/ Guarantee Amounts
Allowable
0 Sunplus Technology Company Limited Sunext Technology Co., Ltd. 79% Subsidiary $1,095,042 (Note 1)
$760,000 $630,000 $ - 5.75% $2,190,084 (Note 2)
Sunplus mMobile Inc. 91% Subsidiary 1,095,042 (Note 1)
577,293 577,293 - 5.27% 2,190,084 (Note 2)
Sunplus Technology (Shanghai) Co., Ltd.
99% Indirect subsidiary 1,095,042 (Note 1)
329,825 306,000 - 2.79% 2,190,084 (Note 2)
Sunplus mMedia Inc. 78% Subsidiary 1,095,042 (Note 1)
479,442 227,000 - 2.07% 2,190,084 (Note 2)
Sunplus Innovation Technology Inc. 84% Subsidiary 1,095,042 (Note 1)
323,550 130,000 - 1.19% 2,190,084 (Note 2)
Sunplus Core Technology Inc. 57% Subsidiary 1,095,042 (Note 1)
60,000 60,000 - 0.55% 2,190,084 (Note 2)
Generalplus Technology Inc. Equity-method investee 1,095,042 (Note 1)
30,000 30,000 - 0.27% 2,190,084 (Note 2)
Waveplus Technology Co., Ltd. Equity-method investee 1,095,042 (Note 1)
20,000 20,000 - 0.18% 2,190,084 (Note 2)
Lin Shin Technology Co., Ltd. Indirect equity-method investee 1,095,042 (Note 1)
10,000 10,000 - 0.09% 2,190,084 (Note 2)
1 Sunplus mMedia Inc. Sunplus mMobile Inc. Equity-method investee of Sunplus mMobile Inc.
127,362 (Note 3)
120,000
-
- - 254,725 (Note 4)
Note 1: For each transaction entity, the amount should not exceed 10% of the endorsement/guarantee provider’s net equity. Note 2: The amount should not exceed 20% of the endorsement/guarantee provider’s net equity. Note 3: For each transaction entity, the amount should not exceed 10% of the endorsement/guarantee provider’s net equity based on the latest audited or reviewed financial statements. Note 4: The amount should not exceed 20% of the endorsement/guarantee provider’s net equity based on the latest audited or reviewed financial statements.

132
TABLE 2 SUNPLUS TECHNOLOGY COMPANY LIMITED MARKETABLE SECURITIES HELD YEAR ENDED DECEMBER 31, 2008 (In Thousands of New Taiwan Dollars, Unless Stated Otherwise)
December 31, 2008 Holding Company Name Type and Issuer/Name of Marketable
Security Relationship with the Holding
Company Financial Statement Account Shares or Units (Thousands) Carrying Value Percentage of
Ownership (%) Market Value or Net Asset Value
Note
Sunplus Technology Company Limited Stock Giantplus Technology Co., Ltd. Equity-method investee Equity-method investments 84,652 $ 1,870,627 21 $1,870,627 Note 1 Orise Technology Co., Ltd. Equity-method investee Equity-method investments 72,090 1,245,799 55 1,245,842 Notes 1 and 7 Sunplus mMedia Inc Equity-method investee Equity-method investments 64,500 708,757 78 710,341 Notes 1 and 8 Sunplus Venture Capital Co., Ltd. Equity-method investee Equity-method investments 100,000 624,889 100 624,889 Note 1 Lin Shih Investment Co., Ltd. Equity-method investee Equity-method investments 70,000 607,241 100 607,241 Notes 1 and 4 Generalplus Technology Inc. Equity-method investee Equity-method investments 27,942 475,292 41 475,292 Note 1 Ventureplus Group Inc. Equity-method investee Equity-method investments 24,700 428,478 100 428,478 Note 1 Russell Holdings Limited Equity-method investee Equity-method investments 14,760 419,813 100 423,387 Notes 1 and 9 Sunplus Innovation Technology Inc. Equity-method investee Equity-method investments 22,660 392,361 84 392,361 Note 1 Sunext Technology Co., Ltd. Equity-method investee Equity-method investments 78,995 244,058 79 102,938 Note 1 Sunplus Core Technology Co., Ltd. Equity-method investee Equity-method investments 8,898 17,857 57 17,857 Note 1 Waveplus Technology Co., Ltd. Equity-method investee Equity-method investments 1,302 16,742 41 16,742 Note 1 Goldkey Technology Corp. Equity-method investee Equity-method investments 1,702 16,584 12 16,584 Note 1 Global Techplus Capital Inc. Equity-method investee Equity-method investments 200 7,852 100 7,852 Note 1 Wei-Young Investment Inc. Equity-method investee Equity-method investments 1,400 5,167 100 5,167 Note 1 Sunplus Technology (H.K.) Co., Ltd. Equity-method investee Equity-method investments 11,075 4,817 100 4,817 Note 1 Sunplus Management Consulting Inc. Equity-method investee Equity-method investments 500 4,194 100 4,194 Note 1 Sunplus mMobile Inc. Equity-method investee Equity-method investments 120,000 (141,111) 91 (126,725) Note 6 Global View Co., Ltd. The Company’s supervisor Available-for-sale financial assets 13,568 121,295 11 121,295 Note 3 RITEK Corp. The Company’s director Available-for-sale financial assets 5,000 21,648 - 21,648 Note 3 United Microelectronics Corp. - Available-for-sale financial assets 1,967 14,619 - 14,619 Note 3 Technology Partners Venture Capital Corp. - Financial assets carried at cost 2,222 22,223 11 22,223 Note 2 Network Capital Global Fund - Financial assets carried at cost 1,333 13,333 7 13,333 Note 2 Inverse floaters issued by Citibank - Financial assets at fair value through
profit or loss - 162,122 - 162,122
Fund Yuanta Commercial Bank Money Market
Common Trust Fund - Available-for-sale financial assets 13,114 135,036 - 135,036 Note 5
Polaris De-Bao Fund - Available-for-sale financial assets 2,273 26,026 - 26,026 Note 5 NITC Taiwan Bond Fund - Available-for-sale financial assets 177 30,032 - 30,032 Note 5 Orise Technology Co. Ltd. Jih Sun Bond Fund - Available-for-sale financial assets 3,052 42,904 - 42,904 Note 5 Prudential Financial Band Fund - Available-for-sale financial assets 3,823 57,673 - 57,673 Note 5 Sunplus mMobile Inc. Sunplus mMedia Inc. Equity-method investee Equity-method investments 500 5,528 1 5,528 Note 1 Sunplus mMobile SAS Equity-method investee Equity-method investments 237 11,318 100 11,318 Note 1 Sunplus mMobile Limited Equity-method investee Equity-method investments 500 (57,294) 100 (57,294) Note 6 Sunplus mMobile Holding Inc. Equity-method investee Equity-method investments 2,580 $2,156 100 $ 2,156 Note 1 Prudential Financial Bond Fund - Available-for-sale financial assets 5 77 - 77 Note 5 Ta Chong bond - Available-for-sale financial assets 1 7 - 7 Note 5 Yuanta Wan Tai Bond Fund - Available-for-sale financial assets 1,674 24,148 - 24,148 Note 5 Sunplus mMobile Holding Bright Sunplus mMobile Inc. Equity-method investee Equity-method investments 2,515 US$1
thousand 100 US$1
thousand Note 1
Sunplus mMedia Inc. Prudential Financial Bond Fund - Available-for-sale financial assets 2,195 34,149 - 34,149 Note 5 Capital Income Fund - Available-for-sale financial assets 1,759 27,040 - 27,040 Note 5

133
December 31, 2008 Holding Company Name Type and Issuer/Name of Marketable
Security Relationship with the Holding
Company Financial Statement Account Shares or Units (Thousands) Carrying Value Percentage of
Ownership (%) Market Value or Net Asset Value
Note
Yuanta Wan Tai Bond Fund - Available-for-sale financial assets 3,466 50,014 - 50,014 Note 5 NITC Taiwan Bond Fund - Available-for-sale financial assets 1,081 15,729 - 15,729 Note 5 Lin Shih Investment Co., Ltd. Stock Goldkey Technology Corp. Equity-method investee Equity-method investments 1,866 18,198 13 18,198 Note 1 Waveplus Technology Co., Ltd. Equity-method investee Equity-method investments 522 6,709 16 6,709 Note 1 Sunext Technology Co., Ltd. Equity-method investee Equity-method investments 6,499 8,500 7 8,500 Note 1 Generalplus Technology Inc. Equity-method investee Equity-method investments 12,653 215,210 19 215,210 Note 1 Sunplus Core Technology Co., Ltd. Equity-method investee Equity-method investments 2,000 4,013 13 4,013 Note 1 Sunplus mMobile Inc. Equity-method investee Equity-method investments 3,055 12,112 2 (3,683) Note 1 Sunplus mMedia Inc. Equity-method investee Equity-method investments 2,483 31,457 3 31,457 Note 1 Sunplus Innovation Technology Inc. Equity-method investee Equity-method investments 452 6,619 2 6,619 Note 1 Sunplus Technology Company Limited Parent company Available-for-sale financial assets 3,560 46,814 1 46,814 Note 3 Ability Enterprise Co., Ltd. - Available-for-sale financial assets 5,120 105,480 1 105,480 Note 3 RITEK Corp. - Available-for-sale financial assets 833 3,608 - 3,608 Note 3 Elite Advanced Laser Corp. - Available-for-sale financial assets 667 6,666 1 6,666 Note 3 AIPTEK International Inc. - Available-for-sale financial assets 199 1,022 - 1,022 Note 3 Radiant Innovation Inc. - Available-for-sale financial assets 1,933 27,346 8 27,346 Note 3 Minton Optic Industry Co., Ltd. - Financial assets carried at cost 4,272 79,643 7 79,643 Note 2 NCTU Spring Venture Capital Co., Ltd. - Financial assets carried at cost 2,000 - 6 - Note 2 GemFor Tech. Co., Ltd. - Financial assets carried at cost 831 10,685 6 10,685 Note 2 MaxEmil Photonics Corporation - Financial assets carried at cost 426 8,273 2 8,273 Note 2 WayTech Development Inc. - Financial assets carried at cost 1,500 - 5 - Note 2 Miracle Technology Co., Ltd. - Financial assets carried at cost 1,295 13,940 9 13,940 Note 2 Socle Technology Corp. - Financial assets carried at cost 250 6,250 - 6,250 Note 2 Glokie Technology Corp. - Financial assets carried at cost 2,300 23,000 14 23,000 Note 2 Genius Vision Digital Co., Ltd. - Financial assets carried at cost 600 6,000 13 6,000 Note 2 Lingri Technology Co., Ltd. - Financial assets carried at cost 304 3,040 19 3,040 Note 2 Russell Holdings Limited Stock Jet Focus Limited Equity-method investee Equity-method investments 4,794 US$(350)
thousand 44 US$(350)
thousand Note 6
Synerchip Co., Ltd. Equity-method investee Equity-method investments 4,236 US$667 thousand
25 US$667 thousand
Note 1
Sunext Technology Co., Ltd. Equity-method investee Equity-method investments 855 US$2,124 thousand
1 US$34 thousand
Note 1
Shang-Hai Fudan Microelectronics Company Limited
- Available-for-sale financial assets 7,280 US$301 thousand
- US$301 thousand
Note 3
InveStar Excelsus Venture Capital (Int’l), Inc., LDC
- Financial assets carried at cost - US$- thousand
19 US$- thousand
Note 2
OZ Optics Ltd. - Financial assets carried at cost 1,000 US$250 thousand
8 US$250 thousand
Note 2
Aicent, Inc. - Financial assets carried at cost 1,000 US$500 thousand
2 US$500 thousand
Note 2
Ortega InfoSystem, Inc. - Financial assets carried at cost 2,557 US$500 thousand
- US$500 thousand
Note 2
Asia B2B on line Inc. - Financial assets carried at cost 1,000 US$- thousand
3 US$- thousand
Note 2
Asia Tech Taiwan Venture Fund - Financial assets carried at cost - US$2,590 Thousand
5 US$2,590 thousand
Note 2
Ether Precision Inc. - Financial assets carried at cost 1,250 US$500 Thousand
1 US$500 thousand
Note 2
Innobrige Venture Fund ILP - Financial assets carried at cost - US$1,400 thousand
- US$1,400 thousand
Note 2
Visualon Inc. - Financial assets carried at cost 377 US$200 thousand
3 US$200 thousand
Note 2

134
December 31, 2008 Holding Company Name Type and Issuer/Name of Marketable
Security Relationship with the Holding
Company Financial Statement Account Shares or Units (Thousands) Carrying Value Percentage of
Ownership (%) Market Value or Net Asset Value
Note
Azalea Networks Inc. - Financial assets carried at cost 850 US$1,150 thousand
2 US$1,150 thousand
Note 2
Sunplus Venture Capital Co., Ltd. Stock Joing Technology Co., Ltd. Equity-method investee Equity-method investments 3,400 $ - 39 $ - Note 1 Waveplus Technology Co., Ltd. Equity-method investee Equity-method investments 387 4,973 12 4,973 Note 1 Sunext Technology Co., Ltd. Equity-method investee Equity-method investments 8,571 11,169 9 11,169 Note 1 Han Young Technology Co., Ltd. Equity-method investee Equity-method investments 420 1,780 70 1,780 Note 1 Generalplus Technology Inc. Equity-method investee Equity-method investments 2,920 49,672 4 49,672 Note 1 Orise Technology Co., Ltd. Equity-method investee Equity-method investments 865 14,478 1 14,478 Note 1 Sunplus Core Technology Co., Ltd. Equity-method investee Equity-method investments 2,000 4,013 13 4,013 Note 1 Sunplus mMobile Inc. Equity-method investee Equity-method investments 142 2,100 - (175) Note 1 Sunplus mMedia Inc. Equity-method investee Equity-method investments 10,000 109,845 12 109,845 Note 1 King Yuan Electronics Co., Ltd. - Available-for-sale financial assets 2,435 16,696 - 16,696 Note 3 AIPTEK International Inc. - Available-for-sale financial assets 1,172 6, 013 1 6, 013 Note 3 Ability Enterprise Co., Ltd. - Available-for-sale financial assets 3,674 75,680 - 75,680 Note 3 Radiant Innovation Inc. - Available-for-sale financial assets 742 10,498 3 10,498 Note 3 Elite Advanced Laser Corp. - Available-for-sale financial assets 166 1,663 - 1,663 Note 3 eWave System, Inc. - Financial assets carried at cost 1,833 - 22 - Note 2 Softchina Venture Capital Corp. - Financial assets carried at cost 407 - 8 - Note 2 Information Technology Total Services - Financial assets carried at cost 51 - - - Note 2 Book4u Company Limited - Financial assets carried at cost 9 - - - Note 2 VenGlobal International Fund - Financial assets carried at cost 1 - 3 - Note 2 Simple Act Inc. - Financial assets carried at cost 1,900 19,000 10 19,000 Note 2 Feature Integration Technology Inc. - Financial assets carried at cost 1,850 24,237 6 24,237 Note 2 Chiabon Venture Capital Co., Ltd. - Financial assets carried at cost 5,000 50,000 5 50,000 Note 2 Cyberon Corporation - Financial assets carried at cost 1,170 13,691 18 13,691 Note 2 WayTech Development Inc. - Financial assets carried at cost 1,000 - 4 - Note 2 Miracle Technology Co., Ltd. - Financial assets carried at cost 1,303 $ 14,025 9 $14,025 Note 2 Socle Technology Corp. - Financial assets carried at cost 550 13,750 1 13,750 Note 2 MaxEmil Photonics Corp. - Financial assets carried at cost 419 12,485 2 12,485 Note 2 Minton Optic Industry Co., Ltd. - Financial assets carried at cost 5,000 75,000 8 75,000 Note 2 Capella Micro System, Inc. - Financial assets carried at cost 630 9,450 3 9,450 Note 2 Smec Media & Entertainment Corp. - Financial assets carried at cost 2,000 6,667 7 6,667 Note 2 VISCO Inc. - Financial assets carried at cost 2,130 22,365 5 22,365 Note 2 Azalea Networks Inc - Financial assets carried at cost 280 12,923 1 12,923 Note 2 Generalplus Technology Inc. Stock Generalplus International (Samoa) Inc. Subsidiary of Generalplus
Technology Inc. Equity-method investments 3,090 11,174 100 11,174 Note 1
Generalplus International (Samoa) Inc. Stock Generalplus (Mauritius) Inc. Subsidiary of Generalplus
International (Samoa) Inc. Equity-method investments 3,090 US$340
thousand 100 US$340
thousand Note 1
Generalplus (Mauritius) Inc. Stock Generalplus Technology (Shenzhen) Co., Ltd. Subsidiary of Generalplus
(Mauritius) Inc. Equity-method investments - US$263
thousand 100 US$263
thousand Note 1
Generalplus Technology (Hong Kong) Co., Ltd.
Subsidiary of Generalplus (Mauritius) Inc.
Equity-method investments - US$77 thousand
100 US$77 thousand
Note 1
Sunext Technology Co., Ltd. Stock Great Sun Corp. Subsidiary of Sunext
Technology Co., Ltd. Equity-method investments 1,750 36,697 100 36,697 Note 1
Great Sun Corp. Stock Sunext (Mauritius) Inc. Subsidiary of Great Sun Corp. Equity-method investments 750 US$119
thousand 100 US$119
thousand Note 1
Sunext (Mauritius) Inc. Stock Sunext Technology (Shanghai) Co., Ltd. Subsidiary of Sunext (Mauritius)
Inc. Equity-method investments - US$118
thousand 100 US$118
thousand Note 1
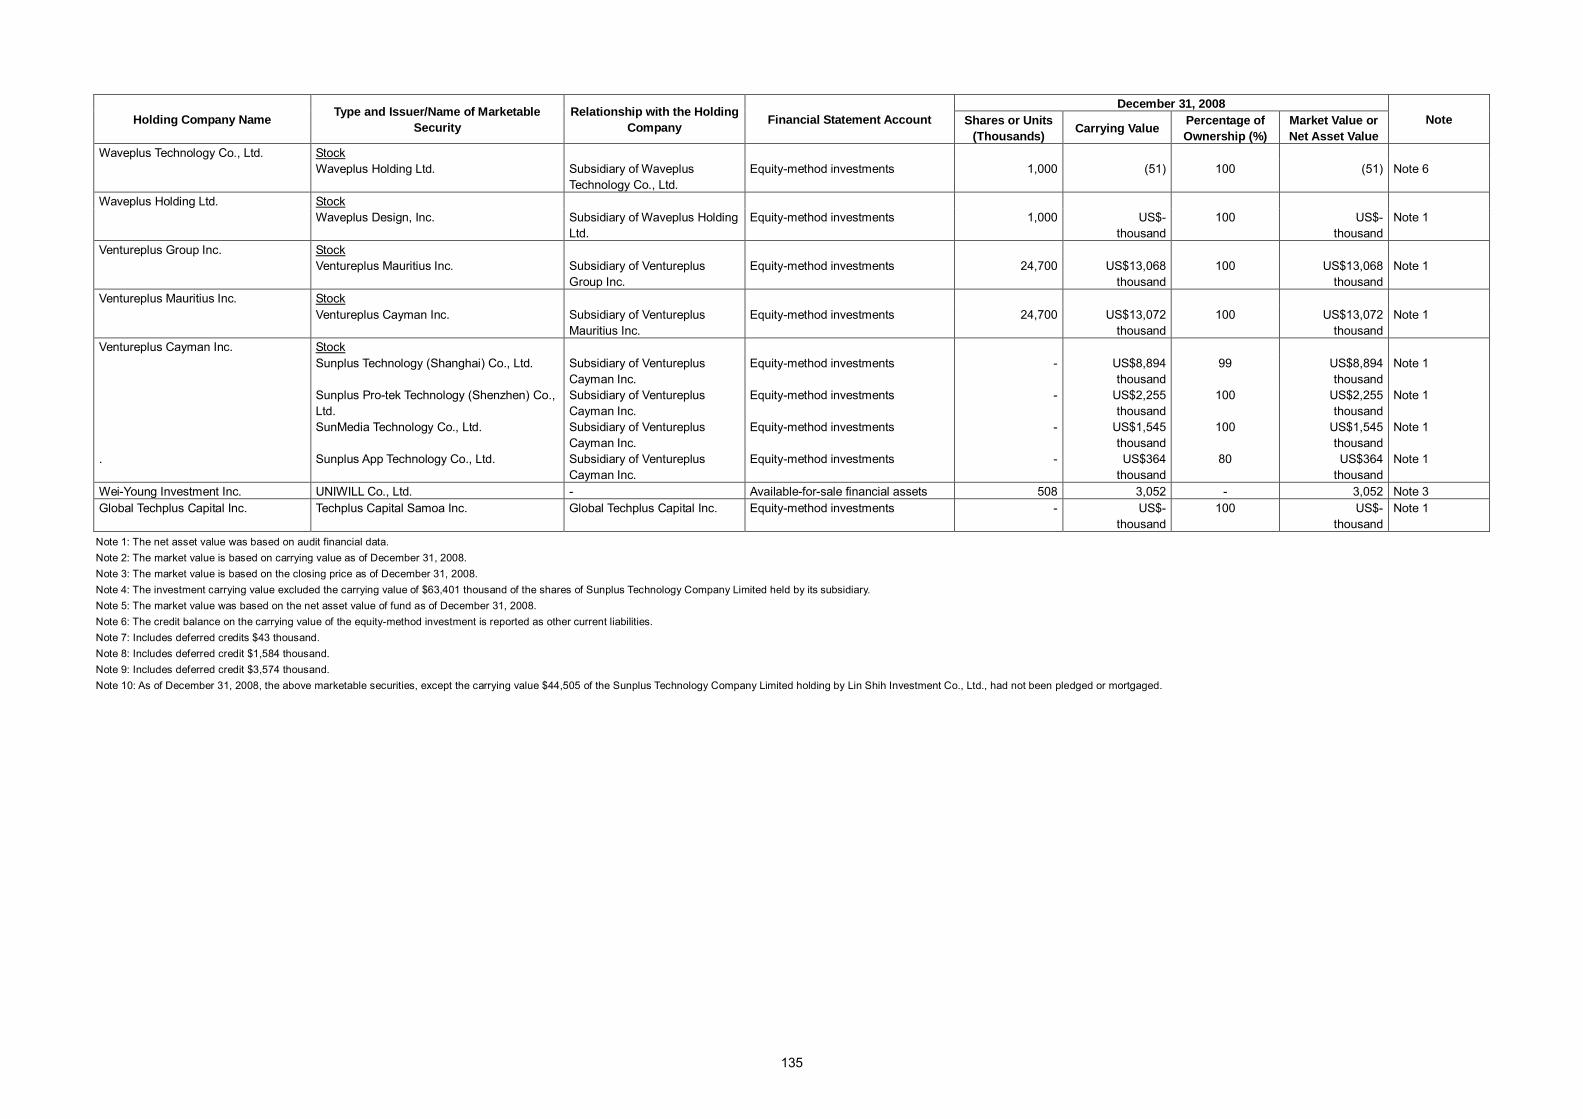
135
December 31, 2008 Holding Company Name Type and Issuer/Name of Marketable
Security Relationship with the Holding
Company Financial Statement Account Shares or Units (Thousands) Carrying Value Percentage of
Ownership (%) Market Value or Net Asset Value
Note
Waveplus Technology Co., Ltd. Stock Waveplus Holding Ltd. Subsidiary of Waveplus
Technology Co., Ltd. Equity-method investments 1,000 (51) 100 (51) Note 6
Waveplus Holding Ltd. Stock Waveplus Design, Inc. Subsidiary of Waveplus Holding
Ltd. Equity-method investments 1,000 US$-
thousand 100 US$-
thousand Note 1
Ventureplus Group Inc. Stock Ventureplus Mauritius Inc. Subsidiary of Ventureplus
Group Inc. Equity-method investments 24,700 US$13,068
thousand 100 US$13,068
thousand Note 1
Ventureplus Mauritius Inc. Stock Ventureplus Cayman Inc. Subsidiary of Ventureplus
Mauritius Inc. Equity-method investments 24,700 US$13,072
thousand 100 US$13,072
thousand Note 1
Ventureplus Cayman Inc. Stock Sunplus Technology (Shanghai) Co., Ltd. Subsidiary of Ventureplus
Cayman Inc. Equity-method investments - US$8,894
thousand 99 US$8,894
thousand Note 1
Sunplus Pro-tek Technology (Shenzhen) Co., Ltd.
Subsidiary of Ventureplus Cayman Inc.
Equity-method investments - US$2,255 thousand
100 US$2,255 thousand
Note 1
SunMedia Technology Co., Ltd. Subsidiary of Ventureplus Cayman Inc.
Equity-method investments - US$1,545 thousand
100 US$1,545 thousand
Note 1
. Sunplus App Technology Co., Ltd. Subsidiary of Ventureplus Cayman Inc.
Equity-method investments - US$364 thousand
80 US$364 thousand
Note 1
Wei-Young Investment Inc. UNIWILL Co., Ltd. - Available-for-sale financial assets 508 3,052 - 3,052 Note 3 Global Techplus Capital Inc. Techplus Capital Samoa Inc. Global Techplus Capital Inc. Equity-method investments - US$-
thousand 100 US$-
thousand Note 1
Note 1: The net asset value was based on audit financial data. Note 2: The market value is based on carrying value as of December 31, 2008. Note 3: The market value is based on the closing price as of December 31, 2008. Note 4: The investment carrying value excluded the carrying value of $63,401 thousand of the shares of Sunplus Technology Company Limited held by its subsidiary. Note 5: The market value was based on the net asset value of fund as of December 31, 2008. Note 6: The credit balance on the carrying value of the equity-method investment is reported as other current liabilities. Note 7: Includes deferred credits $43 thousand. Note 8: Includes deferred credit $1,584 thousand. Note 9: Includes deferred credit $3,574 thousand. Note 10: As of December 31, 2008, the above marketable securities, except the carrying value $44,505 of the Sunplus Technology Company Limited holding by Lin Shih Investment Co., Ltd., had not been pledged or mortgaged.
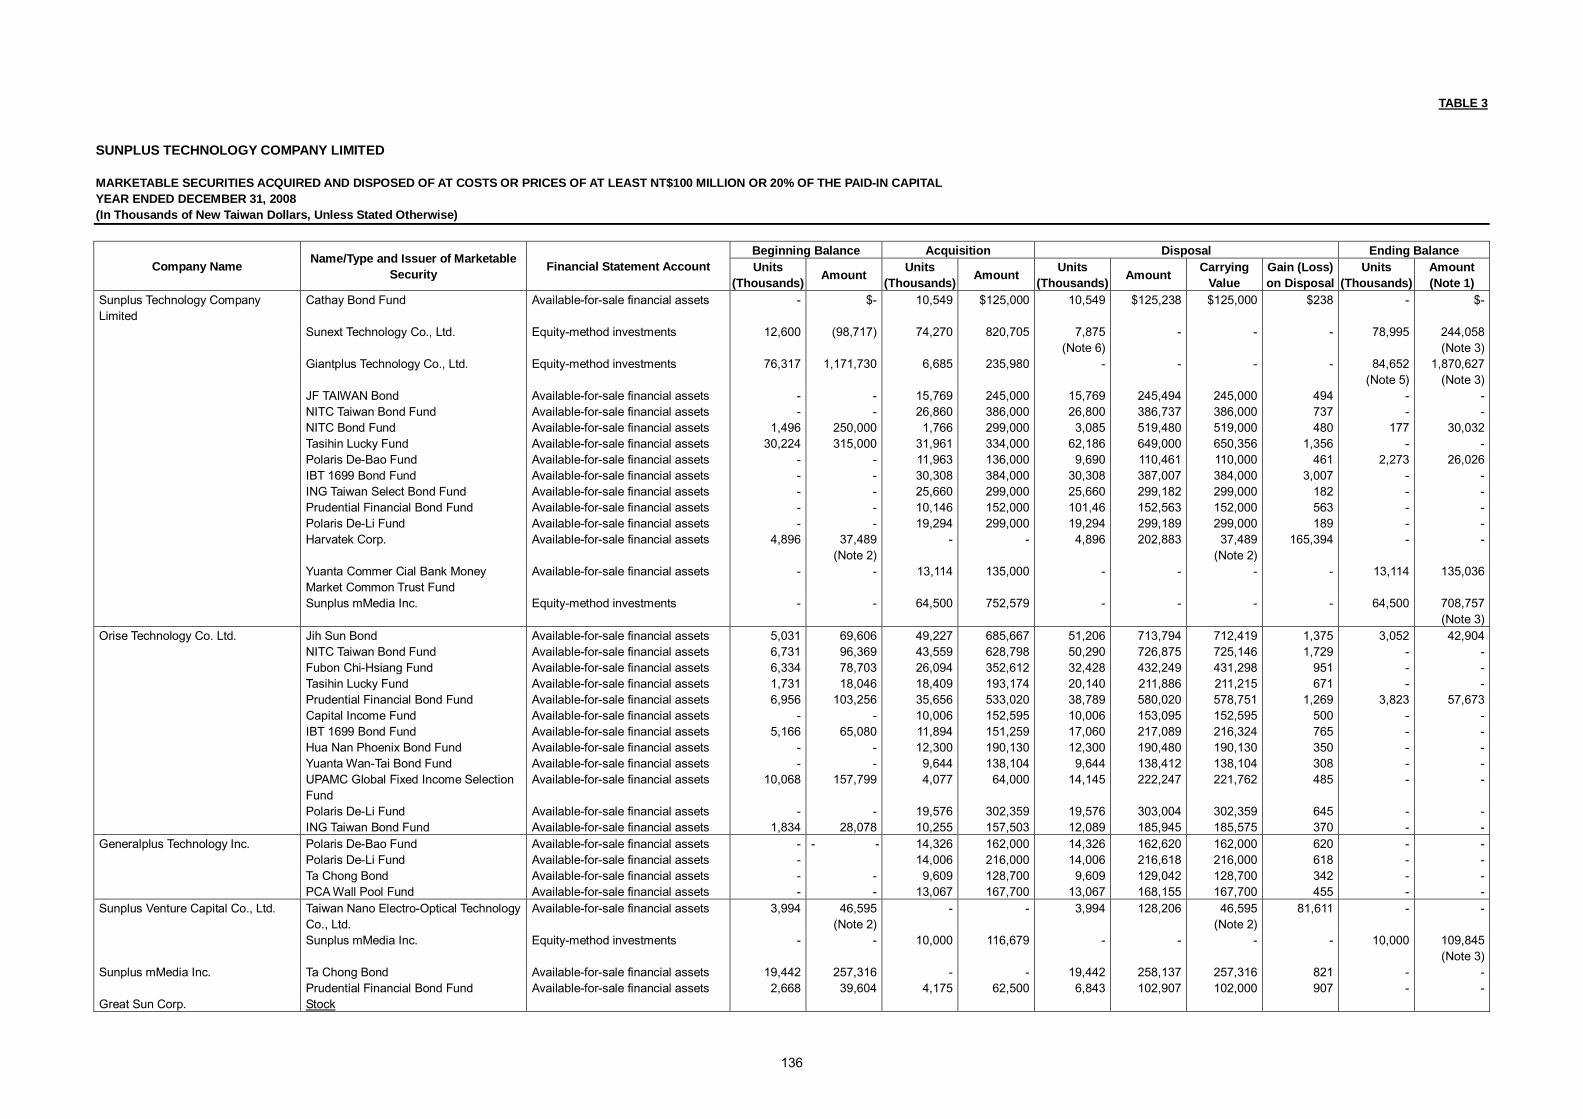
136
TABLE 3 SUNPLUS TECHNOLOGY COMPANY LIMITED MARKETABLE SECURITIES ACQUIRED AND DISPOSED OF AT COSTS OR PRICES OF AT LEAST NT$100 MILLION OR 20% OF THE PAID-IN CAPITAL YEAR ENDED DECEMBER 31, 2008 (In Thousands of New Taiwan Dollars, Unless Stated Otherwise)
Beginning Balance Acquisition Disposal Ending Balance Company Name Name/Type and Issuer of Marketable
Security Financial Statement Account Units (Thousands) Amount Units
(Thousands) Amount Units (Thousands) Amount Carrying
Value Gain (Loss) on Disposal
Units (Thousands)
Amount (Note 1)
Sunplus Technology Company Limited
Cathay Bond Fund Available-for-sale financial assets - $- 10,549 $125,000 10,549 $125,238 $125,000 $238 - $-
Sunext Technology Co., Ltd. Equity-method investments 12,600 (98,717) 74,270 820,705 7,875 (Note 6)
- - - 78,995 244,058 (Note 3)
Giantplus Technology Co., Ltd. Equity-method investments 76,317 1,171,730 6,685 235,980 - - - - 84,652 (Note 5)
1,870,627 (Note 3)
JF TAIWAN Bond Available-for-sale financial assets - - 15,769 245,000 15,769 245,494 245,000 494 - - NITC Taiwan Bond Fund Available-for-sale financial assets - - 26,860 386,000 26,800 386,737 386,000 737 - - NITC Bond Fund Available-for-sale financial assets 1,496 250,000 1,766 299,000 3,085 519,480 519,000 480 177 30,032 Tasihin Lucky Fund Available-for-sale financial assets 30,224 315,000 31,961 334,000 62,186 649,000 650,356 1,356 - - Polaris De-Bao Fund Available-for-sale financial assets - - 11,963 136,000 9,690 110,461 110,000 461 2,273 26,026 IBT 1699 Bond Fund Available-for-sale financial assets - - 30,308 384,000 30,308 387,007 384,000 3,007 - - ING Taiwan Select Bond Fund Available-for-sale financial assets - - 25,660 299,000 25,660 299,182 299,000 182 - - Prudential Financial Bond Fund Available-for-sale financial assets - - 10,146 152,000 101,46 152,563 152,000 563 - - Polaris De-Li Fund Available-for-sale financial assets - - 19,294 299,000 19,294 299,189 299,000 189 - - Harvatek Corp. Available-for-sale financial assets 4,896 37,489
(Note 2) - - 4,896 202,883 37,489
(Note 2) 165,394 - -
Yuanta Commer Cial Bank Money Market Common Trust Fund
Available-for-sale financial assets - - 13,114 135,000 - - - - 13,114 135,036
Sunplus mMedia Inc. Equity-method investments - - 64,500 752,579 - - - - 64,500 708,757 (Note 3)
Orise Technology Co. Ltd. Jih Sun Bond NITC Taiwan Bond Fund
Available-for-sale financial assets Available-for-sale financial assets
5,031 6,731
69,606 96,369
49,227 43,559
685,667 628,798
51,206 50,290
713,794 726,875
712,419 725,146
1,375 1,729
3,052 -
42,904 -
Fubon Chi-Hsiang Fund Available-for-sale financial assets 6,334 78,703 26,094 352,612 32,428 432,249 431,298 951 - - Tasihin Lucky Fund Available-for-sale financial assets 1,731 18,046 18,409 193,174 20,140 211,886 211,215 671 - - Prudential Financial Bond Fund Available-for-sale financial assets 6,956 103,256 35,656 533,020 38,789 580,020 578,751 1,269 3,823 57,673 Capital Income Fund Available-for-sale financial assets - - 10,006 152,595 10,006 153,095 152,595 500 - - IBT 1699 Bond Fund Available-for-sale financial assets 5,166 65,080 11,894 151,259 17,060 217,089 216,324 765 - - Hua Nan Phoenix Bond Fund Available-for-sale financial assets - - 12,300 190,130 12,300 190,480 190,130 350 - - Yuanta Wan-Tai Bond Fund Available-for-sale financial assets - - 9,644 138,104 9,644 138,412 138,104 308 - - UPAMC Global Fixed Income Selection
Fund Available-for-sale financial assets 10,068 157,799 4,077 64,000 14,145 222,247 221,762 485 - -
Polaris De-Li Fund Available-for-sale financial assets - - 19,576 302,359 19,576 303,004 302,359 645 - - ING Taiwan Bond Fund Available-for-sale financial assets 1,834 28,078 10,255 157,503 12,089 185,945 185,575 370 - - Generalplus Technology Inc. Polaris De-Bao Fund
Polaris De-Li Fund Available-for-sale financial assets Available-for-sale financial assets
- -
- - 14,326 14,006
162,000 216,000
14,326 14,006
162,620 216,618
162,000 216,000
620 618
- -
- -
Ta Chong Bond Available-for-sale financial assets - - 9,609 128,700 9,609 129,042 128,700 342 - - PCA Wall Pool Fund Available-for-sale financial assets - - 13,067 167,700 13,067 168,155 167,700 455 - - Sunplus Venture Capital Co., Ltd. Taiwan Nano Electro-Optical Technology
Co., Ltd. Available-for-sale financial assets 3,994 46,595
(Note 2) - - 3,994 128,206 46,595
(Note 2) 81,611 - -
Sunplus mMedia Inc. Equity-method investments - - 10,000 116,679 - - - - 10,000 109,845 (Note 3)
Sunplus mMedia Inc. Ta Chong Bond Available-for-sale financial assets 19,442 257,316 - - 19,442 258,137 257,316 821 - - Prudential Financial Bond Fund Available-for-sale financial assets 2,668 39,604 4,175 62,500 6,843 102,907 102,000 907 - - Great Sun Corp. Stock
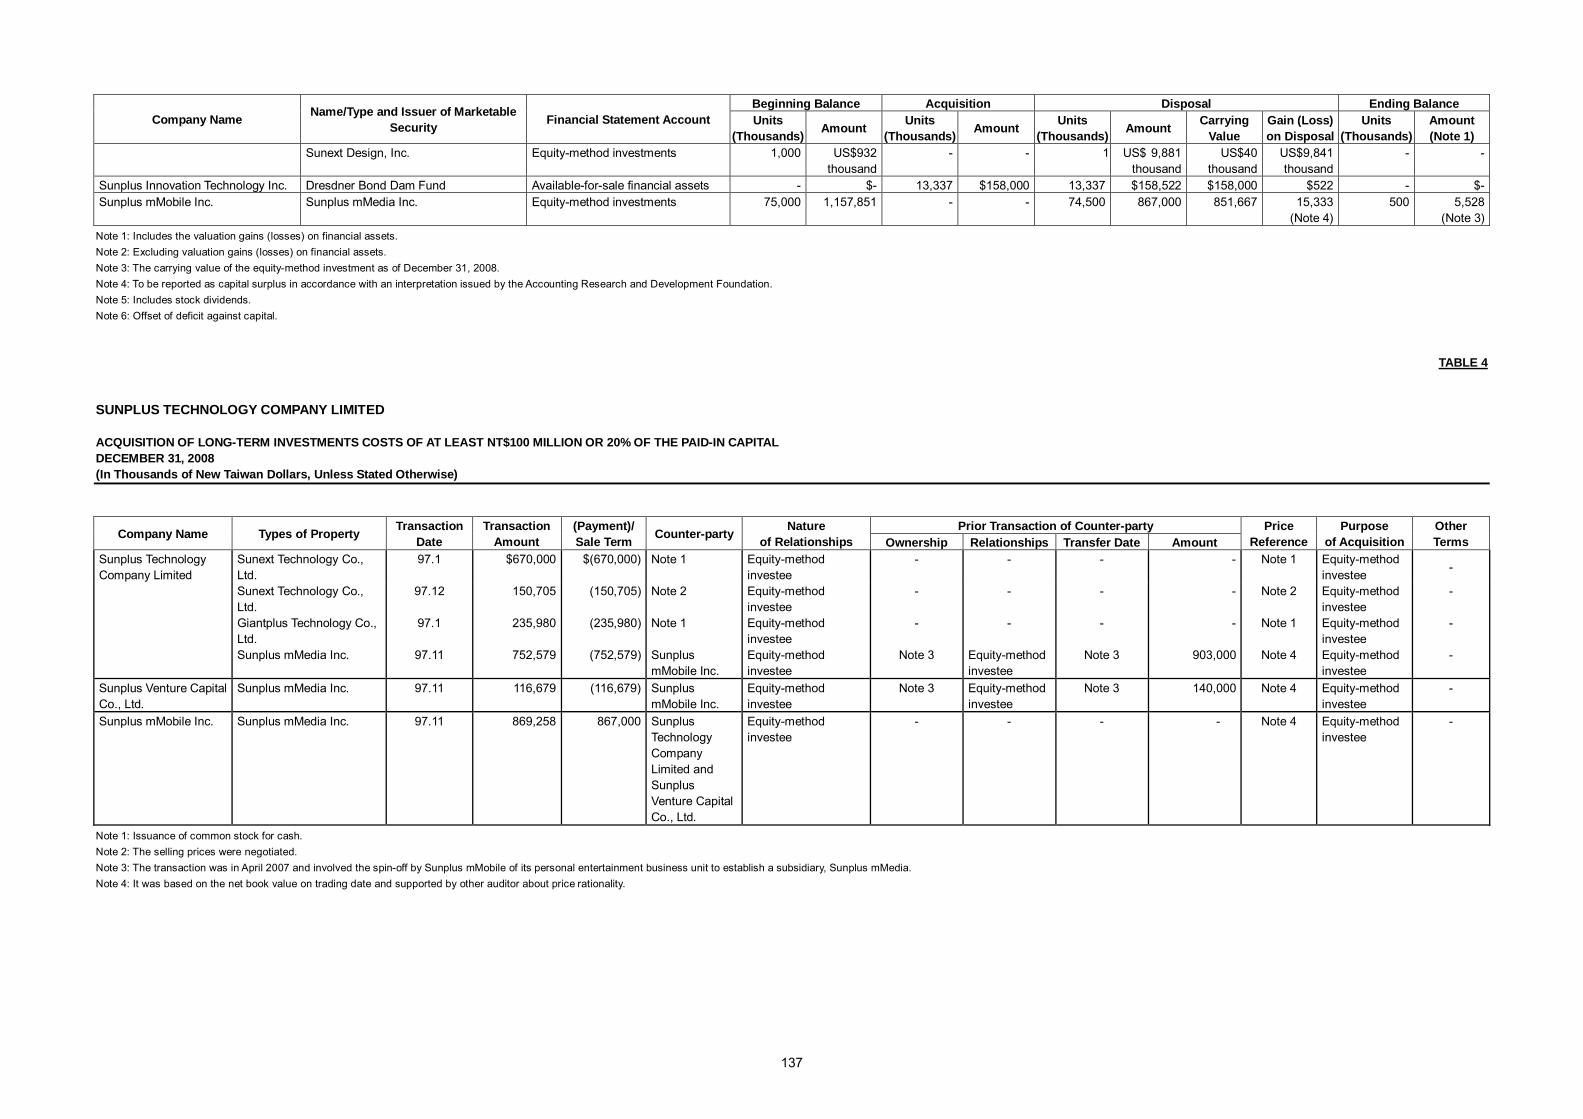
137
Beginning Balance Acquisition Disposal Ending Balance Company Name Name/Type and Issuer of Marketable
Security Financial Statement Account Units (Thousands) Amount Units
(Thousands) Amount Units (Thousands) Amount Carrying
Value Gain (Loss) on Disposal
Units (Thousands)
Amount (Note 1)
Sunext Design, Inc. Equity-method investments 1,000 US$932 thousand
- - 1,000 US$ 9,881 thousand
US$40 thousand
US$9,841 thousand
- -
Sunplus Innovation Technology Inc. Dresdner Bond Dam Fund Available-for-sale financial assets - $- 13,337 $158,000 13,337 $158,522 $158,000 $522 - $- Sunplus mMobile Inc. Sunplus mMedia Inc. Equity-method investments 75,000 1,157,851 - - 74,500 867,000 851,667 15,333
(Note 4) 500 5,528
(Note 3) Note 1: Includes the valuation gains (losses) on financial assets. Note 2: Excluding valuation gains (losses) on financial assets. Note 3: The carrying value of the equity-method investment as of December 31, 2008. Note 4: To be reported as capital surplus in accordance with an interpretation issued by the Accounting Research and Development Foundation. Note 5: Includes stock dividends. Note 6: Offset of deficit against capital.
TABLE 4 SUNPLUS TECHNOLOGY COMPANY LIMITED ACQUISITION OF LONG-TERM INVESTMENTS COSTS OF AT LEAST NT$100 MILLION OR 20% OF THE PAID-IN CAPITAL DECEMBER 31, 2008 (In Thousands of New Taiwan Dollars, Unless Stated Otherwise)
Prior Transaction of Counter-party Company Name Types of Property Transaction Date
Transaction Amount
(Payment)/ Sale Term Counter-party Nature
of Relationships Ownership Relationships Transfer Date Amount Price
Reference Purpose
of Acquisition Other Terms
Sunplus Technology Company Limited
Sunext Technology Co., Ltd.
97.1 $670,000 $(670,000) Note 1 Equity-method investee
- - - - Note 1 Equity-method investee -
Sunext Technology Co., Ltd.
97.12 150,705 (150,705) Note 2 Equity-method investee
- - - - Note 2 Equity-method investee
-
Giantplus Technology Co., Ltd.
97.1 235,980 (235,980) Note 1 Equity-method investee
- - - - Note 1 Equity-method investee
-
Sunplus mMedia Inc. 97.11 752,579 (752,579) Sunplus mMobile Inc.
Equity-method investee
Note 3 Equity-method investee
Note 3 903,000 Note 4 Equity-method investee
-
Sunplus Venture Capital Co., Ltd.
Sunplus mMedia Inc. 97.11 116,679 (116,679) Sunplus mMobile Inc.
Equity-method investee
Note 3 Equity-method investee
Note 3 140,000 Note 4 Equity-method investee
-
Sunplus mMobile Inc. Sunplus mMedia Inc. 97.11 869,258 867,000 Sunplus Technology Company Limited and Sunplus Venture Capital Co., Ltd.
Equity-method investee
- - - - Note 4 Equity-method investee
-
Note 1: Issuance of common stock for cash. Note 2: The selling prices were negotiated. Note 3: The transaction was in April 2007 and involved the spin-off by Sunplus mMobile of its personal entertainment business unit to establish a subsidiary, Sunplus mMedia. Note 4: It was based on the net book value on trading date and supported by other auditor about price rationality.
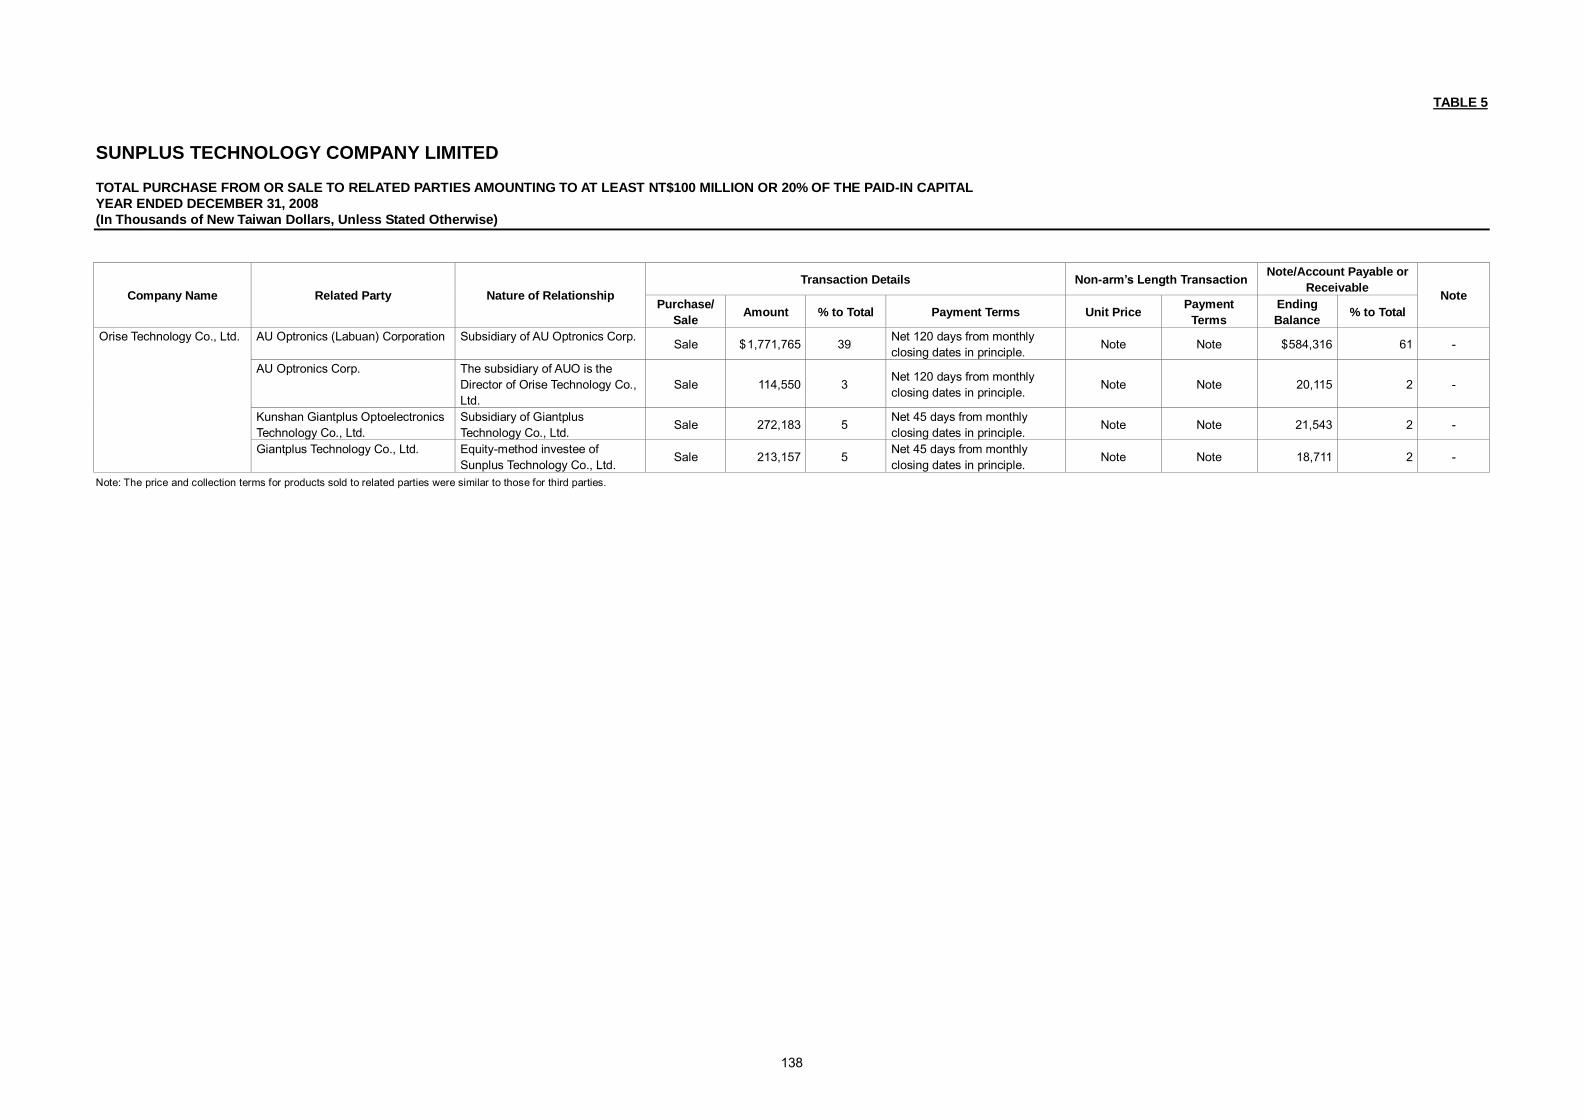
138
TABLE 5 SUNPLUS TECHNOLOGY COMPANY LIMITED TOTAL PURCHASE FROM OR SALE TO RELATED PARTIES AMOUNTING TO AT LEAST NT$100 MILLION OR 20% OF THE PAID-IN CAPITAL YEAR ENDED DECEMBER 31, 2008 (In Thousands of New Taiwan Dollars, Unless Stated Otherwise)
Transaction Details Non-arm’s Length Transaction Note/Account Payable or Receivable Company Name Related Party Nature of Relationship
Purchase/ Sale Amount % to Total Payment Terms Unit Price Payment
Terms Ending Balance % to Total
Note
Orise Technology Co., Ltd. AU Optronics (Labuan) Corporation Subsidiary of AU Optronics Corp. Sale $ 1,771,765 39 Net 120 days from monthly closing dates in principle. Note Note $ 584,316 61 -
AU Optronics Corp. The subsidiary of AUO is the Director of Orise Technology Co., Ltd.
Sale 114,550 3 Net 120 days from monthly closing dates in principle. Note Note 20,115 2 -
Kunshan Giantplus Optoelectronics Technology Co., Ltd.
Subsidiary of Giantplus Technology Co., Ltd. Sale 272,183 5 Net 45 days from monthly
closing dates in principle. Note Note 21,543 2 -
Giantplus Technology Co., Ltd. Equity-method investee of Sunplus Technology Co., Ltd. Sale 213,157 5 Net 45 days from monthly
closing dates in principle. Note Note 18,711 2 -
Note: The price and collection terms for products sold to related parties were similar to those for third parties.

139
TABLE 6 SUNPLUS TECHNOLOGY COMPANY LIMITED RECEIVABLES FROM RELATED PARTIES AMOUNTING TO AT LEAST NT$100 MILLION OR 20% OF THE PAID-IN CAPITAL YEAR ENDED DECEMBER 31, 2008 (In Thousands of New Taiwan Dollars, Unless Stated Otherwise)
Overdue Company Name Related Party Nature of Relationship Ending Balance Turnover Rate
Amount Action Taken
Amounts Received in Subsequent Period
Allowance for Bad Debts and Sales Discounts
Orise Technology Co., Ltd. AU Optronics (Labuan) Corporation Subsidiary of AU Optronics Corp. $584,316 2.61 $ - - $ - $ -

140
TABLE 7 SUNPLUS TECHNOLOGY COMPANY LIMITED NAMES, LOCATIONS, AND RELATED INFORMATION OF INVESTEES ON WHICH THE COMPANY EXERCISES SIGNIFICANT INFLUENCES YEAR ENDED DECEMBER 31, 2008 (In Thousands of New Taiwan Dollars, Unless Stated Otherwise)
Investment Amount Balance as of December 31, 2008 Investor Investee Location
Main Businesses and Products December 31,
2008 December 31,
2007 Shares
(Thousands) Percentage of
Ownership Carrying
Value
Net Income (Loss) of the
Investee
Investment Gain (Loss)
Note
Giantplus Technology Co., Ltd. Tofen Chen, Miaoli, Taiwan Manufacture of TN/STN LCDs and LCD modules
$881,314 $881,314 84,652 21 $1,870,627 $307,601 $57,999 Investee
Orise Technology Co., Ltd. Hsinchu, Taiwan Design of ICs 816,719 834,092 72,090 55 1,245,799 265,446 146,333 Subsidiary Sunplus mMedia Inc. Hsinchu , Taiwan Design of ICs 752,579 - 64,500 78 708,757 (364,758) (28,867) Subsidiary Sunplus Venture Capital Co., Ltd. Hsinchu, Taiwan Investment 999,982 999,982 100,000 100 624,889 91,518 91,518 Subsidiary Lin Shih Investment Co., Ltd. Hsinchu, Taiwan Investment 699,988 699,988 70,000 100 607,241 36,358 27,884 Subsidiary Generalplus Technology Inc. Hsinchu, Taiwan Design of ICs 146,000 146,000 27,942 41 475,292 189,683 78,265 Subsidiary
Ventureplus Group Inc. Belize Investment US$24,700
thousand US$19,250
thousand 24,700 100 428,478 (125,214) (125,214) Subsidiary
Russell Holdings Limited Cayman Islands, British West Indies.
Investment US$14,760
thousand US$19,260
thousand 14,760 100 419,813 (55,098) (58,672) Subsidiary
Sunplus Innovation Technology Inc. Hsinchu, Taiwan Design of ICs 308,000 308,000 22,660 84 392,361 65,882 57,835 Subsidiary Sunext Technology Co., Ltd. Hsinchu, Taiwan Design and sale of ICs 946,705 796,000 78,995 79 244,058 61,338 43,617 Subsidiary Sunplus Core Technology Co., Ltd. Hsinchu, Taiwan Design of ICs 105,470 56,000 8,898 57 17,857 (123,362) (63,001) Subsidiary Waveplus Technology Co., Ltd. Hsinchu, Taiwan Design and sale of ICs 35,517 35,517 1,302 41 16,742 (3,649) (2,813) Subsidiary Goldkey Technology Corp. Taipei, Taiwan Design of ICs 25,541 32,836 1,702 12 16,584 34,980 4,145 Investee
Global Techplus Capital Inc. Seychelles Investment US$200
thousand US$200
thousand 200 100 7,852 1,486 1,486 Subsidiary
Wei-Young Investment Inc. Hsinchu, Taiwan Investment 14,000 14,000 1,400 100 5,167 191 191 Subsidiary
Sunplus Technology (H.K.) Co., Ltd. Kowloon Bay, Hong Kong International trade HK$11,075
thousand HK$11,075
thousand 11,075 100 4,817 8,864 8,864 Subsidiary
Sunplus Management Consulting Inc. Hsinchu, Taiwan Management 5,000 5,000 500 100 4,194 (30) (30) Subsidiary
Sunplus Technology Company Limited
Sunplus mMobile Inc. Hsinchu, Taiwan Design of ICs 1,680,000 1,680,000 120,000 91 (141,111) (1,274,350 ) (1,169,111) Subsidiary Goldkey Technology Corp. Taipei, Taiwan Design of ICs 18,402 26,400 1,866 13 18,198 34,980 4,547 Investee Sunext Technology Co., Ltd. Hsinchu, Taiwan Design and sale of ICs 369,316 369,316 6,499 7 8,500 61,338 4,140 Subsidiary Waveplus Technology Co., Ltd. Hsinchu, Taiwan Design and sale of ICs 91,726 91,726 522 16 6,709 (3,649) (1,127) Subsidiary Sunplus Core Technology Co., Ltd. Hsinchu, Taiwan Design of ICs 20,000 20,000 2,000 13 4,013 (123,362) (18,751) Subsidiary SunPlus mMobile Inc. Hsinchu, Taiwan Design of ICs 42,770 65,898 3,055 2 12,112 (1,274,350 ) (35,044) Subsidiary SunPlus mMedia Inc. Hsinchu, Taiwan Design of ICs 34,755 17,147 2,483 3 31,457 (364,758) (6,310) Subsidiary Sunplus Innovation Technology Inc. Hsinchu, Taiwan Design of ICs 6,234 5,684 452 2 6,619 65,882 1,065 Subsidiary
Lin Shih Investment Co., Ltd.
Generalplus Technology Inc. Hsinchu, Taiwan Design of ICs 65,000 65,000 12,653 19 215,210 189,683 35,446 Subsidiary Joing Technology Co., Ltd. Hsinchu, Taiwan Design of ICs 51,000 51,000 3,400 39 - - - Investee Sunext Technology Co., Ltd. Hsinchu, Taiwan Design and sale of ICs 385,709 360,000 8,571 9 11,169 61,338 5,373 Subsidiary Han Young Technology Co., Ltd. Taipei, Taiwan Design of ICs 4,200 4,200 420 70 1,780 - - Subsidiary Waveplus Technology Co., Ltd. Hsinchu, Taiwan Design and sale of ICs 76,016 76,016 387 12 4,973 (3,649) (836) Subsidiary Orise Technology Co, Ltd. Hsinchu, Taiwan Design of ICs 10,800 10,800 865 1 14,478 265,446 1,723 Subsidiary Sunplus Core Technology Co., Ltd. Hsinchu, Taiwan Design of ICs 20,000 20,000 2,000 13 4,013 (123,362) (18,751) Subsidiary Generalplus Technology Inc. Hsinchu, Taiwan Design of ICs 15,000 15,000 2,920 4 49,672 189,683 8,168 Subsidiary SunPlus mMobile Inc. Hsinchu, Taiwan Design of ICs 1,988 1,988 142 - 2,100 (1,274,350 ) (1,402) Subsidiary
Sunplus Venture Capital Co., Ltd.
Sunplus mMedia Inc. Hsinchu , Taiwan Design of ICs 116,679 - 10,000 12 109,845 (364,758) (4,487) Subsidiary
Jet Focus Limited Cayman Islands, British West Indies
Investment US$6,050 thousand
US$6,050 thousand
4,794 44 US$(350) thousand
US$(618) thousand
US$- thousand
Investee Russell Holdings Limited
Synerchip Co., Ltd. Mauritius Investment US$3,070 thousand
US$2,070 thousand
4,236 25 US$667
thousand US$(4,930)
thousand US$(1,458)
thousand Investee

141
Investment Amount Balance as of December 31, 2008 Investor Investee Location
Main Businesses and Products December 31,
2008 December 31,
2007 Shares
(Thousands) Percentage of
Ownership Carrying
Value
Net Income (Loss) of the
Investee
Investment Gain (Loss)
Note
Sunext Technology Co., Ltd. Hsinchu, Taiwan Design and sale of ICs US$2,119 thousand
US$- thousand
855 1 US$2,124 thousand
61,338 US$8thousand Subsidiary
Sunext Technology Co., Ltd. Great Sun Corp. SAMOA Investment US$1,750 thousand
US$1,750 thousand
1,750 100 $36,697 $264,368 $264,368 Subsidiary
Great Sun Corp. Sunext (Mauritius) Inc. Mauritius Investment US$750
thousand US$750
thousand 750 100
US$119 thousand
US$(105) thousand
US$(105) thousand
Subsidiary
Sunext (Mauritius) Inc. Sunext Technology (Shanghai) Co., Ltd. Shanghai, China Design of software US$750
thousand US$750
thousand - 100
US$118 thousand
US$(106) thousand
US$(106) thousand
Subsidiary
Ventureplus Group Inc. Ventureplus Mauritius Inc. Mauritius Investment US$24,700
thousand US$ 19,250
thousand 24,700 100
US$13,068 thousand
US$(3,975) thousand
US$(3,975) thousand
Subsidiary
Ventureplus Mauritius Inc. Ventureplus Cayman Inc. Cayman Islands, British West Indies
Investment US$24,700
thousand US$ 19,250
thousand 24,700
100
US$13,072 thousand
US$(3,975) thousand
US$(3,975) thousand
Subsidiary
Sunplus Technology (Shanghai) Co., Ltd. Shanghai, China Manufacture and sale of ICs.
US$17,000 thousand
US$ 17,000 thousand
- 99 US$8,894 thousand
US$(111) thousand
US$(109) thousand
Subsidiary
Sunplus Prof-tek Technology (Shenzhen) Co., Ltd.
Shenzhen, China Development, manufacture and sale of ICs
US$4,250 thousand
US$ 2,250 thousand
- 100 US$2,255 thousand
US$(2,195) thousand
US$(2,195) thousand
Subsidiary
Sun Media Technology Co., Ltd. Chengdu, China Development, manufacture and sale of ICs
US$3,000 thousand
US$- thousand
- 100 US$1,545 thousand
US$(1,587) thousand
US$(1,587) thousand
Subsidiary Ventureplus Cayman Inc.
Sunplus App Technology Co., Ltd. Beijing, China Development, manufacture and sale of ICs
US$450 thousand
- - 80 US$364
thousand US$(103) thousand
US$(83) thousand
Subsidiary
Waveplus Technology Co., Ltd. Waveplus Holding Ltd. Mauritius Investment US$500
thousand US$500 thousand
1,000 100 (51) (2,050) (2,050) Subsidiary
Waveplus Holding Ltd. Waveplus Design, Inc. U.S.A. Design of WLANs US$500
thousand US$500
thousand 1,000 100 - - - Subsidiary
Generalplus Technology Inc. Generalplus International (SAMOA) Inc. SAMOA Investment US$3,090 thousand
US$1,090 thousand
3,090 100 11,174 (64,195) (64,195) Subsidiary
Generalplus International (SAMOA) Inc.
Generalplus (Mauritius) Inc. Mauritius Investment US$3,090 thousand
US$1,090 thousand
3,090 100 US$340
thousand US$(2,036)
thousand US$(2,036 )
thousand Subsidiary
Generalplus Technology (Shenzhen) Co., Ltd.
Shenzhen, China After-sales service US$2,700 thousand
US$700 thousand
- 100 US$263
thousand US$(1,925)
thousand US$(1,925 )
thousand Subsidiary
Generalplus (Mauritius) Inc. Generalplus Technology (Hong Kong) Inc. Hong Kong Sales
US$390 thousand
US$390 thousand
- 100 US$77
thousand US$(117) thousand
US$(117) thousand
Subsidiary
Sunplus mMedia Inc. Hsinchu, Taiwan Design of ICs 7,000 1,050,000 500 1 5,528 (364,758) (299,722) Subsidiary
Sunplus mMobile SAS France Design of ICs EUR237
thousand EUR-
thousand 237 100 11,318 360 360 Subsidiary
Sunplus mMobile Limited United Kingdom Design of ICs GBP500
thousand GBP-
thousand 500 100 (57,294) (99,527) (99,527) Subsidiary
Sunplus mMobile Inc.
Sunplus mMobile Holding Inc. SAMOA Investment US$2,580 thousand
- 2,580 100 2,156 (79,273) (79,273) Subsidiary
Sunplus mMobile Holding Inc. Bright Sunplus mMobile Inc. Mauritius Research and development of Intellectual Property Rights
US$2,515 thousand
- 2,515 100 US$1
thousand US$(2,514)
thousand US$(2,514 )
thousand Subsidiary
Global Techplus Capital Inc. Techplus Capital Samoa Inc. SAMOA Investment US$-
thousand US$150 thousand
- 100 US$-
thousand US$-
thousand US$-
thousand Subsidiary
(Concluded)

142
TABLE 8 SUNPLUS TECHNOLOGY COMPANY LIMITED AND SUBSIDIARIES INVESTMENT IN MAINLAND CHINA YEAR ENDED DECEMBER 31, 2008 (In Thousands of New Taiwan Dollars, Unless Stated Otherwise) Sunplus (Nature of Relationship: 0)
Investment Flows
Investee Company Name Main Businesses and Products Total Amount of Paid-in Capital
Investment Type
Accumulated Outflow of
Investment from Taiwan as of
January 1, 2008
Outflow Inflow
Accumulated Outflow of Investment from
Taiwan as of December 31, 2008
% Ownership of Direct or
Indirect Investment
Investment Loss
Carrying Value as of December 31, 2008
Accumulated Inward Remittance of Earnings as of
December 31, 2008
Sunplus Technology (Shanghai) Co., Ltd. Manufacturing and sale of consumer ICs US$17,200 thousand Note 1 US$17,000
thousand US$-
thousand US$-
thousand US$17,000 thousand 99 US$(109)
thousand US$8,894 thousand
US$- thousand
Sunplus Prof-tek (Shenzhen) Co., Ltd. Development and sale of computer software. Service of System Integration
US$4,250 thousand Note 1 US$2,250
thousand US$2,000 thousand
US$- thousand
US$4,250 thousand 100 US$(2,195)
thousand US$2,255 Thousand
US$- thousand
Sun Media Technology Co., Ltd. Manufacturing and sale of computer software. Service of System Integration
US$3,000 thousand Note 1 US$-
thousand US$3,000 thousand
US$- thousand
US$3,000 thousand 100 US$(1,587)
thousand US$1,545 Thousand
US$- thousand
Sunplus App Technology Co., Ltd. Manufacturing and sale of computer software. Service of System Integration and information management education
RMB3,750 thousand Note 1 US$-
thousand US$450 thousand
US$- thousand
US$450 thousand 80 US$(83)
thousand US$364 thousand
US$- thousand
Accumulated Investment in Mainland China as of December 31, 2008 Investment Amounts Authorized by Investment Commission, MOEA Upper Limit on Investment
US$24,700 thousand US$52,800 thousand $6,570,253
Note 1: The Company invested in company located in Mainland China indirectly through the investing company in the third country. Generalplus Technology (Nature of Relationship: 1)
Investment Flows Investee
Company Name
Main Businesses and
Products
Total Amount of Paid-in Capital
Investment Type (e.g., Direct or
Indirect)
Accumulated Outflow of Investment from Taiwan
as of January 1, 2008 Outflow Inflow
Accumulated Outflow of Investment from Taiwan as of
December 31, 2008
% Ownership of Direct or Indirect
Investment
Investment Gain
Carrying Value as of December 31, 2008
Accumulated Inward Remittance of Earnings as of
December 31, 2008
Generalplus Shenzhen Data processing service
US$2,700 thousand Indirect US$700
thousand $2,000
thousand $- US$2,700 thousand 100% US$(1,925)
thousand US$263 thousand $-
Accumulated Investment in Mainland China as of December 31, 2008 Investment Amount Authorized by Investment Commission, MOEA Upper Limit on Investment
US$2,700 thousand US$2,700 thousand $697,738
Sunext Technology (Nature of Relationship: 2)
Investment Flows Investee
Company Name
Main Businesses and
Products
Total Amount of Paid-in Capital
Investment Type (e.g., Direct or
Indirect)
Accumulated Outflow of Investment from Taiwan
as of January 1, 2008 Outflow Inflow
Accumulated Outflow of Investment from Taiwan as of
December 31, 2008
% Ownership of Direct or Indirect
Investment
Investment Loss
Carrying Value as of December 31, 2008
Accumulated Inward Remittance of Earnings as of
December 31, 2008
Sunext Technology (Shanghai)
Design of magnetic disc and software
US$750 thousand Indirect US$750
thousand $- $- US$750 thousand 100% US$(106)
thousand US$118
thousand $-
Accumulated Investment in Mainland China as of December 31, 2008 Investment Amount Authorized by Investment Commission, MOEA Upper Limit on Investment
US$750 thousand US$750 thousand $80,000

143
TABLE 9 SUNPLUS TECHNOLOGY COMPANY LIMITED AND SUBSIDIARIES INTERCOMPANY RELATIONSHIPS AND SIGNIFICANT INTERCOMPANY TRANSACTIONS YEARS ENDED DECEMBER 31, 2008 and 2007 (In Thousands of New Taiwan Dollars, Unless Stated Otherwise) 1. FOR THE YEAR ENDED DECEMBER 31, 2008
Intercompany Transactions Company Name Counter-Party Flow of Transactions
(Note 5) Financial Statements Account Item Amount Terms Percentage of Consolidated Total Gross Sales or Total Assets
Sunplus Technology Co., Ltd. Orise Technology Co., Ltd. 1 Sales $74,271 Note 1 0.45% Nonoperating income and gains 4,787 Note 2 0.03% Deferred royalty income 1,282 - 0.01% Notes and accounts receivables 7,880 Note 1 0.04% Other receivables 473 Note 3 - Generalplus Technology Corp. 1 Sales 27,509 Note 1 0.17% Nonoperating income and gains 8,052 Note 2 0.05% Other receivables 327 Note 3 - Notes and accounts receivables 2,380 Note 1 0.01% Waveplus Technology Co., Ltd. Nonoperating income and gains 550 Note 2 - 1 Sales 248 Note 1 - Notes and accounts receivables 264 Note 1 - Other receivables 3 Note 3 - Sunext Technology Co., Ltd. 1 Sales 23,979 Note 1 0.14% Nonoperating income and gains 7,529 Note 2 0.05% Marketing expenses 1,310 Note 2 0.01% Notes and accounts receivables 445 Note 1 - Deferred royalty income 1,729 - 0.01% Other receivables 143 Note 3 - Sunplus Core Technology Co., Ltd. 1 Other receivables 771 Note 3 - Notes and accounts payables 225 Note 1 - Deferred royalty income 47,200 - 0.27% Nonoperating income and gains 9,398 Notes 2 and 4 0.06% Sales 3,346 Note 1 0.02% Research and development 8,064 Note 2 0.05% Other current liabilities 419 Note 3 - Sunplus mMobile 1 Sales 16,768 Note 1 0.10% Nonoperating income and gains 60,008 Notes 2 and 4 0.36% Notes and accounts receivables 1,644 Note 1 0.01% Other receivables 4,601 Note 3 0.03% Sunplus Innovation Technology Inc. 1 Sales 13,063 Note 1 0.08% Nonoperating income and gains 7,431 Note 2 0.04% Research and development 58 Note 1 - Notes and accounts receivables 1,179 Note 1 0.01% Other receivables 376 Note 3 - Sunplus Technology Co., Ltd. Sunplus mMedia Inc. 1 Sales $ 59,323 Note 1 0.36% Nonoperating income and gains 82,908 Notes 2 and 4 0.50% Notes and accounts receivables 5,059 Note 1 0.03%
Other receivables 5,596 Note 3 0.03% Sunplus Technology Co., Ltd. (Shanghai) 2 Marketing Expenses 16,974 Note 2 0.10%
Sun Media Technology Co., Ltd. 2 Marketing expenses 4,604 Note 2 0.03% Sunplus Technology Co., Ltd. (H.K.) 1 Marketing expenses 2,505 Note 2 0.02% Notes and accounts receivables 2 Note 3 - Sunplus Prof-tek Co., Ltd. 2 Marketing expenses 49,037 Note 2 0.30%

144
Intercompany Transactions Company Name Counter-Party Flow of Transactions
(Note 5) Financial Statements Account Item Amount Terms Percentage of Consolidated Total Gross Sales or Total Assets
Sunext Technology Co., Ltd. Sunext Technology (Shanghai) 3 Research and development 13,269 Note 2 0.08% Other receivable 712 Note 3 - Sunplus mMedia Inc. 3 Nonoperating income and gains 2,151 Note 4 0.01% Orise Technology Co., Ltd. Sunplus Prot-tek Co., Ltd. 3 Marketing expenses 3,784 Note 2 0.02% Sunplus Technology (Shanghai) Co., Ltd. 3 Marketing expenses 13,391 Note 2 0.08% Sunplus mMedia Inc. Sunplus Technology (Shanghai) Co., Ltd. 3 Marketing expenses 4,224 Note 2 0.03% Sunplus Prof-tek Co., Ltd. 3 Marketing expenses 18,567 Note 2 0.11% Research and development 37,428 Note 2 0.23% Sun Media Technology Co., Ltd. 3 Marketing expenses 24,373 Note 2 0.15% Sunplus mMobile Inc. 3 Sales 41,233 Note 1 0.25% Nonoperating income and gains 52 Note 1 - Sunplus Innovation Technology Inc. Generalplus Technology Corp. 3 Nonoperating income and gains 404 Note 1 - Sunplus Technology (Shanghai) Co,. Ltd. 3 Marketing expenses 6,118 Note 2 0.04% Other current liabilities 1,968 Note 3 0.01% Sunplus Core Technology Co., Ltd. Sun Media Technology Co., Ltd. 3 Research and development 6,169 Note 2 0.04% Other current liabilities 6,337 Note 3 0.04% Generalplus Technology Corp. Generalplus Technology Corp. (H.K.) 3 Marketing Expenses 11,454 Note 2 0.07% Other current liabilities 112 Note 3 - Orise Technology Co., Ltd. 3 Sales 592 Note 1 - Sunplus mMedia Inc. 3 Intangible assets 97,619 Note 2 0.55% Purchase
Notes and accounts payable 12,186 12,186
Note 1 Note 1
0.07% 0.07%
Sunplus Technology Co., Ltd. (H.K.) Generalplus Technology Corp. (H.K.) 3 Other current assets 114 - - Sunplus mMobile SAS Bright Sunplus mMobile Inc. 3 Sales 61,429 Note 1 0.37%
Sunplus Technology (Shanghai) Co., Ltd. Generalplus Technology Corp. (Shenzhen) 3 Notes and accounts receivables 4,567 Note 3 0.03% Sales 11,570 Note 2 0.07%
(Continued) 2. FOR THE YEAR ENDED DECEMBER 31, 2007
Intercompany Transactions Company Name Counter-Party Flow of Transactions
(Note 5) Financial Statements Account Item Amount Terms Percentage of Consolidated Total Gross Sales or Total Assets
Sunplus Technology Co., Ltd. Orise Technology Co., Ltd. 1 Sales $59,084 Note 1 0.29% Nonoperating income and gains 14,892 Note 2 0.07% Deferred royalty income 2,381 - 0.01% Other receivables 3,355 Note 1 0.02% Notes and accounts receivables 11,554 Note 1 0.06% Generalplus Technology Inc. 1 Sales 47,290 Note 1 0.24% Other receivables 499 Note 1 - Nonoperating income and gains 10,350 Note 2 0.05% Notes and accounts receivables 4,152 Note 1 0.02% Waveplus Technology Co., Ltd. 1 Sales 6,623 Note 1 0.03% Sunext Technology Co., Ltd. 1 Sales 22,184 Note 1 0.11% Nonoperating income and gains 8,329 Notes 2 and 4 0.04% Marketing expenses 387 Note 2 - Other receivables 4,546 Note 1 0.02% Deferred royalty income 22,917 - 0.11% Sunplus Core Technology Co., Ltd. 1 Other receivables 1,255 Note 1 0.11% Notes and accounts payables 3,621 Note 3 0.02% Nonoperating income and gains 4,695 Notes 2 and 4 0.02% Research and development 4,349 Note 2 0.02% Sunplus mMobile 1 Sales 8,267 Note 1 0.04%

145
Intercompany Transactions Company Name Counter-Party Flow of Transactions
(Note 5) Financial Statements Account Item Amount Terms Percentage of Consolidated Total Gross Sales or Total Assets
Nonoperating income and gains 136,348 Notes 2 and 4 0.68% General and administrative 84 Note 2 - Research and development 515 Note 2 - Notes and accounts receivables 9 Note 1 - Other receivables 7,407 Note 1 0.04% Sunplus Innovation Technology Inc. 1 Sales 24,954 Note 1 0.12% Nonoperating income and gains 16,963 Notes 2 and 4 0.08% General and administrative 82 Note 2 - Research and development 3 Note 2 - Notes and accounts receivables 803 Note 1 - Other receivables 1,708 Note 1 0.01% Sunplus mMedia Inc. 2 Sales 26,306 Note 1 0.13% Notes and accounts receivables 3,572 Note 1 0.02% Other receivables 13,500 Note 1 0.06% Nonoperating income and gains 129,751 Notes 2 and 4 0.65% Sunext Technology Co., Ltd. Sunext Design Inc. 3 Expenses payables 29,111 Note 3 0.14% Research and development 140,214 Note 2 0.70% Sunext Technology (Shanghai) 3 Other receivables 712 Note 3 - Orise Technology Co., Ltd. Sunplus mMedia Inc. 3 Notes and accounts payables $47 Note 3 - Manufacturing expenses 48 Note 2 - Sunplus Technology (Shanghai) Co., Ltd. 3 Marketing expenses 6,093 Note 2 0.03% Sunplus mMobile Inc. Sunplus Technology (Shanghai) Co., Ltd. 3 Marketing expenses 6,845 Note 2 0.03% Sunplus mMedia Inc. 3 Other receivables 150 Note 1 - Sunplus mMedia Inc. Sunplus Technology (Shanghai) Co., Ltd. 3 Marketing expenses 5,035 Note 2 0.03%
Note 1: The transactions were based on normal commercial prices and terms. Note 2: The prices were based on negotiations and but the payment period and related terms were not comparable to market terms. Note 3: The transaction payment terms were at normal commercial terms. Note 4: Lease transaction terms were based on negotiations and were thus not comparable to market terms. The transactions between the company and counter party were at normal terms. Note 5: 1 - from parent company to subsidiary.
2 - from parent company to indirect subsidiary. 3 - between subsidiaries.
(Concluded) 7.6 Financial Difficulties
Impact to the Company or subsidiaries if any turnover problems: None

146
VIII. Financial Analysis 8.1 Financial Status 8.1.1 2008 Financial Analysis Comparison with 2007
Unit: NT$K
Variation Year Item 2008 2007 Amount
Diff.(Decrease) YoY %
Current Assets $2,837,092 $4,315,996 $(1,478,094) -34 Property, Plant & Equipment 836,326 940,134 (103,808) -11 Other Assets 1,260,233 1,380,877 (120,644) -9 Total Assets 12,931,206 15,668,366 (2,737,160) -17 Current Liabilities 1,731,341 2,472,048 (740,707) -30 Other Liabilities 249,443 313,195 (63,752) -20 Total Liabilities 1,980,784 2,785,243 (804,459) -29 Capital Stock 5,982,028 5,567,505 414,523 7 Capital Surplus 1,587,558 1,553,917 33,641 2 Retained Earnings 3,924,634 5,644,622 (1,719,988) -30 Total Shareholder’s Equities 10,950,422 12,883,123 (1,932,701) -15 Remark: ”Current Assets “declined due to less revenue and account receivable in 2008 “Current Liability declined due to less revenue and account payable in 2008 Other Liability declined due to less guarantee deposits in 2008. Retained Earning declined due to less profits in 2008 8.2 Operational Results 8.2.1 2008 Operation Results Comparison with 2007
Unit: NT$K Variation Year
Item 2008 2007 Amount Diff.(decrease) YoY %
Gross Sale $6,433,010 $9,380,826 $(2,947,816) -31 Deduct: Sales Returns and Allowances 339,831 166,767 173,064 104 Net Sales 6,083,179 9,214,059 (3,120,880) -34 Deduct: Unrealized Gain on Inter-company Profit - Net (45,096) 3,888 (48,984) -1260
Cost of Sales 3,690,119 5,305,721 (1,615,602) -30 Gross Profit 2,357,964 3,912,226 (1,554,262) -40 Operating Expenses 1,841,255 2,306,030 (464,775) -20 Income From Operating 516,709 1,606,196 (1,089,487) -68 Non - Operating Income 727,781 1,108,159 (380,600) -34 Non - Operating Expenses 1,084,466 417,873 666,371 160 Income Before Tax 160,024 2,296,482 (2,136,458) -93 Income Tax Benefits (151,641) (234,980) (-83,339 -35 Cumulative Effect of Changes in Accounting Principles 0 0 0 0
Net Income 8,383 2,061,502 (2,053,119) -100 Remarks: 1. “Gross sales”, “Net Sales”, “Gross Profit”, “Cost of Sales”, “Operating Profit” declined due to low demands by economic crisis 2. “Unrealized Gain on Inter-company Profit – Net” increased because of more licensing income from subsidiaries. 3. Non - Operating Income declined due to less deposal gain. 4. Non - Operating Expenses increased due to more losses on long-term investment. 5. Income tax declined due to less net income.

147
8.3 Cash Flow 8.3.1 Cash Flow Analysis
(A) Cash Flow Analysis 2007~2008
Year Item 2008 2007 YoY (%)
Cash flow ratio 120.99 103.20 -35.98% Cash flow adequacy ratio 129.07 110.94 -0.57% Cash flow reinvestment ratio 5.81 3.58 -69.84% Remarks: The cash flow investment ration declined due to less cash dividends.
(B) 2009 Cash Flow Forecast Unit: NT$K
Cash, beginning of
the year
Cash Flow from Operating Activities
Net Cash Outflow Net Cash Balance
Remedial Measure if cash not enough
Balance (1) Net Cash Flow (2) (3) (1)+(2)-(3) Investment plan
financial leverage plan
$914,057 (338,878) 823,724 1,398,903 - - From Operating: cash flow in because of sales growth in 2009 2H. From Investing: cash flow in because of acquisition of long-term investment and fixed assets From Financing: Cash flow out because of loans. 8.4 Major Capital Expenditure 8.4.1 Major Capital Expenditure and Sources
Unit: NT$K Capital Expenditure Plan
Item Sources of Fund
Est. Due Date
Required Capital Amount 2006 2007 2008 2009 2010 2011 2012 2013
Testing facility Own 2006~2013 $379,420 55,563 30,409 35,948 53,500 53,500 53,500 53,500 53,500
8.4.2 Benefits from the Capital Expenditure:
The testing cost could be saved in coming 5 years: Year Cost saved in NT$K 2009 13,250 2010 13,250 2011 13,250 2012 13,250 2013 13,250

148
8.5 Long-Term Investment Analysis
Item
Amount (Note)
In NT$K Policy Reason of Gain
or Loss Improvement Plan Investment Plan in one
year
Sunplus mMedia 752,580
To hold directly for tough competition and slow market demands
The company makes net losses in 2008 because of economic crisis and slow demands.
To review the product lines and evaluate the market opportunities cautiously, to distribute the available resource more carefully; and to develop better products with better cost- performance
None
Note: The investment amount over 5% of the paid-in capital. 8.6 Risk Management 8.6.1 The Impact of Inflation, Foreign Exchange and Interest Rate Fluctuation
and Measures to Cope With Interest Rate: The Company will get more interest expenses when the interest rate rises. The finance division will collect information and evaluate the variation for hedge. Vice versa, the low interest rate will impact interest income. The company will put more cash on highly- returned short-term investment. Exchange Rate: And the products are quoted in US dollars. Most of the costs are quoted in US dollars but still some in NT dollars. So the New Taiwan Dollars appreciation will impact the company sales and gross margin. Our major foreign-currency assets are account receivable and time deposits. The company already utilizes mainly forward currency and option contracts to hedge its foreign exchange exposure, so the impact from floating exchange rate will be minimized. Inflation: The material costs vary timely. The higher manufacture cost and selling pricing which would impact the consumers’ budget for the high-end consumer electronic products. But Sunplus is working hard to develop new products for add-on value and cost-down, and expand the market shares in the emerging markets to relief the slow-down from developed countries.
8.6.2 Internal Policies and Procedure Exist with Respect to High Risk/ High
Leveraged Investment, Lending/Endorsements and Guarantees for Other Parties, Financial Derivatives Transaction No high risk/high leveraged investment. No extension of monetary loans to others. The company already has policies and procedures like “Procedure of Endorsement and Guarantees, and “Procedures of Financial Derivatives Transactions”, which follow the rules issued by Taiwan Securities and Futures Commission. The Endorsement will only be done for Sunplus subsidiaries and invested companies with 20% of net value. And financial transactions of a derivatives nature that Sunplus enters into are strictly for hedging purposes and not for any trading or speculative purposes and under well evaluation.
8.6.3 R&D Plan and Execution
Sunplus will keep investing in developing new products, such as IC solutions for BD player, Set-up-Box, Portable TV, DTV, etc. Except developing core technology on our own, Sunplus is also looking for outside resources like purchasing or licensing IPs to speed up the mass-production schedule.
8.6.4 Political and Regulatory Environment
Staring from 2009, Sunplus will adopt the newly released “Statement of Financial Accounting Standards” No. 10, “Accounting for Inventory”, that the inventories should be evaluated by categories and marked down by the market value. The adoption of mentioned accounting
149
statement won’t impact Sunplus extremely for we are quite cautious with inventory management and has booked the reasonable provision for inventory losses quarterly.
8.6.5 Advanced Technology
The wafer process technology is moving to smaller geometry. The migrated process technology could keep the chip production cost down but R&D cost up. The Company tries to develop higher add-on value and mainstream multimedia products, which mainstream means to produce in huge volume and to share the research and development cost.
8.6.6 Corporate Identify and Image Change
The Company takes corporate image seriously and realizes it could be destroyed in one day. Fortunately, there is no major change till now. The Company will do their best to conserve it.
8.6.7 Mergers &Acquisitions
None
8.6.8 Expansion of Facilities None
8.6.9 Suppliers & Customers
The company purchase materials from several suppliers and subcontract to backend package and testing houses. The Top 5 customers of the company are all distributors with fair due diligence and regular auditing. Besides asking guarantee, the accounting department will track the account receivable monthly.
8.6.10 Major Shareholding Change
None 8.6.11 Ownership Change
None 8.6.12 Litigation Proceedings
None 8.6.13 Other Risks
None 8.7 Other Remarks

150
IX. SPECIAL NOTES 9.1 Affiliates

151
9.1.2 Affiliated Companies Unit: NT$K, and specified otherwise
Company Date of Incorporation Place of Registration Capital Business Activities Sunplus Technology (HK) Co., Ltd. Aug. 31, 1993 Kowloon, HK HK$11,075,000 (Note ) Trading Lin Shih Investment, Ltd. Jul. 2, 1998 Hsinchu, Taiwan 700,000 Investment Russell Holdings Ltd. Mar. 11, 1998 Cayman Islands, British West Indies. US$14,760,000 (Note ) Investment Sunplus Venture Capital Co., Ltd. Dec. 16, 1999 Hsinchu, Taiwan 1,000,000 Investment Waveplus Technology Co., Ltd. Dec. 6, 1999 Hsinchu, Taiwan 32,000 IC Design Waveplus Holding Ltd. May. 29, 2003 Mauritius US$500,000 (Note ) Investment Waveplus Design Inc. Jun. 17, 2003 CA, USA US$500,000 (Note ) IC Design Ventureplus Group Inc. Jul. 27, 2001 Belize US$24,700,000 (Note ) Investment Ventureplus Mauritius Inc. Aug. 2, 2001 Mauritius US$24,700,000 (Note ) Investment Ventureplus Cayman Inc. Sep. 14, 2001 Cayman Islands, British West Indies. US$24,700,000 (Note ) Investment
Shanghai Sunplus Co., Ltd. Dec. 7, 2001 Shanghai, China US$17,200,000 (Note ) CE Products manufacture and sales
Sunplus Prof-tek (Shenzhen) Co., Ltd. Oct.20,2007 Shenzhen, China US$4,250,000 (Note ) Software and System Design
Sunmedia Technology Co., Ltd. Jan.08,2008 Chengdu, China US$3,000,000 (Note ) IC Sales and After Service, Software and System Design
Sunplus App Technology Co., Ltd. Oct.,06,2008 Beijing, China RMB$3,750,000 (Note ) IC Sales and After Service, Software and System Design
Global Techplus Capital Inc. (The original Name: Techplus Capital Niue Inc.) Oct., 2001 Mahe, Seychelles US$200,000 (Note ) Investment
Techplus Capital Samoa Inc. Oct. 23, 2001 Samoa US$0 (Note ) Investment Sunext Technology Co., Ltd. Mar. 13, 2003 Hsinchu, Taiwan 10,00,000 IC Design Great Sun Corporation Jan.28,2003 Samoa US$1,750,000 (Note ) Investment Sunext (Maruitius) Inc. Aug. 19, 2004 Mauritius US$750,000 (Note ) Investment Sunext Optoelectronics Technology (Shanghai) Co. Ltd Dec. 27, 2004 Shanghai, China US$750,000 (Note ) Software
Sunplus Management Consulting Inc. Oct. 29, 2003 Taipei, Taiwan 5,000 Management Consulting WeiYing Investment Feb. 13, 2004 Taipei, Taiwan 14,000 Investment Generalplus Technology Co., Ltd Mar. 30, 2004 Hsinchu, Taiwan 683,664 IC Design Generalplus International (Samoa) Inc. Nov. 12, 2004 Samoa US$3,090,000 (Note) Investment Generalplus (Mauritius) Inc. Nov. 25, 2004 Mauritius US$3,090,000 (Note 2) Investment Generalplus Technology (Shenzhen) Inc. Mar. 24, 2005 Shenzhen, China US$2,700,000 (Note) Sales Service
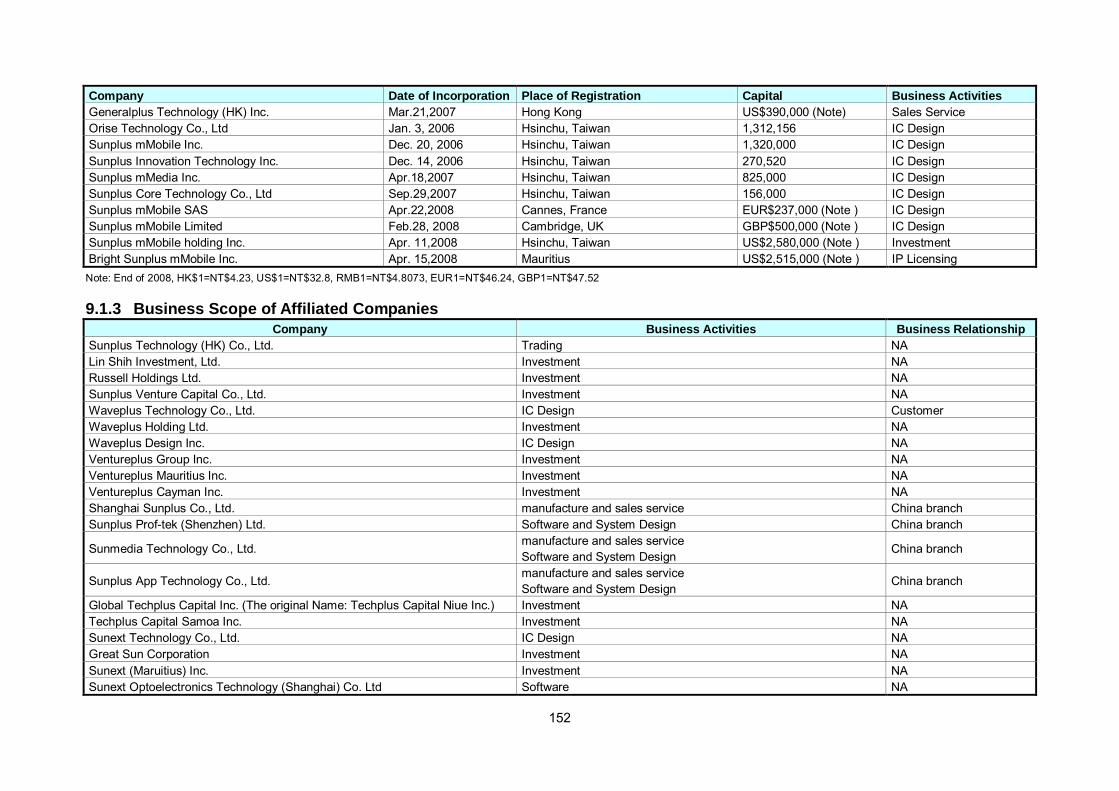
152
Company Date of Incorporation Place of Registration Capital Business Activities Generalplus Technology (HK) Inc. Mar.21,2007 Hong Kong US$390,000 (Note) Sales Service Orise Technology Co., Ltd Jan. 3, 2006 Hsinchu, Taiwan 1,312,156 IC Design Sunplus mMobile Inc. Dec. 20, 2006 Hsinchu, Taiwan 1,320,000 IC Design Sunplus Innovation Technology Inc. Dec. 14, 2006 Hsinchu, Taiwan 270,520 IC Design Sunplus mMedia Inc. Apr.18,2007 Hsinchu, Taiwan 825,000 IC Design Sunplus Core Technology Co., Ltd Sep.29,2007 Hsinchu, Taiwan 156,000 IC Design Sunplus mMobile SAS Apr.22,2008 Cannes, France EUR$237,000 (Note ) IC Design Sunplus mMobile Limited Feb.28, 2008 Cambridge, UK GBP$500,000 (Note ) IC Design Sunplus mMobile holding Inc. Apr. 11,2008 Hsinchu, Taiwan US$2,580,000 (Note ) Investment Bright Sunplus mMobile Inc. Apr. 15,2008 Mauritius US$2,515,000 (Note ) IP Licensing
Note: End of 2008, HK$1=NT$4.23, US$1=NT$32.8, RMB1=NT$4.8073, EUR1=NT$46.24, GBP1=NT$47.52 9.1.3 Business Scope of Affiliated Companies
Company Business Activities Business Relationship Sunplus Technology (HK) Co., Ltd. Trading NA Lin Shih Investment, Ltd. Investment NA Russell Holdings Ltd. Investment NA Sunplus Venture Capital Co., Ltd. Investment NA Waveplus Technology Co., Ltd. IC Design Customer Waveplus Holding Ltd. Investment NA Waveplus Design Inc. IC Design NA Ventureplus Group Inc. Investment NA Ventureplus Mauritius Inc. Investment NA Ventureplus Cayman Inc. Investment NA Shanghai Sunplus Co., Ltd. manufacture and sales service China branch Sunplus Prof-tek (Shenzhen) Ltd. Software and System Design China branch
Sunmedia Technology Co., Ltd. manufacture and sales service Software and System Design China branch
Sunplus App Technology Co., Ltd. manufacture and sales service Software and System Design China branch
Global Techplus Capital Inc. (The original Name: Techplus Capital Niue Inc.) Investment NA Techplus Capital Samoa Inc. Investment NA Sunext Technology Co., Ltd. IC Design NA Great Sun Corporation Investment NA Sunext (Maruitius) Inc. Investment NA Sunext Optoelectronics Technology (Shanghai) Co. Ltd Software NA
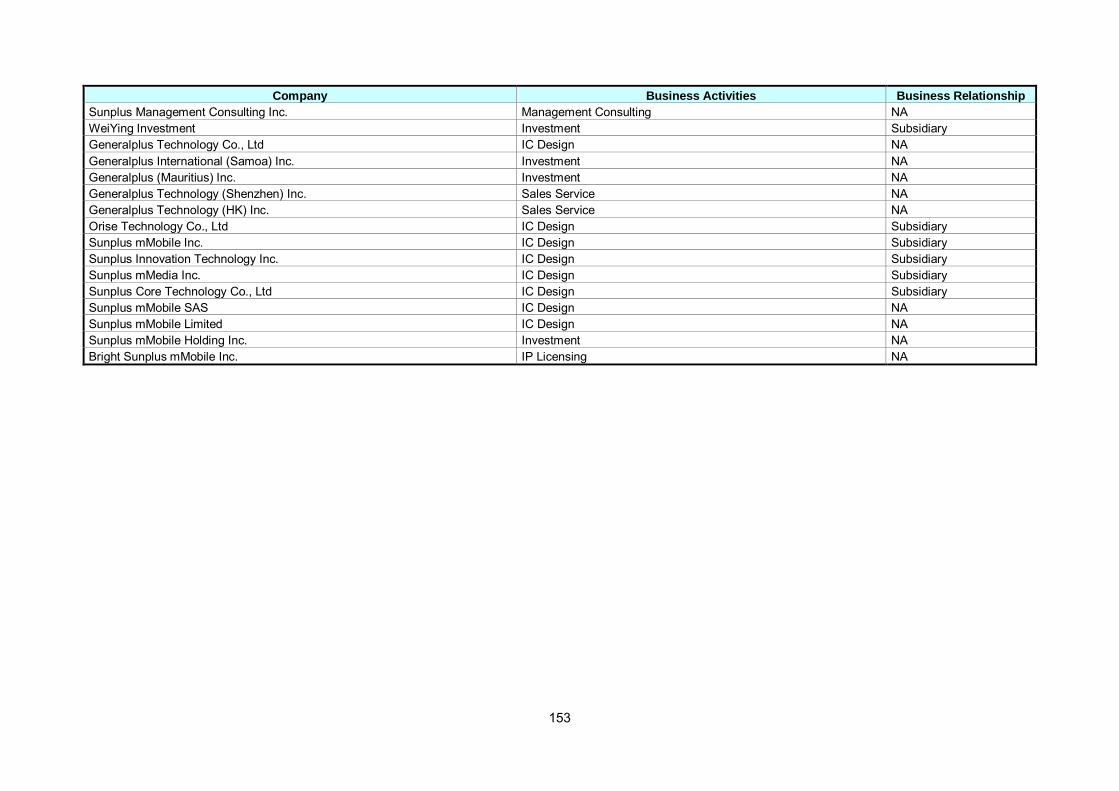
153
Company Business Activities Business Relationship Sunplus Management Consulting Inc. Management Consulting NA WeiYing Investment Investment Subsidiary Generalplus Technology Co., Ltd IC Design NA Generalplus International (Samoa) Inc. Investment NA Generalplus (Mauritius) Inc. Investment NA Generalplus Technology (Shenzhen) Inc. Sales Service NA Generalplus Technology (HK) Inc. Sales Service NA Orise Technology Co., Ltd IC Design Subsidiary Sunplus mMobile Inc. IC Design Subsidiary Sunplus Innovation Technology Inc. IC Design Subsidiary Sunplus mMedia Inc. IC Design Subsidiary Sunplus Core Technology Co., Ltd IC Design Subsidiary Sunplus mMobile SAS IC Design NA Sunplus mMobile Limited IC Design NA Sunplus mMobile Holding Inc. Investment NA Bright Sunplus mMobile Inc. IP Licensing NA

154
9.1.4 Rosters of Directors, Supervisors, and Presidents of Affiliated Companies Shareholding Company Title Name
Amount (shares) % Sunplus Technology HK$11,075,000 100% Chairman Chou-Chye Huang (repr.) - - Sunplus Technology (HK) Co., Ltd. Director Ming-Cheng Hsieh (repr.) - - Sunplus Technology 70,000,000 100% Chairman& President Chou-Chye Huang (repr.) - - Director Bing-Huang Shih - - Director Yarn-Chen Chen - -
Lin Shih Investment Co., Ltd.
Supervisor Gow-Chin Su - - Sunplus Technology US$19,260,000 100% Russell Holdings Ltd. Director Chou-Chye Huang (repr.) - - Sunplus Technology 100,000,000 100% Chairman& President Chou-Chye Huang (repr.) - - Director Yarn-Chen Chen - - Director Bing-Huang Shih - - Director Hans Tai - - Director Gow-Chin Su - -
Sunplus Venture Capital Co., Ltd.
Supervisor Wayne Shen - - Sunplus Technology 1,302,333 40.7% Chairman & President Chou-Chye Huang (repr.) - Director Wei-Chou Tseng 387,000 12.09% Director Lin Shih Investment 522,000 16.31%
Waveplus Technology Co., Ltd.
Supervisor Global View 14,109 0.44% Waveplus Technology US$500,000 100% Waveplus Holding Ltd. Director Chou-Chye Huang (repr.) - - Waveplus Holding US$500,000 100% Waveplus Design Inc. Director Xian Qing Yeh(repr.) - - Sunplus Technology US$24,700,000 100% Ventureplus Group Inc. Director Chou-Chye Huang (repr.) - - Ventureplus Group US$24,700,000 100% Ventureplus Mauritius Inc. Director Chou-Chye Huang (repr.) - - Ventureplus Mauritius US$24,700,000 100% Ventureplus Cayman Inc. Director Chou-Chye Huang (repr.) - - Ventureplus Cayman US$17,000,000 98.84% Shanghai Sunplus Co., Ltd. Director Chou-Chye Huang (repr.) - -

155
Shareholding Company Title Name Amount (shares) %
Director Yarn-Chen Chen - - Ventureplus Cayman US$4,250,000 100% Director Chou-Chye Huang (repr.) - - Sunplus Prof-tek Co., Ltd. Director Yarn-Chen Chen - - Ventureplus Cayman US$3,000,000 100% Sunmedia Technology Co., Ltd. Director Chou-Chye Huang (repr.) Ventureplus Cayman RMB$3,000,000 100% Sunplus App Technology Co., Ltd Director Chou-Chye Huang (repr.) Sunplus Technology US$200,000 100% Global Techplus Capital Inc.(The original
name: Techplus Capital Niue Inc.) Director Chou-Chye Huang (repr.) - - Global Techplus Capital US$0 100% Techplus Capital Samoa Inc. Director Chou-Chye Huang (repr.) - - Sunplus Venture Capital 8,570,895 8.57% Chairman Chou-Chye Huang (repr.) - - Director Yarn-Chen Chen - - Director Bing-Huang Shih - - Director & President Kuang-Pu Mi 939,675 0.94%
Sunext Technology Co., Ltd.
Supervisor Sunplus Venture Capital Hans Tai (repr.) 8,570,895 8.57%
Sunext Technology US$1,750,000 100% Great Sun Corporation Director Chou-Chye Huang (repr.) - - Sunext Design, Inc. US$750,000 100% Sunext (Mauritius) Inc. Director Chou-Chye Huang (repr.) - - Sunext (Mauritius) US$750,000 100% Director Chou-Chye Huang (repr.) - - Director Yarn-Chen Chen - -
Sunext Optoelectronics Technology (Shanghai) Co. Ltd
Director Kuang-Pu Mi - - Director
Sunplus Technology Chou-Chye Huang (repr.)
500,000 -
100% -
Director Yarn-Chen Chen - - Director Bing-Huang Shih - -
Sunplus Management Consulting Inc.
Supervisor Shu-Lan Wang - - Sunplus Technology 1,400,000 100% Director Chou-Chye Huang (repr.) - -
WeiYing Investment Co., Ltd.
Director Yarn-Chen Chen - -

156
Shareholding Company Title Name Amount (shares) %
Director Bing-Huang Shih - - Supervisor Shu-Lan Wang - - Sunplus Technology 27,942,142 40.87% Chairman& President Chou-Chye Huang (repr.) - - Director Yarn-Chen Chen - - Vice Chairman Hou-Shien Chu - - Director Han-Hwa Lu 595,360 0.87% Director Chih-I Yang 512,600 0.75% Supervisor Lin-Shih Investment 12,652,717 18.51%
Generalplus Technology Co., Ltd
Supervisor Sunplus Venture Capital 2,919,858 4.27% Generalplus Technology US$3,090,000 100% Generalplus International (Samoa) Inc. Director Chou-Chye Huang (repr.) - - Generalplus International (Samoa) US$1,090,000 100% Generalplus (Mauritius) Inc. Director Chou-Chye Huang (repr.) - - Generalplus International (Mauritius) US$700,000 100% Director Chou-Chye Huang (repr.) - - Director Yarn-Chen Chen - -
Generalplus Technology (Shenzhen) Inc.
Director Han- Hwa Lu - -
Chairman Sunplus Technology Chou-Chye Huang (repr.)
72,089,982 -
54.94% -
Director Bing-Huang Shih - - Director& President Chin-Nai Tsen 1,319,073 1.01%
Director Konly Venture Corporation Chun-Ting Liu (repr.)
21,719,764 -
16.55% -
Director Hsien-Ho Shen - - Director Pi-Chin Li - - Director Yi-Fang Kao - -
Supervisor Sunplus Venture Capita Shu-Lan Wang(repr.) 865,200 0.66%
Supervisor Chi-Ying Chiu - -
Orise Technology Co., Ltd.
Supervisor Chao-Chang Chen - -
Chairman Sunplus Technology Chou-Chye Huang (repr.)
120,000,000 -
90.91% -
Director & President Yarn-Chen Chen - -
Sunplus mMobile Inc.
Director Bing-Huang Shih - -

157
Shareholding Company Title Name Amount (shares) %
Supervisor Shu-Lan Wang - -
Chairman Sunplus Technology Chou-Chye Huang (repr.)
22,660,000 -
83.76% -
Director Bing-Huang Shih - - Director& President Chih-Hao Kung - -
Sunplus Innovation Technology Inc.
Supervisor Hans Tai - -
Chairman Sunplus mMobile Technology Chou-Chye Huang (repr.)
500,000 -
0.61% -
Director& President Yarn-Chen Chen - - Director Bing-Huang Shih - -
Sunplus mMedia Inc.
Supervisor Shu-Lan Wang - -
Chairman Sunplus Technology Chou-Chye Huang (repr.)
8,898,000
57.04%
Director Bing-Huang Shih Director Lin Shih Investment 2,000,000 12.82%
Sunplus Core Technology Co., Ltd
Director Sunplus Venture Capital 2,000,000 12.82%
Sunplus mMobile SAS Director Sunplus mMobile Technology Chou-Chye Huang (repr.) EUR237,000 100%
Sunplus mMobile Limited Director Sunplus mMobile Technology Chou-Chye Huang (repr.) GBP500,000 100%
Sunplus mMobile holding Inc. Director Sunplus mMobile Technology Chou-Chye Huang (repr.) US$2,580,000 100%
Bright Sunplus mMobile Inc. Director Sunplus mMobile Holding Inc. Chou-Chye Huang (repr.) US$2,515,000 100%
9.1.5 Common Shareholders of Sunplus and Its Subsidiaries or Its Affiliates with Actual of Deemed Control
Not applicable

158
9.1.6 Operation Highlights of Sunplus Affiliates Unit: NT$K; except EPS (NT$)
Company Capital Assets Liabilities Net Worth Net Sales Operation Income
Net Income (After Tax)
EPS (After Tax)
Sunplus Technology (HK) Co., Ltd. 46,847 4,876 59 4,817 3,160 8,864 8,864 NA Lin Shih Investment Co., Ltd. 700,000 689,330 35,274 654,056 184,230 34,610 36,358 0.52 Russell Holdings Limited 484,128 435,102 11,715 423,387 10,245 (60,634) (55,098) NA Sunplus Venture Capital Co., Ltd. 1,000,000 669,850 44,961 624,889 331,206 109,684 91,518 0.92 Waveplus Technology Co., Ltd. 32,000 61,584 20,446 41,138 103,027 (4,948) (3,649) (1.14) Ventureplus Group Inc. 810,160 428,744 266 428,478 0 (125,354) (125,214) NA Ventureplus Mauritius Inc. 810,160 428,785 155 428,630 0 (125,354) (125,354) NA Ventureplus Cayman Inc. 810,160 428,955 195 428,760 0 (125,354) (125,354) NA Shanghai Sunplus Co., Ltd. 564,160 550,838 255,807 295,031 52,091 (3,504) (3,504) NA Global Techplus Capital Inc.(The original name: Techplus Capital Niue Inc.) 6,560 7,852 0 7,852 1,577 1,434 1,486 NA
Hang Young Technology Co., Ltd. 6,000 2,544 0 2,544 0 0 0 0 Sunext Technology Co., Ltd. 1,000,000 646,945 516,628 130,317 253,143 (299,948) 61,338 0.61 Sunplus Management Consulting Inc. 5,000 4,194 0 4,194 0 (98) (30) (0.06) Waveplus Holding Ltd. 16,400 34 85 (51) 0 0 (2,050) NA Waveplus Design Inc. 16,400 0 0 0 0 0 0 NA GreatSun Corporation 57,400 36,697 0 36,697 11,036 (1) 264,368 NA WeiYing Investment Co., Ltd. 14,000 5,207 40 5,167 235 188 191 0.14 Generalplus Technology Co., Ltd. 683,664 1,511,983 349,086 1,162,897 1,893,937 244,924 189,683 2.77 Techplus Capital Samoa Inc. 0 0, 0 0 0 0 0 NA Sunext (Mauritius) Inc. 24,600 3,893 0 3,893 0 0 (3,336) NA Generalplus International Samoa Inc. 101,352 11,174 0 11,174 0 173 (64,195) NA Generalplus (Mauritius) Inc. 101,352 11,174 0 11,174 0 173 (64,195) NA Sunext Optoelectronics Technology (Shanghai) Co. Ltd 24,600 6,143 2,260 3,883 10,856 (3,338) (3,338) NA
Generalplus Technology (Shenzhen) Inc. 88,560 23,623 15,000 8,623 15,881 (59,462) (60,699) NA Orise Technology Co., Ltd. 1,312,156 2,710,534 439,360 2,271,174 4,567,214 298,641 265,446 2.03 Sunplus mMobile Inc. 1,320,000 851,937 1,011,339 (159,402) 44,987 (791,990) (1,274,350) (9.65) Sunplus Innovation Technology Inc. 270,520 639,245 170,817 468,428 1,201,646 77,780 65,822 2.44 Sunplus mMedia Inc. 825,000 1,308,953 400,798 908,155 2,270,119 (256,559) (364,758) (4.42) Sunplus Core Technology 156,000 162,767 131,466 31,301 8,300 (122,892) (123,362) (7.91) Generalplus HK 12,792 4,539 2,020 2,519 11,456 (3,674) (3,674) NA Sunplus Prof-tek(ShenZhen) 139,400 98,564 24,628 73,936 139,463 (65,563) (69,277) NA

159
Company Capital Assets Liabilities Net Worth Net Sales Operation Income
Net Income (After Tax)
EPS (After Tax)
Sunmedia Technology Co., Ltd. 98,400 70,242 19,582 50,660 59,618 (47,029) (50,089) NA Sunplus App Technology Co., Ltd. 18,027 18,209 3,292 14,917 323 (3,266) (3,266) NA Sunplus mMobile SAS 10,959 25,699 14,381 11,318 61,427 (99) 360 NA Sunplus mMobile Limited 23,760 2,019 59,314 (57,294) 0 (99,634) (99,527) NA Sunplus mMobile Holding Inc. 84,624 2,156 0 2,156 0 (79,273) (79,273) NA Bright Sunplus mMobile Inc. 82,492 24 0 24 0 (79,273) (79,273) NA 9.1.7 Consolidated Financial Statement of Sunplus Affiliates
Same as the 7.5 Consolidated Financial Statements. 9.2 Private Placement Securities
Not Applicable

160
9.3 Status of Sunplus Common Shares/GDRs Acquired, Disposed of, or Held by Subsidiaries
Company Capital Source of
Fund
% Owned
by Sunplus
Transaction Date
Amount of Acquisition Amount
of Disposal
Investment Income
Balance (by the Date
of this Report Printed)
Balance of Pledged Shares
Balance of Guarantee
Provided by Sunplus
Balance of Financing
Provided by Sunplus
2001.12.25 3,870,196 Shares &
$95,605,000 - - - None None None
2002.07.02 967,549 Shares
Capital increase from profits and capital surplus
- - - None None None Lin Shih Investment Co., Ltd.
700,000 self-owned reserves
100%
2003.07.13 483,774 Shares
Capital increase from capital surplus
- - - None None None
2004.08.23 532,151 Shares
Capital increase from profits and capital surplus
- - - None None None
2005.08.23 290,614 Shares
Capital increase from profits and capital surplus
- - - 2,503,705
Shares Pledged
None None
2006.08.05 306,132 Shares
Capital increase from profits and capital surplus
- - - 500,741 Shares Pledged
None None
2007.03.26 -3,220,429 Shares
Capital reduction - - - None None None
2007.09.05 +160,538 Shares
Capital increase from profits and capital surplus
- - - 380,000 Shares Pledged
None None
2008.09.08 +169,471 Shares
Capital increase from profits and capital surplus
- - - None None None
By the date of
this report printed
- - - 3,559,996
Shares $63,401,000
3,384,446 Shares Pledged
None None
9.4 Special Notes
Other necessary supplement: None 9.5 Any Events Impact to Shareholders’ Equity and Share Price
None

Related Documents