EPA 430-S-12-002 Summary Report: Global Anthropogenic Non-CO 2 Greenhouse Gas Emissions: 1990 - 2030 Revised December 2012 Office of Atmospheric Programs Climate Change Division U.S. Environmental Protection Agency 1200 Pennsylvania Avenue, NW Washington, DC 20460

Welcome message from author
This document is posted to help you gain knowledge. Please leave a comment to let me know what you think about it! Share it to your friends and learn new things together.
Transcript

EPA 430-S-12-002
Summary Report:
Global Anthropogenic Non-CO2
Greenhouse Gas Emissions: 1990 - 2030 Revised December 2012
Office of Atmospheric Programs
Climate Change Division
U.S. Environmental Protection Agency
1200 Pennsylvania Avenue, NW
Washington, DC 20460

December 2012 I. Introduction Page 1
1 Introduction and Overview
1.1 Introduction
This summary report provides historical and projected estimates of emissions of non-carbon dioxide (non-CO2) greenhouse gases (GHGs) from anthropogenic sources. The report provides a consistent and comprehensive estimate of non-CO2 greenhouse gases for 92 individual countries and eight regions. The analysis provides information that can be used to understand national contributions of GHG emissions, historical progress on reductions, and mitigation opportunities. The projections represent a business-as-usual scenario that includes reductions from established sector-specific programs but not economy-wide programs or commitments.1 Although this document is being published by the EPA, the U.S. projections are generated using the same methodologies used for all countries, and is based on IPCC Tier 1 calculations supplemented with country-reported inventory data where available. The dataset compiled for this report is available in spreadsheet (.xls) format on the U.S. EPA's webpage at: http://www.epa.gov/nonco2/econ-inv/international.html.
The gases included are the direct non-CO2 GHGs covered by the United Nations Framework Convention on Climate Change (UNFCCC): methane (CH4), nitrous oxide (N2O), and the fluorinated greenhouse gases (F-GHGs). The F-GHGs include hydrofluorocarbons (HFCs), perfluorocarbons (PFCs), and sulfur hexafluoride (SF6). In addition, nitrogen trifluoride (NF3) is considered. Compounds covered by the Montreal Protocol are not included in this report, although many of them are also F-GHGs. Historical estimates are reported for 1990, 1995, 2000, and 2005 and projections of emissions are provided for 2010, 2015, 2020, 2025, and 2030. Projections reflect the currently achieved impact of sector-specific climate policy programs, agreements, and measures that are already in place, but exclude GHG reductions due to additional planned activities and economy-wide programs whose impacts on individual sectors are less certain.
To develop estimates, the U.S. Environmental Protection Agency (EPA) collected emission estimates from publicly available nationally-prepared GHG reports consistent with the Revised 1996 Intergovernmental Panel on Climate Change Guidelines for National Greenhouse Gas Inventories (IPCC Guidelines) (IPCC, 1997), the IPCC Good Practice Guidance and Uncertainty Management in National Greenhouse Gas Inventories (IPCC Good Practice Guidance) (IPCC, 2000), and the Revised 2006 Intergovernmental Panel on Climate Change Guidelines for National Greenhouse Gas Inventories (IPCC Guidelines) (IPCC, 2006). If national estimates were unavailable from nationally-prepared GHG reports, EPA estimated non-CO2 GHG emissions in order to produce a complete global inventory. EPA’s calculated emission estimates are prepared in a consistent manner across all countries using IPCC default methodologies, international statistics for activity data, and the IPCC Tier 1 default emission factors.
1.2 Overview of Non-CO2 Greenhouse Gas Emissions
As shown in Exhibit 1, global emissions of CH4, N2O, and F-GHGs account for approximately 28 percent of global radiative forcing since the pre-industrial era of GHGs covered by the UNFCCC
1 See section 1.5 for more information

December 2012 I. Introduction Page 2
(IPCC, 2007). Emissions of non-CO2 GHGs contribute significantly to radiative forcing2 since they are more effective at trapping heat than CO2. The IPCC uses the concept of the global warming potential (GWP) to compare the ability of different gases to trap heat in the atmosphere relative to CO2. Emissions of non-CO2 gases are converted to a CO2-equivalent basis using the 100-year GWPs published in the IPCC’s Second Assessment Report (SAR) (IPCC, 1996). Table 1 shows GWPs of select gases from IPCC’s Second Assessment Report.3 These GWPs, as well as GWPs for additional gases (see Table 4-1 in the full report) were used in this report.
Exhibit 1: Contribution of Anthropogenic Greenhouse Gas Emissions to Global Radiative Forcing (W/m2)
Source: IPCC, 2007: Table 2.1
2 Radiative forcing is the change in the balance between radiation coming into and going out of the atmosphere. Positive radiative forcing tends on average to warm the surface of the Earth, and negative forcing tends on average to cool the surface (IPCC, 2007).
3 Although the GWPs have been updated by the IPCC in the Third Assessment Report (TAR) (IPCC, 2001) and again in the Fourth Assessment Report (AR4) (IPCC, 2007), estimates of emissions in this report continue to use the GWPs from the Second Assessment Report (SAR) (IPCC, 1996), in order to be consistent with international reporting standards under the UNFCCC. However, some of the F-GHGs estimated in this report do not have GWPs in the SAR. In these cases, this report uses the TAR GWPs or other published data (see Table 4-1 in the full version of the report for additional gases).
CO2
71.6%
CH4
20.7%
N2O6.9%
High GWPs0.7%
Non-CO2
28.4%

December 2012 I. Introduction Page 3
Table 1: Global Warming Potentials
Gas GWPa
Carbon dioxide (CO2) 1
Methane (CH4) 21
Nitrous Oxide (N2O) 310
HFC-23 11,700
HFC-32 650
HFC-125 2,800
HFC-134a 1,300
HFC-143a 3,800
HFC-152a 140
HFC-227ea 2,900
HFC-236fa 6,300
HFC-4310mee 1,300
CF4 6,500
C2F6 9,200
C4F10 7,000
C6F14 7,400
SF6 23,900
Source: IPCC, 1996 a 100 year time horizon.
EPA estimates that global non-CO2 GHG emissions in 2005 were about 11,000 million metric tons of carbon dioxide equivalent emissions (MtCO2e
4). When this non-CO2 emissions estimate is added to a global CO2 emissions estimate for 2005 of approximately 32,000 MtCO2 (WRI, 2010), anthropogenic non-CO2 emissions represent 25 percent of the global GHG emissions emitted annually on a CO2 equivalent basis in 2005.
1.3 Emission Sources
This report focuses exclusively on anthropogenic sources of non-CO2 GHGs. Table 2 lists the source categories included in this analysis, and all anthropogenic sources of CH4 and N2O are included (with a few exceptions noted in Section 1.6). The major sources are considered individually and emissions from minor sources are combined under “Other” categories, listed in Table 2. The F-GHG sources include substitutes for ozone-depleting substances (ODS) and industrial sources of HFCs, PFCs, and SF6.
4 One MtCO2 is equivalent to one megatonne or teragram of CO2.

December 2012 I. Introduction Page 4
Table 2: Sources Included in this Report Sector/Source Gas
Energy
Natural Gas and Oil Systems CH4
Coal Mining Activities CH4
Stationary and Mobile Combustion CH4, N2O
Biomass Combustion CH4, N2O
Other Energy Sources
Waste Combustion
Fugitives from Solid Fuels
Fugitives from Natural Gas and Oil Systems
CH4, N2O
N2O
N2O
Industrial Processes
Adipic Acid and Nitric Acid Production N2O
Use of Substitutes for Ozone Depleting Substances HFCs
HCFC-22 Production HFCs
Electric Power Systems SF6
Primary Aluminum Production PFCs
Magnesium Manufacturing SF6
Semiconductor Manufacturing HFCs, PFCs, SF6, NF3
Flat Panel Display Manufacturing PFCs, SF6, NF3
Photovoltaic Manufacturing PFCs, NF3
Other Industrial Processes Sources
Chemical Production
Iron and Steel Production
Metal Production
Mineral Products
Petrochemical Production
Silicon Carbide Production
Solvent and Other Product Use
CH4
CH4
CH4, N2O
CH4
CH4
CH4
N2O
Agriculture
Agricultural Soils N2O
Enteric Fermentation CH4
Rice Cultivation CH4
Manure Management CH4, N2O
Other Agriculture Sources
Agricultural Soils
Field Burning of Agricultural Residues
Prescribed Burning of Savannas
Open Burning from Forest Clearing
CH4
CH4, N2O
CH4, N2O
CH4
Waste
Landfilling of Solid Waste CH4
Wastewater CH4
Human Sewage - Domestic Wastewater N2O
Other Waste Sources
Miscellaneous Waste Handling Processes
CH4, N2O

December 2012 I. Introduction Page 5
Sources of Non-CO2 Greenhouse Gas Emissions Not Included in This Estimate
Due to methodological limitations, a few anthropogenic sources have not been fully included in this analysis. These include CH4 from hydroelectric reservoirs and abandoned coal mines, N2O from industrial wastewater, and F-GHG emissions from the manufacture of electrical equipment. Information on these sources is partially included because historical and projection data taken from country-reported inventories and national communications may include emissions data from one or more of these sources. EPA did not calculate tier 1 estimates for these sources where it was missing, nor subtract out values from country reports where it was included. For this reason, the sources covered by the wastewater, electric power systems, and coal mine estimates may be slightly different between countries with country-reported emissions versus tier 1 estimates. In addition, natural sources of non-CO2 emissions are not included in this report.5
1.4 Region Groupings
Countries have been grouped for the purpose of charts and analysis. These regions are defined based on a combination of geographic regions and OECD membership status:
OECD
non-OECD Asia,
non-OECD Europe and Eurasia,
Africa,
Central and South America, and
the Middle East.
OECD membership status is used as of November 2010. At that time, Chile, Israel, and Slovenia had recently joined the OECD. Chile and Israel are included in the OECD as opposed to Central and South America and Middle East regions. Likewise, Slovenia is included in the OECD as opposed to the non-OECD Europe and Eurasia region. These regional groupings are further defined in Exhibit
5 For more information see EPA Report 430-R-10-001 “Methane and Nitrous Oxide Emissions from Natural Sources.”

December 2012 I. Introduction Page 6
OECD
Australia A
Austria A, E
Belgium A, E
Canada A
Chile
Czech Republic A, E
Denmark A, E
Finland A, E
France A, E
Germany A, E
Greece A, E
Hungary A, E,
Iceland A
Ireland A, E
Israel
Italy A, E
Japan A
Luxembourg A, E
Mexico
Netherlands A, E
New Zealand A
Norway A
Poland A, E
Portugal A, E
SlovakiaA, E
Slovenia A, E
South Korea
Spain A, E
Sweden A, E
Switzerland A
Turkey A
United Kingdom (UK) A, E
United States (U.S.) A
Middle East
Iran O
Iraq O
Jordan
Kuwait O
Saudi Arabia O
United Arab Emirates O
“Rest of Middle East” 1, 2
Non-OECD Asia
Bangladesh
Burma
Cambodia
China
India
Indonesia
Laos
Mongolia
Nepal
North Korea
Pakistan
Philippines
Singapore
Thailand
Vietnam
“Rest of Non-OECD Asia” 1, 2
Africa
Algeria O
Congo (Kinshasa)
Egypt
Ethiopia
Nigeria O
Senegal
South Africa
Uganda
“Rest of Africa” 1, 2
Central and South
America
Argentina
Bolivia
Brazil
Colombia
Ecuador O
Peru
Uruguay
Venezuela O
“Rest of Central and South
America”1, 2
Non-OECD Europe &
Eurasia
Albania
Armenia
Azerbaijan
Belarus A
Bulgaria A, E
Croatia A
Estonia A, E
Georgia
Kazakhstan
Kyrgyzstan
Latvia A, E
Lithuania A, E
Macedonia
Moldova
Monaco A
Romania A, E
Russia A
Tajikistan
Turkmenistan
Ukraine A
Uzbekistan
“Rest of Non-OECD
Europe & Eurasia” 1, 2
Codes:
A – Annex I Countries E – European Union Countries O – OPEC Countries Notes:
1. The complete list of countries included in the “Rest of” groupings can be found in Appendix J. 2. In this report, when emissions totals are presented for a region, the regional sum includes the estimates for all of the individually
reported countries and the aggregated value for the “Rest of” countries. For example, the emissions total for the “Middle East”
found in the graphs and Appendices A through D, includes the sum of Iran, Iraq, Israel, Jordan, Kuwait, Saudi Arabia, the United
Arab Emirates and the smaller emitters already aggregated under “Rest of Middle East”.
Exhibit 2: Regional Groupings
December 2012 I. Introduction Page 7
1.5 Approach
The report presents historical emission estimates for individual countries for 1990, 1995, 2000, and 2005. Projected emissions, assuming no additional reduction measures, were estimated from 2010 to 2030, also at five-year intervals. In addition to the individual country data, EPA presents overall trends by region, gas, and source category and explanations for why these trends are projected.
The general approach for developing the estimates used a combination of country-prepared, publicly-available reports of emissions and calculations based on activity data and default emission factors. The base year for projections was 2005. Estimates from 1990 to 2005 are the historical period and estimates of actual emissions. Estimates from 2010 to 2030 are projections. Emissions projections required a range of assumptions about economic activity, technology development, and emissions reductions, and other factors.
The projections represent a business-as-usual (BAU) scenario where currently achieved reductions are incorporated and future mitigation actions are included only if either a well-established program or an international sector agreement is in place. Estimates are presented at the source category level; therefore, only policies and programs that affect source level emissions directly were reflected in the BAU projections. For example, the reductions attributable to the EU landfill directive regulations, U.S. sector level voluntary programs, and international sector agreements such as the World Semiconductor Council agreement were reflected in BAU projections presented here. The reductions associated with Kyoto commitments and Copenhagen reduction pledges were not reflected in projections by GHG or source category because these are country level goals that are difficult to disaggregate to the required degree.
Data Sources
The three primary types of data used are country-prepared emissions reports, activity data, and default emission factors. Country-reported data include Annex I inventory submissions to the UNFCCC Secretariat which consist of a National Inventory Report (NIR) and Common Reporting Format (CRF), National Communications to the UNFCCC, and/or other country-prepared reports. The preferred source for historical data was the UNFCCC flexible query system (UNFCCC, 2012) since this database provides updated GHG emission estimates for most Annex I Parties and to a lesser extent the latest GHG emission estimates for non-Annex I Parties. 6 National Communications were the preferred source for projections and non-Annex I historical emission estimates. The Fifth National Communications were available for most Annex I Parties. For non-Annex I countries, a majority have submitted their First National Communications, 29 had Second National Communications, and one country had both a Third and Fourth National Communications. The estimates in the UNFCCC inventory submissions and National Communications for each reporting Party are comparable because they rely on the IPCC methodologies and are reported for IPCC-designated source categories which generally follow the categories shown in Table 2.
For most Annex I Parties, a full historical time series of emissions inventories was available from national inventory reports. In some cases, this report also used emissions projections provided by Annex I Parties in their National Communications. However, in many cases emissions projections
6 Annex I Parties include the industrialized countries that were members of the OECD in 1992, plus countries with economies in transition (the CEIT Parties), including the Russian
Federation, the Baltic States, and several Central and Eastern European States. Annex I countries are noted in Exhibit .

December 2012 I. Introduction Page 8
from National Communications use aggregated or differing categories that make them difficult to use for disaggregated source-specific projections. Non-Annex I Parties do not file yearly national inventory reports, but they do produce National Communications. Those National Communications include historical inventories and projections in some cases. However, most non-Annex I countries provided their most recent National Communication prior to 2005, meaning some historical period emissions data use projections and calculations.
In addition to country-reported data, this report utilized international activity data sources and default emission factors. For example, activity data sources included coal and oil production compiled by the International Energy Agency, primary aluminum production compiled by the U.S. Geological Survey, fertilizer usage and crop production compiled by the Food and Agriculture Organization, and population and GDP data and projections. Information on data sources used for each emissions source can be found in Section 7 of the full report. Activity data were used with default emission factors provided in IPCC emissions calculation guidelines to estimate emissions. In some cases, projections of activity data were available. In other cases, growth rates were extrapolated from historical data.
Emissions Calculations
If nationally developed emission estimates were unavailable or if the data were insufficient, EPA estimated historical emissions and projections using the default methodologies presented in the IPCC Guidelines (available at: http://www.ipcc-nggip.iges.or.jp/public/2006gl/index.html) and the IPCC Good Practice Guidance (available at: http://www.ipcc-nggip.iges.or.jp/public/gp/english/). EPA used IPCC Tier 1 methodologies and available country or region-specific activity data to estimate emissions. Some of these calculations relied on population estimates provided by the U.S. Census International Database and GDP estimates from the U.S. Department of Agriculture.
IPCC guidelines provide three tiers of calculation methods which provide different levels of accuracy based on available data. Tier 1 methodologies are the simplest methods, requiring the least data but have the greatest uncertainty. Tier 1 estimates usually involve activity data statistics multiplied by a default emission factor.
Many sources and countries had some years for which country-reported data is available, and others for which calculations were necessary. In most of these cases, growth rates were calculated using Tier 1 methodology (historical or projected activity data and Tier 1 emission factors); these rates were then applied to country-reported estimates to project emissions. One advantage of this approach is that it avoids reporting discontinuities or changes in emissions because of changes in methodology. It also implicitly uses emission factor information from country-reported emissions data, which may use more accurate methodologies than the Tier 1 calculations. The disadvantage, however, is that some emission estimates are a hybrid of country-reported and calculated emissions.
A detailed description of the methodology used for each country and source category is provided in Section 7 and Appendix G of the full report.
1.6 Limitations
Although careful and consistent methods have been used to produce the emissions estimates, limitations still exist. First, some data were not incorporated into the estimates due to methodological and time limitations. In addition, the methods entail significant uncertainty. Third,

December 2012 I. Introduction Page 9
policies and economic development are likely to diverge from the business-as-usual assumptions that were used to construct the projections.
This report primarily uses recent information available as of April 2010 and reported UNFCCC data available as of March 2012. More recent estimates of emissions and activity data are available for some countries and sectors, but were not incorporated due to time limitations. These more recent information include GHG emission estimates from Annex I national inventory report submissions for 2010, several non-Annex I National Communications, emission estimates from biomass burning from EDGAR (the Emission Database for Global Atmospheric Research), energy and fuel use data from IEA (Energy Balances of OECD and Non-OECD Countries), projections of energy and fuel use from IEA’s World Energy Outlook and EIA’s International Energy Outlook, population estimates from the U.S. Census, and GDP estimates from USDA. In addition, some data sources were not used because of methodological limitations or because time was not available to develop calculations to utilize those sources. For example, National Communications often present aggregated emissions projections, which are difficult to use to project emissions by source.
The projections are sensitive to changes in key assumptions regarding technological changes and production/consumption patterns. For example, the emission rates of new equipment using ODS substitutes are likely to be much lower than the emission rates of older equipment. This newer equipment is only now being phased in, and the long-term emission characteristics are not yet well known. In the agriculture sector, the effect of changing consumer preferences on product demand, such as increased beef consumption, is difficult to predict and creates large uncertainties in the projected emissions from many of the agricultural sources. In general, Tier 1 calculations include significant uncertainty because they do not utilize detailed information but instead use average emission rates for a category.
While efforts have been made to provide projected emissions on a consistent basis, the distinction between currently achieved GHG reductions from climate mitigation measures in place and those from additionally planned activities is not always clearly defined in the reported data. The inclusion of incidental GHG reductions in projected emissions as a result of climate related actions or government polices still in development is a possibility in some isolated cases. However, due to the consistent approaches established for reporting projected data and policies and measures in the National Communications, the information developed from these sources is generally considered comparable.
The projections in this report used BAU assumptions. However, many countries have already committed to actions to reduce their emissions below the BAU level. The extent to which actions will affect CO2 and non-CO2 emissions is uncertain. In addition, the projections used constant emission factors, which do not account for future changes in emission rates due to technological development (such as low-emissions technologies).
For all these reasons, uncertainty in the emissions projections is significant. Care should be used in examining emissions projections for a single country or source, especially in examining small changes for which uncertainty can alter conclusions. Nonetheless, EPA believes that these estimates and projections represent a reasonable and detailed approximation with the data and resources available.

December 2012 2. Summary Results Page 10
2 Summary Results
2.1 Summary Estimates
Between 1990 and 2005, global non-CO2 emissions grew by 10 percent from about 9,800 to 10,800 MtCO2e and are expected to grow approximately 43 percent from 2005 to 2030. This projection represents a BAU scenario in which currently achieved reductions are incorporated but future mitigation actions are included only if either a regulation, well-established program, or an international sector agreement is in place.7 Historical emissions of CH4 have increased 9 percent (from about 6,300 to 6,800 MtCO2e), N2O emissions increased 4 percent (from about 3,200 to 3,400 MtCO2e), and F-GHG emissions increased 128 percent (from about 250 to 600 MtCO2e) from 1990 to 2005. Emissions of F-GHGs are projected to increase 336 percent from 2005 to 2030, much faster than CH4 (26 percent) and N2O (26 percent).
Table 3 below provides emissions by gas for 1990, 2005 and 2030 for each sector and source. F-GHGs are provided by their constituent gases for each sector and source. Table 6, at the end of this document, also provides emissions by gas for 2005 and 2030 for each sector and source.
Historical emission trends for CH4 and N2O are the cumulative effect of several drivers. Although basic activities (waste generation and landfilling, energy production and consumption, etc.) have predominantly increased, several factors have mitigated emission growth. First, recovery and use of CH4 has reduced these emissions in many countries. Second, sectoral level restructuring has decreased emissions. Finally, economic restructuring in several countries, such as Russia and Germany, caused a decrease in emissions in the 1990s. Since 2000, emissions have increased due to a number of factors, driven largely by 1) economic and sectoral growth in recently restructured countries and sectors, and 2) only partial mitigation coverage in the BAU projections (as described above). F-GHG emissions, although relatively small in 1990, have increased substantially as HFCs have been deployed as substitutes for the ozone-depleting substances (ODS) that are being phased out globally under the Montreal Protocol. This historical deployment of HFCs has taken place primarily in developed countries, where hydrofluorocarbon (HCFC) phaseout regulations have been promulgated, although emissions are also now present in developing countries where HFCs are being used as direct replacements for the globally-phased out chlorofluorocarbons (CFCs) in some technologies (e.g., air conditioning for passenger cars).
7 Estimates in this report are presented at the source category level, therefore, only policies and programs that affect source level emissions directly are reflected in the BAU projections. For example, the reductions attributable to the EU landfill directive regulations, U.S. sector level voluntary programs, and international sector agreements such as the World Semiconductor Council agreement are reflected in BAU projections presented here. The reductions associated with Kyoto commitments and Copenhagen targets are not taken into account because these are country level goals that are difficult to disaggregate to the source category level.

December 2012 2. Summary Results Page 11
Table 3: Global Non-CO2 GHG Emissions by Sector, by Gas (MtCO2e)
Source Category Sector Gas 1990 2005 2030
Energy
Natural Gas and Oil Systems CH4 1,278.3 1,542.7 2,112.9
Coal Mining Activities CH4 529.8 521.6 784.3
Stationary and Mobile Combustion CH4 221.3 224.3 362.9
N2O 201.3 256.1 402.5
Biomass Combustion CH4 176.3 198.0 230.4
N2O 40.6 47.6 59.4
Other Energy Sources CH4 0.5 0.5 0.5
N2O 2.6 3.5 3.4
Total 2,450.8 2,794.3 3,956.3
Industrial
Processes
Adipic Acid and Nitric Acid Production N2O 199.8 126.5 147.2
Use of Substitutes for Ozone Depleting
Substances
HFCs - 307.7 1,902.7
HCFC-22 Production HFCs 104.2 179.0 286.4
Operation of Electric Power Systems SF6 49.3 41.2 63.8
Primary Aluminum Production PFCs 83.9 30.6 37.4
Magnesium Manufacturing SF6 12.0 9.8 5.2
Semiconductors Manufacturing
HFCs 0.8 0.7 1.1
PFCs 9.0 14.0 12.2
SF6 2.8 5.4 3.3
NF3 0.1 5.5 5.0
Flat Panel Display Manufacturing
PFCs 0.0 0.1 5.2
SF6 0.1 3.3 133.2
NF3 0.0 0.5 23.9
Photovoltaic Manufacturing PFCs - 0.5 112.1
NF3 - 0.0 16.3
Other Industrial Processes Sources CH4 7.7 7.5 6.3
N2O 80.8 77.0 76.3
Total 550.4 809.2 2,837.6
Agriculture
Agricultural Soils N2O 1,658.1 1,840.0 2,482.8
Enteric Fermentation CH4 1,763.9 1,894.3 2,320.5
Rice Cultivation CH4 480.0 500.9 510.4
Manure Management CH4 232.7 219.2 252.7
N2O 203.8 179.0 213.6
Other Agricultural Sources CH4 506.6 421.0 421.0
N2O 776.7 744.1 744.1
Total 5,621.8 5,798.5 6,945.0
Waste
Landfilling of Solid Waste CH4 706.1 794.0 959.4
Wastewater CH4 351.9 476.7 608.8
Human Sewage – Domestic Wastewater N2O 68.0 81.7 99.8
Other Waste Sources CH4 13.4 15.2 15.5
N2O 8.9 11.2 11.4
Total 1,148.3 1,378.8 1,694.9
Total 9,771.2 10,780.7 15,433.8
Projections of future growth in emissions of non-CO2 gases are driven by several factors. Countries with fast-growing economies and populations are expected to contribute more to the global CH4 and N2O totals as their economies grow, energy consumption increases, and waste generation rates increase. Countries with more steady-state economies, and small or even declining population growth rates, are likely to experience minimal growth in CH4 and N2O emissions. The large increase in F-GHG emissions stems predominately from the increase in use of HFCs as substitutes for

December 2012 2. Summary Results Page 12
ozone depleting substances. While this trend has largely been observed only for OECD countries to 2005, throughout the projection period all regions are projected to have increases in HFC emissions, as more countries transition away from ODSs amidst strong global growth in demand expected for refrigeration and air conditioning and other technologies that utilize HFCs in lieu of ODSs. While emissions of HFCs used as substitutes for ODSs are increasing, the ODSs that HFCs replace are also greenhouse gases, in many cases more potent than the substitutes. Thus, although emissions of HFCs used as substitutes of ODSs are increasing, the radiative forcing from the CFCs and HCFCs they replace would have been much higher had the phaseout of ODSs not taken place.8
Exhibit 3: Global Non-CO2 Emissions, by Gas (MtCO2e)
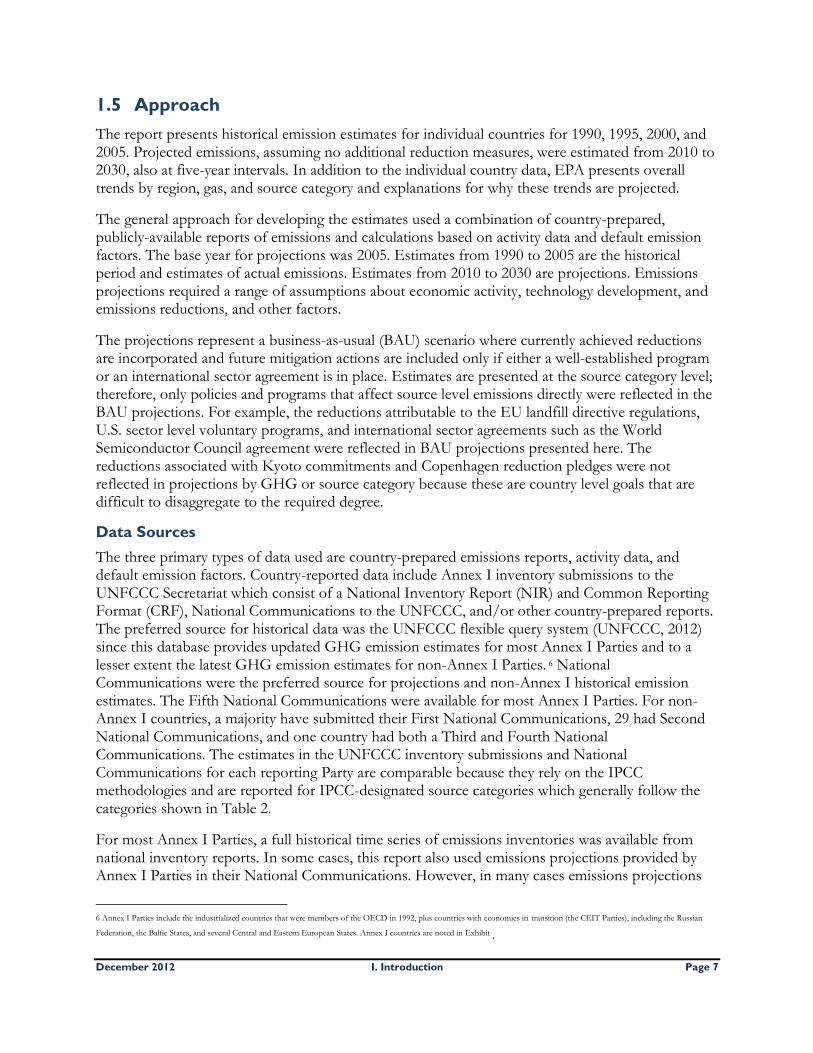
2.2 Trends by Region
Exhibit 4 shows the regional contribution of emissions from 1990 to 2030. Between 1990 and 2005, emissions grew from Africa, Central and South America, the Middle East, and non-OECD Asia, while falling from the OECD and non-OECD Europe and Eurasia regions. By 2030, BAU emissions of non-CO2 GHGs are projected to increase in every region compared to 2005 emissions. Emissions are projected to grow the fastest in non-OECD Asia, the Middle East, and the OECD. Table 4 displays decadal growth rates by region from 1990 to 2030.
8 For an estimate of the climate benefits of phasing out ODSs, see Velders et al. (2007).
-
2,000
4,000
6,000
8,000
10,000
12,000
14,000
16,000
1990 1995 2000 2005 2010 2015 2020 2025 2030
Em
issi
on
s (M
tCO
2e)
Year
F-GHGs
N2O
CH4
December 2012 2. Summary Results Page 13
Exhibit 4: Total Global Non-CO2 Emissions, by Country Grouping (MtCO2e)
Table 4: Percent Change in Total Global Non-CO2 Emissions, by Decade and
Region
Region 1990-2000 2000-2010 2010-2020 2020-2030 1990-2030
OECD 0.6% 1.6% 14.9% 15.2% 35.3%
Non-OECD Asia 13.0% 24.1% 20.9% 28.7% 118.1%
Non-OECD Europe & Eurasia -31.6% 9.2% 10.6% 9.1% -9.7%
Africa 3.5% 23.5% 10.6% 11.3% 57.2%
Central and South America 8.9% 20.3% 10.3% 9.1% 57.7%
Middle East 47.4% 16.0% 20.6% 18.1% 143.4%
Total 1.3% 15.1% 15.2% 17.6% 58.0%
Non-CO2 emissions from the OECD decreased by 2 percent from 1990 to 2005 (to about 2,800 MtCO2e), while GDP grew by 44 percent.9 Several initiatives took place during this period which had the effect of reducing emissions. Some of the most significant were increasing control of emissions from nitric acid, adipic acid, and HCFC-22 manufacturing facilities, tailpipe emissions from vehicles, and capture and combustion of landfill gas. Coal production declined significantly in
9 EIA, 2009. GDP is expressed in constant 2005 dollars, at market exchange rates. Table A4 from the International Energy Outlook 2009.
-
2,000
4,000
6,000
8,000
10,000
12,000
14,000
16,000
1990 1995 2000 2005 2010 2015 2020 2025 2030
Em
issi
on
s (M
tCO
2e)
Year
Middle East
Central and South America
Africa
Non-OECD Europe & Eurasia
Non-OECD Asia
OECD
December 2012 2. Summary Results Page 14
the EU, which decreased emissions from coal mining. Emissions from OECD countries are projected to increase 37 percent (from about 2,800 to 3,800 MtCO2e) from 2005 to 2030. This scenario does not take into account economy-wide programs to control GHG emissions or country emissions reduction pledges. While some emissions reduction activities that have been successful in the OECD in the past will likely continue to be significant, large additional reductions in those areas are less likely since many-cost effective options have already been implemented.
The non-OECD Europe and Eurasia region includes many countries from the former Soviet Union that underwent significant economic changes since 1990. Non-CO2 emissions from this region dropped 29 percent between 1990 and 1995, and stayed at approximately this level through 2005. The emissions decline can be attributed to economic contraction, with GDP in 2005 2 percent lower than 1990, as well as changes in industry structure that accompanied the change to market economies. From 2005 to 2030, emissions from this region are projected to grow 27 percent, which would result in emission totals nearly reaching 1990 levels.
Non-OECD Asia has grown quickly from 1990 to 2005, both in terms of economy and emissions. Over this period, non-CO2 emissions grew 31 percent (from about 2,400 to 3,200 MtCO2e), while GDP grew by 178 percent, nearly tripling the previous level. International offset projects have been concentrated in this region, and especially in the HCFC-22 manufacturing sector, but emissions in this sector have continued to increase. Because national inventory reports are not available from the largest emitters in this region, historical emissions have been estimated using activity data and IPCC default emission factors. Recent initiatives to close small mines in China may be reducing CH4 emissions from the coal mining sector. From 2005 to 2030, non-CO2 emissions from non-OECD Asia are projected to grow by 67 percent, with GDP more than quadrupling (increasing by 327 percent). Two factors are expected to cause ODS substitute emissions to grow significantly: the phase-out of ODSs and the increasing use of air conditioning and refrigeration as economies grow. Emissions from many industries are expected to grow in parallel with economic expansion.
Non-CO2 emissions from Africa grew 17 percent between 1990 and 2005. GDP in Africa grew 57 percent over the same period. The pattern of emissions is quite different in Africa than other regions. Sources with significant emissions and growth over this period include savanna burning (included in other agricultural sources), biomass burning, natural gas and oil, stationary and mobile combustion, landfills and wastewater. Emissions from Africa are projected to increase 34 percent from 2005 to 2030, while GDP is expected to triple over this time. As African economies develop, technologies used are likely to change substantially, impacting non-CO2 emission trajectories. Such changes aren’t generally accounted for in the BAU projections.
Between 1990 and 2005, emissions from Central and South America10 grew 31 percent, while GDP grew by 55 percent. About 82 percent of non-CO2 emissions in Central and South America are attributed to the Agriculture sector in 2005, a much higher proportion than other regions. From 2005 to 2030, emissions from the region are projected to increase 20 percent, the smallest percentage increase of all regions. GDP is expected to grow 157 percent over the projection period, slower than any of the other non-OECD regions.
10 The Central and South America region excludes Chile, which recently joined the OECD and is included in that region.
December 2012 2. Summary Results Page 15
Emissions from the Middle East11 region grew 55 percent from 1990 to 2005. While this rate of growth is the near the highest of any region, emissions from the Middle East comprise only 5 percent of the world total in 2005. Over half of non-CO2 emissions from the Middle East (on a CO2 equivalent basis) are CH4 emissions from the natural gas and oil sector; thus the emissions trend for the region is highly correlated with trends in oil and gas production. From 2005 to 2030, emissions from the region are projected to grow by 57 percent.
2.3 Trends by Gas, Sector, and Source Category
Emissions sources are grouped into four economic sectors: energy, industrial processes, agriculture and waste. While CO2 emissions are concentrated in the energy sector, agriculture accounts for the largest share of non-CO2 emissions (54 percent of emissions in 2005). The energy, waste, and industrial processes sectors account respectively for 26 percent, 8 percent, and 13 percent of emissions in 2005. However, emissions from industrial processes are growing at a faster rate than emissions from the other sectors.
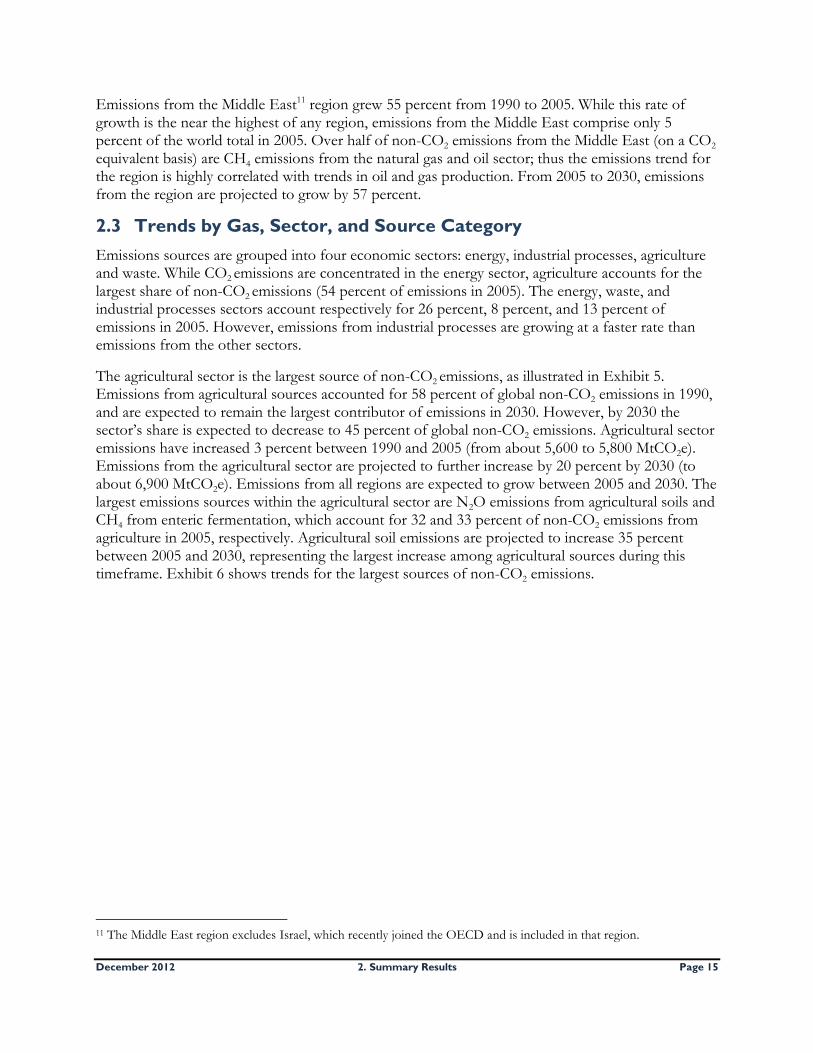
The agricultural sector is the largest source of non-CO2 emissions, as illustrated in Exhibit 5. Emissions from agricultural sources accounted for 58 percent of global non-CO2 emissions in 1990, and are expected to remain the largest contributor of emissions in 2030. However, by 2030 the sector’s share is expected to decrease to 45 percent of global non-CO2 emissions. Agricultural sector emissions have increased 3 percent between 1990 and 2005 (from about 5,600 to 5,800 MtCO2e). Emissions from the agricultural sector are projected to further increase by 20 percent by 2030 (to about 6,900 MtCO2e). Emissions from all regions are expected to grow between 2005 and 2030. The largest emissions sources within the agricultural sector are N2O emissions from agricultural soils and CH4 from enteric fermentation, which account for 32 and 33 percent of non-CO2 emissions from agriculture in 2005, respectively. Agricultural soil emissions are projected to increase 35 percent between 2005 and 2030, representing the largest increase among agricultural sources during this timeframe. Exhibit 6 shows trends for the largest sources of non-CO2 emissions.
11 The Middle East region excludes Israel, which recently joined the OECD and is included in that region.
December 2012 2. Summary Results Page 16
Exhibit 5: Total Global Non-CO2 Emissions, by Sector (MtCO2e)
Energy sector emissions are the second largest source of non-CO2 emissions, accounting for approximately 25 percent of non-CO2 emissions in both 1990 and 2005. Emissions from the energy sector increased 14 percent between 1990 and 2005 (from about 2,500 to 2,800 MtCO2e), driven by a 21 percent increase in emissions from natural gas and oil systems. In 2005, fugitive emissions from natural gas and oil systems represented the largest source of non-CO2 GHG emissions from the energy sector, accounting for 55 percent of energy-related emissions. The next largest source in this sector is emissions from coal mining activities, accounting for 19 percent of energy related emissions in that year. From 2005 to 2030, energy sector emissions are projected to increase 42 percent (to about 4,000 MtCO2e), with emissions from stationary and mobile combustion and coal mining activities increasing by 59 and 50 percent, respectively.
The industrial processes sector was the smallest contributor to global emissions of non-CO2 greenhouse gases in 2005, accounting for only 8 percent of total emissions. As the fastest growing of all sectors, emissions from industrial processes are projected to increase to 18 percent of non-CO2 greenhouse gases in 2030, surpassing emissions from the waste sector. The industrial processes sector includes all emissions of F-GHGs as well as N2O emissions from nitric and adipic acid production and other industrial process sources. In 1990, nitric and adipic acid production accounted for 36 percent of non-CO2 emissions from the sector. Between 1990 and 2005, emissions from nitric and adipic acid declined significantly due to the installation of abatement equipment. However, emissions from production of HCFC-22 and ODS substitutes increased over the same time period. Emissions from the industrial processes sector as a whole have increased 47 percent between 1990 and 2005 (from about 550 to 800 MtCO2e) and are projected to grow even faster,
-
2,000
4,000
6,000
8,000
10,000
12,000
14,000
16,000
1990 1995 2000 2005 2010 2015 2020 2025 2030
Em
issi
on
s (M
tCO
2e)
Year
Waste
Industrial Processes
Energy
Agriculture

December 2012 2. Summary Results Page 17
nearly quadrupling between 2005 and 2030 (from about 800 to 2,800 MtCO2e). This sectoral growth is driven by growth in emissions from ODS substitutes over this period, due to the phase out of ODSs under the Montreal Protocol and strong predicted growth in traditional ODS applications (e.g., refrigeration and air conditioning). As ODSs are phased out, other gases, including HFCs and to a limited extent PFCs, are substituted. The rate of growth is uncertain, however, because the choice of chemicals and potential new technologies or operating procedures could eliminate or diminish the need for these gases. However, under the BAU scenario without further controls, it is assumed that most users will switch to HFCs.
The waste sector was the third largest contributor to global emissions of non-CO2 greenhouse gases in 2005, accounting for 13 percent of total emissions. In the waste sector, the two largest sources of non-CO2 emissions are landfilling of solid waste and wastewater, together contributing 92 to 93 percent of emissions throughout the 1990 to 2030 period. CH4 from landfills accounts for an average of 58 percent of waste emissions across the same timeframe. Increases in waste generation and population drive global waste emissions upward but increases in waste-related regulations and gas recovery and use are expected to temper this increase. Emissions from wastewater are projected to grow more quickly than those from landfills, and are projected to account for 36 percent of waste emissions by 2030. Projected wastewater emissions are driven by population growth and the underlying assumption that growing populations in the developing world are largely served by latrines and open sewers, rather than advanced wastewater treatment systems.
Exhibit 6 displays the breakdown of global non-CO2 emissions by source. Thirteen sources are expected to contribute almost all (95 percent) of non-CO2 emissions in 2030. Four of these sources—agricultural soils, enteric fermentation, ODS substitutes, and natural gas and oil systems—are projected to contribute over half (57 percent) of the global total in 2030.

December 2012 2. Summary Results Page 18
Exhibit 6: Global Non-CO2 Emissions, by Source (MtCO2e)
2.4 Other Global Datasets
Although non-CO2 global emissions data are not as prevalent as CO2 data, other datasets exist and EPA has included information on those datasets for comparison. It should be noted that in some cases, those datasets rely partly on either segments or earlier versions of the dataset presented in this report. Additionally, the dataset presented in this report includes data on biomass burning taken from the Emission Database for Global Atmospheric Research (EDGAR).
Table 5 and Exhibit 7 present global historical and projected emissions of CH4, N2O, and F-GHGs for 2000, 2010, 2020, and 2030 from the following sources:
Energy Management Forum 22 (EMF-22) Analysis (EMF-22, 2009).12
CCSP Synthesis and Assessment Product 2.1 - Scenarios of Greenhouse Gas Emissions and Atmospheric Concentrations (CCSP, 2007).13
Emission Database for Global Atmospheric Research (EDGAR) 4.1 (EC-JRC, 2010).
12 Used “Reference” scenario for all models, which include ETSAP-TIAM, FUND, GTEM, MERGE Optimistic, MERGE Pessimistic, MESSAGE, MiniCAM – BASE, MiniCAM - Lo Tech, POLES, SGM, and WITCH.
13 Ranges depicted include estimates for the three reference scenarios, IGSM, MERGE, and MINICAM.
-
2,000
4,000
6,000
8,000
10,000
12,000
14,000
16,000
1990 1995 2000 2005 2010 2015 2020 2025 2030
Em
issi
on
s (M
tCO
2e)
Year
Remaining 11 Sources
Biomass Combustion
Manure Management
Wastewater
Stationary and Mobile Combustion
Rice Cultivation
Coal Mining Activities
Landfilling of Solid Waste
HCFC-22 Production
Other Agricultural Sources
Natural Gas and Oil Systems
ODS Substitutes
Enteric Fermentation
Agricultural Soils
December 2012 2. Summary Results Page 19
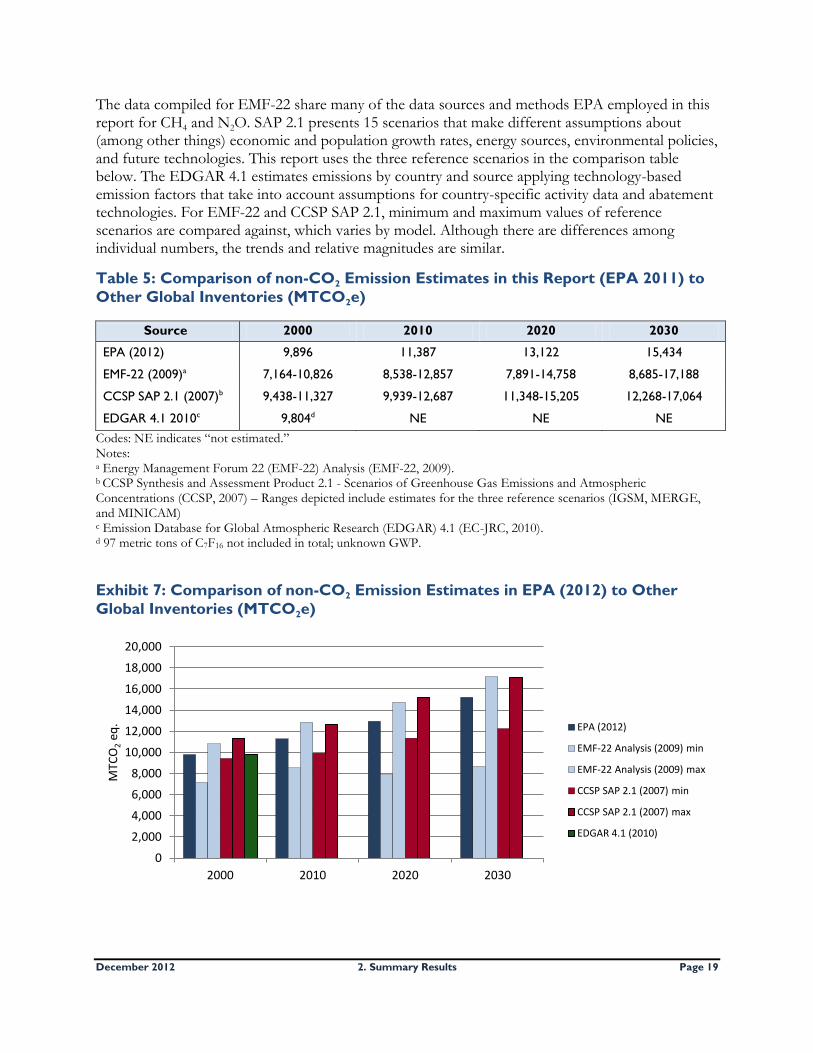
The data compiled for EMF-22 share many of the data sources and methods EPA employed in this report for CH4 and N2O. SAP 2.1 presents 15 scenarios that make different assumptions about (among other things) economic and population growth rates, energy sources, environmental policies, and future technologies. This report uses the three reference scenarios in the comparison table below. The EDGAR 4.1 estimates emissions by country and source applying technology-based emission factors that take into account assumptions for country-specific activity data and abatement technologies. For EMF-22 and CCSP SAP 2.1, minimum and maximum values of reference scenarios are compared against, which varies by model. Although there are differences among individual numbers, the trends and relative magnitudes are similar.
Table 5: Comparison of non-CO2 Emission Estimates in this Report (EPA 2011) to
Other Global Inventories (MTCO2e)
Source 2000 2010 2020 2030
EPA (2012) 9,896 11,387 13,122 15,434
EMF-22 (2009)a 7,164-10,826 8,538-12,857 7,891-14,758 8,685-17,188
CCSP SAP 2.1 (2007)b 9,438-11,327 9,939-12,687 11,348-15,205 12,268-17,064
EDGAR 4.1 2010c 9,804d NE NE NE
Codes: NE indicates “not estimated.” Notes: a Energy Management Forum 22 (EMF-22) Analysis (EMF-22, 2009). b CCSP Synthesis and Assessment Product 2.1 - Scenarios of Greenhouse Gas Emissions and Atmospheric Concentrations (CCSP, 2007) – Ranges depicted include estimates for the three reference scenarios (IGSM, MERGE, and MINICAM) c Emission Database for Global Atmospheric Research (EDGAR) 4.1 (EC-JRC, 2010). d 97 metric tons of C7F16 not included in total; unknown GWP.
Exhibit 7: Comparison of non-CO2 Emission Estimates in EPA (2012) to Other
Global Inventories (MTCO2e)
0
2,000
4,000
6,000
8,000
10,000
12,000
14,000
16,000
18,000
20,000
2000 2010 2020 2030
MTC
O2
eq. EPA (2012)
EMF-22 Analysis (2009) min
EMF-22 Analysis (2009) max
CCSP SAP 2.1 (2007) min
CCSP SAP 2.1 (2007) max
EDGAR 4.1 (2010)

December 2012 3. References Page 20
3 References
3.1 Introduction and Overview
Census. 2009. U.S. Census International Data Base. Online Database Accessed: October 2009. Available online at: http://www.census.gov/ipc/www/idb/.
IPCC. 1996. Climate Change 1995: The Science of Climate Change. Intergovernmental Panel on Climate Change. Edited by J.T. Houghton, L.G. Meira Filho, B.A. Callender, N. Harris, A. Kattenberg, and K. Maskell. Cambridge, UK: Cambridge University Press.
IPCC. 1997. Revised 1996 IPCC Guidelines for National Greenhouse Gas Inventories. Paris: Intergovernmental Panel on Climate Change, United Nations Environment Programme, Organization for Economic Co-Operation and Development, International Energy Agency.
IPCC. 2000. Good Practice Guidance and Uncertainty Management in National Greenhouse Gas Inventories. Intergovernmental Panel on Climate Change, National Greenhouse Gas Inventories Programme, Montreal, IPCC-XVI/Doc.10 (1.IV.2000). May 2000.
IPCC. 2006. 2006 IPCC Guidelines for National Greenhouse Gas Inventories. The National Greenhouse Gas Inventories Programme, The Intergovernmental Panel on Climate Change, H.S. Eggleston, L. Buendia, K. Miwa, T. Ngara, and K. Tanabe (eds.). Hayama, Kanagawa, Japan.
IPCC. 2007. Climate Change 2007: Working Group I: The Physical Science Basis. Intergovernmental Panel on Climate Change. Solomon, S., D. Qin, M. Manning, Z. Chen, M. Marquis, K.B. Averyt, M. Tignor and H.L. Miller (eds.) Cambridge University Press, Cambridge, United Kingdom and New York, NY, USA.
UNFCCC. 2012. United Nations Framework Convention on Climate Change Flexible GHG Data Queries. Online Database Accessed: Spring 2012. Available online at: <http://unfccc.int/di/FlexibleQueries/Setup.do>.
USDA. 2009. Real GDP (2005 dollars) Historical International Macroeconomic Data Set. United States Department of Agriculture Economic Research Service. Available online at <http://www.ers.usda.gov/data/macroeconomics/#BaselineMacroTables>.
WRI. 2010. Climate Analysis Indicators Tool (CAIT) Version 7.0. World Resources Institute. Washington, DC.
3.2 Summary Results
CCSP. 2007. Synthesis and Assessment Product 2.1: Scenarios of Greenhouse Gas Emissions and Atmospheric Concentrations (Part A) and Review of Integrated Scenario Development and Application (Part B). A Report by the U.S. Climate Change Science Program and the Subcommittee on Global Change Research [Clarke, L., J. Edmonds, J. Jacoby, H. Pitcher, J. Reilly, R. Richels, E. Parson, V. Burkett, K. Fisher-Vanden, D. Keith, L. Mearns, C. Rosenzweig, M. Webster (Authors)]. Department of Energy, Office of Biological & Environmental Research, Washington, DC., USA.
December 2012 3. References Page 21
<http://www.climatescience.gov/Library/sap/sap2-1/finalreport/CCSP-2-1A-Scenario-Information-070707.xls>.
EMF-22. 2009. EMF 22: Climate Change Control Scenarios. Energy Modeling Forum. Stanford University, Stanford, California, USA. <http://emf.stanford.edu/research/emf22/>.
EC-JRC. 2010. European Commission, Joint Research Centre (JRC)/Netherlands Environmental Assessment Agency (PBL). Emission Database for Global Atmospheric Research (EDGAR), release version 4.1. Available online at <http://edgar.jrc.ec.europa.eu>
IPCC. 2001. Climate Change 2001: The Scientific Basis, Intergovernmental Panel on Climate Change. Edited by J.T. Houghton, Y. Ding, D.J. Griggs, M. Noguer, P.J. van der Linden, X. Dai, C.A. Johnson, and K. Maskell. Cambridge, UK: Cambridge University Press. Available online at <http://www.grida.no/climate/ipcc_tar/wg1/519.htm>.
Velders et al. 2007. The importance of the Montreal Protocol in protecting climate. Proceedings of the National Academy of Sciences (PNAS), 104(12), 4814-4819.

December 2012 Page 22
Table 6: Global Non-CO2 GHG Emissions by Sector, by Gas (MtCO2e) 2005 and 2030.
Sector/Source 2005 (MtCO2e) 2030 (MtCO2e)
CH4 N2O HFC PFC SF6 NF3 CH4 N2O HFC PFC SF6 NF3
Energy 2,487.1 307.2 - - - - 3,491.0 465.3 - - - -
Natural Gas & Oil Systems 1,542.7 - - - - - 2,112.9 - - - - -
Coal Mining Activities 521.6 - - - - - 784.3 - - - - -
Stationary & Mobile Combustion 224.3 256.1 - - - - 362.9 402.5 - - - -
Biomass Combustion 198.0 47.6 - - - - 230.4 59.4 - - - -
Other Energy Sources (Fugitives from Natural
Gas & Oil, Fugitives from Solid Fuels) 0.5 3.5 - - - - 0.5 3.4 - - - -
Industry 7.5 203.5 487.3 45.2 59.7 6.0 6.3 223.5 2,190.2 166.9 205.5 45.2
Production of Adipic & Nitric Acid - 126.5 - - - - - 147.2 - - - -
ODS Substitutes - - 307.7 - - - - - 1,902.7 - - -
Production of HCFC-22 - - 179.0 - - - - - 286.4 - - -
Electric Power Systems - - - - 41.2 - - - - - 63.8 -
Aluminum - - - 30.6 - - - - - 37.4 - -
Manufacture of Semiconductors - - 0.7 14.0 5.4 5.5 - - 1.1 12.2 3.3 5.0
Magnesium Manufacturing - - - - 9.8 - - - - - 5.2 -
Flat Panel Display Manufacturing - - - 0.1 3.3 0.5 - - - 5.2 133.2 23.9
Photovoltaic Manufacturing - - - 0.5 - 0.0 - - - 112.1 - 16.3
Other IP (Chemical, Iron and Steel, Metal,
Mineral, Petrochemical, Silicon Carbide,
Solvents) 7.5 77.0 - - - - 6.3 76.3 - - - -
Agriculture 3,035.4 2,763.1 - - - - 3,504.5 3,440.5 - - - -
Agricultural Soils - 1,840.0 - - - - - 2,482.8 - - - -
Enteric Fermentation 1,894.3 - - - - - 2,320.5 - - - - -
Rice Cultivation 500.9 - - - - - 510.4 - - - - -
Manure Management 219.2 179.0 - - - - 252.7 213.6 - - - -
Other Agriculture Sources (Savanna Burning,
Ag Res Burning, Ag Soils CH4) 421.0 744.1 - - - - 421.0 744.1 - - - -
Waste 1,285.9 92.9 - - - - 1,583.7 111.2 - - - -
Landfilling of Solid Waste 794.0 - - - - - 959.4 - - - - -
Wastewater 476.7 - - - - - 608.8 - - - - -
Human Sewage - Domestic Wastewater - 81.7 - - - - - 99.8 - - - -
Other Waste Sources (Misc Waste Handling
Practices, Waste Combustion) 15.2 11.2 - - - - 15.5 11.4 - - - -
Total 6,815.8 3,366.6 487.3 45.2 59.7 6.0 8,585.6 4,240.4 2,190.2 166.9 205.5 45.2
Total Emissions 10,780.7 15,433.8

About this Summary Report This document presents overview information from a longer document with the same title available from U.S. EPA’s webpage. The report provides information on historical and projected estimates of emissions of non-CO2 greenhouse gases from anthropogenic sources. The report includes over 20 individual source categories from the energy, industrial processes, agriculture, and waste sectors. It covers 92 countries, historical information from 1990 to 2005 and business-as-usual projections from 2010 to 2030. This document and the full report are a revision of a draft document published to the EPA website in August 2011.
How to Obtain the Full Report You may electronically download this document, as well as the full report this document summarizes, from the U.S. EPA's webpage at: http://www.epa.gov/climatechange/EPAactivities/economics/nonco2projections.html.
How to Obtain the Data You may electronically download the data compiled for this report in .xls format at: http://www.epa.gov/climatechange/EPAactivities/economics/nonco2projections.html.
For Further Information: If you have questions or would like to provide comments on this report, contact Jameel Alsalam ([email protected]) or Shaun Ragnauth ([email protected]), Climate Change Division, Office of Atmospheric Programs, U.S. Environmental Protection Agency.
Expert Reviewed Document A draft of the full version of this report has been reviewed by external experts from the private sector, academia, non-governmental organizations, and other government agencies.
Related Documents