6XGGHQ 6XUJH LQ )', DQG ,QIUDVWUXFWXUH %RWWOHQHFNV 7KH &DVH LQ 9LHWQDP 7LHQ 4XDQJ 7UDQ $6($1 (FRQRPLF %XOOHWLQ 9ROXPH 1XPEHU $SULO SS $UWLFOH 3XEOLVKHG E\ ,6($6²<XVRI ,VKDN ,QVWLWXWH )RU DGGLWLRQDO LQIRUPDWLRQ DERXW WKLV DUWLFOH Accessed 18 Sep 2016 17:01 GMT KWWSVPXVHMKXHGXDUWLFOH

Welcome message from author
This document is posted to help you gain knowledge. Please leave a comment to let me know what you think about it! Share it to your friends and learn new things together.
Transcript

dd n r n FD nd nfr tr t r B ttl n : Th n V tn
T n n Tr n
N n B ll t n, V l 26, N b r , pr l 200 , pp. 8 6 ( rt l
P bl h d b – f h n t t t
F r dd t n l nf r t n b t th rt l
Accessed 18 Sep 2016 17:01 GMT
http : .jh . d rt l 266

A S E A N E c o n o m i c B u l l e t i n 5 8 Vo l . 2 6 , N o . 1 , A p r i l 2 0 0 9
ASEAN Economic Bulletin Vol. 26, No. 1 (2009), pp. 58–76 ISSN 0217-4472 print / ISSN 1793-2831 electronic
© 2009 ISEAS
DOI: 10.1355/ae26-1e
Sudden Surge in FDI andInfrastructure Bottlenecks
The Case in Vietnam
Tien Quang Tran
Through examining trends and patterns of foreign direct investment (FDI) in Vietnam over thetwenty years of reform (1986–2008), this paper found a big increase in registered FDIrecently. This is not in accordance with the increase in actual capital disbursement because oflow absorptive capacity of the economy in terms of poor infrastructure, restricted andunstable policy, and weak competitive capacity of domestic firms. Moreover, newly massiveflows of FDI brought an explosion to infrastructure development in the form of officebuildings, hotels, industrial zones, resident parks and ports. This could help to improve thesituation of infrastructure because it has not kept pace with the rapid economic growth overthe past decade and are considered as major constraints in attracting more FDI.
Keywords: Vietnam, foreign direct investment (FDI), mergers and acquisitions (M&A), entry mode,infrastructure.
I. Introduction
During the reform period (initiated since 1986),Vietnam has already achieved notable success inattracting FDI, and it has become an importantcomponent in gross national investment. By 2008,foreign-invested sector accounted for about 25 percent of total gross domestic investment in theVietnamese economy. Foreign invested enterprises(FIEs) have begun to make a significantcontribution to employment generation and exportexpansion. The impressive economic outcome ofFDI participation in the economy served tostrengthen government commitment to further
bring in reforms to improve Vietnam’sattractiveness to foreign investors, particularly inexport-oriented manufacturing.
The main objective of this paper is toinvestigate the roots of sudden increase in FDIinflow and patterns of FDI in Vietnam over thepast two decades of reform with emphasis oninvestment area/sectoral composition. The causesand possible impacts of the increase in FDI oninfrastructure development will also be carefullyexamined. This paper is based on data compiledfrom administrative records of Vietnam’s Ministryof Planning and Investment (MPI) and other
05 Tien Quang Tran 4/28/09, 9:37 AM58
A S E A N E c o n o m i c B u l l e t i n 5 9 Vo l . 2 6 , N o . 1 , A p r i l 2 0 0 9
important databases on FDI (UNCTAD, CEIC andASEAN FDI databases).
The structure of this paper is as follows. SectionII reviews the impact of policy change on FDIinflows in Vietnam. This is followed by adiscussion on the changes in the form ofinvestment and patterns of source country.Analysis of FDI by investment area will bepresented in section V. In addition, this paperassesses the geographical distribution of FDIin Vietnam with the premise of conventionalclassification of seven regions. Short conclusionson trends and patterns of FDI in Vietnam will bepresented in the last section.
II. Policy Change and Sudden Surge inFDI Inflows
A Law on Foreign Investment was approved bythe National Assembly just one year after thereform was launched in 1986. This law wasamended five times in 1990, 1992, 1996, 2000and 2003. The appearance and amendment of thislaw have contributed to the Reform (Doi Moi)policy of Vietnam. It was highly appreciated bythe international community as an open,attractive law and was in line with internationalnorms. Besides, over fifty bilateral andmultilateral agreements related to FDI were alsoapproved in order to encourage and protectforeign investors given the existing imperfectmarket mechanism in Vietnam.
The most important change in FDI policy wasthe approval by the National Assembly of twonew laws — Investment Law and Law onEnterprises in December 2005. This reform aimedto create a consistent legal system as well as to setup a common playground for three main players:FIEs, state-owned enterprises (SOEs) anddomestic private enterprises (DPEs). The newInvestment Law has some main benchmarks. Thefirst is the new law replaces two separate laws —the FDI Law and the Law on Domestic InvestmentPromotion. Therefore, all kinds of investment aretreated in the same way. The second significantfeature is reduction of paperwork involved in FDIapproval/monitoring and the response time for
issuing an investment certificate. The third oneinvolves strong decentralization on approving andlicensing FDI projects to the provincial peoplecommittee and the management committee ofindustrial zones/export processing zones (IZs/EPZs). Lastly, all regulations related to FIEestablishment and operation were separated fromthe Investment Law. Alternatively, these firms willbe governed by the new Law on Enterprises asother firm types.
The data on FDI inflows have beeninconsistently published among different censusorganizations. There is a significant differencebetween the data published by Vietnamesegovernment agencies and the data frominternational organizations. For example, Table 1compares FDI inflows from three differentsources: MPI, UNCTAD and the General StatisticsOffice of Vietnam (GSO). MPI is a legaladministrative body for managing FDI andOfficial Development Aid (ODA). The differenceamong data sources stems from the method ofmeasuring FDI. MPI defines FDI as totalinvestment in FIEs and, therefore, includes sharesof capital from both domestic and foreign partners.A change in the FIE capital stock as a result ofearnings invested is also regarded as a change inFDI. Meanwhile, most international organizations,like UNCTAD define FDI by two types ofinvestment: Greenfield investment measured bythe actual capital inflows from multinationalenterprises (MNEs) and cross-border merger andacquisition (M&A) activity. This mostly explainswhy MPI figures on realized investment1 are muchbigger than those in the UNCTAD source. Anotherreason for the difference originates from thecapability of the statistical agency in identifyingFDI. Until 2003, FDI data in Vietnam did notcover either reinvested earnings or M&A. Table 1also demonstrates some discrepancies in data fromtwo government agencies (MPI and GSO),especially for the initial stage of capital flows.There are two possible reasons for this: differencein the time of reporting data, and inconsistency indata compilation between government bodies.Investment of Vietnamese people who are citizensof overseas countries (Viet kieu) is generally
05 Tien Quang Tran 4/28/09, 9:37 AM59

A S E A N E c o n o m i c B u l l e t i n 6 0 Vo l . 2 6 , N o . 1 , A p r i l 2 0 0 9
TABLE 1Registered and Realized FDI Flows to Vietnam by Sources of Data
(In US$ million)
FDI flows, MPI source FDI flows, GSO source
Number of Registered Realized No. of Registered Realizedlicensed capital capital licensed capital Capitalprojects projects
1988 38 322 — 8 38 322 —1989 68 526 — 4 68 526 —1990 108 735 — 180 108 735 —1991 151 1,284 428 375 151 1,292 3291992 197 2,077 575 474 197 2,209 5751993 274 2,829 1,118 926 274 3,347 1,0181994 367 4,262 2,241 1,945 367 4,535 2,0411995 408 7,925 2,792 1,780 408 7,699 2,5561996 365 9,429 2,923 1,803 387 9,735 2,7141997 348 5,822 3,218 2,587 358 6,055 3,1151998 275 4,781 2,375 1,700 285 4,877 2,3671999 311 2,197 2,537 1,484 311 2,264 2,3352000 379 2,494 2,420 1,289 389 2,696 2,4142001 550 3,236 2,430 1,300 550 3,230 2,4512002 802 2,805 2,591 1,200 802 2,963 2,5912003 772 3,128 2,650 1,450 748 3,146 2,6502004 723 4,222 2,860 1,610 723 4,222 2,8522005 922 6,339 3,300 2,020 — — —
Total 7,058 64,413 34,458 22,135 6,164 59,853 30,008
NOTE: — data not available.SOURCE: GSO website, MPI database (various source) and UNCTAD database on website.
Year
Actual FDIflows,
UNCTADsource
excluded from the official record on FDI becausemost of this investment is undertaken throughtheir relatives who are Vietnamese residents.
Evidence from the ASEAN Secretariat andUNCTAD shows FDI inflows began before 1986— the first year of reform initiated by the VICommunist Party Congress. However, mostforeign investment in the planned economy phasewas composed of official aid from governments ofthe former Soviet-bloc countries. Therefore, theentry of FDI was recognized as soon as a new lawon FDI was sanctioned and became effective in1987. Twenty years of attracting FDI can be
divided into several episodes. In the first fouryears (1988–91), FDI inflow was small andaffected by the internal instability of the economy(for instance, hyper-inflation and food shortages),and the collapse of the Soviet federation as well asthe socialist countries bloc. At this stage, manyrestrictions and consequences of the plannedeconomy prevented FDI inflows. A significantincrease in FDI had just occurred when many FDI-related policies changed in accordance withstabilizing macro economic problems by the endof 1991. The next period (1992–97) witnessedcontinuous massive FDI inflows reaching a peak
05 Tien Quang Tran 4/28/09, 9:37 AM60

A S E A N E c o n o m i c B u l l e t i n 6 1 Vo l . 2 6 , N o . 1 , A p r i l 2 0 0 9
in 1996 with registered and realized capital atUS$8.2 billion and US$2.9 billion, respectively(FDI data on the MPI website in 2006). FDIinflow then slowed as a result of the Asianfinancial crisis until 2000. A recovery period ofFDI inflow began slowly from 2001 due to thecautious behaviour of foreign investors followingthe crisis. For instance, although reform had beenextended further, registered capital for 2005 wasconsiderably lower than in 1996. Fortunately,inward FDI seems more reliable as the ratiobetween realized capital and registered capital in2005 was higher than 1996.
The fundamental reform of FDI-related policyin late 2005 has caused a sudden increase of FDIin recent years. Table 2 shows registered FDI inthree years (2006–2008) was about five times incomparison with the previous period (2001–2005)and equivalent to 150 per cent compared with thetotal FDI of all years from 1988 to 2005. The dataalso demonstrate a large amount of realized capitalin the past three years (US$23.6 billion). However,there was a big gap between the FDI commitmentand actual disbursements in the last period (2006–2008) compared with the previous ones. Thedecreasing ratio of realized over registered capitalin the last period is explained by the followingreasons. Some provinces did not issue investmentlicences and business certificates accuratelybecause they wanted to encourage FDI as much aspossible. Consequently, there were some projects
aiming to invest in the same field while the localdemand is inadequate. Moreover, the nationalindustry plan is not in line with the local plan, sothe hand-over of land to foreign investors wasdifficult. The weakness in infrastructure(electricity, water, roads, and ports) is also a majorobstacle to the disbursement of FDI. Besides, theshortage of trained workers, especially technicalworkers and engineers, causes the flight of foreigninvestors even though the wage rate in Vietnam isrelatively competitive. Lastly, there were some bigprojects in infrastructure development (highways,ports, bridges, railways, hydro power) but theyhave not been implemented because of negativeeffects from the 2008 global financial crisis.
In comparison with selected host countries inthe same region, this study uses commoncomparative indicators as employed in the WorldInvestment Report produced by UNCTAD. Thetrends of FDI flows in Vietnam, Malaysia andThailand are mostly the same, i.e., flows increaseduntil 1997/1998 and decreased afterwards (Figure1). However, the flow of this type of capital inVietnam has been more stable than in the othertwo countries. Flows to China and Singaporeseemed not to have been affected by the financialcrisis and reached an extremely high levelcompared with other countries. For the wholeperiod (1988–2005), FDI flows in Vietnam werefar below the levels in other ASEAN countries.However, over the past four years, the values of
TABLE 2FDI Inflows by Sub-periods
(In US$ million)
Periods Number of Registered Realized Realized/registeredlicensed projects capital capital capital (%)
1988–1990 214 1,583 0 —1991–1995 1,397 18,377 7,154 38.931996–2000 1,678 24,723 13,473 54.502001–2005 3,769 19,730 13,831 70.102006–2008 3,702 97,362 23,636 24.28
SOURCE: Compilation from MPI database on website <www.mpi.gov.vn> (various sources).
05 Tien Quang Tran 4/28/09, 9:37 AM61

A S E A N E c o n o m i c B u l l e t i n 6 2 Vo l . 2 6 , N o . 1 , A p r i l 2 0 0 9
these capital flows in Vietnam and Thailand havebeen mostly similar.2 The gap between Vietnamand other countries may be explained by thedifference in improving the investment climate.Despite these other countries previously havingsome reservations about the benefits of FDI, theyall rapidly developed favourable environments forFDI from the early 1980s. However, Vietnamremained hesitant about reforming the investmentclimate. The long-lasting effect of the Asian crisisin Vietnam compared with the other nations is atypical example of factors causing the sluggishchange in policy to overcome negative externality.After the crisis, many ASEAN countriesintroduced additional incentives and moreaggressive investment promotion programs (JICA2003), whereas the fundamental policy changes inVietnam have occurred only recently. Vietnam hasso far had two main forms of foreign investment— joint ventures and fully-owned FIEs. Apartfrom these entry modes, other nations havereceived more capital from encouraging M&A andany other forms of investment, so that the totalcapital going to these countries is more volatilethan that going to Vietnam.
Country comparison by other indicators, such asshares of FDI flows in gross fixed capitalformation (GFCF) and the FDI flow/GDP ratio,shows different trends (Figures 2 and 3). The FDIshare in GFCF in Vietnam increased quickly in thefirst five years, reaching its highest level in 1994(about 50 per cent). However, after that, the shareof FDI in GFCF decreased because of the slowdown in new FDI and the expansion of public anddomestic private investment. By 2005, the FDIshare in fixed capital formation was about 15 percent. Compared with the other four countries(Singapore, China, Malaysia and Thailand), therole of foreign investment in Vietnam wasrelatively higher, standing second behindSingapore. The third indicator FDI/GDP ratio,has the same trend, i.e., reaching a peak in 1994(11.9 per cent) and then going down to nearly4 per cent of GDP in 2003. However, this ratio inVietnam is still higher than in China and Malaysiaeven though the value of capital flow is muchlower.
The ownership shares in gross domesticinvestment (Table 3) give further indication of thecontributions from the three ownership types
FIGURE 1FDI Inflows in Vietnam and Selected Host Countries
(In US$ billion)
SOURCE: UNCTAD FDI database online, 2006.
05 Tien Quang Tran 4/28/09, 9:37 AM62

A S E A N E c o n o m i c B u l l e t i n 6 3 Vo l . 2 6 , N o . 1 , A p r i l 2 0 0 9
FIGURE 2FDI Inflows as Percentage of Gross Fixed Capital Formation (GFCF)
SOURCE: UNCTAD FDI database online, 2006.
FIGURE 3Inward FDI Flows as Percentage of Gross Domestic Product (GDP)
SOURCE: UNCTAD FDI database online, 2006.
05 Tien Quang Tran 4/28/09, 9:37 AM63
A S E A N E c o n o m i c B u l l e t i n 6 4 Vo l . 2 6 , N o . 1 , A p r i l 2 0 0 9
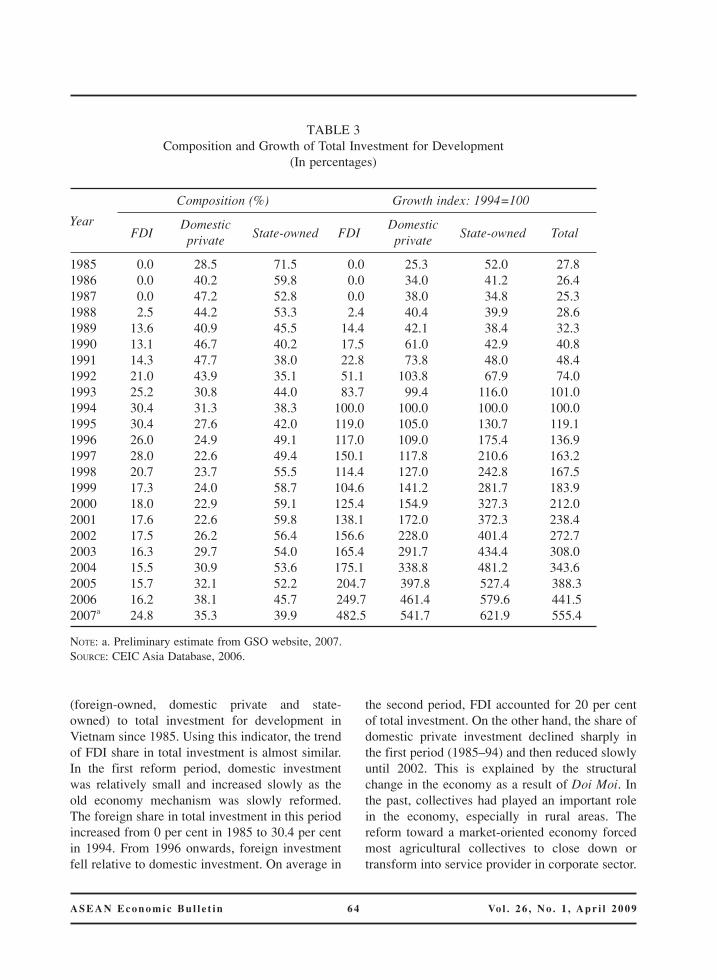
(foreign-owned, domestic private and state-owned) to total investment for development inVietnam since 1985. Using this indicator, the trendof FDI share in total investment is almost similar.In the first reform period, domestic investmentwas relatively small and increased slowly as theold economy mechanism was slowly reformed.The foreign share in total investment in this periodincreased from 0 per cent in 1985 to 30.4 per centin 1994. From 1996 onwards, foreign investmentfell relative to domestic investment. On average in
the second period, FDI accounted for 20 per centof total investment. On the other hand, the share ofdomestic private investment declined sharply inthe first period (1985–94) and then reduced slowlyuntil 2002. This is explained by the structuralchange in the economy as a result of Doi Moi. Inthe past, collectives had played an important rolein the economy, especially in rural areas. Thereform toward a market-oriented economy forcedmost agricultural collectives to close down ortransform into service provider in corporate sector.
TABLE 3Composition and Growth of Total Investment for Development
(In percentages)
Year
Composition (%) Growth index: 1994=100
FDIDomestic
State-owned FDIDomestic
State-owned Totalprivate private
1985 0.0 28.5 71.5 0.0 25.3 52.0 27.81986 0.0 40.2 59.8 0.0 34.0 41.2 26.41987 0.0 47.2 52.8 0.0 38.0 34.8 25.31988 2.5 44.2 53.3 2.4 40.4 39.9 28.61989 13.6 40.9 45.5 14.4 42.1 38.4 32.31990 13.1 46.7 40.2 17.5 61.0 42.9 40.81991 14.3 47.7 38.0 22.8 73.8 48.0 48.41992 21.0 43.9 35.1 51.1 103.8 67.9 74.01993 25.2 30.8 44.0 83.7 99.4 116.0 101.01994 30.4 31.3 38.3 100.0 100.0 100.0 100.01995 30.4 27.6 42.0 119.0 105.0 130.7 119.11996 26.0 24.9 49.1 117.0 109.0 175.4 136.91997 28.0 22.6 49.4 150.1 117.8 210.6 163.21998 20.7 23.7 55.5 114.4 127.0 242.8 167.51999 17.3 24.0 58.7 104.6 141.2 281.7 183.92000 18.0 22.9 59.1 125.4 154.9 327.3 212.02001 17.6 22.6 59.8 138.1 172.0 372.3 238.42002 17.5 26.2 56.4 156.6 228.0 401.4 272.72003 16.3 29.7 54.0 165.4 291.7 434.4 308.02004 15.5 30.9 53.6 175.1 338.8 481.2 343.62005 15.7 32.1 52.2 204.7 397.8 527.4 388.32006 16.2 38.1 45.7 249.7 461.4 579.6 441.52007a 24.8 35.3 39.9 482.5 541.7 621.9 555.4
NOTE: a. Preliminary estimate from GSO website, 2007.SOURCE: CEIC Asia Database, 2006.
05 Tien Quang Tran 4/28/09, 9:37 AM64

A S E A N E c o n o m i c B u l l e t i n 6 5 Vo l . 2 6 , N o . 1 , A p r i l 2 0 0 9
With the recent policy improvement, especiallythe new Law on Enterprises and the InvestmentLaw, both FDI and domestic private sectors havedeveloped quickly, contributing to 24.8 per centand 35.3 per cent of total investment fordevelopment, respectively.
Although the proportion of public investmentdecreased significantly from about 60 per centin 2001 to 40 per cent in 2007, this sector stilldominates with a stable share in total investmentof about 50 per cent during the period 1995–2008.This type of investment also achieved the highestgrowth index3 by 2007 (621.9), followed by thedomestic private (541.7) and the lowest growth isforeign-owned sector (482.5). Roughly speaking, asignificant proportion of the public investmentwas for SOEs in order to guarantee the leadingrole of SOEs in the economy. This preferencepolicy could become a major constraint forcreating an adequate investment climate anddeveloping the private sector.
III. Entry Mode of FDI
The stock value of FDI decomposed by form ofinvestment in Table 4 shows 100 per cent foreign-owned enterprises dominating with 77.6 per centof total projects and 61.6 per cent of totalregistered capital. Joint ventures stand second in
terms of amount of either registered capital orrealized capital. The figures also imply fully-owned FIEs are smaller in size than average interms of capital, although they use more workersthan any other firm types. In joint ventures,foreign investors may also provide tacittechnology, management skills and know-how.Vietnamese counterparts may contribute legalknowledge, trademarks, and infrastructure interms of mostly land and space. On average, jointventures are much larger than fully-owned FIEs incapital stock because most of the former havebeen established through cooperation betweenforeign investors and large SOEs. Other entrymodes, like BCC (Business Cooperation Contract)and BOT (Build-Operate-Transfer), are con-centrated in some highly protected industries(mining and petroleum industries). Recently, anew form of investment — shareholding com-panies4 has been set up and increased quickly as aconsequence of the policy change that allowsforeign investors to buy equity shares fromdomestic enterprises or to work in financialservices.
Looking at the structure of registered capitalstock at different points of time in Figure 4, aremarkable adjustment amongst investment formscan be seen. In the early stages (1988–90), therewere only three forms of investment and most
TABLE 4FDI by Form of Investment as of December 2007
(Stock value, US$ million)
No. of Registered Realized % of% of Realized/
Form of investmentProjects capital capital projects
Registered Registeredcapital capital
Fully-owned FIEs 6,743 52,437 11,324 77.6 61.6 21.6Joint-ventures 1,640 24,575 11,145 18.9 28.9 45.4BCC 226 4,579 5,661 2.6 5.4 123.6BOT, BT, BTO 8 1,711 727 0.1 2.0 42.5Shareholding company 67 1,756 377 0.8 2.1 21.5
Total 8,684 85,057 29,234 100.0 100.0 34.4
SOURCE: Database of MPI on website, 2008.
05 Tien Quang Tran 4/28/09, 9:37 AM65

A S E A N E c o n o m i c B u l l e t i n 6 6 Vo l . 2 6 , N o . 1 , A p r i l 2 0 0 9
foreign investors preferred to cooperate with SOEs(joint ventures) to access government preferentialtreatment on credit, land ownership and otheradministrative procedures. The engagement offoreign investment in joint ventures may alsoreflect the high risk and uncertainty in theeconomic environment at that time. Moreover,foreign investors had to rely on cooperation withSOEs because development of the domesticprivate sector was not equally encouraged at thattime. In the second period (1991–95), those threeforms of investment became more equal with
a significant increase in fully-owned FIEs.Nevertheless, joint ventures continued to increasebecause foreign investors were only allowed toestablish joint ventures in many protectedindustries. Joint ventures were still a driving forcewith more than two-thirds of total registeredcapital. Since 2001, evidence reveals a decrease inthe share of joint ventures in total registeredcapital as well as the share in a number ofprojects. The last episode (2001–2005) observedtwo fundamental changes. One is that the forms ofinvestment were more diversified with the
FIGURE 4Change in Form of Investment over Time
(Registered FDI, US$ million)
SOURCE: MPI database (various sources).
05 Tien Quang Tran 4/28/09, 9:37 AM66

A S E A N E c o n o m i c B u l l e t i n 6 7 Vo l . 2 6 , N o . 1 , A p r i l 2 0 0 9
participation of two more entry modes(shareholding companies and capital holdingcompanies). Another was that fully-owned FIEsoverwhelming joint ventures and other entrymodes. There were two main reasons for this.Policy reform had significantly improved theinvestment climate and foreign investors werenow allowed to set up any form of investment inmost industries and services. They seemed tofollow the trend in preferring to form fully-ownedenterprises, probably in order to avoid benefitconflict and make business decisions easily.Second, there was a huge increase in the numberof domestic firms although most were at lowcompetitive capacity. Therefore, cooperating withdomestic firms in terms of forming a joint ventureis not the best solution. MNEs with theircomparative advantages easily compete in takingmarket power.
Entry mode diversification has become popularin most FDI host countries as there has been arapid increase in FDI in the form of M&Acompared to Greenfield investment (UNCTAD
2006). In the case of Vietnam, with a lessdeveloped financial market and high protection,especially for SOEs, most ownershiptransformation has occurred with direct investorspreferring to set up their own corporations insteadof joining with domestic partners. M&A activity interms of forming shareholding companies was stillpreliminary over the past two decades, butrecently, there were increasing flows of foreigncapital into the stock market. See Table 4.
IV. Source-country Composition
As at December 2007, there were 9,589 FDIprojects in operation in Vietnam with totalregistered and realized capital of over US$97billion and US$46 billion, respectively. In terms ofthe source-country composition, FDI came fromvaried countries. In 2007, eighty-two countriesand territories invested in Vietnam compared tosixty-nine in 2004. Based on the stock value ofeffective projects,5 Table 5 presents informationfor the top ten source-FDI countries which is
TABLE 5Top Ten Source Countries of FDI
(Stock Value as of December 2007)
Number Registered RealizedRealized/
% of% of totalCountries/territories of Capital capital
registeredtotal
projectsprojects (US$ million) (US$ million) registered
Korea 1,857 14,398 2,738 19.0 8.9 17.3Singapore 549 11,059 3,858 34.9 6.8 5.1Taiwan 1,801 10,763 3,079 28.6 6.7 16.7Japan 934 9,180 4,987 54.3 5.7 8.7British Virgin Islands 342 7,795 1,376 17.6 4.8 3.2Hong Kong 457 5,933 2,161 36.4 3.7 4.2Malaysia 245 2,823 1,083 38.4 1.7 2.3The U.S 376 2,789 746 26.8 1.7 3.5Netherland 86 2,599 2,031 78.2 1.6 0.8France 196 2,376 1,085 45.7 1.5 1.8
Subtotal of ten leading countries 6,843 69,715 23,145 33.2 71.3 71.4
Total country FDI 9,589 97,764 46,594 47.7 100.0 100.0
SOURCE: FDI database on website of MPI.
05 Tien Quang Tran 4/28/09, 9:37 AM67

A S E A N E c o n o m i c B u l l e t i n 6 8 Vo l . 2 6 , N o . 1 , A p r i l 2 0 0 9
comprised of six Asian, three European nationsand the United States. The data also show highconcentration in country source of investment asten leading countries contributed to over 70 percent of total registered capital as well as thenumber of projects. Individually, Korea hassurpassed Taiwan and Singapore to become theleading investment country to Vietnam. However,Japan was the largest contributor in terms ofrealized capital, followed by Singapore. In termsof investment performance measured by the ratiobetween realized and registered capital, theNetherlands stood first followed by Japan. Exceptfor these two countries, all other leading countrieshave lower ratio of realized over registered capitalcompared to the average ratio (47.7 per cent). Forinstance, although Korea was the largest investorin Vietnam, its performance level was the lowestamong the ten leading investors.
Table 6 shows changes in source countrycomposition, disaggregated by conventionalclassification of countries and selected individuals.In general, FDI in Vietnam looked like it wasfollowing the common trend that “developed-country MNEs are less likely to invest in poorereconomies with small markets, whereasdeveloping-country MNEs tend to invest inneighbouring developing countries” (UNCTAD2006, p. 185). For instance, FDI from developing
Asian countries dominated with a share of 56.4per cent in total investment, followed by theOECD group (32.2 per cent) and tax-haven BritishVirgin Islands (7.6 per cent). FDI from transitioneconomies (excluding China) was very small,accounting for only about 1 per cent. To be morespecific, registered FDI declined significantlyfrom US$20.4 billion to US$14.7 billion betweenthe two periods, 1996–2000 and 2001–2005.
The share of OECD capital increased from 26.4per cent in 1996–2000 to 35 per cent in 2001–2005. This may be a positive impact as theliterature argues for more advanced technologytransferred from developed-world FDI than fromthe developing-world one. The relative increase ofOECD capital in the second period wasconstituted by new investment from the UnitedStates, the Netherlands and Canada, and becauseof the sharp investment reduction from developingAsia in the second period (2001–2005). Withinthis group, investment from Taiwan and SouthKorea has substantially increased. In contrast, thedrop of Singapore’s FDI in the period caused afundamental change in source-country com-position and put Singapore behind Taiwan in termsof total investment in Vietnam. Mainland Chinaalso significantly increased investment in Vietnambetween two sub-periods when its share rose from0.5 to 3.3 per cent. The combination of Hong
TABLE 6Registered FDI by Source Country (US$ million)
Country group
1996–2000 2001–2005 1988–2005
Total Total Totalinvestment
%investment
%investment
%
OECD Countries 5,391.4 26.4 5,155.6 35.0 16,443.8 32.2Transition/Centrally planned economies 1,426.4 7.0 96.1 0.7 571.2 1.1Developing Asia 11,606.6 56.8 7,572.5 51.4 28,755.1 56.4Tax-haven Islands 1,118.1 5.5 1,066.2 7.2 3,895.9 7.6Other countries 887.2 4.3 855.8 5.8 1,352.0 2.7
Total 20,429.7 100.0 14,746.2 100.0 51,017.9 100.0
SOURCE: CEIC Asian database (for sub-periods) and MPI website for the whole period 1988–2005.The data of MPI covers only effective projects.
05 Tien Quang Tran 4/28/09, 9:37 AM68

A S E A N E c o n o m i c B u l l e t i n 6 9 Vo l . 2 6 , N o . 1 , A p r i l 2 0 0 9
Kong and mainland China makes this countrygrouping one of the five largest investors inVietnam.
Noteworthy is the FDI from two leadingeconomies: Japan and the United States. Somestudies argue that FDI from Japan and the UnitedStates has been invested indirectly through othersmall foreign companies in developing countries(MPI 2005). A study by MPI in 2005 compiledU.S. FDI and defines all capital invested by U.S.-based companies and their overseas subsidiariesas an indicator, “U.S.-related” FDI. The FDIundertaken by U.S.-based companies is called“U.S.-reported” FDI. The share of the capitalinvested through U.S. overseas subsidiaries intotal U.S.-related FDI was high, from 50.0 to 80.7per cent. In terms of capital stock, investmentfrom U.S. overseas subsidiaries accounted for over50 per cent of registered and 72.3 per cent of
realized capital. Using U.S.-reported FDI as anindicator for country-source comparison places theUnited States among the top ten countries whichhave invested in Vietnam. Figure 5 gives moreevidence on the resident country of FDI from U.S.overseas subsidiaries. Over US$800 million ofU.S. capital was invested through subsidiaries inSingapore, followed by Mauritius, Bermuda, theNetherlands and Hong Kong. This study alsopointed out that most of this intermediateinvestment was for heavy industry, foodstuff, oiland gas and was concentrated in the south ofVietnam.
V. FDI by Investment Area
To examine the effect of the new laws (InvestmentLaw and Law on Enterprises) on FDI inflows,Table 7 shows data on accumulative FDI in the
10.47
1.02
10.27
10.48
9.70
5.40
0.95
0.73
5.44
4.53
6.04
1.55
5.41
3.72
1.32
6.41
3.72
0.47
6.53
2.32
3.47
0.02
15: Food product and beverages
16: Manufacture and tobaco products
17: Manufacture of textiles
18: Manufacture of w earing apparel
19: Manufacture of leather products
20: Manufacture of w ood and w ood products
21: Paper and paper products
22: Publishing and printing
24: Chemicals and chemical products
25: Rubber andplastic product
26: Manufacture of other non-metallic mineral products
27: Manufacture of basic metals
28: Fabricated metal products
29: Machinery and equipment n.e.c
30: Office, accounting and computing machineries
31: Electrical machinery and apparatus n.e.c
32: Radio, television and communication equipment
33: Medical and optical instruments, w atches and clocks
34: Motor vehicles, trailers and semi-trailers
35: Manufacture of other transport
36: Manufacture of furniture, manufacturing n.e.c
37: Recycling
VS
IC s
ecto
rs
% of total FDI for manufacturing
FIGURE 5Compositions of FDI Flows to Manufacturing Industry in 2000–2002
(Approval and Total Project Cost Basis)
SOURCE: ASEAN Secretariat, ASEAN FDI database, 2003.
05 Tien Quang Tran 4/28/09, 9:37 AM69

A S E A N E c o n o m i c B u l l e t i n 7 0 Vo l . 2 6 , N o . 1 , A p r i l 2 0 0 9
TA
BL
E 7
Sect
oral
Com
posi
tions
of
FDI
Stoc
k in
198
8–20
08(F
or E
ffec
tive
Proj
ects
Onl
y)
Sect
or
Reg
iste
red
capi
tal
Reg
iste
red
capi
tal
Rea
lize
d ca
pita
lin
198
8–20
05in
200
6–20
08in
198
8–20
07
Valu
e (U
S$C
ompo
siti
onVa
lue
(US$
Com
posi
tion
Valu
e (U
S$C
ompo
siti
onm
illi
on)
(%)
mil
lion
)(%
)m
illi
on)
(%)
Pri
mar
y pr
oduc
tion
886
5,35
710
.513
,444
13.6
7,00
123
.9C
rude
oil
481,
891
3.7
12,5
8712
.75,
148
17.6
Agr
icul
ture
and
for
estr
y83
83,
466
6.8
857
0.9
1,85
36.
3M
anuf
actu
ring
5,83
025
,447
49.9
42,0
6742
.612
,916
44.2
Lig
ht i
ndus
try
2,74
08,
471
16.6
7,20
97.
33,
639
12.4
Hea
vy i
ndus
try
2,60
213
,528
26.5
33,6
3734
.17,
050
24.1
Food
stuf
f35
03,
139
6.2
1,06
01.
12,
058
7.0
Seaf
ood
138
309
0.6
161
0.2
169
0.6
Con
stru
ctio
n80
211
,526
22.6
24,1
1924
.44,
729
16.2
New
res
iden
t Pa
rk56
34,
011
7.9
2,26
72.
32,
150
7.4
New
citi
es14
2,55
25.
05,
673
5.7
111
0.4
Off
ice-
build
ing
189
3,93
77.
715
,425
15.6
1,89
26.
5E
PZ&
IZ, i
nfra
stru
ctur
eco
nstr
uctio
n36
1,02
62.
075
50.
857
62.
0Se
rvic
e84
78,
688
17.0
19,1
2719
.44,
588
15.7
Tra
nspo
rtat
ion
& t
ele-
com
mun
icat
ion
235
2,92
45.
73,
331
3.4
722
2.5
Hot
el, T
ouri
sm25
02,
864
5.6
12,5
4812
.72,
401
8.2
Fina
nce-
Ban
king
6878
81.
527
00.
371
52.
4C
ultu
ral-
Hea
lth-E
duca
tion
294
908
1.8
851
0.9
367
1.3
Oth
er s
ervi
ces
1,43
81,
203
2.4
2,13
02.
238
31.
3
Tota
l9,
803
51,0
1810
0.0
98,7
5710
0.0
29,2
3410
0.0
SO
UR
CE:
FDI
data
base
on
web
site
of
MPI
, 200
6.
Num
ber
of
Pro
ject
s
(200
8)
05 Tien Quang Tran 4/28/09, 9:37 AM70

A S E A N E c o n o m i c B u l l e t i n 7 1 Vo l . 2 6 , N o . 1 , A p r i l 2 0 0 9
period 1988–2005 and 2006–2008, disaggregatedby the main economic sectors. As of December2005, half of the registered capital was allocatedto the manufacturing industry. If we defineinfrastructure in a broad terminology ascompilation of investment in construction (newresident park, new suburb, office building, andEPZ/IZ building) and investment in transportation,communication and hotel building, about 34 percent of total registered FDI of the period 1988–2005 were invested in infrastructure development.In the past three years (2006–2008) the com-position of infrastructure investment accounted forover 40 per cent. The big increase in FDI forinfrastructure occurred in the 2007 and 2008 asthis field lured five out of ten biggest FDIprojects: New City project in Phu Yen province(US$4.3 billion), Ho Tram project in Ba Ria VungTau (US$4.2 billion), Gtel Mobile (US$1.8billion), Starbay resort (US$1.6 billion) and GoodChoice resort (US$1.3 billion). Before 2005, FDIwas distributed equally among specific aspects ofinfrastructure development. Recently, most ofinfrastructure FDI was for building new offices(15.6 per cent) and hotel/resorts (12.7 per cent). Interms of FDI disbursement, in the whole period1988–2007 the investment for infrastructuredevelopment was smaller than the commitment,accounting for about 25 per cent of the totalrealized FDI. Manufacturing industry received thebiggest proportion of realized FDI in the sameperiod (44.2 per cent). The primary sector had thebest performance as the composition of realizedFDI was higher than the composition of registeredFDI. This is partly explained by the governmentpolicy to take advantage of the booming oil pricein the period 2006–2007.
Next, the ASEAN database is used to analysethe FDI distribution within manufacturingindustries. Figure 5 presents the FDI compositionof every two-digit VSIC industry using totalregistered capital for the three years 2000–2002. Itshows that FDI appears in every industry and thelargest shares of this capital are in labour-intensiveand export-oriented industries, such as themanufacture of leather, wearing apparel, textilesand food processing. In addition, electronics and
automobile industries have also attracted asignificant fraction of FDI to meet an increasingdomestic demand for cars and high technologyproducts. Although the data are only available fora short period, it can be concluded that FDI inVietnam mostly aims to take advantage of thelower wage costs, agricultural products and theplentiful skilled and unskilled labour supply. Thisinvestment has caused a significant movement ofallocation from import substitution to export-oriented industries. Based on the same source ofdata, Figure 6 shows that on average for 2000–2003 about 60 per cent of FDI is concentrated inexport-oriented sectors.
VI. Regional Allocation of FDI
Table 8 presents the accumulative FDI (1988–2005) for six regions and ten leading provinces.Despite the Vietnamese government’s effort toencourage regional diversity of FDI location, theevidence indicates a notable imbalance in FDIdistribution among provinces and regions. As ofDecember 2005, about two-thirds of FDI projectsassociated with over 60 per cent of total registeredFDI were invested in the southeast area ofVietnam. The Red River delta was second withnearly 30 per cent of total registered FDI; thesetwo regions accounted for about 90 per cent oftotal FDI. Moreover, all ten leading provinceswere located in these two regions that received84.3 per cent of total foreign investment. Incontrast, fifty-four other provinces and citiesreceived only 15 per cent of total FDI. Thisimplies the concentration level of FDI still verymuch depends on conventional factors likegeographical conditions (transportation costs),population density (market size), labour supplyand the competition level. These areas are alsomore welcoming than other regions in terms of theinvestment climate where infrastructure develop-ment and policy openness play a decisive role.
Looking at the top ten provinces, Ho Chi MinhCity was the largest recipient with 31 per cent ofFDI projects and 24 per cent of registered capital,followed by Hanoi and Dong Nai. Dong Nai andBinh Duong have emerged as the most attractive
05 Tien Quang Tran 4/28/09, 9:37 AM71

A S E A N E c o n o m i c B u l l e t i n 7 2 Vo l . 2 6 , N o . 1 , A p r i l 2 0 0 9
61.2 64.2 59.3 53.8
38.8 35.8 40.7 46.2
0%
20%
40%
60%
80%
100%
2000 2001 2002 2003
Export oriented Domestic market oriented
FIGURE 6Compositions of FDI Flows to Manufacturing Industry in 2000–2003
(Approval and Total Project Cost Basis)
NOTES: Data for 2003 include FDI in the first six months only.Export-oriented sectors including VSIC15, 17-20, 30-32 and 36 selected by the actual export/output ratio.Y-axis: Total FDI invested in manufacturing industries in the relative term (100 per cent).SOURCE: ASEAN Secretariat, ASEAN FDI database, 2003.
places for FDI. Although there is a clear gap in theabsolute value of FDI, the gap measured by therealized/registered FDI ratio is not so large acrossleading provinces. FDI in the oil and gas industryis separated from provincial FDI to avoid possibledistortions.
The realized FDI flows divided into fourperiods in Table 9 may help explain more aboutthe geographical allocation of foreign capital. Inthe first period (1988–90), only five of six regionsreceived FDI and there was extremely highconcentration in the southeast area (72.4 per centof total). In the following two periods (1991–95and 1996–2000), FDI seemed more evenlydistributed in all six regions with significantincreases for the Red River Delta and the CentralCoast. The last period (2001–2005, from adifferent and comparable data source, CEIC Asiandatabase) was associated with a small increase in
FDI for the north mountainous area, while thedominating role remained for the southeast.Across these four periods, it is easy to see betterperformances in the last two periods comparedwith the first two. However, this classificationmay fail to reveal the impact of the Asian crisis onFDI inflows, i.e., for the third period, the poorperformance in the late 1990s (1998–2000) maybe offset by the better performance in the twoprevious years, 1996 and 1997.
VII. Conclusion
This paper has scrutinized the trends and patternsof FDI in Vietnam since the reform was initiatedin 1986. FDI inflows have fluctuated over thisperiod, with a huge increase in the mid-1990sfollowed by a long-lasting depression. Recentfast changes in policy and in the investment
05 Tien Quang Tran 4/28/09, 9:37 AM72

A S E A N E c o n o m i c B u l l e t i n 7 3 Vo l . 2 6 , N o . 1 , A p r i l 2 0 0 9
environment under AFTA and WTO commitmentshave resulted in a new wave of FDI and achievinga new record in 2008 with over US$64 billion.However, there was big gap between registeredand realized capital in the past three years as aresult of deep decentralization without control andorientation from the central government. This isalso a consequence of ongoing weakness ininfrastructure, policy and human resource.
In general, the patterns of FDI shows mostcapital have been invested in labour-intensive orlow technology industries. Before 2006, most FDIhas been disbursed in manufacturing industry.However, since new Laws on Investment and
Corporation became effective in July 2006,especially the accession to WTO in late 2006, thepattern of FDI has been changed as infrastructuredevelopment received an increased number ofprojects and registered capital. Primary pro-duction, in particular crude oil exploration alsoreceived a special attention from foreign investorsas 24 per cent of total FDI disbursed but only10 per cent of total FDI registered.
The source-country analysis revealed that mostFDI originated from Asian countries with highexport orientation. Vietnam has a growing FDIfrom the OECD, indicating the extent of advancedtechnology imports. The evidence also confirms
TABLE 8Regional Distribution of FDI in Vietnam as of December 2005
(In US$ million)
Number of Registered Realized % of% of Realized/
Regionsprojects capital investment projects
Registered Registeredcapital capital
Northern Mountains 158 771 307 2.6 1.5 39.8Red River Delta 1,287 14,515 6,258 21.3 28.5 43.1Central Coast 320 2,730 1,323 5.3 5.4 48.4Central Highlands 88 267 178 1.5 0.5 66.7South East 3,974 31,203 18,794 65.9 61.2 60.2Mekong Delta 203 1,531 1,127 3.4 3.0 73.6
Total 6,030 51,018 27,986 100.0 100.0 54.9
Top ten provincesHo Chi Minh 1,869 12,240 6,056 31.0 24.0 49.5Hanoi 654 9,320 3,402 10.8 18.3 36.5Dong Nai 700 8,495 3,842 11.6 16.7 45.2Binh Duong 1,083 5,032 1,862 18.0 9.9 37.0Baria Vungtau 120 2,896 1,254 2.0 5.7 43.3Hai Phong 185 2,035 1,228 3.1 4.0 60.4Vinh Phuc 95 774 414 1.6 1.5 53.5Long An 102 766 332 1.7 1.5 43.3Hai Duong 77 720 375 1.3 1.4 52.1Thanh Hoa 17 713 410 0.3 1.4 57.5
Sub 10 provinces 4,902 42,990 19,176 81.3 84.3 44.6
NOTE: Accumulative stock of effective projects only.SOURCE: FDI database on website of MPI.
05 Tien Quang Tran 4/28/09, 9:37 AM73

A S E A N E c o n o m i c B u l l e t i n 7 4 Vo l . 2 6 , N o . 1 , A p r i l 2 0 0 9
FDI from the United States was indirectly investedthrough intermediate Asian MNEs.
In the regional distribution of FDI, the highconcentration of investment is generally in twoareas: the southeast and Red River Delta areas.Nine of the ten leading provinces are within thesetwo regions, accounting for nearly 90 per cent oftotal investment. FDI also plays an important rolein industrial zones and export processing zones(IZs/EPZs) with about one-third of total FDIinvested in these areas. Foreign companies locatedin IZs/EPZs can take advantage of betterinfrastructure, incentives and support from localauthorities. Deregulation for local authorities andthe management boards of IZs/EPZs have createdcut-throat competition among provinces inenticing FDI. However, the rapid expansion ofsimilar IZs as a result of excessive competitionin some nearby provinces has reduced theeffectiveness of the policy on FDI and IZs.
Another pattern is the remarkable change in theform of investment from joint ventures to fully-owned FIEs. Initially, joint ventures were mainlyestablished between foreign investors and SOEsand this firm type dominated in the early stage ofreform (in the early 1990s). Positive changes inthe investment climate (including policy reform)are the main reasons for the change in attitude offoreign investors. However, FDI in the form ofM&A was still trivial compared to Greenfieldinvestment. Implicitly, the restriction in ownershiphas deterred Vietnam from exploiting a highlyeffective finance resource for the enhancementof domestic-firm capacity and economicdevelopment.
The foreign-invested sector has played animportant role in the economy of Vietnam as itcontributes significantly to national investment fordevelopment, export, employment generation,GDP and state budget. Based on current situation,
TABLE 9Realized FDI Flows to Vietnam by Regions
(In US$ million)
Regions/episode 1988–1990 1991–1995 1996–2000 2001–2005 1988–2005
North mountainous area — 109 87 421 617Red River Delta 18 1,853 3,185 2,953 8,009Central Coast 1 289 1,159 623 2,073Central Highlands 0 59 73 36 167South East 58 2,604 6,295 6,541 15,498Mekong Delta 3 195 625 352 1,176
Total 81 5,109 11,424 10,926 27,539
Compositions (% of total)North Mountainous area — 2.1 0.8 3.9 2.2Red River Delta 22.3 36.3 27.9 27.0 29.1Central Coast 1.3 5.7 10.1 5.7 7.5Central Highlands 0.2 1.2 0.6 0.3 0.6Southeast 72.4 51.0 55.1 59.9 56.3Mekong Delta 3.8 3.8 5.5 3.2 4.3
Total 100.0 100.0 100.0 100.0 100.0
NOTE: MPI data may exclude a significant proportion of FDI managed by central level.SOURCE: FDI database of MPI (1988-2000) and C.E.I.C Asian database (2001–2005).
05 Tien Quang Tran 4/28/09, 9:37 AM74
A S E A N E c o n o m i c B u l l e t i n 7 5 Vo l . 2 6 , N o . 1 , A p r i l 2 0 0 9
NOTES
1. The terminology used in this paper is consistent with the Vietnamese regulations. Registered capital is totalinvestment reported to the authority and stated in the firm’s charter. Legal capital refers to the minimum capitalrequired to establish a new firm and is also stated in the firm’s charter. Realized capital (in some papers, calledimplemented capital) includes all assets and money invested in Vietnam.
2. Using unpublished data provided by MPI, FDI inflows to Vietnam in 2005 and 2006 surpassed the levels ofThailand and Malaysia.
3. Growth index is a ratio between the annual investment and the 1994’s investment when both are measured at the1994 constant price. It allows to compare the growth rate of the investment amongst different ownerships at agiven point of time.
4. A shareholding company defined in the new Enterprise Law is an enterprise in which (a) the charter capital shallbe divided into equal portions called shares; (b) shareholders shall be liable for the debts and other propertyobligations of the enterprise within the amount of capital contributed to the enterprise; (c) the minimum numberof shareholders shall be three and there shall be no restriction on the maximum number; and (d) shareholdersmay freely assign their shares to other persons.
5. Effective projects refer to projects implemented at the point of time. Therefore, failed and outdated projects areexcluded from the FDI data.
REFERENCES
Addition, Tony and Almas Heshmati. “The new global determinants of FDI flow to developing countries”. DiscussionPaper, Vol. 45. World Institute for Development Economics Research: United Nations University, 2003.
Aitken, Brian J. and Ann E. Harrison. “Do domestic firms benefit from direct foreign investment? Evidence fromVenezuela”. American Economic Review 89 (1999): 605–18.
Athukorala, Prema-Chandra. “Foreign direct investment and manufacturing for export in a new exporting country:The case of Sri Lanka”. World Economy 18, no. 4 (1995): 543–64.
———. Multinational Enterprises in Asian Development. Cheltenham, UK and Northampton, MA, USA: EdwardElgar, 2007a.
Blomström, Magnus and Ari Kokko. “Multinational corporations and spillovers”. Journal of Economic Surveys 12,no. 2 (1998): 247–77.
Bui, Tuan. “Vietnam”. In Managing FDI in a Globalizing Economy, edited by D. Brooks and Hal Hill, pp. 281–307.London: Palgrave Macmillan, 2004.
Caves, Richard E. Multinational Enterprise and Economic Analysis. Cambridge: Cambridge University Press, 1996.Dunning, John H. Multinational Enterprises and the Global Economy. Reading, MA: Addison-Wesley, 1993.Estrin, Saul and Klaus E. Meyer. Investment Strategies in Emerging Markets. Cheltenham, UK and Northampton,
MA, USA: Edward Elgar, 2004.Freeman, Nick J. “Harnessing foreign direct investment for economic development and poverty reduction”. Journal
of the Asian Pacific Economy (2004): 209–22.Garibaldi, Pietro, Nada Mora, Ratna Sahay, and Jeromin Zettelmeyer. “What moves capital to transition economies”.
IMF Staff Paper, vol. 48, pp. 109–45. Washington, D.C.: IMF, 2001.
in future, the world economy is expected to shrinkwith fall in global FDI volume. MNEs have toadjust their business strategy to deal with thecurrent global financial crisis and aftermath.Consequently, there will be a number of approvedprojects that may not be implemented and hence,the ratio of realized over registered capital couldbe further reduced. Moreover, new investors haveto more carefully consider plans to set new
affiliates in the host countries. If the FIE isestablished by bank loans, this investment wouldbe examined and supervised more strictly. Thecrisis also causes decreasing demand for all kindsof goods and services. In brief, both capitaldisbursement and new capital inflows will bereduced significantly in the short term if thegovernment does not pursue further improvementin investment climate.
05 Tien Quang Tran 4/28/09, 9:37 AM75

A S E A N E c o n o m i c B u l l e t i n 7 6 Vo l . 2 6 , N o . 1 , A p r i l 2 0 0 9
Helleiner, G.K. “Transnational corporations and direct foreign investment”. In Volume II Handbook of DevelopmentEconomics, edited by H. Chenery and T.N. Srinivasan. Elsevier Science Publisher, 1989.
Hill, Hal. Foreign Investment and Industrialisation in Indonesia. Singapore: Oxford University Press, 1988.IMF (International Monetary Fund). Balance of Payments Manual. Washington, D.C.: IMF, 1993.JICA (International Cooperation Agency Japan). “The study on FDI promotion strategy in the socialist republic of
Vietnam”. PricewaterhouseCoopers Ltd, Hanoi, Vietnam, 2003.Kinoshita, Yuko and Nauro F. Campos. “Why Does FDI go Where it goes? New evidence from the Transition
economies”. Working Paper, vol. 573. The William Davidson Institute at University of Michigan, Michigan,2003.
Kokko, Ari, Katarina Kotoglou, and Anna Krohwinkel-Karlsson. “Characteristics of failed FDI projects in Vietnam”.Transnational Corporations 12 (2003): 41–73.
Lall, Sanjaya. “Attracting foreign direct investment: New trends, sources and policies”. Economic Paper.Commonwealth Secretariat, London, 1997.
Lankes, Hans-Peter and A.J Venables. “Foreign direct investment in economic transition: the changing pattern ofinvestment”. Economics of Transition 4, no. 2 (1996): 331–47.
Le, Dang Doanh. “Foreign direct investment in Vietnam: Results, achievements, challenges and prospects”.Conference on FDI in Hanoi. Washington, D.C.: IMF, 2002.
Leproux, Vitorio and Douglas H. Brooks. “Vietnam: Foreign direct investment and post crisis regional integration”.ERD Working Paper, vol. 56. Asian Development Bank, Mandaluyong, Philippines, 2004.
Lucas, Robert E. “On the determinants of direct foreign investment: Evidence from East and Southeast Asia”. WorldDevelopment 21, no. 3 (1993): 391–406.
Merlevede, Bruno and Koen Schoors. “Determinants of foreign direct investment in transition economies”.Preliminary version, 2004.
Mirza, Hafiz and Axele Giroud. “Regional integration and benefits from foreign direct investment in ASEANEconomies: The case of Vietnam”. Asian Development Review 21, no. 1 (2004): 66–98.
Moran, Theodore H. Foreign Direct Investment and Development: The New Policy Agenda for Developing Countriesand Economies in Transition. Washington, D.C.: Institute for International Economics, 1998.
MPI (Ministry of Planning and Investment of Vietnam). “General report for proposing development strategy ofclustering industrial zones in Vietnam in 2005–2020”. Hanoi: MPI, 2004.
OECD (Organisation for Economic Co-Operation and Development). Benchmark Definition of Foreign DirectInvestment. 3rd ed. Paris: OECD, 1996.
Pham Hoang Mai. FDI and Development in Vietnam: Policy Implication. Singapore: Institute of Southeast AsianStudies, 2004.
Schaumburg-Muller, Henrik. “Rise and fall of foreign direct investment in Vietnam and its impact on localmanufacturing upgrading”. European Journal of Development Research 15, no. 2 (2003): 44–66.
Tran, Quang Tien. “Reforms in FDI Policy and the Investment Climate in Vietnam”. Journal of World Trade 42, no. 6(2008): 1175–98.
UNCTAD (United Nations Conference on Trade and Development). World Investment Report. Geneva: UNCTAD,various issues.
World Bank. Vietnam business: Vietnam development report 2006. Washington, D.C.: World Bank, 2005.
Tien Quang Tran is Vice Rector, Dean of Business Administration Faculty at Central Women’s Training School inVietnam.
05 Tien Quang Tran 4/28/09, 9:37 AM76
Related Documents