PCR-407 Competitive Research Grant Sub-Project Completion Report on Supply Chain Analysis of Major Vegetables Produced in Hilly and Coastal Region of Bangladesh Project Duration July 2017 to September 2018 Submitted by Agricultural Economics Division Bangladesh Agricultural Research Institute Gazipur-1701, Bangladesh Submitted to Implementation Unit-BARC, NATP-2 Bangladesh Agricultural Research Council Farmgate, Dhaka-1215 September 2018

Welcome message from author
This document is posted to help you gain knowledge. Please leave a comment to let me know what you think about it! Share it to your friends and learn new things together.
Transcript
PCR-407
Competitive Research Grant
Sub-Project Completion Report on
Supply Chain Analysis of Major Vegetables Produced in Hilly
and Coastal Region of Bangladesh
Project Duration
July 2017 to September 2018
Submitted by Agricultural Economics Division
Bangladesh Agricultural Research Institute Gazipur-1701, Bangladesh
Submitted to
Implementation Unit-BARC, NATP-2
Bangladesh Agricultural Research Council
Farmgate, Dhaka-1215
September 2018
Competitive Research Grant
Sub-Project Completion Report on
Supply Chain Analysis of Major Vegetables Produced in Hilly
and Coastal Region of Bangladesh
Project Duration
July 2017 to September 2018
Submitted by Agricultural Economics Division
Bangladesh Agricultural Research Institute Gazipur-1701, Bangladesh
Submitted to Implementation Unit-BARC, NATP-2 Bangladesh Agricultural Research Council
Farmgate, Dhaka-1215
September 2018

Citation Hoq M. S. and Matin M. A. 2018. Supply Chain Analysis of Major Vegetables Produced in Hilly and Coastal Region of Bangladesh. A report of Competitive Research Grant Sub-Project under National Agricultural Technology Program-Phase II Project (NATP-2), Bangladesh Agricultural Research Council (BARC), Farmgate, Dhaka, Bangladesh.
Project Implementation Unit National Agricultural Technology Program- Phase II Project (NATP - 2) Bangladesh Agricultural Research Council New Airport Road, Farmgate, Dhaka-1215 Bangladesh Edited and published by:
Project Implementation Unit National Agricultural Technology Program- Phase II Project (NATP - 2) Bangladesh Agricultural Research Council New Airport Road, Farmgate, Dhaka-1215 Bangladesh
Published in: September 2018
Printed by:
Published by:
Printed by:
Acknowledgement
The execution of CRG sub-project has successfully been completed by Agricultural Economics Division, Bangladesh Agricultural Research Institute using the research grant of USAID Trust Fund and GoB through Ministry of Agriculture. We would like to thank to the World Bank for arranging the grant fund and supervising the CRGs by BARC. It is worthwhile to mention the co-operation and quick responses of PIU-BARC, NATP-2, in respect of field implementation of the sub-project in multiple sites. Preparing the project completion report required to contract a number of persons for collection of information and processing of research data. Without the help of those persons, the preparation of this document could not be made possible. All of them, who made it possible, deserve thanks. Our thanks are due to the Director PIU-BARC, NATP-2 and his team who given their whole hearted support to prepare this document. We hope this publication would be helpful to the agricultural scientists of the country for designing their future research projects in order to generate technology as well as increasing production and productivity for sustainable food and nutrition security in Bangladesh. It would also assist the policy makers of the agricultural sub-sectors for settings their future research directions. The authors expressed their sincere gratitude to Dr. Abul Kalam Azad, Director General, Bangladesh Agricultural Research Institute for his kind support, cooperation and encouragement to carry out this research work successfully. The authors feel proud to express their profound gratitude to Chief Scientific Officer, Dr. Md. Abdul Matin for his technical, administrative support and continuous inspiration to carry out the study. Credit goes to Mr. Md. Nazmul Islam, Accountant of Agricultural Economics Division, BARI, Gazipur who sincerely helped for fund collection and maintaining the accounts of the project. Special recognition is due to the Enumerators and vegetables growers of the study areas for their cooperation and providing data for the report without which it would not be possible to complete the study.
The Authors
ii
ii

Acronyms
AERS : Agricultural Economics and Rural Sociology
BADC : Bangladesh Agricultural Development Corporation
BARC : Bangladesh Agricultural Research Council
BARI : Bangladesh Agricultural Research Institute
BBS : Bangladesh Bureau of Statistics
BCR : Benefit cost ratio
DAE : Department of Agricultural Extension
DAM : Directorate of Agricultural Marketing
FAO : Food and A
FAO : Food and Agricultural Organization
FGD : Focus Group Discussion
GDP : Gross Domestic Product
GM : Gross margin
Ha : Hectare
HYV : High Yielding Variety
MoA : Ministry of Agriculture
7FYP : Seventh Five Years Plan
MT : Metric Tons
CHT : Chittagong Hill Tracts
SCM : Supply Chain Management
TVC : Total Variable Cost
TFC : Total Fixed Cost
MC : Marketing Cost
NFDCC : National Fertilizer Distribution Coordination Committee
PSI : Private Sector Importers
BCIC : Bangladesh Chemical Industries Corporation
TSP : Triple Super Phosphate
MOP : Muriate of Potash
iii
Table of contents
SL. NO. SUBJECTS PAGE NO.
COVER PAGE ACKNOWLEDGEMENTS ACRONYMS Table of CONTENTS LIST OF TABLES LIST OF FIGURES EXECUTIVE SUMMARY
i ii iii iv
viii xi xii
A Sub-project Description 1 1. Title of the CRG sub-project 1
2. Implementing organization 1
3. Name and full address with phone, cell and E-mail of PI/Co-PI 1 3.1 Principal Investigator (Position, full address with phone no) 1 3.2 Co-Principal Investigators (Position, full address with phone no) 1
4. Sub-project budget 1 5. Duration of the sub-project 1 6. Justification of undertaking the sub-project 1 6.1 Background of the study 1 6.2 Land utilization pattern in the hilly region 2 6.3 Land utilization pattern in the coastal region 4 6.4 Present status of vegetables production in hill areas of
Bangladesh 4
6.5 Present status of vegetables production in Coastal areas of Bangladesh 6
7. Sub-project goal 6 8. Sub-project objectives 6 9. Implementing locations 6
10. METHODOLOGY 6 10.1 Selection of the study area 7 10.2 Selection of Vegetables 8 10.3 Sampling Technique 8 10.4 Sample size 8 10.5 Data and Information 9 10.6 Method of data collection 9 10.7 Preparation of interview schedule 9 10.8 Analytical Techniques 10 10.8.1 Profitability at producers’ level 10
iv
10.8.2 Net marketing margin at traders’ level 10 10.8.3 Measurement of marketing efficiency 10
11. RESULTS AND DISCUSSION 11 CHAPTER
11.1 AVAILABILITY AND DISTRIBUTION SYSTEM OF AGRICULTURAL INPUT 12
11.1.1 Seed supply system 12 11.1.2 Sources of seed in hilly areas 13 11.1.3 Sources of seed in coastal areas 14 11.1.4 Fertilizer supply system 15 11.1.5 Sources of fertilizer in hilly region 16 11.1.6 Farmer’s opinion regarding fertilizer price in hilly region 16 11.1.7 Farmers opinion regarding quality of fertilizer in hilly region 17 11.1.8 Sources of fertilizer in coastal area 17 11.1.9 Farmer’s opinion regarding fertilizer price in coastal region 17 11.1.10 Farmer’s opinion regarding fertilizer quality in coastal region 18 11.1.11Pesticides supply system 18 11.1.12 Sources of pesticide in hilly region 19 11.1.13 Farmer’s opinion regarding pesticide quality in hilly region 20 11.1.14 Sources of pesticide in coastal region 20 11.1.15 Farmer’s opinion regarding pesticide quality in coastal region 20
CHAPTER 11.2 PROFITABILITY OF SELECTED CROPS IN HILLY AND COASTAL REGION 19
11.2.1 Profitability Analysis of Selected Crops in Hilly Region 19 11.2.1.1 Homestead cultivation 20 11.2.1.2 Plain land cultivation 20 11.2.1.2.1 Input use, cost and return of brinjal cultivation 20 11.2.1.2.2 Input use, cost and return of yard long bean
cultivation 23
11.2.1.3 Crop production under Jhum cultivation 25 11.2.2 Profitability analysis of selected crops in coastal region 27 11.2.2.1 Profitability of plain land cultivation 27 11.2.2.1.1 Input use, cost and return of bittergourd
cultivation 27
11.2.2.1.2 Input use, cost and return of cucumber cultivation 29
11.2.2.2 Vegetables cultivation under Sorjon method 32 11.2.2.3 Gher based agriculture 34
CHAPTER 11.3
SUPPLY CHAIN OF SELECTED VEGETABLES IN HILLY AND COASTAL REGION 34
11.3.1 Vegetables market in hilly area 34 11.3.2 Vegetables market in coastal area 35 11.3.3 Actors involved in the vegetables supply chain 36 11.3.3.1 Input dealer 36
v

11.3.3.2 Producer 36 11.3.3.3 Farm labourer 37 11.3.3.4 Transport agency 37 11.3.3.5 Farmer-cum-retailer 37 11.3.3.6 Bepari 37 11.3.3.7 Local arathdar 37 11.3.3.8 Urban arathdar 37 11.3.3.9 Paiker-cum-retailer 37 11.3.3.10 Local retailer 38 11.3.3.11 Urban retailer 38 11.3.3.12 Consumer 38 11.3.5 Existing supply chain of selected vegetables in Hilly areas 38 11.3.6 Existing supply chain of selected vegetables in coastal areas 40
CHAPTER 11.4
MARKETING COST AND MARGIN AT DIFFERENT LEVELS IN SUPPLY CHAIN 40
11.4 Marketing cost and margin of different actors 40 11.4.1 Marketing cost of different actors in supply chain of hilly
areas 41
11.4.1.1 Farmers marketing cost 41 11.4.1.2 Marketing cost of farmer-cum-retailer 42 11.4.1.3 Marketing cost of bepari for selected vegetables 42 11.4.1.4 Marketing cost of local arathdar 43 11.4.1.5 Marketing cost of urban arathdar 43
11.4.1.6 Marketing cost of paiker-cum-retailer 45 11.4.1.7 Marketing cost of local retailer 45
11.4.1.8 Marketing cost of urban retailer 45
11.4.2 Marketing margin of different actors for selected vegetables in hilly areas 48
11.4.2.1 Marketing margin of brinjal in hilly area 48 11.4.2.2 Marketing margin of yard long bean in hilly area 48 11.4.3 Marketing cost of different actors for selected vegetables
in coastal areas 48
11.4.3.1 Farmers marketing cost in coastal area 48 11.4.3.2 Marketing cost of farmer-cum-retailer 49 11.4.3.3 Marketing cost of bepari in coastal area 49 11.4.3.4 Marketing cost of local arathdar in coastal area 49 11.4.3.5 Marketing cost of urban arathdar in coastal area 50 11.4.3.6 Marketing cost of paiker-cum-retailer in coastal
areas 50
11.4.3.7 Marketing cost of local retailer in coastal area 50
vi

11.4.3.8 Marketing cost of urban retailer in Coastal area 50 11.4.4 Marketing margin of different actors for selected
vegetables in coastal areas
51
11.4.4.1 Marketing margin of bittergourd in the coastal areas 51
11.4.4.2 Marketing margin of cucumber in the coastal areas 51 CHAPTER
11.5 MARKETING EFFICIENCY OF SELECTED VEGETABLES IN HILLY AND COASTAL AREA 52
11.5.1 Marketing efficiency of selected vegetables in hilly areas 11.5.1.1Marketing efficiency of different supply chain of brinjal 53 11.5.1.1.1 Producer’s share of different brinjal supply chain 53 11.5.1.12. Marketing cost and margin of actors in different
brinjal supply chain 53
11.5.1.1.3 Deviation between maximum and minimum prices of different brinjal supply chain 54
11.5.1.1.4 Efficient supply chain of brinjal marketing 54 11.5.1.2 Marketing efficiency of different supply chain of yard
long bean 55
11.5.1.2.1 Producer’s share of different yard long bean supply chain 55
11.5.1.2.2 Marketing costs and margins of actors in different yard long bean supply chain 55
11.5.1.2.3 Deviation between maximum and minimum prices of yard long bean 56
11.5.1.2.4 Efficient supply chain of yard long bean 56 11.5.2 Marketing efficiency of selected vegetables in coastal areas 57 11.5.2.1 Marketing efficiency of different supply chains of
bittergourd 57
11.5.2.1.1 Producer’s share of bittergourd in different supply chain 57
11.5.2.1.2 Marketing cost and margin of actors in different supply chain of bittergourd 58
11.5.2.1.3 Deviation between maximum and minimum prices of bittergourd 58
11.5.2.1.4 Efficient supply chain of bittergourd 58 11.5.2.2 Marketing efficiency of different supply chain of
cucumber 59
11.5.2.2.1 Producers share of different cucumber supply chain 59
11.5.2.2.2 Marketing cost and margin of actors in different cucumber supply chain 59
11.5.2.2.3 Deviation between maximum and minimum prices of cucumber 60
11.5.2.2.4 Efficient supply chain of cucumber marketing 60
vii

CHAPTER 11.6
CONSTRAINTS TO PRODUCTION, MARKETING AND URBAN MARKET LINKAGE 62
11.6.1 Production constraints faced by the farmers in hilly area 63 11.6.2 Production constraints faced by the farmers in coastal area 64 11.6.3 Marketing problems faced by the farmers and traders 64 11.6.3.1 Marketing problems faced by the farmers 65 11.6.3.2 Marketing problems faced by the traders 65 11.6.3.3 Marketing problems faced by the retailer: 68 11.6.4 Constraints to linkage rural market with urban market 69
CHAPTER 11.7 SUMMARY, CONCLUSION AND POLICY RECOMMENDATION 70
11.7.1 Summary 70 11.7.2 Conclusion 70 11.7.3 Policy recommendations 71 11.7.3.1 Production aspects 71 11.7.3.2 Marketing aspects 72
12. Research Highlights 75
13. REFERNCES 77
B Implementation Position 80 1.Procurement 80 2.Establishment/renovation facilities 80 3.Training/study tour/ seminar/workshop/conference
organized 80
C Financial and Physical Progress 80
D Achievement of Sub-project by Objectives: (Tangible form) 81 E Materials Development/Publication Made under the Sub-project 83 F Technology/Knowledge Generation/Policy Support (as applied) 83 i. Generation of technology (commodity & non-commodity) 84 ii. Generation of new knowledge that help in developing more
technology in future 85
iii. Technology transferred that help increased agricultural productivity and farmers’ income 85
iv. Policy support 85 G Information Regarding Desk and Field Monitoring 85 I Lesson Learned 85 J Challenges 85
Appendix 86
viii
LIST OF THE TABLES
TABLE NO. TITLE PAGE NO.
6.1 Land utilization patterns of the three districts in hilly region 3
6.2 Land utilization patterns of the three districts in coastal region 4
6.3 Present status of vegetables production in hill areas 4 6.4 Present status of vegetables production in coastal areas 5
10.1 Detail study location of the project 7
10.2 Sample distribution of the study 8
11.1.2 Sources of seed in hilly areas 12 11.1.2 Sources of seed in Coastal areas 12 11.1.3 Sources of fertilizer in hilly region 14 11.1.4 Farmers opinion regarding fertilizer price in hilly region 14
11.1.5 Farmers opinion regarding quality of fertilizer in hilly region 15 11.1.6 Sources of fertilizer in coastal area 15 11.1.7 Farmers opinion regarding fertilizer price in coastal region 15 11.1.8 Farmer’s opinion regarding fertilizer quality in coastal region 16 11.1.9 Sources of pesticide in hilly region 17
11.1.10 Farmer’s opinion regarding pesticide quality in hilly region 18 11.1.11 Sources of pesticide in coastal region 18 11.1.12 Farmer’s opinion regarding pesticide quality in coastal area 19 11.2.1 Per hectare input uses pattern of brinjal cultivation 20 11.2.2 Per hectare cost of brinjal cultivation 21 11.2.3 Profitability of brinjal cultivation 22
11.2.4 Per hectare input use pattern of yard long bean cultivation 22
11.2.5 Per hectare cost of yard long bean cultivation 23
11.2.6 Profitability of yard long bean cultivation 24
11.2.7 Cost of production in Jhum cultivation 25
11.2.8 Profitability in Jhum cultivation 25
11.2.9 Per hectare Input use pattern of bitter gourd cultivation 26
11.2.10 Per hectare cost of bitter gourd cultivation 27
11.2.11 Profitability of bitter gourd cultivation 28
11.2.12 Per hectare Input use pattern of cucumber cultivation 28
ix

11.2.13 Per hectare cost of cucumber cultivation 29
11.2.14 Profitability of cucumber cultivation 30
11.2.15 Cost of vegetables production in Sorjan methods 31
11.2.16 Profitability of vegetables production in Sorjan methods 31
11.2.17 Cost of vegetables cultivation in the dike of Gher 33
11.2.18 Profitability of vegetables cultivation in the dike of Gher 33
11.3.1 supply chain of selected vegetables in Hilly areas 37
11.3.2 supply chain of selected vegetables in coastal areas 38
11.4.1 Farmers marketing cost of in hilly areas 41
11.4.2 Marketing cost of farmer-cum-retailer in hilly areas 41
11.4.3 Marketing cost of bepari in hilly areas 42
11.4.4 Marketing cost of local arathdar in hilly areas 42
11.4.5 Marketing cost of urban arathdar in hilly areas 43
11.4.6 Marketing cost of paiker-cum-retailer in hilly areas 43
11.4.7 Marketing cost of local retailer in hilly areas 43
11.4.8 Marketing cost of urban retailer in hilly areas 44
11.4.9 Marketing margin of brinjal in the hilly area 44
11.4.10 Marketing margin of yard long bean in hilly area 45
11.4.11 Farmers marketing cost in coastal area 46
11.4.12 Marketing cost of farmer-cum-retailer in coastal area 47
11.4.13 Marketing cost of bepari in coastal areas 47
11.4.14 Marketing cost of local arathdar in coastal areas 48
11.4.15 Marketing cost of urban arathdar in coastal areas 48
11.4.16 Marketing cost of paiker-cum-retailer in coastal areas 48
11.4.17 Marketing cost of local retailer in coastal areas 49
11.4.18 Marketing cost of urban retailer in coastal areas 49
11.4.19 Marketing margin of biitergourd in the coastal areas 50
x
11.4.20 Marketing margin of cucumber in the coastal areas 50
11.5.1 Producer share, marketing cost and margin of brinjal supply chain 53
11.5.2 Price deviation between of brinjal in different supply chain 54
11.5.3 Final ranking of the efficiency of different brinjal supply chains 54
11.5.4 Producer share, marketing cost and margin of yard long bean supply chain 55
11.5.5 Price deviation of Yard long bean in different supply chain 56
11.5.6 Final ranking of the efficiency of different yard long bean supply chains 57
11.5.7 Producer share, marketing cost and margin of bitter gourd supply chain 57
11.5.8 Price deviation of bitter gourd in different supply chain 58
11.5.9 Final ranking of the efficiency of different bitter gourd supply chains 59
11.5.10 Producer share, marketing cost and margin of cucumber supply chain 60
11.5.11 Price deviation of cucumber in different supply chain 61
11.5.12 Final ranking of the efficiency of different cucumber supply chains 61
11.6.1 Constraint faced by the farmers for production in hilly area 62
11.6.2 Constraint faced by the farmers for production in coastal area 64
11.6.3 Marketing problems faced by the farmers and traders 66
11.6.4 Constraints to linkage rural market with urban market 69
LIST OF THE FIGURES FIGURE NO. TITLE PAGE NO.
6.1 Area of winter and summer vegetables in hilly region 5
6.2 Production of winter and summer vegetables in hilly region 5
6.3 Area of winter and summer vegetables in hilly region 6
6.4 Production of winter and summer vegetables in hilly region 6
10.1 Map showing the selected areas of hilly and coastal region 7
11.1.1 Seed distribution system in the study areas 11
11.1.2 Fertilizer distribution system in the study areas 13
11.1.3 Pesticide distribution system in the study areas 17
11.2.1 Size of an optimum gher for 1 bigha 32
11.3.1 Supply chain of selected vegetables produced in hilly areas of Bangladesh 38
11.3.2 Supply chain of selected vegetables produced in coastal areas of Bangladesh
39
xi

Executive Summary
Bangladesh witnessed a revolution in vegetable production over the last decade. According to the recently releases FAO report, Bangladesh has ranked third in the list of vegetables producing countries of the world. The study was conducted in hilly and coastal region of Bangladesh for understanding the input distribution system, profitability of different production practices, supply chain and different drawbacks of production and marketing of selected vegetables. The study area covered three hill districts namely; Rangamati, Khagrachari and Bndarban and three coastal districts namely; Patuakhali, Satkhira and Cox’s bazar where vegetables production is very limited due to different stress. Brinjal and yard long bean were selected from hilly areas and bitter gourd and cucumber were selected from coastal areas. The study was conducted during the period of 2017-2018. Primary data were collected through face to face interview and ssecondary data were collected from different published sources. Multistage simple random sampling technique was used and total sample size was 1140 for the study. The study revealed that vegetables production and marketing for both farmers and traders were profitable. Three production techniques were found in both regions such as; homestead, plain land and Jhum cultivation in the hilly areas and plain land, sorjon method and gher based cultivation in coastal area. The net return of brinjal and yard long bean in plain land cultivation was Tk. 1, 92,265/ ha and Tk.82362/ha respectively in hilly region and the BCR was found 1.88 and 1.53 respectively. The net return of Jhum cultivation was found Tk.70,113/ha and the BCR was found 2.02.On the other hand, the net return of bitter gourd and cucumber cultivation was Tk. 2,24,530/ ha and Tk. 1,57,893/ha and the BCR was found 2.08 and 1.82 respectively in plain land of coastal area. The profitability of sorjon cultivation and gher based agriculture system was Tk. 91023/ha and Tk. 1,29,115/ha respectively and the BCR was 1.37 and 1.76 respectively. Five supply chains of vegetables were identified in hilly area, of which four chains were dominant and 93.25% vegetables moved by those chains. On the other hand, four supply chains were identified in coastal areas of which three chains were dominant by which 94.43% vegetables moved from producer to consumer. Supply chain-II: Farmer-cum-retailer > Local Consumer is the most efficient chain for both in hilly and coastal region of Bangladesh. Because farmer himself done retailing to the consumer. About 28.30% products run though this chain and the producer’s share of this chain was 95.59% for brinjal and 95.42% for yard long bean in hilly areas. However in coastal areas, about 25.50% products run though this chain and the producer’s share of this chain was 96.29% for bitter gourd and 95.58 % for cucumber. Highest marketing margin was found in supply chain-V in hilly areas which was Tk. 647.60/qt. for brinjal and Tk. 645.81/qt. for yard long bean. In coastal areas, it was found highest in supply chain-IV which was Tk. 777.41/qt. for bitter gourd and Tk.554.65/qt. for cucumber. Farmers faced different production problem in the hilly areas such as; scarcity of irrigation water and quality seed, low yield, Insect & pest attack, poor technical knowledge and production practices, less use of farm machinery etc. and in coastal belt, farmers also faced unavailability of fresh irrigation water, incidence of salinity in the soil, intrusion of salinity due to heavy rainfall and drought, scarcity of quality seed, poor yield, poor technical knowledge etc. for vegetables cultivation. Trader’s also faced some marketing problems such as; price fluctuation, high transportation cost, lack of market information, poor road & transport, unethical subscription, absence of permanent retail place and lack of storage facilities etc. Training program on modern technology and post-harvest handling, improvement of transportation and communication system, development of salt tolerant variety and wider expansion of existing modern technology in coastal region and linking farmers with the extension personnel and researcher were the major recommendation of this study.
xii

1
CRG Sub‐project Completion Report (PCR)
A. Sub‐project Description
1. Title of the CRG Sub‐Project: Supply Chain Analysis of Major Vegetables Produced in Hilly and Coastal Regions of Bangladesh
2. Implementing organization: Agricultural Economics Division, Bangladesh Agricultural Research
Institute, Joydevpur, Gazipur‐1701. 3. Name and address of with phone, cell and E‐mail of PI/Co‐PI (s):
3.1 Principal Investigator: Mohammad Shamsul Hoq Scientific Officer Agricultural Economics Division Bangladesh Agricultural Research Institute Joydevpur, Gazipur 1701. Mobile no. 01716330898 E‐mail: [email protected]
3.2 Co‐Principal Investigators: Dr. Md. Abdul Matin Chief Scientific Officer Agricultural Economics Division Bangladesh Agricultural Research Institute
Gazipur‐1701. Mobile: 01725694481 Email:[email protected],
4. Sub‐project budget (Tk.): 4.1 Total: 19,97,895/‐
4.2 Revised (if any): Not applicable
5. Duration of the sub‐project:
5.1 start date (based on of LoA sign): 13 July, 2017
5.2 End date: 30 September, 2018
6. Justification of undertaking the sub‐project: 6.1 Background of the study
Bangladesh witnessed a revolution in vegetable production over the last decade. According to the
recently releases FAO report, Bangladesh has ranked third in the list of vegetables producing
countries in the world. The country produced a total of 14.23 million tons of vegetables in 2014‐
15 while the growth rate marked a steady six percent yield in each of the last three years (MoA,
2016).Vegetable cultivation has increased fivefold by arresting unfavorable land type like coastal,
hill, char and hoar region of Bangladesh. Hills constitute about 12 per cent of the total area of
Bangladesh in which chittagong hill tracts districts alone covers about 9%. Coastal region of

2
Bangladesh accounts for 30% of the net cultivable area (SRDI, 2012). But vegetable production in
those areas is still in primitive stage due to different stresses.
There are many types of production and marketing constraints that exist in those unfavorable
ecosystems such as water log, tidal sore, salinity, rain‐fed agriculture, poor market infrastructure,
inefficient service provider etc. For these smallholders vegetables farming in those areas are
subsistence and market is also disorganized. Indigenous people in Bangladesh are, in general,
very poor, illiterate, and their livelihood depends on wage earnings and shifting cultivation (Uddin
et al., 2000). However, a large part of hilly areas are under state forest and some are under tea
and rubber plantation. In the remaining part, Jhum (shifting cultivation following slash and burn
method) is being practiced by the tribal people, especially in Chittagong hill tracts and locally in
other areas. Jhum involves clearing of forest land after several years (4‐5 years) of fallow. But
now the fallow period has been reduced further to 2 years due to non‐availability of land. This
exposure of land has increased the chance of soil erosion and further degradation of land (M. A.
Rahman, 2011).They receive the highest income from agriculture compared to other sources, but
are constrained by limited cash and modern technology for higher agricultural production, which
is a threat to the natural resources in the area (Farid and Mujibullah, 1990; Chowdhury, et al.
2004).
Livestock and poultry provide additional income. Their food basket contains mainly indigenous
vegetables, fruits and the meat of animals. On the other hand smallholder farming in the coastal
region was mostly subsistence‐oriented, involving wet‐season rice, livestock (mainly cattle), and
some tree and vegetable crops in the house‐yard. With the construction of coastal embankments
in the 1960s, there was the possibility of planting dry‐season crops, including rice, wheat, pulses,
oilseeds, jute, melons, and various vegetables. In some areas, freshwater fish and prawn are
cultivated along with rice in the wet season and brackish‐water shrimp is cultivated in the dry
season (Bala and Hossain 2010; Ahmed et al. 2010). The land‐use pattern in the coastal region
has been substantially influenced by the level of salinity and the availability of irrigation water for
dry season crops. The proportion of fallowed areas has been increasing because of soil
salinization and scarcity of freshwater irrigation (SRDI 2012). Nearly one million hectares remain
fallow in the dry season, principally due to soil and water salinity (Bala and Hossain 2010)
The main effort of our 7FYP is also to improve the efficiency of agricultural marketing to reduce
market distortions and the cost of marketing, and to ensure that farmers get proper price for
their produce and consumer gets quality products.In the existing supply chain, there are a
number of middlemen which causes a huge gap between vegetable growers and end consumers.
Again the vegetable marketing information system rarely exists in those areas for which the
vegetable growers unable to get vegetables’ price and demand information. So they cannot sell it
at the right price to the middlemen. Moreover poor road and market infrastructure,
inappropriate transport and handling make the vegetable supply chain hardening both in the hill
and coastal region.
A supply chain is effective at that time when it meets the demand of end consumers at the right
place, at the right time and at right price. It creates benefits for all the parties involved in the
chain. In case of vegetable supply chain, it needs to meet the vegetable demand of consumers

3
effectively so that consumers, vegetable growers and middlemen get equal benefit from it. If it is
not effective then the interest of any party may decreases which also impact on the overall
supply chain negatively (Hossain M. A. and M. N.Hossain, 2013). Therefore the study is
undertaken for creating employment opportunities for poor farmers, getting information on
production technique, improving supply chain efficiency, lower post‐harvest losses and
improving market infrastructure in with the above objectives.
6.2 Land utilization pattern in the hilly region
The total land area of Bandarban, Khagrachari and Rangamati district was 4,47,903 ha, 2,70,000
ha and 6,11,600 respectively. In Bandarban upazila, the major share forest area occupied 63.45%
of total land area in Bandarban district whereas it was 52.34% in Khagrachari district and 67.61%
in Rangamati district. On the other hand, the amount of cultivable area was only 9.45% in
Bandarban district, 16.31% in Khagrachari district and 8.95% in Rangamati district. The
vegetables crops covered 1.35% land in Bandarban district and 3.46% land in Khagrachari district
and 0.98% land in Rangamati district. Highest cropping intensity was found in Rangamati district
(159%) followed by Kharachari (154%) and Bandarban district (150%).
Table 6.1 Land utilization patterns of the three districts in hilly region
Particulars
Bandarban Khagrachri Rangamati
Area (ha)
Percent Area (ha) Percent Area (ha)
Percent
1 Total area 447903 100 270000 100 611600 100
2. Homestead and others 3880 0.87 81744 30.28 4876 0.80
3. Forest area 284194 63.45 141330 52.34 413492 67.61
4. Cultivable land 42335 9.45 44030 16.31 54753 8.95
5. Single cropped 20119 4.49 22820 8.45 23872 3.90
6. Double cropped 12931 2.89 18780 6.96 23070 3.77
7. Triple cropped 2470 0.55 2430 0.90 3430 0.56
8. Fallow land 6815 1.52 ‐‐ 0.00 4381 0.72
9.Total cropped area 53391 11.92 67670 25.06 80302 13.13
10. Net cropped area 35520 7.93 44030 16.31 50372 8.24
11. Vegetables crops 6038 1.35 9351 3.46 6020 0.98
12. Cropping intensity (%) 150% ‐‐ 154% ‐‐ 159% ‐‐
(Source: DAE, 2017)
6.3 Land utilization pattern in the coastal region
The total land area of Cox’s bazar, Patuakhali and Satkhirai district was 2,49,186 ha, 3,22,015 ha
and 3,81,729 respectively. The major share of forest area occupied 36.88% of total land area in
Cox’sbazar district whereas it was 6.69% in Patuakhali district 34.65% in Satkhira district. On the
other hand, highest cultivable land was found in Patuakhali district which was 63.23% and lowest
cultivable land was found in Cox’s bazar district which was 35.88% in total land area.
4
Table 6.2 Land utilization patterns of the three districts in coastal region
Particulars
Cox’sbazar Patuakhali Satkhira
Area (ha)
Percent Area (ha)
Percent Area (ha)
Percent
1 Total area 249186 100 322015 100 381729 100
2. Homestead and others ‐‐ ‐‐ ‐‐ ‐‐ 9270 2.43
3.Water body 33420 13.41 ‐‐ ‐‐ 3134 0.82
4. Forest area 91902 36.88 21550 6.69 132265 34.65
5. Cultivable land 89398 35.88 203601 63.23 229607 60.15
6. Single cropped 6100 2.45 50900 15.81 39523 10.35
7. Double cropped 58050 23.30 91620 28.45 103063 27.00
8.Triple cropped 20232 8.12 61081 18.97 45025 11.80
9.Four/more than three cropped 1500 0.60 0.00 1015 0.27
10. Fallow land 3516 1.41 11805 3.67 40981 10.74
11.Total cropped area 188896 75.81 417383 129.62 383784 100.54
12. Net cropped area 85882 34.47 203601 63.23 188626 49.41
13. Vegetables crops 12120 4.86 13605 4.22 16335 4.28
14. Cropping intensity (%) 220% 212% 204%
(Source: DAE, 2017)
Double cropped area was found highest in all the study area of coastal region rather than single
and triple cropped are.The vegetables crops covered 4.86% land in Cox’s bazar district, 4.22%
land in Patuakhali district and 4.22% land in Satkhira district. Highest cropping intensity was
found in Cox’s bazar district (220%) followed by Patuakhali (212%) and Satkhira district (202%).
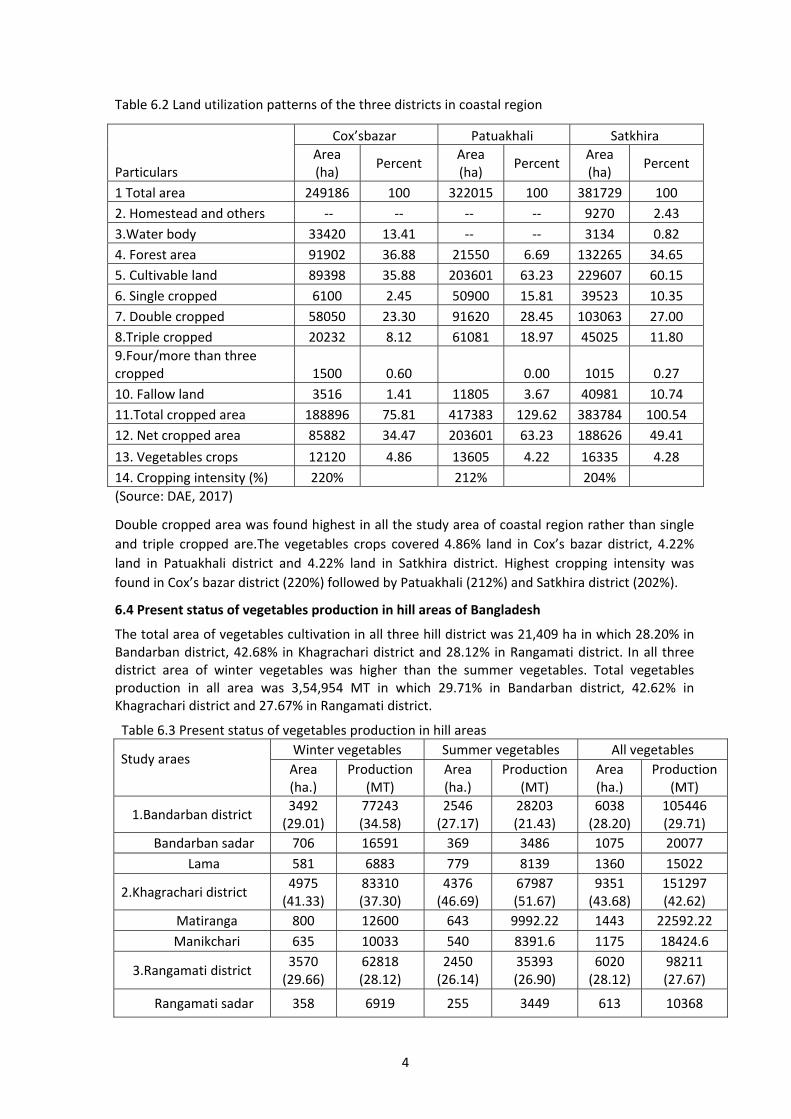
6.4 Present status of vegetables production in hill areas of Bangladesh
The total area of vegetables cultivation in all three hill district was 21,409 ha in which 28.20% in Bandarban district, 42.68% in Khagrachari district and 28.12% in Rangamati district. In all three district area of winter vegetables was higher than the summer vegetables. Total vegetables production in all area was 3,54,954 MT in which 29.71% in Bandarban district, 42.62% in Khagrachari district and 27.67% in Rangamati district.
Table 6.3 Present status of vegetables production in hill areas
Study araes
Winter vegetables Summer vegetables All vegetables
Area (ha.)
Production (MT)
Area (ha.)
Production (MT)
Area (ha.)
Production (MT)
1.Bandarban district 3492 (29.01)
77243 (34.58)
2546 (27.17)
28203 (21.43)
6038 (28.20)
105446 (29.71)
Bandarban sadar 706 16591 369 3486 1075 20077
Lama 581 6883 779 8139 1360 15022
2.Khagrachari district 4975 (41.33)
83310 (37.30)
4376 (46.69)
67987 (51.67)
9351 (43.68)
151297 (42.62)
Matiranga 800 12600 643 9992.22 1443 22592.22
Manikchari 635 10033 540 8391.6 1175 18424.6
3.Rangamati district 3570 (29.66)
62818 (28.12)
2450 (26.14)
35393 (26.90)
6020 (28.12)
98211 (27.67)
Rangamati sadar 358 6919 255 3449 613 10368

5
KawKhali 371 5990 475 7116 846 13106
Total (1+2+3) 12037 223371 9372 131583 21409 354954
(Source: DAE, 2017)
Fig 6.1 shows the areas of summer and winter vegetables produced in three study areas of hilly
region. It is observed from the fig 6.1 that highest area of winter and summer vegetables was
found in khagrachari district. Simultaneously highest production was also found in Khagrachari
district (fig 6.2)
Fig. 6.1 Area of winter and summer vegetables in Hilly areas
Fig. 6.2 Production of winter and summer vegetables in Hilly areas
6.5 Present status of vegetables production in Coastal areas of Bangladesh
The total area of vegetables cultivation in all three hill district was 42069 ha in which 28.82% in
Cox's bazar district, 32.35% in Patuakhal district and 38.84% in Satkhira district. The area and
production of winter vegetables were higher than the summer vegetables in all three districts.
Total vegetables production in all area was 8,94,839 MT in which 39.75% in Cox's bazar district,
27.53% in Patuakhal district and 32.72% in Satkhira district.
Table 6.4 Present status of vegetables production in coastal areas
Study area
Winter vegetables Summer vegetables All vegetables
Area (ha.)
Production (MT) Area (ha.)
Production (MT)
Area (ha.)
Production (MT)
Cox's bazar district 9620 (34.04)
320670 (46.16)
2500 (18.12)
35000 (17.49)
12120 (28.82)
355670 (39.75)
Cox's bazar sadar 2150 60200 150 1800 2300 62000
Chokoria 4500 148500 1200 20400 5700 168900
Patuakhal district 9500 (33.61)
199861 (28.77)
4105 (29.76)
46496 (23.23)
13605 (32.35)
246357 (27.53)
Galachipa 1450 29087 400 4930 1850 34017
Kolapara 2777 60055 840 8613 3617 68668
Satkhira district 9145 (32.35)
174177 (25.07)
7190 (52.12)
118635 (59.28)
16335 (38.84)
292812 (32.72)

6
Ashashuni 620 11620 515 7922 1135 19542
Shamnagar 680 11044 520 8530 1200 19574
Total (1+2+3) 28265 694708 13795 200131 42060 894839
(Source: DAE, 2017)
It is observed from the fig 6.4 highest area of winter vegetables was found in cox’s bazar district and highest area of summer vegetables were found in satkhira district. On the other hand highest production of winter vegetables and lowest production of summer vegetables were found in cox’s bazar district and highest production of summer vegetables were found in Satkhira district.
7. Sub‐project goal: Improve production and marketing system of vegetables by removing
constraints of supply chain in hilly and coastal region.
8. Sub‐project objective (s):
I. To analyze input supply, production system and profitability of major vegetables in hilly
and coastal region;
II. To examine the existing market, marketing system and supply chain of selected
vegetables in those areas;
III. To identify the constraints to production, marketing and urban market linkage of
vegetables and suggest some policy recommendations for improving the vegetables
supply chain.
9. Sub‐project implementation location (s)
The study was implemented in Rangamati, Khagrachari and Bandarban district of hilly region
and Patuakhali, Satkhira and Coxs Bazar district of coastal region.
10. Methodology Research methodology is an arrangement of the essential conditions for collection and analysis of data in a form that aims to combine relevance to research purpose. The reliability of research depends on the proper methodology used in the study. The adopted methodology for the study is stated in this section.
9620 9500 9145
2500
4105
7190
0
2000
4000
6000
8000
10000
12000
Cox's bazar Patuakhali Satkhira
Area(ha.)
Winter vegetables Summer vegetables
320670
199861174177
35000 46496
118635
0
100000
200000
300000
400000
Cox's bazar Patuakhali Satkhira
Production(M
T)
Winter vegetables Summer vegetables
Fig 6.3 Area of winter and summer vegetables in
coastal areas
Fig 6.4 Production of winter and summer
vegetables in coastal areas
7
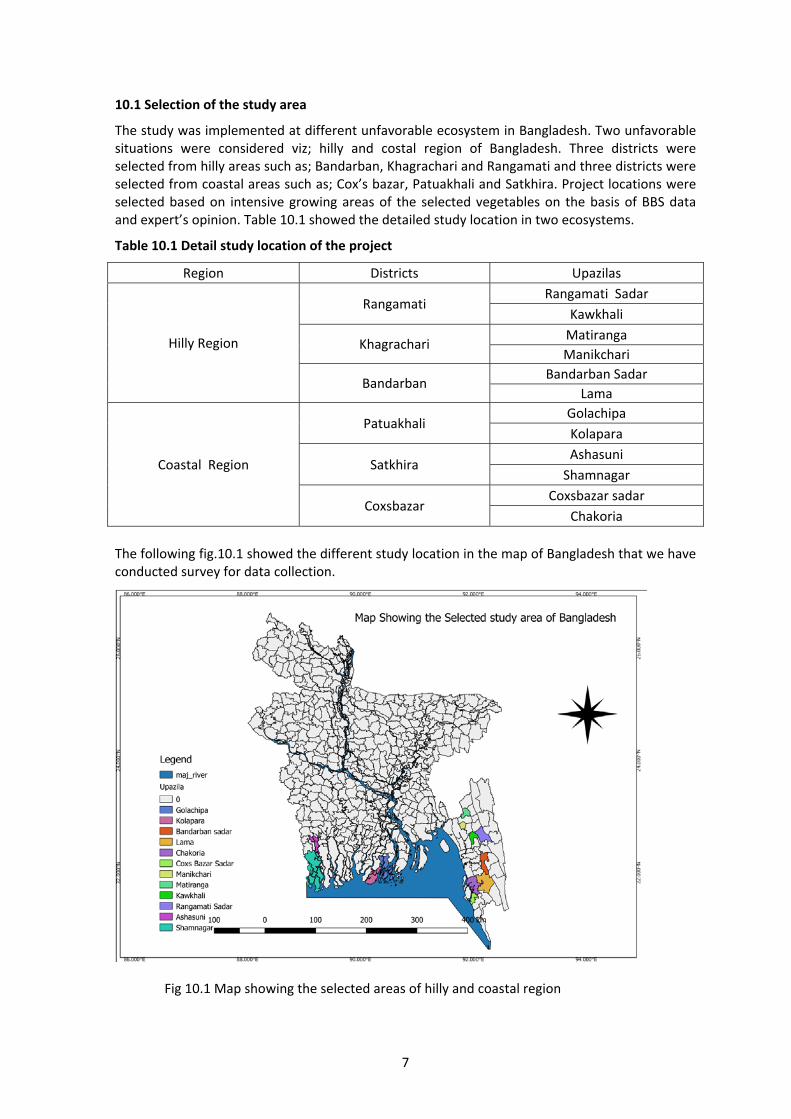
10.1 Selection of the study area
The study was implemented at different unfavorable ecosystem in Bangladesh. Two unfavorable situations were considered viz; hilly and costal region of Bangladesh. Three districts were selected from hilly areas such as; Bandarban, Khagrachari and Rangamati and three districts were selected from coastal areas such as; Cox’s bazar, Patuakhali and Satkhira. Project locations were selected based on intensive growing areas of the selected vegetables on the basis of BBS data and expert’s opinion. Table 10.1 showed the detailed study location in two ecosystems.
Table 10.1 Detail study location of the project
Region Districts Upazilas
Hilly Region
Rangamati Rangamati Sadar
Kawkhali
Khagrachari Matiranga
Manikchari
Bandarban Bandarban Sadar
Lama
Coastal Region
Patuakhali Golachipa
Kolapara
Satkhira Ashasuni
Shamnagar
Coxsbazar Coxsbazar sadar
Chakoria
The following fig.10.1 showed the different study location in the map of Bangladesh that we have conducted survey for data collection.
Fig 10.1 Map showing the selected areas of hilly and coastal region

8
10.2 Selection of Vegetables
Four important vegetables, taking two from hilly area and another two from coastal area were selected for the study. The selected vegetables were brinjal and yard long bean from hilly region and bittergourd and cucumber from coastal region of Bangladesh. The vegetables were selected on the basis of intensively and stressfully growing in that unfavorable ecosystem. The vegetables were selected which are mostly fitted for those location and its production technology and supply chain were taken into consideration. The selections of vegetable were finalized after pre‐test. 10.3 Sampling Technique
The intended stakeholders were vegetable growers and vegetable traders (i.e. Bepari, Arathdar, Retailers). Multistage simple random sampling techniques were adopted for selecting the reasonable numbers of stakeholders involved in vegetable supply chain. Multi‐stage sampling technique was followed for location selection and simple random sampling was used for sample respondent selection.
10.4 Sample size
A total of 600 vegetable growers (6 district x 2 vegetables x 2 upazila x 25 farmers) and 480 intermediaries (6 districts x 2 vegetables x 40 traders) taking 10 Famrmer‐cum retailer, 8 beparis, 8 paiker‐cum‐retailer, 10 retailers and 04 arathdar (commission agent) from both primary and secondary markets were randomly selected for each vegetables. Sixty (60) traders of selected vegetables from Chattagram terminal market were interviewed. Thus the total sample size for the study was 1140 (600 farmers + 540 traders).
Table 10.2 Sample distribution of the study
Region Study area
Vegetables name
Producer Intermediaries Total sample
A. Hilly Area
Rangamati Brinjal, Yard long bean
100 80 180
Khagrachari Brinjal, Yard long bean
100 80 180
Bandarban Brinjal, Yard long bean
100 80 180
B. Coastal Area
Patuakhali Bittergourd, Cucumber
100 80 180
Coxs Bazar Bittergourd, Cucumber
100 80 180
Satkhira Bittergourd, Cucumber
100 80 180
C. Terminal Market
Riazuddin Bazar, Chattagram
All selected Vegetables
‐‐ 60 60
Total sample
600 540 1140
10.5 Data and Information
Both primary and secondary data and information were required for the project. Primary data related to producer and traders were gathered from field level through questionnaire survey from the aforesaid locations. The data were collected on production cost, profits, supply chain, marketing cost, marketing margins, marketing constraints, etc from the farmers and traders. Secondary data and information relating to different statistics of area, yield, production, market
9
price, and other relevant data were gathered from various published sources (e.g. BBS, FAOStat, journal, research reports, thesis, etc.) through an in‐depth literature review.
10.6 Method of data collection
Primary data were collected from the selected respondents through face to face interview
method. Scientific officers/ Scientific Assistants were responsible for data collection. They
collected data from selected farmers and traders with the supervision of principal investigator.
10.7 Preparation of interview schedule
Two sets of interview schedules were prepared for collecting desired data from the growers and
traders. The interview schedules were pre‐tested for judging their suitability. After pre‐testing,
the schedules were finalized and printed.
10.8 Analytical Techniques
10.8.1 Profitability at producers’ level: The Following profit equation (1) was used to assess the profitability of vegetables cultivation. Net return from vegetables cultivation;
πijk= Pijk.Qijk‐(TVCijk+TFCijk)……………………………(1) Where, π= Net return from ith vegetables per hectare
Pijk= Per unit price of ith vegetables (Tk/kg)
Qijk= Quantity of ith vegetables (kg/ha)
TVCijk = Total variable cost of ith vegetables (Tk/ha)
TFCijk= Total fixed cost of ith vegetables (Tk/ha)
i (1..4)= number of crops,
j (1..6)= number of location,
k (1…..600) = number of farmers.
10.8.2 Net marketing margin at traders’ level: The following profit equation (2) was used for calculating net margin at traders’ level. Π = GM‐MC …………………………………………………………….. (2)
Where, Π = Traders’ profit (Tk/) GM = Gross margin (Tk/quintql)
MC = Marketing cost (Tk/quintal) 10.8.3 Measurement of marketing efficiency: Rajagopal (1986) and Chauhanet al., (1994) also used six performance indicators for measuring marketing efficiency of a specific product. The indicators are (i) producer's share to the consumer’s price, (ii) relative marketing cost, (iii) level of middlemen margin, (iv) deviation between the minimum and maximum prices, (v) peak period seasonal price variability, and (vi) lean period seasonal price variability. Out of six performance indicators four indicators were used in this study on the basis of available data and information. The producers’ share was derived by the ratio of net average price received by the producer to the weighted average price of vegetables. It was calculated with the following formula and the channel which had highest producer’s share was ranked 1 as first and vice ‐versa. It was calculated with the following formula (3):

10
Percentage of producer’s share = 100
ri
pi
P
P
Where, Pp i = Producers’ share Pri = Average price of vegetables at the retail level in each channel. i = Number of channels ( i = 1, 2, ‐‐‐‐‐‐, n)
The cost of marketing was calculated and the lowest cost marketing channel was ranked 1 and that which has highest cost as the last. The same approach was followed in ranking the margin of middlemen in each channel. The deviation (d) between the highest and lowest prices in each month in the respective channels was computed. The price equalization among all the categories of farmers denote d = 0. That is, there is no price deviation among the farmers’ prices .If the differences are high it implies highest price deviation and vice‐versa. The seasonal movements of prices will be studied by adopting the simple standard deviation (δ). The following equation (4) will be used in the study.
21PPW
T tt
Where, Where, δ = Standard deviation P = Average price of vegetables of the season in each channel, Pt = Average farm price for the agricultural year, T = Total month in the year. Sales during the month in each channel (St) Wt = Sum of the sales during the month in all channels St = i
th month Sit = i
th channel of tth month
The entire season has been divided in two periods. The peak period and lean period in each agricultural year.
The final ranking of all the four indicators of all channels were computed by using the composite index formula (8). The lowest value of indicator mean represents relatively the most efficient channel and vice versa (Rajagopal, 1986).
i
i
N
RR
Where, Ri = Total value of ranks of all indicators ( I1‐‐‐‐‐‐ I6) all channels Ni = Number of indicators.
(3)
(4)
(5)
11
11. Results and discussion The results and discussion of the study were presented sequentially in the chapter 11.1 to chapter 11.7 according to fulfil and better understanding of the objectives of the project.
CHAPTER 11.1
AVAILABILITY AND DISTRIBUTION SYSTEM OF AGRICULTURAL INPUT
Agricultural inputs uses pattern and its availability is very important for the production process of vegetables. Generally agricultural inputs refer to seed, fertilizer, pesticides and others production factors of production. Efficient production mostly depends on availability and judicious uses of inputs and its proper distribution system. Vegetables cultivation required those types of inputs 2‐3 times higher than cereals crops. This chapter discussed the different types of input, its sources, and distribution system in the study areas of Bangladesh.
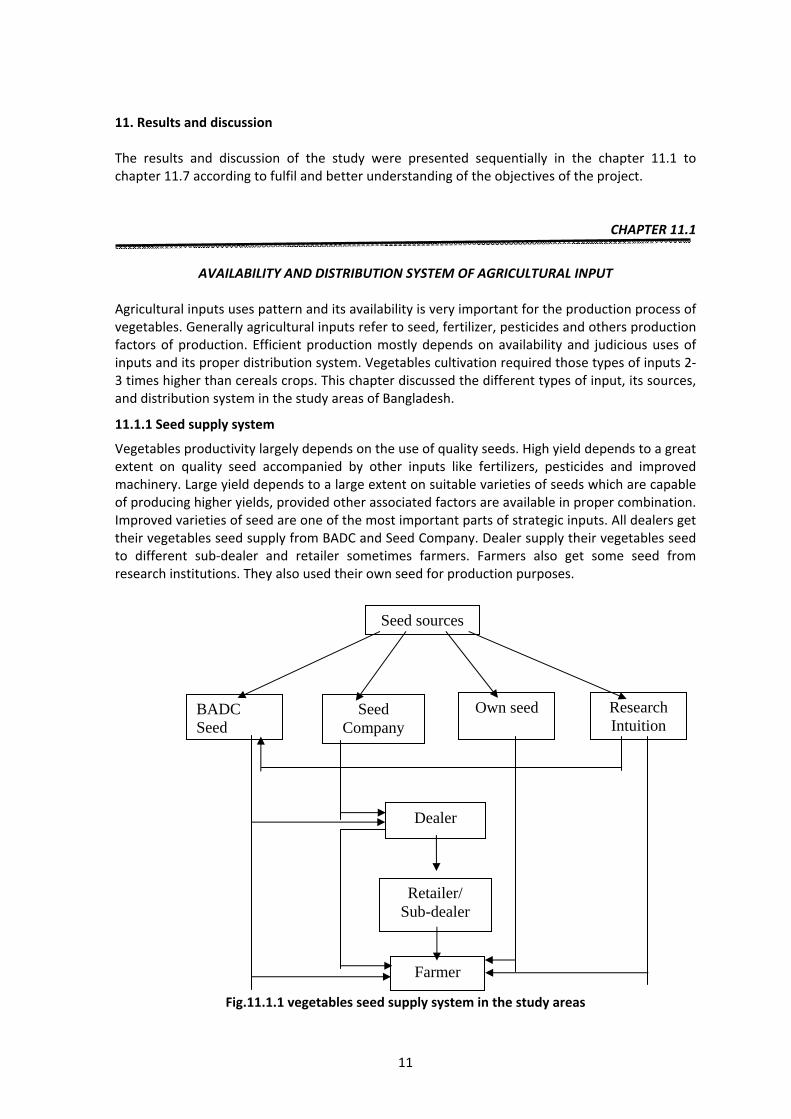
11.1.1 Seed supply system
Vegetables productivity largely depends on the use of quality seeds. High yield depends to a great extent on quality seed accompanied by other inputs like fertilizers, pesticides and improved machinery. Large yield depends to a large extent on suitable varieties of seeds which are capable of producing higher yields, provided other associated factors are available in proper combination. Improved varieties of seed are one of the most important parts of strategic inputs. All dealers get their vegetables seed supply from BADC and Seed Company. Dealer supply their vegetables seed to different sub‐dealer and retailer sometimes farmers. Farmers also get some seed from research institutions. They also used their own seed for production purposes.
Fig.11.1.1 vegetables seed supply system in the study areas
Seed sources
BADC Seed
Seed Company
Own seed Research Intuition
Dealer
Retailer/ Sub-dealer
Farmer

12
11.1.2 Sources of seed in hilly areas
Major sources of vegetables seeds in the hilly areas were own seed, retailer, sub‐dealer and
dealer. Dealers are the company appointed traders whereas sub‐dealers works under dealer and
retailers collect seeds from dealers or sub‐dealers for selling seed to the farmers. Sometimes sub‐
dealers works as a retailer. Majority of the brinjal farmers purchased seed/seedling from retailer
or sub‐dealers (55%) followed by own source (30%), dealer (15%) in all area. Whereas in case of
yard long bean about 53% farmers purchase seed from retailer or sub‐dealers, 23% farmers used
own seed and 25% farmers purchase seed from different dealer. All three district of Chattagram
hill tracts majority of farmers purchased selected vegetables seed from retailer or sub‐dealer
(Table 11.1.1).
Table 11.1.1 Sources of seed in hilly areas
Particulars % of responses
Brinjal
Seed sources Bandarban Khagrachari Rangamati All area
Own 26 36 28 30
Retailer or Sub‐dealer 60 50 54 55
Dealer 14 14 18 15
Seed sources Yard long bean
Bandarban Khagrachari Rangamati All area
Own 20 22 26 23
Retailer or Sub‐dealer 56 50 52 53
Dealer 24 28 22 25
11.1.3 Sources of seed in Coastal areas
In coastal belt of Bangladesh major sources of vegetables seeds were also own seed, retailer, sub‐
dealer and dealer. Majority of the bittergourd farmers purchased seed/seedling from retailer or
sub‐dealers (44%) followed by dealer (37%), own sources (19%), in all selected coastal areas of
Bangladesh. Whereas in case of cucumber about 45% farmers purchase seed from retailer or sub‐
dealers, 39% farmers purchase from
88different dealer and 25% farmers used own seed. All three districts in coastal belt majority of
the farmers purchased selected vegetables seed from retailer or sub‐dealer followed by different
dealer (Table 11.1.2).
Table 11.1.2 Sources of seed in Coastal areas
Particulars % of responses
Bittergourd
Seed sources Cox’s bazar Patuakhali Satkhira All area
Own 20 18 20 19
Retailer/sub‐dealer 48 40 44 44
Dealer 32 42 36 37
Seed sources Cucumber
Cox’s bazar Patuakhali Satkhira All area
Own 18 14 16 16
Retailer/sub‐dealer 48 40 48 45
Dealer 34 46 36 39
13
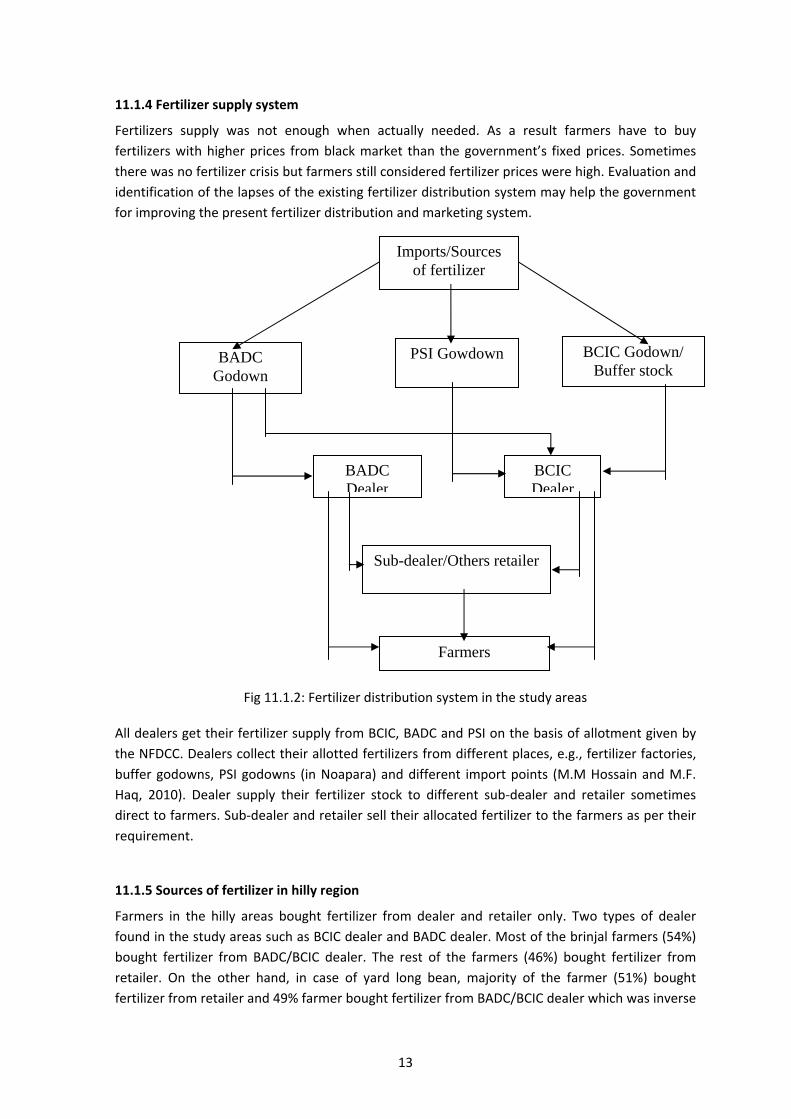
11.1.4 Fertilizer supply system
Fertilizers supply was not enough when actually needed. As a result farmers have to buy
fertilizers with higher prices from black market than the government’s fixed prices. Sometimes
there was no fertilizer crisis but farmers still considered fertilizer prices were high. Evaluation and
identification of the lapses of the existing fertilizer distribution system may help the government
for improving the present fertilizer distribution and marketing system.
Fig 11.1.2: Fertilizer distribution system in the study areas
All dealers get their fertilizer supply from BCIC, BADC and PSI on the basis of allotment given by
the NFDCC. Dealers collect their allotted fertilizers from different places, e.g., fertilizer factories,
buffer godowns, PSI godowns (in Noapara) and different import points (M.M Hossain and M.F.
Haq, 2010). Dealer supply their fertilizer stock to different sub‐dealer and retailer sometimes
direct to farmers. Sub‐dealer and retailer sell their allocated fertilizer to the farmers as per their
requirement.
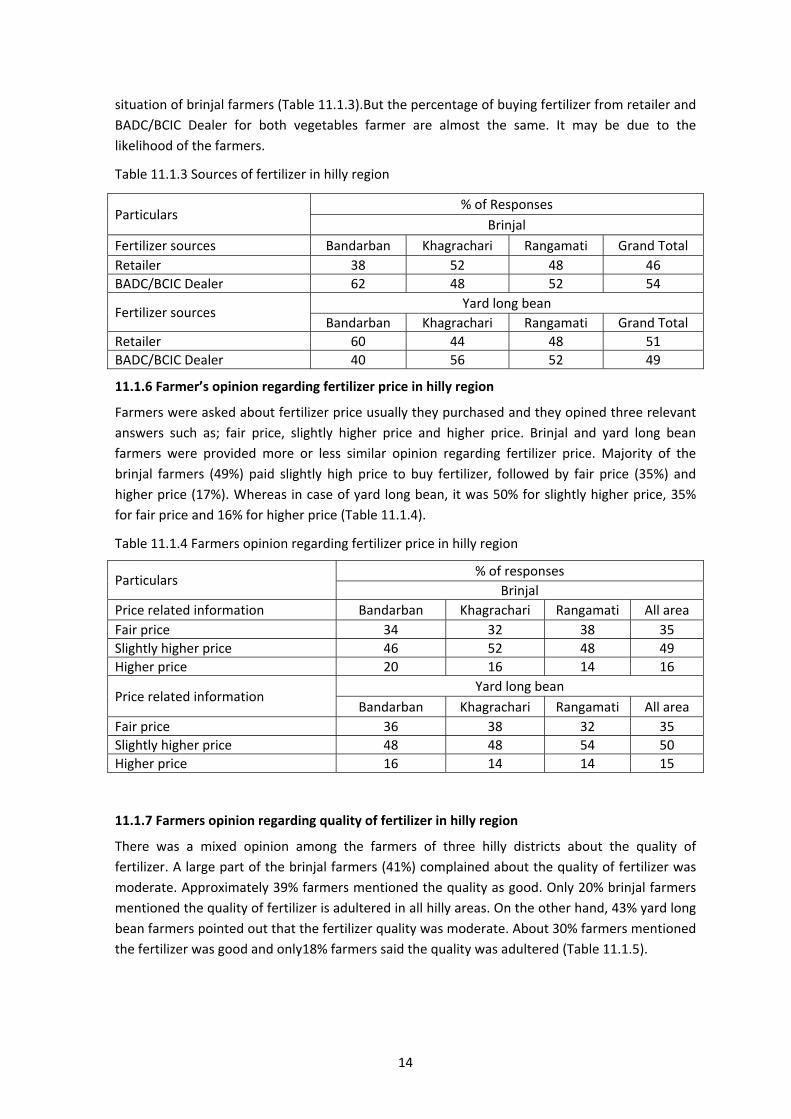
11.1.5 Sources of fertilizer in hilly region
Farmers in the hilly areas bought fertilizer from dealer and retailer only. Two types of dealer
found in the study areas such as BCIC dealer and BADC dealer. Most of the brinjal farmers (54%)
bought fertilizer from BADC/BCIC dealer. The rest of the farmers (46%) bought fertilizer from
retailer. On the other hand, in case of yard long bean, majority of the farmer (51%) bought
fertilizer from retailer and 49% farmer bought fertilizer from BADC/BCIC dealer which was inverse
Imports/Sources of fertilizer
BADC Godown
Sub-dealer/Others retailer
Farmers
BADC Dealer
BCIC Dealer
BCIC Godown/ Buffer stock
PSI Gowdown
14
situation of brinjal farmers (Table 11.1.3).But the percentage of buying fertilizer from retailer and
BADC/BCIC Dealer for both vegetables farmer are almost the same. It may be due to the
likelihood of the farmers.
Table 11.1.3 Sources of fertilizer in hilly region
Particulars % of Responses
Brinjal
Fertilizer sources Bandarban Khagrachari Rangamati Grand Total
Retailer 38 52 48 46
BADC/BCIC Dealer 62 48 52 54
Fertilizer sources Yard long bean
Bandarban Khagrachari Rangamati Grand Total
Retailer 60 44 48 51
BADC/BCIC Dealer 40 56 52 49
11.1.6 Farmer’s opinion regarding fertilizer price in hilly region
Farmers were asked about fertilizer price usually they purchased and they opined three relevant
answers such as; fair price, slightly higher price and higher price. Brinjal and yard long bean
farmers were provided more or less similar opinion regarding fertilizer price. Majority of the
brinjal farmers (49%) paid slightly high price to buy fertilizer, followed by fair price (35%) and
higher price (17%). Whereas in case of yard long bean, it was 50% for slightly higher price, 35%
for fair price and 16% for higher price (Table 11.1.4).
Table 11.1.4 Farmers opinion regarding fertilizer price in hilly region
Particulars % of responses
Brinjal
Price related information Bandarban Khagrachari Rangamati All area
Fair price 34 32 38 35
Slightly higher price 46 52 48 49
Higher price 20 16 14 16
Price related information Yard long bean
Bandarban Khagrachari Rangamati All area
Fair price 36 38 32 35
Slightly higher price 48 48 54 50
Higher price 16 14 14 15
11.1.7 Farmers opinion regarding quality of fertilizer in hilly region
There was a mixed opinion among the farmers of three hilly districts about the quality of
fertilizer. A large part of the brinjal farmers (41%) complained about the quality of fertilizer was
moderate. Approximately 39% farmers mentioned the quality as good. Only 20% brinjal farmers
mentioned the quality of fertilizer is adultered in all hilly areas. On the other hand, 43% yard long
bean farmers pointed out that the fertilizer quality was moderate. About 30% farmers mentioned
the fertilizer was good and only18% farmers said the quality was adultered (Table 11.1.5).

15
Table 11.1.5 Farmers opinion regarding quality of fertilizer in hilly region
Particular % of responses
Brinjal
Fertilizer quality Bandarban Khagrachari Rangamati All area
Good 38 44 34 39
Moderate 42 32 50 41
Adultered 20 24 16 20
Fertilizer quality Yard long bean
Bandarban Khagrachari Rangamati All area
Good 44 34 40 39
Moderate 32 52 44 43
Adultered 24 14 16 18
11.1.8 Sources of fertilizer in coastal area
Farmers in the coastal areas bought fertilizer from dealer (BCIC and BADC) and retailer only. Two
types of dealer found in the coastal areas such as BCIC dealer and BADC dealer. Majority of the
bittergourd farmers (69%) bought fertilizer from BADC/BCIC dealer. The rest of the farmers (31%)
bought fertilizer from retailer. On the other hand, in case of cucumber, majority of the farmer
(67%) bought fertilizer from BADC/BCIC dealer and 33% farmer bought fertilizer from retailer
which was slightly diverge situation from hilly farmers (Table 11.1.6).
Table 11.1.6 Sources of fertilizer in coastal area
Particulars % of respondents
Bittergourd
Fertilizer sources Cox's bazar Patuakhali Satkhira All area
Retailer 38 24 32 31
BADC/BCIC dealer 62 76 68 69
Fertilizer sources Cucumber
Cox's bazar Patuakhali Satkhira All area
Retailer 40 28 30 33
BADC/BCIC dealer 60 72 70 67
11.1.9 Farmer’s opinion regarding fertilizer price in coastal region
Farmers were asked about their opinion regarding fertilizer price in coastal areas. They opined
three relevant answers such as; fair price, slightly higher price and higher price. Majority of the
bittergourd farmers (53%) paid slightly high price to buy fertilizer, followed by fair price (35%)
and higher price (12%). Whereas in case of cucumber farmers, it was 20% for slightly higher price,
46% for fair price and 34% for higher price which was much different from bittergourd farmers
(Table 11.1.7).
Table 11.1.7 Farmers opinion regarding fertilizer price in coastal region
Particulars % of responses
Bittergourd
Fertilizer prices Cox's bazar Patuakhali Satkhira All area
Fair price 44 34 26 35
Slightly higher price 38 58 64 53
Higher price 18 8 10 12
Fertilizer prices Cucumber
16
Cox's bazar Potuakhali Satkhira All area
Fair price 36 48 54 46
Slightly higher price 18 20 22 20
Higher price 46 32 24 34
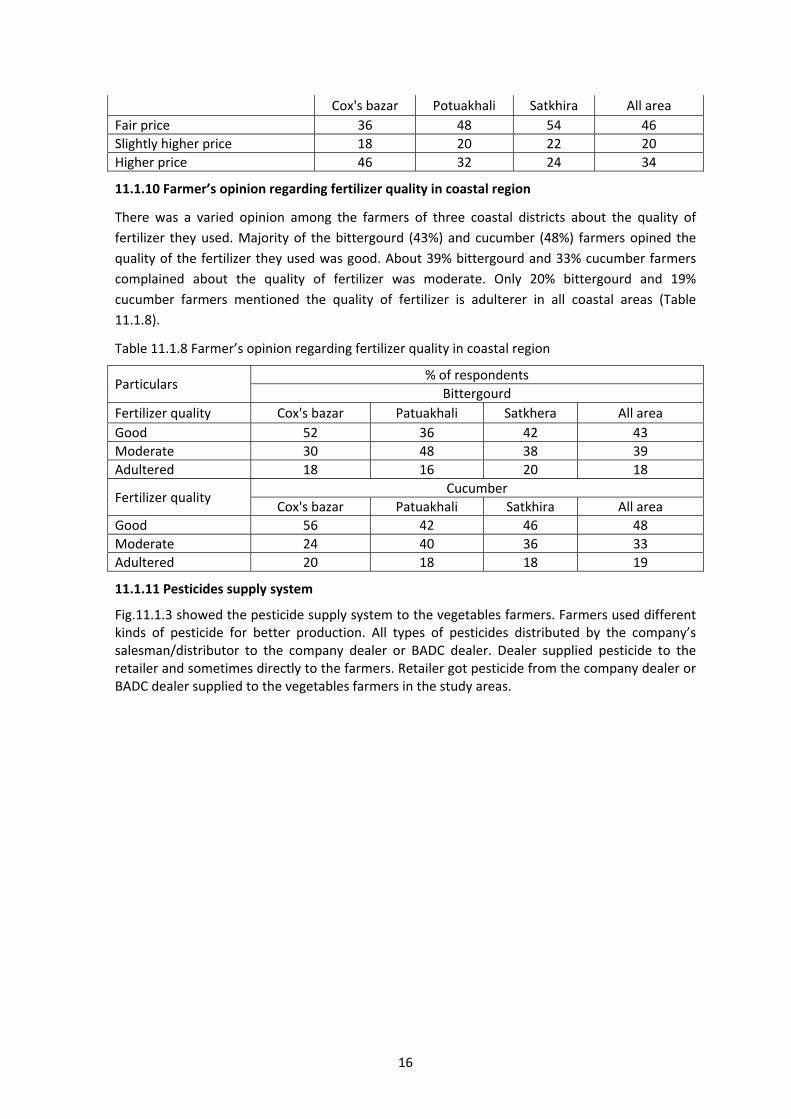
11.1.10 Farmer’s opinion regarding fertilizer quality in coastal region
There was a varied opinion among the farmers of three coastal districts about the quality of
fertilizer they used. Majority of the bittergourd (43%) and cucumber (48%) farmers opined the
quality of the fertilizer they used was good. About 39% bittergourd and 33% cucumber farmers
complained about the quality of fertilizer was moderate. Only 20% bittergourd and 19%
cucumber farmers mentioned the quality of fertilizer is adulterer in all coastal areas (Table
11.1.8).
Table 11.1.8 Farmer’s opinion regarding fertilizer quality in coastal region
Particulars % of respondents
Bittergourd
Fertilizer quality Cox's bazar Patuakhali Satkhera All area
Good 52 36 42 43
Moderate 30 48 38 39
Adultered 18 16 20 18
Fertilizer quality Cucumber
Cox's bazar Patuakhali Satkhira All area
Good 56 42 46 48
Moderate 24 40 36 33
Adultered 20 18 18 19
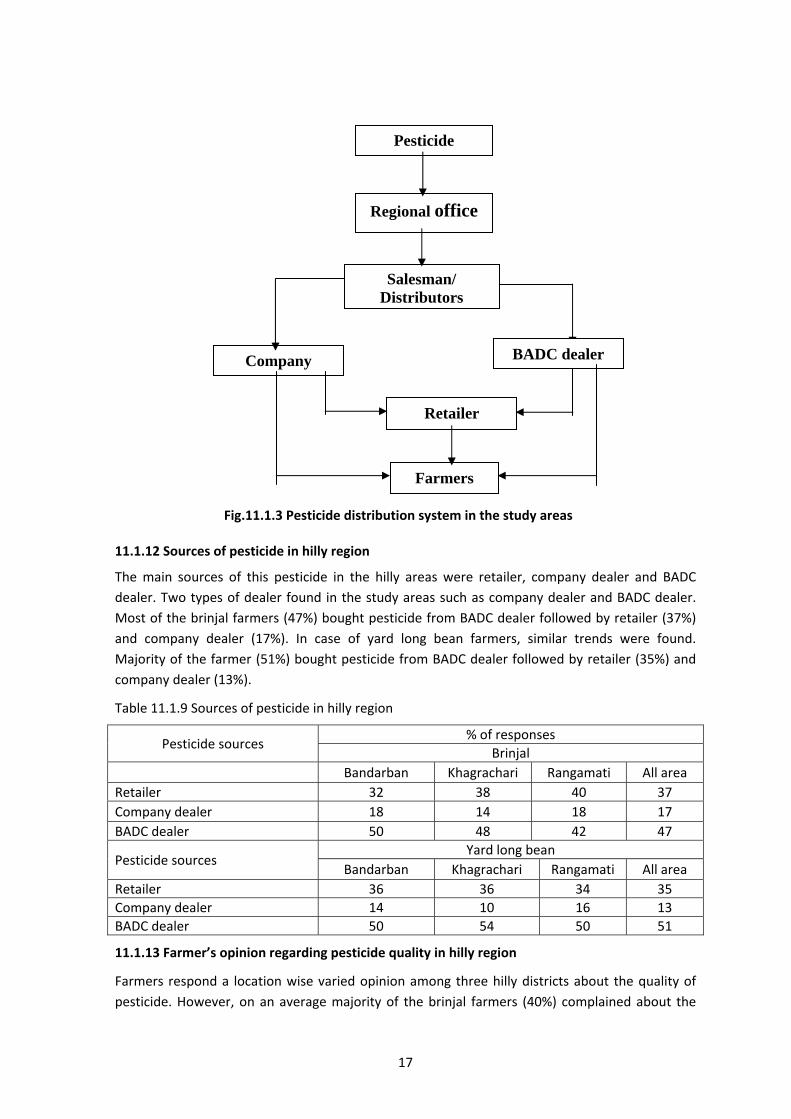
11.1.11 Pesticides supply system
Fig.11.1.3 showed the pesticide supply system to the vegetables farmers. Farmers used different kinds of pesticide for better production. All types of pesticides distributed by the company’s salesman/distributor to the company dealer or BADC dealer. Dealer supplied pesticide to the retailer and sometimes directly to the farmers. Retailer got pesticide from the company dealer or BADC dealer supplied to the vegetables farmers in the study areas.
17
Fig.11.1.3 Pesticide distribution system in the study areas 11.1.12 Sources of pesticide in hilly region
The main sources of this pesticide in the hilly areas were retailer, company dealer and BADC
dealer. Two types of dealer found in the study areas such as company dealer and BADC dealer.
Most of the brinjal farmers (47%) bought pesticide from BADC dealer followed by retailer (37%)
and company dealer (17%). In case of yard long bean farmers, similar trends were found.
Majority of the farmer (51%) bought pesticide from BADC dealer followed by retailer (35%) and
company dealer (13%).
Table 11.1.9 Sources of pesticide in hilly region
Pesticide sources % of responses
Brinjal
Bandarban Khagrachari Rangamati All area
Retailer 32 38 40 37
Company dealer 18 14 18 17
BADC dealer 50 48 42 47
Pesticide sources Yard long bean
Bandarban Khagrachari Rangamati All area
Retailer 36 36 34 35
Company dealer 14 10 16 13
BADC dealer 50 54 50 51
11.1.13 Farmer’s opinion regarding pesticide quality in hilly region
Farmers respond a location wise varied opinion among three hilly districts about the quality of
pesticide. However, on an average majority of the brinjal farmers (40%) complained about the
Pesticide
Salesman/ Distributors
Farmers
Retailer
Company
Regional office
BADC dealer

18
quality of pesticide was moderate. Approximately 37% farmers mentioned the quality was good.
Only 23% brinjal farmers mentioned the quality of pesticide is adultered in the hilly areas. On the
other hand, 48% yard long bean farmers mentioned that the pesticide quality was moderate.
About 33% farmers stated the pesticide quality was good and only19% farmers said the quality
was adultered (Table 11.1.10).
Table 11.1.10 Farmer’s opinion regarding pesticide quality in hilly region
Particulars % of responses
Brinjal
Pesticide quality Bandarban Khagrachari Rangamati All area
Good 38 38 36 37
Moderate 38 36 46 40
Adultered 24 26 18 23
Pesticide quality Yard long bean
Bandarban Khagrachari Rangamati All area
Good 36 30 34 33
Moderate 44 54 46 48
Adultered 20 16 20 19
11.1.14 Sources of pesticide in coastal region
Similar sources of pesticide were also found in coastal area but pesticide buying frequency was
found different from the hilly areas. Here most of the farmers bought pesticide from retailer
rather than dealer. About 59% bittergourd farmers bought pesticide from retailer followed by
BADC dealer (26%) and company dealer (15%). In case of cucumber farmers, similar trends were
found. Majority of the farmer (56%) bought pesticide from retailer followed by BADC dealer
(29%) and company dealer (15%) (Table 11.1.11).
Table 11.1.11 Sources of pesticide in coastal region
Particulars % of responses
Bittergourd
Pesticide sources cox's bazar Patuakhali Satkhira Grand Total
Retailer 58 62 56 59
Company dealer 16 10 20 15
BADC dealer 26 28 24 26
Pesticide sources Cucumber
cox's bazar Patuakhali Satkhira Grand Total
Retailer 54 60 54 56
Company dealer 16 16 12 15
BADC dealer 30 24 34 29
11.1.15 Farmer’s opinion regarding pesticide quality in coastal region
Table 11.1.12 showed the farmers opinion regarding pesticide quality in coastal area and the
trends of farmer’s statement slightly different from those of hilly areas. Here on an average
majority of the bittergourd farmers (43%) opined about the quality of pesticide was good. About
29% bittergourd farmers mentioned the quality of pesticide is moderate and adultered
separately. On the other hand, 41% cucumber farmers mentioned that the pesticide quality was

19
good. About 35% farmers stated that the pesticide quality was moderate and only 25% farmers
said the quality was adultered in the coastal area.
Table 11.1.12 Farmer’s opinion regarding pesticide quality in coastal area
Particulars % of responses
Bittergourd
Pesticide quality cox's bazar Patuakhali Satkhira Grand Total
Good 48 38 42 43
Moderate 26 32 28 29
Adulterate 26 30 30 29
Pesticide quality Cucumber
cox's bazar Patuakhali Satkhira Grand Total
Good 46 34 42 41
Moderate 30 44 30 35
Adulterate 24 22 28 25
CHAPTER 11.2
PROFITABILITY OF SELECTED VEGETABLES IN HILLY AND COASTAL REGION
Cost and return analysis is very important to find out the profitability of crop cultivation and for
determination of acceptance of a crop. Profitability analysis of selected vegetables was done in
two unfavorable ecosystems to identify whether it is profitable or not. This chapter contains the
different cultivation methods, input use patterns, cost of cultivation, net return, and benefit cost
ratio in the study areas.
11.2.1 Profitability Analysis of Selected Crops in Hilly Region Mainly two vegetables crops were selected for profitability analysis to justify the rationality of
vegetables cultivation in hilly region. Vegetables cultivation in hilly region was very difficult due
to unfavorable ecosystem in those areas. Farmers have to face various difficulties for producing
vegetables in hilly region such as uneven topography, acute irrigation water, low yield, less
accessible market etc. But farmers get satisfactory market price of vegetables due to vegetables
market were deficit in local production. Generally, three types of cultivation were found in hilly
region.
11.2.1.1 Homestead cultivation
11.2.1.2 Plain land cultivation
11.2.1.3 Jhum cultivation
11.2.1.1 Homestead cultivation
Homestead areas were found to be properly utilized by the sample household in the study areas.
They grow different types of vegetables such as country bean, bottle gourd, brinjal, ginger,
potato, maize, snake gourd, ridge gourd, white gourd, bitter gourd, yellow pumpkin, arum,
radish, tomato, chili, bean, red amaranth, Indian spinach, okra, cucumber, turmeric and many
20
other crops in their homestead on a small‐scale. They fulfilled their daily requirement by the
homestead production and not cultivated as commercial purposes. So cost and return analysis
was ignored in case of homestead cultivation.
11.2.1.2 Plain land cultivation
11.2.1.2.1 Input use, cost and return of brinjal cultivation
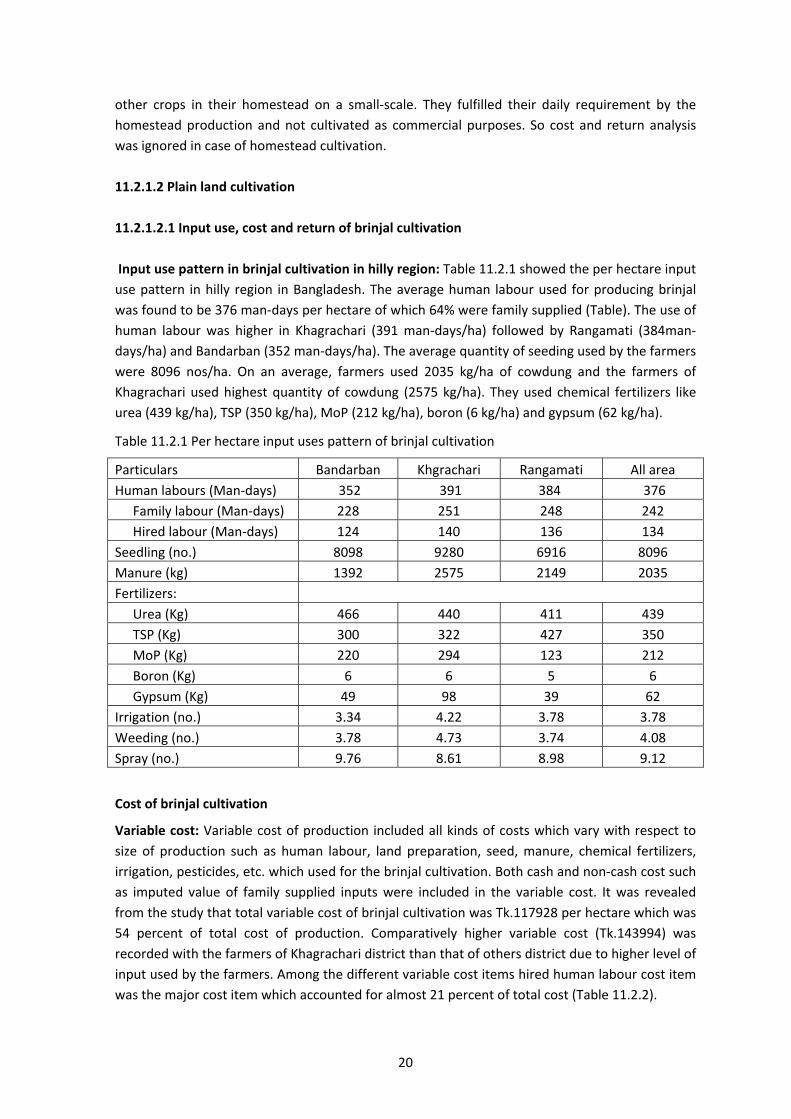
Input use pattern in brinjal cultivation in hilly region: Table 11.2.1 showed the per hectare input
use pattern in hilly region in Bangladesh. The average human labour used for producing brinjal
was found to be 376 man‐days per hectare of which 64% were family supplied (Table). The use of
human labour was higher in Khagrachari (391 man‐days/ha) followed by Rangamati (384man‐
days/ha) and Bandarban (352 man‐days/ha). The average quantity of seeding used by the farmers
were 8096 nos/ha. On an average, farmers used 2035 kg/ha of cowdung and the farmers of
Khagrachari used highest quantity of cowdung (2575 kg/ha). They used chemical fertilizers like
urea (439 kg/ha), TSP (350 kg/ha), MoP (212 kg/ha), boron (6 kg/ha) and gypsum (62 kg/ha).
Table 11.2.1 Per hectare input uses pattern of brinjal cultivation
Particulars Bandarban Khgrachari Rangamati All area
Human labours (Man‐days) 352 391 384 376
Family labour (Man‐days) 228 251 248 242
Hired labour (Man‐days) 124 140 136 134
Seedling (no.) 8098 9280 6916 8096
Manure (kg) 1392 2575 2149 2035
Fertilizers:
Urea (Kg) 466 440 411 439
TSP (Kg) 300 322 427 350
MoP (Kg) 220 294 123 212
Boron (Kg) 6 6 5 6
Gypsum (Kg) 49 98 39 62
Irrigation (no.) 3.34 4.22 3.78 3.78
Weeding (no.) 3.78 4.73 3.74 4.08
Spray (no.) 9.76 8.61 8.98 9.12
Cost of brinjal cultivation
Variable cost: Variable cost of production included all kinds of costs which vary with respect to
size of production such as human labour, land preparation, seed, manure, chemical fertilizers,
irrigation, pesticides, etc. which used for the brinjal cultivation. Both cash and non‐cash cost such
as imputed value of family supplied inputs were included in the variable cost. It was revealed
from the study that total variable cost of brinjal cultivation was Tk.117928 per hectare which was
54 percent of total cost of production. Comparatively higher variable cost (Tk.143994) was
recorded with the farmers of Khagrachari district than that of others district due to higher level of
input used by the farmers. Among the different variable cost items hired human labour cost item
was the major cost item which accounted for almost 21 percent of total cost (Table 11.2.2).

21
Fixed cost: Family labour and rental value of land was considered as fixed cost of production. The
cost of these items was Tk. 84093 and Tk.17292 per hectare respectively which was accounted
for about 46 percent of total cost of production. The highest family labour (Tk.88579/ha) was
found in Bandarban district. Rental value of land (Tk.18525/ha) was also found highest in
Bandarban district (Table 11.2.2).
Total cost: Total cost of production included variable costs and fixed costs incurred for brinjal
cultivation. On an average, total cost of production for brinjal was Tk.219312 per hectare.
Considering average level of farm location highest total cost was found in Khagrachari district
which was Tk.247579/ha) and lowest in rangamati district which was Tk.203831 per hectare
(Table 11.2.2).
Table 11.2.2 Per hectare cost of brinjal cultivation (Tk./ha)
Particulars Bandarban Khagrachari Rangamati All Area % of total
cost
A. Variable cost
Land preparation 12931 13110 9430 11815 5.39
Hired labour 47359 48273 42212 45932 20.94
Seedling 10932 11136 10374 10814 4.93
Manure 2140 3415 2033 2523 1.15
Fertilizers:
Urea 8816 7728 5436 7324 3.34
TSP 7433 8647 6366 7474 3.41
MoP 3314 5117 1597 3330 1.52
Boron 1089 965 765 940 0.43
Zypsum 865 1204 549 870 0.40
Irrigation 13462 14870 10882 13059 5.95
Pesticide/Insecticide 12285 14309 9733 12094 5.51
Bamboo stick 7461 11205 6773 8461 3.86
Boundary and Macha 2508 1678 2371 2189 1.00
Interest on operating capital
2155 2337 1791 1914 0.87
Total variable cost 132751 143994 110311 117928 53.77
B. Fixed cost
Family labour 88579 86785 76970 84093 38.34
Land use cost 18525 16800 16550 17292 7.88
Total fixed cost 107104 103585 93520 101385 46.23
C. Total cost (A+B) 239854 247579 203831 219312 100.00
Profitability of brinjal cultivation
Per hectare average yield of brinjal was 20.07 ton/ha (Table 11.2.3). A considerable yield
difference was found among the three districts. The variation of gross return was due to getting
comparatively high yield of brinjal in Khagrachari district. Per hectare average gross margin was
found Tk.293650.Per hectare net return and BCR from brinjal cultivation were found Tk. 192265
22
and 1.88 respectively which indicates brinjal cultivation is highly profitable in the study areas.
Average cost of producing per kg of brinjal was Tk.10.93.
Table 11.2.3 Profitability of brinjal cultivation
Particulars Bandarban Khagrachari Rangamati All Area
Yield (ton/ha) 20.40 22.58 17.25 20.07
Price (ton/ha) 20090 18972 22449 20503
A. Total cost (Tk./ha) 239854 247579 203831 219312
Variable cost (VC) (Tk./ha) 132751 143994 110311 117928
Fixed cost (FC) (Tk./ha) 107104 103585 93520 101385
B. Gross return(Tk./ha) 409749 428313 387206 411577
C. Gross margin (B‐VC) (Tk./ha) 276999 284319 276895 293650
D. Net return (B‐A) (Tk./ha) 169895 180734 183376 192265
E. BCR on full cost 1.71 1.73 1.90 1.88
F. Cost per kg (Tk) 11.76 10.97 11.82 10.93
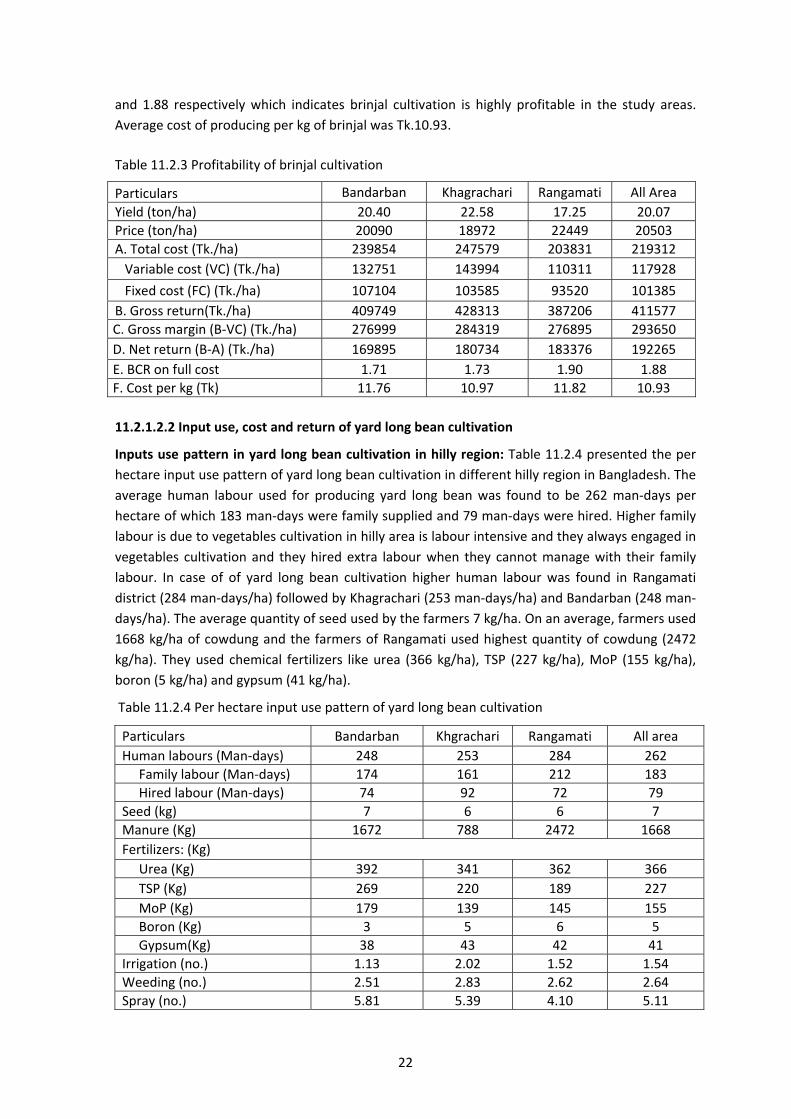
11.2.1.2.2 Input use, cost and return of yard long bean cultivation
Inputs use pattern in yard long bean cultivation in hilly region: Table 11.2.4 presented the per
hectare input use pattern of yard long bean cultivation in different hilly region in Bangladesh. The
average human labour used for producing yard long bean was found to be 262 man‐days per
hectare of which 183 man‐days were family supplied and 79 man‐days were hired. Higher family
labour is due to vegetables cultivation in hilly area is labour intensive and they always engaged in
vegetables cultivation and they hired extra labour when they cannot manage with their family
labour. In case of of yard long bean cultivation higher human labour was found in Rangamati
district (284 man‐days/ha) followed by Khagrachari (253 man‐days/ha) and Bandarban (248 man‐
days/ha). The average quantity of seed used by the farmers 7 kg/ha. On an average, farmers used
1668 kg/ha of cowdung and the farmers of Rangamati used highest quantity of cowdung (2472
kg/ha). They used chemical fertilizers like urea (366 kg/ha), TSP (227 kg/ha), MoP (155 kg/ha),
boron (5 kg/ha) and gypsum (41 kg/ha).
Table 11.2.4 Per hectare input use pattern of yard long bean cultivation
Particulars Bandarban Khgrachari Rangamati All area
Human labours (Man‐days) 248 253 284 262
Family labour (Man‐days) 174 161 212 183
Hired labour (Man‐days) 74 92 72 79
Seed (kg) 7 6 6 7
Manure (Kg) 1672 788 2472 1668
Fertilizers: (Kg)
Urea (Kg) 392 341 362 366
TSP (Kg) 269 220 189 227
MoP (Kg) 179 139 145 155
Boron (Kg) 3 5 6 5
Gypsum(Kg) 38 43 42 41
Irrigation (no.) 1.13 2.02 1.52 1.54
Weeding (no.) 2.51 2.83 2.62 2.64
Spray (no.) 5.81 5.39 4.10 5.11
23
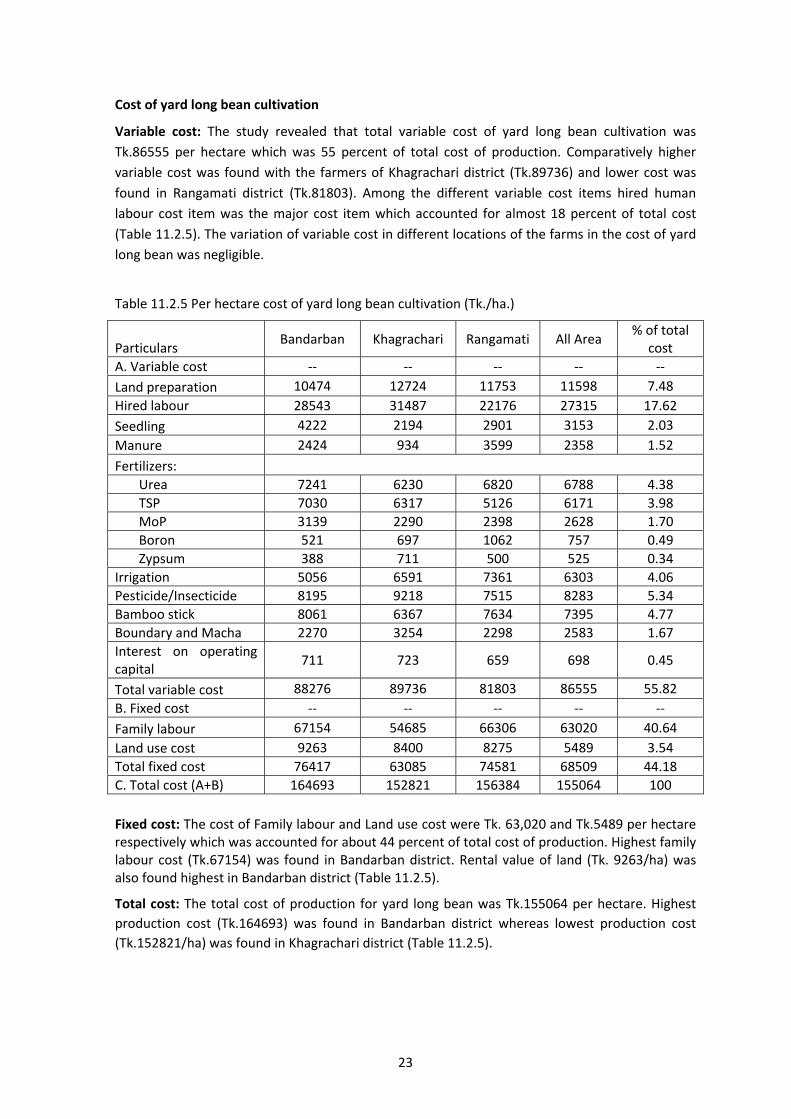
Cost of yard long bean cultivation
Variable cost: The study revealed that total variable cost of yard long bean cultivation was
Tk.86555 per hectare which was 55 percent of total cost of production. Comparatively higher
variable cost was found with the farmers of Khagrachari district (Tk.89736) and lower cost was
found in Rangamati district (Tk.81803). Among the different variable cost items hired human
labour cost item was the major cost item which accounted for almost 18 percent of total cost
(Table 11.2.5). The variation of variable cost in different locations of the farms in the cost of yard
long bean was negligible.
Table 11.2.5 Per hectare cost of yard long bean cultivation (Tk./ha.)
Particulars Bandarban Khagrachari Rangamati All Area
% of total cost
A. Variable cost ‐‐ ‐‐ ‐‐ ‐‐ ‐‐
Land preparation 10474 12724 11753 11598 7.48
Hired labour 28543 31487 22176 27315 17.62
Seedling 4222 2194 2901 3153 2.03
Manure 2424 934 3599 2358 1.52
Fertilizers:
Urea 7241 6230 6820 6788 4.38
TSP 7030 6317 5126 6171 3.98
MoP 3139 2290 2398 2628 1.70
Boron 521 697 1062 757 0.49
Zypsum 388 711 500 525 0.34
Irrigation 5056 6591 7361 6303 4.06
Pesticide/Insecticide 8195 9218 7515 8283 5.34
Bamboo stick 8061 6367 7634 7395 4.77
Boundary and Macha 2270 3254 2298 2583 1.67
Interest on operating capital
711 723 659 698 0.45
Total variable cost 88276 89736 81803 86555 55.82
B. Fixed cost ‐‐ ‐‐ ‐‐ ‐‐ ‐‐
Family labour 67154 54685 66306 63020 40.64
Land use cost 9263 8400 8275 5489 3.54
Total fixed cost 76417 63085 74581 68509 44.18
C. Total cost (A+B) 164693 152821 156384 155064 100
Fixed cost: The cost of Family labour and Land use cost were Tk. 63,020 and Tk.5489 per hectare respectively which was accounted for about 44 percent of total cost of production. Highest family labour cost (Tk.67154) was found in Bandarban district. Rental value of land (Tk. 9263/ha) was also found highest in Bandarban district (Table 11.2.5).
Total cost: The total cost of production for yard long bean was Tk.155064 per hectare. Highest
production cost (Tk.164693) was found in Bandarban district whereas lowest production cost
(Tk.152821/ha) was found in Khagrachari district (Table 11.2.5).
24
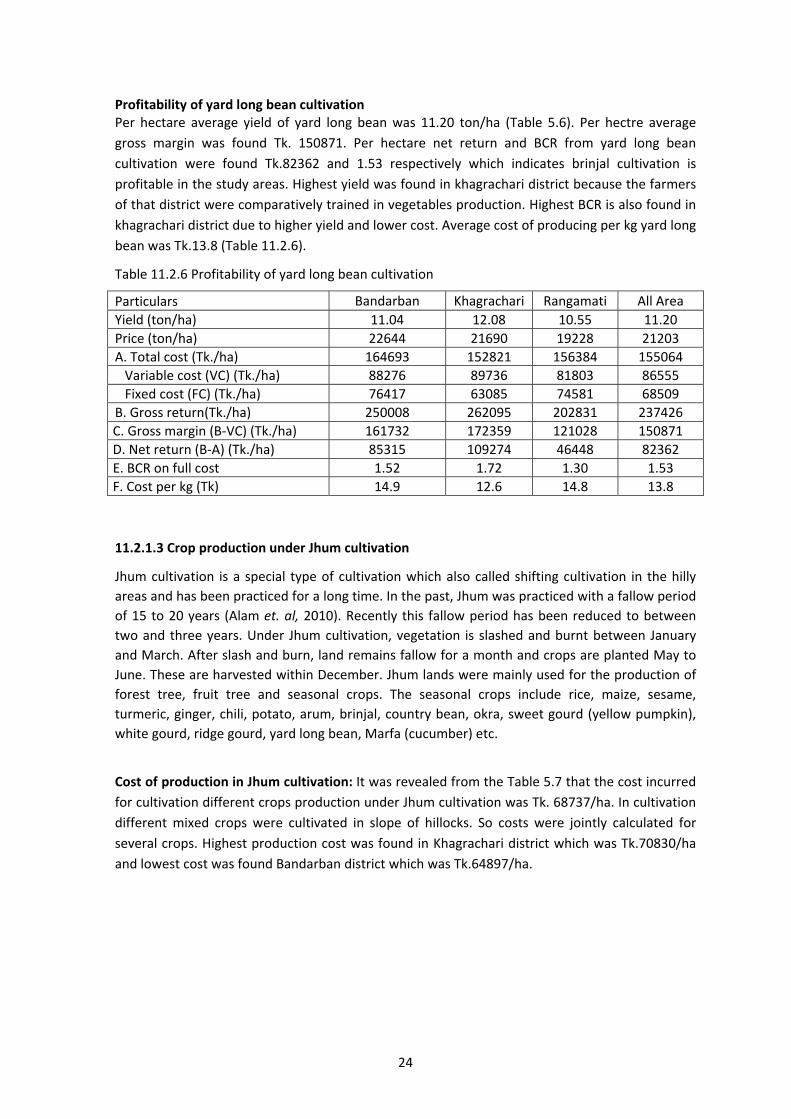
Profitability of yard long bean cultivation Per hectare average yield of yard long bean was 11.20 ton/ha (Table 5.6). Per hectre average
gross margin was found Tk. 150871. Per hectare net return and BCR from yard long bean
cultivation were found Tk.82362 and 1.53 respectively which indicates brinjal cultivation is
profitable in the study areas. Highest yield was found in khagrachari district because the farmers
of that district were comparatively trained in vegetables production. Highest BCR is also found in
khagrachari district due to higher yield and lower cost. Average cost of producing per kg yard long
bean was Tk.13.8 (Table 11.2.6).
Table 11.2.6 Profitability of yard long bean cultivation
Particulars Bandarban Khagrachari Rangamati All Area
Yield (ton/ha) 11.04 12.08 10.55 11.20
Price (ton/ha) 22644 21690 19228 21203
A. Total cost (Tk./ha) 164693 152821 156384 155064
Variable cost (VC) (Tk./ha) 88276 89736 81803 86555
Fixed cost (FC) (Tk./ha) 76417 63085 74581 68509
B. Gross return(Tk./ha) 250008 262095 202831 237426
C. Gross margin (B‐VC) (Tk./ha) 161732 172359 121028 150871
D. Net return (B‐A) (Tk./ha) 85315 109274 46448 82362
E. BCR on full cost 1.52 1.72 1.30 1.53
F. Cost per kg (Tk) 14.9 12.6 14.8 13.8
11.2.1.3 Crop production under Jhum cultivation
Jhum cultivation is a special type of cultivation which also called shifting cultivation in the hilly
areas and has been practiced for a long time. In the past, Jhum was practiced with a fallow period
of 15 to 20 years (Alam et. al, 2010). Recently this fallow period has been reduced to between
two and three years. Under Jhum cultivation, vegetation is slashed and burnt between January
and March. After slash and burn, land remains fallow for a month and crops are planted May to
June. These are harvested within December. Jhum lands were mainly used for the production of
forest tree, fruit tree and seasonal crops. The seasonal crops include rice, maize, sesame,
turmeric, ginger, chili, potato, arum, brinjal, country bean, okra, sweet gourd (yellow pumpkin),
white gourd, ridge gourd, yard long bean, Marfa (cucumber) etc.
Cost of production in Jhum cultivation: It was revealed from the Table 5.7 that the cost incurred
for cultivation different crops production under Jhum cultivation was Tk. 68737/ha. In cultivation
different mixed crops were cultivated in slope of hillocks. So costs were jointly calculated for
several crops. Highest production cost was found in Khagrachari district which was Tk.70830/ha
and lowest cost was found Bandarban district which was Tk.64897/ha.
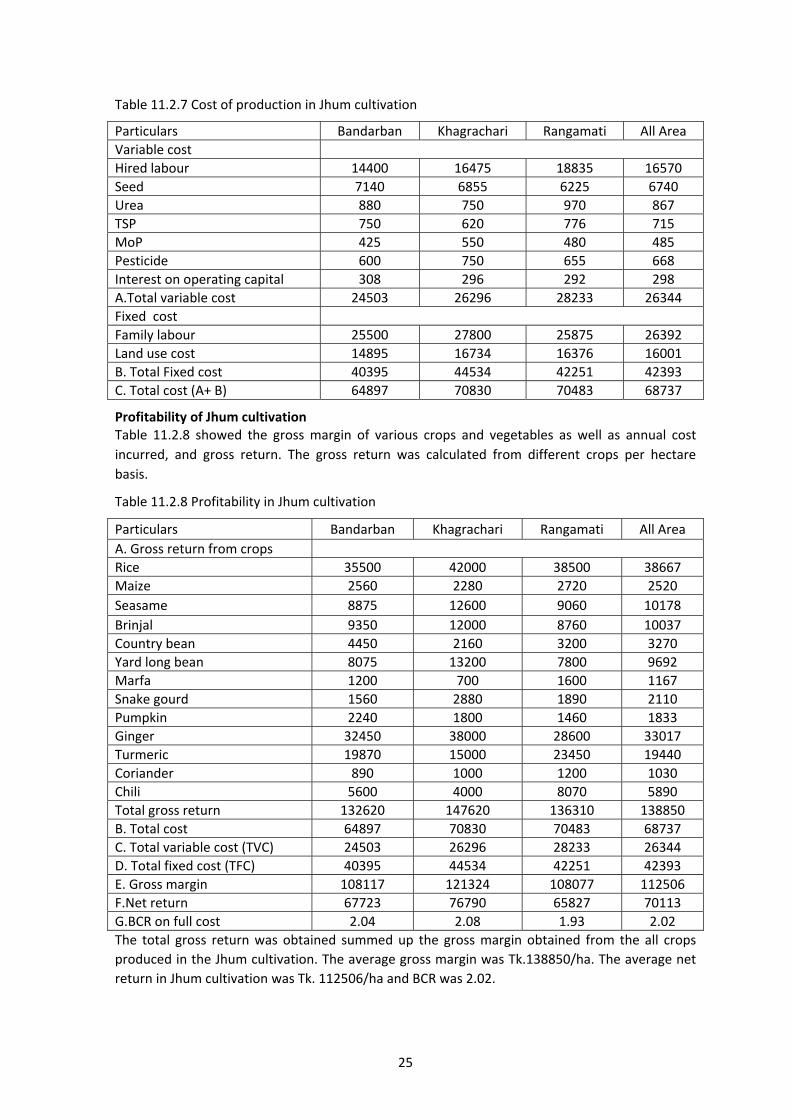
25
Table 11.2.7 Cost of production in Jhum cultivation
Particulars Bandarban Khagrachari Rangamati All Area
Variable cost
Hired labour 14400 16475 18835 16570
Seed 7140 6855 6225 6740
Urea 880 750 970 867
TSP 750 620 776 715
MoP 425 550 480 485
Pesticide 600 750 655 668
Interest on operating capital 308 296 292 298
A.Total variable cost 24503 26296 28233 26344
Fixed cost
Family labour 25500 27800 25875 26392
Land use cost 14895 16734 16376 16001
B. Total Fixed cost 40395 44534 42251 42393
C. Total cost (A+ B) 64897 70830 70483 68737
Profitability of Jhum cultivation Table 11.2.8 showed the gross margin of various crops and vegetables as well as annual cost
incurred, and gross return. The gross return was calculated from different crops per hectare
basis.
Table 11.2.8 Profitability in Jhum cultivation
Particulars Bandarban Khagrachari Rangamati All Area
A. Gross return from crops
Rice 35500 42000 38500 38667
Maize 2560 2280 2720 2520
Seasame 8875 12600 9060 10178
Brinjal 9350 12000 8760 10037
Country bean 4450 2160 3200 3270
Yard long bean 8075 13200 7800 9692
Marfa 1200 700 1600 1167
Snake gourd 1560 2880 1890 2110
Pumpkin 2240 1800 1460 1833
Ginger 32450 38000 28600 33017
Turmeric 19870 15000 23450 19440
Coriander 890 1000 1200 1030
Chili 5600 4000 8070 5890
Total gross return 132620 147620 136310 138850
B. Total cost 64897 70830 70483 68737
C. Total variable cost (TVC) 24503 26296 28233 26344
D. Total fixed cost (TFC) 40395 44534 42251 42393
E. Gross margin 108117 121324 108077 112506
F.Net return 67723 76790 65827 70113
G.BCR on full cost 2.04 2.08 1.93 2.02
The total gross return was obtained summed up the gross margin obtained from the all crops
produced in the Jhum cultivation. The average gross margin was Tk.138850/ha. The average net
return in Jhum cultivation was Tk. 112506/ha and BCR was 2.02.

26
11.2.2 Profitability analysis of selected crops in coastal region
It was also found three types of production technique in the coastal areas that are widely practiced by the farmers. Farmers used this technique to recover the different stresses found in the coastal belt such as waterlogging, salinity, heavy rainfall etc. Generally, these three types of technique were found in the coastal region.
11.2.2.1 Plain land cultivation
11.2.2.2 Sorjon method
11.2.2.3 Gher based agriculture (Composite agriculture)
11.2.2.1 Profitability of plain land cultivation
In coastal region plain land cultivation was found in the slightly high land where waterlogging and
salinity were not affecting the plant.
11.2.2.1.1 Input use, cost and return of bittergourd cultivation
Inputs use pattern in bittergourd cultivation in coastal areas: It was observed from the table
11.2.9 that the average human labour used for producing bittergourd was found to be 278 man‐
days per hectare of which 218 man‐days were family supplied and 60 man‐days were hired.
Higher family labour is due to they always engaged in vegetables cultivation and they hired extra
labour when they cannot manage with their family labour. Higher human labour was found in
Satkhira district (294 man‐days/ha) followed by Cox’sbazar (271 man‐days/ha)
Table 11.2.9 Per hectare Input use pattern of bittergourd cultivation
Particulars Coxbazar Patuakhali Satkhira All Area
Human labours (Man‐days) 271 268 294 278
Family labour (Man‐days) 191 223 239 218
Hired labour (Man‐days) 80 45 55 60
Seed (kg) 1.5 1.4 1.75 1.55
Manure(Kg) 1103 1575 2552 1743
Fertilizers:
Urea (Kg) 324 334 378 345
TSP (Kg) 230 222 229 227
MoP (Kg) 193 155 208 185
DAP (Kg) 102 127 107 112
Boron (Kg) 9 6 10 8
Gypsum (Kg) 148 103 133 128
Irrigation (no.) 3.90 3.16 3.30 3.45
Weeding (no.) 3.30 3.02 3.14 3.15
Spray (no.) 11.88 10.38 10.64 10.97
and Patuakhali (268 man‐days/ha).The average quantity of seed used by the farmers 1.55 kg/ha.
On an average, farmers used 1743 kg/ha of cowdung. They used chemical fertilizers like urea (345
kg/ha), TSP (227 kg/ha), MoP (185 kg/ha), DAP (112 kg/ha), boron (8 kg/ha) and gypsum (128
kg/ha).
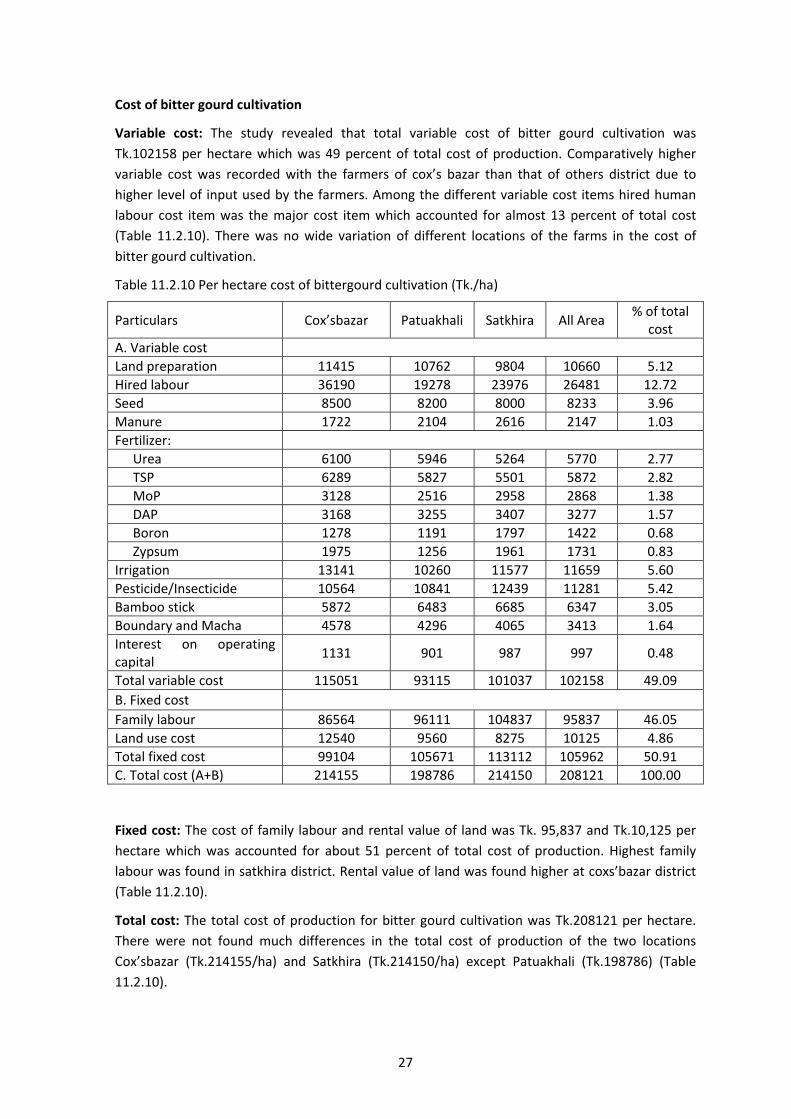
27
Cost of bitter gourd cultivation
Variable cost: The study revealed that total variable cost of bitter gourd cultivation was
Tk.102158 per hectare which was 49 percent of total cost of production. Comparatively higher
variable cost was recorded with the farmers of cox’s bazar than that of others district due to
higher level of input used by the farmers. Among the different variable cost items hired human
labour cost item was the major cost item which accounted for almost 13 percent of total cost
(Table 11.2.10). There was no wide variation of different locations of the farms in the cost of
bitter gourd cultivation.
Table 11.2.10 Per hectare cost of bittergourd cultivation (Tk./ha)
Particulars Cox’sbazar Patuakhali Satkhira All Area % of total
cost
A. Variable cost
Land preparation 11415 10762 9804 10660 5.12
Hired labour 36190 19278 23976 26481 12.72
Seed 8500 8200 8000 8233 3.96
Manure 1722 2104 2616 2147 1.03
Fertilizer:
Urea 6100 5946 5264 5770 2.77
TSP 6289 5827 5501 5872 2.82
MoP 3128 2516 2958 2868 1.38
DAP 3168 3255 3407 3277 1.57
Boron 1278 1191 1797 1422 0.68
Zypsum 1975 1256 1961 1731 0.83
Irrigation 13141 10260 11577 11659 5.60
Pesticide/Insecticide 10564 10841 12439 11281 5.42
Bamboo stick 5872 6483 6685 6347 3.05
Boundary and Macha 4578 4296 4065 3413 1.64
Interest on operating capital
1131 901 987 997 0.48
Total variable cost 115051 93115 101037 102158 49.09
B. Fixed cost
Family labour 86564 96111 104837 95837 46.05
Land use cost 12540 9560 8275 10125 4.86
Total fixed cost 99104 105671 113112 105962 50.91
C. Total cost (A+B) 214155 198786 214150 208121 100.00
Fixed cost: The cost of family labour and rental value of land was Tk. 95,837 and Tk.10,125 per
hectare which was accounted for about 51 percent of total cost of production. Highest family
labour was found in satkhira district. Rental value of land was found higher at coxs’bazar district
(Table 11.2.10).
Total cost: The total cost of production for bitter gourd cultivation was Tk.208121 per hectare.
There were not found much differences in the total cost of production of the two locations
Cox’sbazar (Tk.214155/ha) and Satkhira (Tk.214150/ha) except Patuakhali (Tk.198786) (Table
11.2.10).
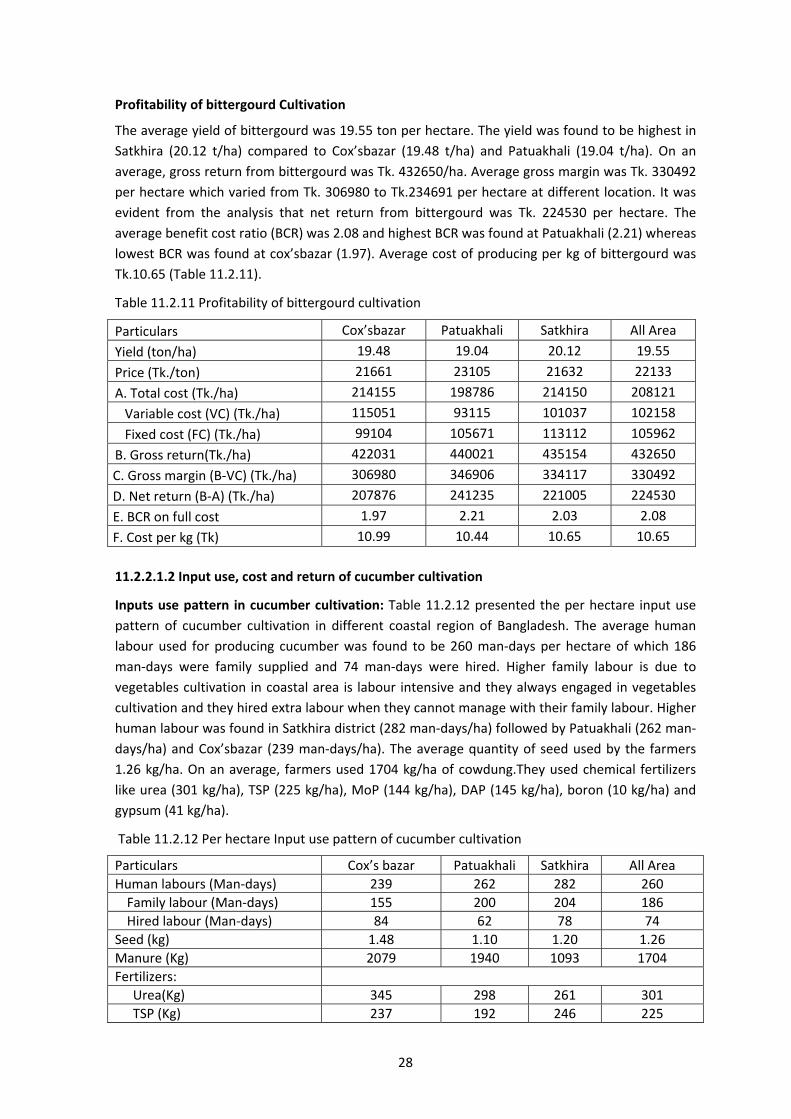
28
Profitability of bittergourd Cultivation
The average yield of bittergourd was 19.55 ton per hectare. The yield was found to be highest in
Satkhira (20.12 t/ha) compared to Cox’sbazar (19.48 t/ha) and Patuakhali (19.04 t/ha). On an
average, gross return from bittergourd was Tk. 432650/ha. Average gross margin was Tk. 330492
per hectare which varied from Tk. 306980 to Tk.234691 per hectare at different location. It was
evident from the analysis that net return from bittergourd was Tk. 224530 per hectare. The
average benefit cost ratio (BCR) was 2.08 and highest BCR was found at Patuakhali (2.21) whereas
lowest BCR was found at cox’sbazar (1.97). Average cost of producing per kg of bittergourd was
Tk.10.65 (Table 11.2.11).
Table 11.2.11 Profitability of bittergourd cultivation
Particulars Cox’sbazar Patuakhali Satkhira All Area
Yield (ton/ha) 19.48 19.04 20.12 19.55
Price (Tk./ton) 21661 23105 21632 22133
A. Total cost (Tk./ha) 214155 198786 214150 208121
Variable cost (VC) (Tk./ha) 115051 93115 101037 102158
Fixed cost (FC) (Tk./ha) 99104 105671 113112 105962
B. Gross return(Tk./ha) 422031 440021 435154 432650
C. Gross margin (B‐VC) (Tk./ha) 306980 346906 334117 330492
D. Net return (B‐A) (Tk./ha) 207876 241235 221005 224530
E. BCR on full cost 1.97 2.21 2.03 2.08
F. Cost per kg (Tk) 10.99 10.44 10.65 10.65
11.2.2.1.2 Input use, cost and return of cucumber cultivation
Inputs use pattern in cucumber cultivation: Table 11.2.12 presented the per hectare input use
pattern of cucumber cultivation in different coastal region of Bangladesh. The average human
labour used for producing cucumber was found to be 260 man‐days per hectare of which 186
man‐days were family supplied and 74 man‐days were hired. Higher family labour is due to
vegetables cultivation in coastal area is labour intensive and they always engaged in vegetables
cultivation and they hired extra labour when they cannot manage with their family labour. Higher
human labour was found in Satkhira district (282 man‐days/ha) followed by Patuakhali (262 man‐
days/ha) and Cox’sbazar (239 man‐days/ha). The average quantity of seed used by the farmers
1.26 kg/ha. On an average, farmers used 1704 kg/ha of cowdung.They used chemical fertilizers
like urea (301 kg/ha), TSP (225 kg/ha), MoP (144 kg/ha), DAP (145 kg/ha), boron (10 kg/ha) and
gypsum (41 kg/ha).
Table 11.2.12 Per hectare Input use pattern of cucumber cultivation
Particulars Cox’s bazar Patuakhali Satkhira All Area
Human labours (Man‐days) 239 262 282 260
Family labour (Man‐days) 155 200 204 186
Hired labour (Man‐days) 84 62 78 74
Seed (kg) 1.48 1.10 1.20 1.26
Manure (Kg) 2079 1940 1093 1704
Fertilizers:
Urea(Kg) 345 298 261 301
TSP (Kg) 237 192 246 225

29
MoP (Kg) 157 130 144 144
DAP (Kg) 103 162 170 145
Boron (Kg) 8 11 12 10
Gypsum (Kg) 142 56 139 112
Irrigation (no.) 4.52 4.50 3.78 4.27
Weeding (no.) 2.80 2.68 2.88 2.79
Spray (no.) 5.14 6.42 5.38 5.65
Cost of cucumber cultivation
Variable cost: The study revealed that total variable cost of cucumber cultivation was Tk.100519
per hectare which was 52 percent of total cost of production. Comparatively higher variable cost
was recorded with the farmers of cox’s bazar than that of others district due to higher level of
input used by the farmers. Among the different variable cost items hired human labour cost item
was the major cost item which accounted for almost 17 percent of total cost (Table 11.2.13).
There was no wide variation of different locations of the farms in the cost of cucumber
cultivation.
Fixed cost: Family labour and rental value of land was considered as fixed cost of production. The
cost of these items was Tk. 95,837 and Tk.10125 per hectare respectively which was accounted
for about 48 percent of total cost of production. The Highest family labour cost (Tk.88757) was
found in Patuakhali district. Rental value (Tk. 12540/ha) of land was found higher at Cox’s bazar
district (Table 11.2.13).
Total cost: Total cost of production included variable costs and fixed costs incurred for cucumber
cultivation. On an average, total cost of production for cucumber cultivation was Tk.191902 per
hectare. Considering average level of farm location there were not much differences in total cost
of production. Highest production cost (Tk.197801) was found in Cox’sbazar district whereas
lowest production cost (Tk.187234) was found in Satkhira district.
Table 11.2.13 Per hectare cost of cucumber cultivation (Tk./ha)
Particulars Cox’s bazar Patuakhali Satkhira All Area % of total
cost
A. Variable cost
Land preparation 13439 11441 11117 11999 6.25
Hired labour 39482 27846 30262 32530 16.95
Seed 3900.0 3080.0 3200.0 3393 1.77
Manure 2520 3472 978 2323 1.21
Fertilizers:
Urea 6089 5534 4461 5361 2.79
TSP 6100 4569 6333 5667 2.95
MoP 2421 1995 2187 2201 1.15
DAP 3379 2870 5678 3976 2.07
Boron 1315 2810 2496 2207 1.15
Zypsum 1782 625 2510 1639 0.85
Irrigation 10151 8810 8962 9308 4.85
Pesticide/Insecticide 9423 7566 8210 8400 4.38
Bamboo stick 6057 6857 6287 6401 3.34

30
Boundary and Macha 4179 3899 4062 4047 2.11
Interest on operating capital
1182 980 1038 1067 0.56
Total variable cost 111421 92355 97781 100519 52.38
B. Fixed cost
Family labour 73840 88757 81177 81258 42.34
Land use cost 12540 9560 8275 10125 5.28
Total fixed cost 86380 98317 89452 91383 47.62
C. Total cost (A+B) 197801 190672 187234 191902 100
Profitability of cucumber cultivation
The average yield of cucumber was 17.82 ton per hectare. The yield was found to be highest in
Satkhira (18.66 t/ha) compared to Cox’sbazar (17.40 t/ha) and Patuakhali (17.41 t/ha. On an
average, gross return from cucumber was Tk.349795/ha. Average gross margin was Tk.249276
per hectare which varied from Tk.219963 per hectare at Cox’sbazar and Tk.266149 per hectare at
Patuakhali. Net return from cucumber production was calculated by deducting total fixed cost
from gross margin or total cost from gross return. It was evident from the analysis that net return
from cucumber was Tk. 157893 per hectare. The average benefit cost ratio (BCR) was 1.82 and
highest BCR was found at Satkhira (1.92) whereas lowest BCR was found at cox’sbazar (1.68).
Average cost of producing per kg of cucumber was Tk.10.77 (Table 11.2.14).
Table 11.2.14 Profitability of cucumber cultivation
Particulars Cox’sbazar Patuakhali Satkhira All Area
Yield (ton/ha) 17.40 17.41 18.66 17.82
Price (Tk./ton) 19046 20592 19240 19626
A. Total cost (Tk./ha) 197801 190672 187234 191902
Variable cost (VC) (Tk./ha) 111421 92355 97781 100519
Fixed cost (FC) (Tk./ha) 86380 98317 89452 91383
B. Gross return (Tk./ha) 331384 358504 359020 349795
C. Gross margin (B‐VC) (Tk./ha) 219963 266149 261239 249276
D. Net return (B‐A) (Tk./ha) 133583 167832 171787 157893
E. BCR on full cost 1.68 1.88 1.92 1.82
F. Cost per kg (Tk) 11.37 10.95 10.03 10.77
11.2.2.2 Vegetables cultivation under Sorjon method
Sorjan is a cropping system which helps the growers to cultivate fish and vegetables
simultaneously on the same land. In this methods farmer uses a system that construct alternate
deep sinks and raised bed in low land. It is viable in high soil salinity and water submergence in
the coastal belt which reduces crop productivity. This has become a common practice in coastal
belt of Bangladesh to protect the crop from salinity, submergence, flooding, erratic rainfall, sea
level rice etc. If this system of cultivation can be extended to more farmers then they could get
three crops in a year and also possible to cultivate crops in unfavorable condition. In some cases
farmers also practiced fish culture in between Sorjon bed.
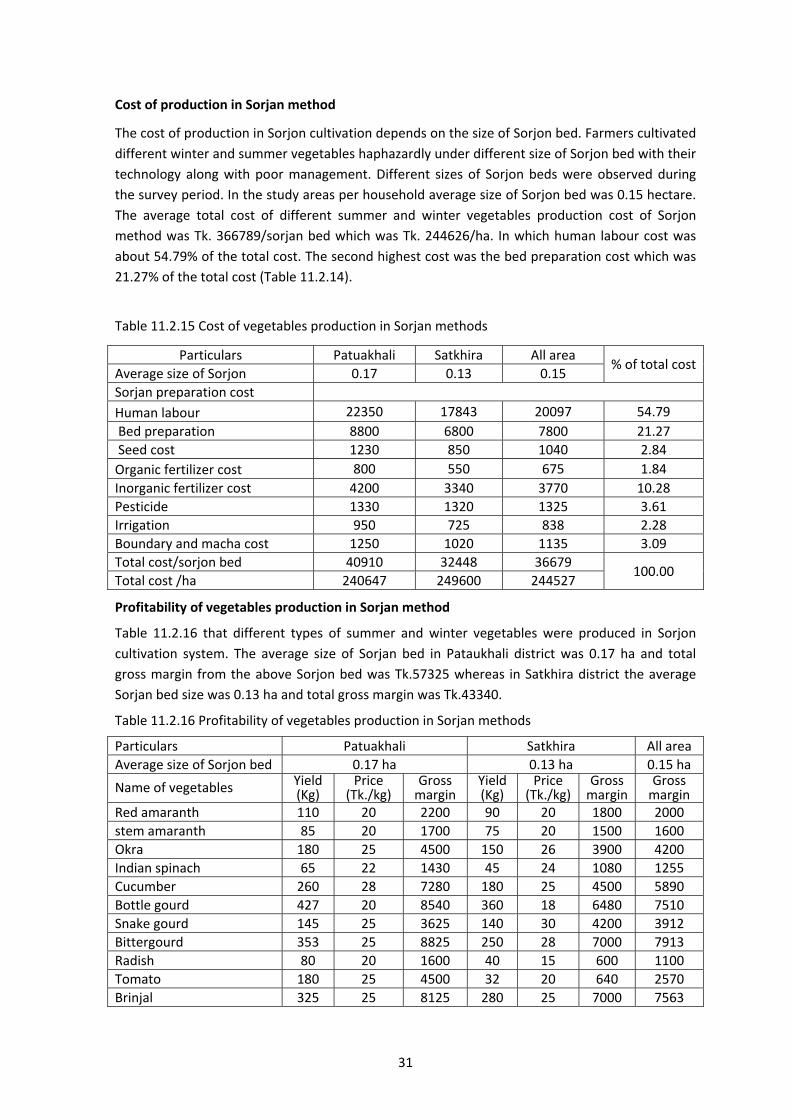
31
Cost of production in Sorjan method
The cost of production in Sorjon cultivation depends on the size of Sorjon bed. Farmers cultivated
different winter and summer vegetables haphazardly under different size of Sorjon bed with their
technology along with poor management. Different sizes of Sorjon beds were observed during
the survey period. In the study areas per household average size of Sorjon bed was 0.15 hectare.
The average total cost of different summer and winter vegetables production cost of Sorjon
method was Tk. 366789/sorjan bed which was Tk. 244626/ha. In which human labour cost was
about 54.79% of the total cost. The second highest cost was the bed preparation cost which was
21.27% of the total cost (Table 11.2.14).
Table 11.2.15 Cost of vegetables production in Sorjan methods
Particulars Patuakhali Satkhira All area % of total cost
Average size of Sorjon 0.17 0.13 0.15
Sorjan preparation cost
Human labour 22350 17843 20097 54.79
Bed preparation 8800 6800 7800 21.27
Seed cost 1230 850 1040 2.84
Organic fertilizer cost 800 550 675 1.84
Inorganic fertilizer cost 4200 3340 3770 10.28
Pesticide 1330 1320 1325 3.61
Irrigation 950 725 838 2.28
Boundary and macha cost 1250 1020 1135 3.09
Total cost/sorjon bed 40910 32448 36679 100.00
Total cost /ha 240647 249600 244527
Profitability of vegetables production in Sorjan method
Table 11.2.16 that different types of summer and winter vegetables were produced in Sorjon
cultivation system. The average size of Sorjan bed in Pataukhali district was 0.17 ha and total
gross margin from the above Sorjon bed was Tk.57325 whereas in Satkhira district the average
Sorjan bed size was 0.13 ha and total gross margin was Tk.43340.
Table 11.2.16 Profitability of vegetables production in Sorjan methods
Particulars Patuakhali Satkhira All area
Average size of Sorjon bed 0.17 ha 0.13 ha 0.15 ha
Name of vegetables Yield (Kg)
Price (Tk./kg)
Gross margin
Yield (Kg)
Price (Tk./kg)
Gross margin
Gross margin
Red amaranth 110 20 2200 90 20 1800 2000
stem amaranth 85 20 1700 75 20 1500 1600
Okra 180 25 4500 150 26 3900 4200
Indian spinach 65 22 1430 45 24 1080 1255
Cucumber 260 28 7280 180 25 4500 5890
Bottle gourd 427 20 8540 360 18 6480 7510
Snake gourd 145 25 3625 140 30 4200 3912
Bittergourd 353 25 8825 250 28 7000 7913
Radish 80 20 1600 40 15 600 1100
Tomato 180 25 4500 32 20 640 2570
Brinjal 325 25 8125 280 25 7000 7563
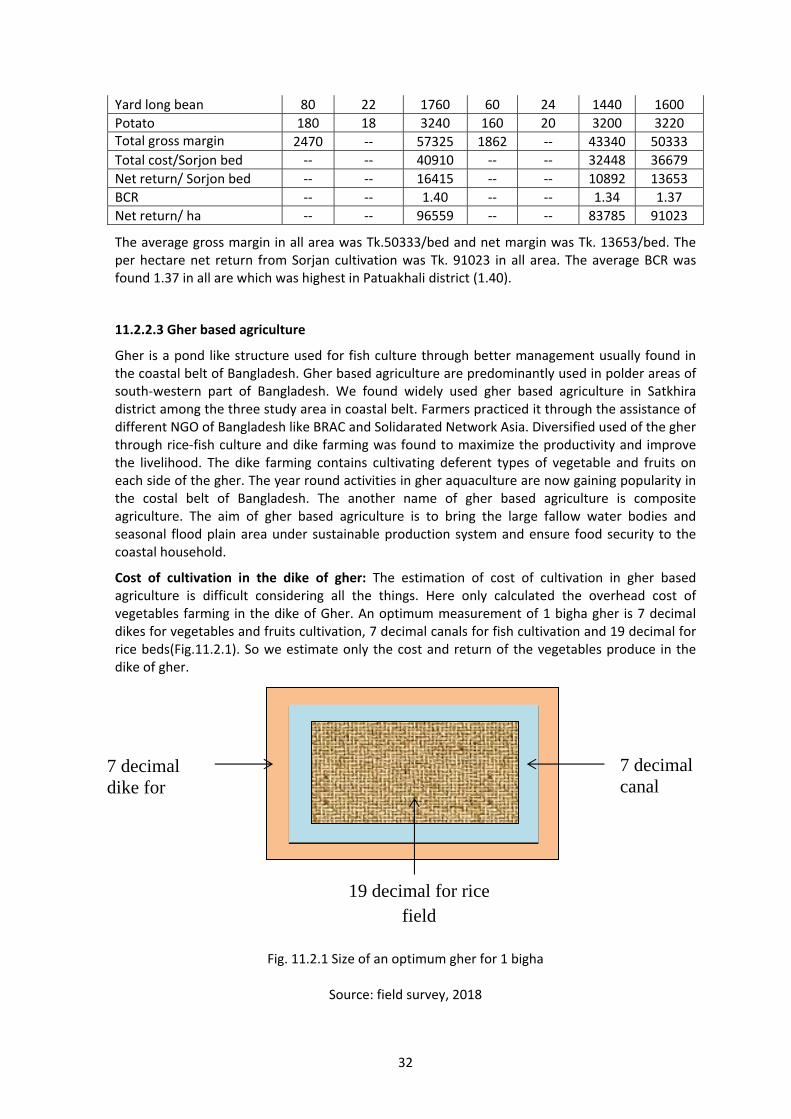
32
Yard long bean 80 22 1760 60 24 1440 1600
Potato 180 18 3240 160 20 3200 3220 Total gross margin 2470 ‐‐ 57325 1862 ‐‐ 43340 50333
Total cost/Sorjon bed ‐‐ ‐‐ 40910 ‐‐ ‐‐ 32448 36679
Net return/ Sorjon bed ‐‐ ‐‐ 16415 ‐‐ ‐‐ 10892 13653
BCR ‐‐ ‐‐ 1.40 ‐‐ ‐‐ 1.34 1.37
Net return/ ha ‐‐ ‐‐ 96559 ‐‐ ‐‐ 83785 91023
The average gross margin in all area was Tk.50333/bed and net margin was Tk. 13653/bed. The per hectare net return from Sorjan cultivation was Tk. 91023 in all area. The average BCR was found 1.37 in all are which was highest in Patuakhali district (1.40).
11.2.2.3 Gher based agriculture
Gher is a pond like structure used for fish culture through better management usually found in the coastal belt of Bangladesh. Gher based agriculture are predominantly used in polder areas of south‐western part of Bangladesh. We found widely used gher based agriculture in Satkhira district among the three study area in coastal belt. Farmers practiced it through the assistance of different NGO of Bangladesh like BRAC and Solidarated Network Asia. Diversified used of the gher through rice‐fish culture and dike farming was found to maximize the productivity and improve the livelihood. The dike farming contains cultivating deferent types of vegetable and fruits on each side of the gher. The year round activities in gher aquaculture are now gaining popularity in the costal belt of Bangladesh. The another name of gher based agriculture is composite agriculture. The aim of gher based agriculture is to bring the large fallow water bodies and seasonal flood plain area under sustainable production system and ensure food security to the coastal household.
Cost of cultivation in the dike of gher: The estimation of cost of cultivation in gher based agriculture is difficult considering all the things. Here only calculated the overhead cost of vegetables farming in the dike of Gher. An optimum measurement of 1 bigha gher is 7 decimal dikes for vegetables and fruits cultivation, 7 decimal canals for fish cultivation and 19 decimal for rice beds(Fig.11.2.1). So we estimate only the cost and return of the vegetables produce in the dike of gher.
Fig. 11.2.1 Size of an optimum gher for 1 bigha
Source: field survey, 2018
7 decimal canal
19 decimal for rice field
7 decimal dike for
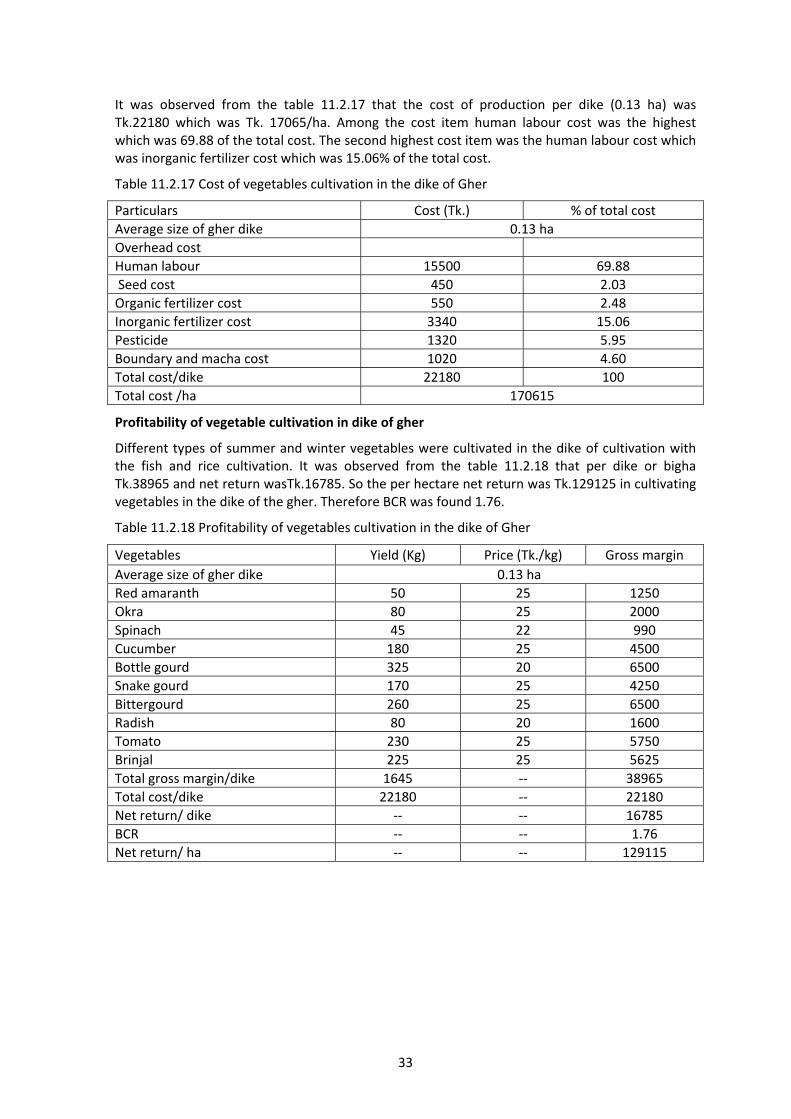
33
It was observed from the table 11.2.17 that the cost of production per dike (0.13 ha) was Tk.22180 which was Tk. 17065/ha. Among the cost item human labour cost was the highest which was 69.88 of the total cost. The second highest cost item was the human labour cost which was inorganic fertilizer cost which was 15.06% of the total cost.
Table 11.2.17 Cost of vegetables cultivation in the dike of Gher
Particulars Cost (Tk.) % of total cost
Average size of gher dike 0.13 ha
Overhead cost
Human labour 15500 69.88
Seed cost 450 2.03
Organic fertilizer cost 550 2.48
Inorganic fertilizer cost 3340 15.06
Pesticide 1320 5.95
Boundary and macha cost 1020 4.60
Total cost/dike 22180 100
Total cost /ha 170615
Profitability of vegetable cultivation in dike of gher
Different types of summer and winter vegetables were cultivated in the dike of cultivation with the fish and rice cultivation. It was observed from the table 11.2.18 that per dike or bigha Tk.38965 and net return wasTk.16785. So the per hectare net return was Tk.129125 in cultivating vegetables in the dike of the gher. Therefore BCR was found 1.76.
Table 11.2.18 Profitability of vegetables cultivation in the dike of Gher
Vegetables Yield (Kg) Price (Tk./kg) Gross margin
Average size of gher dike 0.13 ha
Red amaranth 50 25 1250
Okra 80 25 2000
Spinach 45 22 990
Cucumber 180 25 4500
Bottle gourd 325 20 6500
Snake gourd 170 25 4250
Bittergourd 260 25 6500
Radish 80 20 1600
Tomato 230 25 5750
Brinjal 225 25 5625
Total gross margin/dike 1645 ‐‐ 38965
Total cost/dike 22180 ‐‐ 22180
Net return/ dike ‐‐ ‐‐ 16785
BCR ‐‐ ‐‐ 1.76
Net return/ ha ‐‐ ‐‐ 129115

34
CHAPTER 11.3
SUPPLY CHAIN OF SELECTED VEGETABLES IN HILLY AND COASTAL REGION
The sequence of stages involved in supply of input to the farm and transferring produce from
farm to consumer is generally referred to as a supply chain. The consumer could be as close to
the producer as in same village or on the other side of the country. The main effort of the supply
chain is to reach the produces to the consumer in an efficient way. All transfers involve marketing
activities in some form or other. All the activities involve costs. At the most complex level of a
supply chain a product may be stored for lengthy periods, transported long distances and
processed several times before reaching the form in which it is finally sold. Generally, the more
complex and lengthier the marketing chain the higher are the marketing costs. Thus, simple
comparison of farmer prices with retail prices is a poor indicator of marketing efficiency, as it
does not take into account the costs involved in moving produce along the supply chain from
farmer to consumer.
One of the vital roles of an organization trying to assist farmers to improve marketing is to oil the
wheels of production marketing chain, so that businesses in the chain operate more efficiently.
Very often, marketing chains are not coordinated and the participants can be blind to the
existence of others role in creating opportunities for buyers and sellers to meet, to share
information, to exchange ideas and to explore trading opportunities. The nature of business is
that both buyers and sellers try to maximize their profit. To do this requires information, but
farmers are generally the least well‐informed in the marketing chain. A well‐informed farmer
who has some basic negotiating skills will usually obtain better prices than less well‐informed
farmers (Grahame Dixie, 2005 pp. 100‐103).
This chapter analyzed the supply chain of vegetables marketing in hilly and coastal region of
Bangladesh.
11.3.1 Vegetables market in hilly area
Brinjal and yard long bean were selected for representing the whole vegetables marketing system
in the hilly area. Vegetables production in hilly area was semi‐subsistence due to a lot of things;
such as uneven topography, lack of irrigation water, unavailability of cultivable land etc. So,
vegetables market was deficit here and maximum produced local vegetables were consumed
within the district or near inter districts. A little quantity of local vegetables marketed to distance
market after fulfilling local demand. The markets of the produced vegetables were, local markets
within Chattagram and neighboring districts such as Comilla, Feni and Noakhali.
11.3.2 Vegetables market in coastal area
The study also considered three coastal districts for analyzing supply chain of vegetables in
coastal area and considered bittergourd and cucumber for representing whole vegetables
marketing system in coastal area. In coastal area marketing of selected vegetables was
unorganized due to semi‐substance production, lack of distance bepari, high transportation cost
and crossing feri, especially in Patuakhali and Satkhira district. The coastal belt was deficit in
vegetables production due to low land, intrusion of salinity, excessive rainfall and lack of
irrigation water etc. and the local demand was fulfilled on the basis of import from the others

35
part of the country. So locally produced vegetables were consumed within the district or near
inter district.
11.3.3 Actors involved in the supply chain of vegetables in hilly and coastal area
The vegetable supply chain primarily focuses on the production and marketing of vegetables in
unfavorable eco‐system such as hilly and coastal region. The vegetable supply chain started from
input supply to the farmers and ends by retailing to the consumer. After producing vegetables,
the producers sell major portion of them to local traders. Actors are the main players of the
supply chain. There are many actors in the supply chain of selected vegetables. Some are more
powerful than others. The main actors involved in the supply chain were discussed below:
11.3.3.1 Input dealer
Seed, fertilizer and pesticide or insecticide dealer or retailer played an important role in the
supply chain. For the production of vegetables, supplies of those inputs are very important. Seed,
fertilizer and pesticide dealer supply those input to the producer both in hilly and coastal region.
All these inputs have own independent marketing system. BADC and seed company dealer
supplied improved quality of seed to the producers. The farmers used different types of organic
and inorganic fertilizers for vegetables production. They also used different types of pesticides
and they bought it from the pesticide dealer or retailer. The farmers also used some other inputs
such as bamboo stick, tools and equipment for the production of vegetables.
11.3.3.2 Producer
Producers are the main actor in the supply chain. In the vegetables supply chain farmers play a
dominant role. In the study area most of the farmers were engaged with more or less in
vegetables production. Their main occupation was agriculture. The chain started move from the
production of vegetables by the farmers. The farmers used different types of inputs for the
production of vegetables. Vegetable growers are consumers of many production inputs like
seeds/seedlings, fertilizers, irrigation water and pesticides. They purchased those types of input
from the different stakeholder for vegetables production.
11.3.3.3 Farm labourer
Both male and female labourer’s are involved in the vegetable supply chain from production to
marketing. In hilly areas most of the labourer’s were female associated with vegetables
production. Vegetables are labour intensive crop. These labourer’s are engaged in transplanting,
irrigating, hand weeding and harvesting of vegetables production process.
11.3.3.4 Transport agency
There are many poor people, who are engaged in truck and van driving for providing
transportation services to the vegetable’s producers and traders. The transport agencies provide
transport facilities for carrying vegetables from the producer to consume.
11.3.3.5 Farmer‐cum‐retailer
Most of the times, farmers done retailing in local markets for getting higher price in hilly and
coastal areas. Farmers carry their vegetables to the nearby market and sell directly to the
consumer. These types of farmers mostly observed in chattagram hill tracts.
36
11.3.3.6 Bepari
A bepari was the part time or full‐time agent of the distance market or terminal market in the
production catchment area. A bepari bought selected vegetables directly from the spot (farmgate
area), primary markets and sometimes from secondary markets and performed the marketing
activities from purchase area to terminal market or distance market. In the study area very
limited amount of vegetables handed by bepari due to low production and less surplus of
vegetables in the production area.
11.3.3.7 Local arathdar
Local arathdar was the commission agent who takes commission from farmer or bepari or
sometimes both parties in the primary or secondary market for providing facilities in the market
or consignment. They have a permanent establishment in the market of the production
catchment area and providing some marketing facilities among the both parties such as; buying
and selling, weighing and providing market information etc.
11.3.3.8 Urban arathdar
Urban arathdar was the commission agent who takes commission from bepari or retailer or
sometimes from both parties in the terminal market for providing some marketing facilities in the
market. They have also a permanent establishment in the terminal market and provide the same
facilities.
11.3.3.9 Paiker‐cum‐retailer
Paiker‐cum‐retailer bought selected vegetables directly from the farmers or local arathdar in
primary markets or sometimes from secondary markets and retailing thereof to the local
consumer within the district or inter‐district market.
11.3.3.10 Local retailer
Local retailer bought selected vegetables directly from the farmers in primary markets or
secondary markets and sold thereof to the local consumer.
11.3.3.11 Urban retailer
Urban retailer performed marketing activities in the terminal market and bought selected
vegetables from the urban arathdar and sold thereof to the urban consumer.
11.3.3.12 Consumer
Consumers are the last link of the supply chain and the aim of the vegetables supply chain is to
available vegetables to the consumer and satisfied them. The actors of the supply chain and
others support service done this work.
11.3.4 Existing supply chain of selected vegetables in Hilly area
Major five vegetables supply chains were identified on the basis of product flow and it was ranking on the basis of percentage of product movement. Table 11.3.1 showed that, among the five chains four major chains supply vegetables within the region. The supply chain‐V only supplies vegetables to the distance market whose percentage was 6.75%.
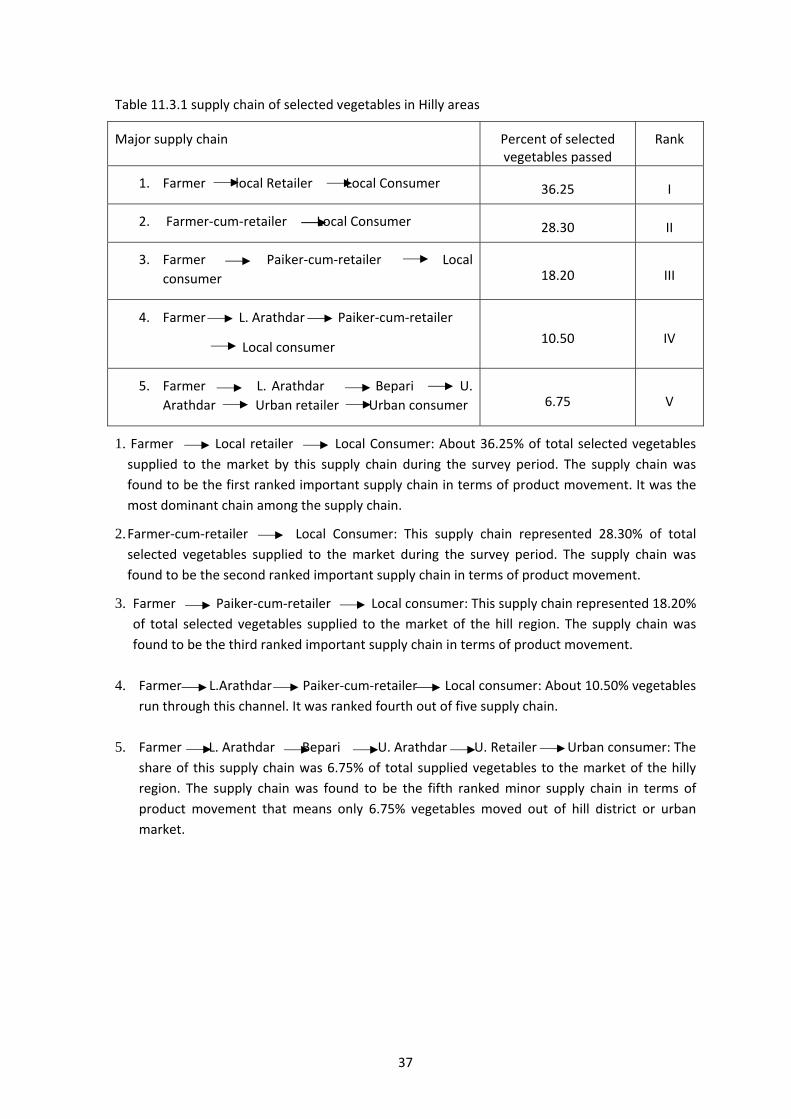
37
Table 11.3.1 supply chain of selected vegetables in Hilly areas
Major supply chain Percent of selected vegetables passed
Rank
1. Farmer local Retailer Local Consumer 36.25 I
2. Farmer‐cum‐retailer Local Consumer 28.30 II
3. Farmer Paiker‐cum‐retailer Local
consumer 18.20 III
4. Farmer L. Arathdar Paiker‐cum‐retailer
Local consumer 10.50 IV
5. Farmer L. Arathdar Bepari U.
Arathdar Urban retailer Urban consumer 6.75 V
1. Farmer Local retailer Local Consumer: About 36.25% of total selected vegetables
supplied to the market by this supply chain during the survey period. The supply chain was
found to be the first ranked important supply chain in terms of product movement. It was the
most dominant chain among the supply chain.
2. Farmer‐cum‐retailer Local Consumer: This supply chain represented 28.30% of total
selected vegetables supplied to the market during the survey period. The supply chain was
found to be the second ranked important supply chain in terms of product movement.
3. Farmer Paiker‐cum‐retailer Local consumer: This supply chain represented 18.20%
of total selected vegetables supplied to the market of the hill region. The supply chain was
found to be the third ranked important supply chain in terms of product movement.
4. Farmer L.Arathdar Paiker‐cum‐retailer Local consumer: About 10.50% vegetables
run through this channel. It was ranked fourth out of five supply chain.
5. Farmer L. Arathdar Bepari U. Arathdar U. Retailer Urban consumer: The
share of this supply chain was 6.75% of total supplied vegetables to the market of the hilly
region. The supply chain was found to be the fifth ranked minor supply chain in terms of
product movement that means only 6.75% vegetables moved out of hill district or urban
market.
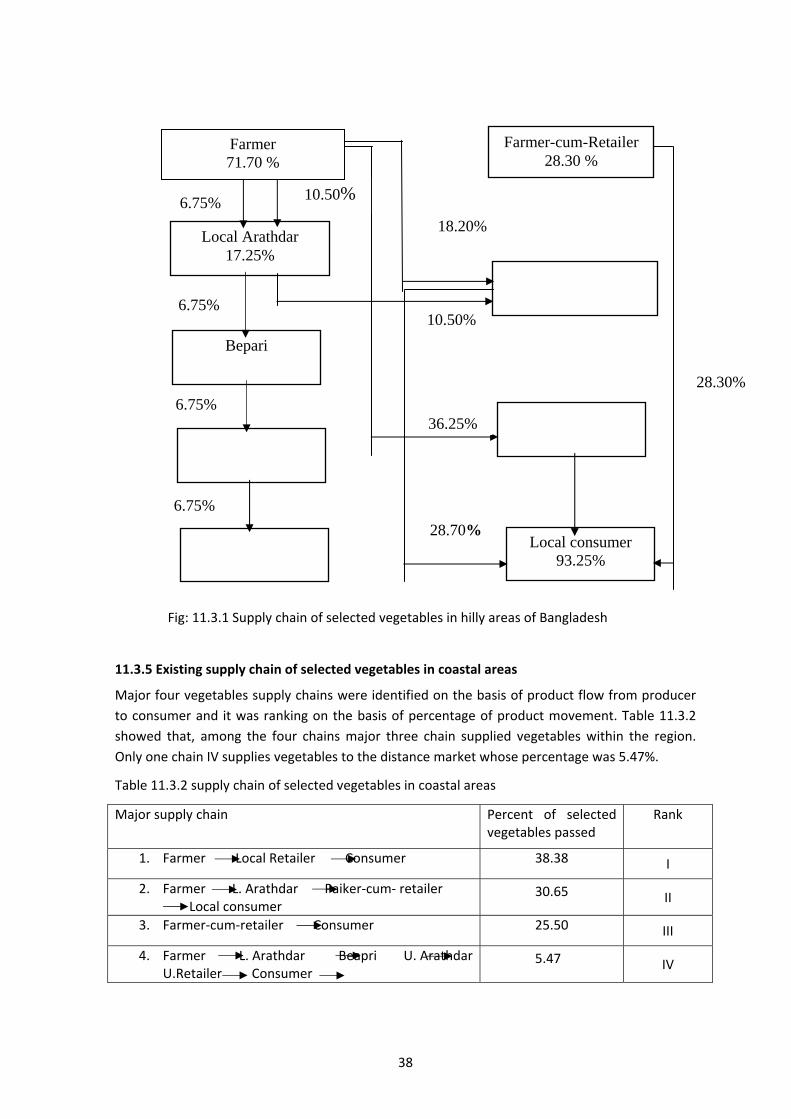
38
Fig: 11.3.1 Supply chain of selected vegetables in hilly areas of Bangladesh
11.3.5 Existing supply chain of selected vegetables in coastal areas
Major four vegetables supply chains were identified on the basis of product flow from producer
to consumer and it was ranking on the basis of percentage of product movement. Table 11.3.2
showed that, among the four chains major three chain supplied vegetables within the region.
Only one chain IV supplies vegetables to the distance market whose percentage was 5.47%.
Table 11.3.2 supply chain of selected vegetables in coastal areas
Major supply chain Percent of selected vegetables passed
Rank
1. Farmer Local Retailer Consumer 38.38 I
2. Farmer L. Arathdar Paiker‐cum‐ retailer Local consumer
30.65 II
3. Farmer‐cum‐retailer Consumer 25.50 III
4. Farmer L. Arathdar Beapri U. Arathdar U.Retailer Consumer
5.47 IV
Farmer-cum-Retailer 28.30 %
Paiker-cum-retailer 28.70%
Local Arathdar 17.25%
Bepari
Local retailer 36.25%
Urban retailer
Local consumer 93.25%
Urban consumer 6.75%
28.30%
36.25%
18.20%
28.70%
10.50% 6.75%
10.50% 6.75%
6.75%
6.75%
Farmer 71.70 %

39
1. Farmer Local retailer Local consumer: About 38.38% of total selected vegetables supplied to the market by this supply chain. The supply chain was found to be the first ranked important supply chain in terms of product movement. It was the most dominant supply chain among the supply chain.
2. Farmer L.arathdar Paiker‐cum‐retailer Local consumer: About 30.65% vegetables run through this supply chain. It was ranked 2nd out of four supply chain.
3. Farmer‐cum‐retailer Local consumer: This supply chain accounted for 25.50% of total selected vegetables supplied to the market during the survey period. The supply chain was found to be the ranked third in terms of product movement.
4. Farmer L. arathdar Bepari U. Arathdar Retailer Urban consumer: About 5.47% of total supplied vegetables passed through this chain to the market of coastal region. The supply chain was found to be the fourth ranked minor supply chain in terms of product movement that means only 5.47% vegetables moved out of coastal district or terminal market.
Fig: 11.3.1 Supply chain of selected vegetables in coastal areas of Bangladesh
Farmer 74.50 %
Farmer-cum-retailer 25.50 %
Paiker-cum-retailer 30.65%
Local Arathdar 36.12%
Bepari
Local retailer 38.38%
Urban retailer
Local consumer 94.53%
Urban consumer 5.47%
25.50% 38.38%
30.65%
38.38% 5.47%
30.65%
5.47%
5.47%
5.47%
30.65%

40
CHAPTER 11.4
MARKETING COST AND MARGIN AT DIFFERENT LEVELS IN SUPPLY CHAIN
This chapter focused on to understand the different marketing cost and margin of the different
actors involved in the selected vegetables supply chain in hilly and coastal areas of Bangladesh.
11.4 Marketing cost and margin of different actors
The cost of marketing represents the cost of performing the various marketing functions and
operation by various agencies involved in the marketing process. In other words, the costs which
are incurred to move the product from producers to consumers are generally known as
marketing cost. Marketing margin is the difference between selling and buying prices of the
commodities. According to Tomek and Robinson (1990), marketing margin may be defined
alternatively as (i) a difference between the price paid by the consumers and that obtained by
producers or as (2) the price of a collection of marketing services which is the outcome of the
demand for and the supply of such services. The total marketing margin usually consists of
margins at different stages of marketing and in each case the margin is the difference between
the buying and selling prices of each intermediary (Patniak, 1989).
11.4.1 Marketing cost of different actors in vegetables supply chain of hilly areas
Marketing costs among farmers and various intermediaries is very important for improving the
efficiency of marketing system. Nature and extent of business marketing cost varies from traders
to traders. The marketing cost included the cost of transportation, packing, binding, loading, and
unloading, market toll and entertainment for the movement of the product from one market to
another. In chattagram hill tracts marketing cost is higher than other plain land of the country
due to a lot of things such as, uneven topography, high transportation cost, different kinds of
subscription etc. Marketing cost of different actors in brinjal and yard long bean supply chain was
presented in the following subsequent part.
11.4.1.1 Farmer’s marketing cost
The per quintal marketing cost of brinjal and yard long bean by farmers was Tk.114.54 and 119.18 respectively (Table 11.4.1). Among the cost items, transportation cost was the highest, which was about 39.19% for brinjal and 41.02% for yard long bean because of high carrying cost of vegetables from home to market. The second highest cost item was weighing charge which was 21.83% for brinjal and 20.98% for yard long bean. The other cost items recorded for the farmers were loading & unloading (15.78%), market toll (9.28%) and personal expenses (13.92%) for brinjal marketing whereas in case of yard long bean it was 15.72%, 9.48% and 12.80% respectively. It was observed from the table 11.4.1 that there was no significant difference among the cost items between brinjal and yard long bean in hilly areas.
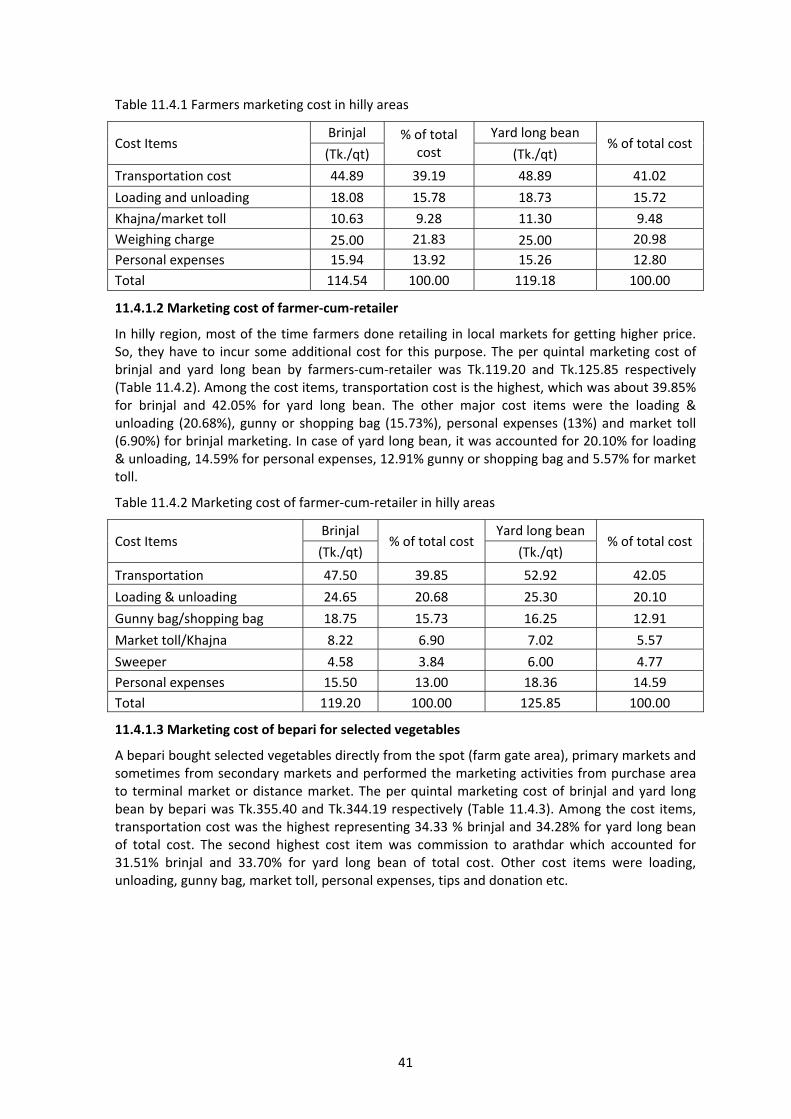
41
Table 11.4.1 Farmers marketing cost in hilly areas
Cost Items Brinjal % of total
cost
Yard long bean % of total cost
(Tk./qt) (Tk./qt)
Transportation cost 44.89 39.19 48.89 41.02
Loading and unloading 18.08 15.78 18.73 15.72
Khajna/market toll 10.63 9.28 11.30 9.48
Weighing charge 25.00 21.83 25.00 20.98
Personal expenses 15.94 13.92 15.26 12.80
Total 114.54 100.00 119.18 100.00
11.4.1.2 Marketing cost of farmer‐cum‐retailer
In hilly region, most of the time farmers done retailing in local markets for getting higher price. So, they have to incur some additional cost for this purpose. The per quintal marketing cost of brinjal and yard long bean by farmers‐cum‐retailer was Tk.119.20 and Tk.125.85 respectively (Table 11.4.2). Among the cost items, transportation cost is the highest, which was about 39.85% for brinjal and 42.05% for yard long bean. The other major cost items were the loading & unloading (20.68%), gunny or shopping bag (15.73%), personal expenses (13%) and market toll (6.90%) for brinjal marketing. In case of yard long bean, it was accounted for 20.10% for loading & unloading, 14.59% for personal expenses, 12.91% gunny or shopping bag and 5.57% for market toll.
Table 11.4.2 Marketing cost of farmer‐cum‐retailer in hilly areas
Cost Items Brinjal
% of total cost Yard long bean
% of total cost (Tk./qt) (Tk./qt)
Transportation 47.50 39.85 52.92 42.05
Loading & unloading 24.65 20.68 25.30 20.10
Gunny bag/shopping bag 18.75 15.73 16.25 12.91
Market toll/Khajna 8.22 6.90 7.02 5.57
Sweeper 4.58 3.84 6.00 4.77
Personal expenses 15.50 13.00 18.36 14.59
Total 119.20 100.00 125.85 100.00
11.4.1.3 Marketing cost of bepari for selected vegetables
A bepari bought selected vegetables directly from the spot (farm gate area), primary markets and sometimes from secondary markets and performed the marketing activities from purchase area to terminal market or distance market. The per quintal marketing cost of brinjal and yard long bean by bepari was Tk.355.40 and Tk.344.19 respectively (Table 11.4.3). Among the cost items, transportation cost was the highest representing 34.33 % brinjal and 34.28% for yard long bean of total cost. The second highest cost item was commission to arathdar which accounted for 31.51% brinjal and 33.70% for yard long bean of total cost. Other cost items were loading, unloading, gunny bag, market toll, personal expenses, tips and donation etc.
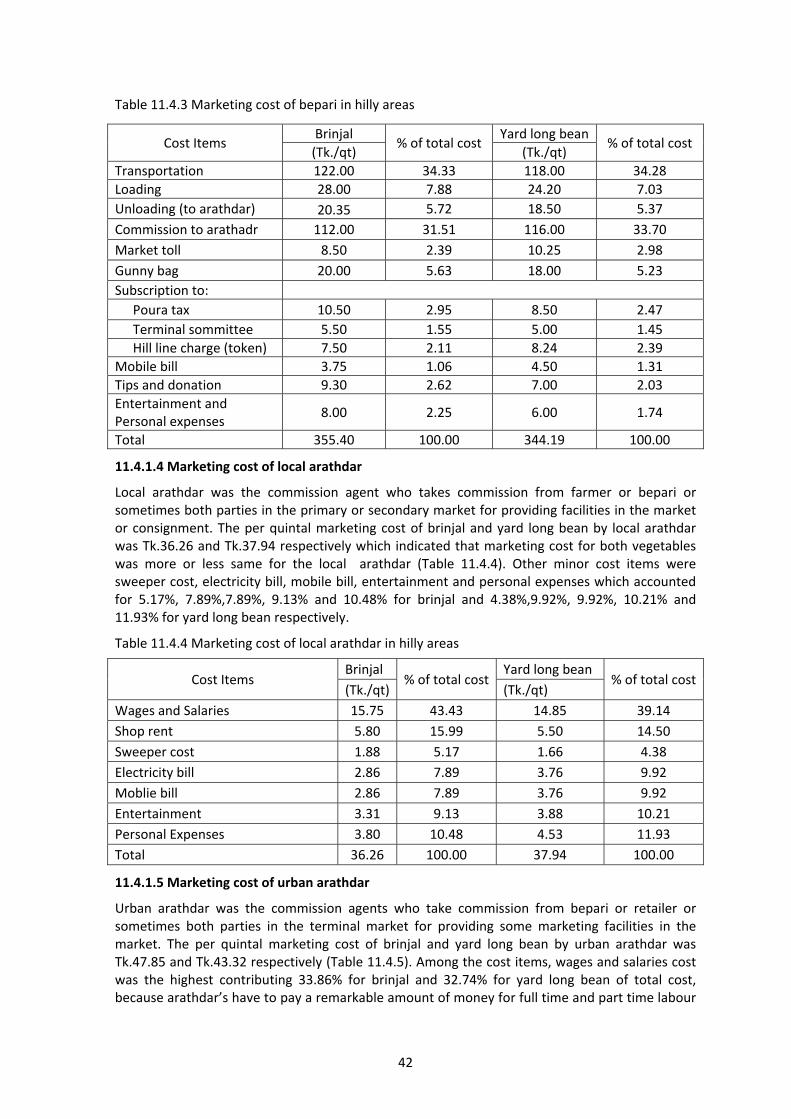
42
Table 11.4.3 Marketing cost of bepari in hilly areas
Cost Items Brinjal
% of total cost Yard long bean
% of total cost (Tk./qt) (Tk./qt)
Transportation 122.00 34.33 118.00 34.28
Loading 28.00 7.88 24.20 7.03
Unloading (to arathdar) 20.35 5.72 18.50 5.37
Commission to arathadr 112.00 31.51 116.00 33.70
Market toll 8.50 2.39 10.25 2.98
Gunny bag 20.00 5.63 18.00 5.23
Subscription to:
Poura tax 10.50 2.95 8.50 2.47
Terminal sommittee 5.50 1.55 5.00 1.45
Hill line charge (token) 7.50 2.11 8.24 2.39
Mobile bill 3.75 1.06 4.50 1.31
Tips and donation 9.30 2.62 7.00 2.03
Entertainment and Personal expenses
8.00 2.25 6.00 1.74
Total 355.40 100.00 344.19 100.00
11.4.1.4 Marketing cost of local arathdar
Local arathdar was the commission agent who takes commission from farmer or bepari or sometimes both parties in the primary or secondary market for providing facilities in the market or consignment. The per quintal marketing cost of brinjal and yard long bean by local arathdar was Tk.36.26 and Tk.37.94 respectively which indicated that marketing cost for both vegetables was more or less same for the local arathdar (Table 11.4.4). Other minor cost items were sweeper cost, electricity bill, mobile bill, entertainment and personal expenses which accounted for 5.17%, 7.89%,7.89%, 9.13% and 10.48% for brinjal and 4.38%,9.92%, 9.92%, 10.21% and 11.93% for yard long bean respectively.
Table 11.4.4 Marketing cost of local arathdar in hilly areas
Cost Items Brinjal
% of total costYard long bean
% of total cost(Tk./qt) (Tk./qt)
Wages and Salaries 15.75 43.43 14.85 39.14
Shop rent 5.80 15.99 5.50 14.50
Sweeper cost 1.88 5.17 1.66 4.38
Electricity bill 2.86 7.89 3.76 9.92
Moblie bill 2.86 7.89 3.76 9.92
Entertainment 3.31 9.13 3.88 10.21
Personal Expenses 3.80 10.48 4.53 11.93
Total 36.26 100.00 37.94 100.00
11.4.1.5 Marketing cost of urban arathdar
Urban arathdar was the commission agents who take commission from bepari or retailer or sometimes both parties in the terminal market for providing some marketing facilities in the market. The per quintal marketing cost of brinjal and yard long bean by urban arathdar was Tk.47.85 and Tk.43.32 respectively (Table 11.4.5). Among the cost items, wages and salaries cost was the highest contributing 33.86% for brinjal and 32.74% for yard long bean of total cost, because arathdar’s have to pay a remarkable amount of money for full time and part time labour
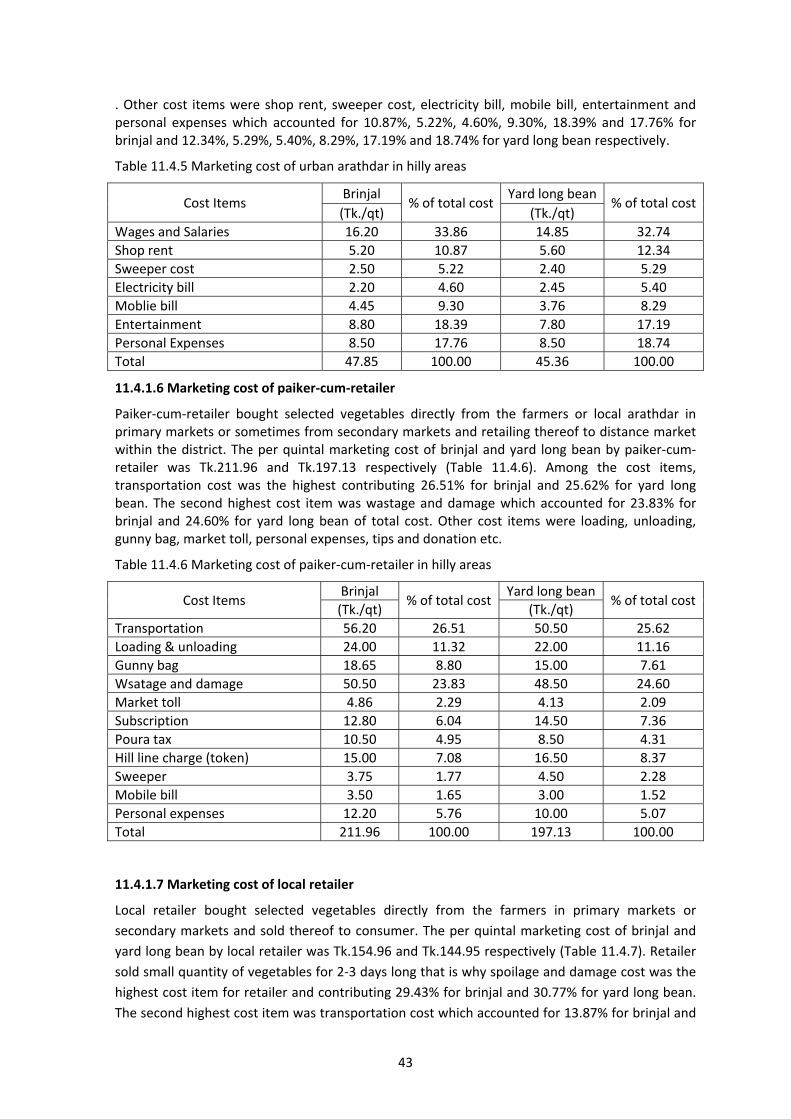
43
. Other cost items were shop rent, sweeper cost, electricity bill, mobile bill, entertainment and personal expenses which accounted for 10.87%, 5.22%, 4.60%, 9.30%, 18.39% and 17.76% for brinjal and 12.34%, 5.29%, 5.40%, 8.29%, 17.19% and 18.74% for yard long bean respectively.
Table 11.4.5 Marketing cost of urban arathdar in hilly areas
Cost Items Brinjal
% of total costYard long bean
% of total cost(Tk./qt) (Tk./qt)
Wages and Salaries 16.20 33.86 14.85 32.74
Shop rent 5.20 10.87 5.60 12.34
Sweeper cost 2.50 5.22 2.40 5.29
Electricity bill 2.20 4.60 2.45 5.40
Moblie bill 4.45 9.30 3.76 8.29
Entertainment 8.80 18.39 7.80 17.19
Personal Expenses 8.50 17.76 8.50 18.74
Total 47.85 100.00 45.36 100.00
11.4.1.6 Marketing cost of paiker‐cum‐retailer
Paiker‐cum‐retailer bought selected vegetables directly from the farmers or local arathdar in primary markets or sometimes from secondary markets and retailing thereof to distance market within the district. The per quintal marketing cost of brinjal and yard long bean by paiker‐cum‐retailer was Tk.211.96 and Tk.197.13 respectively (Table 11.4.6). Among the cost items, transportation cost was the highest contributing 26.51% for brinjal and 25.62% for yard long bean. The second highest cost item was wastage and damage which accounted for 23.83% for brinjal and 24.60% for yard long bean of total cost. Other cost items were loading, unloading, gunny bag, market toll, personal expenses, tips and donation etc.
Table 11.4.6 Marketing cost of paiker‐cum‐retailer in hilly areas
Cost Items Brinjal
% of total cost Yard long bean
% of total cost (Tk./qt) (Tk./qt)
Transportation 56.20 26.51 50.50 25.62
Loading & unloading 24.00 11.32 22.00 11.16
Gunny bag 18.65 8.80 15.00 7.61
Wsatage and damage 50.50 23.83 48.50 24.60
Market toll 4.86 2.29 4.13 2.09
Subscription 12.80 6.04 14.50 7.36
Poura tax 10.50 4.95 8.50 4.31
Hill line charge (token) 15.00 7.08 16.50 8.37
Sweeper 3.75 1.77 4.50 2.28
Mobile bill 3.50 1.65 3.00 1.52
Personal expenses 12.20 5.76 10.00 5.07
Total 211.96 100.00 197.13 100.00
11.4.1.7 Marketing cost of local retailer
Local retailer bought selected vegetables directly from the farmers in primary markets or
secondary markets and sold thereof to consumer. The per quintal marketing cost of brinjal and
yard long bean by local retailer was Tk.154.96 and Tk.144.95 respectively (Table 11.4.7). Retailer
sold small quantity of vegetables for 2‐3 days long that is why spoilage and damage cost was the
highest cost item for retailer and contributing 29.43% for brinjal and 30.77% for yard long bean.
The second highest cost item was transportation cost which accounted for 13.87% for brinjal and
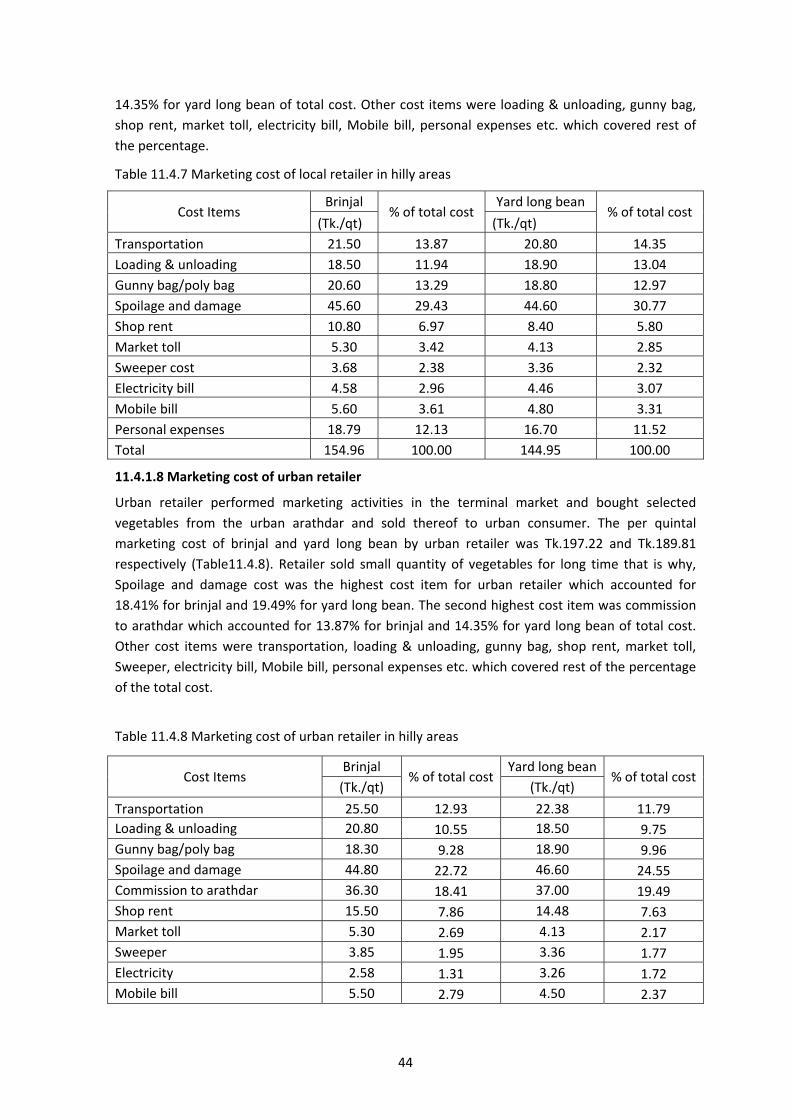
44
14.35% for yard long bean of total cost. Other cost items were loading & unloading, gunny bag,
shop rent, market toll, electricity bill, Mobile bill, personal expenses etc. which covered rest of
the percentage.
Table 11.4.7 Marketing cost of local retailer in hilly areas
Cost Items Brinjal
% of total cost Yard long bean
% of total cost (Tk./qt) (Tk./qt)
Transportation 21.50 13.87 20.80 14.35
Loading & unloading 18.50 11.94 18.90 13.04
Gunny bag/poly bag 20.60 13.29 18.80 12.97
Spoilage and damage 45.60 29.43 44.60 30.77
Shop rent 10.80 6.97 8.40 5.80
Market toll 5.30 3.42 4.13 2.85
Sweeper cost 3.68 2.38 3.36 2.32
Electricity bill 4.58 2.96 4.46 3.07
Mobile bill 5.60 3.61 4.80 3.31
Personal expenses 18.79 12.13 16.70 11.52
Total 154.96 100.00 144.95 100.00
11.4.1.8 Marketing cost of urban retailer
Urban retailer performed marketing activities in the terminal market and bought selected
vegetables from the urban arathdar and sold thereof to urban consumer. The per quintal
marketing cost of brinjal and yard long bean by urban retailer was Tk.197.22 and Tk.189.81
respectively (Table11.4.8). Retailer sold small quantity of vegetables for long time that is why,
Spoilage and damage cost was the highest cost item for urban retailer which accounted for
18.41% for brinjal and 19.49% for yard long bean. The second highest cost item was commission
to arathdar which accounted for 13.87% for brinjal and 14.35% for yard long bean of total cost.
Other cost items were transportation, loading & unloading, gunny bag, shop rent, market toll,
Sweeper, electricity bill, Mobile bill, personal expenses etc. which covered rest of the percentage
of the total cost.
Table 11.4.8 Marketing cost of urban retailer in hilly areas
Cost Items Brinjal
% of total costYard long bean
% of total cost(Tk./qt) (Tk./qt)
Transportation 25.50 12.93 22.38 11.79
Loading & unloading 20.80 10.55 18.50 9.75
Gunny bag/poly bag 18.30 9.28 18.90 9.96
Spoilage and damage 44.80 22.72 46.60 24.55
Commission to arathdar 36.30 18.41 37.00 19.49
Shop rent 15.50 7.86 14.48 7.63
Market toll 5.30 2.69 4.13 2.17
Sweeper 3.85 1.95 3.36 1.77
Electricity 2.58 1.31 3.26 1.72
Mobile bill 5.50 2.79 4.50 2.37
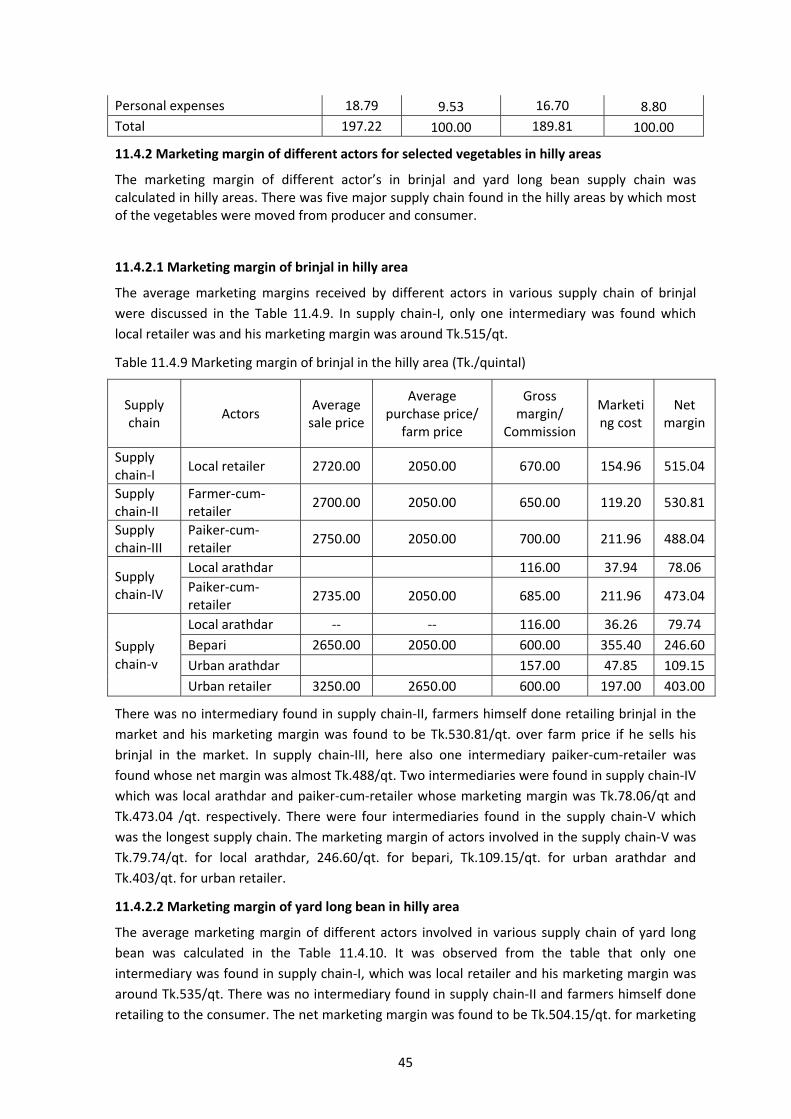
45
Personal expenses 18.79 9.53 16.70 8.80
Total 197.22 100.00 189.81 100.00
11.4.2 Marketing margin of different actors for selected vegetables in hilly areas
The marketing margin of different actor’s in brinjal and yard long bean supply chain was calculated in hilly areas. There was five major supply chain found in the hilly areas by which most of the vegetables were moved from producer and consumer.
11.4.2.1 Marketing margin of brinjal in hilly area
The average marketing margins received by different actors in various supply chain of brinjal
were discussed in the Table 11.4.9. In supply chain‐I, only one intermediary was found which
local retailer was and his marketing margin was around Tk.515/qt.
Table 11.4.9 Marketing margin of brinjal in the hilly area (Tk./quintal)
Supply chain
Actors Average sale price
Average purchase price/
farm price
Gross margin/
Commission
Marketing cost
Net margin
Supply chain‐I
Local retailer 2720.00 2050.00 670.00 154.96 515.04
Supply chain‐II
Farmer‐cum‐retailer
2700.00 2050.00 650.00 119.20 530.81
Supply chain‐III
Paiker‐cum‐retailer
2750.00 2050.00 700.00 211.96 488.04
Supply chain‐IV
Local arathdar 116.00 37.94 78.06
Paiker‐cum‐retailer
2735.00 2050.00 685.00 211.96 473.04
Supply chain‐v
Local arathdar ‐‐ ‐‐ 116.00 36.26 79.74
Bepari 2650.00 2050.00 600.00 355.40 246.60
Urban arathdar 157.00 47.85 109.15
Urban retailer 3250.00 2650.00 600.00 197.00 403.00
There was no intermediary found in supply chain‐II, farmers himself done retailing brinjal in the
market and his marketing margin was found to be Tk.530.81/qt. over farm price if he sells his
brinjal in the market. In supply chain‐III, here also one intermediary paiker‐cum‐retailer was
found whose net margin was almost Tk.488/qt. Two intermediaries were found in supply chain‐IV
which was local arathdar and paiker‐cum‐retailer whose marketing margin was Tk.78.06/qt and
Tk.473.04 /qt. respectively. There were four intermediaries found in the supply chain‐V which
was the longest supply chain. The marketing margin of actors involved in the supply chain‐V was
Tk.79.74/qt. for local arathdar, 246.60/qt. for bepari, Tk.109.15/qt. for urban arathdar and
Tk.403/qt. for urban retailer.
11.4.2.2 Marketing margin of yard long bean in hilly area
The average marketing margin of different actors involved in various supply chain of yard long
bean was calculated in the Table 11.4.10. It was observed from the table that only one
intermediary was found in supply chain‐I, which was local retailer and his marketing margin was
around Tk.535/qt. There was no intermediary found in supply chain‐II and farmers himself done
retailing to the consumer. The net marketing margin was found to be Tk.504.15/qt. for marketing
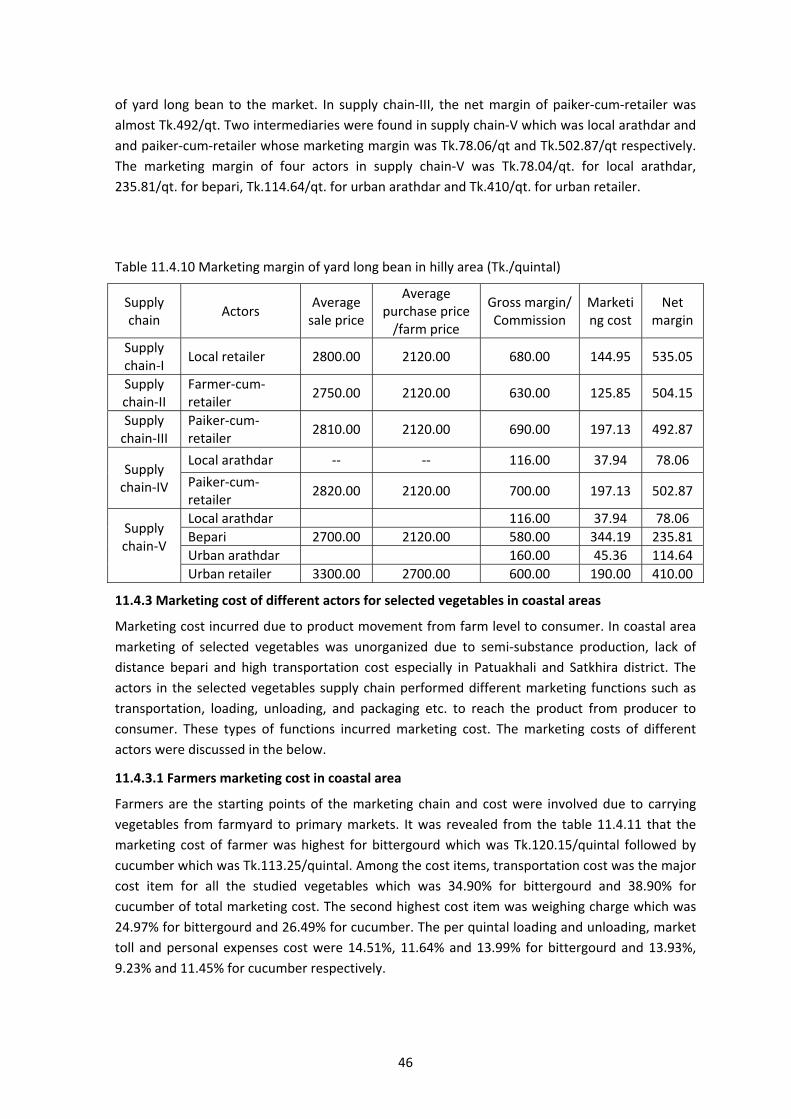
46
of yard long bean to the market. In supply chain‐III, the net margin of paiker‐cum‐retailer was
almost Tk.492/qt. Two intermediaries were found in supply chain‐V which was local arathdar and
and paiker‐cum‐retailer whose marketing margin was Tk.78.06/qt and Tk.502.87/qt respectively.
The marketing margin of four actors in supply chain‐V was Tk.78.04/qt. for local arathdar,
235.81/qt. for bepari, Tk.114.64/qt. for urban arathdar and Tk.410/qt. for urban retailer.
Table 11.4.10 Marketing margin of yard long bean in hilly area (Tk./quintal)
Supply chain
Actors Average sale price
Average purchase price /farm price
Gross margin/ Commission
Marketing cost
Net margin
Supply chain‐I
Local retailer 2800.00 2120.00 680.00 144.95 535.05
Supply chain‐II
Farmer‐cum‐retailer
2750.00 2120.00 630.00 125.85 504.15
Supply chain‐III
Paiker‐cum‐retailer
2810.00 2120.00 690.00 197.13 492.87
Supply chain‐IV
Local arathdar ‐‐ ‐‐ 116.00 37.94 78.06
Paiker‐cum‐retailer
2820.00 2120.00 700.00 197.13 502.87
Supply chain‐V
Local arathdar 116.00 37.94 78.06
Bepari 2700.00 2120.00 580.00 344.19 235.81
Urban arathdar 160.00 45.36 114.64
Urban retailer 3300.00 2700.00 600.00 190.00 410.00
11.4.3 Marketing cost of different actors for selected vegetables in coastal areas
Marketing cost incurred due to product movement from farm level to consumer. In coastal area
marketing of selected vegetables was unorganized due to semi‐substance production, lack of
distance bepari and high transportation cost especially in Patuakhali and Satkhira district. The
actors in the selected vegetables supply chain performed different marketing functions such as
transportation, loading, unloading, and packaging etc. to reach the product from producer to
consumer. These types of functions incurred marketing cost. The marketing costs of different
actors were discussed in the below.
11.4.3.1 Farmers marketing cost in coastal area
Farmers are the starting points of the marketing chain and cost were involved due to carrying
vegetables from farmyard to primary markets. It was revealed from the table 11.4.11 that the
marketing cost of farmer was highest for bittergourd which was Tk.120.15/quintal followed by
cucumber which was Tk.113.25/quintal. Among the cost items, transportation cost was the major
cost item for all the studied vegetables which was 34.90% for bittergourd and 38.90% for
cucumber of total marketing cost. The second highest cost item was weighing charge which was
24.97% for bittergourd and 26.49% for cucumber. The per quintal loading and unloading, market
toll and personal expenses cost were 14.51%, 11.64% and 13.99% for bittergourd and 13.93%,
9.23% and 11.45% for cucumber respectively.
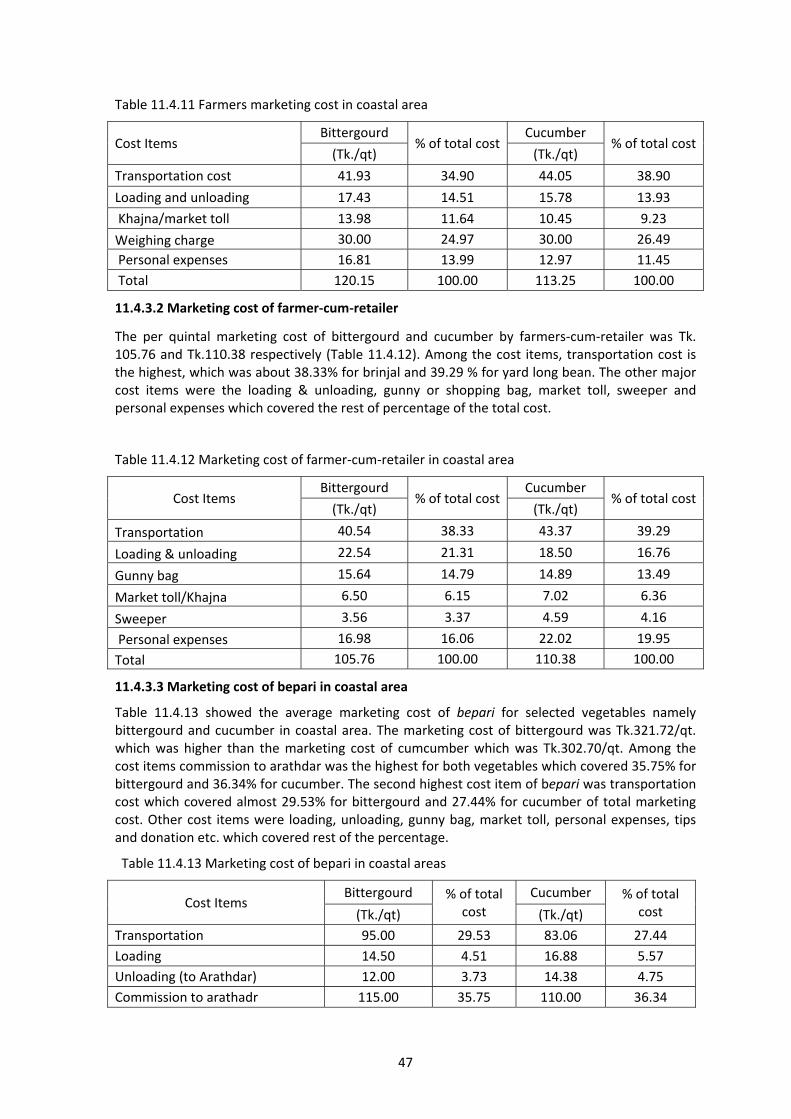
47
Table 11.4.11 Farmers marketing cost in coastal area
Cost Items Bittergourd
% of total costCucumber
% of total cost(Tk./qt) (Tk./qt)
Transportation cost 41.93 34.90 44.05 38.90
Loading and unloading 17.43 14.51 15.78 13.93
Khajna/market toll 13.98 11.64 10.45 9.23
Weighing charge 30.00 24.97 30.00 26.49
Personal expenses 16.81 13.99 12.97 11.45
Total 120.15 100.00 113.25 100.00
11.4.3.2 Marketing cost of farmer‐cum‐retailer
The per quintal marketing cost of bittergourd and cucumber by farmers‐cum‐retailer was Tk. 105.76 and Tk.110.38 respectively (Table 11.4.12). Among the cost items, transportation cost is the highest, which was about 38.33% for brinjal and 39.29 % for yard long bean. The other major cost items were the loading & unloading, gunny or shopping bag, market toll, sweeper and personal expenses which covered the rest of percentage of the total cost.
Table 11.4.12 Marketing cost of farmer‐cum‐retailer in coastal area
Cost Items Bittergourd
% of total costCucumber
% of total cost(Tk./qt) (Tk./qt)
Transportation 40.54 38.33 43.37 39.29
Loading & unloading 22.54 21.31 18.50 16.76
Gunny bag 15.64 14.79 14.89 13.49
Market toll/Khajna 6.50 6.15 7.02 6.36
Sweeper 3.56 3.37 4.59 4.16
Personal expenses 16.98 16.06 22.02 19.95
Total 105.76 100.00 110.38 100.00
11.4.3.3 Marketing cost of bepari in coastal area
Table 11.4.13 showed the average marketing cost of bepari for selected vegetables namely bittergourd and cucumber in coastal area. The marketing cost of bittergourd was Tk.321.72/qt. which was higher than the marketing cost of cumcumber which was Tk.302.70/qt. Among the cost items commission to arathdar was the highest for both vegetables which covered 35.75% for bittergourd and 36.34% for cucumber. The second highest cost item of bepari was transportation cost which covered almost 29.53% for bittergourd and 27.44% for cucumber of total marketing cost. Other cost items were loading, unloading, gunny bag, market toll, personal expenses, tips and donation etc. which covered rest of the percentage.
Table 11.4.13 Marketing cost of bepari in coastal areas
Cost Items Bittergourd % of total
cost
Cucumber % of total cost (Tk./qt) (Tk./qt)
Transportation 95.00 29.53 83.06 27.44
Loading 14.50 4.51 16.88 5.57
Unloading (to Arathdar) 12.00 3.73 14.38 4.75
Commission to arathadr 115.00 35.75 110.00 36.34
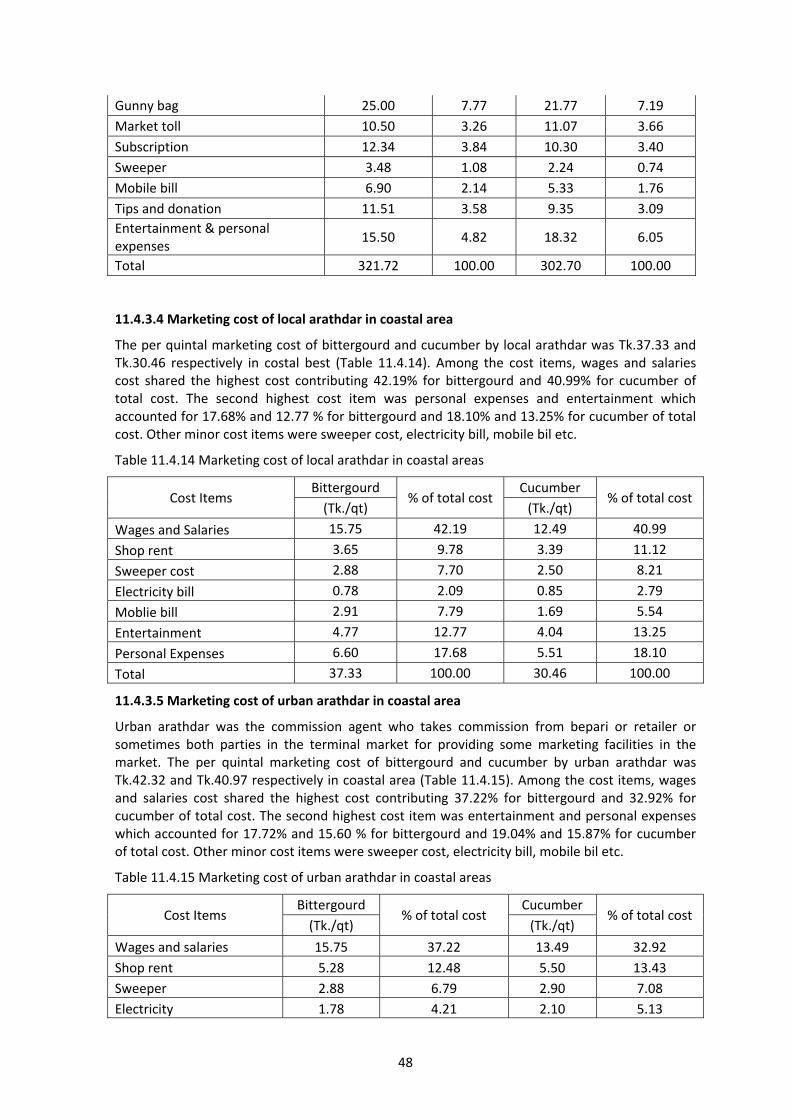
48
Gunny bag 25.00 7.77 21.77 7.19
Market toll 10.50 3.26 11.07 3.66
Subscription 12.34 3.84 10.30 3.40
Sweeper 3.48 1.08 2.24 0.74
Mobile bill 6.90 2.14 5.33 1.76
Tips and donation 11.51 3.58 9.35 3.09
Entertainment & personal expenses
15.50 4.82 18.32 6.05
Total 321.72 100.00 302.70 100.00
11.4.3.4 Marketing cost of local arathdar in coastal area
The per quintal marketing cost of bittergourd and cucumber by local arathdar was Tk.37.33 and Tk.30.46 respectively in costal best (Table 11.4.14). Among the cost items, wages and salaries cost shared the highest cost contributing 42.19% for bittergourd and 40.99% for cucumber of total cost. The second highest cost item was personal expenses and entertainment which accounted for 17.68% and 12.77 % for bittergourd and 18.10% and 13.25% for cucumber of total cost. Other minor cost items were sweeper cost, electricity bill, mobile bil etc.
Table 11.4.14 Marketing cost of local arathdar in coastal areas
Cost Items Bittergourd
% of total cost Cucumber
% of total cost (Tk./qt) (Tk./qt)
Wages and Salaries 15.75 42.19 12.49 40.99
Shop rent 3.65 9.78 3.39 11.12
Sweeper cost 2.88 7.70 2.50 8.21
Electricity bill 0.78 2.09 0.85 2.79
Moblie bill 2.91 7.79 1.69 5.54
Entertainment 4.77 12.77 4.04 13.25
Personal Expenses 6.60 17.68 5.51 18.10
Total 37.33 100.00 30.46 100.00
11.4.3.5 Marketing cost of urban arathdar in coastal area
Urban arathdar was the commission agent who takes commission from bepari or retailer or sometimes both parties in the terminal market for providing some marketing facilities in the market. The per quintal marketing cost of bittergourd and cucumber by urban arathdar was Tk.42.32 and Tk.40.97 respectively in coastal area (Table 11.4.15). Among the cost items, wages and salaries cost shared the highest cost contributing 37.22% for bittergourd and 32.92% for cucumber of total cost. The second highest cost item was entertainment and personal expenses which accounted for 17.72% and 15.60 % for bittergourd and 19.04% and 15.87% for cucumber of total cost. Other minor cost items were sweeper cost, electricity bill, mobile bil etc.
Table 11.4.15 Marketing cost of urban arathdar in coastal areas
Cost Items Bittergourd
% of total cost Cucumber
% of total cost (Tk./qt) (Tk./qt)
Wages and salaries 15.75 37.22 13.49 32.92
Shop rent 5.28 12.48 5.50 13.43
Sweeper 2.88 6.79 2.90 7.08
Electricity 1.78 4.21 2.10 5.13

49
Moblie 2.53 5.98 2.68 6.54
Entertainment 7.50 17.72 7.80 19.04
Personal Expenses 6.60 15.60 6.50 15.87
Total 42.32 100.00 40.97 100.00
11.4.3.6 Marketing cost of paiker‐cum‐retailer in coastal areas
Paiker‐cum‐retailer bought selected vegetables directly from the farmers or local arathdar in
primary markets or sometimes from secondary markets and retailing thereof to distance market
within the district. The per quintal marketing cost of bittergourd and cucumber by paiker‐cum‐
retailer was Tk.167.94 and Tk.161.64 respectively (Table 11.4.16).
Table 11.4.16 Marketing cost of paiker‐cum‐retailer in coastal areas
Cost Items Bittergourd
% of total costCucumber
% of total cost(Tk./qt) (Tk./qt)
Transportation 50.00 29.77 45.50 28.15
Loading & unloading 24.00 14.29 22.00 13.61
Gunny bag/poly bag 18.65 11.11 15.00 9.28
Wsatage and damage 42.30 25.19 46.90 29.02
Market toll/Khajna 8.86 5.28 9.20 5.69
Sweeper 4.28 2.55 4.00 2.47
Mobile bill 5.55 3.30 6.50 4.02
Personal expenses 14.30 8.51 12.54 7.76
Total 167.94 100.00 161.64 100.00
Among the cost items, transportation cost was the highest contributing 29.77% for brinjal and
28.15% for yard long bean. The second highest cost item was wastage and damage which
accounted for 25.19% bittergourd and 29.02% for cucumber of total cost. Other cost items were
loading, unloading, gunny bag, market toll, personal expenses, tips and donation etc.
11.4.3.7 Marketing cost of local retailer in coastal area
The per quintal marketing cost of bittergourd and cucumber by local retailer was Tk.148.31 and Tk.142.70 respectively (Table 11.4.17). Retailer sold small quantity of vegetables for 2‐3 days long that is why spoilage and damage cost was the highest cost item for retailer and contributing 26.16% for bittergourd and 28.45% for cucumber of total cost. The second highest cost item was transportation cost which accounted for 17.79% for bittergourd and 16.69% for cucumber of total cost. Other cost items were loading & unloading, gunny bag, shop rent, market toll, electricity bill, Mobile bill, personal expenses etc. which covered rest of the percentage of total cost
Table 11.4.17 Marketing cost of local retailer in coastal areas
Cost Items Bittergourd
% of total costCucumber
% of total cost(Tk./qt) (Tk./qt)
Transportation 24.60 17.79 22.65 16.69
Loading & unloading 18.75 13.56 18.00 13.26
Gunny bag/poly bag 18.50 13.38 16.60 12.23
Spoilage and damage 38.80 28.05 40.60 29.92
Shop rent 8.54 6.17 9.85 7.26

50
Market toll 3.65 2.64 3.62 2.67
Sweeper 3.05 2.21 1.19 0.88
Electricity 1.49 1.08 2.13 1.57
Mobile bill 4.92 3.56 4.04 2.98
Personal expenses 16.02 11.58 17.02 12.54
Total 138.31 100.00 135.70 100.00
11.4.3.8 Marketing cost of urban retailer in coastal area
Table 11.4.18 showed the per quintal marketing cost of bittergourd and cucumber by local retailer was Tk.187.87 and Tk.180.65 respectively. It was revealed from the table that spoilage and damage cost was the highest cost item for urban retailer and contributing 24.86% for bittergourd and 26.96% for cucumber of total cost. The second highest cost item was commission to arathdar which accounted for 18.26% for bittergourd and 16.79% for cucumber of total cost. Other cost items were transportation, loading & unloading, gunny bag, shop rent, market toll, sweeper cost, electricity bill, Mobile bill and personal expenses etc. which covered rest of the percentage of total cost.
Table 11.4.18 Marketing cost of urban retailer in coastal area
Cost Items Bittergourd
% of total cost Cucumber
% of total cost(Tk./qt) (Tk./qt)
Transportation 21.85 11.63 22.80 12.62
Loading & unloading 20.90 11.12 18.70 10.35
Gunny bag/poly bag 18.50 9.85 16.60 9.19
Wsatage and damage 46.70 24.86 48.70 26.96
Commission to arathdar 34.30 18.26 30.34 16.79
Shop rent 14.50 7.72 12.50 6.92
Market toll 3.65 1.94 3.62 2.00
Sweeper 3.05 1.62 2.19 1.21
Electricity 3.49 1.86 4.14 2.29
Mobile bill 4.92 2.62 4.04 2.24
personal expenses 16.02 8.53 17.02 9.42
Total 187.87 100.00 180.65 100.00
11.4.4 Marketing margin of different actors for selected vegetables in coastal areas
Four major supply chains were identified for bittergourd and cucumber marketing in coastal areas. The marketing margin of different actors was calculated along the supply chain of selected vegetables in coastal area. Four major supply chains were found in the coastal belt by which most of the vegetables were moved from producer and consumer.
11.4.4.1 Marketing margin of bittergourd in the coastal areas
The average marketing margin received by different actors in various supply chain of bittergourd was presented in the Table 11.4.19. It was observed from the table that only one intermediary was found in supply chain‐I which was local retailer and his marketing margin was around Tk.548/qt. In supply chain‐II, the net margin of two intermediaries’ local arathdar and paiker‐cum‐retailer was Tk.77.67/qt. and 529.06/qt. respectively. There was no any intermediary found
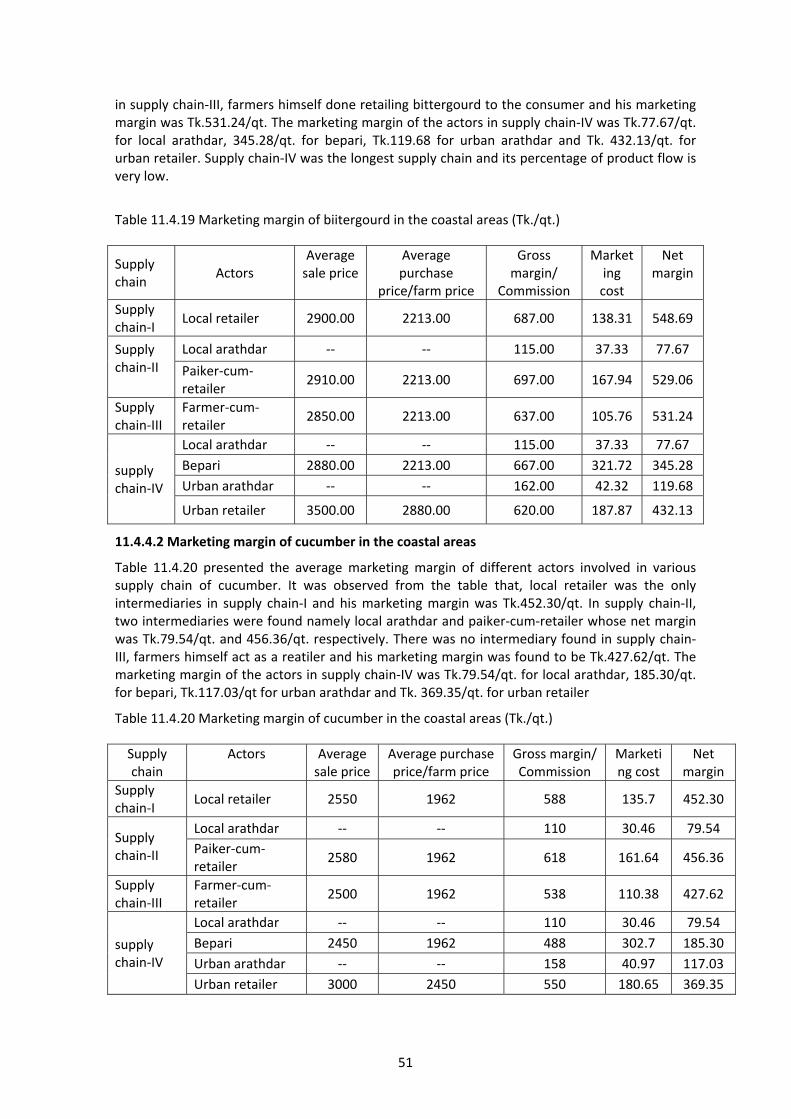
51
in supply chain‐III, farmers himself done retailing bittergourd to the consumer and his marketing margin was Tk.531.24/qt. The marketing margin of the actors in supply chain‐IV was Tk.77.67/qt. for local arathdar, 345.28/qt. for bepari, Tk.119.68 for urban arathdar and Tk. 432.13/qt. for urban retailer. Supply chain‐IV was the longest supply chain and its percentage of product flow is very low.
Table 11.4.19 Marketing margin of biitergourd in the coastal areas (Tk./qt.)
Supply chain
Actors Average sale price
Average purchase
price/farm price
Gross margin/
Commission
Marketing cost
Net margin
Supply chain‐I
Local retailer 2900.00 2213.00 687.00 138.31 548.69
Supply chain‐II
Local arathdar ‐‐ ‐‐ 115.00 37.33 77.67
Paiker‐cum‐retailer
2910.00 2213.00 697.00 167.94 529.06
Supply chain‐III
Farmer‐cum‐retailer
2850.00 2213.00 637.00 105.76 531.24
supply chain‐IV
Local arathdar ‐‐ ‐‐ 115.00 37.33 77.67
Bepari 2880.00 2213.00 667.00 321.72 345.28
Urban arathdar ‐‐ ‐‐ 162.00 42.32 119.68
Urban retailer 3500.00 2880.00 620.00 187.87 432.13
11.4.4.2 Marketing margin of cucumber in the coastal areas
Table 11.4.20 presented the average marketing margin of different actors involved in various supply chain of cucumber. It was observed from the table that, local retailer was the only intermediaries in supply chain‐I and his marketing margin was Tk.452.30/qt. In supply chain‐II, two intermediaries were found namely local arathdar and paiker‐cum‐retailer whose net margin was Tk.79.54/qt. and 456.36/qt. respectively. There was no intermediary found in supply chain‐III, farmers himself act as a reatiler and his marketing margin was found to be Tk.427.62/qt. The marketing margin of the actors in supply chain‐IV was Tk.79.54/qt. for local arathdar, 185.30/qt. for bepari, Tk.117.03/qt for urban arathdar and Tk. 369.35/qt. for urban retailer
Table 11.4.20 Marketing margin of cucumber in the coastal areas (Tk./qt.)
Supply chain
Actors Average sale price
Average purchase price/farm price
Gross margin/ Commission
Marketing cost
Net margin
Supply chain‐I
Local retailer 2550 1962 588 135.7 452.30
Supply chain‐II
Local arathdar ‐‐ ‐‐ 110 30.46 79.54
Paiker‐cum‐retailer
2580 1962 618 161.64 456.36
Supply chain‐III
Farmer‐cum‐retailer
2500 1962 538 110.38 427.62
supply chain‐IV
Local arathdar ‐‐ ‐‐ 110 30.46 79.54
Bepari 2450 1962 488 302.7 185.30
Urban arathdar ‐‐ ‐‐ 158 40.97 117.03
Urban retailer 3000 2450 550 180.65 369.35

52
CHAPTER 11.5
MARKETING EFFICIENCY OF SELECTED VEGETABLES IN HILLY AND COASTAL AREA
Marketing efficiency is directly related to the cost and margin involved in moving goods from the producer to the consumer and the quantity of services offered. If the incurred cost is low with compared to the service involved, it will be efficient marketing system. The improvement of marketing efficiency means the reduction of marketing cost without reducing the quantum of services offered to the consumer. Marketing efficiency is a complicated topic to be defined. It varies different meaning to different persons. Marketing efficiency is the maximization of input output ratio (Kohls and Uhls, 1990)
Efficient marketing of vegetables is considered to be more complex than its production. In hilly and coastal areas due to little access to the urban market and the involvement of a number of intermediaries in the selected vegetables marketing, the smallholder farmers mostly sell their vegetables to the local consumers and traders at a lower price. Thus, the aim of the study is to identify the efficient marketing chain of the selected vegetables.
11.5.1 Marketing efficiency of selected vegetables in hilly areas
There were five major supply chains identified in the hilly areas. Among the five supply chains, four chains supplied vegetables within the local consumer. Only one chain delivered local vegetables to the urban consumer which was supply chain‐V. The marketing efficiency of brinjal and yard long been supply chain was discussed in the following section.
11.5.1.1 Marketing efficiency of different supply chain of brinjal
Marketing efficiency of different supply chain of brinjal was identified in terms of four performance indicators out six performances indicators such as producer share, marketing cost, middlemen marketing margin and deviation between maximum and minimum prices. Peak and lean season price variability is ignored here because it was difficult to identify peak and lean season prices in the study areas. Because selected vegetables were produced year round in the study areas.
11.5.1.1.1 Producer’s share of different brinjal supply chain
The producers’ share in the consumer’s prices of brinjal in different supply chain was shown in Table 11.5.1. Producers’ share was the highest in supply chain‐II and lowest in channel‐V in the study areas. It means that the farmers got highest benefit by selling their vegetables directly to the consumer instead of intermediaries. Producers share was found to be lowest in the supply chain V, it was due to large number of intermediaries involved here and it was ranked V. The producers share of other others supply chains were more or less the same.
11.5.1.1.2 Marketing cost and margin of actors in different brinjal supply chain
The supply chain‐V of brinjal marketing has incurred highest marketing cost whereas the lowest in case of supply chain II (Table 11.5.1). It was revealed that if farmer sell their brinjal through supply chain‐V the marketing cost becomes high. On the other hand, if farmer sell the brinjal through supply chain‐II then the marketing cost was the lowest because farmer sell directly to the consumer. The calculated marketing cost of supply chain‐III and supply chain IV was same for both supply chain. Here only on middlemen was found in supply chain‐III which was paiker‐cum‐retailer and two middlemen was found in supply chain‐IV which was local arathdar and paiker‐cum‐retailer. But marketing cost of the both chain was same in the sense that arathdar commission was the marketing cost of another intermediaries, so arathdar’s cost and margin was

53
not repeated in the chain. The same approach was followed in ranking the margin of middlemen in each supply chain.
Table 11.5.1 Producer share, marketing cost and margin of brinjal supply chain
Particulars
Different supply chain of Brinjal
chain‐I Chain‐II chain‐III Chain‐IV Chain‐V
(Tk./qt) (Tk./qt) (Tk./qt) (Tk./qt) (Tk./qt)
A. Gross price received by the farmer‐cum‐retailer/farmer
2050.00 2700.00 2050.00 2050.00 2050.0
0
a. Marketing cost incurred by the farmer‐cum‐retailer/farmer
114.54 119.20 114.54 114.54 114.54
b. Net price received by the farmer‐cum‐retailer/farmer
1935.46 2580.80 1935.46 1935.46 1935.4
6
B. Gross margin received by the Bepari ‐‐ ‐‐ ‐‐ ‐‐ 600.00
a. Marketing cost incurred by the Bepari ‐‐ ‐‐ ‐‐ ‐‐ 355.40
b. Net margin received by the Bepari ‐‐ ‐‐ ‐‐ ‐‐ 244.60
C. Gross margin received by the paiker‐cum‐retailer
‐‐ ‐‐ 700.00 685.00 ‐‐
a. Marketing cost incurred by the paiker‐cum‐retailer
‐‐ ‐‐ 211.96 211.96 ‐‐
b. Net margin received by the paiker‐cum‐retailer
‐‐ ‐‐ 488.04 473.04 ‐‐
D. Gross margin received by the local retailer
670.00 ‐‐ ‐‐ ‐‐ ‐‐
a. Marketing cost incurred by the local retailer
154.96
‐‐ ‐‐ ‐‐
b. Net margin received by the local retailer
515.04 ‐‐ ‐‐ ‐‐ ‐‐
E. Gross margin received by the urban retailer
‐‐ ‐ ‐‐ ‐‐ 600.00
a. Marketing cost incurred by the urban retailer
‐‐ ‐‐ ‐‐ ‐‐ 197.00
b. Net margin received by the urban retailer
‐‐ ‐‐ ‐‐ ‐‐ 403.00
F. Price paid by the consumers (A+B+C+D+E+F)
2720.00 2700.00 2750.00 2735.00 3250.0
0
G. Producer share in consumer Taka (%) 71.16 95.59 70.38 70.77 59.55
Rank (I1) II I IV III V
H. Total marketing cost 269.50 119.20 326.50 326.50 666.94
Rank (I2) II I III III IV
I. Total marketing margin 515.04 0.00 488.04 473.04 647.60
Rank (I3) IV I III II V
11.5.1.1.3 Deviation between maximum and minimum prices brinjal supply chains
Price deviation means the differences of maximum and minimum prices of brinjal in a month. The differences between maximum and minimum prices of each month were calculated and finally the differences of all months were summed up and then the average deviation was calculated. It may be observed from the table 11.5.2 that Chain‐II incurred lowest price deviation followed by

54
Channel‐I. Price deviation was the highest in Channel‐V. It might be reason of longest supply chain among the five chains.
Table 11.5.2 Price deviation between of brinjal in different supply chain
Month Chain‐I Chain‐II Chain‐III Chain‐IV Chain‐V
January 675 650 730 700 850
February 775 750 820 800 900
March 800 780 850 820 950
April 930 880 943 980 970
May 850 830 890 880 1080
June 735 720 785 750 880
July 720 700 760 740 850
August 695 680 720 710 750
September 638 625 678 650 760
October 550 550 600 550 700
November 545 510 580 580 650
December 525 500 580 550 690
∑d 8438 8175 8973 8710 10030
N 12 12 12 12 12
D 703 681 748 726 836
Rank (I4) II I IV III V
11.5.1.1.4 Efficient supply chain of brinjal marketing
The efficiency of different supply chain of brinjal was drawn on the basis of ranks of four different performance indicators by using composite index formula. The performance indicator revealed that the supply chain‐III and V were not relatively efficient in the hilly areas of Bangladesh. It was due to comparatively lower prices received by the farmers in the supply chain‐III and V. It was revealed from the table 11.5.3 that the score of final ranking of the supply chain‐II is lowest among the supply chain and it was the most efficient supply chain. It implies that farmers were more benefited if they performed as a retailer.
Table 11.5.3 Final ranking of the efficiency of different brinjal supply chains
Performance indicator Supply Chain ‐I
Supply Chain ‐II
Supply Chain ‐III
Supply Chain ‐IV
Supply Chain ‐V
Producers’ share (I1) II I IV III V
Marketing costs (I2) II I III III IV
Margin to middlemen (I3) IV I III II V
Price deviation (I4) II I IV III V
Composite index (Ri ÷ Ni) 2.5 1 3.5 2.75 4.75
Final ranking 2 1 4 3 5
Ri = Total value of the ranks of performance indicators Ni = Total number of performance indicators
11.5.1.2 Marketing efficiency of different supply chain of yard long bean
The marketing efficiency of yard long bean was estimated in term of producer share, total marketing cost, middlemen marketing margin and price deviation. Table 11.5.4 showed the

55
ranking of producer share, marketing cost and marketing margin of different supply chain of yard long bean.
11.5.1.2.1 Producer’s share of different yard long bean supply chain
The producers’ shares in the consumer’s prices of yard long bean in different supply chain were
shown in table 11.5.4. Producers’ share was the highest in supply chain‐II and lowest in channel‐V
in the study areas. It means that the farmers got highest benefit by selling their vegetables
directly to the consumer instead of intermediaries. Producers share was found to be lowest in the
supply chain‐V, it’s due to large number of intermediaries involved here and it was ranked V.
11.5.1.2.2 Marketing costs and margins of actors in different yard long bean supply chain
The supply chain‐V of yard long bean marketing has incurred highest marketing cost whereas the lowest marketing cost incurred in case of supply chain‐II (table 11.5.4). It revealed that if farmer sell their yard long bean through supply chain‐V the marketing cost becomes high. On the other hand, if farmer sell their yard long bean through supply chain‐II then the marketing cost was the lowest. Because farmers direct sell to the consumer and no intermediary was involved in supply chain‐II. The cost of marketing in the supply chain‐III and supply chain IV was same for both supply chain. Here only on middlemen was found in supply chain‐III which was paiker‐cum‐retailer and two intermediaries were found in supply chain‐V which was local arathdar and paiker‐cum‐retailer. But marketing cost of the both chains was same because arathdar’s commission was the marketing cost of other intermediaries, so arathdar’s cost and margin was not repeated in the chain.
Table 11.5.4 Producer share, marketing cost and margin of yard long bean supply chain
Particulars
Different supply chain of yard long bean
chain‐I Chain‐II chain‐III Chain‐IV Chain‐V
(Tk./qt) (Tk./qt) (Tk./qt) (Tk./qt) (Tk./qt)
A. Gross price received by the farmer‐cum‐retailer
2120.00 2750.00 2120.00 2120.00 2120.00
a. Marketing cost incurred by the farmer‐cum‐retailer
119.18 125.85 119.18 119.18 119.18
b. Net price received by the farmer‐cum‐retailer
2000.82 2624.15 2000.82 2000.82 2000.82
B. Gross margin received by the bepari ‐‐ ‐‐ ‐‐ ‐‐ 580.00
a. Marketing cost incurred by the Bepari ‐‐ ‐‐ ‐‐ ‐‐ 344.19
b. Net margin received by the Bepari ‐‐ ‐‐ ‐‐ ‐‐ 235.81
C. Gross margin received by the paiker‐cum‐retailer
‐‐ ‐‐ 690.00 700.00 ‐‐
a. Marketing cost incurred by the paiker‐cum‐retailer
‐‐ ‐‐ 197.13 197.13 ‐‐
b. Net margin received by the paiker‐cum‐retailer
‐‐ ‐‐ 492.87 502.87 ‐‐
D. Gross margin received by the local retailer
680.00 ‐‐ ‐‐ ‐‐ ‐‐
a. Marketing cost incurred by the local retailer
144.95 ‐‐ ‐‐ ‐‐ ‐‐
b. Net margin received by the local retailer
535.05 ‐‐ ‐‐ ‐‐ ‐‐
E. Gross margin received by the urban ‐‐ ‐‐ ‐‐ ‐‐ 600.00
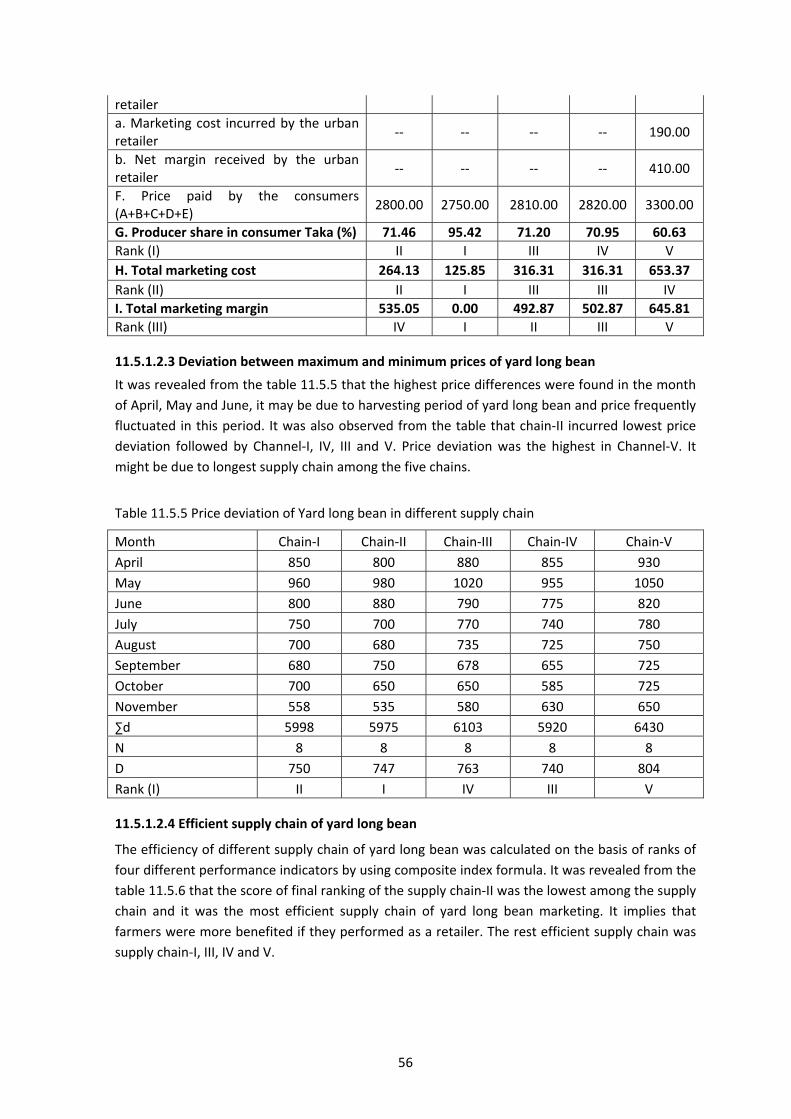
56
retailer
a. Marketing cost incurred by the urban retailer
‐‐ ‐‐ ‐‐ ‐‐ 190.00
b. Net margin received by the urban retailer
‐‐ ‐‐ ‐‐ ‐‐ 410.00
F. Price paid by the consumers (A+B+C+D+E)
2800.00 2750.00 2810.00 2820.00 3300.00
G. Producer share in consumer Taka (%) 71.46 95.42 71.20 70.95 60.63
Rank (I) II I III IV V
H. Total marketing cost 264.13 125.85 316.31 316.31 653.37
Rank (II) II I III III IV
I. Total marketing margin 535.05 0.00 492.87 502.87 645.81
Rank (III) IV I II III V
11.5.1.2.3 Deviation between maximum and minimum prices of yard long bean
It was revealed from the table 11.5.5 that the highest price differences were found in the month
of April, May and June, it may be due to harvesting period of yard long bean and price frequently
fluctuated in this period. It was also observed from the table that chain‐II incurred lowest price
deviation followed by Channel‐I, IV, III and V. Price deviation was the highest in Channel‐V. It
might be due to longest supply chain among the five chains.
Table 11.5.5 Price deviation of Yard long bean in different supply chain
Month Chain‐I Chain‐II Chain‐III Chain‐IV Chain‐V
April 850 800 880 855 930
May 960 980 1020 955 1050
June 800 880 790 775 820
July 750 700 770 740 780
August 700 680 735 725 750
September 680 750 678 655 725
October 700 650 650 585 725
November 558 535 580 630 650
∑d 5998 5975 6103 5920 6430
N 8 8 8 8 8
D 750 747 763 740 804
Rank (I) II I IV III V
11.5.1.2.4 Efficient supply chain of yard long bean
The efficiency of different supply chain of yard long bean was calculated on the basis of ranks of
four different performance indicators by using composite index formula. It was revealed from the
table 11.5.6 that the score of final ranking of the supply chain‐II was the lowest among the supply
chain and it was the most efficient supply chain of yard long bean marketing. It implies that
farmers were more benefited if they performed as a retailer. The rest efficient supply chain was
supply chain‐I, III, IV and V.

57
Table 11.5.6 Final ranking of the efficiency of different yard long bean supply chains
Performance indicator Supply Chain ‐I
Supply Chain ‐II
Supply Chain ‐III
Supply Chain ‐IV
Supply Chain ‐V
Producers’ share (I1) II I III IV V
Marketing costs (I2) II I III III IV
Margin to actors (I3) IV I II III V
Price deviation (I4) II I IV III V
Composite index (Ri ÷ Ni) 2.5 1 3 3.25 4.75
Final ranking 2 1 3 4 5
Ri = Total value of the ranks of performance indicators Ni = Total number of performance indicators
11.5.2 Marketing efficiency of selected vegetables in coastal areas
In coastal area, there were four major supply chains were identified. Among the supply chains three chains were confined within the local consumer. Only one supply chain delivered local vegetables to the urban consumer.
11.5.2.1 Marketing efficiency of different supply chains of bittergourd
The producer shares in consumer price, marketing cost and marketing margin of bittergourd was
presented in the table 11.5.7. The ranking of the producer share, marketing cost and marketing
margin was also presented in this table.
11.5.2.1.1 Producer’s share of bittergourd in different supply chain
The producers’ share was the highest in supply chain‐III and lowest in chain‐IV in bittergourd
marketing. It implies that the farmers got highest benefit by selling bittergourd directly to the
consumer instead of intermediaries. Producers share was found to be lowest in the supply chain
IV, it’s due to large number of actors involved here and it was ranked IV. The producers share of
other others intermediaries were more or less the same (Table 11.5.7).
Table 11.5.7 Producer share, marketing cost and margin of bittergourd supply chain
Particulars
Different supply chain of bittergourd
chain‐I chain‐II Chain‐III Chain‐IV
(Tk./qt) (Tk./qt) (Tk./qt) (Tk./qt)
A. Gross price received by the farmer‐cum‐retailer/farmer
2213 2213 2850 2213
a. Marketing cost incurred by the farmer‐cum‐retailer/farmer
120.15 120.15 105.76 120.15
b. Net price received by the farmer‐cum‐retailer/farmer
2092.85 2092.85 2744.24 2092.85
B. Gross margin received by the bepari ‐‐ ‐‐ ‐‐ 667.00
a. Marketing cost incurred by the bepari ‐‐ ‐‐ ‐‐ 321.72
b. Net margin received by the bepari ‐‐ ‐‐ 345.28
C. Gross margin received by the paiker‐cum‐retailer
‐‐ 697.00 ‐‐ ‐‐
a. Marketing cost incurred by the paiker‐cum‐retailer
‐‐ 167.94 ‐‐ ‐‐
b. Net margin received by the paiker‐cum‐ ‐‐ 529.06 ‐‐ ‐‐
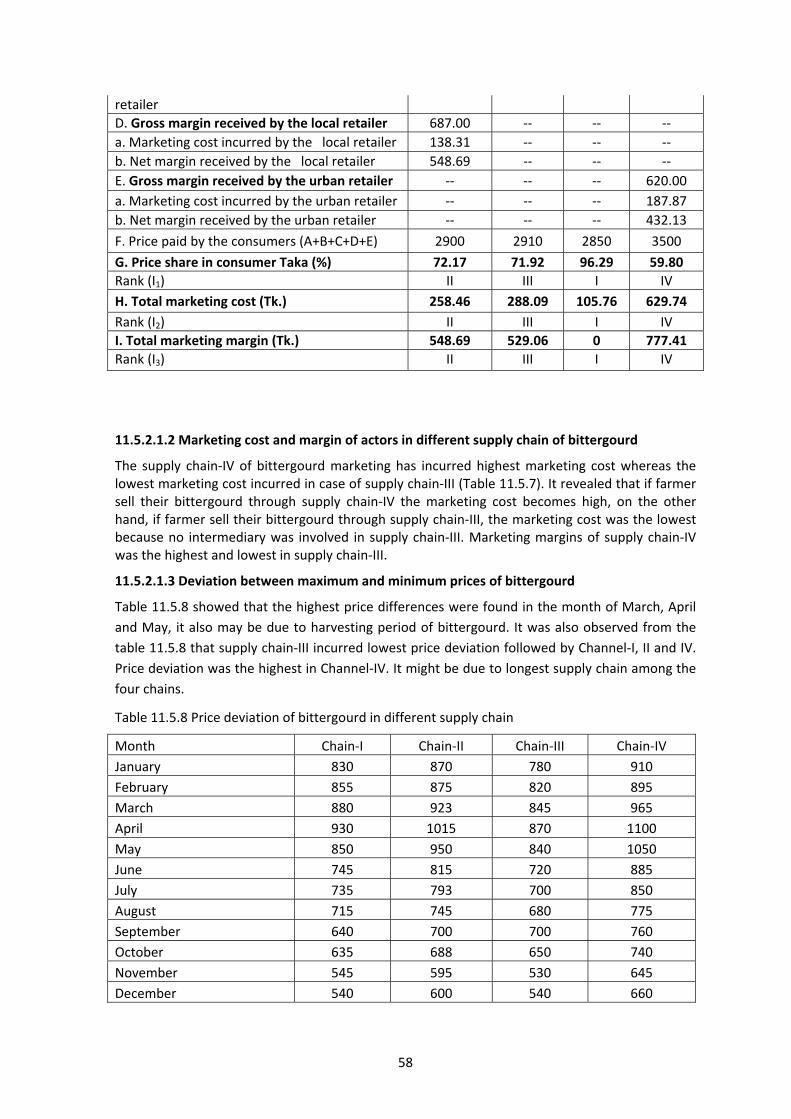
58
retailer
D. Gross margin received by the local retailer 687.00 ‐‐ ‐‐ ‐‐
a. Marketing cost incurred by the local retailer 138.31 ‐‐ ‐‐ ‐‐
b. Net margin received by the local retailer 548.69 ‐‐ ‐‐ ‐‐
E. Gross margin received by the urban retailer ‐‐ ‐‐ ‐‐ 620.00
a. Marketing cost incurred by the urban retailer ‐‐ ‐‐ ‐‐ 187.87
b. Net margin received by the urban retailer ‐‐ ‐‐ ‐‐ 432.13
F. Price paid by the consumers (A+B+C+D+E) 2900 2910 2850 3500
G. Price share in consumer Taka (%) 72.17 71.92 96.29 59.80
Rank (I1) II III I IV
H. Total marketing cost (Tk.) 258.46 288.09 105.76 629.74
Rank (I2) II III I IV
I. Total marketing margin (Tk.) 548.69 529.06 0 777.41
Rank (I3) II III I IV
11.5.2.1.2 Marketing cost and margin of actors in different supply chain of bittergourd
The supply chain‐IV of bittergourd marketing has incurred highest marketing cost whereas the lowest marketing cost incurred in case of supply chain‐III (Table 11.5.7). It revealed that if farmer sell their bittergourd through supply chain‐IV the marketing cost becomes high, on the other hand, if farmer sell their bittergourd through supply chain‐III, the marketing cost was the lowest because no intermediary was involved in supply chain‐III. Marketing margins of supply chain‐IV was the highest and lowest in supply chain‐III.
11.5.2.1.3 Deviation between maximum and minimum prices of bittergourd
Table 11.5.8 showed that the highest price differences were found in the month of March, April
and May, it also may be due to harvesting period of bittergourd. It was also observed from the
table 11.5.8 that supply chain‐III incurred lowest price deviation followed by Channel‐I, II and IV.
Price deviation was the highest in Channel‐IV. It might be due to longest supply chain among the
four chains.
Table 11.5.8 Price deviation of bittergourd in different supply chain
Month Chain‐I Chain‐II Chain‐III Chain‐IV
January 830 870 780 910
February 855 875 820 895
March 880 923 845 965
April 930 1015 870 1100
May 850 950 840 1050
June 745 815 720 885
July 735 793 700 850
August 715 745 680 775
September 640 700 700 760
October 635 688 650 740
November 545 595 530 645
December 540 600 540 660

59
∑d 8900 9568 8675 10235
D 742 797 723 853
N 12 12 12 12
Rank (I) II III I IV
11.5.2.1.4 Efficient supply chain of bittergourd
The efficiency of different supply chain of bittergourd was calculated on the table 11.5.9. The
final score of ranking of the supply chain‐III was lowest among the supply chain and it was the
most efficient supply chain of bittergourd marketing due to lower score. It implied that farmers
were more benefited if they act as a retailer. The afterward efficient supply chains were supply
chain‐ I, II and IV respectively.
Table 11.5.9 Final ranking of the efficiency of different bittergourd supply chains
Performance indicator Supply Chain‐I
Supply Chain‐II
Supply Chain‐III
Supply Chain‐IV
Producers’ share (I1) II III I IV
Marketing costs (I2) II III I IV
Margin to actors (I3) II III I IV
Price deviation (I4) II III I IV
Composite index (Ri ÷ Ni) 2 3 1 4
Final ranking 2 3 1 4
Ri = Total value of the ranks of performance indicators Ni = Total number of performance indicators
11.5.2.2 Marketing efficiency of different supply chain of cucumber
The ranking of producer shares in consumer price, marketing cost and marketing margin of
cucumber was presented in the table 11.5.10.
11.5.2.2.1 Producers share of different cucumber supply chain
The producers’ share was the highest in supply chain‐III and lowest in supply chain‐IV in the
cucumber marketing. It indicates that the farmers got highest benefit by selling their cucumber
directly to the consumer instead of intermediaries. Producers share was found to be lowest in the
supply chain IV, it’s due to large number of intermediaries involved in the chain.
11.5.2.2.2 Marketing cost and margin of actors in different cucumber supply chain
The supply chain‐IV of cucumber marketing has incurred highest marketing cost whereas the
lowest marketing cost incurred in case of supply chain‐III because farmers sell direct to the
consumer (Table 11.5.10). The ranking of the margin of actors in each supply chain of cucumber
marketing was also estimated in the same way. Marketing margins of the supply chain‐IV was the
highest and lowest in the supply chain‐III.

60
Table 11.5.10 Producer share, marketing cost and margin of cucumber supply chain
Particulars
Different supply chain of cucumber
chain‐I chain‐II Chain‐III Chain‐IV
(Tk./qt) (Tk./qt) (Tk./qt) (Tk./qt)
A. Gross price received by the farmer‐cum‐retailer/farmer
1962.00 1962.00 2500.00 1962.00
a. Marketing cost incurred by the farmer‐cum‐retailer/farmer
113.25 113.25 110.38 113.25
b. Net price received by the farmer‐cum‐retailer/farmer
1848.75 1848.75 2389.62 1848.75
B. Gross margin received by the Bepari ‐‐ ‐‐ ‐‐ 488.00
a. Marketing cost incurred by the Bepari ‐‐ ‐‐ ‐‐ 302.70
b. Net margin received by the Bepari ‐‐ ‐‐ ‐‐ 185.30
C. Gross margin received by the paiker‐cum‐retailer
‐‐ 618.00 ‐‐ ‐‐
a. Marketing cost incurred by the paiker‐cum‐retailer
‐‐ 161.64 ‐‐ ‐‐
b. Net margin received by the paiker‐cum‐retailer ‐‐ 456.36 ‐‐ ‐‐
D. Gross margin received by the local retailer 588.00 ‐‐ ‐‐ ‐‐
a. Marketing cost incurred by the local retailer 135.70 ‐‐ ‐‐ ‐‐
b. Net margin received by the local retailer 452.30 ‐‐ ‐‐ ‐‐
E. Gross margin received by the urban retailer ‐‐ ‐‐ ‐‐ 550.00
a. Marketing cost incurred by the urban retailer ‐‐ ‐‐ ‐‐ 180.65
b. Net margin received by the urban retailer ‐‐ ‐‐ ‐‐ 369.35
F. Price paid by the consumers (A+B+C+D+E) 2550.00 2580.00 2500.00 3000.00
G. Price share in consumer Taka (%) 72.50 71.66 95.58 61.63
Rank (I1) II III I IV
H. Total marketing cost 248.95 274.89 110.38 596.60
Rank (II2) II III I IV
I. Total marketing margin 452.30 456.36 0.00 554.65
Rank (III3) II III I IV
11.5.2.2.3 Deviation between maximum and minimum prices of cucumber
Table 11.5.11 showed the deviation between maximum and minimum price difference of
cucumber in each month. The price differences were found in the different month of the year
and this difference is varying in month to month and did not follow any trends. It may be due to
year round production of the cucumber. It was also observed from the table 11.5.11 that
Channel‐III incurred lowest price deviation followed by Channel‐I, II and IV. Price deviation was
the highest in Channel‐IV. It might be due to longest chain among the five supply chains of
cucumber.

61
Table 11.5.11 Price deviation of cucumber in different supply chain
Month Chain‐I Chain‐II Chain‐III Chain‐IV
January 898 915 880 950
February 875 910 840 980
March 900 930 870 990
April 868 895 840 950
May 975 1000 950 1050
June 868 895 840 950
July 800 790 735 850
August 780 825 700 950
September 740 720 680 760
October 673 695 650 740
November 630 620 580 645
December 638 645 630 660
∑d 9643 9840 9195 10475
D 804 820 766 873
N 12 12 12 12
Rank (I4) II III I IV
11.5.2.2.4 Efficient supply chain of cucumber marketing
It was revealed from the table 11.5.12 that the final score of ranking of the supply chain‐III was
the lowest among the supply chain and it was the most efficient supply chain of cucumber
marketing. It implies that farmers were more benefited if they work as a retailer of cucumber
marketing though the supply chain‐III followed by supply chain‐ I, II and IV. So supply chain‐IV was
the most inefficient and farmers become loser if they marketed cucumber through supply chain‐
IV.
Table 11.5.12 Final ranking of the efficiency of different cucumber supply chains
Performance indicator Supply Chain ‐I
Supply Chain ‐II
Supply Chain ‐III
Supply Chain ‐IV
Producers’ share (I1) II III I IV
Marketing costs (I2) II III I IV
Margin to actors (I3) II III I IV
Price deviation (I4) II III I IV
Composite index (Ri ÷ Ni) 2 3 1 4
Final ranking 2 3 1 4
Ri = Total value of the ranks of performance indicators Ni = Total number of performance indicators
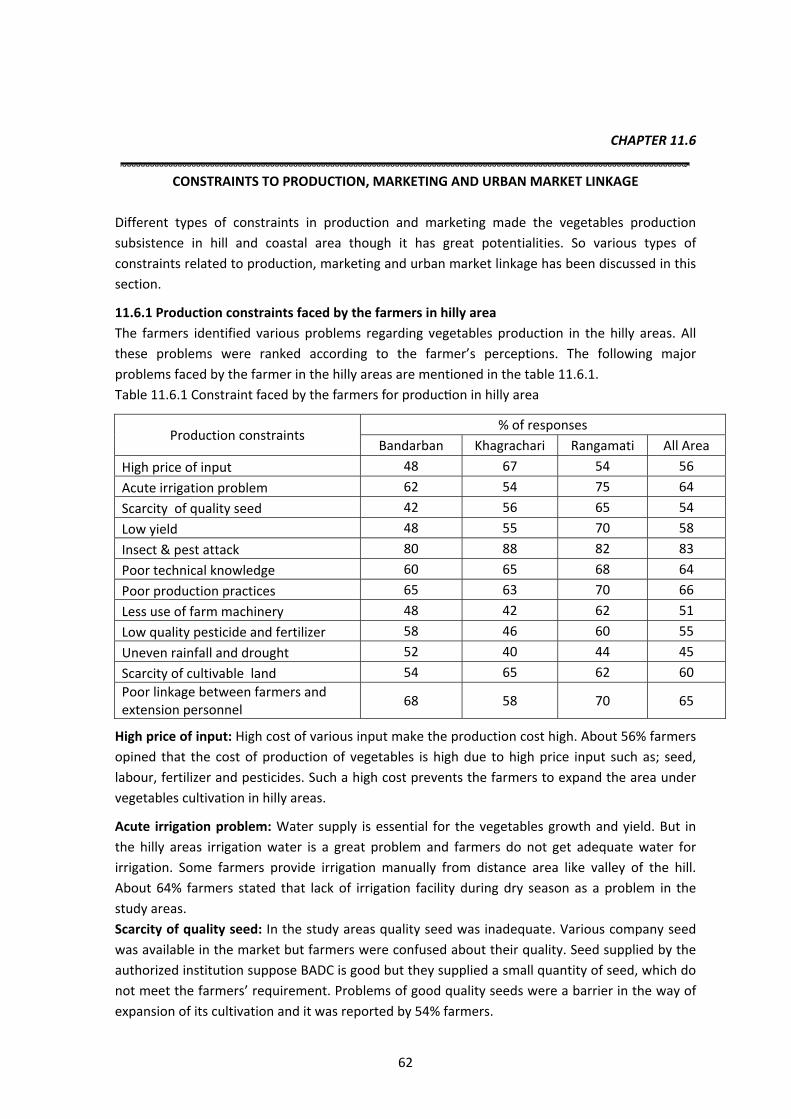
62
CHAPTER 11.6
CONSTRAINTS TO PRODUCTION, MARKETING AND URBAN MARKET LINKAGE
Different types of constraints in production and marketing made the vegetables production
subsistence in hill and coastal area though it has great potentialities. So various types of
constraints related to production, marketing and urban market linkage has been discussed in this
section.
11.6.1 Production constraints faced by the farmers in hilly area
The farmers identified various problems regarding vegetables production in the hilly areas. All
these problems were ranked according to the farmer’s perceptions. The following major
problems faced by the farmer in the hilly areas are mentioned in the table 11.6.1.
Table 11.6.1 Constraint faced by the farmers for produc on in hilly area
Production constraints % of responses
Bandarban Khagrachari Rangamati All Area
High price of input 48 67 54 56
Acute irrigation problem 62 54 75 64
Scarcity of quality seed 42 56 65 54
Low yield 48 55 70 58
Insect & pest attack 80 88 82 83
Poor technical knowledge 60 65 68 64
Poor production practices 65 63 70 66
Less use of farm machinery 48 42 62 51
Low quality pesticide and fertilizer 58 46 60 55
Uneven rainfall and drought 52 40 44 45
Scarcity of cultivable land 54 65 62 60
Poor linkage between farmers and extension personnel
68 58 70 65
High price of input: High cost of various input make the production cost high. About 56% farmers
opined that the cost of production of vegetables is high due to high price input such as; seed,
labour, fertilizer and pesticides. Such a high cost prevents the farmers to expand the area under
vegetables cultivation in hilly areas.
Acute irrigation problem: Water supply is essential for the vegetables growth and yield. But in
the hilly areas irrigation water is a great problem and farmers do not get adequate water for
irrigation. Some farmers provide irrigation manually from distance area like valley of the hill.
About 64% farmers stated that lack of irrigation facility during dry season as a problem in the
study areas.
Scarcity of quality seed: In the study areas quality seed was inadequate. Various company seed
was available in the market but farmers were confused about their quality. Seed supplied by the
authorized institution suppose BADC is good but they supplied a small quantity of seed, which do
not meet the farmers’ requirement. Problems of good quality seeds were a barrier in the way of
expansion of its cultivation and it was reported by 54% farmers.

63
Low yield: Farmers got lower yield in the study areas due to various reason. Lack of quality seed
and improved technology, traditional management practices and lack of suitable land per hectare
yield was very low.
Insect & pest attack: The attack of insect and pest was found greater extent in the hill areas. The
range of severity is much higher in the remote distance vegetables garden. Different types of
insect and pest like fruit fly, fruit borer, shoot borer and leaf disease were found to attack the
vegetables field at different location. Most of farmers were ignorance about this insect and pest,
so they could not take any preventive measure to control the situation and 83% farmer reported
it.
Poor technical knowledge: Farmers knowledge was not sufficient about modern produc on
technology of vegetables cul va on in the hilly areas. They were also very much reluctant to
vegetables cul va on due to their ignorance and lack of modern technical knowledge. About 64%
farmers mentioned that ignorance about technical knowledge is a problem for vegetables
cultivation in the hilly areas.
Poor production practices: Awareness of the farmers about improved produc on prac ces was
very poor in the hilly area. Lack of improved technology in the study area, the farmers had to
depend on the traditional practices for vegetables cultivation. About 66% opined that farmers in
the hilly areas practiced traditional methods rather than improved technology and got lower
yield.
Less use of farm machinery: Mechanization is rare in hilly areas and land is not also suitable for
mechanization. Most of the farmers used local machinery for vegetables cultivation. About 51%
opined that farmers in the hilly areas used traditional farm machinery such as manual irrigation,
land preparation by spade and indigenous farm machinery rather than mechanization.
Low quality pesticide and fertilizer: Some of the farmers have identified the problem of
adulteration in pesticide and artificial scarcity of fertilizer. About 55% farmers reported that
traders were engaged in selling low quality pesticide and fertilizer. As a result they did not get
expected yield.
Uneven rainfall and drought: About 54% farmers reported that excess rainfall during monsoon
and drought was a major problem in the hilly areas. Because vegetables were grown in valley of
hill areas and inundation situation occurs after heavy rainfall. So it is not possible to maintain
cropping season for this reason especially in summer vegetables. Another problem is drought in
the hill areas because of scarcity of irrigation water in dry season.
Scarcity of cultivable land: Sixty percent farmers opined that land not suitable for vegetables
production in hilly areas. Land generally appeared different level of slopping and thus it is very
difficult to operate different inter cultural activities like fertilization, weeding, insecticide
application etc. Level land only found valley of the hill which was very insufficient.
Poor linkage between farmers and extension personnel: Poor linkage between farmers and
extension personnel was a problem and it was reported by 65% farmers. Due to lack of technical
knowledge farmers were using traditional method of cultivation and receiving low yield. If proper
supervision, suggestions and field visit were made by the extension personnel at farm level on
modern production technology they can obtained higher yield.
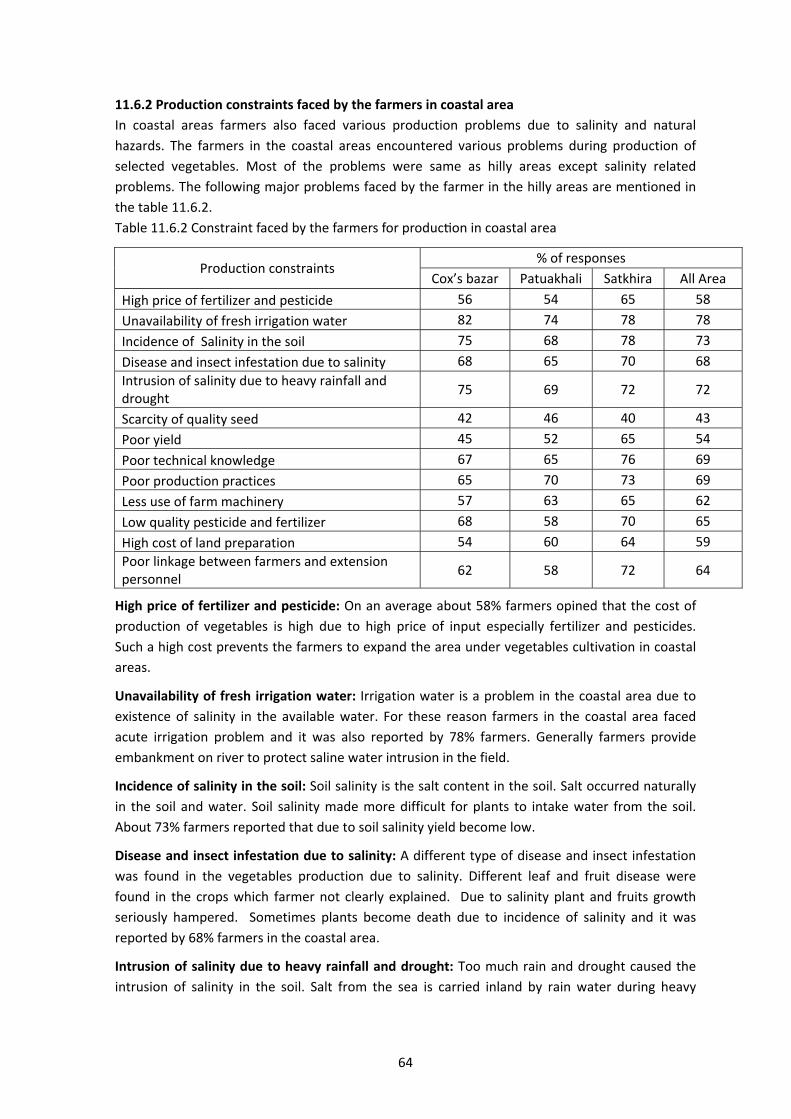
64
11.6.2 Production constraints faced by the farmers in coastal area
In coastal areas farmers also faced various production problems due to salinity and natural
hazards. The farmers in the coastal areas encountered various problems during production of
selected vegetables. Most of the problems were same as hilly areas except salinity related
problems. The following major problems faced by the farmer in the hilly areas are mentioned in
the table 11.6.2.
Table 11.6.2 Constraint faced by the farmers for produc on in coastal area
Production constraints % of responses
Cox’s bazar Patuakhali Satkhira All Area
High price of fertilizer and pesticide 56 54 65 58
Unavailability of fresh irrigation water 82 74 78 78
Incidence of Salinity in the soil 75 68 78 73
Disease and insect infestation due to salinity 68 65 70 68
Intrusion of salinity due to heavy rainfall and drought
75 69 72 72
Scarcity of quality seed 42 46 40 43
Poor yield 45 52 65 54
Poor technical knowledge 67 65 76 69
Poor production practices 65 70 73 69
Less use of farm machinery 57 63 65 62
Low quality pesticide and fertilizer 68 58 70 65
High cost of land preparation 54 60 64 59
Poor linkage between farmers and extension personnel
62 58 72 64
High price of fertilizer and pesticide: On an average about 58% farmers opined that the cost of
production of vegetables is high due to high price of input especially fertilizer and pesticides.
Such a high cost prevents the farmers to expand the area under vegetables cultivation in coastal
areas.
Unavailability of fresh irrigation water: Irrigation water is a problem in the coastal area due to
existence of salinity in the available water. For these reason farmers in the coastal area faced
acute irrigation problem and it was also reported by 78% farmers. Generally farmers provide
embankment on river to protect saline water intrusion in the field.
Incidence of salinity in the soil: Soil salinity is the salt content in the soil. Salt occurred naturally
in the soil and water. Soil salinity made more difficult for plants to intake water from the soil.
About 73% farmers reported that due to soil salinity yield become low.
Disease and insect infestation due to salinity: A different type of disease and insect infestation
was found in the vegetables production due to salinity. Different leaf and fruit disease were
found in the crops which farmer not clearly explained. Due to salinity plant and fruits growth
seriously hampered. Sometimes plants become death due to incidence of salinity and it was
reported by 68% farmers in the coastal area.
Intrusion of salinity due to heavy rainfall and drought: Too much rain and drought caused the
intrusion of salinity in the soil. Salt from the sea is carried inland by rain water during heavy

65
rainfall. Drought also concentrates salt in the surface level of the soil. In both cases a remarkable
yield loss occurred and it was reported by 72% farmers.
Scarcity of quality seed: In coastal areas scarcity of quality seed is also is a problem look like hilly
areas. In coastal areas, various company seed is also available in the market but farmers were
confused about their quality. So Problems of good quality seeds were reported by 43% farmers.
Poor yield: Farmers got poor yield in the study areas due to various reason. Lack of quality seed
and improved technology, traditional management practices and effect of salinity on plant per
hectare yield was very low.
Poor technical knowledge: Farmers were ignorance about modern produc on technology and
salinity management of vegetables cul va on in the coastal areas. They were also very much
reluctant to vegetables cul va on due to their ignorance and lack of modern technical knowledge
about produc on technology and salinity management and it was reported by 69% farmers in the
coastal areas.
Poor production practices: In coastal areas, some indigenous production technologies were
found which were practiced by farmers very poorly. Farmer’s awareness about improved
produc on prac ces and salinity management was very poor in the coastal area. About 69%
opined that farmers in the coastal areas practiced traditional methods rather than improved
technology and got lower yield.
Less use of farm machinery: Mechanization is also rare in coastal areas and land is not also
suitable for mechanization because of waterlogging in the coastal belt. Vegetable cultivation
technique is also different from plain land such as sorjon method and gher based agriculture.
About 62% of the farmers used local machinery for vegetables cultivation in such method.
Low quality pesticide and fertilizer: Some of the farmers in coastal areas also have identified the
problem of adulteration in pesticide and artificial scarcity of fertilizer. About 65% farmers
reported that they did not get expected yield due to low quality pesticide and fertilizer in the
coastal areas.
High cost of land preparation: In ‘sorjon’ technique and ‘gher’ based agriculture, vegetables
production is labour intensive due to bed preparation, ‘madha’ preparation and gher dike
preparation. For this reason land preparation cost of vegetables cultivation in the coastal area is
high. About 59% farmers reported that land preparation for the vegetables cultivation in the
coastal area is laborious.
Poor linkage between farmers and extension personnel: Poor linkage between farmers and
extension personnel was problem in coastal areas as well as in hilly areas and it was reported by
64% farmers. Due to lack of technical knowledge farmers were using traditional method of
cultivation and receiving low yield. If proper supervision, suggestions about salinity management
and field visit were made by the extension personnel at farm level on modern production
technology they can obtained higher yield.
11.6.3 Marketing problems faced by the farmers and traders
There were various problems faced by the farmers and traders in the study areas during
marketing of the selected vegetables from producer to consumer. All the constraints were
presented in the table 11.6.3 according to the frequencies of responses.
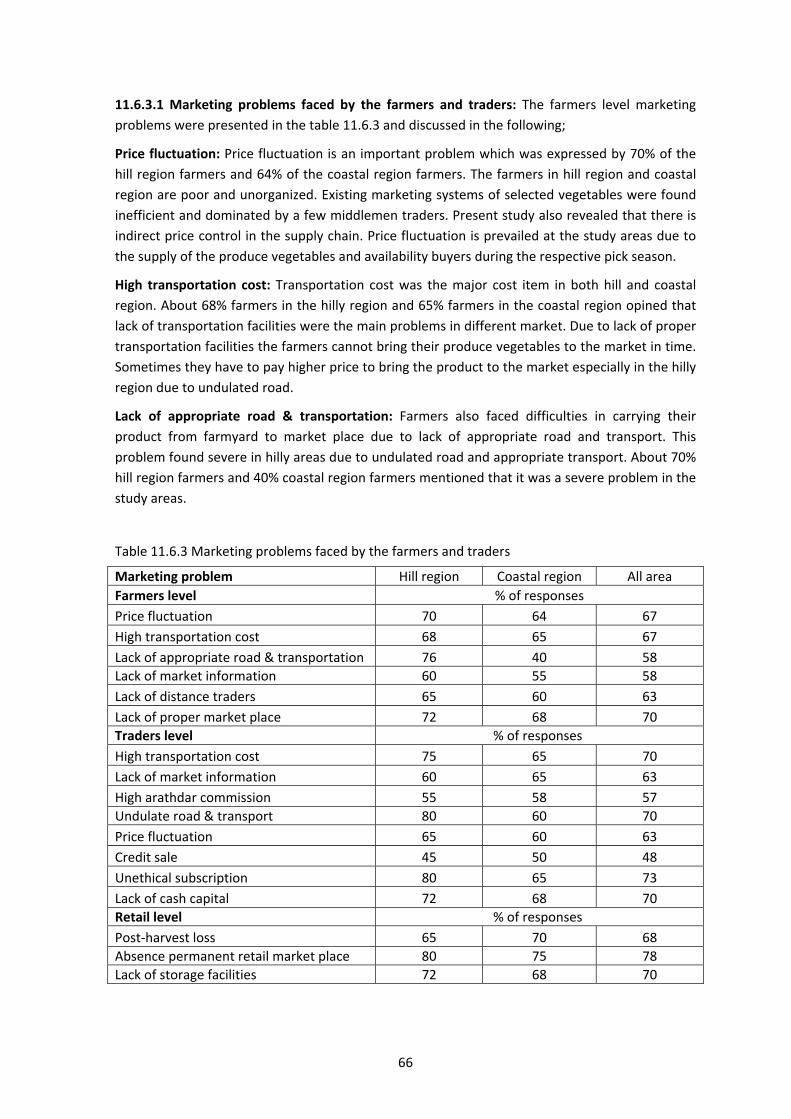
66
11.6.3.1 Marketing problems faced by the farmers and traders: The farmers level marketing
problems were presented in the table 11.6.3 and discussed in the following;
Price fluctuation: Price fluctuation is an important problem which was expressed by 70% of the
hill region farmers and 64% of the coastal region farmers. The farmers in hill region and coastal
region are poor and unorganized. Existing marketing systems of selected vegetables were found
inefficient and dominated by a few middlemen traders. Present study also revealed that there is
indirect price control in the supply chain. Price fluctuation is prevailed at the study areas due to
the supply of the produce vegetables and availability buyers during the respective pick season.
High transportation cost: Transportation cost was the major cost item in both hill and coastal
region. About 68% farmers in the hilly region and 65% farmers in the coastal region opined that
lack of transportation facilities were the main problems in different market. Due to lack of proper
transportation facilities the farmers cannot bring their produce vegetables to the market in time.
Sometimes they have to pay higher price to bring the product to the market especially in the hilly
region due to undulated road.
Lack of appropriate road & transportation: Farmers also faced difficulties in carrying their
product from farmyard to market place due to lack of appropriate road and transport. This
problem found severe in hilly areas due to undulated road and appropriate transport. About 70%
hill region farmers and 40% coastal region farmers mentioned that it was a severe problem in the
study areas.
Table 11.6.3 Marketing problems faced by the farmers and traders
Marketing problem Hill region Coastal region All area
Farmers level % of responses
Price fluctuation 70 64 67
High transportation cost 68 65 67
Lack of appropriate road & transportation 76 40 58
Lack of market information 60 55 58
Lack of distance traders 65 60 63
Lack of proper market place 72 68 70
Traders level % of responses
High transportation cost 75 65 70
Lack of market information 60 65 63
High arathdar commission 55 58 57
Undulate road & transport 80 60 70
Price fluctuation 65 60 63
Credit sale 45 50 48
Unethical subscription 80 65 73
Lack of cash capital 72 68 70
Retail level % of responses
Post‐harvest loss 65 70 68
Absence permanent retail market place 80 75 78
Lack of storage facilities 72 68 70
67
Insufficient market information: Farmers have to sell their vegetables without getting any price
information due to inefficient marketing system and traders syndicate. Because farmers situated
far behind of the information regarding demand, supply and every day market price of the
vegetables due to the insufficient market information system. This problem was expressed by
60% hill region farmers and 55% coastal region farmers.
Lack of distance traders: In both study areas farmers have to compel to sell their produced
vegetables in local traders or directly to the consumer due to lack of distance traders. Due to long
distance, high transportation cost and poor production distance bepari do not come to the study
areas. This problem reported by the 65% hill farmers and 60% coastal farmers.
Lack of proper market place: Most of the marketing activities are performed in open space for
different vegetables marketing in both study areas. There is no shed to protect different
vegetables from sunshine, rain, storm and dust. About 72% of the hill farmers and 68% of the
coastal farmers reported that poor consistency marketing system operating in the study areas.
11.6.3.2 Marketing problems faced by the traders: The traders found various marketing
problems during trading of vegetables which were presented in the table 9.3 and discussed in the
following;
High transportation cost: Transportation cost was the major cost item for traders in both hilly
and coastal region. About 75% farmers in the hill region and 65% farmers in the coastal region
opined that they have to pay high transportation cost due to long distance coverage. Due to lack
of proper transportation facilities and undulated road in hilly areas traders have to pay higher
price to bring the product from farmers to distance market.
Lack of market information: Traders also suffered lack of sufficient market information about
distance market. For this reason they have to buy and sell their vegetables without getting any
price information based on assumption. Because traders were unable to know about daily
information regarding demand, supply and market price of the vegetables due to the insufficient
market information system which was reported by 60% hill region farmers and 65% coastal
region farmers.
High arathdar commission: Arathdars take only commission from the both party for providing
facilities for the buying and selling of vegetables. The commission they took is very high which
was reported by the 55% hill region traders and 58% coastal region farmers. Our study revealed
that arathdar took commission 32‐34% in hill region and around 36% in coastal region of total
marketing cost.
Undulated road & transport: This problem mostly found in hilly areas and general types of
vehicles were not appropriate in such condition. It was reported by 80% traders in the hilly areas.
The infrastructure of the road in the coastal areas is also poor and it was reported by 60% of the
traders.
Price fluctuation: Price fluctuation is an important problem which was expressed by 63% of the
hill region farmers and 57% of the coastal region farmers. Existing marketing systems of selected
vegetables were found inefficient and sometimes they get lower price than purchase price. Price
fluctuation is prevailed at the study areas due to the lack of maladjustment of demand and
supply situation and less bargaining power of the traders in the terminal market.

68
Credit sale: Sometimes beperi have to sell their vegetables in credit to the traders through
arathdar and recovery of this money is very troublesome in most cases. This problem was
reported by on average 48% traders.
Unethical subscription: Traders have to pay different types of subscription at different level due
to run their business. This problem was severe in hilly areas and it was reported 80% traders.
Different types of unethical subscription such as; poura tax, line charge, terminal charge etc.
found in hill areas which make marketing cost high. On the other hand in coastal areas different
kinds of tolls in bridge and ferry make marketing cost high which was reported by 65% traders.
Lack of cash capital: Traders often suffered lack of cash capital and they have to depend on
arathdar or others money lending institution frequently. On an average 70% traders reported
that they suffered lack of sufficient cash capital for their business.
11.6.3.3 Marketing problems faced by the retailer: The retailer also faced some marketing
problems during retailing of vegetables which were presented in the table 11.6.3 and discussed
below;
Post‐harvest loss: Post harvest loss incurred due to spoilage and damage during the selling
period. Our study revealed that retailer have to sell small quantity of vegetables for 2‐3 days long
that is why spoilage and damage cost was the highest cost item for retailer. This problem
encountered by 68% retailer in all area.
Lack of permanent retail market place: Retailer performed most of the marketing activities in
open space or in both side of the coward road in the market. There is no shed to protect different
vegetables from sunshine, rain and dust. Seventy percent of the retailer complained that there is
no specific retail place and management system is very poor in the both study areas.
Lack of storage facilities: Most of the retailers (70%) opined that lack of storage facilities was also
a dominant problem in retail level of the study areas. Because retailers have to hold the
vegetables 2‐3 days in most cases. In this cases short term storage facilities is demanded by the
retailer which was reported by 70% traders in all areas.
11.6.4 Constraints to linkage rural market with urban market
Supply chains are changing rapidly in abundant vegetables growing areas with the coordination of
different linking organizations which are working with farmers, such as donors, NGOs and
government extension services are seeking to promote farmer welfare links between farmers,
traders, processors and retailers. It is against this background by using the “linking farmers to
markets” approach, which usually involves organizing farmers into groups to supply identified
markets. The study revealed that only small quantity vegetables marketed to the urban market.
The followings constraints were identified to liking rural market with urban market (Table 11.6.4).
Communication gap: There is a gap exit between rural traders and urban traders and the rural
traders were hesitate to done business with urban traders especially in terminal market because
they suffered lack of sufficient market information. For this reason rural farmers and traders
were reluctant to send their vegetables in distance urban market. Rural traders were unable to
know about daily information regarding demand, supply and market price of the vegetables to
the distance market due to the insufficient market information system which was reported by
72% traders.

69
High transportation cost: High transportation cost was also a major problem in sending
vegetables to the urban market from both hilly and coastal region. About 77% traders in the hilly
region and 74% traders in the coastal region opined that they have to pay high transportation
cost for sending vegetables to the distance market. Due to lack of proper transportation facilities,
undulated road in hilly areas and crossing ferry in coastal areas traders have to pay higher price
to bring the product from farmers to distance market.
Table 11.6.4 Constraints to linkage rural market with urban market
Constraint to urban market linkage % of responses
Hill region Coastal region All area
Communication gap 74 70 72
High transportation cost 77 74 76
Poor production 62 65 64
Lack of distance traders 72 75 74
High local demand 67 58 63
Different kinds of subscription 70 68 69
Long distance coverage 78 80 79
Poor production: The yield per hectare is very poor due to lack of modern technology, traditional
method of cultivation and different stress in production process. So surplus production is very
rare in those unfavorable ecosystem and commercialization is also limited which was reported by
64% traders.
Lack of distance traders: As surplus production is very limited in the study areas, so most of the
production is consumed in locally through local traders. Distance traders do not find required
amount of vegetables for their consignment and it was reported by 74% traders.
High local demand: The demand of indigenous vegetables is very high in the study areas
especially in hilly areas. A little quantity of local vegetables marketed in distance market after
fulfilling local demand. Because local demand is deficit with the local production in both study
areas and it was reported by 63% traders.
Different kinds of subscription: Traders have to pay different types of subscription at different
level for sending vegetables to urban markets. Different types of unethical subscription such as;
poura tax, line charge, terminal charge etc. found in hilly areas which make marketing cost high in
sending vegetables to the urban markets which was reported by 70% traders. On the other hand
in coastal areas, traders also have to pay different kinds of tolls in bridge and ferry for sending
vegetables to distance market which make marketing cost high which was reported by 68%
traders.
Long distance coverage: Another barrier of sending vegetables from hilly and coastal region to
urban market is traders have to cover long distance. For this reason traders have to bear high
transportation cost and significant post‐harvest losses. About 79% traders identified as a problem
for not sending vegetables from rural to urban markets.

70
CHAPTER 11.7
SUMMARY, CONCLUSION AND POLICY RECOMMENDATION
11.7.1 Summary
The study was conducted in hilly and coastal region of Bangladesh for understanding input
distribution system, profitability of different production practices, supply chain system,
marketing cost and margin of different supply chain and different drawbacks of production and
marketing of selected crops. The study areas covered three hill districts namely Rangamati,
Khagrachari and Bndarban and three coastal districts namely Patuakhali, Satkhira and Cox’s bazar
where vegetables production is very limited due to different production stress. Both primary and
secondary data were used in the study. Primary data were collected through face to face
interview method. Secondary data related to this study were collected from different published
sources.The major findings of the study are summarized in the below:
In the study the sources and distribution system of the most dominant inputs namely;
seed, fertilizer and pesticide were identified.
There were three production techniques such as; homestead, plain land and Jhum
cultivation were found in the hilly areas and also three production techniques such as;
plain land, sorjon method and gher based cultivation were found in the coastal region of
Bangladseh.
The net return of the selected crops such as; brinjal and yard long bean in plain land
cultivation was Tk. 1, 92,265/ ha and Tk.82362/ha respectively in hilly region and the BCR
was found 1.88 and 1.53 respectively. The net return of Jhum cultivation was
Tk.70,113/ha and the BCR was 2.02.
On the other hand, the net return in coastal area for the selected crops such as;
bittergourd and cucumber was Tk. 2,24,530/ ha and Tk. 1,57,893/ha and the BCR was
found 2.08 and 1.82 respectively in plain land cultivation. The profitability of sorjon
cultivation and gher based agriculture system was Tk. 91023/ha and Tk. 1,29,115/ha
respectively and the BCR was 1.37 and 1.76 respectively.
Five supply chains were identified in hill areas of Bangladesh. Among the supply chains
four chains were important, by which 93.25% vegetables moved from producer to
consumer. These four chains were:
Chain I: Farmer ‐> local Retailer ‐> Local Consumer
Chain II: Farmer‐cum‐retailer ‐> Local Consumer
Chain III: Farmer‐> Paiker‐cum‐retailer‐> Local consumer
Chain IV: Farmer‐> L. Arathdar‐> Paiker‐cum‐retailer‐>Local consumer
According to the number of intermediaries involved in each chain and volume of product
run through the chain, supply chain‐I (Farmer‐cum‐retailer ‐ Local Consumer) is the most

71
efficient chain for the vegetables marketing system in hilly areas. Because no
intermediaries were involved in the chain and farmer himself done retailing to the
consumer. About 28.30% products run though this chain and the producer’s share of this
chain was 95.59% for brinjal and 95.42% for yard long bean.
On the other hand four supply chains were identified in coastal areas of Bangladesh.
Among the supply chains three chains were important, by which 94.43% vegetables
moved from producer to consumer. These three chains were:
Chain I: Farmer ‐> local Retailer ‐> Local Consumer
Chain II: Farmer ‐> L. Arathdar‐ Paiker‐cum‐retailer‐>Local consumer
Chain III: Farmer‐cum‐retailer ‐> Local Consumer
In coastal area, we also found supply chain‐I (Farmer‐cum‐retailer ‐ Local Consumer) is
the most efficient chain for the vegetables marketing system. Because no intermediaries
were involved in the chain and farmer himself done retailing to the consumer. About
25.50% products run though this chain and the producer’s share of this chain was 96.29%
for bittergourd and 95.58 % for cucumber.
Total marketing margin was found highest in supply chain‐IV for brinjal and yard long
bean marketing which was Tk. 647.60 for brinjal and Tk. 645.81 for yard long in hilly area.
Total marketing margin was found highest in supply chain‐IV for bitter gourd and
cucumber marketing which was Tk. 777.41 for bittergourd and Tk.554.65 for cucumber in
coastal area.
Farmers faced different production problem in the hilly areas of Bangladesh such as; high
price of input, irrigation water, scarcity of quality seed, low yield, Insect & pest attack,
poor technical knowledge, poor production practices, less use of farm machinery, low
quality pesticide and fertilizer, uneven rainfall and drought, crop damage by wild animal,
poor linkage between farmers and extension personnel etc. for vegetables cultivation.
In the coastal belt, farmers also faced some production problems in vegetables
cultivation such as; high price of fertilizer and pesticide, unavailability of fresh irrigation
water, incidence of salinity in the soil, disease and insect infestation due to salinity,
intrusion of salinity due to heavy rainfall and drought, scarcity of quality seed, poor yield,
poor technical knowledge, less use of farm machinery, poor linkage between farmers and
extension personnel etc.
Farmers and traders also faced some marketing problems for marketing of produced
vegetables such as; price fluctuation, high transportation cost, lack of market
information, undulate road & transport, unethical subscription, credit sale, absence of
permanent retail market place and lack of storage facilities etc. both in hilly and coastal
region of Bangladesh.

72
Communication gap, high transportation cost, poor production, lack of distance traders,
high local demand, different kinds of subscription, long distance coverage were the major
constraints for the traders to linkage with urban market.
Farmers in hilly areas are very much reluctant to vegetables production due to their
ignorance and lack of modern technical knowledge. In this respect, awareness of the
farmers should be developed through providing training for proper utilization of the
input factors for optimum yield. Modern vegetables production technologies should be
disseminated at hill and coastal region for increasing yield and income of the farmer.
11.7.2 Conclusion
It was revealed from the study that vegetables production and marketing both for farmers and
traders level were found profitable in the both locations. Due to poor knowledge and lack of
modern technology they get poor production but they get satisfactory price due to high local
demand and deficit of vegetables production in the study areas. There were lots of imperfections
found in the vegetables marketing system in the hilly and coastal regions. High price gap was
found between producers and consumers level due to inefficient marketing system. Different
types of production stress and lack of appropriate technology they were reluctant to vegetables
cultivation. But recently farmers were getting interest for vegetables production due to highly
profitable of vegetables cultivation in those areas. Nevertheless, both farmers and traders
encountered various problems during marketing of vegetables. In the recent years, some of the
technologies found in coastal areas such as sorjon cultivation and gher based agriculture which is
very promising and encouraging by the farmers at farm level. Whatever technologies so far
developed by BARI now need to be disseminated for obtaining higher yield. Extension personnel
also have to play vital role in dissemination of the modern technology in those unfavourable
ecosystems. In this regard, some recommendations were made for sustainable vegetables
production and adopting of new technology at hilly and coastal region in future. The following
steps were recommended for its greater expansion and dissemination at farmer’s field.
11.7.3 Policy recommendations The following detailed policy recommendation should be implemented with the special attention
for improving the supply chain of vegetables along with existing produc on and marketing
system in hilly and coastal region of Bangladesh.This policy options were also presented in brief
in the policy support options.
11.7.3.1 Produc on aspects
Development of HYV variety and technology
Improved varieties of seed should be increased for getting higher yield. Therefore, continuous effort should be given by the breeders for developing high yielding vegetables seed varieties. Moreover salt tolerant HYV vegetables seed varieties should be developed by the researchers to fit saline area in the coastal belt of Bangladesh. The infestation by different insects and diseases is a common constraint in coastal area for vegetables cultivation due to salinity. Therefore, researchers should develop integrated pest, disease and nutrient management technology which are environment friendly and ecologically sound.

73
Dissemination of technology for fallow land utilization
Most of the hill slopes and coastal belt are remain fallow. If the technologies what are available
according to hill slopes and salinity or waterlogging management to coastal belt, should be
disseminated to the farmers field so that they could avail the opportunities of growing vegetables
in different hill and coastal region of Bangladesh. So whatever the technologies are presently
available in the hand of researcher that needs to be provided to the farmers.
Wider expansion of existing modern technology
Some indigenous modern technologies especially in coastal region were found which needs to be
wider expansion. Suppose sorjon cultivation and gher based agriculture are very effective
production technique in coastal belt in salinity and waterlogging condition which needs to be
wider expansion. But farmers use these techniques with very poor management. So appropriate
training programme should be launched regarding those types of technology in coastal area.
Training programme regarding improved technology
Farmers in hilly areas and coastal areas are very much reluctant to vegetables cul va on due to
their ignorance of modern technical knowledge. In this respect, appropriate training programme
will be helpful for buiding awareness of the farmers for appropriate package of produc on
technology . In this regard upazila’s extension personnel should be given training regarding the
modern production technology of different vegetables cultivation. This will be helpful for wider
adoption of modern the technologies of the vegetables cultivation.
Building linkage with farmers, researcher and extension personnel
Extension contact plays a significant role in achieving higher production. Through regular
extension contact, farmers can receive information regarding production technology, new
varieties, etc. So far, BARI has developed improved production technologies for vegetables
cultivation. More demonstra on of vegetables produc on at different upazila level should be
ini ated to encourage farmers for dissemination of the modern production technologies.
Therefore measures should be taken to strengthen more linkage between DAE, research
organizations and farmers.
Utilization of available water for irrigation
Irriga on is the major problem in hill and coastal region. Farmers kept land fallow due to lack of
irriga on facili es. But there is much small canals/rivulet water available in the basin of the hill.
So, appropriate technique should be developed for u liza on of available water for irriga on in
vegetables field at upland hilly areas. In coastal region salinity free fresh water supply should be
ensured by harves ng of rain water and building embankment in fresh water body so that saline
water cannot entrance.
74
Crop zoning according to hill
Farmers grow different vegetables without knowing about suitability of the soil. According to soil
texture and pa ern of hill slopes and salinity and waterlogging condi on of the coastal belt,
appropriate crop zoning should be developed for proper utilization of land.
11.7.3.2 Marketing aspects
Training on post‐harvest loss management
The estimated post‐harvest losses of major vegetables are enormous. Loss reduction strategies
must be strengthening for the interest of the country. To reduce post‐harvest losses, an
appropriate training programme on different post‐harvest activities like handling, grading,
packaging, carrying etc. should be provided with a view to increasing the efficiency as well as
awareness of the farmers and traders.
Development of short term storage facilities
Short term storage facilities should be developed in hill and coastal areas to reduce post‐harvest
losses and to ensure fair price of their product. Private entrepreneur should come forward to
establish storage facilities at farm level and different wholesale and retail markets. This is the
only way to reduce the post‐harvest losses of vegetables at peak harvesting period in one hand
and to ensure better price for the producers on the other. Facilities should be developed for
short term reservation for unsold vegetables at market place.
Improvement of transportation and communication system
Transportation and communication system should be developed through constructing of
different local road. Low cost transportation facilities which were appropriate in hilly and coastal
area will be ensured to carry their vegetables from farmyard to local market or in distant urban
market for the farmers and traders, where they are likely to get better price for their products.
Then both farmers and traders will receive fair prices.
Introducing group marketing system
Forming group among the farmers can take facilities of group marketing such as dominancy of
market, receiving better price and proper bargaining power through collective action. It would be
better for the farmers if they would organize themselves into a producer group. As an organized
body, they would always hold a better bargaining power for their products over the middlemen
who dominant the price of the product.
Step regarding unethical tips and donation during transportation
Market taxes, undesired tips and donation while carrying vegetables in distant places make
marketing cost high and cause of a much suffering. The traders mentioned that they have to pay
subscription at different points while transporting different vegetables by truck or other vehicle.
The traders also mentioned that they have to pay subscription to the different point of the
transportation system and other social and religious festivals. This problem can be monitored and
checked by the proper authority.

75
Provide market information system: Marketing information like marketing cost, margin, price
spread and marketing problems at different levels are the important consideration. At present
infrastructure there are a little scope to obtain such information easily and quickly in hilly and
coastal areas. If the producers and traders come to know about the price of their produce in
different markets, it will help them a lot to fix their sell price. Respective authority support is
necessary to provide that information to the prospective markets.
Arrangement of institutional credit
Traders always suffer lacks of sufficient capital to run their business. They have limited sources
for income generation activities. So, emphasis should be given for providing institutional credit to
the traders for accelerating their business activities. This programme needs to be intensified in
different financial institution that can play vital role in providing loan to the traders.
12. Research Highlights (bullet points‐max.10 nos.):
There are some production techniques found in both hilly and coastal areas, such as homestead cultivation, plain land cultivation and jhum cultivation were found in hilly areas and plain land cultivation, sorjon cultivation and gher based cultivation were found in the coastal region of Bangladseh.
The net return of selected crops (brinjal and yard long bean) in hilly areas under plain land cultivation was Tk. 1,92,265/ha for brinjal and Tk.82362/ha for yard long bean and the BCR was found 1.88 and 1.53 respectively. The net return of jhum cultivation was Tk.70,113/ha and the BCR was found 2.02 in hilly areas.
The net return of selected crops in plain land cultivation of coastal belt was Tk.2,24,530/ ha for bittergourd and Tk.1,57,893/ha for cucumber and the BCR was found 2.08 and 1.82 respectively.The profitability of sorjon cultivation system and gher based agriculture system was Tk. 91023/ha and Tk. 1,29,115/ha respectively and the BCR was found 1.37 and 1.76 respectively.
Five supply chains were identified in hill areas. Among the supply chains 93.25% vegetables moved from producer to consumer through the following four chains.
Chain I: Farmer ‐> local Retailer ‐> Local Consumer
Chain II: Farmer‐cum‐retailer ‐> Local Consumer
Chain III: Farmer‐> Paiker‐cum‐retailer‐> Local consumer
Chain IV: Farmer‐> L. Arathdar‐> Paiker‐cum‐retailer‐>Local consumer
On the other hand, four supply chains were identified in coastal areas of Bangladesh. Among the supply chains following three chains were important, by which 94.43% vegetables moved from producer to consumer
Chain I: Farmer ‐> local Retailer ‐> Local Consumer
Chain II: Farmer‐cum‐retailer ‐> Local Consumer
Chain III: Farmer ‐> L. Arathdar‐> Paiker‐cum‐retailer‐>Local consumer
We found supply chain‐II (Farmer‐cum‐retailer ‐> Local Consumer) is the most efficient chain for vegetables marketing system in both hilly and coastal area. Because no intermediaries were involved in the chain and farmer himself done retailing to the consumer.

76
Farmers faced different production problem in the hilly and coastal areas of Bangladesh for vegetables cultivation, such as; high price of input, unavailability of irrigation water, incidence of salinity in the soil, disease and insect infestation due to salinity, intrusion of salinity due to heavy rainfall and drought, scarcity of quality seed, low yield, Insect & pest attack, poor technical knowledge, poor production practices, less use of farm machinery, low quality pesticide and fertilizer, poor linkage between farmers and extension personnel etc.
Farmers and traders also faced some marketing problems for marketing of produced
vegetables such as; price fluctuation, high transportation cost, lack of market information, undulate road & transport, unethical subscription, credit sale, absence of permanent retail place and lack of storage facilities etc. both in hilly and coastal region of Bangladesh.
Communication gap, high transportation cost, poor production, lack of distance traders, high local demand, different kinds of subscription, long distance coverage were the major constraints for the traders to linkage with urban market.
77
13. REFERNCES
Acharya, S. S. and N. L. Agarwal, 2004. Agricultural Price Analysis and Policy, Oxford and IBH Publishing Co. Private Ltd. Kolkata, India.
Ahmed N., E. H Allison & J. F. Muir, 2010. Rice fields to prawn farms: A blue revolution in southwest Bangladesh? Aquaculture international, 18(4), 555–574. doi: 10.1007/s10499‐009‐9276‐0.
Alam Q.M., Monayem M. A., and Mohabbatullah M 2010. Land Use Pattern, Nutritional Status and Food Security of Indigenous People in Hill Areas of Bangladesh, National Food Policy Capacity Strengthening Programme, FAO.
Bunt,C., M. Piccome, and R. Diew2002. Supply Chain Management in the Australian Banana
Industry a Case Study, Colin Bunt Agribusiness Consulting Ptv. Ltd. Cairns North, Australia, Vol. 2, No. 575
Bala, B. K., & M. A. Hossain, 2010. Food security and ecological footprint of coastal zone of
Bangladesh. Environment, Development and Sustainability, 12(4), 531–545. doi:10.1007/s10668‐009‐9209‐0.
Chauhan, B. R. S., R. B. S. Tomar, and A. K. Gupta, 1994. Economic Performance of Paddy
Marketing Channels. A Case Study of Banda District of Uttar Pradesh.Journal of Agricultural Marketing 37(2):6‐10.
Chowdhury, M.M.U., Rabbani, M.G., Zubair S.M. and Islam. M. S. 2004. Study on the socio‐economic condition of hill farmers and their consciousness regarding soil degradation and conservation practices. J. Soil Health & Environment, Vol. 1(2):105‐112.
Dewan B., Sarker F. and Alam M.N, 2015. Scenario of Major Fruits Production and Marketing System in Chittagong Hill Tracts; Study Based on Khagrachari Hill District, Bangladesh, International Journal of Economics, Commerce and Management, Vol. III, Issue 5, May 2015,
Dixie, Grahame (2005). Horticultural Marketing, Marketing Extension Guide, Food and Agricultural Organization of the United Nations, Rome, Italy
Farid, A.T.M. and Mujibullah, M.1990. A socio‐economic appraisal of farmers of the Chittagong Hill Tracts. Bangladesh, Journal of Agricultural Research, 15: 52‐58.
FAO 2014. FAO Statistics, Food and Agriculture Organization of the United States, Rome, Italy.
Gujarati, D.2003.Basic Econometrics, 4thed, New York: McGraw Hill, Inc., (Chapter 21).
Hossain, A, M.F. Islam and S. Rafiquzzaman, 1994. Land use pattern in non‐saline Ganges Tidal Flood Plain Area of Southern Bangladesh. Bangladesh Journal of Agril. Research : 19(1): pp.66‐73.
Haque S. A. 2006. Salinity Problems and Crop Production in Coastal Regions of Bangladesh, Pak. J. Bot., 38(5): 1359‐1365, 2006
Hossain M. A. and M. F. Haq, 2010. Fertilizer Marketing and Distribution System, its Impact on Food Grain Production and Household Food Security of the Resource Poor Farmers, Final Report, National Food Policy Capacity Strengthening Programme, FAO.
78
Hoq, M.S, S.K. Raha and N. Saltana, 2012. Value Addition in Vegetables Production processing and Export from Bangladesh. Bangladesh Journal of Agricultural Research, Vol. 37(3): pp.377‐388.
Hossain, M. A and M. N. Hossain, 2013. Some observations over supply chain: with reference to vegetables market of Bangladesh. Journal of Business Studies, 34 (2): 67‐81, August 2013.
Hasan M. K., S. K. Raha, N. Akhther 2013. Improving the Marketing System Performance for Fruits and Vegetables in Bangladesh,NFPCSP, FAO, Rome, Italy.
Islam, M. A., 1996. Development of an effective system for vegetable marketing in Bangladesh.In: Vegetable Crops Agribusiness: Proceedings of a workshop held at BARC, Farmgate, Dhaka, Bangladesh, 2‐4 May 1995. Organised by Asian Vegetable Research and Development Center (AVRDC),Shanhua, Tainan, Taiwan (ROC). Publication no. 97‐457.
Islam, M. A. and Ahsan, 2009. Development of an effective system for vegetable marketing in Bangladesh. Agricultural Economics and Rural Sociology Division, BARC, Farm gate, Dhaka, Scientific Paper No. 7, PP.27‐35.
Kohls, R.L., and J.N. Uhl, (1990), Marketing Of Agricultural Products, 7th edition, Macmillan Publishing Company, pp. 196–197.
Kamruzzaman, M. 1987. A Study on Market Functionaries Involved in Paddy/Rice Marketing in Some Selected Areas of Bangladesh, an Unpublished M.S. Thesis, Department of Cooperation and Marketing, BAU, Mymensingh.
Kafiluddin A., 2008. Fertilizer Distribution, Subsidy, Marketing, Promotion and Agronomic Use Efficiency Scenario in Bangladesh, IFA Crossroads Asia‐Pacific in Melbourne, 2008.
Kundu N., N. Sultana and F. Sehreen 2011.Promising Fortitude of Vegetables Worth in Dhaka City: A Supply Chain Analysis, The Jahangirnagar Journal of Business Studies, Jahangirnagar University, Vol. 1(1): 151‐159. ISSN: 2227‐3484.
Kabir M.J., Cramb R., Alauddin M., Roth C. 2016. Farming Adaptation to Environmental Change in Coastal Bangladesh: Shrimp Culture versus Crop Diversification, Environ Dev Sustain 18:1195–1216, DOI 10.1007/s10668‐015‐9697
Farid, A.T.M and Muzibullah, M.1990. A Socio‐Economic Appraisal of farmers of the chittagong Hill Tracts, Bangladesh. J. Agril. Research. 15(1).
Malakar, 2006. Agricultural Marketing Systems in Bangladesh. Consultancy Report, USAID/BRAC, Dhaka
Matin M. A., M. R. Karim, M. I. Hossainand M. A. Hossain, 2008.Tomato Marketing System in Bangladesh, Bangladesh Journal of Agricultural Research, Vol.33 No. (1): 67‐81
Miah, M. A. M., M. S. Hoq, M. A. Matin, and M. G. Saha, 2016. Marketing and postharvest losses of winter tomato in selected areas of Bangladesh.Bangladesh Journal of Horticulture. Vol.2 No.2 (Series‐2): 95‐108, 2016.
MoA 2016, Annual report, Ministry of Agriculture, Government of the people Republic of Bangladesh, Dhaka.
Miah M. D. and F. U. Ahmed, 2010. Conservation of a Tropical Wet Semi‐evergreen Forest Ecosystem by an Indigenous Community in the Bandarban Hill District of Bangladesh: The Role of Intervention, Small‐scale Forestry (2014) 13:319–331, DOI 10.1007/s11842‐013‐9256‐0
Mohabbat Ullah, M. 2012. Hill Agriculture: Constraints and Opportunities, Hill Agriculture Research Station, BARI, Khagrachari
79
Patniak, K.U.S. 1989. Efficiency of Groundnut Marketing in India. 1st Edition. Discovery Publishing House, Delhi, India.
Rajagopal, 1986. Economic efficiency of paddy marketing system in Madhya Pradesh: A case study. Ind. Jr. of Agri. Econ. 41 (4): 583‐590.
Roy, M.K. and S.K. Munshi, 2006. Hill Agricultural Economy, A Popular Article in the Daily Newspaper New nation, Bangladesh, Dated 20th February, 2006, p. 6.
Ricks, D., T. Woods, and J. Sterns 2000. Chain Management and Marketing Performance in Fruit Industry. Proceedings of the XIVth International Symposium on Horticultural Economics, St Peter Port, Guernsey, UK, 12‐15 September 2000. Acta‐Horticulturae, No. 536, pp. 661‐668.
Ray S.K., Sabur S.A., Kamruzzaman M., 2001. Vegetable Seed Marketing System in Some Selected Areas of Bangladesh, Journal of Biological Sciences 1 (6): 524‐528, 2001
Rahman M.A. 2011. Biodiversity Conservation and Food Security of Indigenous People Hilly Regions of Bangladesh, Forestry, Environment, Plantation Crops and Permaculture Consultancy and Research, http://feppcar.org/150
Sabur S. A. 1999. Pesticide Marketing System in Bangladesh, Bangladesh J. Agric. Econs. XXII, 2(1999): 57‐78
SRDI 2012.Saline soils of Bangladesh. Dhaka: Soil Resource Development Institute, Ministry of Agriculture, Government of the People’s Republic of Bangladesh.
Tomek, W.G. and Robinson, K. L. (1990). Agricultural Product Prices, 3rd ed., Cornell University Press. Ithaca and London
Talukder K. and T.K. Paul, 2013. Agricultural Development Strategy for Rangamati, Agriculture & Food Security Project, Rangamati Hill District Council, 2013.
Uddin, M.S. 1997. Hill Farming System and Resource Utilization: A Baseline Survey.
Uddin M S, M.S. Kamal, M. H. Mollah, 2000. Hill Farming System and Resource Utilization in the Chittagong Hill Tracts, A Baseline Survey, pp. 1‐14.
Uddin, J. 2002. A bench mark survey on existing hill farming system in Bandarban district, published by on‐ farm research division, BARI, Bandarban
Woods, E.J., S. Wei, S. Singgih, D. Adar, and R. Drew, 2002. Supply Chain Management as Beyond Operational Efficiency. Proceedings of the International Symposium on Tropical and Subtropical Fruits, Cairns, Northern Territory, Australia, 26 November to 1 December 2000, Vol. 2.Acta‐Horticulturae, No. 575 (Vol. 2), pp. 425‐431.
Weindlmaier, H. 2003.The Milk Value Chain Concept, Possibilities of Optimization and Areas of Conflict. Deutasche‐Milchwirtschaft,Vol. 54, No.3, pp. 109‐111.
7FYP (2016‐20), Agriculture sub‐sector: Crops and Horticulture, The Seventh Five Year Plan, Planning Commission, Ministry of Planning, Government of the people Republic of Bangladesh, Dhaka.
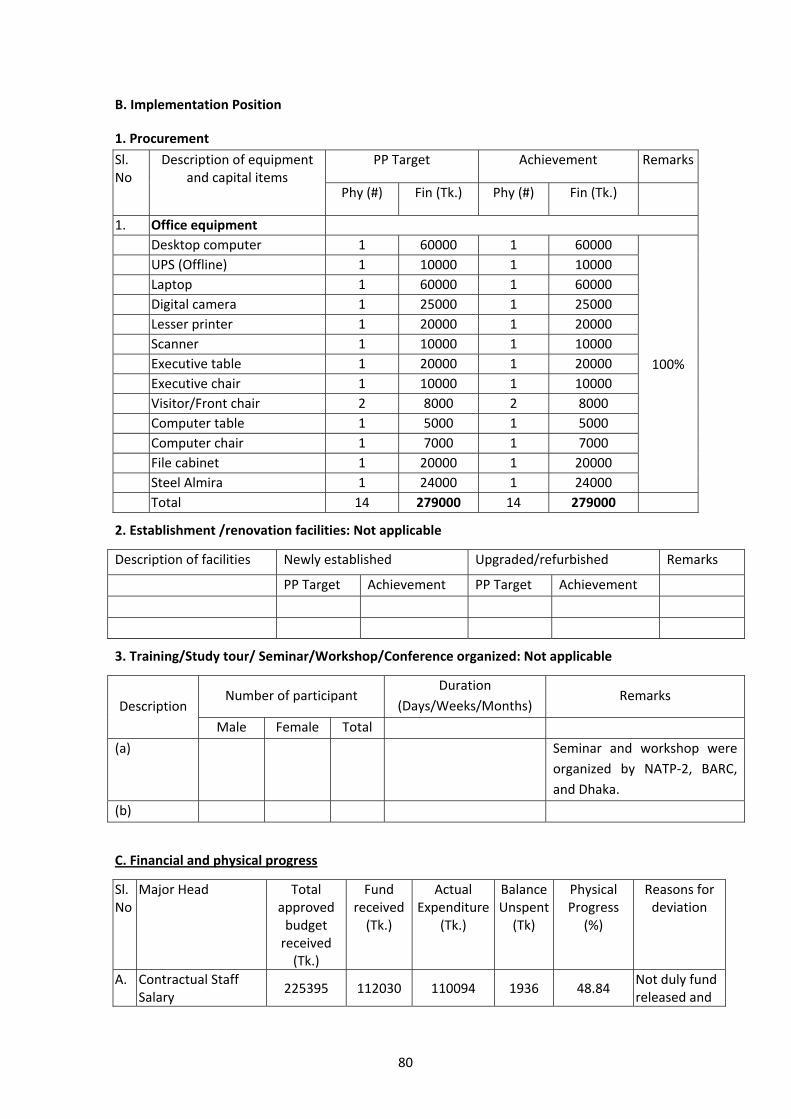
80
B. Implementation Position
1. Procurement
Sl. No
Description of equipment and capital items
PP Target Achievement Remarks
Phy (#) Fin (Tk.) Phy (#) Fin (Tk.)
1. Office equipment
Desktop computer 1 60000 1 60000
100%
UPS (Offline) 1 10000 1 10000
Laptop 1 60000 1 60000
Digital camera 1 25000 1 25000
Lesser printer 1 20000 1 20000
Scanner 1 10000 1 10000
Executive table 1 20000 1 20000
Executive chair 1 10000 1 10000
Visitor/Front chair 2 8000 2 8000
Computer table 1 5000 1 5000
Computer chair 1 7000 1 7000
File cabinet 1 20000 1 20000
Steel Almira 1 24000 1 24000
Total 14 279000 14 279000
2. Establishment /renovation facilities: Not applicable
Description of facilities Newly established Upgraded/refurbished Remarks
PP Target Achievement PP Target Achievement
3. Training/Study tour/ Seminar/Workshop/Conference organized: Not applicable
Description Number of participant
Duration
(Days/Weeks/Months) Remarks
Male Female Total
(a) Seminar and workshop were
organized by NATP‐2, BARC,
and Dhaka.
(b)
C. Financial and physical progress
Sl. No
Major Head Total approved budget received (Tk.)
Fund received (Tk.)
Actual Expenditure
(Tk.)
BalanceUnspent (Tk)
Physical Progress
(%)
Reasons for deviation
A. Contractual Staff Salary
225395 112030 110094 1936 48.84 Not duly fund released and

81
B. Field Research/Lab expenses and supplies
388500 387624 315500 72124 81.21 late signing of LOA.
C. Operating Expenses 365000 354525 216230 138295 59.24
D. Vehicle hire and Fuel, Oil and Maintenance
470000 470000 402900 67100 85.72
E. Training/Workshop /Seminar etc.
95000 95000 0 95000 0.00
F. Publications and printing
125000 106250 0 106250 0.00
G. Miscellaneous 50000 40000 39805 195 79.61
H. Capital Expenses 279000 270000 279000 0 100.00
Grand Total 1997895 1844429 1363529 480900 68.25
D. Achievement of sub‐project by objectives (Tangible form):
Specific objective
of the Sub‐
project
Major technic al
activities
performed in
respect of the
objectives
Output
(i.e. product
obtained,
visible,
measurable)
Outcome
(short term effect of the research)
i. To analyze
input supply,
production
system and
profitability of
major
vegetables in
hilly and
coastal region
Field survey Primary data
collection
Secondary data collection
Production technique in unfavorable condition
Different stresses in vegetable production
Cost and return estimation
There were three production
techniques such as; homestead, plain
land and Jhum cultivation were found
in the hilly areas
Three production techniques such as; plain land, sorjon method and gher
based cultivation were found in the
coastal region of Bangladseh.
The net return of the selected crops such as; brinjal and yard long bean in
plain land cultivation was Tk. 1, 92,265/
ha and Tk.82362/ha respectively.
The net return of Jhum cultivation was
Tk.70,113/ha and the BCR was 2.02.
The net return of bittergourd and
cucumber was Tk. 2,24,530/ ha and Tk.
1,57,893/ha respectively in coastal
area.
The profitability of sorjon cultivation system and gher based agriculture
system was Tk. 91023/ha and Tk.

82
1,29,115/ha respectively .
ii. To examine
the existing
market,
marketing
system and
supply chain
of selected
vegetables in
those areas
Field survey Primary data
collection
Secondary data collection
Identify supply chains of selected vegetables;
Detailed cost and margin at traders level
Estimation efficiency of supply chain
Five supply chains were identified in hill areas and four supply chains were
identified in coastal areas of
Bangladesh.
Total marketing margin was found
highest in supply chain‐V for brinjal
and yard long bean marketing which
was Tk. 647.60 for brinjal and Tk.
645.81 for yard long in hilly area.
Total marketing margin was found
highest in supply chain‐IV for bitter
gourd and cucumber marketing which
was Tk. 777.41 for bittergourd and
Tk.554.65 for cucumber in coastal
area.
ii. To identify
the
constraints to
production,
marketing
and urban
market
linkage of
vegetables
and suggest
some policy
recommenda
tions for
improving
the existing
vegetables
supply chain
Field survey Primary data
collection from
farmers and
traders through
face to face
interview
Different
constraints of
production and
marketing of
farmers and
traders
Different
constraints for
urban market
linkage
Farmers faced different production
problem such as; high price of input,
unavailability of irrigation water,
incidence of salinity in the soil, scarcity
of quality seed, low yield, Insect & pest
attack, poor technical knowledge, poor
production practices, less use of farm
machinery, poor linkage between
farmers and extension personnel etc.
Farmers and traders also faced some
marketing problems such as; price
fluctuation, high transportation cost,
undulate road & transport, unethical
subscription, , absence of permanent
retail place and lack of storage
facilities etc. both in hilly and coastal
region of Bangladesh.
Communication gap, high
transportation cost, poor production,
lack of distance traders, high local
demand, different kinds of
subscription, long distance coverage
were the major constraints for the
traders to linkage with urban market.
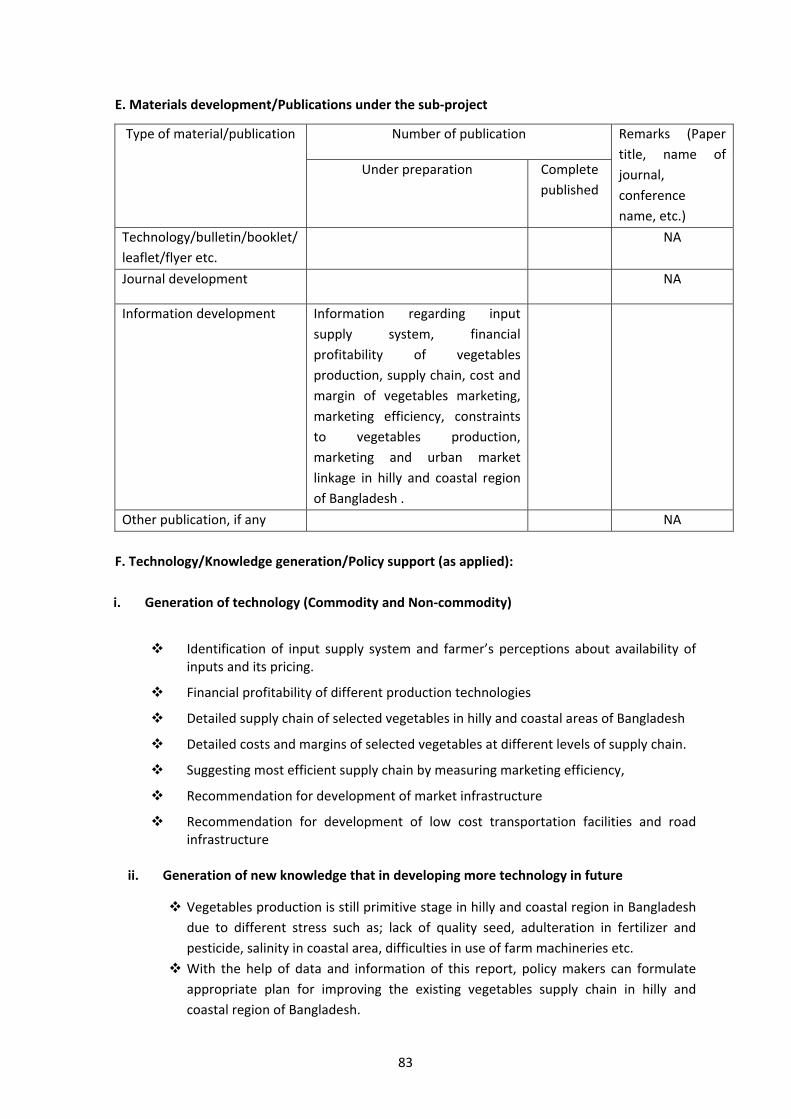
83
E. Materials development/Publications under the sub‐project
Type of material/publication Number of publication Remarks (Paper
title, name of
journal,
conference
name, etc.)
Under preparation Complete
published
Technology/bulletin/booklet/
leaflet/flyer etc.
NA
Journal development NA
Information development Information regarding input
supply system, financial
profitability of vegetables
production, supply chain, cost and
margin of vegetables marketing,
marketing efficiency, constraints
to vegetables production,
marketing and urban market
linkage in hilly and coastal region
of Bangladesh .
Other publication, if any NA
F. Technology/Knowledge generation/Policy support (as applied):
i. Generation of technology (Commodity and Non‐commodity)
Identification of input supply system and farmer’s perceptions about availability of inputs and its pricing.
Financial profitability of different production technologies
Detailed supply chain of selected vegetables in hilly and coastal areas of Bangladesh
Detailed costs and margins of selected vegetables at different levels of supply chain.
Suggesting most efficient supply chain by measuring marketing efficiency,
Recommendation for development of market infrastructure
Recommendation for development of low cost transportation facilities and road infrastructure
ii. Generation of new knowledge that in developing more technology in future
Vegetables production is still primitive stage in hilly and coastal region in Bangladesh
due to different stress such as; lack of quality seed, adulteration in fertilizer and
pesticide, salinity in coastal area, difficulties in use of farm machineries etc.
With the help of data and information of this report, policy makers can formulate
appropriate plan for improving the existing vegetables supply chain in hilly and
coastal region of Bangladesh.
84
Moreover new research regarding adoption of HYV varieties or development of salt
tolerant variety, impact of mechanization on vegetables production, undertaking
training and demonstration program of vegetables cultivation, value addition in
vegetables cultivation should be new issue for further research and development.
iii. Technology transferred that help increased agricultural productivity and farmers
income
If the above information and knowledge properly taken into consideration as a policy
issue, it is expected that it will be helpful for increasing agricultural productivity and
farmers income.
iv. Policy support Improved varieties of seed should be increased for getting higher yield. Therefore,
continuous effort should be given by the breeders for developing high yielding vegetables seed varieties.
Some indigenous modern technologies especially in coastal region were found which needs to be wider expansion. Suppose sorjon cultivation and gher based agriculture are very effective production technique in coastal belt in salinity and waterlogging condition which needs to be wider expansion.
Building awareness of the farmers by providing training regarding appropriate produc on technology that can encourage farmers because farmers in hilly areas and coastal areas are ignorance and lack of modern technical knowledge.
More demonstra on of vegetables produc on technology should be ini ated to encourage farmers for dissemination of the modern production technologies. Therefore measures should be taken to strengthen more linkage between DAE, research organizations and farmers.
Salt tolerant HYV vegetables seed should be developed by the researchers to fit saline area in the coastal belt of Bangladesh.
Farmers grow different vegetables without knowing about suitability of the soil. According to soil texture and pa ern of hill slopes and salinity and waterlogging condi on of the coastal belt, appropriate crop zoning should be developed for proper utilization of land.
Short term storage facilities should be developed in hill and coastal areas to reduce post‐harvest losses and to ensure fair price of their product.
Transportation and communication system should be developed through constructing of different local road. Low cost appropriate transportation facilities in hilly and coastal areas will be ensured to carry their vegetables from farmyard to local market or in distant urban market for the farmers and traders.
To reduce post‐harvest losses, an appropriate training programme on different post‐harvest activities like handling, grading, packaging, carrying etc. should be provided with a view to increasing the efficiency as well as awareness of the farmers and traders.

85
G. Information regarding desk and field monitoring
i) Desk monitoring [description & output of consultation meeting, monitoring,
workshops/seminars etc.): Not applicable
ii) Field monitoring (Time and no of visit, Team visit and output):
Types of Audit Major observations
/issues/objections raised, if any
Status at the
sub‐project end
Time of visit
BARC T\team Verified and found correct 06/02/18
GoB audit (Foreign aid) Verified and found correct 20/10/18
H. Lesson learned (if any)
Though vegetables production and marketing is complex in hilly and coastal areas,
it is very much promising and profitable for the farmers and traders.
Removing constraints of the vegetables production, marketing and urban market
linkage in vegetables supply chain, it may become a profitable livelihood of the
farmers and traders
There is an opportunity regarding new research on adoption and development of
HYV and salt tolerant variety, impact of mechanization on vegetables production,
irrigation system, training and demonstration programme on vegetables
cultivation, value addition in vegetables cultivation
I. Challenges (if any)
Challenges in hilly region :
Acute irrigation problem
Scarcity of cultivable land High price of input Poor technical knowledge Low yield Less use of farm machinery Crop damage by wild animal
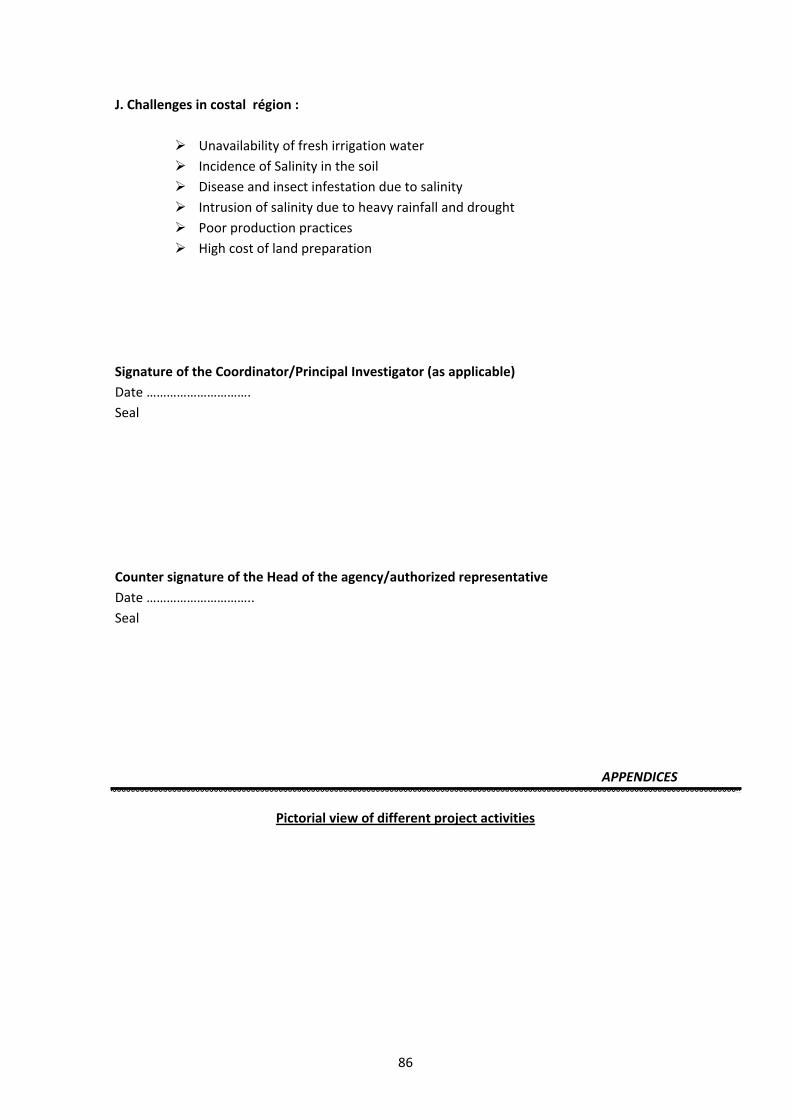
86
J. Challenges in costal région :
Unavailability of fresh irrigation water
Incidence of Salinity in the soil
Disease and insect infestation due to salinity
Intrusion of salinity due to heavy rainfall and drought
Poor production practices
High cost of land preparation
Signature of the Coordinator/Principal Investigator (as applicable)
Date ………………………….
Seal
Counter signature of the Head of the agency/authorized representative
Date …………………………..
Seal
APPENDICES
Pictorial view of different project activities

87
Field visit of yard long bean in Khagrachari district. Field visit of Brinjal in Rangamati district.
Data collection in sapchari, Rangamati. Data collection in Ghagra, Kawkhali, Rangamati.
Data collection from retailer Data collection from retailer

88
Bepari loaded Brinjal for Chittagong Arath Data collection from farmer‐cum‐retailer
Bepari loaded vegetables for distance market Transportation System in Khagrachari district
Sorjon cultivation in patuakhali Jhum cultivation in Khagrachari
Related Documents