Entrepreneurship in Emerging Domestic Markets

Welcome message from author
This document is posted to help you gain knowledge. Please leave a comment to let me know what you think about it! Share it to your friends and learn new things together.
Transcript

Entrepreneurship in EmergingDomesticMarkets
The Milken Institute Series on Financial Innovation and
Economic Growth
Series Editors
James R. Barth
Senior Fellow at the Milken Institute
Glenn Yago
Director of Capital Studies at the Milken Institute,
Other books in the series:
RESTRUCTURINGREGULATIONAND FINANCIAL INSTITUTIONSJames R Barth, Dan R. Brumbaugh, Jr. and Glenn Yago
MICROSOFT, ANTITRUST AND THE NEW ECONOMY: SELECTEDESSAYSDavid S. Evans
MERGERS AND EFFICIENCY: CHANGES ACROSS TIMESusanne Trimbath
THE BRIDGE TO A GLOBAL MIDDLE CLASS: DEVELOPMENT,TRADE AND INTERNATIONAL FINANCEWalter Russell Mead and Sherle Schwenninger
THE SAVINGS AND LOAN CRISISJames R. Barth, Susanne Trimbath and Glenn Yago
ASIA’S DEBT CAPITAL MARKETSDouglas Arner, Jae-Ha Park, Paul Lejot and Qiao Liu

Glenn Yago l James R. Barth l Betsy ZeidmanEditors
Entrepreneurshipin Emerging DomesticMarkets
Barriers and Innovation
Foreword by Robert E. Litan

EditorsGlenn YagoMilken Institute, Santa Monica,CA 90401.
James R. BarthMilken Institute, Santa Monica,CA 90401.
Betsy ZeidmanMilken Institute Santa Monica,CA 90401.
ISBN-13: 978-0-387-72856-8 e-ISBN-13: 978-0-387-72857-5
Library of Congress Control Number: 2007933507
# 2008 by Milken Institute
All rights reserved. This workmay not be translated or copied in whole or in part without the writtenpermission of the publisher (Springer Science+Business Media, Inc., 233 Spring Street, New York,NY 10013, USA), except for brief excerpts in connection with reviews or scholarly analysis. Use inconnection with any form of information storage and retrieval, electronic adaptation, computersoftware, or by similar or dissimilar methodology now known or hereafter developed is forbidden.The use in this publication of trade names, trademarks, service marks and similar terms, even if theyare not identified as such, is not to be taken as an expression of opinion as to whether or not they aresubject to proprietary rights.
TheMilken Institute has chosen the material published in this book series for its quality and seriousnessof purpose. But the opinions expressed in the books do not necessarily reflect the views of the Institute orits staff.
Printed on acid-free paper
9 8 7 6 5 4 3 2 1
springer.com

The Milken Institute is a publicly supported,nonpartisan, independent economic thinktank whose work makes a difference in thelives of people worldwide by helping create amore democratic and efficient globaleconomy.We do this by using capital-marketprinciples and financial innovations toaddress some of our biggest social andeconomic challenges, from energyindependence to poverty.
Guided by market-based approaches, wework to improve economic conditions and thequality of life for people in the United Statesand around the world. Our approach isstraightforward: we put research to work,pursuing viable solutions to the gaps in accessto capital markets, education and jobopportunities.
Our work is rooted in the long-term trendtoward three revolutions of access – theworldwide democratization of capital, healthand knowledge. By improving global accessin these areas to all citizens, states andnations, the Institute hopes to spur economicdevelopment and improve standards of living.
v

Contents
Entrepreneurship in low and moderate income communities . . . . . . . . . . . . 1Kelly D. Edmiston
Alleviating the Lagging Performance of Economically Depressed
Communities and Regions . . . . . . . . . . . . . . . . . . . . . . . . . . . . . . . . . . . . . . 9Timothy Bates
State of Literature on Small- to Medium-Sized Enterprises and
Entrepreneurship in Low-Income Communities . . . . . . . . . . . . . . . . . . . . . . 21Zoltan J. Acs and Kadri Kallas
On Government Intervention in the Small-Firm Credit Market and
Economic Performance . . . . . . . . . . . . . . . . . . . . . . . . . . . . . . . . . . . . . . . . 47Ben R. Craig, William E. Jackson III and James B. Thomson
Stumbling Blocks to Entrepreneurship in Low- and Moderate-Income
Communities . . . . . . . . . . . . . . . . . . . . . . . . . . . . . . . . . . . . . . . . . . . . . . . . 69James R. Barth, Glenn Yago, and Betsy Zeidman
The Role of Morris Plan Lending Institutions in Expanding Consumer
Microcredit in the United States . . . . . . . . . . . . . . . . . . . . . . . . . . . . . . . . . 121David Mushinski and Ronnie J. Phillips
Policies to Expand Minority Entrepreneurship: Closing Comments . . . . . . 141Michael S. Barr
Index . . . . . . . . . . . . . . . . . . . . . . . . . . . . . . . . . . . . . . . . . . . . . . . . . . . . . . 151
vii

Note from the Editors
This volume examines the crucial role entrepreneurship plays in fostering jobcreation and promoting economic growth, particularly in traditionally over-looked communities in the United States. Individuals with new ideas, newapproaches to organizing businesses, and new products for the market are vitalto generating economic development and creatingwealth. Greater recognition ofthis fact has led to increased interest in better understanding the determinants ofentrepreneurship, as well as the potential barriers limiting its ability to flourish.
The latest research in these topics is particularly important for low- and mod-erate-income communities, and those with high ethnic and immigrant concentra-tions. Entrepreneurship offers individuals in such areas the opportunity to improvetheir standards of living through their own efforts. In the process of improving theirown lives, moreover, these entrepreneurs contribute to the overall economy. WiththeU.S. population undergoing rapid diversification, enabling the economic poten-tial of these emerging domestic markets is critical to enabling the national growth.
The Federal Reserve Bank of Kansas City and the Ewing Marion KauffmanFoundation sponsored a conferenceNovember 3–4, 2005, in an effort to furtherour knowledge about the importance of entrepreneurship to low- and moderate-income communities. A group of experts on entrepreneurship from around thecountry participated in the conference, which involved the presentation anddiscussion of several policy-oriented papers. Most of the papers are includedhere and provide an up-to-date and first-rate assessment of policy actions thatcan alleviate the gap between those with an entrepreneurial potential and theresources necessary tomake it a reality. It is hoped that the information providedhere will help guide policy makers when focusing on ways to improve conditionsin our emerging domestic markets. The production of this volume would nothave been possible without the support of our colleagues at the Milken Institute.The Co-Editors wish to specifically acknowledge the valuable contributions ofAlethea Abuyuan, Dinah McNichols, Caitlin MacLean, and Karen Giles.
James R. Barth and Glenn YagoMilken Institute Series on FinancialInnovation and Economic Growth
ix

Foreword
Slowly but surely, entrepreneurship is getting its proper due as a source ofeconomic growth for the economy as a whole, and as a pathway to economicand personal independence for many individuals in our society. This bookmakes an important contribution to the literature by documenting the signifi-cance of entrepreneurship in low- and moderate-income communities.
The studies in this volume, by eminent experts in the field, document howentrepreneurial activity provides income to the entrepreneurs themselves (whoneed not be residents of these communities), and to the people they employ. Butstarting and growing a business is risky.Many firms fail, and individuals of low-and moderate-income face higher hurdles than others, because many lack therequisite skills, education, financial capital, and social contacts that increase abusiness’s likelihood of success. Many of the papers in this volume provideguidance to policy makers on how to bridge these gaps so that individuals of allmeans have an equal shot at success in their entrepreneurial endeavors.
The Kauffman Foundation is devoted to helping the public and policymakers to appreciate and understand the contribution of entrepreneurs to theU.S. economy. The Foundation is grateful for the opportunity it had, togetherwith the Federal Reserve Bank of Kansas City, to help sponsor the conferenceat which most of the papers in this volume were presented. We hope that thefindings will be useful to citizens, professional researchers, and policy makers inUnited States and throughout the world.
Robert E. LitanResearch and Policy
The Kauffman [email protected]
June 2007
xi


Author Bios
Zoltan Acs
Zoltan J. Acs is University Professor and Director of the Center for Entrepre-neurship and Public Policy at the School of Public Policy, George MasonUniversity. He is also a Research Scholar at the Max Planck Institute forEconomics in Jena, Germany, and Scholar-in-Residence at the KauffmanFoundation. He is coeditor of Small Business Economics. Zoltan Acs hasserved as the Chief Economic Advisor at the U.S. Small Business Administra-tion. He is a leading advocate of the importance of entrepreneurship foreconomic development. Zoltan Acs has published more than 100 articles and20 books, including articles in the American Economic Review, Review ofEconomics and Statistics, Journal of Urban Economics, Economica, ResearchPolicy and Science Policy. He is currently completing a research project onKnowledge, Geography and American Economic Growth, funded by theNational Science Foundation, The American Statistical Association and theU. S. Small Business Administration.
James Barth (Series/Volume editor; author)
James R. Barth is the Lowder Eminent Scholar in Finance at Auburn Univer-sity and a Senior Finance Fellow at the Milken Institute. His research hasfocused on financial institutions and capital markets, both domestic and global,with special emphasis on regulatory issues. Most recently, he served as leader ofan international team advising the People’s Bank of China on banking reform.
Barth was an appointee of Presidents RonaldReagan andGeorgeH.W. Bushas chief economist of the Office of Thrift Supervision until November 1989 andhas previously served as the chief economist of the Federal Home Loan BankBoard. He has also held the positions of professor of economics at GeorgeWashington University, associate director of the economics program at theNational Science Foundation, and Shaw Foundation Professor of Banking andFinance at Nanyang Technological University. He has been a visiting scholar atthe U.S. Congressional Budget Office, Federal Reserve Bank of Atlanta, Officeof the Comptroller of the Currency, and theWorld Bank. He is a member of theAdvisory Council of George Washington University’s Financial ServicesResearch Program.
xiii
Barth’s expertise in financial institution and capital market issues has led himto testify before the U.S. House and Senate Banking Committees on severaloccasions. He has authored more than 200 articles in professional journals andhas written and edited several books, including The Great Savings and LoanDebacle and The Reform of Federal Deposit Insurance. His most recent booksare Rethinking Bank Regulation: Till Angels Govern, with Jerry Caprio andRossLevine, CambridgeUniversity Press, 2006, andFinancialRestructuring andReform in Post-WTO China, with Zhongfei Zhou, Douglas Arner, Berry Hsu,andWeiWang,Kluwer Law International, 2007.He is also the overseas associateeditor of The Chinese Banker. Barth has been quoted in publications rangingfrom the New York Times and Wall Street Journal to Time and Newsweek, andappeared on broadcast programs including ‘‘The McNeil/Lehrer Newshour,’’‘‘Good Morning America,’’ ‘‘Moneyline,’’ and National Public Radio.
Barth serves on the editorial boards of the Journal of Financial ServicesResearch, Review of Pacific Basin Financial Markets and Policies, Journal ofEconomics and Finance, and Financial Services Review. He is also included inWho’s Who in Economics: A Biographical Dictionary of Major Economists,1700 to 1995.
Barth received his Ph.D. in Economics from Ohio State University
Timothy Bates
Timothy Bates is Professor of Labor and Urban Affairs and Economics atWayne State University. Research reported in this studywas conducted, in part,at the U.S. Bureau of the Census Center for Economic Studies. Findingsexpressed are those of the author and do not necessarily reflect views of theU.S. Bureau of the Census. Financial assistance from the Woodrow WilsonCenter International Center for Scholars supported this study.
Ben Craig
Ben Craig is an economic advisor in the Research Department of the FederalReserve Bank of Cleveland, where he specializes in the economics of bankingand international finance.
Before joining the Bank in 1994, Dr. Craig was an assistant professor ofeconomics at Indiana University. He has also taught at Washington StateUniversity, Stanford University, and the University of Konstanz, Germany.He was a visiting scholar at the Bundesbank in Germany in 2001.
Dr. Craig earned a bachelor’s degree with honors fromHarvardUniversity in1976 and received a doctorate in economics from Stanford in 1986. He ismarried and the father of three children.
Kelly Edmiston
Kelly D. Edmiston is a Senior Economist in the Community Affairs Depart-ment of the Federal Reserve Bank of Kansas City. His primary research inter-ests are regional economic growth and development and state and local publicpolicy. His research has been published in several leading economics and policy
xiv Author Bios

journals, and he has presented his research findings at numerous nationalconferences and professional meetings. He has also provided policy adviceand technical assistance to several state and local governments, as well asoverseas, and has provided expert commentary in national media outlets.Prior to joining the Federal Reserve Bank of Kansas City, Kelly was AssistantProfessor of Economics at the Andrew Young School of Policy Studies atGeorgia State University and served as a consultant for the World Bank. Heholds BA and PhD degrees from the University of Tennessee.
William E. Jackson III
William Jackson is a financial economist and associate policy adviser with thefinancial group of the research department of the Federal Reserve Bank ofAtlanta. Dr. Jackson concentrates his research on the role financial marketsand financial institutions play in making the modern economy more efficientand productive.
Before joining the Atlanta Fed, Dr. Jackson was an associate professor offinance at the Kenan-Flagler Business School of the University of NorthCarolina at Chapel Hill. He also taught at the Kellogg Graduate School ofManagement at Northwestern University and at Boston University.
He has published in the Journal ofMoney Credit and Banking, the Review ofIndustrial Organization, the Journal of Banking and Finance, ManagementScience, and the Review of Economics and Statistics. Dr. Jackson is currentlyon the editorial advisory board of the Journal of Small Business Management.In July 2004, Dr. Jackson provided expert testimony before the U.S. House ofRepresentatives on the deregulation of credit unions. In 2005, he served aseditor of a special issue of the Journal of Small Business Management on‘‘Small Firm Finance, Governance, and Imperfect Capital Markets’’ and alsoin 2005 was selected to serve a three-year term as a Filene Research Fellow.
Dr. Jackson earned his bachelor’s degree in economics and applied mathe-matics at Centre College. He earned an MBA in finance at Stanford Universityand his master’s degree and doctorate in economics at the University of Chicago.
Kadri Kallas
Kadri Kallas is a Ph.D student at the School of Public Policy, George MasonUniversity. She received her MA in Public Administration and Social Policy atthe University of Tartu, Estonia. She has been involved in European UnionResearch Programs and studied the organization and processes of Estonia’saccession of European Union. Her current research areas include innovationsystems, technology transfer, and entrepreneurship.
Robert Litan
Robert Litan is vice president of Research and Policy at the KauffmanFoundation.
Litan has been affiliated with The Brookings Institution for nearly 20 years,first as a Senior Fellow and since 1996 as director of Economic Studies and
Author Bios xv
holder of Cabot Family Chair in Economics. At Brookings, he led a team ofeconomists monitoring the global economy and seeking answers to economicpolicy issues in the U.S. and around the world. The group’s rigorous, indepen-dent research was designed to increase the public’s understanding of how theeconomy works and how to make it better. During his time with Brookings,Litan authored or co-authored more than 25 books and 200 articles for profes-sional journals and magazines. He co-founded and serves as the Director of theAEI-Brookings Joint Center on Regulatory Studies.
Litan has had a distinguished career in public service. He served on the staffof the Council of Economic Advisers (1977–79), as Deputy Assistant AttorneyGeneral in the Antitrust Division of the Justice Department (1993–95), andAssociate Director of the Office and Management and Budget (1995–96). Healso has been a consultant to the Treasury Department on financial policyissues.
Litan received his B.S. degree in Economics, graduating summa cum laude,from the Wharton School Department of Finance at the University of Penn-sylvania; his J.D. from Yale Law School; and both a Master of Philosophy andPh.D. in Economics from Yale University.
David Mushinski
David Mushinski is an Associate Professor in the Department of Economics,Colorate State University. He has a Ph.D. in Economics from the University ofWisconsin-Madison, a J.D. from the University of Virginia School of Law, andB.A. in Economics from the College of William and Mary. His research hasfocused on micro-enterprise and small business access to credit in developingareas, American Indian economic development, and regional economics. Hiscurrent research interests include the relationship between entrepreneurshipand health insurance, and the Morris Plan of lending.
Ronnie J. Phillips
Ronnie J. Phillips received and his B.A. in Urban Studies from the University ofOklahoma in 1973 and his Ph.D. in Economics from The University of Texas atAustin in 1980. He is a Senior Fellow at Networks Financial Institute inIndianapolis, Indiana and Professor of Economics at Colorado State Univer-sity where he has taught since 1983. From 2001–2006, he was Chairman of theEconomics Department. He was the recipient of the Oliver Pennock Distin-guished Service Award from CSU in 2000. A past president of the Associationfor Evolutionary Economics, he has been a Scholar in Residence at the EwingMarion Kauffman Foundation in Kansas City, Missouri; a Visiting ResearchFellow at the American Institute for Economic Research in Great Barrington,Massachusetts; a Visiting Scholar in the Division of Insurance at the FederalDeposit Insurance Corporation in Washington, D.C.; a Visiting Scholar in theBank Research Division at the Office of the Comptroller of the Currency,Department of the Treasury, in Washington, D.C.; and a Resident Scholar at theJerome Levy Economics Institute of Bard College in Annandale-on-Hudson,
xvi Author Bios
New York. Before coming to CSU he taught at Texas A&M Universityin College Station, Texas. He has published widely on banking issues,entrepreneurship, and public policy in books, academic journals, newspapers,magazines, and public policy briefs. His current research interests are paydaylending and entrepreneurship in the music industry.
James Thomson
James Thomson is vice president and economist in the Research Department ofthe Federal Reserve Bank of Cleveland. His research interests focus on financialmarkets and institutions, historical banking, and government-sponsoredenterprises.
Prior to joining the Bank in 1986, Dr. Thomson worked as a financialeconomist at the U.S. General Accounting Office. He is currently a memberof the American Finance Association as well as the Financial ManagementAssociation. He has published numerous papers on federal deposit insurance,bank structure, and bank capital regulation, including articles in the Journal ofFinance, Journal of Money, Credit, and Banking, and Journal of Small Busi-ness Management.
Dr. Thomson received a bachelor’s degree in economics from Georgia Insti-tute of Technology and amaster’s and Ph.D. in economics from The Ohio StateUniversity. He is married and has three children.
Glenn Yago (Series/Volume editor; author)
Glenn Yago is Director of Capital Studies at the Milken Institute. He specia-lizes in financial innovations, financial institutions and capital markets, and hasextensively analyzed public policy relating to job creation and capitalformation.
Before coming to the Institute, Yago was Director of the Center for CapitalStudies in New York, which he founded in 1992 to develop insight into theprocess of capital access and ownership change. He was a faculty member of theCity University of New York Graduate Center Ph.D. Program in Economics,and a Senior Research Associate at the Center for the Study of BusinessGovernment at Baruch College—City University of New York.
He has held the positions of Faculty Fellow at the Rockefeller Institute ofGovernment, Director of the Economic Research Bureau at the State Univer-sity of New York at Stony Brook and Associate Professor of Management atStony Brook’s Harriman School for Management and Policy. He has alsoserved as Chairman of the New York State Network for Economic Researchand consulted for corporations and governments on economic policy andstrategy. Yago received his Ph.D. from the University of Wisconsin, Madison.
Betsy Zeidman (Volume editor; author)
Betsy Zeidman is Director of the Center for Emerging Domestic Markets(CEDM) and a Research Fellow at the Milken Institute. CEDM aims toincrease the flow of capital to America’s emerging entrepreneurs and
Author Bios xvii

communities through its research and information network, educational centerand financial innovations laboratory. She also manages the Center’s activity insuch areas as strategic philanthropy, mission-related investing, corporate gov-ernance, environmental finance and international microfinance. In this posi-tion, Zeidman works with foundations, governments, institutional andindividual investors, entrepreneurs and policy makers. She authors articlesand research reports, and speaks frequently at conferences and to the media.Zeidman also provides strategic advisory services, with a specialty in corporateresponsibility and financial performance. Prior to joining the Institute, sheserved as senior management at several entertainment companies and publicaffairs firms, and staffed national and state political campaigns. She receivedher B.A and M.B.A. degrees from Yale University.
xviii Author Bios
Contributors
Zoltan J. Acs
George Mason [email protected]
Michael S. Barr
University of Michigan Law Schooland The Brookings [email protected]
James R. Barth
Milken [email protected]
Timothy Bates
Wayne State [email protected]
Ben R. Craig
Federal Reserve Bank of [email protected]
William E. Jackson
Federal Reserve Bank of Atlanta andthe University of [email protected]
Kadri Kallas
George Mason [email protected]
David Mushinski
Colorado State [email protected]
Ronnie J. Phillips
Colorado State [email protected]
James B. Thomson
Federal Reserve Bank of [email protected]
Glenn Yago
Milken [email protected]
Betsy Zeidman
Milken [email protected]
xix


Entrepreneurship in Low and Moderate
Income Communities
Kelly D. Edmiston1
Over the last several decades, numerous programs and policies have been
established to assist low and moderate income families.2 Some of these endea-
vors, especially those targeting the very poor, have made substantial improve-ments in the lives of those they have touched. Historically, however, most of
these efforts to assist low and moderate income people have had little impact
beyond the provision of basic needs, such as food, clothing, and shelter.
Advocates have recognized this, and increasingly efforts are being made to
generate more sustainable improvements in the financial well-being of lowand moderate income people by assisting them in creating and maintaining
wealth (Sherraden, 1991). Examples of these endeavors include home owner-
ship programs and individual development accounts. Another important way
one can create wealth is through entrepreneurship.Although a consensus definition does not exist, most would agree that an
entrepreneur is onewho starts a business and accepts (most of) the risk associated
with owning that business. Some believe that one must bring an innovative
product or service to market to be considered an entrepreneur, but others
would consider any self-employed person to be an entrepreneur.3 In the low
andmoderate income context, it is probably best to use a broad definition, whichwould include self-employed people generally.
Evidence suggests that entrepreneurship is a viable alternative to wage
and salary employment (or unemployment) for many low andmoderate income
K. EdmistonCommunity Affairs Department of the Federal Reserve Bank of Kansas [email protected]
1 The views expressed in this chapter are those of the author do not necessarily reflect theviews of the Federal Reserve Bank of Kansas City or the Federal Reserve System.2 Low income refers to families earning less than 40 percent of area median income (metro-politan statistical area median income for those living in metropolitan areas and state medianincome for those living in nonmetropolitan areas). The earnings of moderate income familieslie between 40 percent and 80 percent of area median income.3 See, for example, Evans and Leighton (1989) and Blanchflower and Oswald (1998).
G. Yago et al. (eds), Entrepreneurship in Emerging Domestic Markets.� Milken Institute 2008
1
people. An analysis of data from the Panel Study of Entrepreneurial Dynamics(PSED) suggests that 38 percent of nascent entrepreneurs, defined as those whoare actively involved in the creation of new business ventures, live in low andmoderate income households.4 Of these, about 45 percent live in low incomehouseholds. Roughly eight percent of nascent entrepreneurs live in householdswith below poverty-level income.
Entrepreneurship may yield a double dividend in low and moderate incomecommunities. Many of the retail and services establishments available inhigher income areas, such as grocery stores, often are not available to lowand moderate income people because they tend not to be located in low andmoderate income places, and many low and moderate income people facetransportation challenges (Cotterill and Franklin, 1995). Entrepreneurialactivity not only provides income to the entrepreneurs and perhaps othersin the community, but also provides needed goods and services. The entre-preneurs themselves do not need to be low and moderate income people forthe community to profit from this double dividend, however. Benefits alsoarise from the location of entrepreneurial enterprises developed and operatedby higher income people, but located in low and moderate incomecommunities.
Additional gainsmay also arise from increased entrepreneurship. Self-employedpeople on average have higher incomes than wage and salary workers (Fronczek,2005), and self-employment may be an important component of upward mobility.Further, many report nonpecuniary benefits: self-employed people tend to reporthaving more control over their lives and more often report being highly satisfiedwith their lives than do wage and salary workers (Blanchflower, 2004).5 And ofcourse, self-employment may be the only reasonable option to earn income formany low and moderate income people.
Although the benefits from entrepreneurship in low and moderate incomecommunities are many, numerous hurdles also exist. For example, low andmoderate income people hold little of the nation’s wealth.Wealth can be criticalfor entrepreneurial success because it may provide start-up capital, provides afinancial safety net during the transition from wage and salary employment,and may serve as a positive signal to other potential investors (Kim et al., 2004).Although there is some debate, research largely suggests that the lack offinancial capital is a major impediment to entrepreneurship (Kim et al., 2004;Dunn and Holtz-Eakin, 2000; Evans and Jovanovic, 1989).
Human capital also presents a problem in low and moderate incomecommunities. Educational attainment among low and moderate income people
4 All figures reflect calculations by the author using data from the PSED. For data anddocumentation, visit http://www.psed.isr.umich.edu/main.php (accessed May 17, 2006).5 Of course, as Blanchflower notes, self-employment people also work under a lot of pressureand report that they find their work stressful, come home fromwork exhausted, are constantlyunder strain, lose sleep over worry, and place more weight on work than they do on leisure.
2 K. D. Edmiston
is significantly lower than that of higher income households (Zhan and
Schreiner, 2004). Low and moderate income people also tend to have less
work experience.6 Research suggests that human capital, in the form of both
education and work experience, is positively related to the survival and
performance of new ventures (Brush and Manolova, 2004; Cooper and
Gimeno-Gascon, 1992).Many other obstacles to entrepreneurship exist for low and moderate income
communities as well, not the least of which is a declining economy in many urban
areas. Although several promising efforts to promote entrepreneurship and sup-
port small business owners in low and moderate income communities have been
implemented in the last several years, the idea of fostering entrepreneurship in low
and moderate income communities has received little attention in academic
circles. In an effort to stimulate research, encourage discussion, and begin to
frame the issues, several leading scholars were brought together for a conference
to explore the possibilities that entrepreneurshipmight offer for low andmoderate
income communities. The conference, which was held November 3–4, 2005
in Kansas City, Missouri, was jointly sponsored by the Federal Reserve Bank
of Kansas City and the Ewing Marion Kauffman Foundation. This volume is a
collection of original essays prepared for the conference, as well as comments
from discussants and remarks from panelists.One way to think about entrepreneurship in low and moderate income
communities is to consider the role of entrepreneurship in revitalizing depressed
areas, which often are heavily populated by low and moderate income people.
This is the path followed by Tim Bates.In many of the great industrial centers of the 20th century, established firms
constituting the economic base of the area – firms serving national and interna-
tionalmarkets, which provide the ‘‘raison d’etre for the regional economy’’ – have
lost their competitive edge, due in large part to an increasingly globalized
economy and relatively cheap labor over seas. Reduced money flows from out-
side the area also result in dimmer fortunes for local suppliers that service the
base industries and for the many, mostly smaller firms that service local needs,
such as food, housing, and medical services.As the local economy becomes depressed, ‘‘bright young people’’ and estab-
lished professionals often depart to seek attractive opportunities in expanding
regions. Physical capital often is drained from the area as well, as factories and
other facilities become underutilized or closed down altogether. The flight of
human capital and erosion of physical capital simply exacerbate the problem,
and a downward spiral often ensues. Finally, public infrastructure tends to
decay and public service delivery suffers as local governments face declining
resources.
6 For data, see http://pubdb3.census.gov/macro/032002/perinc/new05_001.htm (accessedMay 19, 2006).
Entrepreneurship in Low and Moderate Income Communities 3
Bates argues that often local government attempts to revitalize depressedareas contribute to further deterioration. There is little ‘‘hard evidence’’ thatenterprise and empowerment zones, and to some degree tax incentives in gen-eral, achieve their stated goals – one only has to look at Detroit, which is‘‘blanketed’’ by a variety of such incentives. Worker training and educationmake sense as a tool for easing the transition of workers into sectors where labordemand is increasing, but these are ‘‘people based’’ rather than ‘‘place based’’policies, and the effect is to enhance the workers’ mobility, which often meansan escape from stagnant and declining areas to expanding areas where jobopportunities are readily available.
Revitalization of a depressed area requires an entrepreneur to re-deploy itsunderutilized resources. This can be most directly accomplished by strengthen-ing the region’s economic base. But if the market for the base product is largeand stable, and the product is highly standardized, the strategy is not going towork. Rather, what is needed are circumstances in which small, innovative,entrepreneurial firms can compete at this level. These include a small, but highlyviable market for a product that is highly differentiated (as opposed to stan-dardized) and for which the weight and bulk to value ratio is high, where speedof delivery is important and applicable supplier industries are competitive.
Echoing Bates, Zoltan Acs and Kadri Kallas argue that the role of theentrepreneur is to shift resources yielding a low return into activities that yield ahigh return and a personal gain to the entrepreneur. In the absence of entrepre-neurs, resources continue to be employed in activities yielding low returns, whichleads to an ‘‘ossified economy’’ where resources are under-utilized. Empiricalevidence supports the notion that entrepreneurship can be a critical factor ineconomic growth. Acs andKallas refer to findings of a 2004 paperAcswrotewithCatherine Armington, which suggest that a one standard deviation increase in therate of new firm formation (from 3.5 to 4.5 per thousand in the labor force )yields a one-half standard deviation increase in the employment growth rate, from2.1 percent to 2.85 percent.
Unfortunately, while entrepreneurship can provide a substantial boost toeconomic growth in general, its prospects for revitalizing low and moderateincome communities are not very promising. Acs and Kallas assert that a majorconclusion of his literature survey is that ‘‘entrepreneurship may not play animportant role in poor communities.’’ The majority of microentrepreneurs whostart off poor remain poor.
The chief problem, it seems, is that many low and moderate income peoplesimply lack the requisite skills to be successful entrepreneurs. Many of thedeficiencies that prevent entry into white-collar employment, such as languageand technical skills, also hinder small business development. Of course, the lackof human capital is not the only problem impeding entrepreneurship in low andmoderate income areas. These communities often also suffer from a lack ofother required inputs and inadequate social capital and finance. Having saidthat, it is important to note that money will not overcome gaps in education andentrepreneurial skills.
4 K. D. Edmiston
Acs and Kallas argue that ‘‘each segment of the population includes someproportion of entrepreneurs.’’ The extent to which they will emerge depends onthe support they receive. In terms of support from the public sector, he suggeststhat it is not so much pro-active policies that are needed, but the undoing ofsome destructive policies. The economic value of the inner city as a businesslocation can be increased by, among other things, ‘‘abolishing self-inflictedregulatory costs.’’ There is little evidence that public financial support programsto small businesses are effective in poor communities, although there is evidencethat some specific programs work well in some cases. In general, public inter-vention should not try to imitate market functioning mechanisms. Rather, itshould focus on creating an enabling environment for entrepreneurship andapplying non-market solutions to market failures, such as education and phy-sical infrastructure.
An interesting twist in the Acs and Kallas paper is the notion that the linkbetween entrepreneurship and low and moderate income communities may besocial entrepreneurship. They argue that ‘‘social entrepreneurship is when an indi-vidual who has the prerequisite skills to pursue for-profit entrepreneurship choosesto maximize his or her utility instead of profits.’’ An ‘‘attractive’’ opportunity is onewith sufficient potential for a positive impact to justify the investment. The devel-opment of social capital that social entrepreneurship often engenders can help to‘‘empower disadvantaged people and encourage them to take greater responsibilityfor, and control over, their lives.’’
Much of the literature Acs and Kallas review is tepid at best in its support ofpublic financial support programs for small businesses in poor communities.But the U.S. Small Business Association’s loan guarantee programs may havesomething to offer low and moderate income communities, according to apaper by Will Jackson, Ben Craig, and James Thompson. Previous work bythe same authors suggests that SBA guaranteed lending has a positive, albeitsmall effect on economic growth rates in local geographic markets, as measuredby per capita income. In this paper, the authors extend the analysis to anothermeasure of economic performance, the employment rate. Perhaps more impor-tantly from the perspective of this volume, they investigate the possibility of adifferential impact on low income communities vis-a-vis higher incomemarkets.
Using a simple fixed effects model, Jackson, Craig, and Thompson find thatthe inflation-adjusted total dollar amount of SBA-guaranteed loans, scaled bypopulation, has a statistically significant positive impact on employment ratesin MSAs and non-MSA counties, but similar to their previous work, they findthat the result is economically small. Importantly, the authors find that theeffect of per capita SBA-guaranteed lending on the employment rate diminisheswith greater levels of market development, as measured by per capita bankdeposits. Given a positive correlation between financial market developmentand per capita income, the authors draw the conclusion that SBA-guaranteedlending has a larger impact in lower income areas.
Like Acs and Kallas and Bates, Barth, Yago, and Zeidman suggest thatgovernment regulations can be stumbling blocks to entrepreneurship. Results
Entrepreneurship in Low and Moderate Income Communities 5
from the Small Business Problems and Priorities survey of small business ownersindicate that in a ranking of 75 barriers for small businesses, regulations such asworkers’ compensation and ‘‘unreasonable government regulation’’ were thirdand ninth on the list, respectively, while business taxes was fifth and propertytaxes ranked sixth. The authors provide some anecdotal evidence of regulatorybarriers to new businesses, as well. Although the difficulty of obtaining long-term and short-term loans ranked low on the list (70th and 68th, respectively),the authors assert that some regulations intended to protect borrowers actuallyhave the perverse effect of reducing the availability of loans to small businesses.
Barth, Yago, and Zeidman note that much of the literature on the determi-nants of entrepreneurship mention that liquidity constraints are a major barrier.Looking across Census tracts, the authors find that the mean share of loansmade to businesses in low and moderate income communities is more than 40percent below the mean share of low and moderate income people in thepopulation. While they argue that this calculation is a somewhat naıve measureof ‘‘loan bias,’’ they suggest that the number is a useful benchmark with whichone can begin to understand the reasons for ‘‘the substantial variation in dis-tributions of LMI loans and LMI populations across MSAs.’’ Indeed, the meantells us little about the distribution, which varies widely across MSAs. In a fewcases, LMI communities receive a share of business loans greater than their shareof the population, but a considerable majority of LMI communities receive asubstantially smaller share of loans compared to their population share.
An arguably much better measure of such loan bias is the distribution ofloans to LMI communities relative to their share of total income. In thiscalculation, Barth, Yago, and Zeidman find a reversal of fortunes: the shareof business loans in LMI areas exceeds their share of income. But again, thedistribution varies widely across MSAs, and 13 percent of LMI communitieshave a ‘‘positive loan bias.’’
In the remainder of their paper, Barth, Yago, and Zeidman review theliterature on the determinants of entrepreneurship and set out to investigatethe issue themselves in what they term an ‘‘indirect approach.’’ Using regres-sions of number (or share) of total and small business establishments onnumerous factors, they find several of their potential determinants of entrepre-neurship to be statistically significant, among them many of the financialvariables they included. None of the formulations of their measure of loanbias was significant in explaining total establishments, but the formulationsusing population in the denominator were positively correlated with establish-ments with zero and 1–10 employees and negatively correlated with establish-ments with more than 100 employees. The income-based measure of loan biaswas not significant in any of the regressions.
Similar to Barth, Yago, and Zeidman and Jackson, Craig, and Thompson,Phillips and Mushinski focus to some degree on access to financing for smallbusinesses. They evaluate the role that Morris Plan lending institutions playedin expanding consumer micro-credit in the United States in the early twentiethcentury. This story serves as an interesting and important example of an
6 K. D. Edmiston

institutional structure ‘‘appearing organically and through the private sector tosatisfy a consumer need’’ and thus offers vital lessons for those seeking toincrease access to micro-credit today, an important effort in expanding entre-preneurship in low-and-moderate-income communities.
TheMorris Plan bankswere unique in viewing the lending needs of low-incomepeople as a profit opportunity. They took advantage of the joint liability structurein their loan contracts to make relatively low cost loans–loans that were low costto both borrower and lender.
Arthur J. Morris, for whom these thrifts were named, believed that ‘‘char-acter, plus earning power, is the proper basis for credit.’’ Therefore, these loanswere unsecured and were targeted to individuals who were judged to have goodcharacter and who had a steady source of income, but who did not necessarilyhave financial resources available. Borrowers were required to find two people toserve as co-signers on the loan. This imposition of joint liability lowered mon-itoring costs because the co-signers had an incentive to investigate a problemloan and rectify the default. Further, adverse selection problems were mitigatedto the extent that co-signers would presumably only co-sign a loan for someonethey viewed as trustworthy and likely to repay the loan. Judging the character ofthe borrower was thusmuch less costly to the lender. These attributes allowed theMorris Plan banks to profitably serve a previously underserved market.
Credit unions arose in the United States at about the same time as theMorrisPlan banks. Joint liability is an important component of credit union lending aswell, because the members all suffer a loss when a loan is not repaid (and someloans require co-signers). In this sense, the joint liability imposed on creditunion borrowers was much broader than that imposed on Morris Plan bor-rowers. Phillips and Mushinski assert that the relatively greater success ofMorris Plan banks during this period is due in large part to the weaker jointliability of the Morris Plan loans.
Phillips andMushinski note that a key lesson from the experience of theMorrisPlan banks relative to the credit unions is that those designing micro-creditinstitutions should critically consider the social and cultural context into whichthe institution is to be introduced. The Morris Plan structure was ‘‘more attunedto the individuality of typical Americans than were credit unions.’’
The overall thrust of these papers seems to be that fostering entrepreneurshipin low andmoderate income communities is no easy task.Many of the problemsthat lead to unemployment and low wages in these communities are likely alsohindrances to entrepreneurship. But there is hope, and the public and nonprofitsectors may be able to help.
One of the best things that the public sector can do to foster entrepreneurshipis to eliminate unnecessary regulations and break down other barriers. Financialcapital is critical, and existing efforts to assist entrepreneurs in acquiring finan-cial capital seem to have been effective in some cases. Small Business Adminis-tration loan guarantees are associated with higher personal income and higheremployment rates, and tend to be especially effective in low and moderateincome communities. Given their share of personal income, low and moderate
Entrepreneurship in Low and Moderate Income Communities 7
income communities also largely receive a reasonable share of commercial loans,although there is wide variance in these shares relative to personal income acrosscommunities, and commercial loan activity is very low in low and moderateincome communities overall relative to their share of the population. Entrepre-neurship likely has a critical role in rebuilding declining communities.
While these five papers offer some important insights on the issue of entre-preneurship in low and moderate income communities, they have really onlytouched the surface. The hope is that this conference will spawn additionalresearch in the area of entrepreneurship in low and moderate income commu-nities and begin to frame an important policy debate.
References
Blanchflower, David G. (2004). ‘‘Self-Employment: More May Not Be Better,’’ NationalBureau of Economic Research Working Paper No. 10286, Cambridge, MA, February.
Blanchflower, David G. and Andrew J. Oswald (1998). ‘‘What Makes an Entrepreneur?’’Journal of Labor Economics, 16(1), 26–60.
Brush, Candida G. and Tatiana S. Manolova (2004). ‘‘Personal Background,’’ inWilliam B. Gartner, Kelly G. Shaver, Nancy M. Carter, and Paul D. Reynolds, Eds.,Handbook of Entrepreneurial Dynamics: The Process of Business Creation (ThousandOaks, CA: Sage Publications), 49–61.
Cooper, Arnold C. and Javier Gimeno-Gascon (1992). ‘‘Entrepreneurs, Processes of Found-ing and Firm Performance,’’ in Donald L. Sexton and John D. Kasarda, Eds., The State ofthe Art of Entrepreneurship (Boston, MA: PWS-Kent), 301–340.
Cotterill, Ronald and Andrew Franklin (1995). ‘‘The Urban Grocery Store Gap.’’ FoodMarketing Policy Center, University of Connecticut, April.
Dunn, Thomas andDouglasHoltz-Eakin (2000). ‘‘Financial Capital, HumanCapital, and theTransition to Self-Employment: Evidence from Intergenerational Links,’’ Journal of LaborEconomics, 18(2), 282–305.
Evans, David S. and Boyan Jovanovic (1989). ‘‘An Estimated Model of EntrepreneurialChoice Under Liquidity Constraints,’’ Journal of Political Economy, 97(4), 808–827.
Evans, David S. and Linda Leighton (1989). ‘‘Some Empirical Aspects of Entrepreneurship,’’American Economic Review, 79(3), 519–535.
Fronczek, Peter (2005). ‘‘Income, Earnings, and Poverty from the 2004American CommunitySurvey,’’ U.S. Census Bureau, Washington, DC, August.
Kim, Phillip H., Howard E. Aldrich, and Lisa A. Keister (2004). ‘‘Household Incomeand Net Wealth,’’ in William B. Gartner, Kelly G. Shaver, Nancy M. Carter, andPaul D. Reynolds, Eds., Handbook of Entrepreneurial Dynamics: The Process of BusinessCreation (Thousand Oaks, CA: Sage Publications), 49–61.
Sherraden, Michael W. (1991). Assets and the Poor: A New American Welfare Policy.Armonk, NY: M.E. Sharpe.
Zhan, Min and Mark Schreiner (2004). ‘‘Saving for Post-Secondary Education in IndividualDevelopment Accounts,’’ Working Paper No. 04–11, Center for Social Development,Washington University, St. Louis, MO.
8 K. D. Edmiston
Alleviating the Lagging Performance
of Economically Depressed Communities
and Regions
Timothy Bates
1 Lagging Economic Base, Lagging Employment,
Lagging Incomes: Roots
Joseph Schumpeter observed early in the twentieth century that there really is
no equilibrium in competitive markets. Static efficiency at a single point in time
conveys little advantage to the firm, the industry, or the region; the advantage,
instead, belongs to the innovators introducing new marketing strategies, new
products, and more efficient production techniques. The entrenched giants
relying upon scale economies in production and marketing for competitive
advantage are unlikely to survive in the long run, when matched against the
entrepreneurs who invent newmarket segments, revolutionize production tech-
niques, and reconfigure supply chains.Manyof the greatest centers ofU.S. industry in twentieth century are economic-
ally depressed areas today, for example:Detroit,Michigan;Gary, Indiana; various
cities in upstate New York. All suffer from a slow, long-term loss of competitive
position. Leading firms in the these regions—Ford,U. S. Steel,Kodak,Xerox, and
others—previously enjoyed powerful oligopolistic positions in their respective
industries.The process of decay did not follow a set formula, but Michael Porter has
identified certain broad patterns, including lagging innovation, a gentlemanly
pace of competition, and a tendency to blame industry problems on unfair
international competition or, perhaps, labor unions (1998). Competition might
be suppressed in part by private-sector monopoly power, or by protective
government policies once the process of decline has set in. But at best, this
merely slows the pace of decline.Local governments in the declining regions often face fiscal crises, which
they address by pursuing policies that accelerate the pace of decline. In Detroit,
T. BatesWayne State University,[email protected]
G. Yago et al. (eds.), Entrepreneurship in Emerging Domestic Markets.� Milken Institute 2008
9

for example, weak infrastructure and poor education and training systems workto exacerbate rather than alleviate the processes of long-term decline. Bright,ambitious young adults raised in economically depressed areas often choose todepart, seeking their fortunes in other regions of the country, where opportu-nities are wider and risks are lower. The outcomes of these and other contribut-ing factors are economically depressed regions characterized by weak humanresources, low levels of capital investment, lagging innovation, and erodinginfrastructure. Something of a downward spiral develops; a process of cumu-lative causation takes root, which is very hard to halt, much less reverse.
Porter offers a provocative thumbnail sketch of what is perhaps the mostcommon cause of regional stagnation: the core cause of high underemploymentrates and lagging household incomes. Firms constituting the economic base ofthe area—the firms that bring in dollars by selling their products to clientslocated outside of the region—are experiencing a loss of their competitive edge(1998). These established firms may have large-scale, highly specialized assets inthe form of plants and equipment; they might have professional, technical, andmanagerial workers—indeed most of their workers—possessed of a wealth ofspecialized skills and hands-on work experience. That is not really the crux ofthe problem. The crux is the fact that these established firms, however wealthyand powerful, have been slow to adapt to changing circumstances.
This reality explains why the large and powerful corporation so often losesout when faced with competition that is truly entrepreneurial. ‘‘Successfulcompanies seek predictability and stability,’’ notes Porter (1998, p.52). Toooften, prevailing conventional wisdom is rooted in circumstances that are losingtheir relevance. Faced with competitive threats within changing circumstances,decision makers are basing strategies upon outdated fundamentals, and ‘‘strat-egy becomes ossified’’ (Porter, 1998, p.52).
Entrepreneurship can manifest itself in many ways; I will focus primarilyupon: small firms. What chance does the small business have against theentrenched, large-scale, status quo producers? The inflexibility of the oldorder is key to understanding why the newcomer often prevails. Unencumberedby the conventional wisdom, the entrepreneurial newcomer is not bound bynorms and common practices. Greater flexibility, quicker execution, new stra-tegies—these are the keys to success.
2 The Dynamics of Regional Cumulative Underdevelopment
Declining competitive advantage drags down the economic-base industries thatregions rely upon for competitive advantage. If the regional economy is highlydiversified, cumulative underdevelopment tendencies may never materialize.A healthy, well-diversified regional economy is most likely one that has anumber of different industries experiencing varying stages of expansion anddecline. As those core industries decline, they free up resources (by laying off
10 T. Bates
workers, for example); industries enjoying increasing competitiveness andexpanding market share are buying/hiring more resources. This processundoubtedly is painful to individuals displaced from a declining sector andlacking the skills most actively sought in the expanding sectors. But the pain oftransition is part of the normal functioning of a healthy, market-drivencapitalist economy. The problem of cumulative underdevelopment isprofoundly more painful, and, most often, it afflicts areas with a thinly diversi-fied economic base.
A hypothetical depressed area is described in this section, focusing uponcircumstances that perpetuate regional underdevelopment. I am not attemptingto deny the diversity that characterizes actual depressed regions and districts;my intent is to simplify reality by abstracting from messy detail certain coretraits that might be manipulated by persons or institutions seeking to create orexpand entrepreneur-driven business activities.
A depressed area is an underdeveloped enclave within a prosperous anddynamic economy. Economic underdevelopment is preserved by a drain ofresources that sustains the depression. Flows of resources interact with prevail-ing economic conditions in a system of circular causation that maintains under-developed areas as characteristic features of the U.S. economy. Characteristicresource drains include human capital, financial capital, physical capital, andpurchasing power. Depressed areas, therefore, are left without many of theresources necessary for redevelopment and improvement.
Human capital is the most important single resource. This resource oftendiminishes over time by way of the educational system and the high-wageeconomy. Drawn by outside opportunities, many intelligent and capableyoung adults move into the progressive sectors where opportunities are widerand rewards are greater. Advanced educational credentials are common ticketsout for bright young people. Attractive career opportunities are forthcomingfrom employers located in prosperous, growing regions of the country.Depressed-area employers are unlikely to offer comparable opportunities.This selective drain of human resources leaves underdeveloped areas bereft oftheir best products.
Young people may be the most mobile, but they are not the only humanresources leaving depressed areas. Declining opportunities prompt local profes-sionals to look elsewhere. The pull of attractive career options in expandingregions, combined with bleak local options, cause accountants, engineers,lawyers, doctors, and other professionals to depart. Often, they are notreplaced.
The drain of physical capital is equally striking. The economic-base indus-tries in depressed areas are typically in decline. Regions with atrophying exportindustries—autos in Detroit, camera film in Rochester, New York, dairy pro-ducts in rural New England—compose a major share of the depressed areascurrently found in the United States. Almost by definition, declining exportindustries are undergoing long-term disinvestment. New investment—particu-larly cost-cutting investment—may take place, and the economic-base
Alleviating the Lagging Performance 11
industries may bemajor local employers. But long-run trends are clear: employ-ment numbers gradually are declining as old facilities close down, rarely to bereplaced. Factories, farms, and other facilities often fall into a state of under-utilization and ultimately are abandoned.
Non-base industries—local retailing and services—gain much of their vital-ity (or lack thereof) from the area’s economic-base industries. When factoriesclose and farm land is underutilized, employment in the base industries fallspredictably, and the pool of local purchasing power to buy the goods andservices of the non-base industries contracts. These industries then shrink inlockstep fashion as the region’s economic base declines.
Faced with declining industries, job loss, shrinking purchasing power, andselective out-migration of well-educated adults, local governments operate inan environment of declining fiscal capacity. The local public infrastructure mayfall into disrepair and become increasingly expensive to maintain. Lacking theresources for adequate maintenance and repair, local governments by defaultoften permit public facilities to deteriorate. Streets, schools, parks, sanitation,police and fire stations (and their equipment) depreciate. Repairs to resolvecrises replace normal maintenance; the physical capital of public infrastructuredrains out of depressed areas. Ultimately, older schools, libraries, police andfire stations, hospitals, and the like are closed down.
The housing sector’s vitality profoundly reflects dominant trends in theregion’s private sector. Low property values and a paucity of new constructionpredictably accompany the long-run decline of the local economic base. Weakpublic services provided by local governments prone to fiscal crisis do notenhance property values. Faced with a declining demand for rental housing,some landlords may choose to maintain their short-run cash flows by minimiz-ing building maintenance. Like the public infrastructure, some rental housingstock falls into a pattern of deterioration and disinvestment. When property isworn out and future prospects do not warrant major repairs, it may beabandoned.
A substantial part of the savings generated by residents and businesses indepressed areas flows into local financial institutions whose investment policiesmight send funds out of the area. Amodern financial sector normally stimulatesgrowth by mobilizing savings and by facilitating allocation of funds to financeeconomic activity. Businesses, households, and local governments depend uponsuch funds to finance economic activities beyond what they can raise indepen-dently. Yet in economies where regional development is highly uneven, expan-sion in growing areas typically drains capital from declining regions (Bates andBradford, 1979).
High rates of investment in expanding areas increase employment andpurchasing power, and this in turn further tends to increase investment in amultiplier fashion. To support high investment, funds migrate to the growingareas from other regions, in search of attractive returns. ‘‘The banking system,’’observed Myrdal, ‘‘becomes an instrument for siphoning off the savings fromthe poorer regions to the richer and more progressive ones’’ (1957, p.28).
12 T. Bates

The resources that might enable a depressed area to break out of its down-ward trajectory are precisely the resources that are prone to drain out. Bankersseek secure returns; young adults seek attractive career opportunities; landlordsredeploy their capital by disinvesting from weak housing markets. All of theseprocesses are part of the normal functioning of the U. S. economy. That isprecisely why depressed areas are normal features of a dynamic economy.
Redeploying resources from declining to expanding sectors and regions oftenexacerbates uneven development because processes of circular causation mag-nify growth in the expanding areas and decline in the depressed regions. Thecapital and talent needed to revitalize depressed areas tend to be drained away.As these resources gravitate toward high-growth areas, regional inequality isheightened. As the ensuring downward multiplier process becomes entrenched,it can be difficult to reverse. In summary, local governments are particularlyharmed: declining resources predictably lead to public infrastructure decay anda struggle to maintain public services. Housing markets, already hurt by out-migration, suffer further from declining public-sector services and amenities.Banks, observing local government deterioration and a weak housing market,are reinforced in their belief that secure returns on loans are more attainableelsewhere. Tightening credit availability encourages landlords to disinvest frommarginal properties that might otherwise have been maintained.
Pessimism reigns, further driving young adults to pursue careers in morepromising environs. Non-base industries are unlikely to make long-term invest-ments in local retail and service industries. Out-migration, public-sector dete-rioration, tightening credit availability, housing disinvestment, businessdisinvestment . . . all of these factors snowball, decline feeding upon decline ina process of circular causation.
3 Traditional Attempts to Revitalize Depressed Areas
It’s important to realize that systematic local government responses toeconomic decline are often themselves contributors to further economic dete-rioration. Simply stated, entrenched government policies worsen the situationin many instances, constituting an effective strategy for undermining possibili-ties for economic revitalization. This may stem from structural problems–lossof property-tax base, for example—rather than incompetence or mismanage-ment in local government. Incompetence, of course, merely causes a bad situa-tion to worsen (Porter, 1997).
Lack of political power may handicap local governments as they compete forresources at higher levels of government. Infrastructure improvement, forexample, may be needed badly, but the competition for public-sector infra-structure allocations may be intense. Winners are apt to be the contenders withgreater political clout: affluent suburbs may take the bulk of infrastructurefunding that fiscally strapped central cities are seeking (Orfield, 1998).
Alleviating the Lagging Performance 13
There exists, nonetheless, local economic development policies designed topromote business investment and job creation in regions and communitiescharacterized by as low income, high poverty, high un- and underemployment,and the like. Such policies often evolve in a political environment in which themajor development needs of depressed areas do not heavily shape the content ofthe revitalization program.
Enterprise zones, of course, come to mind. Tax subsidy programs designedto jump-start economically depressed areas have been a standard feature oflocal economic development policies for decades. Numerous studies by econo-mists have produced little hard evidence that such tax-cut policies actuallyachieve their objectives in any fashion, much less in a cost-effective manner.But there is some evidence. A recent review of the scholarly literature onapplicable state tax incentives, conducted by Terry Buss, does find some evi-dence that tax breaks can influence firm location decisions (2001).
The narrower scholarly literature on enterprise and empowerment zones hasreached a similar conclusion (Peters and Fisher, 2002). Well-designed studies ofimpact (Dowell, 1996, for example) usually conclude that enterprise-zoneincentives have no discernible impact upon the location, investment, and job-creation decisions of private businesses. But a serious optimist could findenough evidence fragments in the literature to argue that a program character-ized by superior design and excellent administration may be a useful tool forrevitalizing depressed areas.
Such optimismmight explain why Detroit has been blanketed by a variety ofstate and federal enterprise- or empowerment-zone incentives and programsover the past decade. An alternative hypothesis is that adopting tax incentives ispolitically easier and less expensive than addressing major infrastructure needs,lack of local government fiscal capacity, and other serious structural problemsthat undermine the attractiveness of Detroit as a site for business creation andexpansion. I label this the ‘‘tax incentive as a token gesture’’ hypothesis, aproductive area for further scholarly research. Meanwhile, prevailing informedopinion suggests that tax-incentive programs are likely to have little impact bythemselves either to revitalize depressed areas or encourage critically neededentrepreneurial business development.
The case for public-sector involvement in worker training and retraining isaltogether different from the rationale for boosting local economic develop-ment through tax subsidies. Yet the worker-training strategy, properly under-stood, is not really about area development. Local economic developmentstrategies often are characterized as ‘‘place-based.’’ Worker training and educa-tion, in contrast, are ‘‘people-based’’ and thus, at best, are very indirectapproaches to revitalizing depressed areas.
Seen in the context of a dynamic, ever-changing economy, the need toencourage, subsidize, and otherwise provide for worker training and retrainingis widely recognized and not controversial. As workers predictably are expelledfrom industry sectors where labor demand is declining, effective retrainingfacilitates the transfer of workers into sectors where labor demand is increasing.
14 T. Bates
Workers must have the skills and expertise employers seek in an expanding,dynamic economy. Effective training enhances the mobility of displacedworkers and lowers the personal costs of transition for workers who have losttheir jobs.
The fallacy of utilizing education and training as a place-based redevelop-ment strategy has been demonstrated many times (Fusfeld and Bates, 1984).Like education, effective training increases one’s options in the labor market.Workers can move easier from a declining industry to an expanding one,drawing people out of the stagnant and declining geographic areas where jobsare few, and into the dynamic and expanding geographic areas with moreopportunities. People move toward opportunity. The depressed areas leftbehind bymobile members of the work force reap no automatic benefit. Havinglost their more skilled workers, these areas most often are left worse off. Thecumulative causation heightening regional inequality is unlikely to abatethrough worker training and education.
4 What does Work?
The conditions that enhance regional inequality are counterbalanced in theprivate sector by forces inherent in that inequality. This counterbalancing ishighly imperfect and may not become manifest for many years, but it is acorrective process that attracts observant entrepreneurs. Simply stated, sus-tained growth in specific geographic areas tends to raise the costs of doingbusiness. California’s Silicon Valley grew rapidly for decades, and by the end ofthe twentieth century, the costs of doing business had soared. Housing wasbrutally expensive, infrastructure was congested, and skilled labor was increas-ingly scarce and aggressively sought. Sustained success at some point tends toturn into its opposite.
Sustained underperformance has altogether different private-sector mani-festations. Property values stagnate and decline; plants and equipment areunderutilized; idle land awaits development and redevelopment; underemploy-ment is often rampant. Economic stagnation itself naturally generates a pool ofresources that is ready and willing to be redeployed.
What is needed are individuals who profitably can redeploy the under-utilized resources of the depressed region. These individuals are entrepre-neurs. Their role is to attract the necessary resources from outside theregion that, when combined with local resources, will render viable businessentities.
The appropriate role of government, broadly, is not to give this entrepreneura tax subsidy. More important is that depressed-area local governments arerelieved of the fiscal straitjacket that too often undermines their ability toprovide modern infrastructure and basic government services. A local govern-ment lacking the fiscal capacity and/or ability to provide modern infrastructure
Alleviating the Lagging Performance 15
and basic services will drive away far more entrepreneurs than an enterprisezone will attract.
Detroit in 1994 was implementing a federally funded empowerment zone tocomplement its existing enterprise-zone incentives to businesses. Simulta-neously, the city’s once impressive system of freeways literally was fallingapart; local streets were in serious disrepair; large parts of the sewer andwater main infrastructure were decades beyond their useful life; and snowremoval frommost of Detroit’s streets ranged from problematic to nonexistent.This list of systemic malfunctions is representative rather than exhaustive.Contemplate building a new firm in an enterprise zone, and tapping into asection of the sewer system that was installed during the Civil War. . .. Theenterprise-zone incentives were not attractive. Detroit, effectively, was operat-ing a disinvestment program and driving away firms and entrepreneurialenergy.
Detroit claimed that it was offering economic revitalization incentives toprivate businesses, but it wasn’t. The net effect of the incentive, infrastructure,and government-services package in Detroit was to enhance underdevelop-ment. The city was operating an economic devitalization program. It worked:Detroit’s economic base was weaker in 2005 and the number of workersemployed by the private sector had fallen, relative to the level of the early1990s. The attraction of underutilized resources effectively had been neutra-lized, in the eyes of private-sector firms, by the economic devitalization pro-gram offered by the public sector.
5 What is to be done?
This is a conceptual paper. Thus far, I have been discussing the positive con-tribution of entrepreneurship to area revitalization in a highly general, abstractmanner. The balance of this paper will move from the abstract to the specific. Iwill narrow my focus to a single manifestation of entrepreneurship: the smallbusiness.
Economic-base industries (those selling products outside their region)commonly have been thought of as goods’ producers—manufacturers ofgoods and bulk commodities as diverse as coal, soybeans, and apples. Asidefrom agricultural producers, goods production industries traditionally havebeen dominated by large firms.
The role of small firms in base and non-base industries can be clarified, ifimperfectly, by grouping a region’s firms into three broad categories. First,the base industries serving multistate, national, and international marketsprovide the raison d’etre for the regional economy—autos in Detroit, dairyproducts in rural Vermont, movies in Los Angeles. A second industry tiercomplements the base industries by providing them with the goods andservices necessary to produce their exports. A third industry tier supplies the
16 T. Bates
local economy with food, housing, medical services, recreational services, and
the like. This group is dominated by small businesses; tier two has a signifi-cant presence of larger-scale small firms, but it is populated predominantly by
large businesses. Tier one is dominated by the large-scale firms that describethe Fortune 500. corporations.
Area revitalization is accomplished most directly by strengthening a region’s
economic base; that is, by strengthening the scope and presence of tier-one andtier-two firms. If these firms prosper, money flows into the region from the
purchases of customers located elsewhere. As the economic-base employers hiremore workers and buy more products from local suppliers, benefits filter down
to tier-three firms. A tempting generalization is that the big firms (tiers one andtwo) lead and the small firms (tier three) follow. The more accurate this general-
ization, however, the weaker the potential contribution of small firms to revi-talize the economy in depressed areas.
Tier-one firms in many regions of the nation with lagging economies sufferfrom rising competition rooted in the rapid globalization of goods production.
Southern textile mills, for example, lose market share, and the regions wherethey predominate face the same problems that have set back the Detroit area—
decline in the base industries ripples through the region in a multiplier fashion.In this context, the development potential of tier-three small businesses prob-
ably will be neutralized by declining local purchasing power. Entrepreneurialinnovation is needed at tiers one and two.
Can an innovative small textile business revitalize the local economic base
in a declining textile-dominated region? That depends. Hopelessness anddespair among local economic development advocates are justified most
when certain conditions prevail; the applicable six conditions broadly defineindustry niches where significant scale economies permit high volume, mass
production of goods that are amenable to being moved cheaply via contain-erized shipping. If the following six questions are answered affirmatively, theodds against the success of the innovative small producer of goods are
overwhelming:
1. Is the market for the product large?2. Is the product standardized?3. Is the demand for the product highly stable?4. Is speed of delivery of only minor importance?5. Is the product’s weight-to-value ratio low? It’s bulk-to-value ratio?6. Do the dominant producers of the product exercise significant monopolistic
power in their dealings with major suppliers?
Global supply chains have come to dominate many product areas where
answers to the questions above are affirmative. Why produce bath towels inNorth Carolina? Produce them instead in a large, modern factory in southern
China, where wage and benefit costs are a fraction of those in NorthCarolina.
Alleviating the Lagging Performance 17
The advice economists traditionally offer to innovative firms seeking bath-
towel competitiveness strikes me as useless. For producers unable to competeon labor costs, that advice has been to:
1. invest in labor-saving equipment;2. reorganize production and training for the purpose of making labor more
productive.
Typically, the response to labor-cost disadvantages has been concertedefforts to step up capital investment and worker productivity. For more thantwo decades, this strategy has been undermined by a steadily growing number
of export-oriented producers in low-wage countries matching ‘‘the levels ofproductivity attained by the most efficient domestic producers’’ (Waldinger,1989, p.72).
The globe is steadily becoming a smaller place for goods production. Sophis-
ticated telecommunications along with jumbo jets and containerized shippingeffectively have shrunk international space. Productivity levels of U.S. workersare being matched or even exceeded in a growing range of producers with low-
cost labor in countries such as China.By identifying the circumstances for pessimism, I have spelled out the con-
verse—the circumstances in which the innovative small firm can competesuccessfully at tier one. Inherent in every advantage of the global low-cost
producer is an important disadvantage. International space has shrunk, butthe producer at the terminus of a 10,000-mile-long global supply chain lacksmuch of the flexibility that carves viable market niches for innovative small
firms.The giant factories inAsiamay enjoy significant scale economies in production,
but those producers are unlikely to be competitive in market niches demandingrapid deliveries of small, unstandardized orders. The weight-to-value ratios of
many products rule out economical shipping by air freight; a very long supplychain, therefore, translates into a very long time lag. Domestically as well asglobally, the flexible, quick-moving small producer has an edge in serving niche
markets, particularly those characterized by unstable demand and typically smallorders. Is the applicable niche market subject to regularly changing consumer
tastes and preferences? Is the product market seasonal in ways that are hard topredict? Does the niche market deal in perishable products, particularly thosewhere freshness and price are directly related? Broadly speaking, an affluent
clientele often prefers the niche product to the standardized, mass-producedalternative. This offers the innovative, flexible, fast-moving small firm entry intotier one. Such a small business can be a major component of the goods-producing
industries that so often dominate a region’s economic base.If all or most of the following six questions are answered affirmatively, the
odds favor the success of innovative small producers of goods:
1. Is the market for the product small?2. Is the product highly differentiated (as opposed to standardized)?
18 T. Bates
3. Is the demand for the product highly variable?4. Is speed of delivery of major importance?5. Is the product’s weight-to-value ratio high? It’s bulk-to-value ratio?6. Are the applicable supplier industries highly competitive?
If the above conditions apply, then the wisdom of Joseph Schumper is highlyapplicable: static efficiency at one point in time conveys little advantage. . .theadvantage instead belongs to the innovators introducing new marketing stra-tegies and products. . . .Cost advantages rooted in low wages and scale econo-mies of production convey little advantage to the export-based manufacturer ina wide range of the markets served by innovative entrepreneurs operatingnimble small businesses.
References
Bates, Timothy, ‘‘Small Business Viability in the UrbanGhetto,’’ Journal of Regional Science.29(4): 625–43/1989.
Bates, Timothy, andWilliam Bradford, Financing Black Economic Development. (New York:Academic Press, 1979).
Buss, Terry, ‘‘The Effect of State Tax Incentives on Economic Growth and Firm LocationDecisions,’’ Economic Development Quarterly. 18(2): 90–105/2001.
Dowell, David, ‘‘An Evaluation of California’s Enterprise Zone Programs,’’ EconomicDevelopment Quarterly. 10(4): 352–68/1996.
Fusfeld, Daniel, and Timothy Bates, Political Economy of the Urban Ghetto. (Carbondale:Southern Illinois University Press, 1984).
Myrdal, Gunner, Economic Theory and Underdeveloped Regions (London: Duckwith, 1957).Orfield, Myron,Metropolitics: A Regional Agenda for Community and Stability (Washington,
D.C.: Brookings Institution Press, 1998).Peters, A., and P. Fisher, State Enterprise Zone Programs: Have they Worked? (Kalamazoo,
MI: Upjohn Institute, 2002).Porter, Michael, The Competitive Advantage of Nations (New York: The Free Press, 1998).Porter, Michael, ‘‘New Strategies for Inner-City Economic Development,’’ Economic
Development Quarterly. 11(2): 11–27/1997.Waldinger, Roger, Through the Eye of the Needle: Immigrants and Enterprise in New York’s
Garment Trades (New York: New York University Press, 1989).
Alleviating the Lagging Performance 19

State of Literature on Small- to Medium-Sized
Enterprises and Entrepreneurship in
Low-Income Communities
Zoltan J. Acs and Kadri Kallas
1 Introduction
The topic of this paper seems rather simple at first glance; however, it is any-thing but simple. The issue, entrepreneurship and low-income (LI) commu-nities, must be put into perspective, and that is not simple. So let us start with asimple question: Does entrepreneurship impact communities in general, and, ifso, how? Over the years, the literature has given three answers to this question—job creation, innovation, and economic growth—each with supporters anddetractors. By studying the opposing issues for three decades, we have learnedthat job creation takes place in firms of all sizes create jobs; in some industries,small firms have the advantage in innovation, and new-firm formation seems tolead to economic growth. While this statement can be debated, it seems to be areasonable summary of my research and its findings over the past three decades.
What about the role of entrepreneurship in LI, or poor communities? Andwhat do we mean by an ‘‘LI’’ community? Do we mean a developing country; apoor, rural community; or a pocket of poverty in a rich country? A poorcountry probably needs capital accumulation, education, foreign investment,and building of a supportive institutional environment for entrepreneurship(Deininger, 2003; Hallberg, 2000; Klein and Hadjimichael, 2003; Smith, 2000).All of this would mean declining rates of self-employment. If by ‘‘LI’’ we meanpockets of poverty in a rich country, then the immediate question is about whothe entrepreneur will be—rich people in poor communities, or the poor—andhow will entrepreneurship would help them? If we are interested in cities, thenwe have a lot of literature upon which to draw.
This paper limits the discussion of the role of entrepreneurship to LI areas indeveloped countries. We define entrepreneurship as new-firm formation; theclassic Schumpeterian connotation of the term with innovativeness is aban-doned in this paper. Hence, the formation of new small- and medium-size
Z. Z. AcsGeorge Mason [email protected]
G. Yago et al. (eds.), Entrepreneurship in Emerging Domestic Markets.� Milken Institute 2008
21
enterprises (SME) is taken to mean entrepreneurship. These definitions are
adopted to embrace the complex relationships among SMEs, job creation,
innovation, and economic growth. An underlying assumption of the paper is
that the foremost objective of LI communities with respect to entrepreneurship
is job creation. Innovation and economic growth should be regarded as sec-
ondary goals.The literature from the past decade suggests that when poor people start
businesses without the requisite skills, education, financial capital, and social
contacts, they usually fail. The causes of poverty in these communities go much
deeper than what entrepreneurship might fix. Of course, many programs have
tried to help the poor, and we will review some of these. This paper will develop
a framework to help guide our thinking and organize the literature on the
subject.The next section develops a simple two-by-two matrix to guide our thinking
by focusing on a supply-and-demand model of the economy for rich and poor
communities. The model helps us understand what role supply of inputs and
demand for products play in a community that is above average and one that is
below: if rich communities have functioning markets, perhaps poor commu-
nities do not. The third section examines what is necessary to create functioning
markets where none exist. The forth section asks questions about who becomes
an entrepreneur: why do some people work for wages and others try self-
employment? The fifth section begins with a short case study about the regional
development efforts in Appalachia and presents the results of empirical
research about the role and impact of SMEs in LI communities—the evidence
on entrepreneurship and poor communities turns out to be mixed. Next, social
entrepreneurship and its role in community building are examined. We suggest
that social entrepreneurship, with its emphasis on utility maximizing, as
opposed to profit maximizing, might play an important role in building com-
munities where government has failed. The penultimate section reviews the
literature on the impact of entrepreneurship policies on poor communities.
The final section is a summary.
2 Basic Regional Economic Development Theories
Classic regional development theories have approached the topic from the
supply side and the demand side, both reflected in the economic-base theory
of regional development (Hoover, 1975; Nelson, 1993). This theory embraces
regional export activity as the primary source of regional economic develop-
ment (Krikelas, 1992). A region will grow when income from its export goods
contributes to the local economy; the consequent increase in local incomes gives
rise to non-basic economic activities. Growth results from forward and back-
ward linkages, described in the supply- and demand-side models, respectively.
22 Z. J. Acs, K. Kallas

The supply-side theory of regional development views a region with a com-petitive pool of inputs that attract new investment: an educated work force,financial capital, technological base, land, and natural resources. Each region’smixture of inputs determines the nature of its base-economic activities. Thesupply-driven model describes regional growth as an outcome of a primarysupply of ‘‘labor, capital, imported inputs, and government services’’ (Hoover,1975, p.231). The ‘‘supplymultiplier’’ effect occurs as an increase in output froma successful activity stimulates increases in other, supporting economic activ-ities through forward linkages. Measures for increasing the availability andimproving the quality of inputs include educating and training the labor force,creating university-industry linkages and removing the ‘‘barriers to occupa-tional mobility and technical change’’ (Hoover, 1975, p.242).
Demand theories explain regional development through a process where theexternal demand for a region’s product gives rise to the demand for otherproducts in the region (either inputs to the central product or nonbase productsand services). The process is called ‘‘backward linkage’’ to denote how regionaldevelopment starts with defining ‘‘where the demand comes from’’ and con-tinues with tracing ‘‘its impact through the regional economic system’’ (Hoover,1975, p.218). In the demand-driven model, the supply of inputs is taken asgiven: Perfectly elastic supply follows demand (Hoover, 1975).
Hoover (1975) emphasizes that the demand- and supply-driven models arenot conflicting but complementary theories. They both build on the under-standing that economic-base activities lead to and determine a region’s overalldevelopment; that ‘‘nonbasic’’ activities are ‘‘simply consequences’’ of theregion’s economic growth. A region cannot grow from within or by ‘‘takingon in its own washing’’ (Hoover, 1975, p.219). What differentiates the supply-and demand-driven model is the understanding of where the impetus to growthcomes from—the supply of quality production inputs in a region, or thedemand for its economic base products?
A critique of this theory is that if the unit of analysis (the region) is taken tobe a large, self-sufficient region that has internal trade flows, then the internaltrade and demand can generate growth (Tiebout, 1956).
Both the supply-side and demand-side theories assume that regions arecharacterized by strong social capital (Porter, 1998; Rubin, 1994), and a reg-ulatory system that guarantees smooth functioning of markets (Deininger,2003; Klein and Hadjimichael, 2003). These theories do not explain how poorand uneducated regions start to develop in the first place; they assume thepresence of some competitive competencies or resources, or a persistent demandfor the region’s economic base product.
Could entrepreneurship explain how poor communities develop (comple-menting the supply-side theories)? (See here Hirschman, 1958). Start with theassumption that entrepreneurship is always desirable in poor communities,even if entrepreneurs need continuing public support and , and most small-and medium-sized enterprises never grow big and pay lower wages than largeplants. Table 1 represents supply- and demand-side approaches to development
State of Literature on Small- to Medium-Sized Enterprises 23
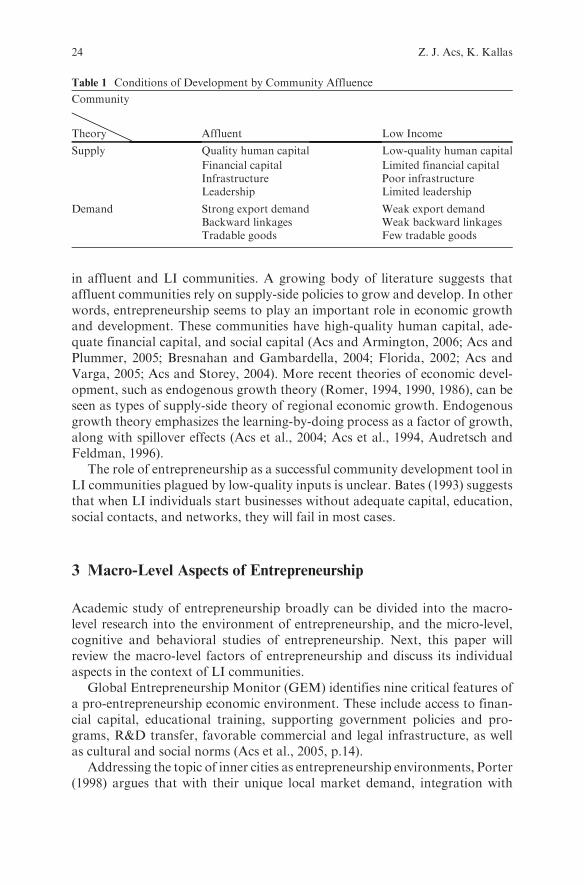
in affluent and LI communities. A growing body of literature suggests thataffluent communities rely on supply-side policies to grow and develop. In otherwords, entrepreneurship seems to play an important role in economic growthand development. These communities have high-quality human capital, ade-quate financial capital, and social capital (Acs and Armington, 2006; Acs andPlummer, 2005; Bresnahan and Gambardella, 2004; Florida, 2002; Acs andVarga, 2005; Acs and Storey, 2004). More recent theories of economic devel-opment, such as endogenous growth theory (Romer, 1994, 1990, 1986), can beseen as types of supply-side theory of regional economic growth. Endogenousgrowth theory emphasizes the learning-by-doing process as a factor of growth,along with spillover effects (Acs et al., 2004; Acs et al., 1994, Audretsch andFeldman, 1996).
The role of entrepreneurship as a successful community development tool inLI communities plagued by low-quality inputs is unclear. Bates (1993) suggeststhat when LI individuals start businesses without adequate capital, education,social contacts, and networks, they will fail in most cases.
3 Macro-Level Aspects of Entrepreneurship
Academic study of entrepreneurship broadly can be divided into the macro-level research into the environment of entrepreneurship, and the micro-level,cognitive and behavioral studies of entrepreneurship. Next, this paper willreview the macro-level factors of entrepreneurship and discuss its individualaspects in the context of LI communities.
Global Entrepreneurship Monitor (GEM) identifies nine critical features ofa pro-entrepreneurship economic environment. These include access to finan-cial capital, educational training, supporting government policies and pro-grams, R&D transfer, favorable commercial and legal infrastructure, as wellas cultural and social norms (Acs et al., 2005, p.14).
Addressing the topic of inner cities as entrepreneurship environments, Porter(1998) argues that with their unique local market demand, integration with
Table 1 Conditions of Development by Community Affluence
Community
Theory Affluent Low Income
Supply Quality human capital
Financial capitalInfrastructureLeadership
Low-quality human capital
Limited financial capitalPoor infrastructureLimited leadership
Demand Strong export demandBackward linkagesTradable goods
Weak export demandWeak backward linkagesFew tradable goods
24 Z. J. Acs, K. Kallas
regional clusters, and human resources (there are myths about the inner-citylabor force), they offer good opportunities for inner-city-based entrepreneurs.He states, however, that efforts at fostering inner-city development have ‘‘tried todefy the laws of the marketplace’’ (1998, p.10). The competitiveness of locationsis largely a function of the local business environment, which, in turn, influencesthe productivity of inputs. Access to labor, capital, and natural resources nolonger determine prosperity because they are more widely available.
As to the role of government subsidies and support, Porter’s position is thatthe focus and qualifying criteria for current programs erodes their effectiveness.Businesses should be supported on the basis of economic need rather than onthe basis of the race, ethnicity, or gender of their owners. The qualifying criteriashould be location and number of employees. The private sector has the leadingrole in revitalizing inner cities. The focus should be on ‘‘creating economicallyviable businesses,’’ rather than on subsidies and special-preference programs(p.396). This can be accomplished by establishing business relationships withinner-city companies, redirecting corporate philanthropy from social services tobusiness-to-business efforts, such as training programs and management assis-tance, and adopting the right model for equity capital investment. Abolishingself-inflicted regulatory costs also can increase the economic value of the innercity as a business location.
Hallberg (2000) agrees that SME competitiveness and growth are functionsof the overall business environment, and argues that a good business environ-ment is necessary for the success of targeted assistance programs. The primaryrole of government is to ‘‘provide an enabling business environment that opensaccess to markets and reduces policy-induced biases against small firms’’ (p.8).SME development strategy is, Hallberg says, a ‘‘private-sector developmentstrategy’’ (p.8). The rationale for intervention in the SME sector is to addressmarket and institutional failures that bias the size distribution of firms, not theexistence of inherent economic benefits provided by small firms. By promotingproduct innovation and delivery mechanisms, and by building institutionalcapacity, governments can hasten the development of markets that SMEs canaccess for services.
Even though Porter (1998) supports creating a favorable market environ-ment first (through enabling regulation), there also shines through the impor-tance of the ‘‘correct attitude’’ of the community. Porter sees the role ofcommunity-based organizations (CBOs) in working to change the work forceand community attitudes, and to create work-readiness and job-referral sys-tems. But he also states that in trying to develop a community economically,one should not rely on local human resources if these are inferior to the‘‘incomers.’’
Rubin (1994) notes that CBOs are moving away from advocacy to focusingon providing physical assets, such as housing. Porter would argue that this is theright strategy—profit-oriented businesses are more efficient in using publicsubsidies. Some supporters of community-based development fear that thisshift in philosophy will derail the whole community-based development
State of Literature on Small- to Medium-Sized Enterprises 25
endeavor from its initial mission, which is community regeneration, empower-ment, and participation. CBOs counter that ‘‘Enabling individuals to growthrough property ownership, skill development or continued education, andencouraging them to participate in decisions to physically and socially repairthe community, increases the assets of both individuals and the neighborhood,’’Rubin writes, and, ‘‘as communities become more economically viable, they arebetter places to live, and communities that are better places to live become moreeconomically viable’’ (p.410). CBOs not only should make efforts to have thehouses built, but also remember that the entire process flows from and benefitsthe community.
Cluster formation, which generally is associated with social capital, is an‘‘essential ingredient of economic development’’ as well (Porter, 1998, p.8).Clusters are defined as ‘‘geographical concentrations of interconnected compa-nies and institutions in a particular field’’ (Porter, 1998a, p.2). Firms within anindustry prefer to locate close to their competitors and related industries inorder to benefit from the presence of a pool of skilled work force, suppliers,industry information, and to expose oneself to innovative pressure. Klein andHadjimichael (2003), referring to Audretsch (2002) and Glaeser (1998), statethat: ‘‘Functioning cities . . . are the best of all incubators or clusters, as they helpfirms, particularly small- and medium-sized ones, establish themselves, grow,and create employment’’ (p.80).
4 Individual-Level Aspects of Entrepreneurship
4.1 Characteristics of an Entrepreneur
To evaluate the role entrepreneurshipmight play in community revitalization, itis critical to understand that, ‘‘The entrepreneurial process is a long-term,human-centered practice of innovation that transcends industrial, sectoral,race, sex, and class lines’’ (Friedman, 1986, p.35). According to psychologists,on an individual level, entrepreneurs exhibit the need to achieve, an internallocus of control, propensity for risk-taking, tolerance of ambiguity, and a type-A behavior (Gladwin et al., 1989, p.1,306). Each segment of the populationincludes some proportion of people temperamentally disposed to be entrepre-neurs. But the extent to which they become entrepreneurs depends upon theenvironmental support—cultural, financial, and educational (Friedman, 1986).
Bates (1993) echoes Friedman’s observations, noting, ‘‘The personal traitsassociated most strongly with entry into self-employment are wealth holdings,education, and age (a proxy for years of work experience)’’ (p.255). The neces-sary traits serve as complements, not substitutes, for one another. Startupcapital cannot overcome deficiencies in entrepreneurial skills and education,and loans to less-skilled individuals often are not repaid. Business survival isdetermined by many of the same characteristics that influence the success of
26 Z. J. Acs, K. Kallas
individual entrepreneurs. New managers of businesses with uncertain abilitieslearn as time goes by. If they revise their abilities upward, they probably willsurvive; if not, they probably will not. Newer firms with lower sales volumes aremore likely to fail, while efficient–and more experienced–firms grow and sur-vive (Jovanovic, 1982). Financial capital and educational attainment are corre-lated most strongly with business survival–similar to the entry into self-employment.
4.2 What Motivates Startups?
While studying microenterprises in LI communities, Sherrard Sherrarden et al.(2004), contend that human capital theory variables such as skills, knowledge,education, experience, motivation, and creativity fail to explain the determi-nants of becoming an entrepreneur. Entrepreneurship is a function of need,opportunity, and environmental conduciveness, and, more often than not, istriggered by negative occurrences that may include the loss of a job or spouse(Friedman, 1986). Some individuals find discrimination in the labor market tobe motivating. For others, the decision to start a business is the result of morepositive rationale, which includes a sense of self-fulfillment and personalgrowth, autonomy, flexibility, and community service (Sherrarden et al.,2004). There are also people who start new firms to ‘‘appropriate the expectedvalue of their new ideas, or potential innovations, particularly under the entre-preneurial regime’’ (Audretsch, 2002, p.26).
Innovative output is affected by city scale, as spillovers are assumed to occurwith greater frequency in regions where the direct knowledge-generating inputsare greatest (Audretsch, 2002). Following the theory of knowledge spillovers,derived from the knowledge-production function, the greatest clustering ofinnovating activity will occur in industries where tacit knowledge is important.Within the literature, the consensus view is that knowledge spillovers, within agiven location, fuel technological advance, but there is little consensus as to themanner in which this occurs.
4.3 Obstacles to Starting a Firm
Entrepreneurs generally are faced with myriad obstacles as they create a newbusiness. The barriers to entry originate from a number of sources includingindividual characteristics, government policies, financing, and location. Poten-tial entrepreneurs are people with the human and financial resources necessaryto overcome the barriers to entry and those who are prone to respond toopportunities.
The lack of language for immigrants and the technical skills for the generalpopulation that prevent entry into white-collar employment—which may be
State of Literature on Small- to Medium-Sized Enterprises 27
preferable to self-employment—are also are obstacles to starting a small busi-ness (Bates, 1993). Other encumbrances to business formation come as a resultof tax policies and regulation, subsidy programs, and regulatory burdens (Kleinand Hadjimichael, 2003; OECD, 1997). Entry requires adequate access tocapital, financing, infrastructure, markets, technology, and skilled work force(Friedman, 1986; Klein and Hadjimichael, 2003; OECD, 1997). The success ofstartups also is determined by surrounding business and physical environments.The rate at which new businesses are formed is greatly influential in determiningthe viability of further small business development in a particular area (Bates,1993). Venture capital, while essential for financing startups, typically is noteffective if it targets LI communities undergoing industrial restructuring (Fried-man, 1986). Furthermore, areas in which corruption, crime, and theft arecommonplace tend to be poor climates for the successful creation of businesses(Klein and Hadjimichael, 2003).
Relative to urban areas, rural communities have a smaller customer base andmay be less welcoming of outsiders (Gladwin et al., 1989). In addition to lowsales potential, these rural communities also may be constrained by perceivedlow returns, a lack of knowledge and previous management experience, and alack of capital and credit as well as of social acceptability and contacts.
Barriers to exit, including rigid labor market regulations, hard budget con-straints, and stigma associated with business failure, may also be problematicfor entrepreneurship (Klein and Hadjimichael, 2003).
5 Empirical Research on the Role of SMEs in LI Communities
5.1 Trends in Entrepreneurship and Poverty:The Case of Appalachia
Appalachia, a 200,000-square-mile region stretching from New York to Missis-sippi along the Appalachian mountain range, encompasses the entirety of WestVirginia and parts of 12 other states (Appalachian Regional Commission, 2007).The terms ‘‘Appalachia’’ and ‘‘coal’’ used to be synonymous because the region’ssubstantial reliance on heavy industry and natural resource extraction. In the1960s, many of the poorest counties in the country were located in Appalachia;incomes averaged only 73% of the rest of the nation (Widner, 1990, p.299).President Kennedy, having encountered the striking poverty of the region duringhis election campaign, initiated the Appalachian Regional Commission (ARC)in 1961. The Appalachian Regional Development Act was signed into law in1965, and became the first federal government program exclusively devoted tothe development of a lagging region (Higgins and Savoie, 1995, p.205).
Causes of the poor economic performance of the region included the so-called ‘‘boom-and-bust economies of coal mining,’’ the decline of farmingemployment, heavy concentration of mature industries, massive outmigration
28 Z. J. Acs, K. Kallas
of young and educated population, and the region’s extreme isolation due totopographical characteristics. From 1965 to 1992, about two-thirds of federalappropriations for ARC went for highways to address the region’s isolation.The majority of supplemental federal funds and state and local funds, however,were used for other infrastructure development, such as water supply, sewers,industrial sites, and airports (Higgins and Savoie, 1995, p.213).
Although smaller in absolute amounts, significant funds were used toimprove the quality of education, health services, and housing conditions.Only after 1971, when the ARC was reauthorized, did the emphasis shift‘‘from construction of physical infrastructure to its operation, and from voca-tional training to formal education at all three levels’’ (Higgins and Savoie,1995, p.219). Developments in entrepreneurship in recent decades will bereviewed subsequently in this past context of regional development measures.
In general, certain portions of Appalachia have prospered, while manycontinue to underperform. In 1990, poverty rates were highest in central Appa-lachia, followed by southern and northern segments. Among counties that weremore distressed in 1990, poverty rates have declined more than for those closerto the U.S. average in their level of development; the level of economic devel-opment is equalizing within the region. At the county level, particularly indistressed and mining areas, a substitution in labor force participation betweenmen and women has been significant (Black and Sanders, 2004).
In the ten years between 1990 and 2000, the economy has grown much fasterwhile income inequality appears to have grownmore slowly in Appalachia thanfor the nation. But median family income and labor force participation inAppalachia remains lower than the U.S. averages, while poverty rates arehigher. Between 1990 and 2000, the unemployment rate of men in Appalachiaon the whole decreased more than for the United States. The decrease wasparticularly noticeable among white men in Appalachia relative to white men inthe United States (Black and Sanders, 2004).
Despite some of the trying economic conditions in the Appalachian region,businesses are created, residents are employed, and wages are generated. Whilethese activities typically occur on a smaller scale than at the national level, amore focused approach best illustrates the nature of business development inAppalachia. It is true that establishment birth rates are lower in Appalachiathan in the United States as a whole, but at the same time, establishment deathrates are lower. Between 1982 and 1997, increases in manufacturing establish-ments were 10% greater in Appalachia than in the Unites States overall. In aknowledge-based economy, this may not necessarily be an improvement(Foster, 2003).
It is no surprise that job creation rates are 1.2% points lower in Appalachiathan the rest of the United States. More interesting is that Appalachian jobdestruction rates are 3.4% points lower than overall U.S. job destruction rates.While these figures may invite the belief that Appalachia is performing quitewell, it is important to note that, in general, new businesses in the region arerelatively less productive and offer lower wages. The average Appalachian
State of Literature on Small- to Medium-Sized Enterprises 29

worker makes 10% less than his or her average American counterpart (Foster,2003). But lower living costs of the region may not directly translate into a 10%lower standard of living.
To this point, we have scrutinized the whole of Appalachia against the entirecountry. By examining more targeted indicators, two things become apparent.First, the Appalachian region is heterogeneous. Given its size and varyingcultural makeup, an in-depth look into variations among its three subre-gions—northern, central, and southern Appalachia—is necessary. Second, incertain aspects, such as southern subregion job creation, the Appalachianregion is comparable to the whole United States, but it still lags behind therest of the United States as a whole (Foster, 2003; Jensen, 1998).
In 1982, all three subregions were dominated bymanufacturing, but by 1997,the central and northern subregions were dominated by the service sector.Despite the shift in industry dominance, the southern subregion continues tofare best. Establishment size is relatively consistent across areas, although it islargest in the southern subregion. The southern subregion enjoyed the highestestablishment birth rate, followed by the central and northern subregions.Employee wages in the central subregion are about 20% below the rest of theUnited States, while the gap for those in the northern and southern areas is onlyabout 10%. In summary, the southern subregion appears to be in the best healthof all the Appalachian subregions, at least in terms of the measures discussed(Foster, 2003).
Regional technology industries lag considerably in most measures applied inBrandow Company, Inc. (2001) in terms of the vitality of retained firms. Thelargest firms in technology sectors are likely to be lagging in competitiveness, assuggested by their lower-than-average sales-per employee rates (BrandowCom-pany, Inc., 2001). On amore positive note, startups in the region during a recentfive-year period tended to survive at a slightly higher rate than the U.S. averageand tended to add jobs at a favorable pace. A tendency among startups to growjobs without being able to sustain them, however, is likely, given that job lossfrom failed startups was greater than that observed in the nation, and that thesales vitality of remaining firms was low. These insufficiencies underscore theregion’s poor entrepreneurial performance.
Overall, while Appalachia has done well in retaining existing firms, most ofthese are in non-value-added retail and service sectors. Further, the regions stillsuffers from low levels of entrepreneurship and low growth among firms, andalso continues to be heavily reliant on branch facilities (Brandow Company,Inc., 2001). In summary, there are lessons to learn from Appalachia. Businessretention does not necessarily translate into robust growth and vitality. Broad-ranging retention outreach programs detract from potentially more beneficialactivities. Those include specific assessments of the needs of and service deliveryto core local industry clusters, high-vitality industries, and high-growth firmsthat potentially improve the area where they are located (Brandow Company,Inc., 2001). The lag in entrepreneurial activity in Appalachia is clearly theweakest link (p.30). Consequently, as Jensen (1998) notes, there is a need for
30 Z. J. Acs, K. Kallas
‘‘continuous public and private investment in job training, reemployment, andemployment services.’’ The study by Brandow Company, Inc. (2001) reachessimilar conclusions, stating that ‘‘Appalachian technology’’ is not an oxy-moron. Rather, targeted assistance is necessary for the region to catch up.Branch facilities create entrepreneurial opportunities that should be exploited,and potential synergies with startups should be explored.
5.2 How Effective have SMEs Been in Creating Jobs, GeneratingEconomic Growth, and Initiating Innovation?
Entrepreneurs perform a very specific role in help enhance economic develop-ment. Their role is to recognize an opportunity and to use resources yielding alow return and shift them into a function yielding a higher return from whichthey personally gain (Casson, 1982; Acs and Storey, 2004). Entrepreneurs seekout these opportunities for personal gain and, in so doing, ensure that resourcesconstantly are being reallocated in a manner that improves efficiency. In otherwords, productivity is enhanced by allocating the production factors of labor,capital, and knowledge more effectively throughout the economy (Acs andStorey, 2004). In the absence of entrepreneurs, resources fuel functions whosereturns are low, leading to an ossified economy in which resources are under-utilized. Further, as Acs and Storey state: ‘‘The clearest example of an entre-preneurial act which can lead to resource transfer is the creation of a new firmthat offers a product or service that was not previously available. The new firmfounder assembles resources to provide the product/service and offers this tocustomers. Where this is an entirely new product it may not explicitly displacean existing product or service’’ (p.873).
Entrepreneurs, however, do not always have perfect knowledge. They mayobserve what they believe to be an opportunity, but either because of unreason-able optimism and/or poor judgment, their idea proves nonviable in the short,medium, or long term. They may have displaced an existing business but thenfailed to satisfy its customers. In this case, the entrepreneurship is referred to as‘‘destructive,’’ but even it might have benefits. For example, other entrepreneursmay observe the actions of this unsuccessful entrepreneur. Somemay take it as asignal to avoid such activities, providing valuable discouragement to othersconsidering replicating the venture. Others, however, may observe aspects ofthe failed venture and conclude they can make changes to improve the chancesof this venture where others have failed. Finally, the entrepreneur who startedthe business may learn from this experience in a subsequent business (Acs andStorey, 2004).
While the enhancements entrepreneurship may offer an area are potentiallyconsiderable, the fact remains that entrepreneurial activity varies greatly acrossand within countries; whether clustering occurs because of intrinsic advantagesor historical accidents (OECD, 1997) is a subject of disagreement. In the Untied
State of Literature on Small- to Medium-Sized Enterprises 31

States, two of the most well-known clusters have occurred in ‘‘Third Italy’’ andthe Silicon Valley (OECD, 1997). In South Korea, SMEs have played asignificant role in major transformations within the economy, especially withregard to exports, foreign investment, and productivity performance(Nugent and Yhee, 2002). Although particular regions in the United Statesand South Korea have benefited greatly from increased levels of entrepreneur-ship, it is important to note that others have not experienced comparableprogress. What are the factors that might lead to higher entrepreneurship?
A key variable in the firm formation rate is the educational attainment of thelabor force (Acs et al., 2005). Although the knowledge denoted by a collegedegree seldom suffices as the basis for a successful new business, the analyticalmethods learned in college serve individuals well to keep learning and to beopen to new ideas.
Glaeser and others (1995) find that for a cross section of cities, a keyeconomic determinant of growth is the level of schooling, as had beenfound for countries. This suggests that higher education influences latergrowth, not through increased savings, but by promoting higher rates oftechnological growth through spillovers. More specifically, Acs and Arming-ton (2004a) find a positive impact of higher proportions of adults with collegedegrees on rates of new firm formation. But this positive effect of educationalattainment was limited to the share of adults with college degrees. Althoughthe high school graduate share is correlated strongly with formation rate, afterallowing for the effect of differences in local share of college graduates, theadditional impact of higher shares of high school graduates is negative. Inother words, higher shares of high school dropouts were associated withhigher rates of new firm formation, assuming similar shares of college gradua-tion. This effect may be explained partly by the function of high schooldropouts in supplying cheap labor to both old and new businesses. The highschool dropout rate also may be interacting in a complex way with unemploy-ment, with which it is correlated fairly strongly—regions with higher shares ofhigh school dropouts tend to have higher unemployment rates. While theunemployment rate generally did not show a significant relationship to firmformation rates in our model, if we drop either of the educational attainmentmeasures from the model, the local unemployment rate becomes significantlypositive. This suggests that a substantial portion of new businesses is formedout of necessity, when workers are not able to find attractive alternatives inpositions as employees.
Since the mid-1980s, the role of education and human capital externalitieshas been recognized as a key variable in theories of economic growth. Lucas(1988) emphasizes that the economies of metropolitan areas are a naturalcontext in which to understand the mechanics of economic growth; animportant factor contributing to this growth is the catalytic role of humancapital externalities within the cities. While the benefits of human capital toindividuals have been studied extensively, economists are realizing that indi-viduals do not capture all of the benefits from their own human capital. Some
32 Z. J. Acs, K. Kallas
benefits spill over to their colleagues and observers through discussion,example, publications, and even more positive attitudes toward change,risk, and new knowledge (Acs and Armington, 2004b). Acs and Armington(2004a) empirically investigate how new firm formation rates for varioussubsectors of service industries are influenced by human capital differencesin 394 labor market areas, while controlling for other regional characteristicsthat also are likely to affect firm formation rates. They conclude that theextent of human capital in a region has a significant effect on the new servicefirm formation rate.
The service firm formation rate is even more sensitive to the concentration ofsimilar businesses (establishments-per-thousand people) within a local area.The greater the concentration, the more probable are relevant knowledge spil-lovers, and the more likely the resulting new ideas will lead to new firm forma-tions (Acs and Armington, 2004a). New knowledge in the form of products,processes, and organizations leads to opportunities that can be exploited com-mercially. Converting new ideas into economic growth, however, requires turn-ing new knowledge into economic knowledge that constitutes a commercialopportunity. Acs and Plummer (2005) develop a model that introduces a‘‘knowledge filter’’ between new knowledge and economic knowledge. It iden-tifies both new ventures and incumbent firms as mechanisms that reduce theknowledge filter and increase regional growth. They test the hypothesis thatnew venture creation is a better mechanism than the absorptive capacity ofincumbent firms for converting new knowledge into economic knowledge. Theresults support the contention that new venture creation is a superior method ofpenetrating the regional knowledge filter than incumbent firms. Simon andNardinelli (2002) come to similar a conclusion based on historical evidencethat cities in the United States and the United Kingdom with more knowledge-able people grow faster in the long run because knowledge spillovers are limitedgeographically to the city, and knowledge is more productive in the city withinwhich it is acquired.
A growing body of literature suggests that variations across countries inentrepreneurial activity and the spatial structure of economies could be thesource of different efficiencies in knowledge spillovers and, ultimately, in eco-nomic growth. The empirical model used by Acs and Varga (2005) attempts toexamine this by endogenizing both entrepreneurial activity and agglomerationeffects on knowledge spillover within a Romerian framework. The model istested using the Global Entrepreneurship Monitoring cross-national data tomeasure the level of entrepreneurship in each particular economy. After con-trolling for the stock of knowledge and research and development (R&D)expenditures, the authors find that both entrepreneurial activity and agglom-eration have a positive and statistically significant effect on technologicalchange in the European Union.
To explain how growth occurs, the transmission mechanism from humancapital to growthmust be examined. Acs andArmington (2004b) find that if thenew firm formation rate increases by one standard deviation, from 3.5 per
State of Literature on Small- to Medium-Sized Enterprises 33
thousand (labor force) to 4.5 per thousand, the employment growth will
increase by one-half standard deviation, from 2.1% to 2.85%. This holds for
all years examined and for all sectors of economy except manufacturing, where
new plants are more important than new firms.Additionally, Acs and Armington find that if the high school graduation
rate increased by one standard deviation, from 72% to 80%, economic
growth would increase from 2.1% to 2.85%. The evidence also suggests that
raising the overall level of education (high school graduation) has a greater
impact on economic growth than raising the level of the best educated. The
results indicate that if the business specialization rate increased by one stan-
dard deviation, from 2.2 establishments per thousand in the population to 2.6
establishments per thousand in the population, the employment growth rate
would decline by 0.75%. Finally, Acs and Armington note that more crowd-
ing and density also is associated with less, not more, growth.Public officials have some power to influence business location and reloca-
tion decisions. Infrastructure, education, tax, and expenditure policies can
play a role, albeit to varying degrees (Fox and Murray, 1990). The empirical
study by Fox and Murray shows that large firms tend to be less sensitive to
certain policy factors than smaller firms. Corporations looking to establish or
relocate branch facilities place greater value on profitability, while local
startups, which are typically smaller, emphasize amenities. Overall, the most
influential policy-amenable factors appear to be the presence of an interstate
highway, railroad infrastructure, and the educational attainment level of an
area’s work force.The importance of distinguishing between types of entrepreneurship
becomes apparent in studying the shift in the industrial makeup of cities.
The service sector now dominates where manufacturing once did. While all
cities have a core service industry, the largest cities have a disproportionate
concentration of financial and advanced corporate services, whereas smaller
cities have a greater concentration of manufacturing (Sassen, 1990). Sassen
finds a clear association between the size of the region and its functional
specialization. Twelve of sixteen large metropolitan statistical areas (more
than 2 million people), or MSAs, had a high concentration of both produc-
tion and exported producer and distribution services related to banking,
insurance, real estate, business, and the law. The concentration of manufac-
turing industries was highest among smaller MSAs (fewer than 1 million
people). In short, advanced services have concentrated massively into large
cities, and the emergence of the producer service sector does not necessarily
‘‘lift the boat’’ of the poor in these cities (Sassen, 1990). Rural retail and
service businesses have been found to contribute only modestly to local
employment, income, and the tax base (Gladwin et al., 1989). Gladwin et al.
suggest that to achieve economic growth in rural areas, efforts should be
targeted to industries and manufacturers that produce goods and services
for export.
34 Z. J. Acs, K. Kallas

Microenterprise has not proved itself to be a particularly successful weaponagainst poverty, either. In a detailed study of microentrepreneurs by Sherrardand Sherrarden, the majority who were LI before startup remained LI(Sherrard Sherrarden et al., 2004). While microenterprise has not been shownto increase incomes, it does provide other enrichment. In the manufacturingsector, no association between the increase of incomes in the lowest incomequintile and SMEs was observed, nor was a link made between the importanceof SMEs and the ‘‘depth and breath of poverty’’ (Beck and Demirguc-Kunt,2004). In studying the role of small businesses in job creation in the UnitedStates, Haltiwanger and Krizan (1999) conclude that even though young firmshave higher average net employment growth rates, the growth is much morevolatile relative to mature establishments. Hence, the age rather than size of afirm appears to be critical for employment growth.
Hallberg (2000) finds the empirical evidence for a causal link betweenSMEs and poverty alleviation to be very mixed. SMEs offer less job security,lower wages, fewer fringe benefits, worse working conditions, and less skill-enhancement opportunities than large firms. Research focused on examiningprivate enterprise training patterns and effects in Colombia, Indonesia,Malaysia, Taiwan, and Mexico found that manufacturing and small andmicrofirms tended not to offer formal, structured training or informal on-the-job training (Batra and Tan, 1995). This is of great concern, as firm-levelproductivity was found to be affected positively by the formal training ofskilled workers. The training of unskilled workers, however, appeared to haveno effect on productivity. Nevertheless, Hallberg (2000) ends with anencouraging note saying that, ‘‘Encouraging their [SMEs’] emergence in LIcountries is warranted because of their share of employment–‘being there’ is asufficient justification’’ (p.2).
6 Social Entrepreneurship
One conclusion of this survey is that entrepreneurship may not be a cure forpoverty in poor communities. The reason is that the community does not havethe requisite human capital, networks, social capital, finance, or otherrequired supply inputs necessary for successful entrepreneurship. A conclu-sion articulated as early as the 1950s must be repeated: human capital build-ing must precede entrepreneurship because, ‘‘The ultimate repositories oftechnological knowledge in any society are the men comprising it’’ (V. Graf,1957). Poor communities generally do not have the government funding forthe inputs of entrepreneurship and, therefore, it would seem as though entre-preneurship does not and will not play an important role. When governmentfails to provide the requisite educational, community, and social inputs neces-sary for successful entrepreneurship, we find that social entrepreneurship mayplay an important role in these communities.
State of Literature on Small- to Medium-Sized Enterprises 35

6.1 Defining Social Entrepreneurship
‘‘Social entrepreneurship’’ has several definitions. According to Johnson
(2000), what they have in common is a ‘‘problem-solving nature,’’ alongwith the ‘‘corresponding emphasis on developing and implementing initiativesthat produce measurable results in the form of changed social outcomes and/or impacts’’ (p.5). Referring to Thompson et al. (2000), Johnson says that theskills of social entrepreneurs are ‘‘fairly replicable’’ if ‘‘social entrepreneurshipis defined as ‘principally bringing businesses and management skills to thenonprofit sector’ ’’ (p.11). But ‘‘If a social entrepreneur is defined as an‘exceptionally creative and innovative individual,’ replication will be muchmore difficult to achieve, and the focus, then, should be on creating condi-tions in which latent entrepreneurial talent can be harnessed for social
purposes.’’(p.11).Cannon (2000) identifies social entrepreneurship as: (1) individuals who have
a lot of money elsewhere and now want to ‘‘give back’’ to further social goals;(2) ‘‘recovering social workers’’ looking for more effective approaches thanoffered by the system from which they came; and (3) a new breed of businessschool graduate with a social enterprise in mind. Combining attributes thatvarious authors (Say, Schumpeter, Drucker, Stevenson) have associated withentrepreneurship, Dees (2001) gives a clearly idealistic definition of a socialentrepreneur. He states that social entrepreneurs are the agents of change while:‘‘(1) adopting a mission to create and sustain social value (not just privatevalue); (2) recognizing and relentlessly pursuing new opportunities to serve
that mission; (3) engaging in a process of continuous innovation, adaptation,and learning; and (4) acting boldly without being limited by resources currentlyin hand; and (5) exhibiting heightened accountability to the constituenciesserved and for the outcomes created’’ (p.4).
Put simply, social entrepreneurship is when an individual who has therequisite skills to pursue for-profit entrepreneurship chooses to maximize hisor her utility instead of profits.
Whatever the definition of ‘‘social entrepreneurship,’’ the impacts of activ-ities that fit within its range are becoming more noticeable. In a time when thegap between the affluent and the poor is widening, social entrepreneurship isemerging as an innovative approach for dealing with complex social needs. Ithas surfaced in the background of the move away from the ‘‘social welfare stateapproach’’ toward the market-based distribution of wealth (Johnson, 2000,p.2). Traditionally, the nonprofit sector has been the provider of publicly or
charity-funded social services. The number of nonprofit organizations hasincreased, but the flow of finances to them has decreased (Johnson, 2000,p.3). Nonprofit organizations increasingly have had to align themselves towardmarket-like principles of action. New donors from diverse backgrounds arerethinking the principles of giving, and stress real outcomes in place of donorsatisfaction (Johnson, 2000).
36 Z. J. Acs, K. Kallas
6.2 How do Social Entrepreneurs Operate?
Entrepreneurs are drawn in by attractive opportunities. Gucly et al. (2002)
state, ‘‘For social entrepreneurs, an ‘attractive’ opportunity is one that hassufficient potential for positive social impact to justify the investment of time,energy, and money required to pursue it seriously.’’
In determining whether a promising idea is worthy of their investment, socialentrepreneurs must be able to articulate a compelling social impact theory and aplausible business model (Gucly et al., 2002). Designing an effective operatingmodel and crafting a viable resources strategy are central to framing a plausiblebusiness model. They hinge upon credible assumptions about the intendedoperating environment. ‘‘Finally, the requirements of the venture must fit thecommitment, qualifications, and life stage of the entrepreneur considering it,’’say Gucly et al. (p.14). ‘‘When all these elements are feasible and aligned, thechances for success are relatively high, and those involved can make a more
informed estimate of the potential for social impact’’ (p.14).Traditional sector boundaries are breaking down as societies search for
more innovative, cost-effective, and sustainable ways to solve social problemsand provide socially important goods, such as education and health care (Deesand Anderson, 2002). Communities adversely affected by economic declinelikely need both economic and social regeneration (Thompson et al., 2000).‘‘Social entrepreneurship needs champions who understand which initiativesare most appropriate, feasible, and desirable, and who can bring out the latententerprise in others,’’ say Thompson et al. (p.328). These individuals mustrecognize that there is an opportunity to satisfy an unmet need that the statewelfare system will not or cannot meet, and those who are able to gather the
necessary resources must use them effectively toward the goal of ‘‘making adifference’’ (p.328). Development of new social capital (community-based tan-gible and intangible assets that otherwise would not exist) will help empowerdisadvantaged people and encourage them to take greater responsibility for andcontrol over their lives.
‘‘If we assume that promoting an entrepreneurial culture is a desirable meansof achieving our end (social and economic development), then we must clearlydefine what elements, behaviors, traits, and characteristics we want to encou-rage and value,’’ states Davis (2002, p.6). Davis proposes five steps to fosterentrepreneurial culture. These include rethinking the architecture of work (withemphasis on fair competition, equal access, and fair play); changing the direc-tion of macroecnomic policies from fighting inflation and protecting the inves-
tors to promoting decent work and employment-intensive growth; removinggovernment-created barriers to entrepreneurship; and ensuring access to creditwithout race-, gender-, or firm-size-based discrimination. Last, social entrepre-neurship must be ‘‘promoted, cultivated, and valued as a profession’’ (p.15).These steps do not seem to be very helpful for practical purposes, nor are theyrealistic. Davis goes on to stress the believed importance of youth development,
State of Literature on Small- to Medium-Sized Enterprises 37
particularly as it relates to promoting young entrepreneurs: ‘‘Education andemployment policies should be developed in an integrated manner, as they havedirect implications and impact each other. Youth employment and entrepre-neurship policies are likely to be more effective if they are closely linked andintegrated with educational policies, including the structure and content ofschool curricula, extracurricular activities, and after-school programs. Voca-tional needs of young people should be central’’ (p.19).
6.3 A Picture of Social Entrepreneurship
In 1998, the Open Society Institute (OSI), a privately operating and grant-making foundation, launched the Baltimore initiative to address ‘‘criticalnational urban issues as they are experienced locally’’ (OSI, 2006). The initiativefunctions within ‘‘the limitations and opportunities created by local social,economic, and political conditions,’’ and ‘‘builds on the commitment ofBaltimore’s government and nonprofit community to employ innovative stra-tegies and develop public-private partnerships to address the city’s problems.’’Continuing interaction between the staff of the initiative and the communityleaders is considered of ultimate importance.
The initiative targets problems in five interrelated areas: drug addictiontreatment, criminal justice, work force and economic development, educationand youth development, and access to justice. The initiative awards grants andconvenes educational forums to learn about these five problem areas. The goalof the initiative is to bring together ‘‘a representative cross section of the region’’while addressing the problem areas, and ‘‘to help identify policies and practicesthat will enable all residents to participate fully in Baltimore’s economic, social,and political life.’’
OSI goes on to say: ‘‘Confronting high levels of drug addiction, crime, andunemployment, Baltimore city government acknowledges its responsibility tocombat poverty and discrimination, and has welcomed joint public-privateefforts, including contributions from OSI, to change harmful or ineffectivepolicies and implement promising initiatives. In a city of 620,000, where halfof the students in neighborhood schools drop out before graduation, 60,000residents are said to be drug dependent, and 56% of the African-American menare involved in the criminal justice system, OSI–Baltimore recognized that smallinitiatives or model programs would have limited impact. Instead, it concen-trated on building partnerships and engaging large bureaucratic systems in adeliberate process of change’’ (2004, p.163).
Local hospitals were engaged to start a collaborative program to ‘‘recruit,train, and advance low-income city residents as skilled health-care workers’’(p.163). Local hospitals also were engaged in supporting the expansion of thepublic drug addiction treatment system. The ‘‘Campaign for Treatment NotIncarceration’’ was undertaken to promote solutions to drug addiction. Grants
38 Z. J. Acs, K. Kallas
were awarded to encourage ‘‘public and private agencies to offer employmenttraining services to people who were previously incarcerated to help themreenter the community successfully’’ (p.164).
In the education system, some large, ineffective public high schools havebeen replaced with small learning communities that have increased attendancerates. After-school partnerships have been initiated.
With the Soros Foundations Network’s initial $50million investment, OSIhas been able to leverage more than $225 million to address Baltimore’s mostpersistent challenges, including poverty, drug addiction, criminal and juvenilejustice, and education (OSI, 2004). OSI claims that it not only has received agood return on its investment but also has alleviated some of Baltimore’s mostchallenging problems. Among OSI’s stated accomplishments are raising Balti-more students’ test scores; doubling the number of drug-dependent residentsreceiving treatment; dramatically reducing individuals’ illegal income after theyhave been in drug treatment; publicizing abuses at juvenile justice centers,including abuses at a notorious center that subsequently was closed; expandinghigh-quality summer learning programs for LI students; securing $25 millionfor after-school programs for 14,000 students; helping to establish six new,innovative high schools; breaking up large neighborhood high schools intosmaller learning centers; and creating an urban debate league now operatingin 26 high schools.
7 Policy Suggestions and Practices
Thus far, a plethora of measures have been applied by government entities toencourage business formation, despite the relatively limited theoretical gui-dance. Governments have tried supplying certain types of financing (for exam-ple, long-term credit); providing management and marketing advice to smallbusinesses; assisting with the establishment of interfirm linkages and match-making programs between foreign and domestic traders and investors; support-ing technology development through risk-sharing programs and cluster orincubator promotion; and supporting enterprise-level training (Klein andHadjimichael, 2003). As argued above, entrepreneurship may not present asolution for LI communities. Hence, the entrepreneurship policies applied byregions, nations, and international organizations are more often than notcarried by ideologies and beliefs of policy makers or also academic scholars.As Hallberg (2000, p.5) concludes, ‘‘In reality, the desire of governments topromote SMEs is often based on social and political considerations rather thanon economic grounds.’’ Although it includes a bias toward market solution, asimilar statement by Klein and Hadjimichael asks if government-supportedentrepreneurship policies are ‘‘being pursued because they systematicallyimprove on market outcomes or because they are potentially attractive pro-grams that sometimes may even replace more meaningful reform?’’ (p.73).
State of Literature on Small- to Medium-Sized Enterprises 39
The rest of this subsection continues the discussion of entrepreneurshippolicy solutions for LI communities.
Acs and Armington (2006) propose an American solution to the socialfeedback mechanism, one that is consistent with the early work of Schumpeter.American capitalism differs from all other forms of industrial capitalism in itshistorical focus on both the creation of wealth (entrepreneurship) and thereconstitution of wealth (philanthropy). Philanthropy is part of the implicitsocial contract that continuously nurtures and revitalizes economic prosperity.Much of the new wealth has been given back to the community to build up thegreat social institutions that have a positive feedback on future economicgrowth. This entrepreneurship-philanthropy nexus has not been exploredfully by either economists or sociologist. The authors suggest that Americanphilanthropists—especially those who have made their own fortunes–createdfoundations that, in turn, contributed to greater and more widespread eco-nomic prosperity through knowledge creation.
Lundstrom and Stevenson (2005) suggest focusing primarily on the occupa-tional choice issue and the shift in emphasis from firms to people. Hart (2003)focuses on the regional level, with a particular view toward regional growth andthe role of universities. Audretsch (2002) and Glaeser (1998) suggest that publicpolicies ensure that firms are provided with necessary infrastructure (telecom-munications, transport, energy, water) and social services (health, education),in addition to establishing a sound business environment and adequate marketinfrastructure. Functioning cities, for example, are the best of all incubators orclusters, as they help firms, particularly small- andmedium-sized ones, establishthemselves, grow, and create employment (Audretsch, 2002; Glaeser, 1998).Holtz-Eakin and Rosen (2004) choose to examine three issues germane to anentrepreneurial society: the design of effective public venture capital programs;new firm formation and the deregulation of the banking industry; and therelationship among entrepreneurial activity, social mobility, and wealthinequality.
Bates (1993) warns the policy makers that money will not overcome gaps ineducation and entrepreneurial skill. It is important to recognize that, ‘‘Debtcapital and human capital endowments are complements in the small businessworld, not substitutes’’ (p.258). He argues that successful public loan programstarget higher-income, better-educated owners that possess appropriate skillsand experience, and who contribute their profits to investments that promoteexpansion and growth (Bates, 1993). Bates recommends such policy measuresas preferential public procurement, tax incentives on capital gains, and higherrates of immigration of educated people who also have financial capital.
Similarly to Bates, Deininger (2003), Hallberg (2000), and Klein andHadjimichael (2003) all conclude that public financial support programs toSMEs generally are not effective. Public institutions should not try to imitatemarket-functioning mechanisms. Their strengths lie in application of nonmar-ket solutions to the problems resulting from market failure, and the possessionof resources that the private sector cannot make available or may not be willing
40 Z. J. Acs, K. Kallas
to provide. Public institutions should do only what they can do better than the
private market. Klein and Hadjimichael (2003) state: ‘‘The emerging consensus
is that lasting subsidies are undesirable and that business development services
should be market oriented and privately provided. Private firms have powerful
incentives to seek out advice and to search for better partners. When the market
selection mechanism works well, firms that find ways to obtain such services
grow, and those that do not fail’’ (p.82).One might contend, however, that the situation of SMEs and entrepreneur-
ship in LI communities reflects exactly what will happen when the solution is
left to the market. Klein and Hadjimichael (2003) suggest that providing non-
dependent, one-time services and basic education, and marrying intervention
with community development efforts is a better method for aiding SME success.
They assert that subsidies should be a one-time support (such as for develop-
ment of credit-assessment skills, or for a management toolkit). After this initial
input, ‘‘following-up activity and discipline’’ should be left to market forces
(p.82). They are of the opinion that ‘‘Public intervention should focus on the
enabling environment for firms, including basic market infrastructure such as
credit bureaus, but should abstain from direct support to individual firms or
intermediaries’’ (p.82).Counter arguments can be raised that public assistance is sometimes neces-
sary in helping SMEs to grow, especially if they are high-potential, new tech-
nology-based firms. Audretsch (2002) concludes that the Small Business
Investment Company program has been an effective tool for ‘‘growing’’
SMEs, particularly with respect to commercializing inventions. Klein and
Hadjimichael do not oppose supporting the creation of industry clusters that
are relevant to or develop high technologies, as they can be powerful drivers of
growth. Experience shows, however, that rarely are high-potential technology
startups created in LI communities. As for private-sector development and pro-
poor policy design, Klein and Hadjimichael (2003) state that the poor must be
able to realize opportunity through provisions of basic education and a mini-
mum of social cohesion. ‘‘The design of pro-poor policies is a case-by-case
effort’’ (p.128).For member countries of the Organization for Economic Cooperation and
Development, the primary regional development policies for attracting firms to
disadvantaged regions are investment in infrastructure, social assistance, train-
ing, and other forms of public assistance (OECD, 1997). Programs to assist the
creation and development of microenterprises in inner cities and remote rural
areas also have become widespread policy tools (OECD, 1997). More specifi-
cally, programs instituted in OECD countries with the goal of encouraging
microenterprise in inner cities and rural areas are based on the premise that
these new ventures become the catalysts of further and future growth. In line
with arguments by Hart (2003), the OECD advises, ‘‘Governments wishing to
adopt policies used successfully in other regions or countries should take the
regional context into account’’ (1997, pp.4–5).
State of Literature on Small- to Medium-Sized Enterprises 41
Recommendations from the OECD mirror those of the majority of thestudies on the issue of public intervention. The role of government should beoriented toward ensuring a supporting business environment for SME growth,and policies should be carried out by local authorities who are more intimatelyaware of local conditions and needs (OECD, 1997). Additionally, the avail-ability of financing, the business environment, the presence of technology,management capabilities, and access to markets (foreign markets, public pro-curement are the five conditions under which the best policy practices thrive.Policies targeted toward an increase in entrepreneurial activity are influencedby certain regional characteristics, so, while labor-force skill improvementprograms may be effective in urban and intermediate-sized regions, they typi-cally are ineffective in rural areas, where take-up rates are low. Conversely, firmcreation policies are likely to be more effective in rural areas than urban orintermediate regions, as a result of low dead weight and displacement effects(OECD, 1997).
8 Summary
It is worth reposing our earlier question: Are we interested in LI communities orLI individuals? We know that when LI individuals try self-employment, theyoften fail. The evidence supports this. If we look at LI communities, the issue is alittlemore complicated.We saw that the issue inLI communities revolves aroundthe lack of both demand- and supply-side issues. On the supply side, we saw thatLI communities lack the inputs for successful economic development. On thedemand side, they lack the demand for goods and services produced by theregion. Therefore, in a region lacking an economic base, the role of entrepreneur-ship may be limited as an economic development tool. It is useful to think of apoor community in a rich country as an example of government failure. By thiswe mean that the basic supply-side institutions—education, infrastructure, lea-dership, finance—are missing. Many of these are public goods. We also suggestthat when the supply side of the model is ‘‘broken,’’ it might be beyond both theability of the state and the market to solve the problem. Here, philanthropy freefrom both political and market forces might be the appropriate institution totackle the problem of economic development by rebuilding. Baltimore providesan interesting example of this type of social entrepreneurship.
References
Acs, Z.J. and C. Armington. 2006. Entrepreneurship, Geography and American EconomicGrowth, Cambridge: Cambridge University Press.
Acs, Z.J. and C. Armington. 2004a. ‘‘The Geographic Differences in New Firm Formationand Human Capital,’’ Journal of Urban Economics, 56(2), 244–278.
42 Z. J. Acs, K. Kallas
Acs, Z.J. and C. Armington. 2004b. ‘‘Employment Growth and Entrepreneurial Activity inCities,’’ Regional Studies, 38: 879–877.
Acs, Z.J. and L.A. Plummer. 2005. ‘‘Penetrating the ‘Knowledge Filter’ in RegionalEconomies,’’ Annals of Regional Science, 39: 1–18.
Acs, Z.J. and D.J. Storey. 2004. ‘‘Entrepreneurship and Economic Development,’’ RegionalStudies, 38: 871–877.
Acs, Z.J. and A. Varga. 2005. ‘‘Entrepreneurship, Agglomeration, and TechnologicalChange,’’ Small Business Economics, 24(3): 323–334 (2005).
Acs, Z.J. et al. 2005. Global Entrepreneurship Monitor. 2004 Executive Report. London:Babson College, MA/London Business School.
Acs, Z.J., D.B. Audreutsch, P. Braunerhjelm, and B.Carlsson. 2004. ‘‘The Knowledge Filterand Entrepreneurship in Endogenous Growth.’’ Discussion Paper No. 0805, DiscussionPapers on Entrepreneurship, Growth and Public Policy Series, Max Planck Institute.
Acs, Z.J., D.B. Audreutsch, and M. P. Feldmann. 1994. ‘‘R&D Spillovers and InnovativeActivity,’’ Managerial and Decision Economics, 15(2): 131–138.
Appalachian Regional Commission. 2007. Project’s Web –page: http://www.arc.gov/ index.do?nodeId=2.
Audretsch, D.B. 2002. ‘‘The Dynamic Role of Small Firms: Evidence from the U.S,’’ SmallBusiness Economics, 18 (1–3): 13–40.
Audretsch, D.B. and M.P. Feldman. 1996. ‘‘R&D Spillovers and the Geography of Innova-tion and Production,’’ The American Economic Review, 86(3): 630–640.
Bates, T. 1993 ‘‘Theories of Entrepreneurship.’’ In Bingham, R.D. and R. Mier, eds, Theoriesof Local Economic Development Perspectives from Across Disciplines. Newbury Park,London, New Delhi: Sage, pp. 248–264.
Batra, G. and H. Tan. 1995. Enterprise Training in Developing Countries: Incidence, Produc-tivity Effects, and Policy Implications. Washington, D.C.: World Bank.
Beck, T. and A. Demirguc-Kunt. 2004. SME-s, Growth, and Poverty: Do Pro-SME PoliciesWork? The World Bank. Public Policy for the Private Sector, Note No. 268. Web page:http://rru.worldbank.org/Documents/PublicPolicyJournal/268- private.pdf.
Black, D.A. and S.G. Sanders, 2004. Labor Market Performance, Poverty, and IncomeInequality In Appalachia. Appalachian Regional Commission. Web page: http://www.arc.gov/index.do?nodeId=57.
BrandowCompany, Inc. 2001.Analysis of Business Formation, Survival, and Attrition Rates ofNew and Existing Firms and Related Job Flows in Appalachia. AppalachianRegional Commission. Web page: http://www.arc.gov/ images/reports/bizform/analysis-final.pdf.
Bresnahan, T. and A. Gambardella. 2004. Building High-Tech Clusters, Cambridge:Cambridge University Press.
Cannon, C. 2000. ‘‘Charity for Profit: How the New Social Entrepreneurs Are Creating Goodby Sharing Wealth,’’ National Journal, June 16, pp. 1,898–1,904.
Casson, M. 1982. The Entrepreneur: An Economic Theory, Oxford: Martin RobertsonDavis, S. 2002. Social Entrepreneurship: Toward an Entrepreneurial Culture for Social and
Economic Development, Ashoka: Innovators for the Public. Web page: http://www.ashoka.com/global/yespaper.pdf.
Dees, J.G. 2001. The Meaning of Social-Entrepreneurship. Duke University, Center forthe Advancement of Social Entrepreneurship. Web page: http://www.fuqua.duke.edu/centers/case/documents/dees_SE.pdf.
Dees, J.G. and B. B. Anderson. 2002. ‘‘For Profit Social Ventures,’’ InternationalJournal of Entrepreneurship Education. 2(1). Web page: http://scholar.google.com/ scho-lar? hl= en&lr=&q=cache:Z9Hol-ERki4J:www.fuqua.duke.edu/centers/ case/news/documents/DeesAndersonCASE.pdfþForþProfitþSocialþVentures.
Deininger, K. 2003. Land Policies for Growth and Poverty Reduction. World Bank policyresearch report no 26384, June 30.
State of Literature on Small- to Medium-Sized Enterprises 43
Florida, R. 2002. The Rise of the Creative Class, New York: Basic Books.Foster, L. 2003. The Appalachian Economy, Establishment, and Employment
Dynamics, 1982–1997: Evidence from theLongitudinal BusinessDatabase. AppalachianRegio-nal Commission. Web page: http://www.arc.gov/images/reports/ service/service_sector.pdf.
Fox, W.F. and M.N. Murray. 1990. ‘‘Local Public Policies and Interregional BusinessDevelopment,’’ Southern Economic Journal 57 (2): 413–427.
Friedman, R.E. 1986. ‘‘Entrepreneurial Renewal in the Industrial City,’’ Annals of theAmerican Academy of Political and Social Science, 488: 35–46.
Gladwin, C.H. et al. 1989. ‘‘Rural Entrepreneurship: One Key to Rural Revitalization,’’American Journal of Agricultural Economics 71 (5): 1,305–1,314.
Glaeser, E.L. 1998. ‘‘Are Cities Dying?’’ Journal of Economic Perspectives, 12 (2):139–160.Glaeser, E.L., J.A. Scheinkman, and A. Shleifer. 1995. ‘‘Economic Growth in a Cross Section
of Cities,’’ Journal of Monetary Economics, 36: 117–143.Graf, J., V. de. 1957. Theoretical Welfare Economics, Cambridge: Cambridge University
Press.Gucly, A., J.G. Dees and B.B. Anderson. 2002. The Process of Social Entrepreneurship:
Creating Opportunities Worthy of Serious Pursuit, Center for the Advancement of SocialEntrepreneurship. Web page: http://www.fuqua.duke.edu/centers/case/ documents/SEProcessDraft_FINAL.pdf.
Hallberg, K. 2000. A Market-Oriented Strategy for Small and Medium-Scale Enterprises. Dis-cussion Paper No 40. World Bank-International Finance Corporation, Washington, D.C.
Haltiwanger, J. and C.J. Krizan. 1999. ‘‘Small Business and Job Creation in theUnited States,’’ In Acs, Z.J., ed., Are Small Firms Important? Their Role and Impact,Boston / Dordrecht / London: Kluwer Academic Publishers.
Hart, D. ed. 2003.The Emergence of Entrepreneurship Policy, Cambridge: CambridgeUniversity Press.
Higgins, B. andD.J. Savoie. 1995.Regional Development Theories and Their Application,NewBrunswick, N.J., U.S.A: Transaction Publishers.
Hirschman, A.O. 1958. The Strategy of Economic Development, New Haven and London:Yale University Press.
Holtz-Eakin,D. andH. S.Rosen, eds. 2004.Public policy and the economics of entrepreneurship.Cambridge: MIT Press.
Hoover, E. 1975. ‘‘How Regions Develop,’’ An Introduction to Regional Economics, 2nd ed.,Alfred A. Knopff, 207–244.
Jensen, J.B. 1998. Birth and Death of Manufacturing Plants and Restructuring in Appalachia’sIndustrial Economy, 1963–1992: Evidence from the Longitudinal Research Database,Appalachian Regional Commission. Web page:http://www.arc.gov/images/reports/manufacturing/manufact.pdf.
Johnson, S. 2000. Literature Review on Social Entrepreneurship, Canadian Centre for SocialEntrepreneurship. Web page: http://www.bus.ualberta.ca/ccse/Publications/.
Jovanovic, B. 1982. ‘‘Selection and the Evolution of Industry,’’Econometrica, 50 (3): 649–670.Klein, M.U. and B. Hadjimichael. 2003. The Private Sector in Development. Entrepreneurship,
Regulation, and Competitive Disciplines. Washington, D.C.: The World Bank. Web page:http://www-wds.worldbank.org/servlet/WDSContentServer/WDSP/IB/2003/07/26/000094946_03071204032945/Rendered/PDF/multi0page.pdf.
Krikelas, A.C. 1992. ‘‘Why Regions Grow: A Review of Research on the Economic BaseModel,’’ Economic Review, Federal Reserve Bank of Atlanta, 16–29.
Lucas, R.E. 1988. ‘‘On the Mechanics of Economic Development,’’ Journal of MonetaryEconomics, 22: 3–42.
Lundstrom, A and L. Stevenson. 2005. Entrepreneurship Policy: Theory and Practice, Boston:Kluwer Academic Publishers.
Nelson, A. 1993. ‘‘Theories of Regional Development,’’ In Bingham R. and R. Mier, eds.,Theories of Local Economic Development. Sage, 27–79.
44 Z. J. Acs, K. Kallas
Nygent, J.B. and S.-J. Yhee. 2002. Small and Medium Enterprises in Korea: Achievements,Constraints, and Policy Issues, Small Business Economics, 18(1–3): 85–119.
Organization for Economic Cooperation and Development. 1997. Small Businesses, JobCreation, and Growth: Facts, Obstacles, and Best Practices. Paris. Web page: http://www.oecd.org/dataoecd/10/59/2090740.pdf.
Open Society Institute. 2004. Soros foundations network Report 2004: Building Open Societies.Web page: http://www.soros.org/resources/articles_publications/publications/ar2004_200507 18.
Open Society Institute. Baltimore Initiative. Web page: http://www.soros.org/initiatives/baltimore.
Porter, M.E. 1998. ‘‘The Competitive Advantage of the Inner City,’’ In Porter, M.E. OnCompetition. Boston, MA: Harvard Business School Publishing, 377–408.
Porter, M.E. 1998a. ‘‘Cluster and the New Economics of Competition,’’ Harvard BusinessReview, Nov.–Dec., 77.
Romer, P.M. 1994. ‘‘The Origins of Endogenous Growth,’’ Journal of Economic Perspectives,Winter, 8(1): 3–22.
Romer, P.M. 1990. ‘‘Endogenous Technological Change,’’ The Journal of Political Economy,98 (5.2): S71–S102.
Romer, P.M. 1986. ‘‘Increasing Returns and Long-Run Growth,’’ The Journal of PoliticalEconomy, 94(5): 1,002–1,037.
Rubin, H. 1994. ‘‘There aren’t Going to be any Bakeries here if There is no Money to AffordJellyrolls: The Organic Theory of Community Based Development,’’ Social Problems,41(3): 401–424.
Sassen, S. 1990. ‘‘Economic Restructuring and The American City,’’ Annual Review ofSociology 16: 465–490.
Sherrard Sherrarden, M., C.K. Sanders, and M. Sherrarden. 2004. Kitchen Capitalism.Microenterprise in Low-Income Households. Albany: SUNY Press.
Simon, C. and C. Nardinelli. 2002. ‘‘Human Capital and the Rise of American Cities,1900–1990,’’ Regional Science and Urban Economics, 32: 59–96.
Smith, W. 2000. ‘‘Regulating Infrastructure for the Poor: Perspectives on RegulatorySystem Design,’’ Paper presented at the International Conference on Infrastructurefor Development: Private Solutions and the Poor, London, May 31–June 2. http://www.ppiaf.org/conference/section2-paper3.pdf.
Thompson, J., G.Alvy andA. Lees. 2000. ‘‘Social Entrepreneurship–ANewLook at the Peopleand the Potential,’’Management Decision, 38(5): 328–338. http://www.emeraldinsight.com /Insight/viewPDF.jsp?Filename=html/
Output/Published/EmeraldFullTextArticle/Pdf/0010380503.pdf.Tiebout, C.M. 1956. ‘‘Exports and Regional Economic Growth,’’ Journal of Political
Economy, 64 (2): 160–169.Widner, R.R. 1990. ‘‘Appalachian Development After 25 Years: An Assessment,’’ Economic
Development Quarterly, 4(4): 291–312.
State of Literature on Small- to Medium-Sized Enterprises 45

On Government Intervention in the Small-Firm
Credit Market and Economic Performance
Ben R. Craig, William E. Jackson and James B. Thomson
Abstract In this paper we empirically test whether the Small Business
Administration’s main guaranteed-lending program—the 7(a) program—has
a greater impact on economic performance in low-income markets. This
hypothesis is predicated on our previous research (Craig, Jackson, and Thom-
son, 2007b), where we investigate aggregate SBA guaranteed lending. In that
research, we found that the overall impact of SBA-guaranteed lending on
economic performance is significant and positive in low-income markets.Using local labor market employment rates as our measure of economic
performance, we find a quantitatively similar positive impact of SBA
7(a)-guaranteed lending. This impact on economic performance is also signifi-
cantly larger in low-income areas. This result suggests that the 7(a) program,
which is the largest SBA guaranteed lending program, is also the main con-
tributor to the positive impact of SBA-guaranteed lending on local market
economic performance.
1 Introduction
It is well documented in the economics literature that economic growth and
financial market development tend to be positively correlated. Whether rela-
tively higher levels of financial development actually cause higher levels of
economic performance, however, or higher levels of economic performance
cause higher levels of financial development, is an issue of debate that dates at
least to the studies of Schumpeter (1911) and Robinson (1952).Three important recent studies provide evidence that relatively higher levels
of financial market development do, indeed, tend to lead to higher levels of one
B. R. CraigFederal Reserve Bank of Cleveland,[email protected]
G. Yago et al. (eds), Entrepreneurship in Emerging Domestic Markets.� Milken Institute 2008
47
measure of economic performance—higher rates of economic growth. Jayartne
and Strahan (1996), Rajan and Zingales (1998), and Guiso, Sapienza, andZingales (2004), all report significant evidence supporting the proposition that
the causal relationship runs from more financial market development to moreeconomic growth.
In this paper, we investigate whether local financial market development
helps to promote economic performance by focusing on a particular rationalefor such a relationship—financial market development increases the amount of
external finance available to small firms. Specifically, we examine whether agovernment intervention aimed at increasing small firms’ access to bank credit
has a relatively greater impact in low-income areas. We exploit the fact thatthere is a strong positive correlation between low-income markets and markets
with relatively low levels of financial development. And we use SBA-guaranteedlending as our government invention method. We choose the small-firm credit
market because of the high degree of information asymmetry that may beassociated with it, and because this information asymmetry may lead to a creditrationing problem, as explained in Stiglitz and Weiss (1981).
We choose the SBA guaranteed lending program because our previous
research (Craig, Jackson, and Thomson, 2007b) suggests that SBA guaranteedlending in the aggregate has a larger positive influence on low-income markets.
Our previous research used metropolitan statistical areas (MSAs) and non-MSA counties to represent local geographic financial markets. However, Craig,
Jackson, and Thomson (2007b) did not investigate whether this positive rela-tionship between SBA-guaranteed lending and economic performance in low-
income markets was primarily the result of SBA’s main guaranteed-lendingprogram, the 7(a) program. As in Craig, Jackson, and Thomson (2007b), we use
the level of labor market employment, or the employment rate, as our measureof economic performance. And we test whether 7(a) program guaranteed lend-
ing alone has a differential impact for low-income markets.Our null hypothesis is that 7(a) program guaranteed lending does not have
an impact on low-income markets different from higher-income markets. Ourprimary alternative hypothesis is that 7(a) program guaranteed lending has a
greater impact on the employment rate in low-income markets than in higher-income markets. As in Craig, Jackson, and Thomson (2007b), this alternative
hypothesis is predicated on four overlapping assumptions. They are:
1. Income levels are a proxy for relative development of the local financialmarket.
2. Less developed financial markets are more likely to experience severe infor-mation asymmetry problems that could lead to credit rationing.
3. SBA-guaranteed lending is likely to reduce these credit-rationing problemsand improve the development of that local financial market.
4. Increased financial development helps to lubricate the wheels of economicperformance and increase the effective level of labor utilization, or theemployment rate.
48 B. R. Craig et al.
Our results suggest that low-income markets are affected positively by 7(a)program guaranteed lending to a similar extent as aggregate SBA-guaranteedlending. Moreover, as in Craig, Jackson, and Thomson (2007b), the impact forlow-income markets is significantly larger than it is for higher-income markets.These results suggests that the 7(a) program, which is the largest SBA-guaran-teed lending program, is also the main contributor to the positive impact ofSBA-guaranteed lending on local market economic performance. These resultsalso have important implications for public policy in general, and the composi-tion of the SBA guaranteed lending programs in particular.
The remainder of this article is organized as follows. Section 2 provides adiscussion of the economics of small-business credit markets. A rationale forSBA loan guarantees is presented in Section 3, where we also consider theunderlying economic mechanisms that might enable a directed subsidy, suchas SBA-guaranteed lending, to result in better ‘‘observed’’ economic perfor-mance. In Section 4, we focus on the net welfare effect of SBA-administeredsubsidies and review the empirical literature examining the link between SBAloan guarantees and economic performance. We also include in this section adescriptive overview of the SBA 7(a) guaranteed lending program. In Section 5,we provide the data, model, and results for testing the empirical links betweenSBA 7(a) loan guarantees and economic performance in low-income markets.Section 6 offers our conclusion with a public policy discussion.
2 Small-Business Credit Markets
Lenders may fail to allocate loans efficiently because of fundamental informa-tion problems in the market for small-business loans. These information pro-blems may be so severe that they lead to credit rationing and constitute thefailure of the credit market. Stiglitz andWeiss (1981) argue that banks considerthe interest rate they receive on the loan and its riskiness when deciding to lend.Information frictions in loan markets may cause two effects that allow theinterest rate itself to affect the riskiness of the bank’s loan portfolio. Whenthe interest rate affects the nature of the transaction, it is unlikely that a rate tosuit both buyers and sellers will be found—that is, no interest rate will ‘‘clear themarket.’’ The first effect, adverse selection, impedes the ability of markets toallocate credit using only the lending rate, because it increases the proportion ofhigh-risk borrowers to within the pool of prospective borrowers. The secondeffect, moral hazard, reduces the ability of rates alone to clear lending markets,because it influences the ex post actions of borrowers.
The adverse selection effect is a consequence of different borrowers havingdifferent likelihoods of repaying their loans, a probability known to the bor-rowers but not the lenders. The expected return to the bank on a loan obviouslydepends on the probability of repayment, so the bank would like to be able toidentify borrowers who are more likely to repay. It is difficult to identify such
Government Intervention in Small-Firm Credit Market and Economic Performance 49
borrowers partly because the borrowers have more information than the lender
(Myers and Majluf, 1984). Typically, the bank will use a variety of screening
devices. The interest rate a borrower is willing to pay may act as one such
screening device. For example, people who are willing to pay a higher interest
rate are likely to be, on average, worse risks, because they know their prob-
ability of repaying the loan is low. So as the interest rate rises, the average
‘‘riskiness’’ of people willing to borrow increases. This may result in lowering
the bank’s profits from lending.Similarly, as the interest rate and other terms of the contract change, the
behavior of the borrower is also likely to change. For instance, raising the
interest rate decreases the payoffs of successful projects. Higher interest rates
thus may induce firms to undertake riskier projects—projects with lower prob-
abilities of success, but higher payoffs when successful. In other words, the price
a firm pays for credit may affect the riskiness of its investment decisions, which
is the moral hazard problem.As a result of these two effects, a bank’s expected return may increase less
than proportionately for an additional increase in the interest rate; beyond a
certain point, it may decrease as the interest rate is increased. It is conceivable
that the demand for credit may exceed its supply. Although traditional analysis
would argue that in the presence of an excess demand for credit, unsatisfied
borrowers would offer to pay a higher interest rate to the bank?bidding up the
interest rate until demand equals supply—that does not happen in this case.
This is because the bank will not lend to someone who offers to pay the higher
interest rate, as this borrower is likely to be a worse risk than the average
borrower. The expected return on a loan to a borrower at the higher interest
rate may be actually lower than the expected return on loans the bank is
currently making. Hence, there are no pecuniary forces leading supply to
equal demand, and credit is rationed.
2.1 Importance of Lending Relationships
Lending relationships have been recognized by economists as an important
market mechanism for reducing credit rationing.1 Lending is based on limited
information about the quality of borrowers in the market, but a close and
continued interaction between a firm and a bank may provide a lender with
sufficient information about, and a voice in, the firm’s affairs so as to lower the
cost and increase the availability of credit. Conditional on a positive previous
experience with the borrower, the bank may expect future loans to be less risky,
1 See Kane andMalkiel (1965), Petersen and Rajan (1994), Berger andUdell (1995), and Stein(2002).
50 B. R. Craig et al.
which should reduce its average cost of lending and increase its willingness toprovide funds.
The relationship-lending literature suggests that in addition to being formedover time, relationships can be built through interaction overmultiple products.That is, borrowers may obtain more than just loans from a bank. Borrowersmay purchase a variety of financial services, such as checking and savingsaccounts. These added dimensions of a relationship can affect the firm’s bor-rowing cost in two ways. First, they render the lender’s information about theborrower more precise. For example, the lender can learn about the firm’s salesby monitoring the cash flow in its checking account or by factoring the firm’saccounts receivables. Second, the lender can spread any fixed costs of monitor-ing the firm over multiple products.
Overall, the available evidence points to a significantly positive relationshipbetween factors connected to the strength and duration of the lending relation-ships among banks and small-business customers, and both the terms (lowerloan rates and fewer loan covenants) and availability of credit. From theperspective of the banks, the stronger the relationship, the more likely theborrower is to select the bank for future credit needs and other banking services.
3 Potential Role for SBA Loan Guarantees
The promotion of small businesses is a cornerstone of economic policy for alarge number of industrialized countries. Public support for small enterpriseappears to be based on the widely held perception that the small-business sectoris an incubator of economic growth—a place where innovation occurs and newideas become economically viable business enterprises. In addition, policymakers routinely point to small businesses as important sources of employmentgrowth. Possibly as a result, there is widespread political support for govern-ment programs, tax breaks, and other subsidies aimed at encouraging thegrowth and development of small business in the United States, and increas-ingly, around the world (Bergstrom, 2000).
A particular area of concern for policymakers is whether small businesseshave access to adequate credit. After all, a lot of small firms are relatively youngand have little or no credit history. Lenders also may be reluctant to fund smallfirms with new and innovative products because of the difficulty of evaluatingtheir risk. These difficulties are classic information problems—difficulty obtain-ing sufficient information about the parties involved in a transaction—and theymay prevent otherwise creditworthy firms from obtaining credit. If informationproblems are substantial, they can lead to credit rationing; that is, loans areallocated by a mechanism other than price. If small businesses face severe creditrationing, then they also may become credit-constrained; they may miss out onpositive net present value projects because they cannot raise the external capitalnecessary to fund the project. This suggests that to the extent economically
Government Intervention in Small-Firm Credit Market and Economic Performance 51

significant credit rationing persists in small-business credit markets, a rationale
exists for supporting small enterprises through government programs to
improve their access to credit.Because relationships may be more costly for small businesses to establish
than large businesses, and because lack of relationships may lead to severe
credit rationing in the small-business credit market, some form of government
intervention to assist small businesses in establishing relationships with lenders
may be appropriate. But the nature of intervention must be evaluated carefully,
as it represents a subsidy to small businesses (or lenders, or both) at the expense
of other groups.One government intervention to improve the private market’s allocation of
credit to small enterprises is the SBA-guaranteed lending program. SBA loan
guarantees are well established, and their volume has grown significantly over
the past decade. Nearly 20 million small businesses have received direct or
indirect help from some SBA program since 1953. The SBA’s business loan
portfolio of roughly 240,000 guaranteed loans was worth about $60 billion in
2004, making it the single largest financial backer of small businesses in the
United States. To place this amount in perspective, consider that in June 2004,
commercial banks reported a total of about $522 billion of small-business loans
outstanding (small-business loans are defined as any commercial and industrial
loan with an initial amount of less than $1 million [SBA, 2005]). Although these
two sets of loan numbers are not exactly comparable, the relative magnitude of
SBA activity to that of the commercial banking industry suggests that the SBA
is a major player in the small-business loan market.2
The economic justification for any government-sponsored, small-business
lending program or loan guarantee program must rest on a generally acknowl-
edged failure of the private sector to allocate loans efficiently. Without a clearly
identified problem with private-sector lending to small businesses, the SBA’s
activities would seem to be a wasteful, politically motivated subsidy to this
sector of the economy.SBA loan guarantees may improve credit allocation by providing a mechan-
ism for pricing loans that is independent of borrower behavior. By reducing the
expected loss associated with a loan default, the guarantee increases the
expected return to the lender—without increasing the lending rate. In the
absence of adverse selection, lenders could offer loan rates to borrowers that
reflected the average risk within the pool of borrowers; each loan would reflect a
2 There are several reasons why comparisons of SBA loan totals and small-business loansreported for commercial banks on the call reports can be misleading. First, SBA-guaranteedloan totals include a non-trivial amount of loans by non-bank lenders. Second, banks reportbusiness loans only in amounts of $1 million and less, while the SBA will guarantee loans foras much as $2 million. Finally, the call reports reflecting small loans to businesses includeloans to small businesses and loans under the $1million threshold to large and medium-sizedfirms.
52 B. R. Craig et al.

randomdraw from the pool. If the bankmade a large number of small loans to apool of borrowers, the bank’s loan portfolio would have the same risk andreturn characteristics of the pool.
With the guarantee in place, the lender could profitably extend credit at loanrates below what would be dictated by the risk of the average borrower. Theguarantee increases the profitability of the loan by reducing the losses to thebank in instances when the borrower defaults.
To the extent that the loan guarantees reduce the interest rate at which banksare willing to lend, external loan guarantees will help mitigate the moral hazardproblem. The lower lending rates afforded by external guarantees reduce thebankruptcy threshold, thereby increasing the expected return of safe projectsvis-a-vis riskier ones.
Additionally, lowering the lending rate increases the number of low-riskborrowers applying for credit; that in turn increases the likelihood that theaverage risk of firms applying for loans is representative of the pool of bor-rowers. Hence, external loan guarantees also help mitigate adverse selection. Intheory, SBA loan guarantees should reduce the probability that a viable smallbusiness is credit-rationed.
The program reduces the risk to the lender of establishing a relationship withinformationally opaque small-business borrowers. Finally, the SBA loan guar-antee programs may improve the intermediation process by lowering the risk tothe lender of extending longer-term loans, which more closely meet the needs ofsmall businesses for capital investment. It is interesting to note that small-firmcredit markets are becoming better at addressing some of the problems SBAguarantees are said to address. For example, credit-scoring technology mayhelp alleviate some of the credit-rationing problems in small-firm creditmarkets.
As discussed in Berger and Frame (2006), small-business credit scoring(SBCS) is a lending technology used by many financial institutions to evaluateapplicants for so-called ‘‘microcredits’’—those less than $250,000 ($250K).SBCS analyzes consumer data about the owner of the firm, and, using statisticalmethods to predict future credit performance, combines it with relatively lim-ited data about the firm itself. As these markets develop, and more financialinstitutions engage in SBCS-based lending technologies, the degree to whichsmall businesses face credit rationing may decline. That suggests that the valueof SBA guaranteed lending may decline, at least to the extent that SBCS reducesfrictions in the small-firm credit market. 3
One should not jump to the conclusion that the presence of a marketimperfection, in this case credit-market friction, makes government interven-tion desirable. By guaranteeing the loans of a certain class of small enterprise,
3 For more on credit scoring as a lending technology see: Berger and Frame (2006); Berger,Frame, and Miller (2005); Frame, Srinivasan, and Woolsey (2001); Frame, Padhi, andWoolsey (2004).
Government Intervention in Small-Firm Credit Market and Economic Performance 53
the SBA selectively influences credit allocation. From Kane (1977), and Craig
and Thomson (2003), we know that selective credit allocation is likely to be an
inefficient and possibly counterproductive policy tool. In the case of financial
institutions, the provision of subsidies tied to small-enterprise lending is likely
to have costly, unintended effects. The welfare costs of these unintended con-
sequences may include: deadweight losses associated with resource misalloca-
tion, wealth redistribution, and less stability in the banking system. In the case
of small businesses, the provision of subsidies tied to borrowing is likely to
increase the amount of debt capital held by small firms, and generate welfare
costs associated with this differing capital structure. The subsidy associated
with SBA guaranteed lending may have redistributional effects inconsistent
with conventional notions of social welfare. For example, it is likely that most
of the wealth transfer will be to established small-business owners or to the
shareholders of the lending institutions, neither of which represents the poorest
or most disadvantaged in our society.4
Nonetheless, the net value of subsidizing small businesses will be positive if
the benefits are greater than the costs. One benefit may be an increase in local
market employment rates. Such an increase may have significant social benefits,
especially in areas with chronic levels of low employment.
4 SBA Loan Guarantee Programs and Local Economic
Performance
The Small Business Administration was born on July 30, 1953. The SBA
received most of its powers from two agencies that were dissolved at its birth,
the Reconstruction Finance Corporation (RFC) and the Small Defense Plants
Agency (SDPA). The SBA was granted authority to make direct loans and
guarantee bank loans to small businesses by the RFC. It also assumed the
RFC’s role of making loans to victims of natural disasters. Formerly the
functions of the SDPA, helping small businesses procure government contracts,
and helping small-business owners with managerial, technical, and business
training assistance also were assumed by the SBA.Recognizing that private financial institutions are typically better than gov-
ernment agencies at deciding which small business loans to underwrite, in the
mid-1980s the SBA began moving away from making direct loans and toward
guaranteeing private loans. Currently, the SBA makes direct loans only under
special circumstances. Guaranteed lending, through the SBA’s 7(a) guaranteed
loan and 504 loan programs, is the main form of SBA activity in lending
markets.
4 See Craig and Thomson (2003) for more on this point.
54 B. R. Craig et al.
Themore basic andmore significant of these two is the 7(a) loan program. Its
name refers to Section 7(a) of the Small Business Act, which authorizes the
agency to provide business loans to small businesses. All 7(a) loans are provided
by commercial lenders. A large percentage of American commercial banks
participate in the 7(a) program, as do a number of finance companies, credit
card banks, and other non-bank lenders.It is important to note that 7(a) loans are made available only on a guaranty
basis. They are provided by lenders who structure their own loans in accordance
with SBA’s underwriting requirements, and then apply for and receive a guar-
anty from the SBA on a portion of the loan. The SBA does not fully guaranty
7(a) loans; usually, it’s 50 percent to 85 percent of the loan amount. The
maximum 7(a) loan is $2 million, and the maximum guaranty on such a loan
is $1.5 million (SBA 2006a). For the maximum loan, the SBA will guarantee no
more than 75 percent of the loan amount. The lender and the SBA share the risk
that a borrower will not repay the loan in full.The public policy rationale for SBA guarantees appears to be that credit-
market imperfections may result in small enterprises being credit-rationed—
particularly for longer-term loans for purposes such as capital expansion. If
SBA loan guarantees indeed reduce credit rationing in the markets for small-
business loans, then there should be a relationship between measures of SBA
guaranteed lending activities and economic performance. Our main point is
that credit-market frictions—primarily in the form of costly information and
verification of a small firm’s projects—can lead to lower levels of credit alloca-
tion that negatively impact economic performance in the local market.5 To the
extent that SBA’s guaranteed lending program mitigates credit-market fric-
tions, there should be a positive relationship between the SBA guaranteed
lending and economic performance, especially across local markets where
credit-market frictions are likely to be a significant problem.6
Does more SBA-guaranteed lending lead to higher levels of local market
economic performance? The results fromCraig, Jackson, and Thomson (2007b)
suggest that the answer is yes. In that paper we empirically test whether
aggregate SBA guaranteed lending has a greater impact on economic perfor-
mance in low-income marketsUsing local labor market employment rates as our measure of economic
performance, we find evidence consistent with this proposition. In particular,
5 Implicit here is that labor and capital are complements, at least for small firms.6 This empirical relationship is supported also by the economics literature that documents asignificant positive correlation between economic growth and financial market development.This literature dates at least to the controversial studies of Schumpeter (1911) and Robinson(1952). More recent important studies provide evidence that relatively higher levels of finan-cial market development tend to lead to higher levels of economic performance—King andLevine (1993a,b), Jayartne and Strahan (1996), Rajan and Zingales (1998), and Guiso,Sapienza, and Zingales (2004).
Government Intervention in Small-Firm Credit Market and Economic Performance 55

we find a positive and significant correlation between the average annual levelof employment in a local market, and the level of aggregate SBA guaranteedlending in that local market. The intensity of this correlation is relatively largerin low-income markets. Indeed, one interpretation of our results is that thiscorrelation is positive and significant only in low-income markets.
In Craig, Jackson, and Thomson (2007a) we report regression results con-sistent with the hypothesis that aggregate SBA guaranteed lending producespositive, albeit small, net social benefits. Specifically, we report consistentevidence that the level of SBA-guaranteed lending activity (per $1,000 ofdeposits) is positively related to the growth of per capita income at the localmarket level–for both urban and rural markets. This impact of SBA-guaranteedlending on growth appears to be small. This small, measurable economic impactof SBA loan guarantees on local economic growth would be expected, however,given the limited role they play in the overall (small- and large-firm) creditintermediation process.
In Craig, Jackson, and Thomson (2007a), our sample consists of localeconomic markets for which we have complete SBA-guaranteed lending dataover the sample estimation period (1992–2001). Our sample contained morethan 360,000 SBA loans aggregated to the local market level for each year in oursample. We estimated our models separately for urban (MSAs) and rural (non-MSA counties) markets. We used the instrumental variables (with the instru-ments from prior periods) and mean transformed data in our estimationprocedures.
The results from both Craig, Jackson, and Thomson (2007a) and Craig,Jackson, and Thomson (2007b) should be interpreted with caution, however,for at least two reasons. First, we are unable to control for small-businesslending at the local market level and hence, we do not know whether aggregateSBA loan guarantees are contributing to economic performance by helping tocomplete the market for small firm credit or are simply proxies for small-business lending in the market. Second, we are not able to test whether SBAloan guarantees materially increase the volume of small-business lending in amarket, a question related to who captures the subsidy associated with SBAloan guarantees.
5 7(a) Loan Guarantees and Low-Income Markets
Previous research has examined the impact of SBA loan guarantees on eco-nomic growth for both urban and rural markets. While this research has founda link between the level of SBA loan guarantees, scaled by deposits, in a market,and personal income growth, it provides only indirect evidence consistent withthe hypothesis that SBA guarantees improve credit allocation in the small-business market. Direct tests of this hypothesis are elusive, however, as theywould seem to require the type of information on potential small-business
56 B. R. Craig et al.

borrowers that is not readily observable—the lack of which is the likely cause aviable business might face credit rationing.
The SBA 7(a) guaranteed lending program is one of many government-sponsored market interventions aimed at promoting small business. The ratio-nale for these guarantees often is based on the argument that credit-marketimperfections can result in small enterprises being credit-rationed—particularlythose in financially less developed areas. If SBA loan guarantees do reducecredit rationing in these markets for small-business loans, then there should be arelationship between measures of SBA guaranteed lending activities and eco-nomic performance, and this relationship should be more evident in financiallyless developed markets.
We take as our maintained hypothesis that credit-market frictions—primar-ily in the form of costly information and verification of a small-firm’s projects—can lead to a socially suboptimal credit allocation that negatively impacts thelabor employment rate in the local market. (Implicit here is that labor andcapital are complements ... at least for small firms.) To the extent that SBAguaranteed lending programsmitigate credit-market frictions, there should be apositive relationship between SBA guaranteed lending and the level of employ-ment, especially across less developed (low-income) financial markets. There-fore, we test for whether SBA loan guarantees ease credit-market frictions bymeasuring whether the normalized amount of SBA guaranteed lending in alocal market is correlated with relatively higher levels of employment in low-income areas. Our null hypothesis is that there are no discernible differences inthe impact of SBA guaranteed lending on employment rates in low-incomemarkets relative to higher-income markets.
5.1 Data
To examine our hypothesis about the differential impact of SBA 7(a) guaran-teed lending on employment rates in less financially developed areas, we utilizedata from three sources. One is loan-specific data—including borrower andlender information—on all SBA-guaranteed 7(a) from January 1991throughDecember 2001. We have more than 320,000 loans, with an average size of$203,000, in our sample.
Our second source of data is from the National Bureau of EconomicResearch (NBER), the Bureau of Labor Statistics (BLS), and the Bureau ofEconomic Analysis (BEA) from 1991 through 2001. The third source is datafrom the Federal Deposit Insurance Corporation’s annual summary of depositdata (SUMD) files.
All of our individual loan data are aggregated to the local market level. Forthis study, we also aggregate over time to produce cross-sectional observationsfor our local markets. We use Metropolitan Statistical Areas to define therelevant local market for urban areas and non-MSA counties as the localmarket for rural areas.
Government Intervention in Small-Firm Credit Market and Economic Performance 57
5.2 Empirical Strategy
Recall that our null hypothesis is that the impact of SBA 7(a) guaranteedlending on employment rates is not different in local markets that are relativelyless financially developed. To test this hypothesis, we simplify the analysis ofCraig, Jackson, and Thomson (2007a). These authors estimate their modelsusing classic Arellano and Bond panel regression estimation techniques. In thisstudy, we estimate a simple cross-sectional OLS fixed-effects regression modeldesigned to explain differences in employment levels across markets over oursample period. Our basic model is:
EMPRi ¼�0 þ �1PICAPi þ �2HERFi þ �3MSADUMi þ �4DEPPOPi
þ �5SBAPOPi þ "i ð1Þ
Equation (1) uses the average annual employment rate over our sample period(EMPR) at the local market level to proxy for economic performance. We areinterested in how SBA 7(a) guaranteed lending affects cross-sectional changesin EMPR. For this study EMPR is defined as 100 minus the unemploymentpercentage rate in the local market. The primary variable of interest on theright-hand side of equation (1) is SBAPOP, which is the inflation-adjustedaverage annual dollar amount of SBA 7(a) guaranteed loans scaled by averagepopulation in the local market over our sample period.
Other right-hand side variables in our model are included as controls. Forexample, DEPPOP is a measure of market liquidity similar to the one used byKing and Levine (1993a).DEPPOP is defined as the inflation-adjusted averageannual dollar amount of commercial bank deposits scaled by average popula-tion in the local market over our sample period. PICAP is defined as theinflation-adjusted average annual per capita income in the local market overour sample period. It is probably reasonable to assume that markets with higherPICAP and higher DEPPOP also have higher levels of employment, EMPR.
The deposit market Herfindahl index (HERF) is also included in (1) tocontrol for the structure of the local market. Constructed at the market levelusing branch-level deposit data from the SUMD database, HERF provides ameasure of concentration, and presumably the competitiveness, of the localbanking market. Equation (1) also includes a dummy variable MSADUMwhich is equal to one, zero otherwise, if the local market is an MSA as opposedto a non-MSA county.
We test our null hypothesis using a research design based on dividing oursample into a high financially developed local market subsample and a lowfinancially developed local market subsample. We do not have a direct measureof local financial market development. Thus, we use an instrument variable forfinancial development of the local market. Following Jackson, Craig, andThomson (2007a), we use PICAP as a proxy for financial market development.This reasonably assumes that financial services tend to gravitate to high-income
58 B. R. Craig et al.
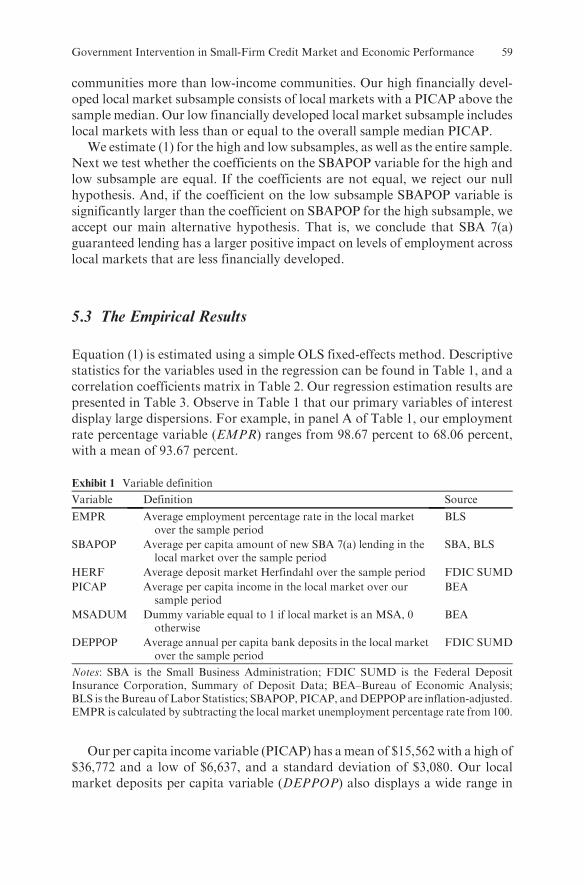
communities more than low-income communities. Our high financially devel-oped local market subsample consists of local markets with a PICAP above thesample median. Our low financially developed local market subsample includeslocal markets with less than or equal to the overall sample median PICAP.
We estimate (1) for the high and low subsamples, as well as the entire sample.Next we test whether the coefficients on the SBAPOP variable for the high andlow subsample are equal. If the coefficients are not equal, we reject our nullhypothesis. And, if the coefficient on the low subsample SBAPOP variable issignificantly larger than the coefficient on SBAPOP for the high subsample, weaccept our main alternative hypothesis. That is, we conclude that SBA 7(a)guaranteed lending has a larger positive impact on levels of employment acrosslocal markets that are less financially developed.
5.3 The Empirical Results
Equation (1) is estimated using a simple OLS fixed-effects method. Descriptivestatistics for the variables used in the regression can be found in Table 1, and acorrelation coefficients matrix in Table 2. Our regression estimation results arepresented in Table 3. Observe in Table 1 that our primary variables of interestdisplay large dispersions. For example, in panel A of Table 1, our employmentrate percentage variable (EMPR) ranges from 98.67 percent to 68.06 percent,with a mean of 93.67 percent.
Exhibit 1 Variable definition
Variable Definition Source
EMPR Average employment percentage rate in the local marketover the sample period
BLS
SBAPOP Average per capita amount of new SBA 7(a) lending in thelocal market over the sample period
SBA, BLS
HERF Average deposit market Herfindahl over the sample period FDIC SUMD
PICAP Average per capita income in the local market over oursample period
BEA
MSADUM Dummy variable equal to 1 if local market is an MSA, 0otherwise
BEA
DEPPOP Average annual per capita bank deposits in the local marketover the sample period
FDIC SUMD
Notes: SBA is the Small Business Administration; FDIC SUMD is the Federal DepositInsurance Corporation, Summary of Deposit Data; BEA–Bureau of Economic Analysis;BLS is the Bureau of Labor Statistics; SBAPOP, PICAP, andDEPPOP are inflation-adjusted.EMPR is calculated by subtracting the local market unemployment percentage rate from 100.
Our per capita income variable (PICAP) has amean of $15,562 with a high of$36,772 and a low of $6,637, and a standard deviation of $3,080. Our localmarket deposits per capita variable (DEPPOP) also displays a wide range in
Government Intervention in Small-Firm Credit Market and Economic Performance 59
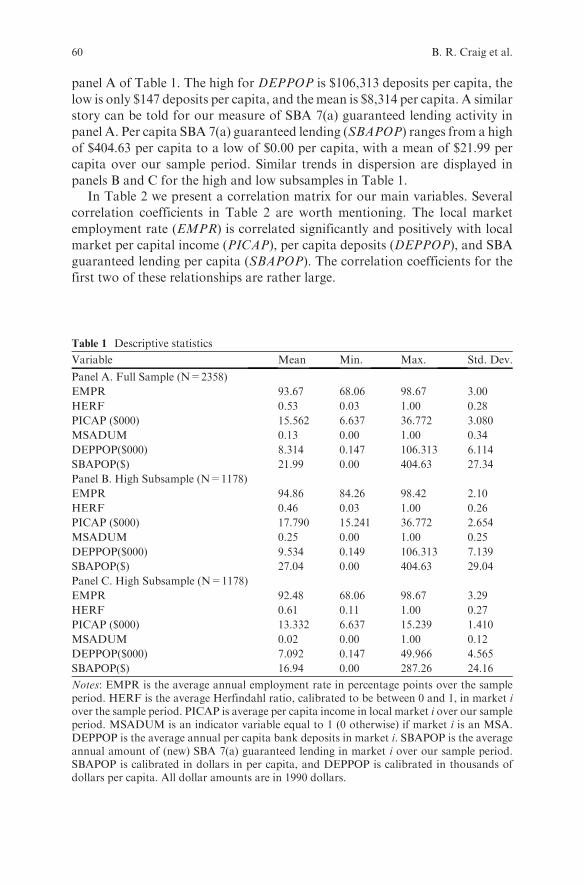
panel A of Table 1. The high for DEPPOP is $106,313 deposits per capita, the
low is only $147 deposits per capita, and themean is $8,314 per capita. A similar
story can be told for our measure of SBA 7(a) guaranteed lending activity in
panel A. Per capita SBA 7(a) guaranteed lending (SBAPOP) ranges from a high
of $404.63 per capita to a low of $0.00 per capita, with a mean of $21.99 per
capita over our sample period. Similar trends in dispersion are displayed in
panels B and C for the high and low subsamples in Table 1.In Table 2 we present a correlation matrix for our main variables. Several
correlation coefficients in Table 2 are worth mentioning. The local market
employment rate (EMPR) is correlated significantly and positively with local
market per capital income (PICAP), per capita deposits (DEPPOP), and SBA
guaranteed lending per capita (SBAPOP). The correlation coefficients for the
first two of these relationships are rather large.
Table 1 Descriptive statistics
Variable Mean Min. Max. Std. Dev.
Panel A. Full Sample (N=2358)
EMPR 93.67 68.06 98.67 3.00
HERF 0.53 0.03 1.00 0.28
PICAP ($000) 15.562 6.637 36.772 3.080
MSADUM 0.13 0.00 1.00 0.34
DEPPOP($000) 8.314 0.147 106.313 6.114
SBAPOP($) 21.99 0.00 404.63 27.34
Panel B. High Subsample (N=1178)
EMPR 94.86 84.26 98.42 2.10
HERF 0.46 0.03 1.00 0.26
PICAP ($000) 17.790 15.241 36.772 2.654
MSADUM 0.25 0.00 1.00 0.25
DEPPOP($000) 9.534 0.149 106.313 7.139
SBAPOP($) 27.04 0.00 404.63 29.04
Panel C. High Subsample (N=1178)
EMPR 92.48 68.06 98.67 3.29
HERF 0.61 0.11 1.00 0.27
PICAP ($000) 13.332 6.637 15.239 1.410
MSADUM 0.02 0.00 1.00 0.12
DEPPOP($000) 7.092 0.147 49.966 4.565
SBAPOP($) 16.94 0.00 287.26 24.16
Notes: EMPR is the average annual employment rate in percentage points over the sampleperiod. HERF is the average Herfindahl ratio, calibrated to be between 0 and 1, in market iover the sample period. PICAP is average per capita income in local market i over our sampleperiod. MSADUM is an indicator variable equal to 1 (0 otherwise) if market i is an MSA.DEPPOP is the average annual per capita bank deposits in market i. SBAPOP is the averageannual amount of (new) SBA 7(a) guaranteed lending in market i over our sample period.SBAPOP is calibrated in dollars in per capita, and DEPPOP is calibrated in thousands ofdollars per capita. All dollar amounts are in 1990 dollars.
60 B. R. Craig et al.
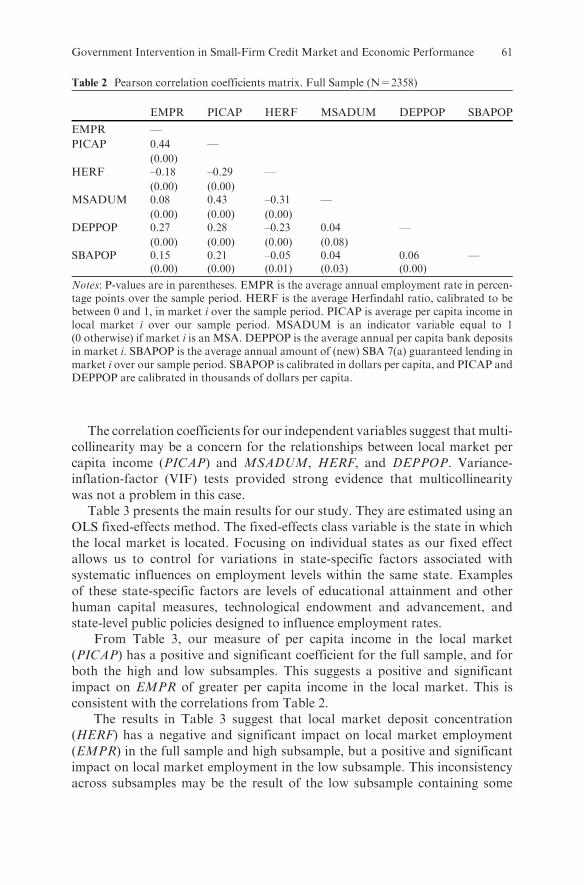
The correlation coefficients for our independent variables suggest that multi-collinearity may be a concern for the relationships between local market percapita income (PICAP) and MSADUM, HERF, and DEPPOP. Variance-inflation-factor (VIF) tests provided strong evidence that multicollinearitywas not a problem in this case.
Table 3 presents the main results for our study. They are estimated using anOLS fixed-effects method. The fixed-effects class variable is the state in whichthe local market is located. Focusing on individual states as our fixed effectallows us to control for variations in state-specific factors associated withsystematic influences on employment levels within the same state. Examplesof these state-specific factors are levels of educational attainment and otherhuman capital measures, technological endowment and advancement, andstate-level public policies designed to influence employment rates.
From Table 3, our measure of per capita income in the local market(PICAP) has a positive and significant coefficient for the full sample, and forboth the high and low subsamples. This suggests a positive and significantimpact on EMPR of greater per capita income in the local market. This isconsistent with the correlations from Table 2.
The results in Table 3 suggest that local market deposit concentration(HERF) has a negative and significant impact on local market employment(EMPR) in the full sample and high subsample, but a positive and significantimpact on local market employment in the low subsample. This inconsistencyacross subsamples may be the result of the low subsample containing some
Table 2 Pearson correlation coefficients matrix. Full Sample (N=2358)
EMPR PICAP HERF MSADUM DEPPOP SBAPOP
EMPR —
PICAP 0.44
(0.00)
—
HERF –0.18
(0.00)
–0.29
(0.00)
—
MSADUM 0.08
(0.00)
0.43
(0.00)
–0.31
(0.00)
—
DEPPOP 0.27
(0.00)
0.28
(0.00)
–0.23
(0.00)
0.04
(0.08)
—
SBAPOP 0.15(0.00)
0.21(0.00)
–0.05(0.01)
0.04(0.03)
0.06(0.00)
—
Notes: P-values are in parentheses. EMPR is the average annual employment rate in percen-tage points over the sample period. HERF is the average Herfindahl ratio, calibrated to bebetween 0 and 1, in market i over the sample period. PICAP is average per capita income inlocal market i over our sample period. MSADUM is an indicator variable equal to 1(0 otherwise) if market i is an MSA. DEPPOP is the average annual per capita bank depositsin market i. SBAPOP is the average annual amount of (new) SBA 7(a) guaranteed lending inmarket i over our sample period. SBAPOP is calibrated in dollars per capita, and PICAP andDEPPOP are calibrated in thousands of dollars per capita.
Government Intervention in Small-Firm Credit Market and Economic Performance 61

markets without banks, and thus a zero HERF. Such markets are likely to be
low employment rate markets.Observe in Table 3 that our measure of per capita bank deposits in the local
market (DEPPOP) has a positive and significant coefficient for the full sample,
and high and low subsamples. This suggests a positive and significant impact on
EMPR of more per capita deposits in the local financial market.To some extent, DEPPOP is a measure of cross-sectional local market
liquidity levels. A similar measure of liquidity was used by King and Levine
(1993a, 1993b) to proxy for the level of financial development across countries.
However, the issue of endogeneity is a concern for this variable. For it could be
argued that higher levels of employment cause higher levels of per capita bank
deposits as forcefully as it can be argued that higher levels of per capita bank
deposits cause higher levels of employment. As mentioned in the introduction,
however, recent studies including Jayartne and Strahan (1996), Rajan and
Table 3 OLS Fixed-effects regression estimation of (1)
Parameter Estimates and T-statistics
Variable Full Sample High Subsample Low Subsample
Intercept 86.99
(250.62)*
92.48
(221.41)*
79.22
(86.45)*PICAP 0.41
(19.76)*
0.13
(5.36)*
0.90
(14.05)*HERF –0.65
(–3.04)*
–0.81
(–3.41)*
0.69
(2.05)**MSADUM –1.17
(–6.43)*
–0.83
(–5.51)*
–2.43
(–3.46)*DEPPOP 0.07
(7.53)*
0.06
(7.37)*
0.11
(5.39)*SBAPOP 0.006
(3.13)*
0.003
(1.66)
0.008
(2.36)**Adj – R2 0.236 0.107 0.196
F- Statistic 144.29* 29.22* 58.39*
N= 2358 1178 1178
Notes: This table provides parameter estimates for (1): EMPRi ¼ a0 þ a1PICAPiþa2HERFi þ a3MSADUMi þ a4DEPPOPi þ a5SBAPOPi þ ei. EMPR is the averageannual employment rate in percentage points over the sample period. PICAP is average percapita income in local market i over our sample period. HERF is the averageHerfindahl ratio,calibrated to be between 0 and 1, in market i over the sample period. MSADUM is anindicator variable equal to 1 (0 otherwise) if market i is an MSA. DEPPOP is the averageannual per capita bank deposits in market i. SBAPOP is the average annual amount of (new)SBA 7(a) guaranteed lending in market i over our sample period. SBAPOP is calibrated indollars in per capita, and DEPPOP is calibrated in thousands of dollars per capita. This tableprovides estimates of (1) for the Full sample, the High subsample, and the Low subsample.The Low (High) subsample contacts those observations where PICAP is less (greater) than themedian PICAP for the Full sample. T-statistics are in parentheses.* indicates significant at the 1% level.**indicates significant at the 5% level.***indicates significant at the 10% level.
62 B. R. Craig et al.
Zingales (1998), andGuiso, Sapienza, and Zingales (2004), all report significantevidence supporting the proposition that the causal relationship runs frommore financial market development to better economic performance.
Our main variable of interest in Table 3 is SBAPOP. It has a positive andsignificant coefficient in the full sample and the low subsample, but not in thehigh subsample. This suggests that the positive and significant impact ofSBAPOP on EMPR in the full sample is driven by the positive and significantimpact of SBAPOP on EMPR in the low subsample. It also suggests that thereis a differential impact of SBAPOP on EMPR in the low subsample relative tothe high subsample. A t-test confirms that the coefficient on SBAPOP in thelow subsample is significantly larger (at the 1 percent level) than the coefficienton SBAPOP in the high subsample.
But even for the low subsample, the impact of SBAPOP on EMPR appearsto be economically small. For example, if you increased per capita SBA guar-anteed lending in a low subsample local market by two standard deviations(approximately $50), the predicted result is an increase in the level of employ-ment by 0.4 percentage points. Of course, this still may be a cost-effectivemethod of increasing employment relative to other policy tools.
Overall, the results from Table 3 suggest that per capita SBA 7(a) guaranteedlending is significantly and positively correlated with local market employmentrates. And, the impact of SBA guaranteed lending on the level of employment isgreater in financially less developed markets. These results lead to the rejectionof our null hypothesis. Recall that our null hypothesis, that the impact of SBA7(a) guaranteed lending on employment rates is not different in local marketsthat are relatively less financially developed.
Our results are also consistent with the notion that less developed financialmarkets benefit relatively more from governmental interventions in small-firmcredit markets. This relatively higher benefit is consistent with a credit-rationingargument such as that offered by Stiglitz and Weiss (1981), in which the inter-vention serves to ameliorate a market failure in the small-firm credit market. Asin Jackson, Craig, andThomson (2007a), these results also suggest that SBA7(a)guaranteed lending will have a larger positive impact on social welfare if it istargeted to certain financially less developed (or lower-income) areas.
6 Conclusion
In our previous research (Craig, Jackson, and Thomson, 2007b), we found thatSBA guaranteed lending in the aggregate had a larger positive influence on low-income markets. However, Craig, Jackson, and Thomson (2007b) did notinvestigate whether this positive relationship between SBA guaranteed lendingand economic performance in low-income markets was primarily the result ofSBA’s main guaranteed lending program—the 7(a) program. As in Craig,Jackson, and Thomson (2007b), we use the level of labor market employment,or the employment rate, as our measure of economic performance. And we test
Government Intervention in Small-Firm Credit Market and Economic Performance 63
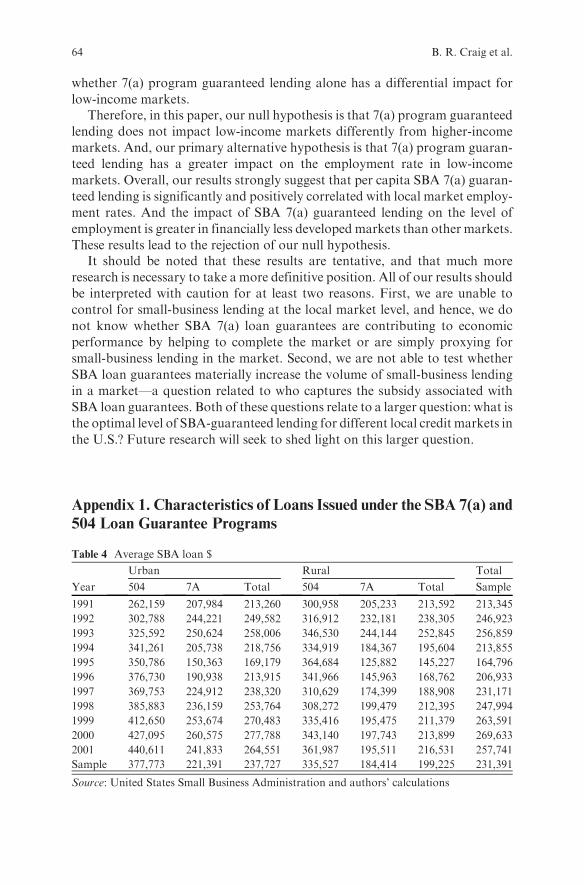
whether 7(a) program guaranteed lending alone has a differential impact for
low-income markets.Therefore, in this paper, our null hypothesis is that 7(a) program guaranteed
lending does not impact low-income markets differently from higher-income
markets. And, our primary alternative hypothesis is that 7(a) program guaran-
teed lending has a greater impact on the employment rate in low-income
markets. Overall, our results strongly suggest that per capita SBA 7(a) guaran-
teed lending is significantly and positively correlated with local market employ-
ment rates. And the impact of SBA 7(a) guaranteed lending on the level of
employment is greater in financially less developed markets than other markets.
These results lead to the rejection of our null hypothesis.It should be noted that these results are tentative, and that much more
research is necessary to take a more definitive position. All of our results should
be interpreted with caution for at least two reasons. First, we are unable to
control for small-business lending at the local market level, and hence, we do
not know whether SBA 7(a) loan guarantees are contributing to economic
performance by helping to complete the market or are simply proxying for
small-business lending in the market. Second, we are not able to test whether
SBA loan guarantees materially increase the volume of small-business lending
in a market—a question related to who captures the subsidy associated with
SBA loan guarantees. Both of these questions relate to a larger question: what is
the optimal level of SBA-guaranteed lending for different local credit markets in
the U.S.? Future research will seek to shed light on this larger question.
Appendix 1. Characteristics of Loans Issued under the SBA 7(a) and
504 Loan Guarantee Programs
Table 4 Average SBA loan $
Urban Rural Total
Year 504 7A Total 504 7A Total Sample
1991 262,159 207,984 213,260 300,958 205,233 213,592 213,345
1992 302,788 244,221 249,582 316,912 232,181 238,305 246,923
1993 325,592 250,624 258,006 346,530 244,144 252,845 256,859
1994 341,261 205,738 218,756 334,919 184,367 195,604 213,855
1995 350,786 150,363 169,179 364,684 125,882 145,227 164,796
1996 376,730 190,938 213,915 341,966 145,963 168,762 206,933
1997 369,753 224,912 238,320 310,629 174,399 188,908 231,171
1998 385,883 236,159 253,764 308,272 199,479 212,395 247,994
1999 412,650 253,674 270,483 335,416 195,475 211,379 263,591
2000 427,095 260,575 277,788 343,140 197,743 213,899 269,633
2001 440,611 241,833 264,551 361,987 195,511 216,531 257,741
Sample 377,773 221,391 237,727 335,527 184,414 199,225 231,391
Source: United States Small Business Administration and authors’ calculations
64 B. R. Craig et al.

Table 5 Total SBA loans ($000)
Urban Rural Total
Year 504 7A Total 504 7A Total Sample
1991 168,044 1,235,636 1,403,680 58,687 418,265 476,952 1,880,632
1992 380,301 3,043,969 3,424,270 96,975 912,007 1,008,982 4,433,252
1993 564,577 3,978,656 4,543,233 148,315 1,125,014 1,273,329 5,816,562
1994 1,015,593 5,761,698 6,777,291 207,985 1,419,439 1,627,423 8,404,715
1995 1,165,310 4,821,247 5,986,557 234,127 916,799 1,150,926 7,137,483
1996 1,727,682 6,204,515 7,932,197 269,811 874,902 1,144,713 9,076,910
1997 1,219,816 7,273,196 8,493,012 199,424 939,313 1,138,736 9,631,748
1998 1,464,425 6,725,796 8,190,221 191,437 919,600 1,111,037 9,301,258
1999 1,521,028 7,908,288 9,429,316 175,423 797,344 972,767 10,402,083
2000 1,319,722 6,984,461 8,304,183 166,766 768,827 935,593 9,239,776
2001 1,238,118 5,266,396 6,504,514 185,699 694,065 879,765 7,384,279
Sample 11,784,617 59,203,858 70,988,475 1,934,647 9,785,575 11,720,223 82,708,698
Source: United States Small Business Administration and authors’ calculations
Table 6 Total number of SBA loans
Urban Rural Total
Year 504 7A Total 504 7A Total Sample
1991 641 5,941 6,582 195 2,038 2,233 8,815
1992 1,256 12,464 13,720 306 3,928 4,234 17,954
1993 1,734 15,875 17,609 428 4,608 5,036 22,645
1994 2,976 28,005 30,981 621 7,699 8,320 39,301
1995 3,322 32,064 35,386 642 7,283 7,925 43,311
1996 4,586 32,495 37,081 789 5,994 6,783 43,864
1997 3,299 32,338 35,637 642 5,386 6,028 41,665
1998 3,795 28,480 32,275 621 4,610 5,231 37,506
1999 3,686 31,175 34,861 523 4,079 4,602 39,463
2000 3,090 26,804 29,894 486 3,888 4,374 34,268
2001 2,810 21,777 24,587 513 3,550 4,063 28,650
Sample 31,195 267,418 298,613 5,766 53,063 58,829 357,442
Source: United States Small Business Administration and authors’ calculations
References
Bergstrom, F. (2000). ‘‘Capital Subsidies and the Performance of Firms,’’ Small BusinessEconomics, 14(3), 183–193.
Berger, A.N., W.S. Frame, and N. Miller. (2005). ‘‘Credit Scoring and the Availability, Price,and Risk of Small-Business Credit,’’ Journal of Money, Credit, and Banking, 37, 191–222.
Berger, Allen N., and W. Scott Frame. (2007). ‘‘Small-Business Credit Scoring and CreditAvailability,’’ Journal of Small Business Management, 45(1), 5–22.
Berger, A.N., and G.F. Udell. (1995). ‘‘Relationship Lending and Lines of Credit in Small-Firm Finance,’’ Journal of Business, 68(3), 351–381.
Calem, P.S., and G.A. Carlino. (1991). ‘‘The Concentration/Conduct Relationship in BankDeposit Markets,’’ Review of Economics and Statistics, 73, 268–276.
Government Intervention in Small-Firm Credit Market and Economic Performance 65
Cowling, M., and P. Mitchell. (2003). ‘‘Is the Small-Firms Loan Guarantee Scheme Hazar-dous for Banks or Helpful to Small Business?’’, Small Business Economics, 21, 63–71.
Craig, B.R., W.E. Jackson III, and J.B. Thomson. (2004). ‘‘Are SBA Loan GuaranteesDesirable?’’, Economic Commentary, Federal Reserve Bank of Cleveland, 15 September.
Craig, B.R., W.E. Jackson III, J.B. Thomson. (2005). ‘‘The Role of Relationships in Small-Business Lending,’’ Economic Commentary, Federal Reserve Bank of Cleveland,15 October.
Craig, B.R.,W.E. Jackson III, and J.B. Thomson. (2007a). ‘‘SBA-LoanGuarantees andLocalEconomic Growth,’’ Journal of Small Business Management, 45, 116–132.
Craig, B.R., W.E. Jackson III, and J.B. Thomson. (2007b). ‘‘Credit Market Failure Interven-tion: Do Government-Sponsored Small-Business Credit Programs Enrich Poorer Areas?’’Small Business Economics (forthcoming), DOI 10.1007/s11187–007–9050–5.
Craig, B.R., and J.B. Thomson. (2003). ‘‘Federal Home Loan Bank Lending to CommunityBanks: Are Targeted Subsidies Desirable?’’ Journal of Financial Services Research 23(1),5–28.
Frame, W.S., A. Srinivasan, and L. Woosley (2001). ‘‘The Effect of Credit Scoring on SmallBusiness Lending,’’ Journal of Money, Credit, and Banking, 33, 813–825.
Frame, W.S., M. Padhi, and L. Woolsey. (2004). ‘‘The Effect of Credit Scoring on SmallBusiness Lending in Low- and Moderate Income Areas,’’ Financial Review, 39, 35–54.
E.M. Kauffman Foundation. (2004a). Kauffman Thought book 2004, Kauffman Foundation,Kansas City, Missouri.
Guiso, Luigi, Sapienza, Paola, and Zingales, Luigi, (2004). ‘‘Does Local Financial Develop-ment Matter?’’ Quarterly Journal of Economics, 119, 929–969.
Jackson, W.E. III. (1992a). ‘‘The Price-Concentration Relationship in Banking: A Com-ment,’’ Review of Economics and Statistics, 74, 373–376.
Jayartne, J., and P.E. Strahan (1996). ‘‘The Finance-Growth Nexus: Evidence From BankBranch Deregulation,’’ Quarterly Journal of Economics, 111(3), 639–670.
Kane, E.J., and B.G.Malkiel (1965). ‘‘Bank Portfolio Allocation, Deposit Variability, and theAvailability Doctrine,’’ Quarterly Journal of Economics, 79(1), 113–134.
Kane, E.J. (1977). ‘‘Good Intentions and Unintended Evil: The Case Against Selective CreditAllocation,’’ Journal of Money, Credit and Banking, 9(1), 55–69.
King, R.G., and R. Levine (1993a). ‘‘Finance and Growth: Schumpeter Might be Right,’’Quarterly Journal of Economics, 108(3): 717–737.
King, R.G., and R. Levine (1993b). ‘‘Finance, Entrepreneurship, and Growth: Theory andEvidence,’’ Journal of Monetary Economics, 32(3), 513–542.
Myers, S.C., and N.S. Majluf (1984). ‘‘Corporate Financing and Investment Decisions whenFirms have Information that Investors do not have,’’ Journal of Financial Economics, 13,187–221.
Petersen, Mitchell, A., and R.G. Rajan. (1994). ‘‘The Benefits of Lending Relationships:Evidence from Small-Business Data,’’ Journal of Finance, 49(1), 3–37.
Petersen, M.A., and R.G. Rajan. (1995). ‘‘The Effect of Credit Market Competition onLending Relationships,’’ Quarterly Journal of Economics, 110(2), 407–443.
Rajan, R.G. and L. Zingales. (1998). ‘‘Financial Dependence and Growth,’’ American Eco-nomic Review, 88(3), 559–586.
Robinson, J. (1952). The Generalization of the General Theory: The Rate of Interest and OtherEssays. Macmillan Press, London.
SBA. (2005). Small and Micro Business Lending for 2003–2004, U.S. Small Business Admin-istration, Office of Advocacy, November 2005, Report No. 266.
SBA. (2006a).Web page for Small Business Administration, September 18, 2006. www.sba.gov.Schumpeter, J. (1911). A Theory of Economic Development. Harvard University Press,
Cambridge, Massachusetts.Shaffer, S. (1994). ‘‘ Bank Competition in Concentrated Markets,’’ Business Review,Federal
Reserve Bank of Philadelphia, 3–16.
66 B. R. Craig et al.

Shaffer, S., (2004). ‘‘Patterns of Competition in Banking,’’ Journal of Economics and Business,56, 287–313.
Stein, Jeremy C., 2002, Information Production and Capital Allocation: Decentralized versusHierarchical Firms Journal of Finance, 57(5), 1891–1921.
Stiglitz, J.E., and A. Weiss. (1981). ‘‘Credit Rationing in Markets with Imperfect Informa-tion,’’ American Economic Review, 71(3), 393–410.
Todd, W.F. (1992). ‘‘History of and Rationales for the Reconstruction Finance Corporation,Federal Reserve Bank of Cleveland,’’ Economic Review (4th Quarter), 22–35.
Wennekers, S., and R. Thurik. (1999). ‘‘Linking Entrepreneurship and Economic Growth,’’Small Business Economics, 13(1), 27–55.
Government Intervention in Small-Firm Credit Market and Economic Performance 67

Stumbling Blocks to Entrepreneurship
in Low- and Moderate-Income Communities
James R. Barth, Glenn Yago, and Betsy Zeidman
1 Introduction
There is growing and widespread interest among policy makers at all levels ofgovernment to promote entrepreneurial-friendly environments and entrepre-neurship in terms of both self-employment and business ownership. The interestis motivated by a substantial body of research indicating that entrepreneursspur the diffusion and implementation of innovative ideas, thereby creating newproducts, services, and markets. In addition, and perhaps more importantly,entrepreneurs contribute, whether through self-employment or the establish-ment of small businesses, to job formation and economic growth and develop-ment. Moreover, some consider self-employment a route out of poverty or offthe unemployment rolls, especially for people encountering discrimination inthe labor market. Self-employment can also be a way to increase one’s earnings.All these factors play a role in governmental efforts to foster entrepreneurship,in terms of both self-employment and business ownership, particularly in low-and moderate-income communities.
Although evidence demonstrating the importance of entrepreneurship forincreasing social welfare might be strong, the most important determinants ofentrepreneurship are uncertain, and, therefore, so are policies that best supportentrepreneurial activity. This uncertainty is twofold: it is not known fully whysome individuals become entrepreneurs, while others become wage or salaryworkers; and factors most responsible for enabling or preventing a would-beentrepreneur from becoming self-employed or establishing a business are unclear.Researchers have studied both of these issues have been studied, but, so far, havefailed to reach a consensus that provides a true roadmap to meaningful policyactions.
The purpose of this paper is to explore several aspects of the various recenteffortsmade to understand better whatworks best at promoting entrepreneurship
James R. BarthMilken [email protected]
G. Yago et al. (eds.), Entrepreneurship in Emerging Domestic Markets.� Milken Institute 2008
69

throughout the United States, especially in the low- and moderate-income com-munities. Our approach is to rely mainly on the work of other researchers, butalso to make a modest attempt to contribute to the knowledge in the field.
In the next section, we briefly discuss the importance of entrepreneurialactivity’s contribution to economic growth and development, and, morebroadly, social welfare. The third section focuses on the commitment of finan-cial institutions to channel loans to businesses in low- and moderate-incomecommunities. The fourth section focuses on a newly constructed measure of‘‘loan bias’’ in these communities. The fifth section focuses on databases avail-able to study entrepreneurship, empirical studies that have examined severalways to determine entrepreneurial activity, and potential barriers to entrepre-neurship. The section also identifies inconsistencies in findings, and the lack ofcommon data sources that undermine the confidence one can have in anyproposed policy actions to foster greater entrepreneurship. The sixth sectiondiscusses regulatory measures that might impede the development of greaterentrepreneurial activity.
The 7th section changes pace, and discusses an alternative approach toidentifying factors that help explain the differences in entrepreneurial activityacross geographical regions. The approach is to focus on how business sizediffers in different regions of the country, based upon the notion that relativelysmaller firms are breeding grounds for the expression of the entrepreneurialspirit, no matter where they are located. The 8th and last section provides asummary and conclusions.
2 Overview of the Importance of Entrepreneurship
Economic theory is not clear about how to classify entrepreneurs from otherworkers. For example, Kihlstrom and Laffont (1979, p.720) develops a theore-tical model and find that ‘‘. . .less risk-averse individuals become entrepreneurs,while the more risk-averse work as laborers.’’ Lucas (1978, p.510) constructs amodel in which ‘‘each member of the work force is endowed with a ‘‘talent formanaging’’ [that] varies across workers.’’ Thus, either innate differences inattitudes toward risk or talents for managing are key to why some individualsare entrepreneurs and others paid workers. More generally, as Holtz-Eakin andRosen (1994a, p.338) state, ‘‘In the nonstatistical literature . . . entrepreneurs arecharacterized in terms of their daring, risk-taking, animal spirits, and so on. . ..’’People who study entrepreneurship empirically, however, require a more con-crete way in which to identify entrepreneurs, a way that quantifies variousfactors that might help explain differences in the degree of entrepreneurshipover time and across geographical regions.
In this regard, ThomasHoening (2005, p.2), president of the Federal ReserveBank of Kansas City, suggests that the entrepreneur is someone who recognizes‘‘. . . the potential of new ideas, designs applications, develops new products,
70 J. R. Barth et al.
and successfully brings these products to markets.’’ Based on this definition,individuals who are self-employed or own relatively small businesses could beconsidered entrepreneurs. At the very least, they are entrepreneurial enough tobring products and services to the marketplace. Indeed, among the empiricalstudies of entrepreneurship, Evans and Leighton (1989), Blanchflowerand Oswald (1998), and Fairlie (1999) use self-employment to define entrepre-neurs; Gentry and Hubbard (2004) uses business ownership; Meyer (1990) usesboth self-employment and business ownership status; and Holtz-Eakin, Joul-faian, and Rosen (1994a,b) uses filers of IRS form 1040 schedule C to defineentrepreneurs.
Tables 1 and 2 offer data on the economic impact of entrepreneurship.Table 1 shows that small businesses are extremely important for employmentand economic growth. Specifically, it reveals that small businesses (thosewith fewer than 500 employees) account for 99 percent of all firms in theUnited States, 86 percent of all establishments, 50 percent of total employ-ment, 45 percent of annual payroll, and 39 percent of total receipts. Enter-prises with zero to five employees account for 47 percent of all firms and37 percent of all establishments.1 These firms, not surprisingly, account foronly 5 percent of employment and 4 percent of annual payroll and receipts.But from these small firms, through the process of ‘‘creative destruction,’’come the far bigger organizations that help sustain the dynamic process ofjob creation and economic development. Indeed, ‘‘. . . over the past decade,small firms have provided 60–80 percent of the net new jobs in the economy,and . . . almost all of these net new jobs stem from startups in the first twoyears of operation’’ (U.S. Small Business Administration Office of Advocacyand The Ewing Marion Kauffman Foundation, 2004). Furthermore, Acsand Armington (2004) empirically finds that a higher ratio of entrepreneurialactivity is associated strongly with faster growth of local economies. It is,therefore, incumbent upon policymakers concerned with growth andemployment not to erect barriers to the establishment and operation ofsmall businesses.
Table 2 provides a somewhat broader view of the role of small business in theeconomy because it includes the self-employed. But it also sounds a note ofcaution regarding the race, ethnicity, and gender of owners of firms. It isimportant for social welfare that all races, ethnicities, and genders are providedthe opportunity to become self-employed or small business owners. Recentdemographic data showing the growing importance of different social andethnic groups in the total population underscore this fact. Table 2 raises theissue of whether this opportunity is available to individuals in all these groups.It shows the ownership distribution of firms based upon/different demographic
1 Firms can contain multiple establishments, defined by the U.S. Census Bureau as a ‘‘singlephysical location at which business is conducted.’’ See Appendix 2 for definitions of these andother terms frequently used in studies of entrepreneurship.
Stumbling Blocks to Entrepreneurship in Low- and Moderate-Income Communities 71
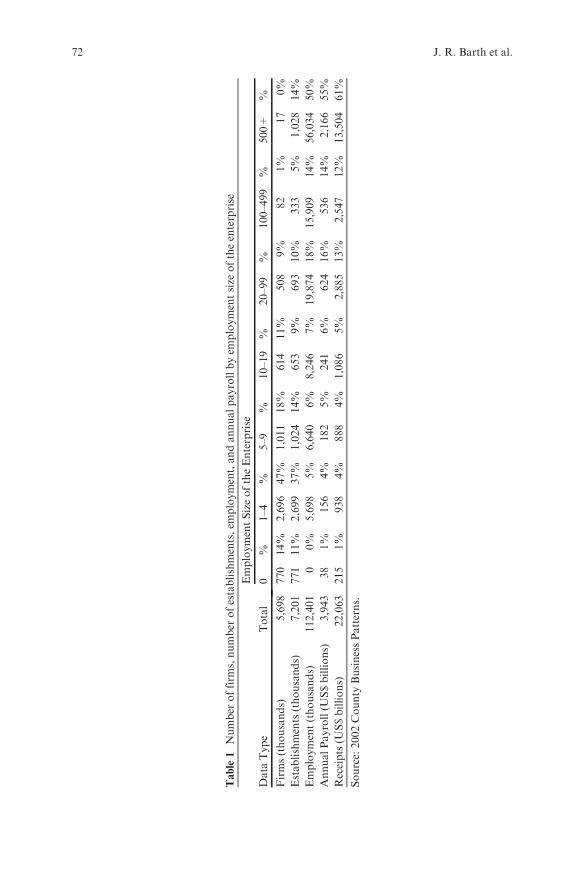
Table1
Number
offirm
s,number
ofestablishments,em
ployment,andannualpayrollbyem
ploymentsize
oftheenterprise
Data
Type
Total
EmploymentSizeoftheEnterprise
0%
1–4
%5–9
%10–19
%20–99
%100–499
%500+
%
Firms(thousands)
5,698
770
14%
2,696
47%
1,011
18%
614
11%
508
9%
82
1%
17
0%
Establishments(thousands)
7,201
771
11%
2,699
37%
1,024
14%
653
9%
693
10%
333
5%
1,028
14%
Employment(thousands)
112,401
00%
5,698
5%
6,640
6%
8,246
7%
19,874
18%
15,909
14%
56,034
50%
AnnualPayroll(U
S$billions)
3,943
38
1%
156
4%
182
5%
241
6%
624
16%
536
14%
2,166
55%
Receipts(U
S$billions)
22,063
215
1%
938
4%
888
4%
1,086
5%
2,885
13%
2,547
12%
13,504
61%
Source:2002County
BusinessPatterns.
72 J. R. Barth et al.
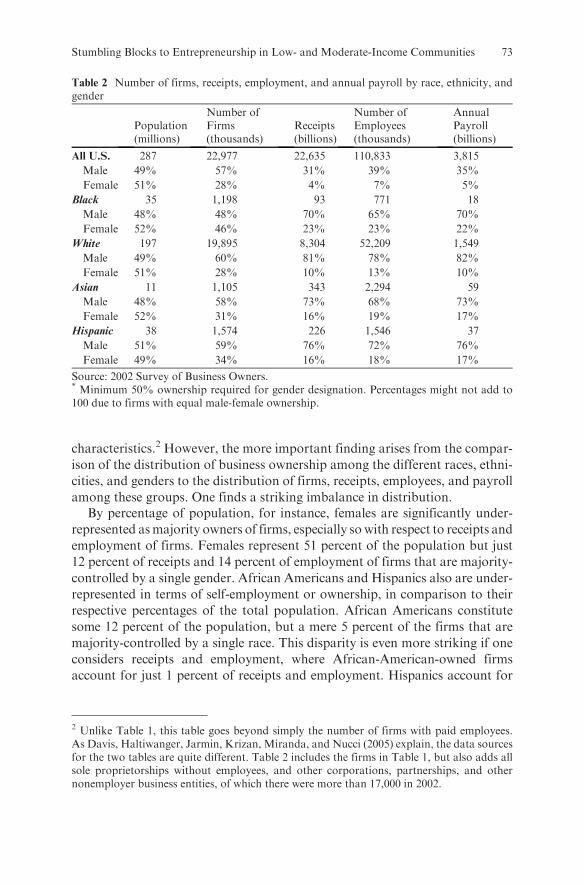
characteristics.2 However, the more important finding arises from the compar-
ison of the distribution of business ownership among the different races, ethni-
cities, and genders to the distribution of firms, receipts, employees, and payroll
among these groups. One finds a striking imbalance in distribution.By percentage of population, for instance, females are significantly under-
represented asmajority owners of firms, especially sowith respect to receipts and
employment of firms. Females represent 51 percent of the population but just
12 percent of receipts and 14 percent of employment of firms that are majority-
controlled by a single gender. African Americans and Hispanics also are under-
represented in terms of self-employment or ownership, in comparison to their
respective percentages of the total population. African Americans constitute
some 12 percent of the population, but a mere 5 percent of the firms that are
majority-controlled by a single race. This disparity is even more striking if one
considers receipts and employment, where African-American-owned firms
account for just 1 percent of receipts and employment. Hispanics account for
Table 2 Number of firms, receipts, employment, and annual payroll by race, ethnicity, andgender
Population(millions)
Number ofFirms(thousands)
Receipts(billions)
Number ofEmployees(thousands)
AnnualPayroll(billions)
All U.S. 287 22,977 22,635 110,833 3,815
Male 49% 57% 31% 39% 35%
Female 51% 28% 4% 7% 5%
Black 35 1,198 93 771 18
Male 48% 48% 70% 65% 70%
Female 52% 46% 23% 23% 22%
White 197 19,895 8,304 52,209 1,549
Male 49% 60% 81% 78% 82%
Female 51% 28% 10% 13% 10%
Asian 11 1,105 343 2,294 59
Male 48% 58% 73% 68% 73%
Female 52% 31% 16% 19% 17%
Hispanic 38 1,574 226 1,546 37
Male 51% 59% 76% 72% 76%
Female 49% 34% 16% 18% 17%
Source: 2002 Survey of Business Owners.* Minimum 50% ownership required for gender designation. Percentages might not add to100 due to firms with equal male-female ownership.
2 Unlike Table 1, this table goes beyond simply the number of firms with paid employees.As Davis, Haltiwanger, Jarmin, Krizan, Miranda, and Nucci (2005) explain, the data sourcesfor the two tables are quite different. Table 2 includes the firms in Table 1, but also adds allsole proprietorships without employees, and other corporations, partnerships, and othernonemployer business entities, of which there were more than 17,000 in 2002.
Stumbling Blocks to Entrepreneurship in Low- and Moderate-Income Communities 73

13 percent of the population but just 7 percent of firms, and 3 percent of receiptsand employment. In contrast, AsianAmericans represent shares of firm employ-ment and receipts in approximate parity to their share of the population, and ashare of firm numbers higher than their share of population.
This information raises important questions about potential impediments, ifnot downright barriers, to self-employment and business ownership for indivi-duals in several demographic groups. It also suggests, however, that thesepotential obstacles might be less important, if not unimportant, for at leastone minority group. The fact that many individuals from these demographicgroups live in low- and moderate-income communities heightens the impor-tance of such concerns. The reason, of course, is that to limit the opportunitiesof these individuals to become self-employed or establish small businesses is tolimit the opportunities of a large and increasing portion of the U.S. populationto grow and prosper through entrepreneurship. One of the limiting factors mostfrequently mentioned is lack of access to capital. We explore this issue further inthe next section.
3 Potential Stumbling Blocks to Entrepreneurial Activity
in Low- and Moderate-Income Communities
Many studies of the determinants of entrepreneurship conclude that a majorbarrier to entrepreneurship (i.e., self-employment or establishing a small business)is lack of access to funds, commonly called ‘‘liquidity constraints.’’ The enactmentof the Community Reinvestment Act (CRA) of 1977, however, requires thatbanks channel a portion of their funds to the communities in which they arelocated. Appendix 1 shows the percentage of the population in each of the 280Metropolitan Statistical Areas (MSAs) represented by low- and moderate-income3 (LMI) individuals, and the percentage of the total dollar amount ofloans made to businesses in these communities by banks under CRA4 in 2000. Itis important to note, however, that only banks with assets of greater than$250 million were required to report under CRA in 2000 (this minimum wasincreased to $1 billion in 2005). Reporting banks, moreover, are required toreport data only on loans of $1 million or less. For these reasons, CRA datacan be viewed as information on the small-business lending of banks that
3 According to the U.S. Census Bureau, low-income individuals in a given MSA are peoplewith annual income of 50 percent or less of that MSA’s median income, and low- andmoderate-income individuals are people with incomes 80 percent or less of the median incomein that MSA.4 Low-income communities are census tracts in which the median family income is less than50 percent of the MSA median family income. The low- and moderate-incomes categorycomprises census tracts in which the median family income of the census tract is less than80 percent of the MSA median family income.
74 J. R. Barth et al.
accounted for more than 90 percent of total bank assets and business loansin 2000.5
In addition, for our analysis in this section, we assume that LMI individualslive mainly in LMI census tracts, rather than being randomly located through-out the census tracts in MSAs. This is plausible given that the U.S. CensusBureau notes that census tracts are ‘‘designed to be relatively homogeneousunits with respect to population characteristics, economic status, and livingconditions.’’
It is quite clear that the distribution of the LMI population as a percentage ofan MSA’s total population varies substantially across the MSAs–the mean is40 percent and the standard deviation is 0.03 percent. The shares range from ahigh of 49 percent in Yolo, California, to a low of 34 percent in Jacksonville,North Carolina. Bank loans made by reporting banks to businesses in the LMIcommunities as a percentage of the total dollar amount of bank loans made inthese MSAs varies even more—the mean is 23 percent and the standard devia-tion is 0.10 percent. These figures range from a high of 54 percent in DesMoines, Iowa, to a low of 0.2 percent in Dover, Delaware. It is interestingthat the mean share of loans made to businesses in LMI communities is sub-stantially lower than the mean of the LMI population as a share of the totalpopulation. Indeed, it is more than 40 percent lower.
When one focuses on just low-income (LI) communities, one finds that theshare of the total population in MSAs accounted for by the LI segment rangesfrom a high of 32 percent in Yolo, California, to a low of 16 percent in Jackson-ville, North Carolina. The mean is 23 percent and the standard deviation is0.03 percent. At the same time, the share of the total dollar amount of loansmade by reporting banks to businesses in LI communities ranges from a high of28 percent in Sioux City, Iowa-Nebraska, to a low of 0 percent in each of forty-five MSAs. The mean share of loans made to businesses in LI communities is amere 6 percent (75 percent lower than themean of the LI population as a share ofthe total population), and the standard deviation is 0.05 percent–the latter figurequite lower than the variation of the share of loans made to businesses in LMIcommunities.
The idea of parity between share of population and share of business activityseems to appeal to some commentators on entrepreneurship, particularly withrespect to entrepreneurship in minority populations. This is apparent in TheState of Minority Business Enterprises(MBDA, 2006), which notes that ‘‘Min-ority-owned business activity . . . continues to be significantly smaller thanminority representation of the nation’s population.’’ It describes this deviationfrom parity, moreover, as an ‘‘opportunity gap.’’ In the next section we con-struct a measure that reflects this view of the relationship (to an economist,
5 The CRA data, however, are not without limitations: loans may be made to a firm with anaddress in an LMI community, but the proceeds are used to fund operations, in the case of afirm with multiple establishments, outside LMI communities.
Stumbling Blocks to Entrepreneurship in Low- and Moderate-Income Communities 75

perhaps naıve) between share of population and share of business activity; thelatter is represented here by business loans from banks reporting under CRA.
In this view, the ideal world is one in which the shares of the total dollaramount of loans made to businesses in the LMI communities in every MSAwould match one-for-one the shares of the total population in the MSAsaccounted for by low- and moderate-income individuals. The world is far fromperfect based upon such a view. The difference between the LMI share ofpopulation and share of loans made to businesses in LMI communities variesfrom a high of 42 percentage points for Dover, Delaware (an MSA with 42 per-cent LMI individuals and 0 percent of total loans going to businesses in LMIcommunities), to a low of a negative 18 percentage points for DesMoines, Iowa(anMSAwith 36 percent LMI individuals and 54 percent of total loans going tobusinesses in LMI communities). Moreover, there are just nineteenMSAs out ofa total of 280 for which we have data (just 7 percent) where the difference is 0 orless. The difference between the LI share of population and share of loans tobusinesses in LI communities varies from a high of 31 percent for Yolo,California (an MSA with 31 percent LI individuals and 0 percent of total loansgoing to businesses in LI communities), to a low of a negative 5 percentage pointsfor Sioux City, Iowa-Nebraska (an MSA with 22 percent LI individuals and27 percent of total loans going to businesses in LMI communities).
Table 3 shows the pairwise correlations between the LI and LMI shares ofpopulation, and the LI and LMI shares of loans, both in terms of numbers andamounts. The LI share of the population is correlated significantly and posi-tively with the LI shares of numbers and amounts of loans. The correlations,however, are quite low. With regard to the LMI share of population and theLMI share of loans either in terms of numbers or amounts, the correlation isalso positive and significant, although quite low. According to the naıve viewdescribed above, all the correlations would have been positive and one.
4 A Measure of Low- and Moderate-Income ‘‘Loan Bias’’
Another way to view the data in the previous section is in terms of an LI andLMI community ‘‘loan bias’’ based on the naıve view of an ideal world describednoted above, where the share of total loans to businesses in LI (LMI) commu-nities would be equal to the share of the total population represented byLI (LMI) individuals for every MSA. We choose to use the term ‘‘loan bias’’not in a pejorative sense, but to demonstrate that what might appear initially tobe bias to some people might require closer examination and interpretation.Appendix 1 presents a measure of the LI and LMI loan bias for each of theMSAs. It is calculated as 1 minus the ratio of the LI (LMI) share of the totalamount of loans in anMSA to the LI (LMI) share of the total population in thatMSA.A value of 0 would indicate no loan bias, while a value of 1 would indicatemaximum loan bias. The LI loan bias ranges from 1 to –0.26. Forty-threeMSAs
76 J. R. Barth et al.
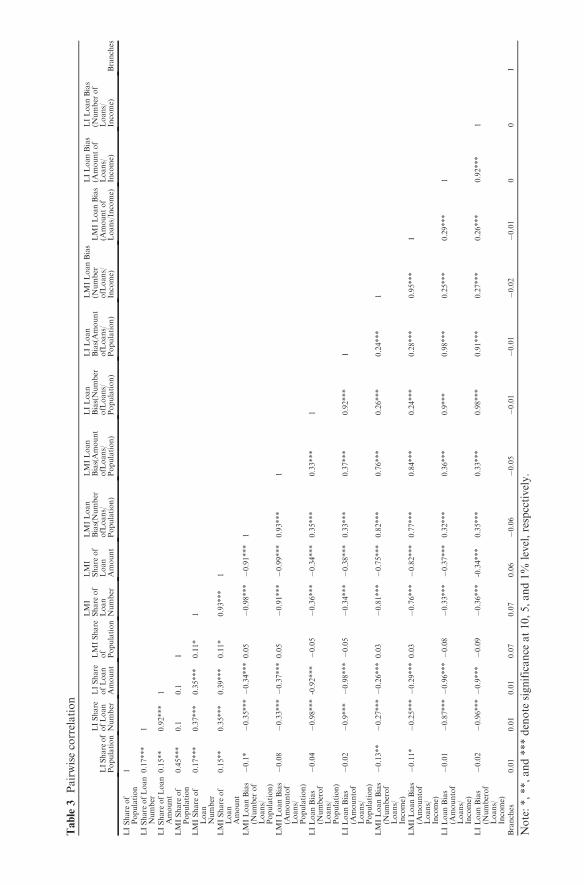
Table3
Pairwisecorrelation
LIShare
of
Population
LIShare
ofLoan
Number
LIShare
ofLoan
Amount
LMIShare
of
Population
LMI
Share
of
Loan
Number
LMI
Share
of
Loan
Amount
LMILoan
Bias(Number
ofLoans/
Population)
LMILoan
Bias(Amount
ofLoans/
Population)
LILoan
Bias(Number
ofLoans/
Population)
LILoan
Bias(Amount
ofLoans/
Population)
LMILoanBias
(Number
ofLoans/
Income)
LMILoanBias
(Amountof
Loans/Income)
LILoanBias
(Amountof
Loans/
Income)
LILoanBias
(Number
of
Loans/
Income)
Branches
LIShare
of
Population
1
LIShare
ofLoan
Number
0.17***
1
LIShare
ofLoan
Amount
0.15**
0.92***
1
LMIShare
of
Population
0.45***
0.1
0.1
1
LMIShare
of
Loan
Number
0.17***
0.37***
0.35***
0.11*
1
LMIShare
of
Loan
Amount
0.15**
0.35***
0.39***
0.11*
0.93***
1
LMILoanBias
(Number
of
Loans/
Population)
�0.1*
�0.35***�0.34***
0.05
�0.98***�0.91***
1
LMILoanBias
(Amountof
Loans/
Population)
�0.08
�0.33***�0.37***
0.05
�0.91***�0.99***
0.93***
1
LILoanBias
(Numberof
Loans/
Population)
�0.04
�0.98***
-0.92***�0.05
�0.36***�0.34***
0.35***
0.33***
1
LILoanBias
(Amountof
Loans/
Population)
�0.02
�0.9***�0.98***�0.05
�0.34***�0.38***
0.33***
0.37***
0.92***
1
LMILoanBias
(Numberof
Loans/
Income)
�0.13**
�0.27***�0.26***
0.03
�0.81***�0.75***
0.82***
0.76***
0.26***
0.24***
1
LMILoanBias
(Amountof
Loans/
Income)
�0.11*
�0.25***�0.29***
0.03
�0.76***�0.82***
0.77***
0.84***
0.24***
0.28***
0.95***
1
LILoanBias
(Amountof
Loans/
Income)
�0.01
�0.87***�0.96***�0.08
�0.33***�0.37***
0.32***
0.36***
0.9***
0.98***
0.25***
0.29***
1
LILoanBias
(Numberof
Loans/
Income)
�0.02
�0.96***�0.9***�0.09
�0.36***
-0.34***
0.35***
0.33***
0.98***
0.91***
0.27***
0.26***
0.92***
1
Branches
0.01
0.01
0.01
0.07
0.07
0.06
�0.06
�0.05
�0.01
�0.01
�0.02
�0.01
00
1
Note:*,**,and***denote
significance
at10,5,and1%
level,respcctively.
have a LI score of 1,meaning businesses in the low-income communities receivednone of the loans banks made under CRA in these MSAs. Four MSAs havescores less than 0, meaning businesses in the low-income communities received alarger percentage of the total amount of loansmade in theseMSAs than the low-income share of total population. The degree of LMI loan bias is onlymarginallybetter. While noMSA has a score of 1, many have relatively high scores. TwentyMSAs have LMI loan bias scores of 0.75 ormore. Thismeans that for businessesin the LMI communities, their share of the total loans to all businesses in theseMSAs is less than one-quarter of the LMI communities’ share of the totalpopulation.
Table 3 indicates that the LI share of the population of an MSA is notcorrelated with LI loan bias, whereas LI share of the amount of loans iscorrelated significantly and negatively with LI loan bias. The same resultshold for the correlations involving LMI shares. This means that loan bias isless with a greater share of loans to businesses in LI (LMI) communities, but isnot related to the share of the population composed of LI (LMI) individuals.It’s interesting to note that the table also shows that the number of branches perfinancial institution is correlated significantly and negatively with LMI loanbias, but not correlated with LI loan bias. Thus, for LMI loan bias, the degree offinancial development in the MSA, as measured by branches per institution,matters.
The measure of LMI loan bias obviously is based upon a naıve view of theworld, and is simply a statistical construct. Yet, as seen above, such a naıve viewmight be influential, and our construct might be useful in understanding thereasons for the substantial variation in the distributions of LMI loans and LMIpopulations across MSAs. Because the measure reflects smaller loans to busi-nesses by reporting banks, it is clear that businesses in LMI communities insome MSAs receive a substantial portion of the total smaller loans to allbusinesses in these MSAs, compared with the LMI communities’ share of thetotal population. Businesses located in other LMI communities, however, farefar worse in this respect. Whether these differences in loan bias across thevarious MSAs can be explained fully by focusing on the world of economicsis our next topic. In free and competitive markets, one would expect differencesin loan bias across regions, but differences that reflect economic factors, such asthe creditworthiness of businesses.
Now we consider a slightly less naıve view of world in which disproportio-nately fewer fundsmight flow to businesses in LMI communities in part becausethe incomes in those areas are disproportionately lower than in other areas ofMSAs. So we recalculated our measure of loan bias, but this time we based it onincome rather than population. Specifically, this measure of loan bias is calcu-lated as 1 minus the ratio of the LI (LMI) share of the total amount of loans tobusinesses in an MSA to the LI (LMI) community share of the total income ofthat MSA. It is interesting that the LI and LMI loan bias measures based uponpopulation correlate positively and significantly with the same two respectiveloan bias measures when based upon income, with correlations of 0.98 and 0.84,
78 J. R. Barth et al.
respectively. But the average LI (LMI) loan bias figure based upon populationis 0.75 (0.41), whereas the average LI (LMI) loan bias figure based upon incomeis 0.22 (–0.85). This means that when one calculates the loan bias based uponpopulation, the share of total loans made to businesses in LI (LMI) commu-nities is, on average, less than the LI (LMI) community share of total popula-tion in the 275MSAs. But when one calculates loan bias based upon income, theshare of the total amount of loans made to businesses is, on average, greaterthan the LI (LMI) community share of total income in the MSAs. Yet, beyondthe averages, one finds that 51 percent of the low-income communities and13 percent of the low- and moderate-income communities have positive loanbias figures based upon income. This exercise suggests that to the extent thatincome of an area correlates with the amount of loans to businesses one mightexpect to be made, economic factors do help to explain why more funds flow tosome areas as opposed to others within MSAs.
Clearly, the naıve view of the world reflected in the ideal of parity and of‘‘opportunity gaps’’ is not compelling; when one considers only income (ignor-ing other factors, such as the presence of collateral that might affect lendingdecisions), much of the loan bias we noted above disappears. Yet, there remainssubstantial variation in the income-based measure of loan bias, and an assess-ment of the reasons for this variation might be a fruitful subject for future work.In any event, whether these measures of loan bias have any power in explainingthe number and size of establishments in LMI communities within MSAs isassessed below.
5 Selected Databases and Studies of Entrepreneurship
Literature pertaining to entrepreneurship is growing rapidly. The focus here ison selected empirical studies into why some individuals become entrepreneursand others do not. The focus is also on studies that examine the entrepreneurialprocess of starting or owning a small business, or becoming self-employed.Given our interest in empirical studies rather than theoretical studies, it is usefulto begin with a brief overview of the different data sets typically used byresearchers when studying entrepreneurship.
Table 4 provides information onwidely used databases fromU.S. studies. Thetable shows substantial differences in the data sets in terms of the issues that canbe examined. Some are longitudinal data sets that enable researchers to study thesame individuals or cohorts of the same individuals over time to determinefactors that might explain why some individuals choose self-employment overpaid employment. Others enable researchers to focus on business startups orsmall businesses over time or across geographical regions, rather than individualchoices between self-employment and wage and salary work. All of these studiesusually try to include as much information as available on the characteristics ofthe self-employed, the characteristics of business owners, the characteristics of
Stumbling Blocks to Entrepreneurship in Low- and Moderate-Income Communities 79
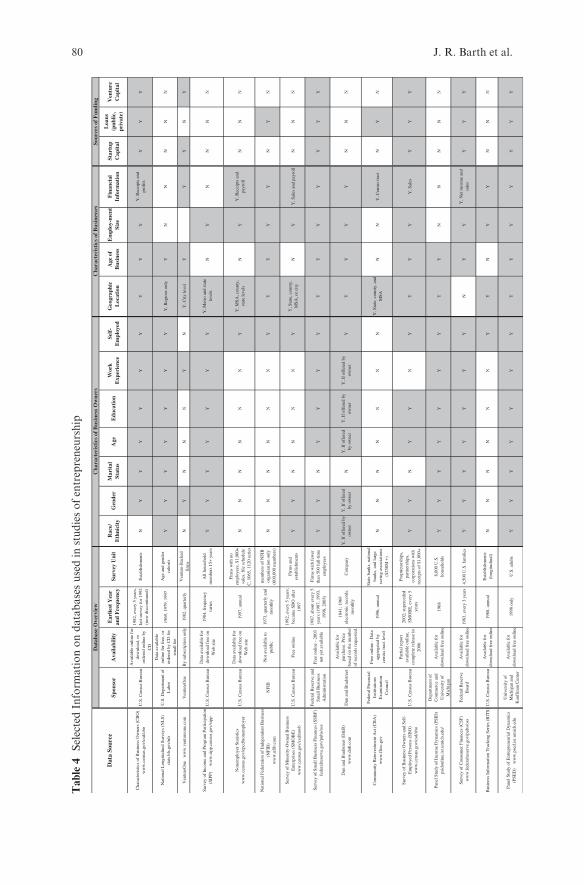
Table4
SelectedInform
ationondatabasesusedin
studiesofentrepreneurship
Spon
sor
Ava
ilabi
lity
Ear
liest
Yea
r an
d F
requ
ency
Surv
ey U
nit
Rac
e/
Eth
nici
tyG
ende
rM
arit
al
Stat
usA
geE
duca
tion
Wor
k E
xper
ienc
eSe
lf-
Em
ploy
edG
eogr
aphi
c L
ocat
ion
Age
of
Bus
ines
sE
mpl
oy-m
ent
Size
Fin
anci
al
Info
rmat
ion
Star
tup
Cap
ital
Loa
ns
(p
ublic
, pr
ivat
e)
Ven
ture
C
apit
al
Cha
ract
eris
tics
of B
usin
ess
Ow
ners
(C
BO
) w
ww
.cen
sus.
gov/
csd/
cbo
U.S
. Cen
sus
Bur
eau
Ava
ilabl
e on
line
for
dow
nloa
d, o
r or
dere
d on
line
by
CD
1982
, eve
ry 5
yea
rs,
last
sur
vey
for
1992
(n
ow d
isco
ntin
ued)
Est
ablis
hmen
tsN
YY
YY
YY
YY
YY
, Rec
eipt
s an
d pr
ofits
Y
YY
Nat
iona
l Lon
gitu
dina
l Sur
veys
(N
LS)
st
ats.
bls.
gov/
nls
U.S
. Dep
artm
ent o
f L
abor
Dat
a av
aila
ble
onlin
e fo
r fr
ee, o
r or
dere
d by
CD
for
sm
all f
ee
1969
, 197
9, 1
997
Age
and
gen
der
coho
rts
YY
YY
YY
YY
, Reg
ions
onl
yY
NN
NN
N
Ven
ture
One
w
ww
.ven
ture
one.
com
Ven
ture
One
By
subs
crip
tion
only
1982
, qua
rter
lyV
entu
re-B
acke
d fi
rms
NY
NN
NY
NY
, City
leve
lY
YY
NY
Surv
ey o
f In
com
e an
d Pr
ogra
m P
artic
ipat
ion
(SIP
P)
ww
w.s
ipp.
cens
us.g
ov/s
ipp
U.S
. Cen
sus
Bur
eau
Dat
a av
aila
ble
for
dow
nloa
d fr
ee o
n W
eb s
ite
1984
, fre
quen
cy
vari
esA
ll ho
useh
old
mem
bers
15+
yea
rsY
YY
YY
YY
Y, M
etro
and
sta
te
leve
lsN
YN
NN
N
Non
empl
oyer
Sta
tistic
s
ww
w.c
ensu
s.go
v/ep
cd/n
onem
ploy
er
U.S
. Cen
sus
Bur
eau
Dat
a av
aila
ble
for
dow
nloa
d fr
ee o
n W
eb s
ite19
97, a
nnua
l
Firm
s w
ith n
o em
ploy
ees,
$1,
000+
sa
les,
file
sch
edul
e C
, 106
5, 1
120
seri
es
NN
NN
NN
YY
, MSA
, cou
nty,
st
ate
leve
lsN
YY
, Rec
eipt
s an
d pa
yrol
lN
NN
Nat
iona
l Fed
erat
ion
of I
ndep
ende
nt B
usin
ess
(NFI
B)
ww
w.n
fib.
com
NFI
BN
ot a
vaila
ble
to
publ
ic
1973
, qua
rter
ly a
nd
mon
thly
mem
bers
of
NFI
B
orga
niza
tion
only
(6
00,0
00 m
embe
rs)
NN
NN
NN
YY
YY
YN
YN
Surv
ey o
f M
inor
ity-O
wne
d B
usin
ess
Ent
erpr
ises
(SM
OB
E)
w
ww
.cen
sus.
gov/
csd/
mw
bU
.S. C
ensu
s B
urea
uFr
ee o
nlin
e19
92, e
very
5 y
ears
; be
cam
e SB
O a
fter
19
97
Firm
s an
d es
tabl
ishm
ents
YY
NN
NN
YY
, Sta
te, c
ount
y,
MSA
, or
city
NY
Y, S
ales
and
pay
roll
NN
N
Surv
ey o
f Sm
all B
usin
ess
Fina
nces
(SS
BF)
fe
dera
lres
erve
.gov
/pub
s/os
s
Fede
ral R
eser
ve a
nd
Smal
l Bus
ines
s A
dmin
istr
atio
n
Free
onl
ine
- 20
03
not y
et a
vaila
ble
1987
, abo
ut e
very
5
year
s (1
987,
199
3,
1998
, 200
3)
Firm
s w
ith f
ewer
th
an 5
00 f
ull-
time
empl
oyee
sY
YN
YY
YY
YY
YY
YY
Y
Dun
and
Bra
dstr
eet (
D&
B)
ww
w.d
nb.c
omD
un a
nd B
rads
tree
t
Ava
ilabl
e fo
r pu
rcha
se. P
rice
ba
sed
on th
e nu
mbe
r of
rec
ords
req
uest
ed.
1841
; 196
9 el
ectr
onic
rec
ords
, m
onth
lyC
ompa
nyY
, If
offe
red
by
owne
rY
, If
offe
red
by o
wne
rN
Y, I
f of
fere
d by
ow
ner
Y, I
f of
fere
d by
ow
ner
Y, I
f of
fere
d by
ow
ner
YY
YY
YN
NN
Com
mun
ity R
einv
estm
ent A
ct (
CR
A)
w
ww
.ffi
ec.g
ov
Fede
ral F
inan
cial
In
stitu
tions
E
xam
inat
ion
Cou
ncil
Free
onl
ine
- D
ata
aggr
egat
ed b
y ce
nsus
trac
t lev
el19
96, a
nnua
l
Stat
e ba
nks,
nat
iona
l ba
nks,
and
larg
e sa
ving
ass
ocia
tions
($
250M
+)
NN
NN
NN
NY
, Sta
te, c
ount
y, a
nd
MSA
NN
Y, C
ensu
s tr
act
NY
N
Surv
ey o
f B
usin
ess
Ow
ners
and
Sel
f-E
mpl
oyed
Per
sons
(SB
O)
w
ww
.cen
sus.
gov/
csd/
sbo
U.S
. Cen
sus
Bur
eau
Part
ial r
epor
t av
aila
ble
onlin
e,
com
plet
e re
leas
e in
20
06
2002
; sup
erce
ded
SMO
BE
, eve
ry 5
ye
ars
Prop
riet
orsh
ips,
pa
rtne
rshi
ps,
corp
orat
ions
with
re
ceip
ts o
f $1
,000
+
YY
NY
YN
YY
YY
Y, S
ales
YY
Y
Pane
l Stu
dy o
f In
com
e D
ynam
ics
(PSI
D)
ps
idon
line.
isr.
umic
h.ed
u/
Dep
artm
ent o
f C
omm
erce
and
U
nive
rsity
of
Mic
higa
n
Ava
ilabl
e fo
r do
wnl
oad
free
onl
ine
1968
8,00
0 U
.S.
hous
ehol
dsY
YY
YY
YY
YY
NN
NN
N
Surv
ey o
f C
onsu
mer
Fin
ance
s (C
SF)
w
ww
.fed
eral
rese
rve.
gov/
pubs
/oss
Fede
ral R
eser
ve
Boa
rdA
vaila
ble
for
dow
nloa
d fr
ee o
nlin
e19
83, e
very
3 y
ears
4,50
0 U
.S. f
amili
es
YY
YY
YY
YN
YY
Y, N
et in
com
e an
d sa
les
YY
Y
Bus
ines
s In
form
atio
n T
rack
ing
Seri
es (
BIT
S)U
.S. C
ensu
s B
urea
uA
vaila
ble
for
dow
nloa
d fr
ee o
nlin
e19
88, a
nnua
lE
stab
lishm
ents
(l
ongi
tudi
nal)
NN
NN
NN
YY
NY
YN
NN
Pane
l Stu
dy o
f E
ntre
pren
euri
al D
ynam
ics
(PSE
D)
w
ww
.pse
d.is
r.um
ich.
edu
Uni
vers
ity o
f M
ichi
gan
and
Kau
ffm
an C
ente
r
Ava
ilabl
e fo
r do
wnl
oad
free
onl
ine
1998
onl
yU
.S. a
dults
YY
YY
YY
YY
YY
YY
YY
Sour
ces
of F
undi
ng
Dat
a So
urce
Dat
abas
e O
verv
iew
Cha
ract
eris
tics
of
Bus
ines
ses
Cha
ract
eris
tics
of
Bus
ines
s O
wne
rs
80 J. R. Barth et al.

the business, and the sources of funding for becoming self-employed, establish-ing, or owning a business.
Table 4 shows that it is difficult to compare the results of studies using thesedifferent data sets. Apart from trying to explain different measures of entrepre-neurship, the various factors for which one can control in any single study areconstrained by the chosen data set. Thus, different studies using different datasets necessarily cannot control for a common and broad set of factors thatmight enable one to explain a given measure of entrepreneurship. Yet, theomission of any important factors might bias whatever results one obtainsfrom a single dataset. This is not to disparage the considerable and costly effortsto compile all these data sets; rather, more effort should be made to reach aconsensus on what information contained in the different data sets can becombined, and on what additional information is necessary to enable policy-makers to determine the best actions to promote entrepreneurship.
To illustrate the importance of the use of different data sets to determine whatworks best to promote entrepreneurship, Table 5 provides information aboutseveral studies that have employed some of the data sets in Table 4. Severalcomments are based upon these studies. First, Blanchflower and Oswald (1998)andHoltz-Eakin, Joulfarian, andRosan (1994a,b) find that liquidity constraintsare a barrier to entrepreneurship, whereas Vos, Yeh, Carter, and Tagg (2005),Hurst and Lusardi (2004), and Moore (2004) do not. Second, Mitchell andPearce (2004) finds there is prejudicial loan discrimination against African-American and Hispanic owners of small businesses, whereas Bostic andLampani (1999) find loan racial disparity for African-American-owned but notHispanic-owned businesses, andMeyer (1990) finds that liquidity constraints donot seem to explain the low African-American self-employment rate. Third, Puriand Robinson (2005) finds that entrepreneurs differ from nonentrepreneurs inbeing innately more optimistic and risk-loving, whereas Guiso and Schivardi(2004) concludes that entrepreneurship can be acquired through learning, irre-spective of differences in temperament. Fourth, Black and Strahan (2002) findsthat more bank branches and greater consolidation in the banking industryfoster entrepreneurship, whereas Mitchell and Pearce (2004) argues that themove by larger banks to transactional lending through credit scores and ‘‘harder’’information might lead to greater loan discrimination against small businesses.Fifth, Petersen and Rajan (2002) finds that small businesses located farther awayfrom lenders no longer must be the highest-quality credits, indicating greateraccess to credit, whereas Brevoort and Hannan (2004) finds no evidence thatdistance is becoming less important, and instead find that distance diminishes thelikelihood of a local commercial loan being made. Sixth, and last, DeYoung,Glennon, and Nigro (2005) finds that lenders making loans made to smallbusinesses under the SBA 7(a) loan guarantee program experience higher defaultrates with greater borrower-lender distance and higher loan guarantees.
Based upon these findings, can one confidently suggest ways to improveentrepreneurship, especially in LMI communities? In Table 6, different potentialstumbling blocks to entrepreneurship define one axis, while different measures
Stumbling Blocks to Entrepreneurship in Low- and Moderate-Income Communities 81
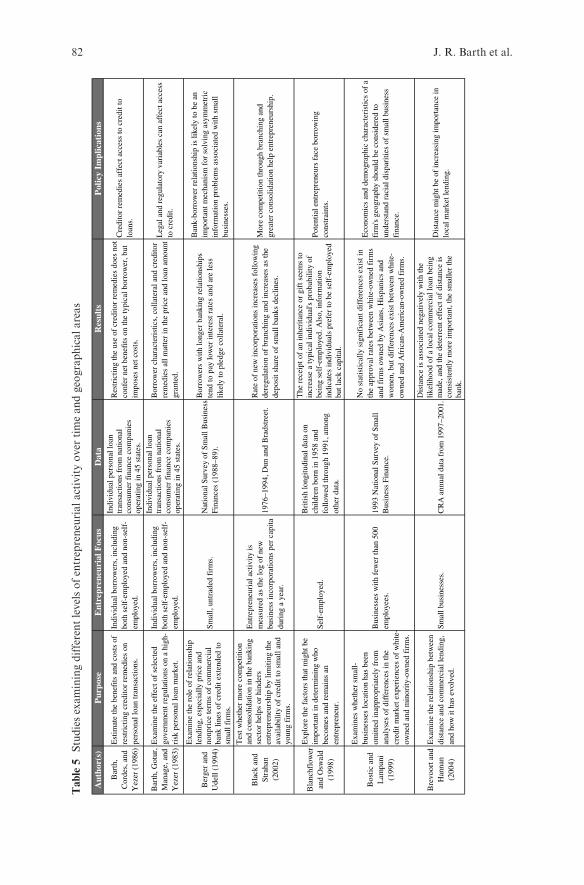
Table5
Studiesexaminingdifferentlevelsofentrepreneurialactivityover
timeandgeographicalareas
Aut
hor(
s)P
urpo
seE
ntre
pren
euri
al F
ocus
Dat
aR
esul
tsP
olic
y Im
plic
atio
ns
Bar
th,
Cor
des,
and
Y
ezer
(19
86)
Est
imat
e th
e be
nefi
ts a
nd c
osts
of
rest
rict
ing
cred
itor
rem
edie
s on
pe
rson
al lo
an tr
ansa
ctio
ns.
Indi
vidu
al b
orro
wer
s, in
clud
ing
both
sel
f-em
ploy
ed a
nd n
on-s
elf-
empl
oyed
.
Indi
vidu
al p
erso
nal l
oan
tran
sact
ions
fro
m n
atio
nal
cons
umer
fin
ance
com
pani
es
oper
atin
g in
45
stat
es.
Res
tric
ting
the
use
of c
redi
tor
rem
edie
s do
es n
ot
conf
er n
et b
enef
its
on th
e ty
pica
l bor
row
er, b
ut
impo
ses
net c
osts
.
Cre
dito
r re
med
ies
affe
ct a
cces
s to
cre
dit t
o lo
ans.
Bar
th, G
otur
, M
anag
e, a
nd
Yez
er (
1983
)
Exa
min
e th
e ef
fect
of
sele
cted
go
vern
men
t reg
ulat
ions
on
a hi
gh-
risk
per
sona
l loa
n m
arke
t.
Indi
vidu
al b
orro
wer
s, in
clud
ing
both
sel
f-em
ploy
ed a
nd n
on-s
elf-
empl
oyed
.
Indi
vidu
al p
erso
nal l
oan
tran
sact
ions
fro
m n
atio
nal
cons
umer
fin
ance
com
pani
es
oper
atin
g in
45
stat
es.
Bor
row
er c
hara
cter
isti
cs, c
olla
tera
l and
cre
dito
r re
med
ies
all m
atte
r in
the
pric
e an
d lo
an a
mou
nt
gran
ted.
Leg
al a
nd r
egul
ator
y va
riab
les
can
affe
ct a
cces
s to
cre
dit.
Ber
ger
and
Ude
ll (
1994
)
Exa
min
e th
e ro
le o
f re
lati
onsh
ip
lend
ing,
esp
ecia
lly
pric
e an
d no
npri
ce te
rms
of c
omm
erci
al
bank
line
s of
cre
dit e
xten
ded
to
smal
l fir
ms.
Smal
l, un
trad
ed f
irm
s.N
atio
nal S
urve
y of
Sm
all B
usin
ess
Fina
nces
(19
88–8
9).
Bor
row
ers
with
long
er b
anki
ng r
elat
ions
hips
te
nd to
pay
low
er in
tere
st r
ates
and
are
less
li
kely
to p
ledg
e co
llat
eral
.
Ban
k-bo
rrow
er r
elat
ions
hip
is li
kely
to b
e an
im
port
ant m
echa
nism
for
sol
ving
asy
mm
etri
c in
form
atio
n pr
oble
ms
asso
ciat
ed w
ith s
mal
l bu
sine
sses
.
Bla
ck a
nd
Stra
han
(200
2)
Tes
t whe
ther
mor
e co
mpe
titi
on
and
cons
olid
atio
n in
the
bank
ing
sect
or h
elps
or
hind
ers
entr
epre
neur
ship
by
lim
iting
the
avai
labi
lity
of
cred
it to
sm
all a
nd
youn
g fi
rms.
Ent
repr
eneu
rial
act
ivit
y is
m
easu
red
as th
e lo
g of
new
bu
sine
ss in
corp
orat
ions
per
cap
ita
duri
ng a
yea
r.
1976
–199
4, D
un a
nd B
rads
tree
t.R
ate
of n
ew in
corp
orat
ions
incr
ease
s fo
llow
ing
dere
gula
tion
of
bran
chin
g an
d in
crea
ses
as th
e de
posi
t sha
re o
f sm
all b
anks
dec
lines
.
Mor
e co
mpe
titio
n th
roug
h br
anch
ing
and
grea
ter
cons
olid
atio
n he
lp e
ntre
pren
eurs
hip.
Bla
nchf
low
er
and
Osw
ald
(199
8)
Exp
lore
the
fact
ors
that
mig
ht b
e im
port
ant i
n de
term
inin
g w
ho
beco
mes
and
rem
ains
an
entr
epre
neur
.
Self
-em
ploy
ed.
Bri
tish
long
itudi
nal d
ata
on
child
ren
born
in 1
958
and
follo
wed
thro
ugh
1991
, am
ong
othe
r da
ta.
The
rec
eipt
of
an in
heri
tanc
e or
gif
t see
ms
to
incr
ease
a ty
pica
l ind
ivid
ual's
pro
babi
lity
of
bein
g se
lf-e
mpl
oyed
. Als
o, in
form
atio
n in
dica
tes
indi
vidu
als
pref
er to
be
self
-em
ploy
ed
but l
ack
capi
tal.
Pot
enti
al e
ntre
pren
eurs
fac
e bo
rrow
ing
cons
trai
nts.
Bos
tic a
nd
Lam
pani
(1
999)
Exa
min
es w
heth
er s
mal
l-bu
sine
sses
loca
tion
has
been
om
itted
inap
prop
riat
ely
from
an
alys
es o
f di
ffer
ence
s in
the
cred
it m
arke
t exp
erie
nces
of
whi
te-
owne
d an
d m
inor
ity-o
wne
d fi
rms.
Bus
ines
ses
with
few
er th
an 5
00
empl
oyee
s.19
93 N
atio
nal S
urve
y of
Sm
all
Bus
ines
s Fi
nanc
e.
No
stat
istic
ally
sig
nifi
cant
dif
fere
nces
exi
st in
th
e ap
prov
al r
ates
bet
wee
n w
hite
-ow
ned
firm
s an
d fi
rms
owne
d by
Asi
ans,
His
pani
cs a
nd
wom
en, b
ut d
iffe
renc
es e
xist
bet
wee
n w
hite
-ow
ned
and
Afr
ican
-Am
eric
an-o
wne
d fi
rms.
Eco
nom
ics
and
dem
ogra
phic
cha
ract
eris
tics
of
a fi
rm's
geog
raph
y sh
ould
be
cons
ider
ed to
un
ders
tand
rac
ial d
ispa
ritie
s of
sm
all b
usin
ess
fina
nce.
Bre
voor
t and
H
anna
n (2
004)
Exa
min
e th
e re
lati
onsh
ip b
etw
een
dist
ance
and
com
mer
cial
lend
ing,
an
d ho
w it
has
evo
lved
.Sm
all b
usin
esse
s.C
RA
ann
ual d
ata
from
199
7–20
01.
Dis
tanc
e is
ass
ocia
ted
nega
tivel
y w
ith th
e li
keli
hood
of
a lo
cal c
omm
erci
al lo
an b
eing
m
ade,
and
the
dete
rren
t eff
ect o
f di
stan
ce is
co
nsis
tent
ly m
ore
impo
rtan
t, th
e sm
alle
r th
e ba
nk.
Dis
tanc
e m
ight
be
of in
crea
sing
impo
rtan
ce in
lo
cal m
arke
t len
ding
.
82 J. R. Barth et al.

Aut
hor(
s)P
urpo
seE
ntre
pren
euri
al F
ocus
Dat
aR
esul
tsP
olic
y Im
plic
atio
ns
Cav
allu
zzo
and
Wol
ken
(200
2)
Exa
min
e th
e im
pact
of
pers
onal
w
ealth
on
smal
l bus
ines
s lo
an
reje
ctio
ns a
cros
s de
mog
raph
ic
grou
ps.
Bus
ines
ses
with
few
er th
an 5
00
empl
oyee
s.
1998
Sur
vey
of S
mal
l Bus
ines
s F
inan
ces,
Dun
and
Bra
dstr
eet,
and
Fed
eral
Res
erve
Sys
tem
dat
a.
Subs
tant
ial u
nexp
lain
ed d
iffe
renc
es in
den
ial
rate
s be
twee
n A
fric
an-A
mer
ican
-, H
ispa
nic-
, A
sian
- an
d W
hite
-ow
ned
firm
s. G
reat
er p
erso
nal
wea
lth
is a
ssoc
iate
d w
ith lo
wer
pro
babi
lity
of
loan
den
ial.
Rac
ial d
ispa
riti
es e
xist
eve
n af
ter
cont
roll
ing
for
vari
ous
cons
trai
nts.
DeY
oung
, G
lenn
on, a
nd
Nig
ro (
2005
)
Exa
min
e ho
w in
crea
sed
borr
ower
-le
nder
dis
tanc
e w
orse
ns th
e pe
rfor
man
ce o
f sm
all b
usin
ess
loan
s, a
nd h
ow n
ew le
ndin
g te
chno
logi
es a
nd e
xist
ing
gove
rnm
ent s
ubsi
dies
mig
ht
mit
igat
e or
exa
cerb
ate
thes
e ef
fect
s.
Smal
l bus
ines
s lo
ans
mad
e to
fi
rms
unde
r S
BA
7(a
) lo
ans
prog
ram
.
Ran
dom
sam
ple
of 3
5,99
9 SB
A
7(a)
gua
rant
eed
loan
s or
igin
ated
by
5,5
52 q
ualif
ied
SBA
pro
gram
le
nder
s be
twee
n 19
83 a
nd 2
001.
On
aver
age,
lend
ers
that
use
cre
dit s
cori
ng
mod
els
expe
rien
ce h
ighe
r de
faul
t rat
es th
an
thos
e th
at d
o no
t. L
oan
defa
ults
incr
ease
with
bo
rrow
er-l
ende
r di
stan
ce, a
nd h
ighe
r lo
an
guar
ante
es a
re a
ssoc
iate
d w
ith
high
er d
efau
lt
rate
s.
Mor
e ge
nero
us g
over
nmen
t loa
n gu
aran
tees
m
ight
not
gen
erat
e de
sire
d re
sults
.
Dun
n an
d H
oltz
-Eak
in
(200
0)
Exa
min
e th
e im
pact
s of
in
divi
dual
s' ow
n w
ealth
and
hu
man
cap
ital
, and
par
enta
l wea
lth
and
self
-em
ploy
men
t exp
erie
nce
on th
e pr
obab
ilit
y th
at a
n in
divi
dual
tran
sits
fro
m w
age-
and-
sala
ry to
sel
f-em
ploy
men
t.
Self
-em
ploy
ed.
Nat
iona
l Lon
gitu
dina
l Sur
veys
. Sp
ecif
ical
ly, s
ampl
es o
f yo
ung
men
who
wer
e ag
es 1
4–24
in
1966
, mat
ure
wom
en w
ho w
ere
ages
30–
44 in
196
7 an
d ol
der
men
w
ho w
ere
ages
45–
59 in
196
6.
The
fin
anci
al a
sset
s of
you
ng m
en e
xert
a
stat
istic
ally
sig
nifi
cant
but
qua
ntita
tivel
y m
odes
t ef
fect
on
the
tran
siti
on in
to s
elf-
empl
oym
ent.
Usi
ng th
is a
s ou
r m
etri
c, th
ey f
ind
a re
lati
vely
sm
all i
mpa
ct o
f ca
pita
l mar
ket c
onst
rain
ts in
the
NL
S.
The
se d
ata
sugg
est s
tron
g ro
les
for
fam
ily-
spec
ific
cap
ital a
nd tr
ansm
issi
on o
f sk
ills
with
in
fam
ilies
in e
nhan
cing
the
prob
abili
ty o
f m
akin
g a
tran
siti
on to
ent
repr
eneu
rshi
p.
Eva
ns a
nd
Lei
ghto
n (1
989)
Exa
min
e th
e pr
oces
s of
sel
ecti
on
into
sel
f-em
ploy
men
t and
the
dete
rmin
ants
of
self
-em
ploy
men
t ea
rnin
gs.
Self
-em
ploy
ed.
Nat
iona
l Lon
gitu
dina
l Sur
vey,
sa
mpl
e of
men
fol
low
ed f
rom
19
66–1
981.
Pro
babi
lity
is h
ighe
r of
bei
ng s
elf-
empl
oyed
for
un
empl
oyed
and
mor
e hi
ghly
edu
cate
d, b
ut n
ot
rela
ted
to a
ge o
r ex
peri
ence
for
fir
st 2
0 ye
ars
of
expe
rien
ce. A
lso,
ret
urn
to w
age
expe
rien
ce in
se
lf-e
mpl
oym
ent i
s lo
wer
than
the
retu
rn to
w
age
expe
rien
ce in
wag
e w
ork.
Une
mpl
oyed
wor
kers
with
the
poor
est
oppo
rtun
ities
in th
e w
age
sect
or s
witc
h to
and
re
mai
n in
sel
f-em
ploy
men
t.
Fair
lie (
1999
)
Exa
min
e ra
cial
pat
tern
s in
tr
ansi
tions
bet
wee
n se
lf-
empl
oym
ent a
nd w
age/
sala
ry w
ork
amon
g pr
ime-
age
men
.
Self
-em
ploy
ed.
22 y
ears
of
data
fro
m th
e P
anel
St
udy
of I
ncom
e D
ynam
ics
(PS
ID).
Rac
ial d
iffe
renc
es in
ass
et le
vels
and
pr
obab
ilitie
s of
hav
ing
self
-em
ploy
ed f
athe
rs
expl
ain
a la
rge
part
of
the
gap
in A
fric
an-
Am
eric
an/w
hite
ent
ry r
ate,
but
non
e of
the
gap
in th
e ex
it r
ate.
Exi
stin
g po
licie
s th
at p
rom
ote
min
ority
bus
ines
s ow
ners
hip
need
to b
e m
odif
ied
or r
edes
igne
d to
re
flec
t the
rac
ial d
iffe
renc
es in
tran
siti
on r
ates
in
to a
nd o
ut o
f se
lf-e
mpl
oym
ent.
Fair
lie
and
Rob
b (2
004)
Exa
min
e th
e ca
uses
of
inte
rgen
erat
iona
l lin
ks in
bus
ines
s ow
ners
hip,
and
the
rela
ted
issu
e of
ho
w h
avin
g a
fam
ily b
usin
ess
back
grou
nd a
ffec
ts s
mal
l-bu
sine
ss
outc
omes
.
Smal
l bus
ines
ses
base
d on
fili
ng
IRS
form
104
0 Sc
hedu
le C
.19
92 C
hara
cter
istic
s of
Bus
ines
s O
wne
rs.
Pri
or w
ork
expe
rien
ce in
a f
amil
y m
embe
r's
busi
ness
has
a p
ositi
ve e
ffec
t on
busi
ness
ou
tcom
es. A
lso,
inhe
rite
d bu
sine
sses
are
mor
e su
cces
sful
than
non
inhe
rite
d bu
sine
sses
.
Mos
t dis
adva
ntag
ed b
usin
ess
deve
lopm
ent
polic
ies,
suc
h as
set
-asi
des
and
loan
ass
ista
nce
prog
ram
s, a
re ta
rget
ed to
war
d al
levi
atin
g fi
nanc
ial c
onst
rain
ts n
ot to
war
d pr
ovid
ing
oppo
rtun
itie
s fo
r w
ork
expe
rien
ce in
sm
all
busi
ness
.
Table5
(continued)
(continued)
Stumbling Blocks to Entrepreneurship in Low- and Moderate-Income Communities 83
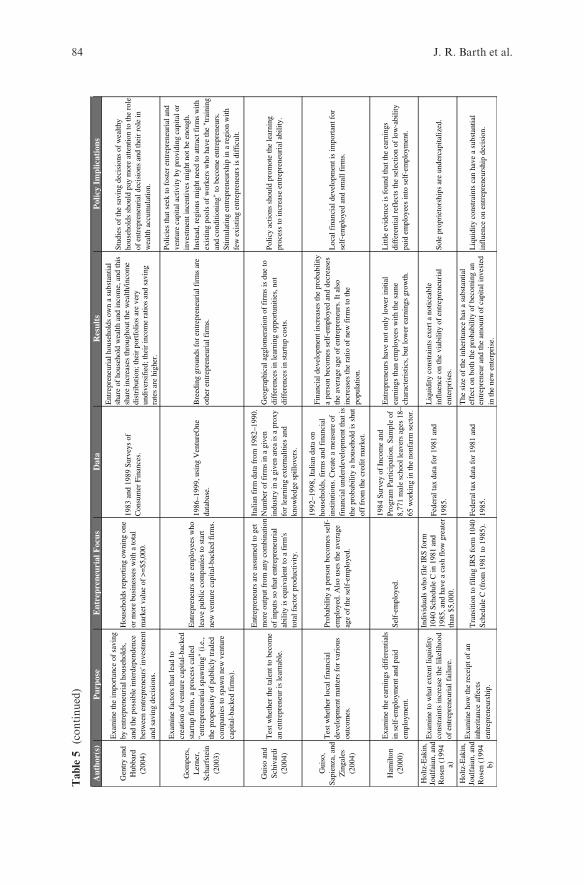
Aut
hor(
s)P
urpo
seE
ntre
pren
euri
al F
ocus
Dat
aR
esul
tsP
olic
y Im
plic
atio
ns
Gom
pers
, L
erne
r,
Scha
rfst
ein
(200
3)
Exa
min
e fa
ctor
s th
at le
ad to
cr
eati
on o
f ve
ntur
e ca
pita
l-ba
cked
st
artu
p fi
rms,
a p
roce
ss c
alle
d "e
ntre
pren
euri
al s
paw
ning
" (i
.e.,
the
prop
ensi
ty o
f pu
blic
ly tr
aded
co
mpa
nies
to s
paw
n ne
w v
entu
re
capi
tal-
back
ed f
irm
s).
Ent
repr
eneu
rs a
re e
mpl
oyee
s w
ho
leav
e pu
blic
com
pani
es to
sta
rt
new
ven
ture
cap
ital
-bac
ked
firm
s.
1986
–199
9, u
sing
Ven
ture
One
da
taba
se.
Bre
edin
g gr
ound
s fo
r en
trep
rene
uria
l fir
ms
are
othe
r en
trep
rene
uria
l fir
ms.
Pol
icie
s th
at s
eek
to f
oste
r en
trep
rene
uria
l and
ve
ntur
e ca
pita
l act
ivit
y by
pro
vidi
ng c
apit
al o
r in
vest
men
t inc
entiv
es m
ight
not
be
enou
gh.
Inst
ead,
reg
ions
mig
ht n
eed
to a
ttra
ct f
irm
s w
ith
exis
ting
poo
ls o
f w
orke
rs w
ho h
ave
the
"tra
inin
g an
d co
ndit
ioni
ng"
to b
ecom
e en
trep
rene
urs.
St
imul
atin
g en
trep
rene
ursh
ip in
a r
egio
n w
ith
few
exi
stin
g en
trep
rene
urs
is d
iffi
cult.
Gui
so a
nd
Schi
vard
i (2
004)
Tes
t whe
ther
the
tale
nt to
bec
ome
an e
ntre
pren
eur
is le
arna
ble.
Ent
repr
eneu
rs a
re a
ssum
ed to
get
m
ore
outp
ut f
rom
any
com
bina
tion
of in
puts
so
that
ent
repr
eneu
rial
ab
ilit
y is
equ
ival
ent t
o a
firm
's to
tal f
acto
r pr
oduc
tivity
.
Ital
ian
firm
dat
a fr
om 1
982–
1990
. N
umbe
r of
fir
ms
in a
giv
en
indu
stry
in a
giv
en a
rea
is a
pro
xy
for
lear
ning
ext
erna
liti
es a
nd
know
ledg
e sp
illov
ers.
Geo
grap
hica
l agg
lom
erat
ion
of f
irm
s is
due
to
diff
eren
ces
in le
arni
ng o
ppor
tuni
ties,
not
di
ffer
ence
s in
sta
rtup
cos
ts.
Pol
icy
acti
ons
shou
ld p
rom
ote
the
lear
ning
pr
oces
s to
incr
ease
ent
repr
eneu
rial
abi
lity.
Gui
so,
Sap
ienz
a, a
nd
Zin
gale
s (2
004)
Tes
t whe
ther
loca
l fin
anci
al
deve
lopm
ent m
atte
rs f
or v
ario
us
outc
omes
.
Pro
babi
lity
a pe
rson
bec
omes
sel
f-em
ploy
ed. A
lso
uses
the
aver
age
age
of th
e se
lf-e
mpl
oyed
.
1992
–199
8, I
talia
n da
ta o
n ho
useh
olds
, fir
ms
and
fina
ncia
l in
stitu
tions
. Cre
ate
a m
easu
re o
f fi
nanc
ial u
nder
deve
lopm
ent t
hat i
s th
e pr
obab
ility
a h
ouse
hold
is s
hut
off
from
the
cred
it m
arke
t.
Fina
ncia
l dev
elop
men
t inc
reas
es th
e pr
obab
ility
a
pers
on b
ecom
es s
elf-
empl
oyed
and
dec
reas
es
the
aver
age
age
of e
ntre
pren
eurs
. It a
lso
incr
ease
s th
e ra
tio
of n
ew f
irm
s to
the
popu
latio
n.
Loc
al f
inan
cial
dev
elop
men
t is
impo
rtan
t for
se
lf-e
mpl
oyed
and
sm
all f
irm
s.
Ham
ilton
(2
000)
Exa
min
e th
e ea
rnin
gs d
iffe
rent
ials
in
sel
f-em
ploy
men
t and
pai
d em
ploy
men
t.Se
lf-e
mpl
oyed
.
1984
Sur
vey
of I
ncom
e an
d P
rogr
am P
arti
cipa
tion
. Sam
ple
of
8,77
1 m
ale
scho
ol le
aver
s ag
es 1
8–65
wor
king
in th
e no
nfar
m s
ecto
r.
Ent
repr
eneu
rs h
ave
not o
nly
low
er in
itia
l ea
rnin
gs th
an e
mpl
oyee
s w
ith
the
sam
e ch
arac
teri
stic
s, b
ut lo
wer
ear
ning
s gr
owth
.
Lit
tle
evid
ence
is f
ound
that
the
earn
ings
di
ffer
entia
l ref
lect
s th
e se
lect
ion
of lo
w-a
bilit
y pa
id e
mpl
oyee
s in
to s
elf-
empl
oym
ent.
Hol
tz-E
akin
, Jo
ulfa
ian,
and
R
osen
(19
94
a)
Exa
min
e to
wha
t ext
ent l
iqui
dity
co
nstr
aint
s in
crea
se th
e lik
elih
ood
of e
ntre
pren
euri
al f
ailu
re.
Indi
vidu
als
who
file
IR
S fo
rm
1040
Sch
edul
e C
in 1
981
and
1985
, and
hav
e a
cash
flo
w g
reat
er
than
$5,
000.
Fede
ral t
ax d
ata
for
1981
and
19
85.
Liq
uidi
ty c
onst
rain
ts e
xert
a n
otic
eabl
e in
flue
nce
on th
e vi
abil
ity
of e
ntre
pren
euri
al
ente
rpri
ses.
Sole
pro
prie
tors
hips
are
und
erca
pita
lize
d.
Hol
tz-E
akin
, Jo
ulfa
ian,
and
R
osen
(19
94
b)
Exa
min
e ho
w th
e re
ceip
t of
an
inhe
rita
nce
affe
cts
entr
epre
neur
ship
.
Tra
nsiti
on to
fili
ng I
RS
form
104
0 Sc
hedu
le C
(fr
om 1
981
to 1
985)
.Fe
dera
l tax
dat
a fo
r 19
81 a
nd
1985
.
The
siz
e of
the
inhe
rita
nce
has
a su
bsta
ntia
l ef
fect
on
both
the
prob
abili
ty o
f be
com
ing
an
entr
epre
neur
and
the
amou
nt o
f ca
pita
l inv
este
d in
the
new
ent
erpr
ise.
Liq
uidi
ty c
onst
rain
ts c
an h
ave
a su
bsta
ntia
l in
flue
nce
on e
ntre
pren
eurs
hip
deci
sion
.
Gen
try
and
Hub
bard
(2
004)
Exa
min
e th
e im
port
ance
of
savi
ng
by e
ntre
pren
euri
al h
ouse
hold
s,
and
the
poss
ible
inte
rdep
ende
nce
betw
een
entr
epre
neur
s' in
vest
men
t an
d sa
ving
dec
isio
ns.
Hou
seho
lds
repo
rtin
g ow
ning
one
or
mor
e bu
sine
sses
with
a to
tal
mar
ket v
alue
of
>=
$5,0
00.
1983
and
198
9 Su
rvey
s of
C
onsu
mer
Fin
ance
s.
Ent
repr
eneu
rial
hou
seho
lds
own
a su
bsta
ntia
l sh
are
of h
ouse
hold
wea
lth
and
inco
me,
and
this
sh
are
incr
ease
s th
roug
hout
the
wea
lth/
inco
me
dist
ribu
tion;
thei
r po
rtfo
lios
are
very
un
dive
rsif
ied;
thei
r in
com
e ra
tios
and
savi
ng
rate
s ar
e hi
gher
.
Stud
ies
of th
e sa
ving
dec
isio
ns o
f w
ealth
y ho
useh
olds
sho
uld
pay
mor
e at
tent
ion
to th
e ro
le
of e
ntre
pren
euri
al d
ecis
ions
and
thei
r ro
le in
w
ealt
h ac
cum
ulat
ion.
Table5
(continued)
84 J. R. Barth et al.
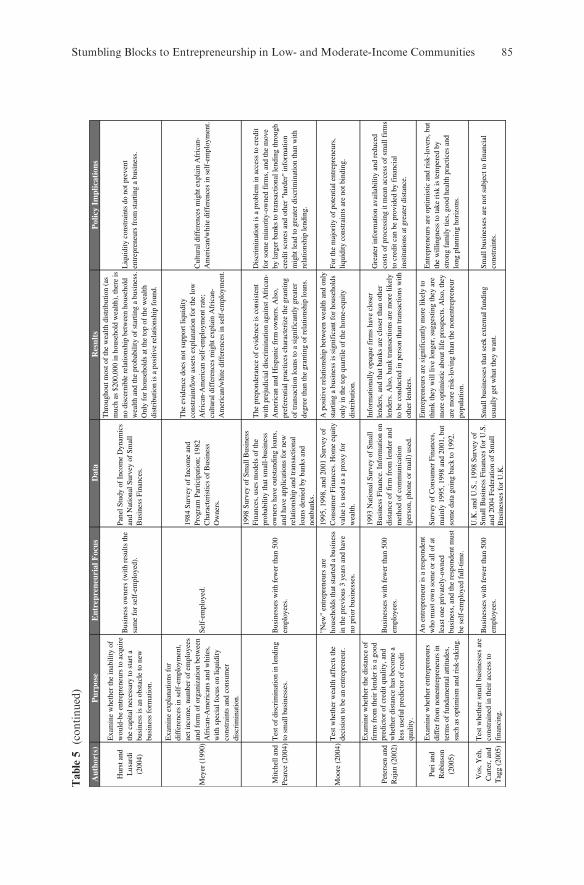
Aut
hor(
s)P
urpo
seE
ntre
pren
euri
al F
ocus
Dat
aR
esul
tsP
olic
y Im
plic
atio
ns
Hur
st a
nd
Lus
ardi
(2
004)
Exa
min
e w
heth
er th
e in
abili
ty o
f w
ould
-be
entr
epre
neur
s to
acq
uire
th
e ca
pita
l nec
essa
ry to
sta
rt a
bu
sine
ss is
an
obst
acle
to n
ew
busi
ness
for
mat
ion.
Bus
ines
s ow
ners
(w
ith r
esul
ts th
e sa
me
for
self
-em
ploy
ed).
Pane
l Stu
dy o
f In
com
e D
ynam
ics
and
Nat
iona
l Sur
vey
of S
mal
l B
usin
ess
Fina
nces
.
Thr
ough
out m
ost o
f th
e w
ealth
dis
trib
utio
n (a
s m
uch
as $
200,
000
in h
ouse
hold
wea
lth),
ther
e is
no
dis
cern
ible
rel
atio
nshi
p be
twee
n ho
useh
old
wea
lth a
nd th
e pr
obab
ility
of
star
ting
a bu
sine
ss.
Onl
y fo
r ho
useh
olds
at t
he to
p of
the
wea
lth
dist
ribu
tion
is a
pos
itive
rel
atio
nshi
p fo
und.
Liq
uidi
ty c
onst
rain
ts d
o no
t pre
vent
en
trep
rene
urs
from
sta
rtin
g a
busi
ness
.
Mey
er (
1990
)
Exa
min
e ex
plan
atio
ns f
or
diff
eren
ces
in s
elf-
empl
oym
ent,
net i
ncom
e, n
umbe
r of
em
ploy
ees
and
form
of
orga
niza
tion
betw
een
Afr
ican
-Am
eric
ans
and
whi
tes,
w
ith s
peci
al f
ocus
on
liqui
dity
co
nstr
aint
s an
d co
nsum
er
disc
rim
inat
ion.
Self
-em
ploy
ed.
1984
Sur
vey
of I
ncom
e an
d Pr
ogra
m P
artic
ipat
ion;
198
2 C
hara
cter
istic
s of
Bus
ines
s O
wne
rs.
The
evi
denc
e do
es n
ot s
uppo
rt li
quid
ity
cons
trai
nt/lo
w a
sset
s ex
plan
atio
n fo
r th
e lo
w
Afr
ican
-Am
eric
an s
elf-
empl
oym
ent r
ate;
cu
ltura
l dif
fere
nces
mig
ht e
xpla
in A
fric
an-
Am
eric
an/w
hite
dif
fere
nces
in s
elf-
empl
oym
ent.
Cul
tura
l dif
fere
nces
mig
ht e
xpla
in A
fric
an-
Am
eric
an/w
hite
dif
fere
nces
in s
elf-
empl
oym
ent.
Mitc
hell
and
Pear
ce (
2004
)T
est o
f di
scri
min
atio
n in
lend
ing
to s
mal
l bus
ines
ses.
Bus
ines
ses
with
few
er th
an 5
00
empl
oyee
s.
1998
Sur
vey
of S
mal
l Bus
ines
s Fi
nanc
es, u
ses
mod
els
of th
e pr
obab
ility
that
sm
all-
busi
ness
ow
ners
hav
e ou
tsta
ndin
g lo
ans,
an
d ha
ve a
pplic
atio
ns f
or n
ew
rela
tions
hip
and
tran
sact
iona
l lo
ans
deni
ed b
y ba
nks
and
nonb
anks
.
The
pre
pond
eran
ce o
f ev
iden
ce is
con
sist
ent
with
pre
judi
cial
dis
crim
inat
ion
agai
nst A
fric
an-
Am
eric
an a
nd H
ispa
nic
firm
ow
ners
. Als
o,
pref
eren
tial p
ract
ices
cha
ract
eriz
e th
e gr
antin
g of
tran
sact
ion
loan
s to
a s
igni
fica
ntly
gre
ater
de
gree
than
the
gran
ting
of r
elat
ions
hip
loan
s.
Dis
crim
inat
ion
is a
pro
blem
in a
cces
s to
cre
dit
for
som
e m
inor
ity-o
wne
d fi
rms,
and
the
mov
e by
larg
er b
anks
to tr
ansa
ctio
nal l
endi
ng th
roug
h cr
edit
scor
es a
nd o
ther
"ha
rder
" in
form
atio
n m
ight
lead
to g
reat
er d
iscr
imin
atio
n th
an w
ith
rela
tions
hip
lend
ing.
Moo
re (
2004
)T
est w
heth
er w
ealth
aff
ects
the
deci
sion
to b
e an
ent
repr
eneu
r.
"New
" en
trep
rene
urs
are
hous
ehol
ds th
at s
tart
ed a
bus
ines
s in
the
prev
ious
3 y
ears
and
hav
e no
pri
or b
usin
esse
s.
1995
, 199
8, a
nd 2
001
Surv
ey o
f C
onsu
mer
Fin
ance
s. H
ome
equi
ty
valu
e is
use
d as
a p
roxy
for
w
ealth
.
A p
ositi
ve r
elat
ions
hip
betw
een
wea
lth a
nd o
nly
star
ting
a bu
sine
ss is
sig
nifi
cant
for
hou
seho
lds
only
in th
e to
p qu
artil
e of
the
hom
e-eq
uity
di
stri
butio
n.
For
the
maj
ority
of
pote
ntia
l ent
repr
eneu
rs,
liqui
dity
con
stra
ints
are
not
bin
ding
.
Pete
rsen
and
R
ajan
(20
02)
Exa
min
e w
heth
er th
e di
stan
ce o
f fi
rms
from
thei
r le
nder
is a
goo
d pr
edic
tor
of c
redi
t qua
lity,
and
w
heth
er d
ista
nce
has
beco
me
a le
ss u
sefu
l pre
dict
or o
f cr
edit
qual
ity.
Bus
ines
ses
with
few
er th
an 5
00
empl
oyee
s.
1993
Nat
iona
l Sur
vey
of S
mal
l B
usin
ess
Fina
nce.
Inf
orm
atio
n on
di
stan
ce o
f fi
rm f
rom
lend
er a
nd
met
hod
of c
omm
unic
atio
n (p
erso
n, p
hone
or
mai
l) u
sed.
Info
rmat
iona
lly o
paqu
e fi
rms
have
clo
ser
lend
ers,
and
that
ban
ks a
re c
lose
r th
an o
ther
le
nder
s. A
lso,
ban
k tr
ansa
ctio
ns a
re m
ore
likel
y to
be
cond
ucte
d in
per
son
than
tran
sact
ions
with
ot
her
lend
ers.
Gre
ater
info
rmat
ion
avai
labi
lity
and
redu
ced
cost
s of
pro
cess
ing
it m
ean
acce
ss o
f sm
all f
irm
s to
cre
dit c
an b
e pr
ovid
ed b
y fi
nanc
ial
inst
itutio
ns a
t gre
ater
dis
tanc
e.
Puri
and
R
obin
son
(200
5)
Exa
min
e w
heth
er e
ntre
pren
eurs
di
ffer
fro
m n
onen
trep
rene
urs
in
term
s of
fun
dam
enta
l atti
tude
s,
such
as
optim
ism
and
ris
k-ta
king
.
An
entr
epre
neur
is a
res
pond
ent
who
mus
t ow
n so
me
or a
ll of
at
leas
t one
pri
vate
ly-o
wne
d bu
sine
ss, a
nd th
e re
spon
dent
mus
t be
sel
f-em
ploy
ed f
ull-
time.
Surv
ey o
f C
onsu
mer
Fin
ance
s,
mai
nly
1995
, 199
8 an
d 20
01, b
ut
som
e da
ta g
oing
bac
k to
199
2.
Ent
repr
eneu
rs a
re s
igni
fica
ntly
mor
e lik
ely
to
thin
k th
ey w
ill li
ve lo
nger
, sug
gest
ing
they
are
m
ore
optim
istic
abo
ut li
fe p
rosp
ects
. Als
o, th
ey
are
mor
e ri
sk-l
ovin
g th
an th
e no
nent
repr
eneu
r po
pula
tion.
Ent
repr
eneu
rs a
re o
ptim
istic
and
ris
k-lo
vers
, but
th
e w
illin
gnes
s to
take
ris
k is
tem
pere
d by
st
rong
fam
ily ti
es, g
ood
heal
th p
ract
ices
and
lo
ng p
lann
ing
hori
zons
.
Vos
, Yeh
, C
arte
r, a
nd
Tag
g (2
005)
Tes
t whe
ther
sm
all b
usin
esse
s ar
e co
nstr
aine
d in
thei
r ac
cess
to
fina
ncin
g.
Bus
ines
ses
with
few
er th
an 5
00
empl
oyee
s.
U.K
. and
U.S
., 19
98 S
urve
y of
Sm
all B
usin
ess
Fina
nces
for
U.S
. an
d 20
04 F
eder
atio
n of
Sm
all
Bus
ines
ses
for
U.K
.
Smal
l bus
ines
ses
that
see
k ex
tern
al f
undi
ng
usua
lly g
et w
hat t
hey
wan
t.Sm
all b
usin
esse
s ar
e no
t sub
ject
to f
inan
cial
co
nstr
aint
s.
Table5
(continued)
Stumbling Blocks to Entrepreneurship in Low- and Moderate-Income Communities 85

Table6
Stumblingblocksto
entrepreneurship
Indi
vidu
al
Se
lf-E
mpl
oym
ent
Yes
: Pur
i and
R
obin
son
(200
5)
Yes
: Kni
ght
(192
1); Y
es: P
uri
and
Rob
inso
n (2
005)
; Yes
: K
ihls
trom
and
L
affo
nt (
1979
)
Yes
: Luc
as
(197
8); Y
es:
Schu
mpe
ter
(191
1)
Yes
: Dun
n an
d H
oltz
-Eak
in
(200
0); Y
es:
Gui
so a
nd
Schi
vard
i (20
04)
Yes
: Gom
pers
, L
erne
r,
Scha
rfst
ein
(200
3); Y
es:
Gui
so a
nd
Schi
vard
i (20
04)
No:
Hur
st a
nd L
usar
di (
2004
); N
o: M
oore
(2
004)
; Yes
: Gen
try
and
Hub
bard
(20
04);
Y
es: G
uiso
, Sap
ienz
a, a
nd Z
inga
les
(200
4);
Yes
: Bla
nchf
low
er a
nd O
swal
d (1
998)
; Yes
: Fa
irlie
(19
99);
Yes
: Bla
ck a
nd S
trah
an
(200
2); Y
es: I
mm
ergl
uck
and
Smith
(20
01)
Yes
: Bat
es (
1991
); Y
es:
Bla
nchf
low
er, L
evin
e,
and
Zim
mer
man
(20
03);
Y
es: M
itche
ll an
d Pe
arce
(20
04)
Yes
: Bar
th, C
orde
s, a
nd
Yez
er (
1986
); Y
es:
Ber
kow
itz a
nd W
hite
(2
002)
; Yes
: Per
sad
(200
4)
Indi
vidu
al B
usin
ess
Ow
ners
hip
Yes
: Pur
i and
R
obin
son
(200
5)
Yes
: Kni
ght
(192
1); Y
es: P
uri
and
Rob
inso
n (2
005)
; Yes
: K
ihls
trom
and
L
affo
nt (
1979
)
Yes
: Luc
as
(197
8); Y
es:
Schu
mpe
ter
(191
1)
Yes
: Dun
n an
d H
oltz
-Eak
in
(200
0); Y
es:
Gui
so a
nd
Schi
vard
i (20
04)
Yes
: Gom
pers
, L
erne
r, a
nd
Scha
rfst
ein
(200
3); Y
es:
Gui
so a
nd
Schi
vard
i (20
04)
No:
Hur
st a
nd L
usar
di (
2004
); N
o: M
oore
(2
004)
; Yes
: Gen
try
and
Hub
bard
(20
04);
Y
es: G
uiso
, Sap
ienz
a, a
nd Z
inga
les
(200
4);
Yes
: Bla
nchf
low
er a
nd O
swal
d (1
998)
; Yes
: Fa
irlie
(19
99);
Yes
: Bla
ck a
nd S
trah
an
(200
2); Y
es: I
mm
ergl
uck
and
Smith
(20
01)
Yes
: Bat
es (
1991
); Y
es:
Bla
nchf
low
er, L
evin
e,
and
Zim
mer
man
(20
03);
Y
es: M
itche
ll an
d Pe
arce
(20
04)
Yes
: Bar
th, C
orde
s, a
nd
Yez
er (
1986
); Y
es:
Ber
kow
itz a
nd W
hite
(2
002)
; Yes
: Per
sad
(200
4)
New
Fir
m S
tart
ups
Yes
: Pur
i and
R
obin
son
(200
5)
Yes
: Kni
ght
(192
1); Y
es: P
uri
and
Rob
inso
n (2
005)
; Yes
: K
ihls
trom
and
L
affo
nt (
1979
)
Yes
: Luc
as
(197
8); Y
es:
Schu
mpe
ter
(191
1)
Yes
: Dun
n an
d H
oltz
-Eak
in
(200
0); Y
es:
Gui
so a
nd
Schi
vard
i (20
04)
Yes
: Gom
pers
, L
erne
r, a
nd
Scha
rfst
ein
(200
3); Y
es:
Gui
so a
nd
Schi
vard
i (20
04)
No:
Hur
st a
nd L
usar
di (
2004
); N
o: M
oore
(2
004)
; Yes
: Gen
try
and
Hub
bard
(20
04);
Y
es: G
uiso
, Sap
ienz
a, a
nd Z
inga
les
(200
4);
Yes
: Bla
nchf
low
er a
nd O
swal
d (1
998)
; Yes
: Fa
irlie
(19
99);
Yes
: Bla
ck, a
nd S
trah
an
(200
2); Y
es: I
mm
ergl
uck
and
Smith
(20
01)
Yes
: Bat
es (
1991
); Y
es:
Bla
nchf
low
er, L
evin
e,
and
Zim
mer
man
(20
03);
Y
es: M
itche
ll an
d Pe
arce
(20
04)
Yes
: Bar
th, C
orde
s, a
nd
Yez
er (
1986
); Y
es:
Ber
kow
itz a
nd W
hite
(2
002)
; Yes
: Per
sad
(200
4)
Firm
s by
Num
ber
of
Em
ploy
ees
Yes
: Pur
i and
R
obin
son
(200
5)
Yes
: Kni
ght
(192
1); Y
es: P
uri
and
Rob
inso
n (2
005)
; Yes
: K
ihls
trom
and
L
affo
nt (
1979
)
Yes
: Luc
as
(197
8); Y
es:
Schu
mpe
ter
(191
1)
Yes
: Dun
n an
d H
oltz
-Eak
in
(200
0); Y
es:
Gui
so a
nd
Schi
vard
i (20
04)
No
Stud
ies
No:
Vos
, Yeh
, Car
ter,
and
Tag
g (2
005)
; No:
Pe
ters
en a
nd R
ajan
(20
02);
Yes
: Im
mer
gluc
k an
d Sm
ith (
2001
)
Yes
: Bat
es (
1991
); Y
es:
Bla
nchf
low
er, L
evin
e,
and
Zim
mer
man
(20
03);
Y
es: M
itche
ll an
d Pe
arce
(20
04);
Onl
y be
twee
n w
hite
and
A
fric
an-A
mer
ican
bu
sine
ss o
wne
rs: B
ostic
an
d L
ampa
ni (
1999
)
Yes
: Bar
th, C
orde
s, a
nd
Yez
er (
1986
); Y
es:
Ber
kow
itz a
nd W
hite
(2
002)
; Yes
: Per
sad
(200
4)
Opt
imis
tic
Low
Ris
k A
vers
ion
Tal
ent
or A
bilit
yR
egul
atio
nM
easu
re o
f E
ntre
pren
eurs
hip
Not
Am
enab
le t
o P
olic
yA
men
able
to
Pol
icy
Exo
geno
us C
hara
cter
isti
cs o
f E
ntre
pren
eurs
Tal
ent
or A
bilit
y Is
Lea
rnab
leA
gglo
mer
atio
n of
E
ntre
pren
eurs
Fin
anci
ng o
r L
iqui
dity
Con
stra
ints
Dis
crim
inat
ion
86 J. R. Barth et al.

of entrepreneurship define the other. In the middle of the table are various
studies of entrepreneurship linked to both the different impediments and the
different entrepreneurship measures. For each of the studies, we indicate
whether stumbling blocks to entrepreneurial activity do exist.The studies differ as to whether impediments to entrepreneurship actually
exist, and if they do, whether they are significant. Unfortunately, differences in
entrepreneurship measures and differences in data sets make it difficult to
choose which results should guide policy. This is certainly the case with respect
to the existence of liquidity constraints. But there appears to be agreement
among the studies reviewed that discrimination, particularly involving African
Americans, is a barrier to entrepreneurship. Also, there seems to be agreement
that the existence of entrepreneurial firms in a region helps spur the establish-
ment of still more such firms. Furthermore, as the next section shows, there
appears to be consensus that governmental regulations impede entrepreneur-
ship. Finally, there appears to be agreement that individuals can learn or be
taught to become entrepreneurs. At the very least, agreement that are indeed
stumbling blocks to entrepreneurship should provide better guidance as to how
to allocate available resources for the benefit of all communities, but especially
LMI communities.
6 Regulatory Stumbling Blocks to Entrepreneurship
An additional way to identify impediments to entrepreneurship is to ask entre-
preneurs what they perceive to be barriers to starting and operating a business.
Every four years, the National Federation of Independent Business conducts a
nationwide survey of small-business owners known as Small Business Problems
& Priorities. Table 7 includes selected problems identified as critical by respon-
dents to the 2004 survey. It is notable that few of the barriers studied in the
empirical literature are identified as critical by survey respondents. For
instance, as noted earlier, liquidity constraints are the topic of numerous studies
–many of which find them to be binding–yet the difficulty of obtaining long-
term loans is ranked 68th and the difficulty of obtaining short-term loans is
ranked 70th of seventy-five problems. Additionally, just 7 percent of respon-
dents rated these two problems as being of ‘‘critical’’ importance. Instead,
business owners tended to stress three broad groups of problems: those not
amenable to policy actions (such as earnings); those typically beyond the scope
of small-business policy (such as health-care costs); and those associated with
governmental tax or regulatory policies. As Table 7 shows, the cost of workers’
compensation insurance is ranked the third-most important problem; business
taxes are ranked fifth (see Table 8 for differences in state sales taxes); property
taxes are ranked sixth; and ‘‘unreasonable’’ government regulation is ranked the
ninth-most important impediment.
Stumbling Blocks to Entrepreneurship in Low- and Moderate-Income Communities 87
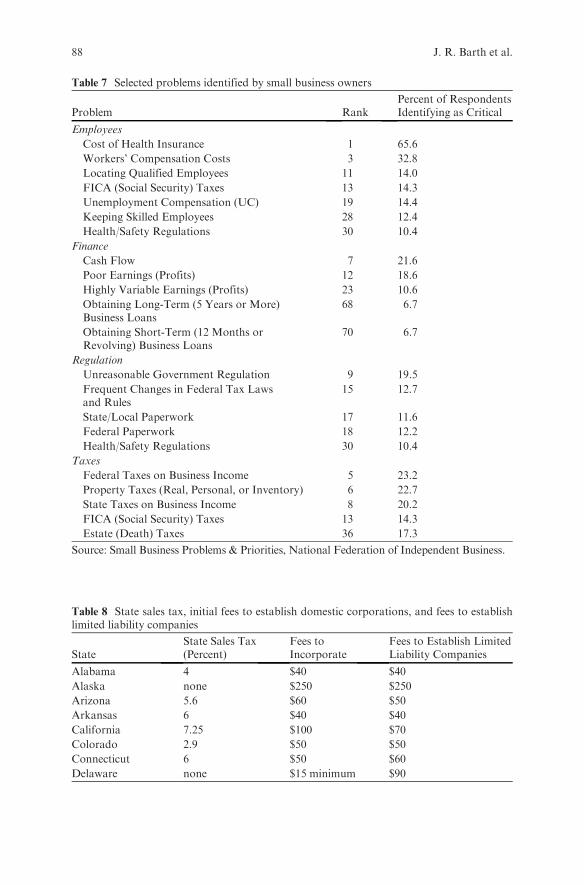
Table 7 Selected problems identified by small business owners
Problem RankPercent of RespondentsIdentifying as Critical
Employees
Cost of Health Insurance 1 65.6
Workers’ Compensation Costs 3 32.8
Locating Qualified Employees 11 14.0
FICA (Social Security) Taxes 13 14.3
Unemployment Compensation (UC) 19 14.4
Keeping Skilled Employees 28 12.4
Health/Safety Regulations 30 10.4
Finance
Cash Flow 7 21.6
Poor Earnings (Profits) 12 18.6
Highly Variable Earnings (Profits) 23 10.6
Obtaining Long-Term (5 Years or More)Business Loans
68 6.7
Obtaining Short-Term (12 Months orRevolving) Business Loans
70 6.7
Regulation
Unreasonable Government Regulation 9 19.5
Frequent Changes in Federal Tax Lawsand Rules
15 12.7
State/Local Paperwork 17 11.6
Federal Paperwork 18 12.2
Health/Safety Regulations 30 10.4
Taxes
Federal Taxes on Business Income 5 23.2
Property Taxes (Real, Personal, or Inventory) 6 22.7
State Taxes on Business Income 8 20.2
FICA (Social Security) Taxes 13 14.3
Estate (Death) Taxes 36 17.3
Source: Small Business Problems & Priorities, National Federation of Independent Business.
Table 8 State sales tax, initial fees to establish domestic corporations, and fees to establishlimited liability companies
StateState Sales Tax(Percent)
Fees toIncorporate
Fees to Establish LimitedLiability Companies
Alabama 4 $40 $40
Alaska none $250 $250
Arizona 5.6 $60 $50
Arkansas 6 $40 $40
California 7.25 $100 $70
Colorado 2.9 $50 $50
Connecticut 6 $50 $60
Delaware none $15 minimum $90
88 J. R. Barth et al.
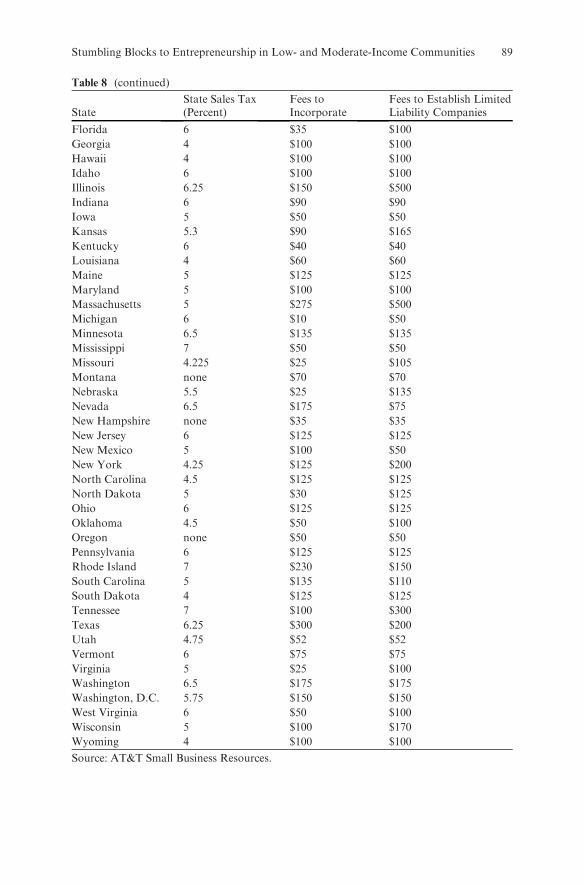
Table 8 (continued)
StateState Sales Tax(Percent)
Fees toIncorporate
Fees to Establish LimitedLiability Companies
Florida 6 $35 $100
Georgia 4 $100 $100
Hawaii 4 $100 $100
Idaho 6 $100 $100
Illinois 6.25 $150 $500
Indiana 6 $90 $90
Iowa 5 $50 $50
Kansas 5.3 $90 $165
Kentucky 6 $40 $40
Louisiana 4 $60 $60
Maine 5 $125 $125
Maryland 5 $100 $100
Massachusetts 5 $275 $500
Michigan 6 $10 $50
Minnesota 6.5 $135 $135
Mississippi 7 $50 $50
Missouri 4.225 $25 $105
Montana none $70 $70
Nebraska 5.5 $25 $135
Nevada 6.5 $175 $75
New Hampshire none $35 $35
New Jersey 6 $125 $125
New Mexico 5 $100 $50
New York 4.25 $125 $200
North Carolina 4.5 $125 $125
North Dakota 5 $30 $125
Ohio 6 $125 $125
Oklahoma 4.5 $50 $100
Oregon none $50 $50
Pennsylvania 6 $125 $125
Rhode Island 7 $230 $150
South Carolina 5 $135 $110
South Dakota 4 $125 $125
Tennessee 7 $100 $300
Texas 6.25 $300 $200
Utah 4.75 $52 $52
Vermont 6 $75 $75
Virginia 5 $25 $100
Washington 6.5 $175 $175
Washington, D.C. 5.75 $150 $150
West Virginia 6 $50 $100
Wisconsin 5 $100 $170
Wyoming 4 $100 $100
Source: AT&T Small Business Resources.
Stumbling Blocks to Entrepreneurship in Low- and Moderate-Income Communities 89
Anecdotal evidence for the impact of governmental regulations as a barrier toentrepreneurship is substantial. For instance, Cleveland, Ohio, requires any newtaxicab company to have a fleet of at least 25 cars–all of whichmust be three yearsold or younger. The Ohio cities of Akron, Canton, and Dayton require potentialtaxicab operators to demonstrate to government officials that their firms willmeet so-called ‘‘public convenience and necessity’’ requirements before they canbegin operation. Licensing is another potential stumbling block. The State ofCalifornia requires professions such as landscape architects and interior decora-tors to be licensed. Nationally there are some five hundred occupations (includingfence installers and courtroom shorthand reporters) with licensing requirements.Table 8 shows other impediments, such as fees to incorporate and fees to establishlimited liability companies. These vary widely across states, and undoubtedlycontribute to variable entrepreneurial activity across geographical regions.
Other regulations that might be problematic for entrepreneurs apply tolending. Although intended to benefit borrowers, these regulations can havethe perverse effect of decreasing the availability of loans to businesses. Bank-ruptcy exemption regulations, for example, might be a barrier to entrepreneur-ship. Unincorporated business owners are personally liable for their commercialendeavors, so an increase in personal bankruptcy exemptions lowers the recov-ery value of defaulted loans. This could increase the cost of loans, and decreasetheir availability. Berkowitz and White (2002) studies the impact of personalbankruptcy exemption levels on the probability of small firms being deniedcredit using data from the 1993 Survey of Small Business Finances (SSBF) andfinds that high exemption levels ‘‘are associated with an increase in the prob-ability of noncorporate firms being denied credit’’ (Berkowitz and White, 2002,p.446). Persad (2004), using SBA 7(a) data, finds that personal bankruptcyexemption levels are associated positively with default rates and loan interestrates. In addition, Barth, Cordes, and Yezer (1983 and 1986) finds that restric-tions on creditor remedies (such as wage garnishment, wage assignment, anddeficiency judgments) have net costs to borrowers in the personal loan market.This impact also relates to small business finance; as the SSBF suggests, manysmall-business owners fund their operations with personal liabilities.
7 An Indirect Approach to Assessing Determinants
of Entrepreneurship
Our initial approach to examining factors that may explain cross-sectionalvariation in entrepreneurship across geographic regions is based on the size ofbusinesses as measured by number of employees. The analysis considers totalnumber and size composition of establishments in 204 MSAs. We examineestablishments grouped into four size categories (0, 1–10, 11–100, and morethan 100 employees), as well as all establishments combined. To the extent thatthe intensity of entrepreneurial activity is greater in smaller than bigger
90 J. R. Barth et al.
businesses, examining the determinants of the relative importance of smaller
versus bigger businesses represents an indirect study of the differences in
entrepreneurship across geographical regions.6 The basic model is as follows:
ESTij ¼ �þ �10Dij þ �2
0Pþ �3
0Fij þ �4
0Bij þ "ij; (1)
where EST is either all establishments or the share of establishments as repre-
sented by one of the four size categories; D includes the race, ethnic, gender, age,
and educational level (four-year college degree or higher, and high schooldiploma or lower), composition of the population, average household income,
homeownership rate, poverty level, unemployment rate, and number of estab-
lishments per square mile (except in the total number of establishment regres-
sions, in which only the land area is used); P is the state sales tax rate; F aremeasures of available financial resources, about whichmore will be saidmomen-
tarily; B are the measures of loan bias discussed earlier (i.e., BLMIPB–loan bias
for LMI communities based on income; BLIPB–loan bias for LI communities
based on population; BLMIIB–loan bias for LMI communities based onincome; BLIIB–loan bias for LI communities based on income; is a random
error term; i is a subscript for MSA, and j is a subscript for state.The variables included in F are the total number of financial institutions; the
number of branches per institution; the total deposits per institution; the totalnumber and average size of loans to businesses made by banks under CRA; the
proportion of the number and amount of loans to businesses in low-income (LI)
and moderate-income (MI) communities to the total number and amount of
loans to all businesses in an MSA; the proportion of the number and amount ofloans made to businesses in low- andmoderate-income communities (LMI) to all
businesses in an MSA; and the proportion of the number and amount of loans
made to businesses with receipts less than $1 million to the total number and
amount of loans to all businesses. A list of all the variables, their definitions, datasources, and summary of statistics is provided in Table 9a, and Table 9b contains
the pairwise correlations for the variables. There are five basic models: one for
total establishments and four representing each of the establishment size cate-
gories. Each model has six specifications reflecting mainly the inclusion or exclu-sion of different combinations of the LI and MI loan variables, discussed below.
Tables 10–14 present the empirical results of our exercise. We summarize
them as follows:
Population
l Total population is not a significant factor in explaining the total level or theshares of establishments with either 0 or 11–100 employees in MSAs. But
6 Lucas (1978) contends that smaller businesses have less managerial talent and, therefore,one would expect to find that smaller businesses are likely located in regions with lower levelsof income per capita.
Stumbling Blocks to Entrepreneurship in Low- and Moderate-Income Communities 91
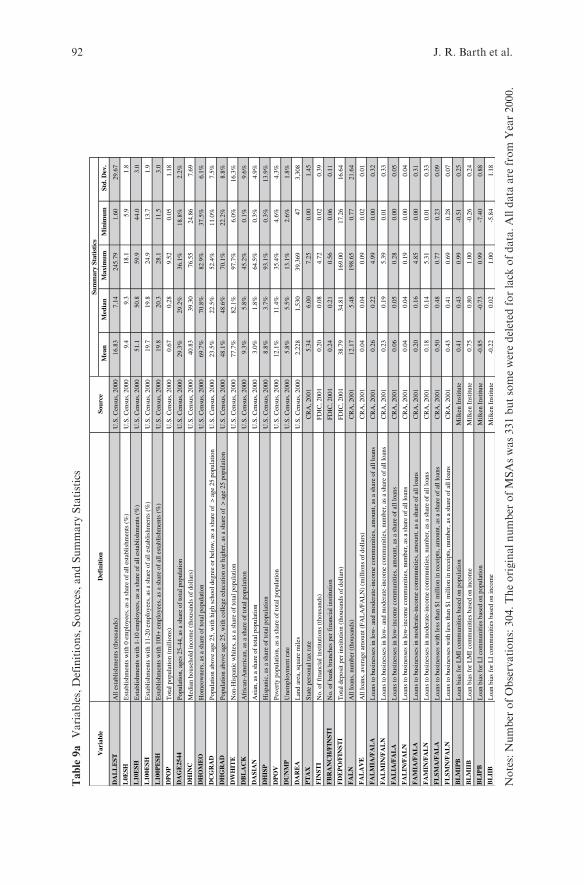
Table9a
Variables,Definitions,Sources,andSummary
Statistics
Mea
n M
edia
n M
axim
um M
inim
um S
td. D
ev.
DA
LL
EST
All
esta
blis
hmen
ts (
thou
sand
s)U
.S. C
ensu
s, 2
000
16.8
37.
1424
5.79
1.60
29.6
7
L0E
SHE
stab
lishm
ents
with
0 e
mpl
oyee
s, a
s a
shar
e of
all
esta
blis
hmen
ts (
%)
U.S
. Cen
sus,
200
09.
49.
318
.15.
91.
8
L10
ESH
Est
ablis
hmen
ts w
ith 1
-10
empl
oyee
s, a
s a
shar
e of
all
esta
blis
hmen
ts (
%)
U.S
. Cen
sus,
200
051
.150
.859
.944
.03.
0
L10
0ESH
Est
ablis
hmen
ts w
ith 1
1-20
em
ploy
ees,
as
a sh
are
of a
ll es
tabl
ishm
ents
(%
)U
.S. C
ensu
s, 2
000
19.7
19.8
24.9
13.7
1.9
L10
0PE
SHE
stab
lishm
ents
with
100
+ e
mpl
oyee
s, a
s a
shar
e of
all
esta
blis
hmen
ts (
%)
U.S
. Cen
sus,
200
019
.820
.328
.111
.53.
0
DP
OP
Tot
al p
opul
atio
n (m
illio
ns)
U.S
. Cen
sus,
200
00.
670.
289.
520.
051.
18
DA
GE
2544
Popu
latio
n, a
ges
25-4
4, a
s a
shar
e of
tota
l pop
ulat
ion
U.S
. Cen
sus,
200
029
.3%
29.2
%36
.1%
18.8
%2.
2%
DH
INC
Med
ian
hous
ehol
d in
com
e (t
hous
ands
of
dolla
rs)
U.S
. Cen
sus,
200
040
.83
39.3
076
.55
24.8
67.
69
DH
OM
EO
Hom
eow
ners
, as
a sh
are
of to
tal p
opul
atio
nU
.S. C
ensu
s, 2
000
69.7
%70
.8%
82.9
%37
.5%
6.1%
DC
GR
AD
Popu
latio
n ab
ove
age
25, w
ith h
igh
scho
ol d
egre
e or
bel
ow, a
s a
shar
e of
> a
ge 2
5 po
pula
tion
U.S
. Cen
sus,
200
023
.5%
22.5
%52
.4%
11.0
%7.
5%
DH
GR
AD
Popu
latio
n ab
ove
age
25, w
ith c
olle
ge e
duca
tion
or h
ighe
r, a
s a
shar
e of
> a
ge 2
5 po
pula
tion
U.S
. Cen
sus,
200
048
.1%
48.6
%70
.1%
22.2
%8.
8%
DW
HIT
EN
on-H
ispa
nic
whi
tes,
as
a sh
are
of to
tal p
opul
atio
nU
.S. C
ensu
s, 2
000
77.7
%82
.1%
97.7
%6.
0%16
.3%
DB
LA
CK
Afr
ican
-Am
eric
an, a
s a
shar
e of
tota
l pop
ulat
ion
U.S
. Cen
sus,
200
09.
3%5.
8%45
.2%
0.1%
9.6%
DA
SIA
NA
sian
, as
a sh
are
of to
tal p
opul
atio
nU
.S. C
ensu
s, 2
000
3.0%
1.8%
64.5
%0.
3%4.
9%
DH
ISP
His
pani
c, a
s a
shar
e of
tota
l pop
ulat
ion
U.S
. Cen
sus,
200
08.
8%3.
7%93
.1%
0.3%
13.9
%
DP
OV
Pove
rty
popu
latio
n, a
s a
shar
e of
tota
l pop
ulat
ion
U.S
. Cen
sus,
200
012
.1%
11.4
%35
.4%
4.6%
4.3%
DU
NM
PU
nem
ploy
men
t rat
eU
.S. C
ensu
s, 2
000
5.8%
5.5%
13.1
%2.
6%1.
8%
DA
RE
AL
and
area
, squ
are
mile
sU
.S. C
ensu
s, 2
000
2,22
81,
530
39,3
6947
3,30
8
PT
AX
Stat
e pe
rson
al ta
x ra
teC
RA
, 200
15.
346.
007.
250.
001.
45
FIN
STI
No.
of
fina
ncia
l ins
titut
ions
(th
ousa
nds)
FDIC
, 200
10.
200.
084.
720.
020.
39
FB
RA
NC
H/F
INST
IN
o. o
f ba
nk b
ranc
hes
per
fina
ncia
l ins
titut
ion
FDIC
, 200
10.
240.
210.
560.
060.
11
FD
EP
O/F
INST
IT
otal
dep
osit
per
inst
itutio
n (t
hous
ands
of
dolla
rs)
FDIC
, 200
138
.79
34.8
116
9.00
17.2
616
.64
FA
LN
All
loan
s, n
umbe
r (t
hous
ands
)C
RA
, 200
112
.17
5.48
198.
650.
7721
.64
FA
LA
VE
All
loan
s, a
vera
ge a
mou
nt (
FAL
A/F
AL
N)
(mill
ions
of
dolla
rs)
CR
A, 2
001
0.04
0.04
0.09
0.02
0.01
FA
LM
IA/F
AL
AL
oans
to b
usin
esse
s in
low
- an
d m
oder
ate-
inco
me
com
mun
ities
, am
ount
, as
a sh
are
of a
ll lo
ans
CR
A, 2
001
0.26
0.22
4.99
0.00
0.32
FA
LM
IN/F
AL
NL
oans
to b
usin
esse
s in
low
- an
d m
oder
ate-
inco
me
com
mun
ities
, num
ber,
as
a sh
are
of a
ll lo
ans
CR
A, 2
001
0.23
0.19
5.39
0.01
0.33
FA
LIA
/FA
LA
Loa
ns to
bus
ines
ses
in lo
w-i
ncom
e co
mm
uniti
es, a
mou
nt, a
s a
shar
e of
all
loan
sC
RA
, 200
10.
060.
050.
280.
000.
05
FA
LIN
/FA
LN
Loa
ns to
bus
ines
ses
in lo
w-i
ncom
e co
mm
uniti
es, n
umbe
r, a
s a
shar
e of
all
loan
sC
RA
, 200
10.
040.
040.
190.
000.
04
FA
MIA
/FA
LA
Loa
ns to
bus
ines
ses
in m
oder
ate-
inco
me
com
mun
ities
, am
ount
, as
a sh
are
of a
ll lo
ans
CR
A, 2
001
0.20
0.16
4.85
0.00
0.31
FA
MIN
/FA
LN
Loa
ns to
bus
ines
ses
in m
oder
ate-
inco
me
com
mun
ities
, num
ber,
as
a sh
are
of a
ll lo
ans
CR
A, 2
001
0.18
0.14
5.31
0.01
0.33
FL
SMA
/FA
LA
Loa
ns to
bus
ines
ses
with
less
than
$1
mill
ion
in r
ecei
pts,
am
ount
, as
a sh
are
of a
ll lo
ans
CR
A, 2
001
0.50
0.48
0.77
0.23
0.09
FL
SMN
/FA
LN
Loa
ns to
bus
ines
ses
with
less
than
$1
mill
ion
in r
ecei
pts,
num
ber,
as
a sh
are
of a
ll lo
ans
CR
A, 2
001
0.43
0.41
0.69
0.28
0.07
BL
MIP
BL
oan
bias
for
LM
I co
mm
uniti
es b
ased
on
popu
latio
nM
ilken
Ins
titut
e0.
410.
430.
99-0
.51
0.25
BL
MII
BL
oan
bias
for
LM
I co
mm
uniti
es b
ased
on
inco
me
Milk
en I
nstit
ute
0.75
0.80
1.00
-0.2
60.
24
BL
IPB
Loa
n bi
as f
or L
I co
mm
uniti
es b
ased
on
popu
latio
nM
ilken
Ins
titut
e-0
.85
-0.7
30.
99-7
.40
0.88
BL
IIB
Loa
n bi
as f
or L
I co
mm
uniti
es b
ased
on
inco
me
Milk
en I
nstit
ute
-0.2
20.
021.
00-5
.84
1.18
Var
iabl
eD
efin
itio
nSo
urce
Sum
mar
y St
atis
tics
Notes:Number
ofObservations:304.Theoriginalnumber
ofMSAswas331butsomeweredeleted
forlack
ofdata.Alldata
are
from
Year2000.
92 J. R. Barth et al.
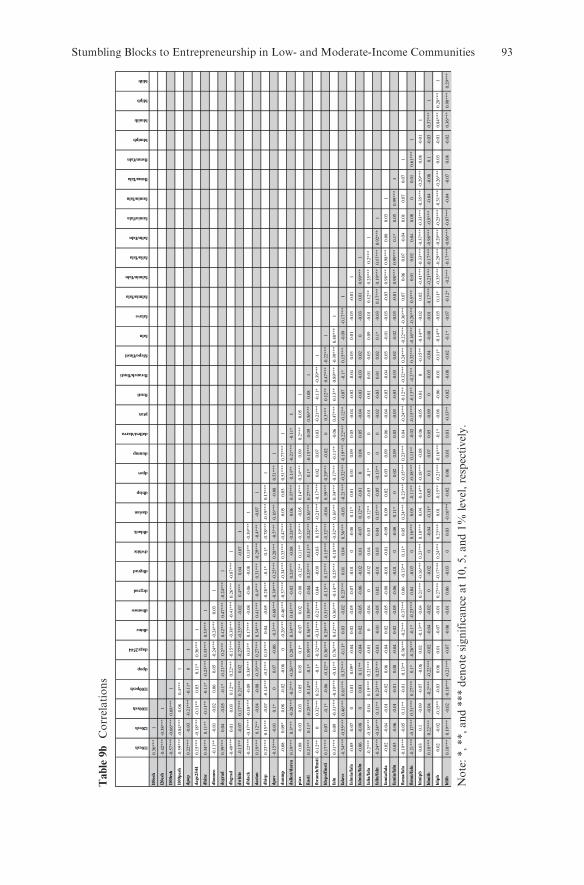
Table9b
Correlations
l10esh
l20esh
l100esh
l100pesh
dpop
dage2544
dhinc
dhomeo
dcgrad
dhgrad
dwhite
dblack
dasian
dhisp
dpov
dunmp
dallest/darea
ptax
finsti
fbranch/finsti
fdepo/finsti
faln
falave
falmia/fala
falmin/faln
falia/fala
falin/faln
famia/fala
famin/faln
flsma/fala
flsmn/faln
blmipb
blmiib
blipb
bliib
l10e
sh0.
36**
*1
l20e
sh-0
.42*
**-0
.38*
**1
l100
esh
-0.5
7***
-0.6
6***
0.68
***
1
l100
pesh
-0.5
9***
-0.8
4***
0.08
0.4*
**1
dpop
0.22
***
-0.0
3-0
.21*
**-0
.11*
01
dage
2544
0.15
***
-0.1
8***
-0.1
1**
0.03
0.11
*0.
36**
*1
dhin
c0.
34**
*0.
11**
-0.1
1**
-0.1
1*-0
.23*
**0.
33**
*0.
53**
*1
dhom
eo-0
.11*
*-0
.01
-0.0
20.
060.
05-0
.24*
**-0
.24*
**0.
031
dcgr
ad0.
39**
*0.
04-0
.05
-0.1
*-0
.21*
**0.
2***
0.42
***
0.47
***
-0.2
4***
1
dhgr
ad-0
.49*
**0.
010.
030.
12**
0.22
***
-0.1
5***
-0.3
8***
-0.4
1***
0.26
***
-0.8
7***
1
dwhi
te-0
.13*
*-0
.07
0.17
***
0.21
***
0.02
-0.2
7***
-0.2
3***
-0.0
20.
4***
0.04
-0.0
71
dbla
ck-0
.22*
**-0
.17*
**-0
.18*
**-0
.09
0.38
***
0.13
**0.
17**
*-0
.08
-0.0
6-0
.08
0.13
**-0
.39*
**1
dasi
an0.
19**
*0.
12**
-0.0
4-0
.08
-0.1
9***
0.27
***
0.34
***
0.41
***
-0.4
***
0.31
***
-0.2
9***
-0.4
***
-0.0
71
dhis
p0.
23**
*0.
15**
*-0
.07
-0.1
4***
-0.2
***
0.15
***
0.04
-0.0
5-0
.28*
**-0
.1*
0.1*
-0.7
8***
-0.1
9***
0.17
***
1
dpov
-0.1
5***
-0.0
10.
1*0
0.07
-0.0
6-0
.3**
*-0
.68*
**-0
.39*
**-0
.25*
**0.
28**
*-0
.5**
*0.
16**
*-0
.08
0.51
***
1
dunm
p-0
.08
0.09
*0.
08-0
.02
-0.0
60
-0.2
6***
-0.4
6***
-0.3
7***
-0.3
4***
0.33
***
-0.4
7***
0.05
0.03
0.51
***
0.77
***
1
dalle
st/d
area
0.19
***
0.3*
**-0
.28*
**-0
.2**
*-0
.26*
**0.
28**
*0.
34**
*0.
43**
*-0
.02
0.24
***
-0.0
8-0
.24*
**0.
060.
37**
*0.
14**
-0.2
1***
-0.1
1*1
ptax
-0.0
8-0
.03
0.03
0.05
0.05
0.1*
-0.0
70.
02-0
.08
-0.1
2**
0.11
**-0
.19*
**-0
.05
0.14
***
0.24
***
0.09
0.2*
**0.
051
fins
ti0.
21**
*0.
11*
-0.2
5***
-0.1
4**
-0.1
*0.
59**
*0.
36**
*0.
39**
*-0
.04
0.23
***
-0.1
1**
-0.2
4***
0.16
***
0.27
***
0.1*
-0.1
5***
-0.0
90.
56**
*0.
081
fbra
nch/
fins
ti-0
.12*
*0
0.32
***
0.21
***
-0.1
*-0
.32*
**-0
.31*
**-0
.21*
**0.
04-0
.09
-0.0
30.
15**
-0.2
1***
-0.1
7***
0.02
0.07
0.03
-0.2
1***
-0.1
1*-0
.39*
**1
fdep
o/fi
nsti
0.17
***
0.07
-0.1
*-0
.06
-0.1
2**
0.36
***
0.29
***
0.31
***
-0.1
3**
0.17
***
-0.1
5***
-0.3
2***
-0.0
40.
39**
*0.
29**
*-0
.02
00.
3***
0.12
**0.
47**
*-0
.22*
**1
faln
0.31
***
0.09
-0.3
1***
-0.1
9***
-0.1
1**
0.76
***
0.42
***
0.36
***
-0.1
4**
0.25
***
-0.1
8***
-0.3
2***
0.16
***
0.34
***
0.17
***
-0.1
1**
-0.0
60.
47**
*0.
13**
0.89
***
-0.3
9***
0.48
***
1
fala
ve-0
.34*
**-0
.55*
**0.
46**
*0.
61**
*0.
37**
*-0
.11*
0.03
-0.0
20.
23**
*0.
010.
040.
36**
*-0
.03
-0.2
1***
-0.3
2***
-0.1
9***
-0.2
2***
-0.1
2**
-0.0
7-0
.1*
0.15
***
-0.0
9-0
.17*
**1
falm
ia/f
ala
-0.0
5-0
.07
00.
010.
09*
-0.0
40.
02-0
.05
-0.0
7-0
.01
0-0
.08
0.11
*0.
010.
010.
090.
05-0
.04
-0.0
2-0
.04
0.03
0.01
-0.0
3-0
.01
1
falm
in/f
aln
-0.0
6-0
.08
00.
010.
11**
-0.0
40.
02-0
.05
-0.0
6-0
.02
0.01
-0.0
70.
12**
-0.0
10
0.08
0.05
-0.0
4-0
.03
-0.0
30.
020
-0.0
30.
010.
99**
*1
falia
/fal
a-0
.2**
*-0
.18*
**0.
040.
19**
*0.
21**
*-0
.01
0-0
.04
0-0
.02
0.04
0.03
0.12
**-0
.03
-0.1
*0
0-0
.01
0.01
0.01
0.03
0.09
-0.0
10.
12**
0.25
***
0.2*
**1
falin
/fal
n-0
.24*
**-0
.24*
**0.
11**
0.23
***
0.25
***
-0.0
1-0
.01
-0.0
50.
02-0
.01
0.03
0.04
0.15
***
-0.0
5-0
.13*
*0
0-0
.02
-0.0
30.
010.
020.
1*-0
.03
0.17
***
0.19
***
0.17
***
0.92
***
1
fam
ia/f
ala
-0.0
2-0
.04
-0.0
1-0
.02
0.06
-0.0
40.
02-0
.05
-0.0
8-0
.01
-0.0
1-0
.09
0.09
0.02
0.03
0.09
0.06
-0.0
4-0
.03
-0.0
40.
03-0
.01
-0.0
3-0
.03
0.98
***
0.98
***
0.08
0.03
1
fam
in/f
aln
-0.0
3-0
.06
-0.0
1-0
.01
0.08
-0.0
40.
02-0
.05
-0.0
6-0
.01
0-0
.08
0.11
*0
0.02
0.09
0.05
-0.0
3-0
.03
-0.0
30.
02-0
.02
-0.0
3-0
.01
0.98
***
0.99
***
0.1*
0.05
0.99
***
1
flsm
a/fa
la-0
.19*
**-0
.05
0.11
**-0
.01
0.13
**-0
.36*
**-0
.2**
*-0
.37*
**0.
06-0
.13*
*0.
11*
0.05
0.24
***
-0.2
3***
-0.1
5***
0.23
***
0.04
-0.2
4***
-0.1
2**
-0.3
2***
0.24
***
-0.2
2***
-0.3
6***
0.07
0.06
0.07
-0.0
40.
010.
070.
071
flsm
n/fa
ln-0
.21*
**-0
.17*
**0.
31**
*0.
27**
*0.
1*-0
.26*
**-0
.1*
-0.2
3***
0.04
-0.0
30
0.16
***
0.05
-0.1
1**
-0.1
8***
0.11
**-0
.02
-0.1
5***
-0.1
3**
-0.2
***
0.32
***
-0.1
6***
-0.2
6***
0.5*
**0.
010.
020.
040.
080
0.01
0.61
***
1
blm
ipb
0.03
0.1
-0.0
9-0
.07
-0.0
60.
02-0
.13*
*-0
.04
0.21
***
-0.1
6***
0.23
***
0.18
***
0.04
-0.1
4**
-0.1
8***
-0.0
8-0
.06
-0.0
50.
010
-0.1
5**
-0.1
4**
-0.0
20.
02-0
.41*
**-0
.33*
**-0
.37*
**-0
.33*
**-0
.35*
**-0
.29*
**0.
08-0
.01
1
blm
iib0.
18**
*0.
22**
*-0
.04
-0.2
***
-0.2
2***
-0.0
2-0
.04
-0.0
20
-0.0
20
-0.0
4-0
.11*
0.03
0.1
0.07
0.05
-0.0
90
-0.0
3-0
.04
-0.0
8-0
.01
-0.1
7***
-0.2
1***
-0.1
7***
-0.9
8***
-0.9
***
-0.0
4-0
.08
0.1
-0.0
30.
37**
*1
blip
b0.
02-0
.02
-0.1
5**
-0.0
30.
060.
01-0
.07
-0.0
10.
27**
*-0
.17*
**0.
24**
*0.
23**
*0.
01-0
.15*
*-0
.21*
**-0
.16*
**-0
.1*
-0.0
6-0
.06
-0.0
1-0
.11*
-0.1
4**
-0.0
30.
11*
-0.3
5***
-0.2
9***
-0.2
9***
-0.2
5***
-0.3
1***
-0.2
6***
0.03
-0.0
10.
84**
*0.
28**
*1
bliib
0.18
***
0.19
***
-0.0
2-0
.18*
**-0
.21*
**-0
.07
-0.0
6-0
.01
0.06
-0.0
30
0.03
-0.1
6***
-0.0
20.
060.
010.
01-0
.13*
*-0
.02
-0.0
8-0
.02
-0.1
*-0
.07
-0.1
2*-0
.2**
*-0
.17*
**-0
.96*
**-0
.87*
**-0
.04
-0.0
70.
08-0
.02
0.36
***
0.98
***
0.29
***
Note:*,**,and***denote
significance
at10,5,and1%
level,respectively.
Stumbling Blocks to Entrepreneurship in Low- and Moderate-Income Communities 93

population is related positively to a larger share of establishments with morethan 100 employees, and negatively associated with the share of establish-ments with 1–10 employees.
l MSAswith larger shares of the population in the 25–44 age group tend to havemore establishments. This segment of the population correlates negativelywith a larger share of small establishments (those with 0 and 1–10 employees),and positively with the share of establishments with more than 10 employees.
Table 10 Determinants of the total number of establishments in MSAs
(1) (2) (3) (4) (5) (6) (7) (8) (9) (10)C -52.35 -17.4971 -18.169 -19.3771 -17.8355 -15.104 -58.0395* -57.4187* -58.2001* -57.5618*
(0.13) (0.35) (0.33) (0.32) (0.34) (0.42) (0.07) (0.07) (0.07) (0.07)DPOP 6.9919*** 0.7933 0.8025 0.8182 0.7941 0.7341 4.7605* 4.7646* 4.7656* 4.7647*
(0.00) (0.21) (0.2) (0.2) (0.21) (0.25) (0.05) (0.05) (0.05) (0.05)DAGE2544 89.4948*** 36.5161** 36.887** 36.2153** 36.6461** 37.2844*** 56.6351** 56.194** 56.3769** 56.2983**
(0.00) (0.01) (0.01) (0.01) (0.01) (0.01) (0.03) (0.03) (0.03) (0.03)DHINC -0.2693 0.0307 0.0354 0.0292 0.0318 0.0238 0.0678 0.0713 0.0687 0.0721
(0.2) (0.72) (0.68) (0.74) (0.71) (0.78) (0.64) (0.62) (0.63) (0.62)DHOMEO 25.1614 15.0137* 15.4675* 15.716* 15.1018* 14.9274* 32.5734** 32.7334** 32.641** 32.884**
(0.2) (0.07) (0.06) (0.06) (0.07) (0.07) (0.02) (0.02) (0.02) (0.02)DCGRAD -17.8901 -1.6203 -0.9965 -2.2475 -1.3086 -1.9156 -19.1231 -19.3292 -18.9967 -19.5014
(0.35) (0.86) (0.92) (0.8) (0.89) (0.83) (0.13) (0.13) (0.13) (0.13)DHGRAD -30.979*** -8.2244 -7.5181 -9.3567 -7.8851 -8.6132 -27.6072*** -27.6173*** -27.3728*** -27.7399***
(0.01) (0.2) (0.25) (0.14) (0.22) (0.17) (0.00) (0.00) (0.00) (0.00)DWHITE 37.3751 -1.8691 -2.709 0.4799 -2.0379 -2.0295 26.8032 26.6357 26.8973 26.3373
(0.18) (0.89) (0.84) (0.97) (0.88) (0.88) (0.21) (0.21) (0.21) (0.22)DBLACK 35.5407 -7.6439 -8.2912 -4.6843 -7.7413 -7.1919 25.1725 24.8345 25.2457 24.3809
(0.19) (0.56) (0.51) (0.73) (0.55) (0.59) (0.21) (0.22) (0.21) (0.22)DASIAN 57.9889* -2.1364 -3.6306 0.2821 -2.5474 -1.6941 44.9694 44.9436 45.0031 44.6178
(0.09) (0.88) (0.8) (0.98) (0.86) (0.91) (0.1) (0.11) (0.1) (0.11)DHISP 40.2164 -5.3202 -6.307 -2.9899 -5.5578 -5.8122 26.7493 26.5794 26.7759 26.3059
(0.15) (0.7) (0.63) (0.83) (0.68) (0.67) (0.18) (0.18) (0.18) (0.19)DPOV -2.2796 11.2356 11.723 10.5979 11.3069 13.996 35.5476 36.418 35.5795 36.4716
(0.94) (0.44) (0.43) (0.47) (0.44) (0.33) (0.23) (0.23) (0.23) (0.23)DUNMP -38.6361 -0.0459 0.8192 4.1101 0.2486 -3.487 -21.7382 -22.6779 -21.7235 -22.7742
(0.26) (1) (0.97) (0.83) (0.99) (0.86) (0.46) (0.44) (0.46) (0.44)DAREA 0.0005* 0.0001 0.0001 0.0001 0.0001 0.0001 0.0004** 0.0004** 0.0004** 0.0004**
(0.05) (0.22) (0.23) (0.21) (0.22) (0.24) (0.03) (0.03) (0.03) (0.03)PTAX 0.4053 0.064 0.0598 0.0125 0.0659 0.0509 0.1419 0.1398 0.1416 0.138
(0.24) (0.76) (0.77) (0.94) (0.75) (0.81) (0.64) (0.64) (0.65) (0.65)FINSTI 54.2215*** 19.7425*** 19.706*** 19.8558*** 19.7332*** 19.7511*** 71.0229*** 71.0204*** 71.0165*** 70.9787***
(0.00) (0.00) (0.00) (0.00) (0.00) (0.00) (0.00) (0.00) (0.00) (0.00)FBRANCH/FINSTI -1.5591 -0.0292 -0.154 -0.3516 -0.0387 0.6351 7.1136 6.9617 7.0515 6.8936
(0.77) (1) (0.98) (0.95) (0.99) (0.91) (0.24) (0.24) (0.24) (0.25)FDEPO/FINSTI -1.5591 0.0177 6.9617 7.0515 6.8936
(0.77) (0.58) (0.24) (0.24) (0.25)FALN 0.9722*** 0.9726*** 0.9679*** 0.9725*** 0.9717***
(0.00) (0.00) (0.00) (0.00) (0.00)FALAVE 17.5219 19.1437 22.6161 18.2856 25.3088
(0.4) (0.38) (0.34) (0.39) (0.37)FALMIA/FALA 7.0293
(0.27)FALMIN/FALN -6.6582
(0.27)FALIA/FALA 28.6861
(0.26)FALIN/FALN -41.2395
(0.25)FAMIA/FALA 2.4595
(0.49)FAMIN/FALN -2.3066
(0.48)FLSMA/FALA -2.197
(0.51)FLSMN/FALN -2.9871
(0.56)BLMIPB 0.1719
(0.87)BLMIIB 0.0162
(0.6)BLIPB 0.0175
(0.58)BLIIB 0.0157
(0.61)Adjusted R2 0.91 0.96 0.96 0.96 0.96 0.96 0.88 0.88 0.88 0.88F-statistic 187.24 448.94 402.63 406.22 401.34 402.44 108.85 108.89 108.85 108.93Prob (F-statistic) 0.00 0.00 0.00 0.00 0.00 0.00 0.00 0.00 0.00 0.00Number of Observations 304 304 304 304 304 304 263 263 263 263
Note: White heteroskedasticity-consistent standard errors and covariance, and p-values inparentheses. *, ** and *** denote significance at 10, 5, and 1% level, respectively.
94 J. R. Barth et al.
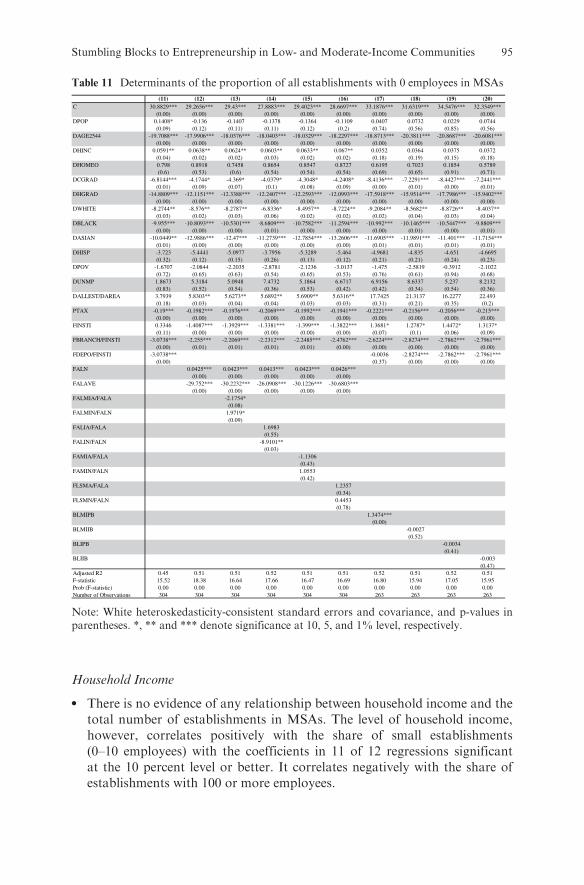
Household Income
l There is no evidence of any relationship between household income and thetotal number of establishments in MSAs. The level of household income,however, correlates positively with the share of small establishments(0–10 employees) with the coefficients in 11 of 12 regressions significantat the 10 percent level or better. It correlates negatively with the share ofestablishments with 100 or more employees.
Table 11 Determinants of the proportion of all establishments with 0 employees in MSAs
(11) (12) (13) (14) (15) (16) (17) (18) (19) (20)C 30.8829*** 29.2656*** 29.43*** 27.8883*** 29.4023*** 28.6697*** 33.1876*** 31.6319*** 34.5476*** 32.3549***
(0.00) (0.00) (0.00) (0.00) (0.00) (0.00) (0.00) (0.00) (0.00) (0.00)DPOP 0.1408* -0.136 -0.1407 -0.1378 -0.1364 -0.1109 0.0407 0.0732 0.0229 0.0744
(0.09) (0.12) (0.11) (0.11) (0.12) (0.2) (0.74) (0.56) (0.85) (0.56)DAGE2544 -19.7088*** -17.9906*** -18.0376*** -18.0403*** -18.0329*** -18.2297*** -18.8713*** -20.3811*** -20.8687*** -20.6081***
(0.00) (0.00) (0.00) (0.00) (0.00) (0.00) (0.00) (0.00) (0.00) (0.00)DHINC 0.0591** 0.0638** 0.0624** 0.0603** 0.0633** 0.067** 0.0352 0.0364 0.0375 0.0372
(0.04) (0.02) (0.02) (0.03) (0.02) (0.02) (0.18) (0.19) (0.15) (0.18)DHOMEO 0.798 0.8918 0.7458 0.8654 0.8547 0.8727 0.6195 0.7023 0.1854 0.5789
(0.6) (0.53) (0.6) (0.54) (0.54) (0.54) (0.69) (0.65) (0.91) (0.71)DCGRAD -6.8144*** -4.1744* -4.369* -4.0379* -4.3048* -4.2408* -8.4136*** -7.2291*** -8.4427*** -7.2441***
(0.01) (0.09) (0.07) (0.1) (0.08) (0.09) (0.00) (0.01) (0.00) (0.01)DHGRAD -14.8809*** -12.1151*** -12.3388*** -12.2407*** -12.2593*** -12.0993*** -17.5918*** -15.9514*** -17.7986*** -15.9402***
(0.00) (0.00) (0.00) (0.00) (0.00) (0.00) (0.00) (0.00) (0.00) (0.00)DWHITE -8.2744** -8.576** -8.2787** -6.8336* -8.4957** -8.7224** -9.2084** -8.5682** -8.8726** -8.4037**
(0.03) (0.02) (0.03) (0.06) (0.02) (0.02) (0.02) (0.04) (0.03) (0.04)DBLACK -9.955*** -10.8093*** -10.5301*** -8.6809*** -10.7582*** -11.2594*** -10.992*** -10.1465*** -10.5447*** -9.8809***
(0.00) (0.00) (0.00) (0.01) (0.00) (0.00) (0.00) (0.01) (0.00) (0.01)DASIAN -10.0449** -12.9886*** -12.47*** -11.2739*** -12.7854*** -13.2606*** -11.6905*** -11.9891*** -11.401*** -11.7154***
(0.01) (0.00) (0.00) (0.00) (0.00) (0.00) (0.01) (0.01) (0.01) (0.01)DHISP -3.723 -5.4441 -5.0977 -3.7956 -5.3289 -5.464 -4.9681 -4.835 -4.651 -4.6695
(0.32) (0.12) (0.15) (0.26) (0.13) (0.12) (0.21) (0.21) (0.24) (0.23)DPOV -1.6707 -2.0844 -2.2035 -2.8781 -2.1236 -3.0137 -1.475 -2.5819 -0.3912 -2.1022
(0.72) (0.65) (0.63) (0.54) (0.65) (0.53) (0.76) (0.61) (0.94) (0.68)DUNMP 1.8673 5.3184 5.0948 7.4732 5.1864 6.6717 6.9156 8.6337 5.237 8.2132
(0.83) (0.52) (0.54) (0.36) (0.53) (0.42) (0.42) (0.34) (0.54) (0.36)DALLEST/DAREA 3.7939 5.8303** 5.6273** 5.6892** 5.6909** 5.6316** 17.7425 21.3137 16.2277 22.493
(0.18) (0.03) (0.04) (0.04) (0.03) (0.03) (0.31) (0.21) (0.35) (0.2)PTAX -0.19*** -0.1982*** -0.1976*** -0.2069*** -0.1992*** -0.1941*** -0.2221*** -0.2156*** -0.2056*** -0.215***
(0.00) (0.00) (0.00) (0.00) (0.00) (0.00) (0.00) (0.00) (0.00) (0.00)FINSTI 0.3346 -1.4087*** -1.3929*** -1.3381*** -1.399*** -1.3822*** 1.3681* 1.2787* 1.4472* 1.3137*
(0.11) (0.00) (0.00) (0.00) (0.00) (0.00) (0.07) (0.1) (0.06) (0.09)FBRANCH/FINSTI -3.0738*** -2.255*** -2.2069*** -2.2312*** -2.2485*** -2.4762*** -2.6224*** -2.8274*** -2.7862*** -2.7961***
(0.00) (0.01) (0.01) (0.01) (0.01) (0.00) (0.00) (0.00) (0.00) (0.00)FDEPO/FINSTI -3.0738*** -0.0036 -2.8274*** -2.7862*** -2.7961***
(0.00) (0.37) (0.00) (0.00) (0.00)FALN 0.0425*** 0.0423*** 0.0413*** 0.0423*** 0.0426***
(0.00) (0.00) (0.00) (0.00) (0.00)FALAVE -29.752*** -30.2232*** -26.0908*** -30.1226*** -30.6803***
(0.00) (0.00) (0.00) (0.00) (0.00)FALMIA/FALA -2.1754*
(0.08)FALMIN/FALN 1.9719*
(0.09)FALIA/FALA 1.6983
(0.55)FALIN/FALN -8.9101**
(0.03)FAMIA/FALA -1.1306
(0.43)FAMIN/FALN 1.0553
(0.42)FLSMA/FALA 1.2357
(0.34)FLSMN/FALN 0.4453
(0.78)BLMIPB 1.3474***
(0.00)BLMIIB -0.0027
(0.52)BLIPB -0.0034
(0.41)BLIIB -0.003
(0.47)Adjusted R2 0.45 0.51 0.51 0.52 0.51 0.51 0.52 0.51 0.52 0.51F-statistic 15.52 18.38 16.64 17.66 16.47 16.69 16.80 15.94 17.05 15.95Prob (F-statistic) 0.00 0.00 0.00 0.00 0.00 0.00 0.00 0.00 0.00 0.00Number of Observations 304 304 304 304 304 304 263 263 263 263
Note: White heteroskedasticity-consistent standard errors and covariance, and p-values inparentheses. *, ** and *** denote significance at 10, 5, and 1% level, respectively.
Stumbling Blocks to Entrepreneurship in Low- and Moderate-Income Communities 95
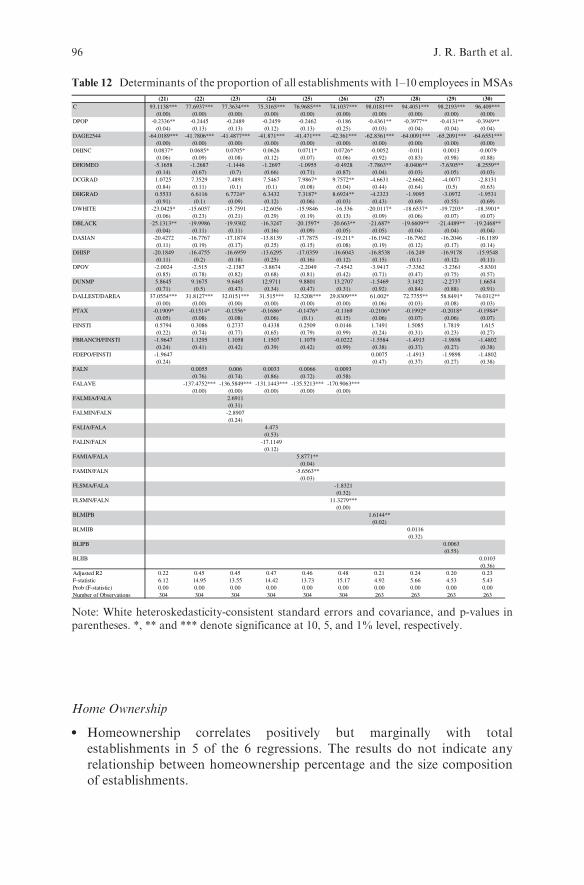
Home Ownership
l Homeownership correlates positively but marginally with totalestablishments in 5 of the 6 regressions. The results do not indicate anyrelationship between homeownership percentage and the size compositionof establishments.
Table 12 Determinants of the proportion of all establishments with 1–10 employees inMSAs
(21) (22) (23) (24) (25) (26) (27) (28) (29) (30)C 93.1138*** 77.6937*** 77.3634*** 75.3165*** 76.9685*** 74.1037*** 98.0181*** 94.4051*** 98.2193*** 96.409***
(0.00) (0.00) (0.00) (0.00) (0.00) (0.00) (0.00) (0.00) (0.00) (0.00)DPOP -0.2336** -0.2445 -0.2489 -0.2459 -0.2462 -0.186 -0.4361** -0.3977** -0.4131** -0.3949**
(0.04) (0.13) (0.13) (0.12) (0.13) (0.25) (0.03) (0.04) (0.04) (0.04)DAGE2544 -64.0189*** -41.7806*** -41.4877*** -41.871*** -41.471*** -42.361*** -62.8361*** -64.0091*** -65.2091*** -64.6551***
(0.00) (0.00) (0.00) (0.00) (0.00) (0.00) (0.00) (0.00) (0.00) (0.00)DHINC 0.0837* 0.0685* 0.0705* 0.0626 0.0711* 0.0726* -0.0052 -0.011 0.0013 -0.0079
(0.06) (0.09) (0.08) (0.12) (0.07) (0.06) (0.92) (0.83) (0.98) (0.88)DHOMEO -5.1658 -1.2687 -1.1446 -1.2697 -1.0955 -0.4928 -7.7863** -8.0406** -7.6305** -8.2559**
(0.14) (0.67) (0.7) (0.66) (0.71) (0.87) (0.04) (0.03) (0.05) (0.03)DCGRAD 1.0725 7.3529 7.4891 7.5467 7.9867* 9.7572** -4.6631 -2.6662 -4.0077 -2.8131
(0.84) (0.11) (0.1) (0.1) (0.08) (0.04) (0.44) (0.64) (0.5) (0.63)DHGRAD 0.5533 6.6116 6.7724* 6.3432 7.3187* 8.6924** -4.2323 -1.9095 -3.0972 -1.9531
(0.91) (0.1) (0.09) (0.12) (0.06) (0.03) (0.43) (0.69) (0.55) (0.69)DWHITE -23.0425* -15.6057 -15.7591 -12.6056 -15.9846 -16.336 -20.0117* -18.6537* -19.7203* -18.3901*
(0.06) (0.23) (0.21) (0.29) (0.19) (0.13) (0.09) (0.06) (0.07) (0.07)DBLACK -25.1313** -19.9986 -19.9302 -16.3247 -20.1597* -20.663** -21.687* -19.6609** -21.4489** -19.2468**
(0.04) (0.11) (0.11) (0.16) (0.09) (0.05) (0.05) (0.04) (0.04) (0.04)DASIAN -20.4272 -16.7767 -17.1874 -13.8139 -17.7875 -19.211* -16.1942 -16.7962 -16.2046 -16.1189
(0.11) (0.19) (0.17) (0.25) (0.15) (0.08) (0.19) (0.12) (0.17) (0.14)DHISP -20.1849 -16.4755 -16.6959 -13.6295 -17.0359 -16.6043 -16.8538 -16.249 -16.9178 -15.9548
(0.11) (0.2) (0.18) (0.25) (0.16) (0.12) (0.15) (0.1) (0.12) (0.11)DPOV -2.0024 -2.515 -2.1387 -3.8674 -2.2049 -7.4542 -3.9417 -7.3362 -3.2361 -5.8301
(0.85) (0.78) (0.82) (0.68) (0.81) (0.42) (0.71) (0.47) (0.75) (0.57)DUNMP 5.8645 9.1675 9.6465 12.9711 9.8801 13.2707 -1.5469 3.1452 -2.2737 1.6654
(0.71) (0.5) (0.47) (0.34) (0.47) (0.31) (0.92) (0.84) (0.88) (0.91)DALLEST/DAREA 37.0554*** 31.8127*** 32.0151*** 31.515*** 32.5208*** 29.8309*** 61.002* 72.7755** 58.8491* 74.0312**
(0.00) (0.00) (0.00) (0.00) (0.00) (0.00) (0.06) (0.03) (0.08) (0.03)PTAX -0.1909* -0.1514* -0.1556* -0.1686* -0.1476* -0.1169 -0.2106* -0.1992* -0.2018* -0.1984*
(0.05) (0.08) (0.08) (0.06) (0.1) (0.15) (0.06) (0.07) (0.06) (0.07)FINSTI 0.5794 0.3086 0.2737 0.4338 0.2509 0.0146 1.7491 1.5085 1.7819 1.615
(0.22) (0.74) (0.77) (0.65) (0.79) (0.99) (0.24) (0.31) (0.23) (0.27)FBRANCH/FINSTI -1.9647 1.1295 1.1058 1.1507 1.1079 -0.0222 -1.5584 -1.4913 -1.9898 -1.4802
(0.24) (0.41) (0.42) (0.39) (0.42) (0.99) (0.38) (0.37) (0.27) (0.38)FDEPO/FINSTI -1.9647 0.0075 -1.4913 -1.9898 -1.4802
(0.24) (0.47) (0.37) (0.27) (0.38)FALN 0.0055 0.006 0.0033 0.0066 0.0093
(0.76) (0.74) (0.86) (0.72) (0.58)FALAVE -137.4752*** -136.5849*** -131.1443*** -135.5213*** -170.9063***
(0.00) (0.00) (0.00) (0.00) (0.00)FALMIA/FALA 2.6911
(0.31)FALMIN/FALN -2.8907
(0.24)FALIA/FALA 4.473
(0.53)FALIN/FALN -17.1149
(0.12)FAMIA/FALA 5.8771**
(0.04)FAMIN/FALN -5.6563**
(0.03)FLSMA/FALA -1.8321
(0.32)FLSMN/FALN 11.3279***
(0.00)BLMIPB 1.6144**
(0.02)BLMIIB 0.0116
(0.32)BLIPB 0.0063
(0.55)BLIIB 0.0103
(0.36)Adjusted R2 0.22 0.45 0.45 0.47 0.46 0.48 0.21 0.24 0.20 0.23F-statistic 6.12 14.95 13.55 14.42 13.73 15.17 4.92 5.66 4.53 5.43Prob (F-statistic) 0.00 0.00 0.00 0.00 0.00 0.00 0.00 0.00 0.00 0.00Number of Observations 304 304 304 304 304 304 263 263 263 263
Note: White heteroskedasticity-consistent standard errors and covariance, and p-values inparentheses. *, ** and *** denote significance at 10, 5, and 1% level, respectively.
96 J. R. Barth et al.

Education
l We do not find any significant relationships between educational level andeither total establishments or the share of establishments with at least oneemployee.. But the shares of the population with at least a college degree orno more than a high school diploma tends to correlate negatively with theshare of establishments with no employees. This negative relationship isparticularly strong in the case of the high school variable.
Table 13 Determinants of the proportion of all establishments with 11–100 employees in MSAs
(31) (32) (33) (34) (35) (36) (37) (38) (39) (40)C -7.1981 2.0116 1.9568 3.4213 2.0365 2.9359 -12.287** -10.5271* -13.3226** -11.4774**
(0.19) (0.71) (0.72) (0.5) (0.71) (0.58) (0.03) (0.05) (0.02) (0.03)DPOP -0.1168 -0.0183 -0.0197 -0.0202 -0.022 -0.0545 0.0057 -0.0112 0.0249 -0.0126
(0.12) (0.89) (0.88) (0.87) (0.86) (0.67) (0.96) (0.92) (0.83) (0.91)DAGE2544 32.0876*** 18.6097*** 18.6675*** 18.6708*** 18.6845*** 18.9548*** 35.3272*** 35.788*** 36.3909*** 36.0906***
(0.00) (0.00) (0.00) (0.00) (0.00) (0.00) (0.00) (0.00) (0.00) (0.00)DHINC 0.0078 0.0164 0.0167 0.0196 0.0165 0.012 0.0537* 0.057* 0.0533* 0.0558*
(0.76) (0.45) (0.44) (0.38) (0.45) (0.58) (0.07) (0.05) (0.07) (0.06)DHOMEO 1.9593 -0.2729 -0.2601 -0.3436 -0.3023 -0.27 2.7789 2.924 3.1579 3.0539
(0.34) (0.88) (0.88) (0.85) (0.87) (0.88) (0.2) (0.17) (0.15) (0.15)DCGRAD 4.8999 0.0983 0.1091 0.0502 0.0189 0.1172 6.7583* 5.8213 6.9256* 5.8679*
(0.12) (0.97) (0.97) (0.99) (0.99) (0.97) (0.06) (0.1) (0.05) (0.1)DHGRAD 7.2376*** 2.5526 2.566 2.7943 2.4711 2.4685 8.9938*** 7.9328*** 9.4078*** 7.9371***
(0.01) (0.24) (0.24) (0.2) (0.25) (0.27) (0.00) (0.01) (0.00) (0.01)DWHITE 8.4366* 4.6491 4.6441 2.8819 4.7088 4.8717 9.4899** 8.8345** 9.2874* 8.6674**
(0.05) (0.35) (0.36) (0.52) (0.34) (0.3) (0.05) (0.04) (0.06) (0.04)DBLACK 3.5434 1.2417 1.2821 -0.9368 1.357 1.8785 3.8717 2.8819 3.569 2.6151
(0.39) (0.8) (0.79) (0.83) (0.78) (0.68) (0.38) (0.46) (0.43) (0.51)DASIAN 9.1397** 8.692* 8.6531* 6.9299 8.7936* 9.138* 9.4123* 9.7012** 9.1802* 9.3622**
(0.05) (0.09) (0.09) (0.14) (0.08) (0.06) (0.07) (0.04) (0.08) (0.05)DHISP 3.4735 2.416 2.4014 0.7275 2.4858 2.4472 4.7315 4.4229 4.4656 4.2474
(0.42) (0.62) (0.63) (0.87) (0.61) (0.6) (0.3) (0.28) (0.34) (0.3)DPOV 9.5649* 10.3635** 10.4323** 11.1373** 10.4551** 11.7852** 13.7282** 15.4207*** 13.023** 14.7452***
(0.08) (0.04) (0.04) (0.03) (0.04) (0.02) (0.02) (0.01) (0.02) (0.01)DUNMP 10.3572 6.854 6.9349 4.4638 6.8419 4.8765 6.028 3.7092 7.2009 4.3421
(0.33) (0.45) (0.45) (0.62) (0.46) (0.6) (0.57) (0.73) (0.5) (0.69)DALLEST/DAREA -17.6569*** -15.3258*** -15.3017*** -15.0627*** -15.3812*** -14.9941*** -6.8599 -12.7596 -6.1309 -13.7956
(0.00) (0.00) (0.00) (0.00) (0.00) (0.00) (0.7) (0.47) (0.73) (0.44)PTAX 0.1365** 0.1157** 0.1149** 0.1296** 0.1143** 0.109** 0.1274** 0.1221** 0.1162* 0.1215**
(0.01) (0.04) (0.04) (0.03) (0.04) (0.05) (0.04) (0.04) (0.06) (0.04)FINSTI -0.0253 0.7539 0.7479 0.6742 0.7494 0.7264 -1.6041** -1.4853* -1.6596** -1.5337**
(0.91) (0.17) (0.18) (0.21) (0.18) (0.21) (0.04) (0.05) (0.03) (0.04)FBRANCH/FINSTI 5.5478*** 3.431*** 3.4304*** 3.4502*** 3.4448*** 3.7687*** 5.6606*** 5.6022*** 5.6958*** 5.5803***
(0.00) (0.00) (0.00) (0.00) (0.00) (0.00) (0.00) (0.00) (0.00) (0.00)FDEPO/FINSTI 5.5478*** -0.0027 5.6022*** 5.6958*** 5.5803***
(0.00) (0.62) (0.00) (0.00) (0.00)FALN -0.0172 -0.0171 -0.0156 -0.0171 -0.0174
(0.22) (0.23) (0.25) (0.23) (0.24)FALAVE 90.8097*** 90.9548*** 87.0376*** 90.7309*** 93.0853***
(0.00) (0.00) (0.00) (0.00) (0.00)FALMIA/FALA 0.3689
(0.78)FALMIN/FALN -0.4302
(0.72)FALIA/FALA -5.1177
(0.12)FALIN/FALN 12.9234**
(0.02)FAMIA/FALA -0.3203
(0.84)FAMIN/FALN 0.1343
(0.92)FLSMA/FALA -1.6383
(0.2)FLSMN/FALN -0.9503
(0.59)BLMIPB -0.7146
(0.11)BLMIIB -0.0048
(0.42)BLIPB -0.0031
(0.56)BLIIB -0.0043
(0.46)Adjusted R2 0.21 0.46 0.46 0.48 0.46 0.47 0.25 0.27 0.26 0.26F-statistic 5.77 15.61 13.96 14.88 13.99 14.37 5.80 6.29 6.02 6.21Prob (F-statistic) 0.00 0.00 0.00 0.00 0.00 0.00 0.00 0.00 0.00 0.00Number of Observations 304 304 304 304 304 304 263 263 263 263
Note: White heteroskedasticity-consistent standard errors and covariance, and p-values inparentheses. *, ** and *** denote significance at 10, 5, and 1% level, respectively
Stumbling Blocks to Entrepreneurship in Low- and Moderate-Income Communities 97
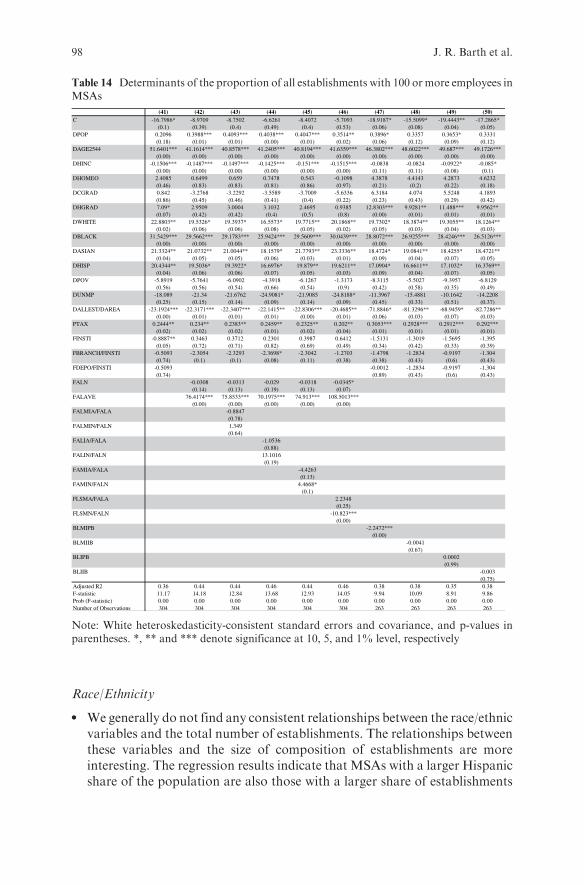
Race/Ethnicity
l We generally do not find any consistent relationships between the race/ethnicvariables and the total number of establishments. The relationships betweenthese variables and the size of composition of establishments are moreinteresting. The regression results indicate that MSAs with a larger Hispanicshare of the population are also those with a larger share of establishments
Table 14 Determinants of the proportion of all establishments with 100 or more employees inMSAs
(41) (42) (43) (44) (45) (46) (47) (48) (49) (50)C -16.7986* -8.9709 -8.7502 -6.6261 -8.4072 -5.7093 -18.9187* -15.5099* -19.4443** -17.2865*
(0.1) (0.39) (0.4) (0.49) (0.4) (0.53) (0.06) (0.08) (0.04) (0.05)DPOP 0.2096 0.3988*** 0.4093*** 0.4038*** 0.4047*** 0.3514** 0.3896* 0.3357 0.3653* 0.3331
(0.18) (0.01) (0.01) (0.00) (0.01) (0.02) (0.06) (0.12) (0.09) (0.12)DAGE2544 51.6401*** 41.1614*** 40.8578*** 41.2405*** 40.8194*** 41.6359*** 46.3802*** 48.6022*** 49.687*** 49.1726***
(0.00) (0.00) (0.00) (0.00) (0.00) (0.00) (0.00) (0.00) (0.00) (0.00)DHINC -0.1506*** -0.1487*** -0.1497*** -0.1425*** -0.151*** -0.1515*** -0.0838 -0.0824 -0.0922* -0.085*
(0.00) (0.00) (0.00) (0.00) (0.00) (0.00) (0.11) (0.11) (0.08) (0.1)DHOMEO 2.4085 0.6499 0.659 0.7478 0.543 -0.1098 4.3878 4.4143 4.2873 4.6232
(0.46) (0.83) (0.83) (0.81) (0.86) (0.97) (0.21) (0.2) (0.22) (0.18)DCGRAD 0.842 -3.2768 -3.2292 -3.5589 -3.7009 -5.6336 6.3184 4.074 5.5248 4.1893
(0.86) (0.45) (0.46) (0.41) (0.4) (0.22) (0.23) (0.43) (0.29) (0.42)DHGRAD 7.09* 2.9509 3.0004 3.1032 2.4695 0.9385 12.8303*** 9.9281** 11.488*** 9.9562**
(0.07) (0.42) (0.42) (0.4) (0.5) (0.8) (0.00) (0.01) (0.01) (0.01)DWHITE 22.8803** 19.5326* 19.3937* 16.5573* 19.7715** 20.1868** 19.7302* 18.3874** 19.3055** 18.1264**
(0.02) (0.06) (0.06) (0.08) (0.05) (0.02) (0.05) (0.03) (0.04) (0.03)DBLACK 31.5429*** 29.5662*** 29.1783*** 25.9424*** 29.5609*** 30.0439*** 28.8072*** 26.9255*** 28.4246*** 26.5126***
(0.00) (0.00) (0.00) (0.00) (0.00) (0.00) (0.00) (0.00) (0.00) (0.00)DASIAN 21.3324** 21.0732** 21.0044** 18.1579* 21.7793** 23.3336** 18.4724* 19.0841** 18.4255* 18.4721**
(0.04) (0.05) (0.05) (0.06) (0.03) (0.01) (0.09) (0.04) (0.07) (0.05)DHISP 20.4344** 19.5036* 19.3922* 16.6976* 19.879** 19.6211** 17.0904* 16.6611** 17.1032* 16.3769**
(0.04) (0.06) (0.06) (0.07) (0.05) (0.03) (0.09) (0.04) (0.07) (0.05)DPOV -5.8919 -5.7641 -6.0902 -4.3918 -6.1267 -1.3173 -8.3115 -5.5027 -9.3957 -6.8129
(0.56) (0.56) (0.54) (0.66) (0.54) (0.9) (0.42) (0.58) (0.35) (0.49)DUNMP -18.089 -21.34 -21.6762 -24.9081* -21.9085 -24.8188* -11.3967 -15.4881 -10.1642 -14.2208
(0.25) (0.15) (0.14) (0.09) (0.14) (0.09) (0.45) (0.33) (0.51) (0.37)DALLEST/DAREA -23.1924*** -22.3171*** -22.3407*** -22.1415** -22.8306*** -20.4685** -71.8846* -81.3296** -68.9459* -82.7286**
(0.00) (0.01) (0.01) (0.01) (0.00) (0.01) (0.06) (0.03) (0.07) (0.03)PTAX 0.2444** 0.234** 0.2383** 0.2459** 0.2325** 0.202** 0.3053*** 0.2928*** 0.2912*** 0.292***
(0.02) (0.02) (0.02) (0.01) (0.02) (0.04) (0.01) (0.01) (0.01) (0.01)FINSTI -0.8887** 0.3463 0.3712 0.2301 0.3987 0.6412 -1.5131 -1.3019 -1.5695 -1.395
(0.05) (0.72) (0.71) (0.82) (0.69) (0.49) (0.34) (0.42) (0.33) (0.39)FBRANCH/FINSTI -0.5093 -2.3054 -2.3293 -2.3698* -2.3042 -1.2703 -1.4798 -1.2834 -0.9197 -1.304
(0.74) (0.1) (0.1) (0.08) (0.11) (0.38) (0.38) (0.43) (0.6) (0.43)FDEPO/FINSTI -0.5093 -0.0012 -1.2834 -0.9197 -1.304
(0.74) (0.89) (0.43) (0.6) (0.43)FALN -0.0308 -0.0313 -0.029 -0.0318 -0.0345*
(0.14) (0.13) (0.19) (0.13) (0.07)FALAVE 76.4174*** 75.8533*** 70.1975*** 74.913*** 108.5013***
(0.00) (0.00) (0.00) (0.00) (0.00)FALMIA/FALA -0.8847
(0.78)FALMIN/FALN 1.349
(0.64)FALIA/FALA -1.0536
(0.88)FALIN/FALN 13.1016
(0.19)FAMIA/FALA -4.4263
(0.13)FAMIN/FALN 4.4668*
(0.1)FLSMA/FALA 2.2348
(0.25)FLSMN/FALN -10.823***
(0.00)BLMIPB -2.2472***
(0.00)BLMIIB -0.0041
(0.67)BLIPB 0.0002
(0.99)BLIIB -0.003
(0.75)Adjusted R2 0.36 0.44 0.44 0.46 0.44 0.46 0.38 0.38 0.35 0.38F-statistic 11.17 14.18 12.84 13.68 12.93 14.05 9.94 10.09 8.91 9.86Prob (F-statistic) 0.00 0.00 0.00 0.00 0.00 0.00 0.00 0.00 0.00 0.00Number of Observations 304 304 304 304 304 304 263 263 263 263
Note: White heteroskedasticity-consistent standard errors and covariance, and p-values inparentheses. *, ** and *** denote significance at 10, 5, and 1% level, respectively
98 J. R. Barth et al.

with 100 or more employees. But MSAs with a larger mix of white, African-American, andAsian-American populations tend to correlate positively witha larger share of big establishments and negatively with a larger share of thesmallest establishments. There is alsomodest evidence thatMSAs with largerAsian-American populations tend to have a larger share of establishmentswith 11–100 employees.
Poverty
l We did not find any relationships between the degree of poverty and thenumber of establishments. There is also no evidence suggesting a relationshipbetween poverty and the share of either the smallest or biggest establish-ments in MSAs. Instead, the data indicate that MSAs with lower povertyrates tend to have a smaller proportion of medium (11–100 employees) sizeestablishments.
Unemployment
l We do not find a relationship between unemployment rates within MSAs,and the total number of establishments or the size composition of establish-ments. Only in two of the six regressions for the share of establishments withmore than 100 employees are the coefficients for the unemployment ratenegative and marginally significant.
Land Area
l Although we find no relationship between the number of establishments andthe land area in the MSAs, we do find a negative relationship betweenestablishments per square mile and the share of establishments with morethan ten employees. This relationship, however, is positive in the regressionsfor the share of establishments with fewer than ten employees.
Sales Tax Rate
l We find no relationship between the state sales tax rate and the number oftotal establishments in MSAs. But we do find that a higher tax rate tends tocorrelate negatively with the share of 0–10 employee establishments, andpositively with the share of establishments with ten or more employees.
Financial Institutions
l After controlling for branches per institution, MSAs with more financialinstitutions tend to have more total establishments, but a smaller share of0 employee establishments.
l Although we do not find a relationship between branches per financial institu-tion within an MSA and the total number of establishments, we find thenumber of branches per financial institution tends to have a negative relation-ship with the share of 0 employee establishments, a positive relationship withthe share of 11–100 employee establishments, and a negative but marginallysignificant relationship with the share of 100 ormore employee establishments.
Stumbling Blocks to Entrepreneurship in Low- and Moderate-Income Communities 99
l After controlling for the number of institutions, deposits per institution corre-lates negatively with the share of 0 employee establishments and positivelywiththe proportion of 11–100 employee establishments, and has no relationship tothe other size or total establishment variables.
Loan Activity in Low- and Moderate-Income Communities
l MSAs with larger numbers of loans tend to have more establishments, and alarger share of zero-employee establishments.
l We do not find a relationship between the average size of loans within anMSA and the total number of establishments. But we do find that MSAswith higher average size loans tend to have a smaller share of 0–10employee establishments and a larger share of eleven or more employeeestablishments.
l We find marginal evidence that the higher the share of loan amounts tobusinesses in low- and moderate-income communities, the smaller the shareof zero-employee establishments. Yet the marginal evidence indicates thatthe higher the share of number of loans to businesses in low- and moderate-income communities, the larger the share of zero-employee establishments.We do not find that the share of the amount or number of loans to low- andmoderate-income communities provides any explanation with respect toother size categories of establishments.
l We do not find any significant relationship between the share of loanamounts to businesses in low-income communities and the total number ofestablishments or the size composition of establishments. But the share ofloan numbers to businesses in low-income communities has a negative andsignificant relationship to the share of zero-employee establishments, anegative but not significant relationship with the share of 1–10 employeeestablishments, a positive and significant relationship with the share of11–100 employee establishments, and a positive but not significant relation-ship with the share of 100 or more employee establishments.
l The share of the total amount of loans to moderate-income communities ispositively related to only the share of establishments with 1 to 10 employ-ees, while the share of the number of loans to moderate-income commu-nities is negatively related to the same size establishments. The share of thetotal number of loans to moderate-income communities also correlatespositively with a larger share of establishments with more than 100employees.
l While the share of total amount of loans to establishments with less than$1 million of receipts does not have a significant relationship with the totalnumber or size composition of establishments, the share of the total numberof loans to such establishments tends to have a positive correlation with theshare of establishments with 1–10 employees. At the same time, the share ofthe total number of loans to establishments with less than $1 million inreceipts tends to have a negative association with the share of establishmentswith 100 or more employees.
100 J. R. Barth et al.
Loan Bias
l None of the four measures of loan bias has a significant association with thetotal number of establishments. But the loan bias measure for LMI commu-nities based upon population correlates positively with establishmentswith 0 employees and those with 1–10 employees, and negatively with estab-lishments with 100 or more employees. These significant results disappear,however, when the loan bias measure is based on income rather thanpopulation.
In summary, several factorsmatter for entrepreneurship asmeasured indirectly bythe size of establishments in MSAs throughout the United States. The way inwhich these factors are related to entrepreneurship, however, varies depending onthe size measure used. It is useful, therefore, to summarize the findings byestablishment size.
7.1 Establishments with 0 Employees
One finds in MSAs that the greater the share of total establishments with zeroemployees, the lower the share of the population aged 25–44, the higher thehousehold income, the smaller the percentage of the labor force with a collegedegree, and the smaller the share of the labor force with a high school diplomaor less. In addition, one finds that the greater the share of establishments withzero employees, the greater the race or ethnic mix of the population, the lowerthe state sales tax rate, the larger the number of financial institutions, the lowerthe number of branches per institution, the lower the deposits per institution,the greater the number of loans, the lower the average loan size, the lower theshare of the total amount of loans to businesses in low- and moderate-incomecommunities in MSAs, the larger the share of the total number of loans tobusinesses in low- and moderate-income communities in MSAs, and the lowerthe share of the total number of loans made to businesses in low-incomecommunities.
7.2 Establishments with 1–10 Employees
Our work suggests that the greater the share of total establishments with 1–10employees, the lower the share of the population aged 25–44, the higher thehousehold income, the higher the percentage of the labor force with a collegedegree (in two of six regressions), and the higher the share of the labor forcethat has a house school diploma or less (in three of six regressions). Inaddition, one finds that the greater the share of establishments with 1–10
Stumbling Blocks to Entrepreneurship in Low- and Moderate-Income Communities 101

employees, the lower the state sales tax rate, the lower the average loan size,the greater the share of the total amount of loans to businesses in moderate-income communities in MSAs, the lower the share of the total number ofloans to businesses in moderate-income communities in MSAs, and thegreater the share of the total number of loans made to establishments withreceipts of less than $1 million.
7.3 Establishments with 11–100 Employees
The greater the share of total establishments with 11–100 employees, the greaterthe share of the population aged 25–44, the higher the higher the poverty rate,the higher the state sales tax rate, the higher the number of branches perinstitution, the higher the amount of deposits per institution, the higher theaverage loan size, and the larger the share of the total number of loans tobusinesses in low-income communities in MSAs.
7.4 Establishments with 100 or More Employees
One finds inMSAs that the greater the share of total establishments with 100 ormore employees, the higher the population of the MSA, the higher the share ofthe population aged 25–44, the lower the household income, the lower the raceor ethnic mix of the population, the lower the unemployment rate (this is amarginal result in two of six regressions), the higher the state sales tax rate, thelarger the average loan size, the higher the share of the total number of the loansto businesses in moderate-income communities in MSAs, and the lower theshare of the total number of loans made to establishments with receipts of lessthan $1 million.
7.5 All Establishments
The findings for all establishments are important because to the extent that afactor increases this variable, any trade-off between that factor’s effect on thesize composition of establishments and the number of establishments becomesless important. The reason, of course is that with more establishments, asmaller share of the total for any size category can experience an absoluteincrease in the number of establishments. In the case of other factors that arenot significant for total establishments, but are significant in explaining thesize composition of establishments, there are necessarily trade-offs (i.e., an
102 J. R. Barth et al.
increase in the share of one size category within an MSA at the expense of a
decrease in both the number and the share of other size categories). In this
respect, only four factors seem to matter for the total number of establish-
ments. These factors are: the share of population in the 25–44 age group, the
homeownership rate, the number of financial institutions, and the total num-
ber of loans made in an MSA. All four correlate positively with the total
number of establishments.Clearly, the empirical results presented here emphasize the need to develop a
more generalmicroeconomicmodel, and to assemble bettermicrodata (preferably
panels) to understand more fully the key determinants of entrepreneurial activity
in different geographical regions. Unfortunately, as discussed earlier with respect
to the existing literature, there is an insufficient database, and no widely accepted
microeconomic model is available to meet this need. This situation, however,
should provide motivation for researchers and policy makers to remedy the
deficiency so that more progress can be made in identifying what works best at
eliminating stumbling blocks to entrepreneurship in low- and moderate-income
communities.
8 Policy Recommendations
This paper conducts a selected review of the economic literature on entrepre-
neurship, and provides tentative empirical analyses of the determinants of
entrepreneurship across MSAs. We find that the conclusions of previous
researchers, and even our findings, in some instances are consistent with one
another and in others contradictory. Nevertheless, based on the literature
review, other papers not directly reviewed here, and our empirical analysis,
we find sufficient agreement to draw several conclusions and policy recommen-
dations aimed at increasing entrepreneurial activity, particularly in low- and
moderate-income communities. These findings follow.
1. Construct a single, multiuse data set by creating a data consortium that poolsinformation from different public and private data sets.
Researchers frequently use different measures of entrepreneurship and differ-
ent data sets, limiting the ability to compare the work of different scholars
and hampering an understanding of the factors that influence entrepreneur-
ship, and thus the development of effective policies. As noted above, the term
‘‘entrepreneur’’ means different things in different studies. For example, a
recent paper published by the Federal Reserve Bank of Kansas City (Low,
Henderson, and Weiler, 2005) identifies entrepreneurs as the self-employed,
and the Kauffman Foundation’s Index of Entrepreneurial Activity (Fairlie,
2005) identifies entrepreneurs as business owners (as reported in the Current
Stumbling Blocks to Entrepreneurship in Low- and Moderate-Income Communities 103

Population Survey performed by U.S. Bureau of the Census for the Bureau of
Labor Statistics).A consortium could address the problem for policy makers when researchers
use different definitions and control variables. Consortium participants might
contribute data on a blind basis, with researchers and participants gaining
access to the full pool of contributions. This would improve upon the
information necessary to understand the best way to promote or to facilitate
entrepreneurship.
2. Provide incentives through Capital Access Programs and other creditenhancement programs to decrease loan bias.
Our calculations of LI and LMI loan bias suggest that the financing
received by businesses in many LI and LMI communities diverges from
what some people, perhaps naively, might consider appropriate, even when
accounting for income disparity. In general, our first measure of loan bias
(based on population) indicates that businesses in LI and LMI communities
receive a significantly smaller share of the total amount of loans than might
be expected, given the LI and LMI shares of population. Our second
measure of loan bias (based on income) suggests that this type of lending
gap exists in a large number of MSAs. To the extent that this bias is not
explained by economic factors, or is due to regulatory barriers, incentives
provided through Capital Access Programs (in which lenders, borrowers,
and the government each contribute to a reserve fund to cover loan losses)
and other credit enhancement programs might help to decrease this loan
bias. 7
3. Increase the securitization of average-sized loans.
We and others find that financial variables are important to entrepreneur-
ship. We specifically find that MSAs with fewer financial institutions and
larger average loan sizes tend to have a smaller share of total establishments
with fewer than 10 employees (potentially the most entrepreneurial establish-
ments, or those most associated with new startups). One way to increase
small business loan origination across MSAs might be to increase the
securitization of such loans. This would enable small business lenders to
sell portions of their loan portfolios and use the proceeds to originate more
loans, as well as lower their capital requirements. 8
7 For further discussion of credit enhancement as a potential alleviator of the capital access‘‘gaps’’ facing LMI businesses, see Yago, Zeidman, and Schmidt (2003).8 For further discussion of the role of securitization, see Yago, Zeidman, and Schmidt (2003).
104 J. R. Barth et al.
4. Expand capital and other forms of support to African-Americanentrepreneurs.
Discrimination appears to persist, particularly related to capital access byAfrican-American entrepreneurs. The continued difficulty of African-Ameri-can-owned firms to gain financing, the smaller size of these firms, and the higherconcentration of larger firms in MSAs with large African-American popula-tions suggest the continuing need to extend capital and other forms of supportto African-American entrepreneurs. This is particularly important when oneconsiders that the number of these firms is growing faster than the rate of allfirms, and the growth (or lack thereof) has an increasingly significant effect onlocal communities.
5. Decrease taxes.
Taxes and government regulations are significant impediments to entrepre-neurship. Indeed, they rank very high among the barriers to entrepreneurshipcited by entrepreneurs. The cost of workers compensation and health insur-ance, taxes, and a number of government regulations are factors that stateand federal governments could modify to promote entrepreneurship. Well-meaning regulations often have unanticipated consequences. For instance,high bankruptcy exemptions are intended to benefit borrowers, but havebeen found to hurt them by decreasing lenders’ willingness to providecapital. The relationship between lower sales taxes and greater entrepreneur-ship suggests one approach to mitigating this adverse effect would be toreduce tax levels. Of course, one must account for the fact that tax revenueshelp finance the infrastructure essential for the successful operation ofbusinesses.
6. Support programs to expand understanding of what entrepreneurshiprequires.
There appears to be consensus in the literature that individuals can learn tobecome entrepreneurs. Well-developed training programs, with targeted out-reach to LI and LMI communities, can expand entrepreneurship to a widerpopulation. Data currently reflect businesses located in LI and LMI commu-nities, but, unfortunately, tell us little about the individual entrepreneur. Theexistence of entrepreneurial firms in a region spurs the growth of more suchfirms in a cluster effect. Programs such as those supported by the KauffmanFoundation should produce greater understanding of entrepreneurship in com-munities, thereby increasing the likelihood of more new businesses being estab-lished throughout the country.In summary, more work needs to be done to understand fully the determinantsof entrepreneurial activity. This includes developing better microeconomicmodels that capture the different trade-offs associated with specific policyactions affecting entrepreneurial activity, and additional empirical analysis todetermine which actions work best to promote such activity.
Stumbling Blocks to Entrepreneurship in Low- and Moderate-Income Communities 105

Appendix 1
Loans to Businesses in Low- and Moderate-Income Communities:LI and LMI Shares of Population, Businesses’ Share of Loans, and LI and LMI Loan Biases
MSA
LMI ShareofPopulation
LMIShare ofAmountof Loans
LMILoanBias:Amountof Loans
LI Share ofPopulation
LI ShareofAmountof Loans
LI LoanBias:Amountof Loans
Yolo, CA 49.1% 41.8% 0.15 31.5% 0.1% 1.00
Dutchess County,NY
46.2% 18.8% 0.59 26.0% 8.8% 0.66
Vallejo-Fairfield-Napa, CA
46.1% 34.8% 0.25 24.7% 1.5% 0.94
New York, NY 45.9% 19.2% 0.58 31.0% 4.8% 0.84
Oakland, CA 45.3% 25.4% 0.44 28.3% 13.5% 0.52
Bryan-CollegeStation, TX
45.1% 16.3% 0.64 29.5% 2.8% 0.90
Sacramento, CA 45.1% 29.6% 0.34 26.4% 7.2% 0.73
San Francisco, CA 44.9% 35.6% 0.21 27.2% 16.0% 0.41
Albany, GA 44.6% 29.9% 0.33 23.0% 15.1% 0.34
Tuscaloosa, AL 44.2% 18.8% 0.57 23.6% 2.6% 0.89
Riverside-SanBernardino, CA
43.8% 24.0% 0.45 28.4% 5.7% 0.80
Columbus,GA-AL
43.7% 37.7% 0.14 20.7% 12.0% 0.42
Yuba City, CA 43.6% 18.0% 0.59 19.5% 0.0% 1.00
Springfield, MA 43.5% 24.2% 0.44 24.6% 8.5% 0.66
Florence, SC 43.5% 22.5% 0.48 29.0% 8.1% 0.72
Muncie, IN 43.4% 21.8% 0.50 19.8% 2.7% 0.87
Huntington-Ashland, WV-KY-OH
43.4% 28.8% 0.34 26.5% 7.6% 0.71
Rocky Mount, NC 43.4% 8.4% 0.81 21.5% 1.2% 0.94
Missoula, MT 43.3% 37.2% 0.14 19.6% 0.0% 1.00
Auburn-Opelika, AL 43.2% 21.0% 0.51 29.6% 7.4% 0.75
Odessa-Midland, TX 43.1% 46.5% -0.08 19.8% 5.6% 0.72
New Orleans, LA 43.1% 26.5% 0.38 29.0% 6.3% 0.78
Charleston, WV 43.1% 31.6% 0.27 28.0% 15.2% 0.46
Houma, LA 43.0% 39.7% 0.08 29.3% 0.0% 1.00
Fresno, CA 42.9% 27.4% 0.36 19.8% 3.4% 0.83
Utica-Rome, NY 42.9% 19.1% 0.55 27.5% 2.9% 0.89
Yakima, WA 42.9% 34.3% 0.20 18.4% 13.4% 0.27
Nassau-Suffolk, NY 42.9% 12.7% 0.70 24.2% 0.1% 1.00
Bakersfield, CA 42.8% 21.7% 0.49 28.2% 6.5% 0.77
Louisville, KY-IN 42.8% 29.0% 0.32 22.5% 7.0% 0.69
Lake Charles, LA 42.7% 21.5% 0.50 29.1% 2.0% 0.93
Lewiston-Auburn,ME
42.7% 20.4% 0.52 26.9% 8.3% 0.69
106 J. R. Barth et al.

Appendix 1 (continued)
MSA
LMI ShareofPopulation
LMIShare ofAmountof Loans
LMILoanBias:Amountof Loans
LI Share ofPopulation
LI ShareofAmountof Loans
LI LoanBias:Amountof Loans
Kalamazoo-BattleCreek, MI
42.7% 23.1% 0.46 22.5% 7.3% 0.68
Springfield, MO 42.6% 15.3% 0.64 17.6% 2.9% 0.84
Las Cruces, NM 42.6% 29.8% 0.30 25.3% 0.1% 1.00
Alexandria, LA 42.6% 22.0% 0.48 25.9% 5.1% 0.80
Sarasota-Bradenton,FL
42.6% 19.8% 0.53 20.4% 0.6% 0.97
Mobile, AL 42.5% 12.9% 0.70 28.5% 5.7% 0.80
Beaumont-PortArthur, TX
42.5% 21.8% 0.49 28.3% 5.6% 0.80
Sharon, PA 42.5% 15.6% 0.63 17.3% 12.5% 0.28
Stockton-Lodi, CA 42.5% 33.6% 0.21 23.5% 6.5% 0.72
Greensboro-Winston-Salem-High Point,
42.5% 18.4% 0.57 21.5% 1.6% 0.93
Greenville, NC 42.5% 24.2% 0.43 21.5% 4.5% 0.79
Corvallis, OR 42.4% 23.3% 0.45 23.4% 0.0% 1.00
Providence-FallRiver-Warwick,RI-MA
42.4% 21.7% 0.49 24.5% 4.7% 0.81
San Diego, CA 42.4% 25.1% 0.41 24.3% 1.9% 0.92
Corpus Christi, TX 42.3% 43.1% -0.02 27.8% 6.1% 0.78
Bloomington-Normal, IL
42.3% 24.3% 0.43 24.7% 8.5% 0.65
Bangor, ME 42.2% 14.1% 0.67 27.5% 0.0% 1.00
Tallahassee, FL 42.2% 26.9% 0.36 28.3% 3.4% 0.88
Merced, CA 42.1% 24.5% 0.42 26.1% 0.0% 1.00
Dover, DE 42.1% 0.2% 0.99 21.5% 0.0% 1.00
Topeka, KS 42.1% 37.9% 0.10 21.0% 13.8% 0.34
Amarillo, TX 42.0% 25.3% 0.40 26.0% 8.8% 0.66
St. Joseph, MO 42.0% 25.9% 0.38 26.3% 19.0% 0.28
Wheeling,WV-OH
42.0% 23.9% 0.43 24.6% 2.3% 0.91
Orange County,CA
41.9% 34.8% 0.17 22.1% 4.6% 0.79
Los Angeles-LongBeach, CA
41.9% 31.5% 0.25 29.7% 12.5% 0.58
Decatur, AL 41.8% 11.1% 0.73 26.9% 2.0% 0.92
Dallas, TX 41.7% 21.4% 0.49 23.0% 4.6% 0.80
Lafayette, LA 41.6% 12.3% 0.71 26.8% 3.7% 0.86
Dayton-Springfield,OH
41.6% 27.2% 0.35 21.2% 10.1% 0.52
Pine Bluff, AR 41.5% 22.9% 0.45 24.7% 9.3% 0.62
(continued )
Stumbling Blocks to Entrepreneurship in Low- and Moderate-Income Communities 107
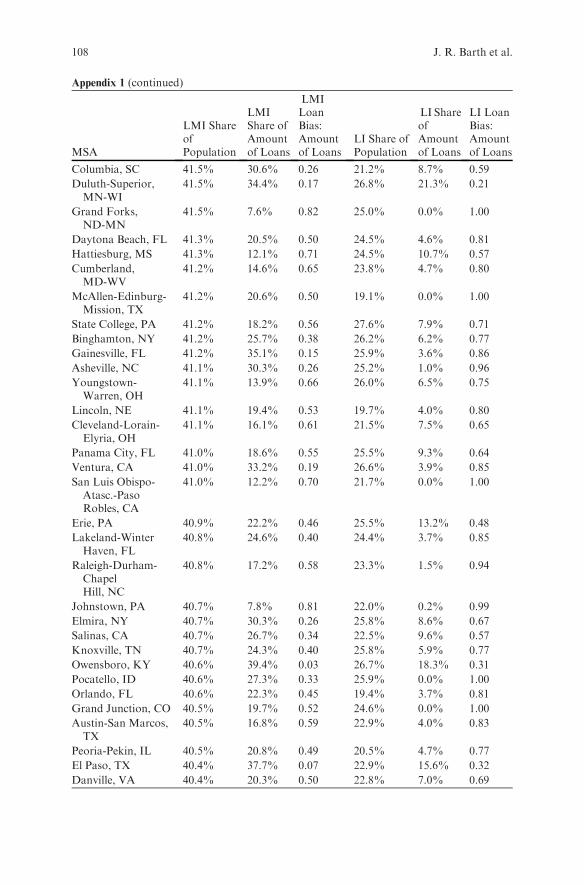
Appendix 1 (continued)
MSA
LMI ShareofPopulation
LMIShare ofAmountof Loans
LMILoanBias:Amountof Loans
LI Share ofPopulation
LI ShareofAmountof Loans
LI LoanBias:Amountof Loans
Columbia, SC 41.5% 30.6% 0.26 21.2% 8.7% 0.59
Duluth-Superior,MN-WI
41.5% 34.4% 0.17 26.8% 21.3% 0.21
Grand Forks,ND-MN
41.5% 7.6% 0.82 25.0% 0.0% 1.00
Daytona Beach, FL 41.3% 20.5% 0.50 24.5% 4.6% 0.81
Hattiesburg, MS 41.3% 12.1% 0.71 24.5% 10.7% 0.57
Cumberland,MD-WV
41.2% 14.6% 0.65 23.8% 4.7% 0.80
McAllen-Edinburg-Mission, TX
41.2% 20.6% 0.50 19.1% 0.0% 1.00
State College, PA 41.2% 18.2% 0.56 27.6% 7.9% 0.71
Binghamton, NY 41.2% 25.7% 0.38 26.2% 6.2% 0.77
Gainesville, FL 41.2% 35.1% 0.15 25.9% 3.6% 0.86
Asheville, NC 41.1% 30.3% 0.26 25.2% 1.0% 0.96
Youngstown-Warren, OH
41.1% 13.9% 0.66 26.0% 6.5% 0.75
Lincoln, NE 41.1% 19.4% 0.53 19.7% 4.0% 0.80
Cleveland-Lorain-Elyria, OH
41.1% 16.1% 0.61 21.5% 7.5% 0.65
Panama City, FL 41.0% 18.6% 0.55 25.5% 9.3% 0.64
Ventura, CA 41.0% 33.2% 0.19 26.6% 3.9% 0.85
San Luis Obispo-Atasc.-PasoRobles, CA
41.0% 12.2% 0.70 21.7% 0.0% 1.00
Erie, PA 40.9% 22.2% 0.46 25.5% 13.2% 0.48
Lakeland-WinterHaven, FL
40.8% 24.6% 0.40 24.4% 3.7% 0.85
Raleigh-Durham-ChapelHill, NC
40.8% 17.2% 0.58 23.3% 1.5% 0.94
Johnstown, PA 40.7% 7.8% 0.81 22.0% 0.2% 0.99
Elmira, NY 40.7% 30.3% 0.26 25.8% 8.6% 0.67
Salinas, CA 40.7% 26.7% 0.34 22.5% 9.6% 0.57
Knoxville, TN 40.7% 24.3% 0.40 25.8% 5.9% 0.77
Owensboro, KY 40.6% 39.4% 0.03 26.7% 18.3% 0.31
Pocatello, ID 40.6% 27.3% 0.33 25.9% 0.0% 1.00
Orlando, FL 40.6% 22.3% 0.45 19.4% 3.7% 0.81
Grand Junction, CO 40.5% 19.7% 0.52 24.6% 0.0% 1.00
Austin-San Marcos,TX
40.5% 16.8% 0.59 22.9% 4.0% 0.83
Peoria-Pekin, IL 40.5% 20.8% 0.49 20.5% 4.7% 0.77
El Paso, TX 40.4% 37.7% 0.07 22.9% 15.6% 0.32
Danville, VA 40.4% 20.3% 0.50 22.8% 7.0% 0.69
108 J. R. Barth et al.
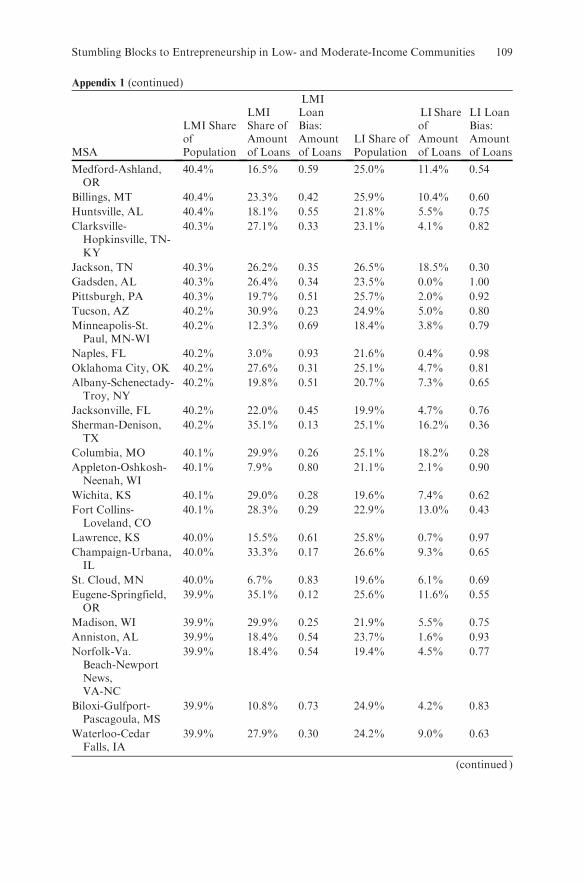
Appendix 1 (continued)
MSA
LMI ShareofPopulation
LMIShare ofAmountof Loans
LMILoanBias:Amountof Loans
LI Share ofPopulation
LI ShareofAmountof Loans
LI LoanBias:Amountof Loans
Medford-Ashland,OR
40.4% 16.5% 0.59 25.0% 11.4% 0.54
Billings, MT 40.4% 23.3% 0.42 25.9% 10.4% 0.60
Huntsville, AL 40.4% 18.1% 0.55 21.8% 5.5% 0.75
Clarksville-Hopkinsville, TN-KY
40.3% 27.1% 0.33 23.1% 4.1% 0.82
Jackson, TN 40.3% 26.2% 0.35 26.5% 18.5% 0.30
Gadsden, AL 40.3% 26.4% 0.34 23.5% 0.0% 1.00
Pittsburgh, PA 40.3% 19.7% 0.51 25.7% 2.0% 0.92
Tucson, AZ 40.2% 30.9% 0.23 24.9% 5.0% 0.80
Minneapolis-St.Paul, MN-WI
40.2% 12.3% 0.69 18.4% 3.8% 0.79
Naples, FL 40.2% 3.0% 0.93 21.6% 0.4% 0.98
Oklahoma City, OK 40.2% 27.6% 0.31 25.1% 4.7% 0.81
Albany-Schenectady-Troy, NY
40.2% 19.8% 0.51 20.7% 7.3% 0.65
Jacksonville, FL 40.2% 22.0% 0.45 19.9% 4.7% 0.76
Sherman-Denison,TX
40.2% 35.1% 0.13 25.1% 16.2% 0.36
Columbia, MO 40.1% 29.9% 0.26 25.1% 18.2% 0.28
Appleton-Oshkosh-Neenah, WI
40.1% 7.9% 0.80 21.1% 2.1% 0.90
Wichita, KS 40.1% 29.0% 0.28 19.6% 7.4% 0.62
Fort Collins-Loveland, CO
40.1% 28.3% 0.29 22.9% 13.0% 0.43
Lawrence, KS 40.0% 15.5% 0.61 25.8% 0.7% 0.97
Champaign-Urbana,IL
40.0% 33.3% 0.17 26.6% 9.3% 0.65
St. Cloud, MN 40.0% 6.7% 0.83 19.6% 6.1% 0.69
Eugene-Springfield,OR
39.9% 35.1% 0.12 25.6% 11.6% 0.55
Madison, WI 39.9% 29.9% 0.25 21.9% 5.5% 0.75
Anniston, AL 39.9% 18.4% 0.54 23.7% 1.6% 0.93
Norfolk-Va.Beach-NewportNews,VA-NC
39.9% 18.4% 0.54 19.4% 4.5% 0.77
Biloxi-Gulfport-Pascagoula, MS
39.9% 10.8% 0.73 24.9% 4.2% 0.83
Waterloo-CedarFalls, IA
39.9% 27.9% 0.30 24.2% 9.0% 0.63
(continued )
Stumbling Blocks to Entrepreneurship in Low- and Moderate-Income Communities 109
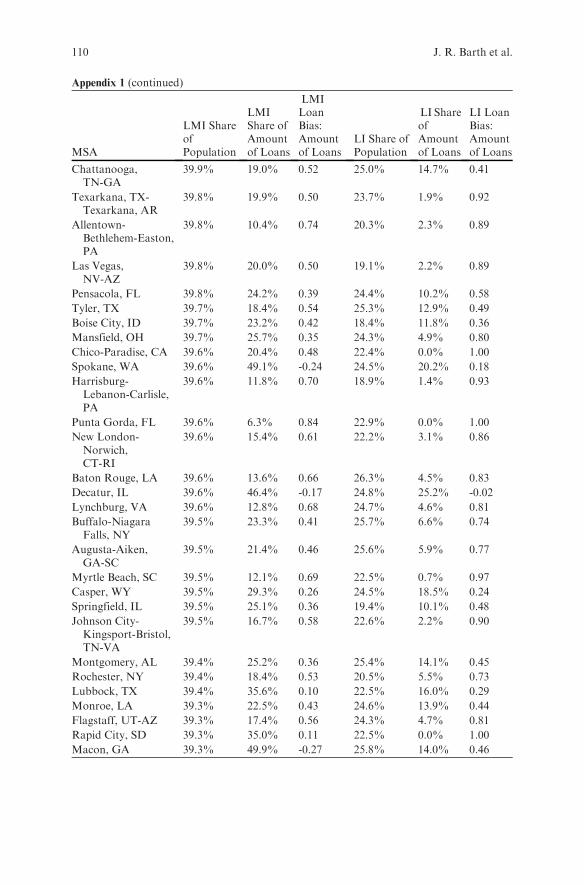
Appendix 1 (continued)
MSA
LMI ShareofPopulation
LMIShare ofAmountof Loans
LMILoanBias:Amountof Loans
LI Share ofPopulation
LI ShareofAmountof Loans
LI LoanBias:Amountof Loans
Chattanooga,TN-GA
39.9% 19.0% 0.52 25.0% 14.7% 0.41
Texarkana, TX-Texarkana, AR
39.8% 19.9% 0.50 23.7% 1.9% 0.92
Allentown-Bethlehem-Easton,PA
39.8% 10.4% 0.74 20.3% 2.3% 0.89
Las Vegas,NV-AZ
39.8% 20.0% 0.50 19.1% 2.2% 0.89
Pensacola, FL 39.8% 24.2% 0.39 24.4% 10.2% 0.58
Tyler, TX 39.7% 18.4% 0.54 25.3% 12.9% 0.49
Boise City, ID 39.7% 23.2% 0.42 18.4% 11.8% 0.36
Mansfield, OH 39.7% 25.7% 0.35 24.3% 4.9% 0.80
Chico-Paradise, CA 39.6% 20.4% 0.48 22.4% 0.0% 1.00
Spokane, WA 39.6% 49.1% -0.24 24.5% 20.2% 0.18
Harrisburg-Lebanon-Carlisle,PA
39.6% 11.8% 0.70 18.9% 1.4% 0.93
Punta Gorda, FL 39.6% 6.3% 0.84 22.9% 0.0% 1.00
New London-Norwich,CT-RI
39.6% 15.4% 0.61 22.2% 3.1% 0.86
Baton Rouge, LA 39.6% 13.6% 0.66 26.3% 4.5% 0.83
Decatur, IL 39.6% 46.4% -0.17 24.8% 25.2% -0.02
Lynchburg, VA 39.6% 12.8% 0.68 24.7% 4.6% 0.81
Buffalo-NiagaraFalls, NY
39.5% 23.3% 0.41 25.7% 6.6% 0.74
Augusta-Aiken,GA-SC
39.5% 21.4% 0.46 25.6% 5.9% 0.77
Myrtle Beach, SC 39.5% 12.1% 0.69 22.5% 0.7% 0.97
Casper, WY 39.5% 29.3% 0.26 24.5% 18.5% 0.24
Springfield, IL 39.5% 25.1% 0.36 19.4% 10.1% 0.48
Johnson City-Kingsport-Bristol,TN-VA
39.5% 16.7% 0.58 22.6% 2.2% 0.90
Montgomery, AL 39.4% 25.2% 0.36 25.4% 14.1% 0.45
Rochester, NY 39.4% 18.4% 0.53 20.5% 5.5% 0.73
Lubbock, TX 39.4% 35.6% 0.10 22.5% 16.0% 0.29
Monroe, LA 39.3% 22.5% 0.43 24.6% 13.9% 0.44
Flagstaff, UT-AZ 39.3% 17.4% 0.56 24.3% 4.7% 0.81
Rapid City, SD 39.3% 35.0% 0.11 22.5% 0.0% 1.00
Macon, GA 39.3% 49.9% -0.27 25.8% 14.0% 0.46
110 J. R. Barth et al.
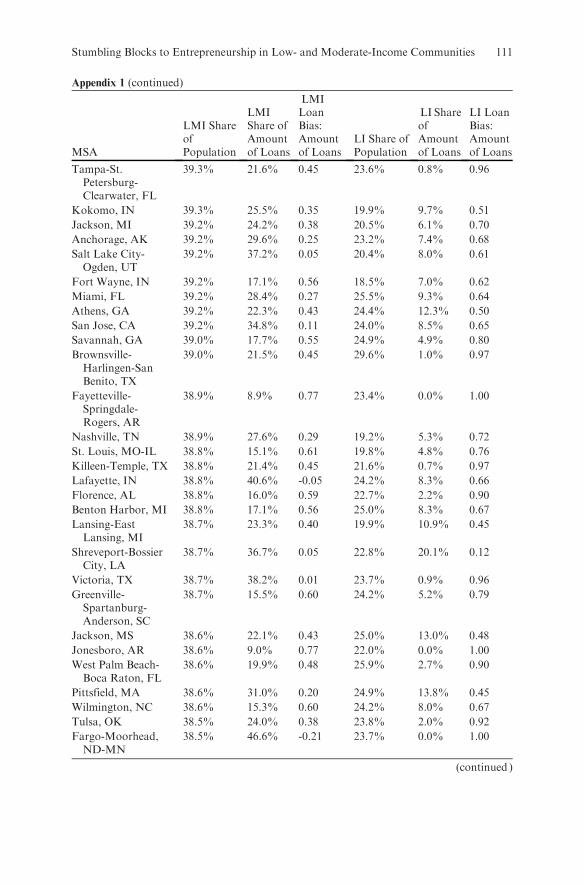
Appendix 1 (continued)
MSA
LMI ShareofPopulation
LMIShare ofAmountof Loans
LMILoanBias:Amountof Loans
LI Share ofPopulation
LI ShareofAmountof Loans
LI LoanBias:Amountof Loans
Tampa-St.Petersburg-Clearwater, FL
39.3% 21.6% 0.45 23.6% 0.8% 0.96
Kokomo, IN 39.3% 25.5% 0.35 19.9% 9.7% 0.51
Jackson, MI 39.2% 24.2% 0.38 20.5% 6.1% 0.70
Anchorage, AK 39.2% 29.6% 0.25 23.2% 7.4% 0.68
Salt Lake City-Ogden, UT
39.2% 37.2% 0.05 20.4% 8.0% 0.61
Fort Wayne, IN 39.2% 17.1% 0.56 18.5% 7.0% 0.62
Miami, FL 39.2% 28.4% 0.27 25.5% 9.3% 0.64
Athens, GA 39.2% 22.3% 0.43 24.4% 12.3% 0.50
San Jose, CA 39.2% 34.8% 0.11 24.0% 8.5% 0.65
Savannah, GA 39.0% 17.7% 0.55 24.9% 4.9% 0.80
Brownsville-Harlingen-SanBenito, TX
39.0% 21.5% 0.45 29.6% 1.0% 0.97
Fayetteville-Springdale-Rogers, AR
38.9% 8.9% 0.77 23.4% 0.0% 1.00
Nashville, TN 38.9% 27.6% 0.29 19.2% 5.3% 0.72
St. Louis, MO-IL 38.8% 15.1% 0.61 19.8% 4.8% 0.76
Killeen-Temple, TX 38.8% 21.4% 0.45 21.6% 0.7% 0.97
Lafayette, IN 38.8% 40.6% -0.05 24.2% 8.3% 0.66
Florence, AL 38.8% 16.0% 0.59 22.7% 2.2% 0.90
Benton Harbor, MI 38.8% 17.1% 0.56 25.0% 8.3% 0.67
Lansing-EastLansing, MI
38.7% 23.3% 0.40 19.9% 10.9% 0.45
Shreveport-BossierCity, LA
38.7% 36.7% 0.05 22.8% 20.1% 0.12
Victoria, TX 38.7% 38.2% 0.01 23.7% 0.9% 0.96
Greenville-Spartanburg-Anderson, SC
38.7% 15.5% 0.60 24.2% 5.2% 0.79
Jackson, MS 38.6% 22.1% 0.43 25.0% 13.0% 0.48
Jonesboro, AR 38.6% 9.0% 0.77 22.0% 0.0% 1.00
West Palm Beach-Boca Raton, FL
38.6% 19.9% 0.48 25.9% 2.7% 0.90
Pittsfield, MA 38.6% 31.0% 0.20 24.9% 13.8% 0.45
Wilmington, NC 38.6% 15.3% 0.60 24.2% 8.0% 0.67
Tulsa, OK 38.5% 24.0% 0.38 23.8% 2.0% 0.92
Fargo-Moorhead,ND-MN
38.5% 46.6% -0.21 23.7% 0.0% 1.00
(continued )
Stumbling Blocks to Entrepreneurship in Low- and Moderate-Income Communities 111
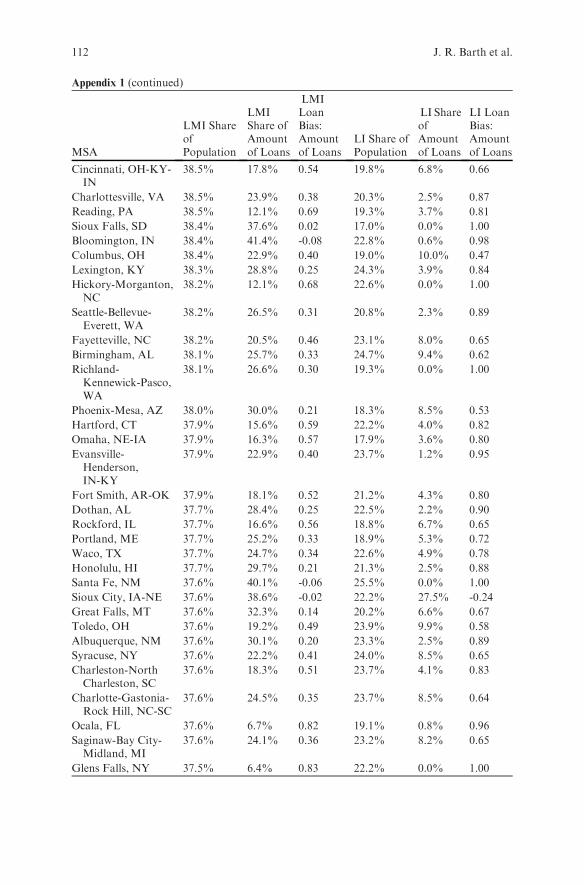
Appendix 1 (continued)
MSA
LMI ShareofPopulation
LMIShare ofAmountof Loans
LMILoanBias:Amountof Loans
LI Share ofPopulation
LI ShareofAmountof Loans
LI LoanBias:Amountof Loans
Cincinnati, OH-KY-IN
38.5% 17.8% 0.54 19.8% 6.8% 0.66
Charlottesville, VA 38.5% 23.9% 0.38 20.3% 2.5% 0.87
Reading, PA 38.5% 12.1% 0.69 19.3% 3.7% 0.81
Sioux Falls, SD 38.4% 37.6% 0.02 17.0% 0.0% 1.00
Bloomington, IN 38.4% 41.4% -0.08 22.8% 0.6% 0.98
Columbus, OH 38.4% 22.9% 0.40 19.0% 10.0% 0.47
Lexington, KY 38.3% 28.8% 0.25 24.3% 3.9% 0.84
Hickory-Morganton,NC
38.2% 12.1% 0.68 22.6% 0.0% 1.00
Seattle-Bellevue-Everett, WA
38.2% 26.5% 0.31 20.8% 2.3% 0.89
Fayetteville, NC 38.2% 20.5% 0.46 23.1% 8.0% 0.65
Birmingham, AL 38.1% 25.7% 0.33 24.7% 9.4% 0.62
Richland-Kennewick-Pasco,WA
38.1% 26.6% 0.30 19.3% 0.0% 1.00
Phoenix-Mesa, AZ 38.0% 30.0% 0.21 18.3% 8.5% 0.53
Hartford, CT 37.9% 15.6% 0.59 22.2% 4.0% 0.82
Omaha, NE-IA 37.9% 16.3% 0.57 17.9% 3.6% 0.80
Evansville-Henderson,IN-KY
37.9% 22.9% 0.40 23.7% 1.2% 0.95
Fort Smith, AR-OK 37.9% 18.1% 0.52 21.2% 4.3% 0.80
Dothan, AL 37.7% 28.4% 0.25 22.5% 2.2% 0.90
Rockford, IL 37.7% 16.6% 0.56 18.8% 6.7% 0.65
Portland, ME 37.7% 25.2% 0.33 18.9% 5.3% 0.72
Waco, TX 37.7% 24.7% 0.34 22.6% 4.9% 0.78
Honolulu, HI 37.7% 29.7% 0.21 21.3% 2.5% 0.88
Santa Fe, NM 37.6% 40.1% -0.06 25.5% 0.0% 1.00
Sioux City, IA-NE 37.6% 38.6% -0.02 22.2% 27.5% -0.24
Great Falls, MT 37.6% 32.3% 0.14 20.2% 6.6% 0.67
Toledo, OH 37.6% 19.2% 0.49 23.9% 9.9% 0.58
Albuquerque, NM 37.6% 30.1% 0.20 23.3% 2.5% 0.89
Syracuse, NY 37.6% 22.2% 0.41 24.0% 8.5% 0.65
Charleston-NorthCharleston, SC
37.6% 18.3% 0.51 23.7% 4.1% 0.83
Charlotte-Gastonia-Rock Hill, NC-SC
37.6% 24.5% 0.35 23.7% 8.5% 0.64
Ocala, FL 37.6% 6.7% 0.82 19.1% 0.8% 0.96
Saginaw-Bay City-Midland, MI
37.6% 24.1% 0.36 23.2% 8.2% 0.65
Glens Falls, NY 37.5% 6.4% 0.83 22.2% 0.0% 1.00
112 J. R. Barth et al.
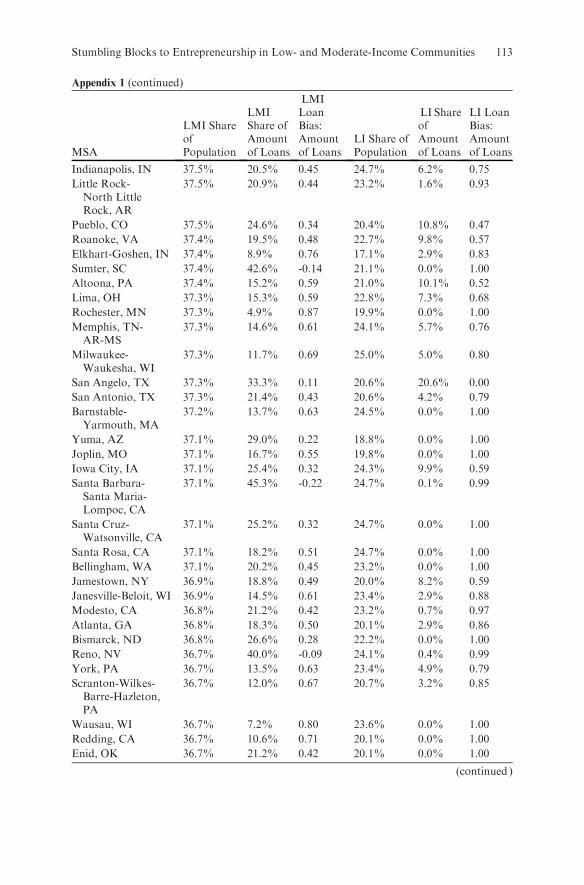
Appendix 1 (continued)
MSA
LMI ShareofPopulation
LMIShare ofAmountof Loans
LMILoanBias:Amountof Loans
LI Share ofPopulation
LI ShareofAmountof Loans
LI LoanBias:Amountof Loans
Indianapolis, IN 37.5% 20.5% 0.45 24.7% 6.2% 0.75
Little Rock-North LittleRock, AR
37.5% 20.9% 0.44 23.2% 1.6% 0.93
Pueblo, CO 37.5% 24.6% 0.34 20.4% 10.8% 0.47
Roanoke, VA 37.4% 19.5% 0.48 22.7% 9.8% 0.57
Elkhart-Goshen, IN 37.4% 8.9% 0.76 17.1% 2.9% 0.83
Sumter, SC 37.4% 42.6% -0.14 21.1% 0.0% 1.00
Altoona, PA 37.4% 15.2% 0.59 21.0% 10.1% 0.52
Lima, OH 37.3% 15.3% 0.59 22.8% 7.3% 0.68
Rochester, MN 37.3% 4.9% 0.87 19.9% 0.0% 1.00
Memphis, TN-AR-MS
37.3% 14.6% 0.61 24.1% 5.7% 0.76
Milwaukee-Waukesha, WI
37.3% 11.7% 0.69 25.0% 5.0% 0.80
San Angelo, TX 37.3% 33.3% 0.11 20.6% 20.6% 0.00
San Antonio, TX 37.3% 21.4% 0.43 20.6% 4.2% 0.79
Barnstable-Yarmouth, MA
37.2% 13.7% 0.63 24.5% 0.0% 1.00
Yuma, AZ 37.1% 29.0% 0.22 18.8% 0.0% 1.00
Joplin, MO 37.1% 16.7% 0.55 19.8% 0.0% 1.00
Iowa City, IA 37.1% 25.4% 0.32 24.3% 9.9% 0.59
Santa Barbara-Santa Maria-Lompoc, CA
37.1% 45.3% -0.22 24.7% 0.1% 0.99
Santa Cruz-Watsonville, CA
37.1% 25.2% 0.32 24.7% 0.0% 1.00
Santa Rosa, CA 37.1% 18.2% 0.51 24.7% 0.0% 1.00
Bellingham, WA 37.1% 20.2% 0.45 23.2% 0.0% 1.00
Jamestown, NY 36.9% 18.8% 0.49 20.0% 8.2% 0.59
Janesville-Beloit, WI 36.9% 14.5% 0.61 23.4% 2.9% 0.88
Modesto, CA 36.8% 21.2% 0.42 23.2% 0.7% 0.97
Atlanta, GA 36.8% 18.3% 0.50 20.1% 2.9% 0.86
Bismarck, ND 36.8% 26.6% 0.28 22.2% 0.0% 1.00
Reno, NV 36.7% 40.0% -0.09 24.1% 0.4% 0.99
York, PA 36.7% 13.5% 0.63 23.4% 4.9% 0.79
Scranton-Wilkes-Barre-Hazleton,PA
36.7% 12.0% 0.67 20.7% 3.2% 0.85
Wausau, WI 36.7% 7.2% 0.80 23.6% 0.0% 1.00
Redding, CA 36.7% 10.6% 0.71 20.1% 0.0% 1.00
Enid, OK 36.7% 21.2% 0.42 20.1% 0.0% 1.00
(continued )
Stumbling Blocks to Entrepreneurship in Low- and Moderate-Income Communities 113
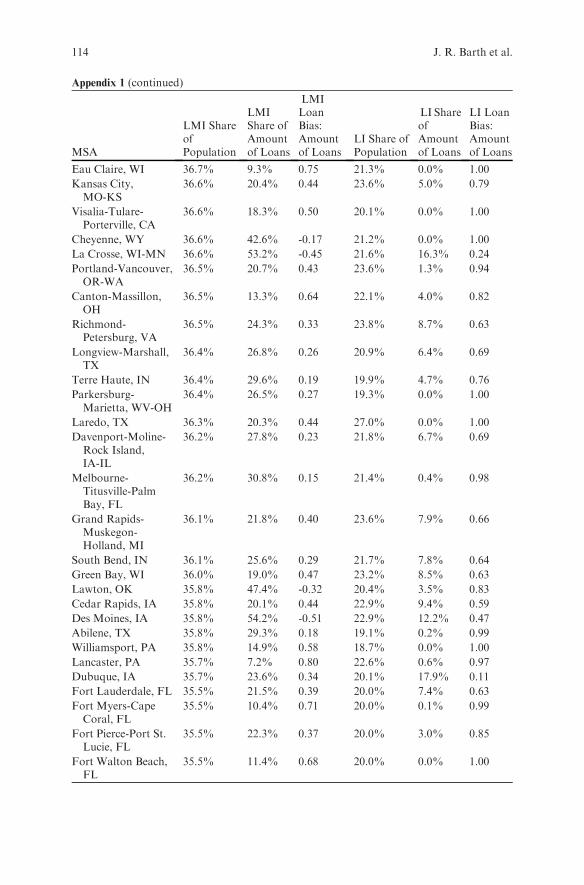
Appendix 1 (continued)
MSA
LMI ShareofPopulation
LMIShare ofAmountof Loans
LMILoanBias:Amountof Loans
LI Share ofPopulation
LI ShareofAmountof Loans
LI LoanBias:Amountof Loans
Eau Claire, WI 36.7% 9.3% 0.75 21.3% 0.0% 1.00
Kansas City,MO-KS
36.6% 20.4% 0.44 23.6% 5.0% 0.79
Visalia-Tulare-Porterville, CA
36.6% 18.3% 0.50 20.1% 0.0% 1.00
Cheyenne, WY 36.6% 42.6% -0.17 21.2% 0.0% 1.00
La Crosse, WI-MN 36.6% 53.2% -0.45 21.6% 16.3% 0.24
Portland-Vancouver,OR-WA
36.5% 20.7% 0.43 23.6% 1.3% 0.94
Canton-Massillon,OH
36.5% 13.3% 0.64 22.1% 4.0% 0.82
Richmond-Petersburg, VA
36.5% 24.3% 0.33 23.8% 8.7% 0.63
Longview-Marshall,TX
36.4% 26.8% 0.26 20.9% 6.4% 0.69
Terre Haute, IN 36.4% 29.6% 0.19 19.9% 4.7% 0.76
Parkersburg-Marietta, WV-OH
36.4% 26.5% 0.27 19.3% 0.0% 1.00
Laredo, TX 36.3% 20.3% 0.44 27.0% 0.0% 1.00
Davenport-Moline-Rock Island,IA-IL
36.2% 27.8% 0.23 21.8% 6.7% 0.69
Melbourne-Titusville-PalmBay, FL
36.2% 30.8% 0.15 21.4% 0.4% 0.98
Grand Rapids-Muskegon-Holland, MI
36.1% 21.8% 0.40 23.6% 7.9% 0.66
South Bend, IN 36.1% 25.6% 0.29 21.7% 7.8% 0.64
Green Bay, WI 36.0% 19.0% 0.47 23.2% 8.5% 0.63
Lawton, OK 35.8% 47.4% -0.32 20.4% 3.5% 0.83
Cedar Rapids, IA 35.8% 20.1% 0.44 22.9% 9.4% 0.59
Des Moines, IA 35.8% 54.2% -0.51 22.9% 12.2% 0.47
Abilene, TX 35.8% 29.3% 0.18 19.1% 0.2% 0.99
Williamsport, PA 35.8% 14.9% 0.58 18.7% 0.0% 1.00
Lancaster, PA 35.7% 7.2% 0.80 22.6% 0.6% 0.97
Dubuque, IA 35.7% 23.6% 0.34 20.1% 17.9% 0.11
Fort Lauderdale, FL 35.5% 21.5% 0.39 20.0% 7.4% 0.63
Fort Myers-CapeCoral, FL
35.5% 10.4% 0.71 20.0% 0.1% 0.99
Fort Pierce-Port St.Lucie, FL
35.5% 22.3% 0.37 20.0% 3.0% 0.85
Fort Walton Beach,FL
35.5% 11.4% 0.68 20.0% 0.0% 1.00
114 J. R. Barth et al.

Appendix 1 (continued)
MSA
LMI ShareofPopulation
LMIShare ofAmountof Loans
LMILoanBias:Amountof Loans
LI Share ofPopulation
LI ShareofAmountof Loans
LI LoanBias:Amountof Loans
Provo-Orem, UT 35.4% 7.7% 0.78 22.2% 1.7% 0.92
Burlington, VT 35.4% 16.7% 0.53 23.1% 8.4% 0.64
Sheboygan, WI 35.3% 7.5% 0.79 22.1% 0.0% 1.00
Colorado Springs,CO
35.2% 39.8% -0.13 22.2% 3.0% 0.87
Goldsboro, NC 35.1% 15.9% 0.55 19.2% 1.0% 0.95
Wichita Falls, TX 34.6% 36.5% -0.05 18.7% 23.6% -0.26
Jacksonville, NC 33.6% 8.1% 0.76 15.8% 0.0% 1.00
Source: Milken Institute based on U.S. Census 2000, CRA 2001, and FDIC 2001.
Appendix 2
Explanation of Terms Used in Entrepreneurship Studies(See http://www.census.gov/csd/susb/defterm.html)
Establishment–A single physical location where business is conducted or where
services or industrial operations are performed.
Employment–Paid employment consists of full- and part-time employees,
including salaried officers and executives of corporations, who were on the
payroll in the pay period including March 12. Included are employees on sick
leave, holidays, and vacations; not included are proprietors and partners of
unincorporated businesses.
Annual Payroll–Total annual payroll includes all forms of compensation, such
as salaries, wages, commissions, bonuses, vacation allowances, sick-leave pay,
and the value of payments in kind (e.g., free meals and lodgings) paid during the
year to all employees.
Receipts–Receipts (net of taxes) are defined as the revenue for goods produced or
distributed, or services provided, including revenue earned from premiums,
commissions and fees, rents, interest, dividends, and royalties. Receipts excludes
all revenue collected for local, state, and federal taxes. Receipts are acquired
from the Economic Census data for establishments in industries that are
in-scope[?] to the Economic Census; receipts are acquired from IRS tax data
for single-establishment businesses in industries that are out-of-scope of[?]the
Economic Census; payroll-to-receipts ratios are used to estimate receipts for
multiestablishment businesses in industries that are out-of-scope of[?]the
Economic Census. Statistics of U.S. Businesses has receipts for 1997 only.
Stumbling Blocks to Entrepreneurship in Low- and Moderate-Income Communities 115

Enterprise–A business organization consisting of one or more domestic
establishments under common ownership or control. The enterprise and the
establishment are the same for single-establishment firms. Each multiestablish-
ment company forms one enterprise-the enterprise employment and annual
payroll are summed from the associated establishments.
Firm–A business organization consisting of one or more domestic establish-
ments in the same state and industry under common ownership or control. The
firm and the establishment are the same for single-establishment firms. For each
multiestablishment firm, establishments in the same industry within a state will
be counted as one firm; the firm employment and annual payroll are summed
from the associated establishments.
Enterprise Size–Designations are determined by the summed employment of all
associated establishments. The enterprise size group 0 includes enterprises for
which no associated establishments reported paid employees in the mid-March
pay period but paid employees at some time during the year.
Establishment Births–Establishments with no employment in the first quarter of
the initial year, and positive employment in the first quarter of the subsequent year.
Establishment Deaths–Establishments with positive employment in the first quar-
ter of the initial year and no employment in the first quarter of the subsequent year.
Establishment Expansions–Establishments with positive first-quarter employ-
ment in both the initial and subsequent years, and increase employment during
the period between the first quarter of the initial year and the first quarter of the
subsequent year.
Establishments Contractions–establishments with positive first-quarter employ-
ment in both the initial and subsequent years and decrease employment during
the period between the first quarter of the initial year and the first quarter of the
subsequent year.
Metropolitan Statistical Area (MSA)– An integrated economic and social unit
with a large population nucleus. EachMSA consists of one or more counties or
statistically equivalent area meeting published standards of population and
metropolitan character; in the six New England states (Connecticut, Maine,
Massachusetts, NewHampshire, Rhode Island, and Vermont), cities and towns
(rather than counties) are used as the component geographic units.Legal Form of Organization (LFO)
a. Corporations–Enterprises legally incorporated under state lawsb. Partnerships–Unincorporated enterprises owned by two or more persons
having financial interest in the business
116 J. R. Barth et al.

c. Sole Proprietorships–Unincorporated enterprises owned by one persond. Nonprofit Organizations–Enterprises with nonprofit status (tax-exempt)e. Other (Associations, Trust, Joint Ventures, Estates, etc.)–Enterprises
formed by another legal form of organizationf. Unknown–Enterprises with an unknown legal form of organization
References
Acs, Zoltan and Catherine Armington. ‘‘Employment Growth and Entrepreneurial Activityin Cities.’’ Working Paper for the Discussion Papers on Entrepreneurship, Growth andPublic Policy, March 2004.
Barth, JamesR., JosephCordes, andAnthonyYezer. ‘‘Benefits andCosts of LegalRestrictionson Personal Loan Markets.’’ Journal of Law and Economics 29, No. 2 (1986): 357–380.
Barth, James R., Padma Gotour. Neela Manage and Anthony Yezer. ‘‘The Effect ofGovernment Regulations on Personal Loan Markets: A Tobit Estimation of aMicroeconomic Model.’’ The Journal of Finance 38, No. 4 (1983): 1,233–1,251.
Bates, Timothy. ‘‘Commercial Bank Financing of White- and Black-Owned Small BusinessStartups.’’ Quarterly Review of Economics and Business 31, No. 1 (1991): 64–80.
Berger, Allen and Gregory Udell. ‘‘Lines of Credit and Relationship: Lending in Small FirmFinance.’’ Working Paper No. 113 of the Jerome Levy Economics Institute, 1994.
Berkowitz, J and White, M J (2002), ‘Bankruptcy and Small Firms’ Access to Credit’, NBERWorking Paper Number 9010.
Black, Sandra and Philip Strahan. ‘‘Entrepreneurship and Bank Credit Availability.’’ TheJournal of Finance 58, No. 6 (2002): 2,807–2,833.
Blanchflower, David, Phillip Levine, and David Zimmerman. ‘‘Discrimination in theSmall-Business Credit Market.’’ Review of Economics and Statistics 85, No. 4 (2003):930–943.
Blanchflower, David and Andrew Oswald. ‘‘WhatMakes an Entrepreneur?’’ Journal of LaborEconomics 16, No. 1 (1998): 26–60.
Bostic, Raphael and Parick Lampani. ‘‘Racial Differences in Patterns of Small BusinessFinance: The Importance of Local Geography.’’ Presented at the Federal SystemResearch Conference on Business Access to Capital and Credit, Arlington, VA, 8March 1999.
Brevoort, Kenneth and Timothy Hannan. ‘‘Commercial Lending and Distance: Evidencefrom Community Reinvestment Act Data.’’ Working Paper No. 2004–24 of the FederalReserve Finance and Economics Discussion Series, 2004.
Cavaluzzo, Ken and John Wolken. ‘‘Small Business Loan Turndowns, Personal Wealth, andDiscrimination.’’ Working Paper No. 2002–35 of the Federal Reserve Finance and Eco-nomics Discussion Series, 2002.
Davis, Steven, John Haltiwanger, Ron Jarmin, and others. ‘‘Measuring the Dynamics ofYoung and Small Businesses: Integrating the Employer and Nonemployer Universes.’’Working Paper by the Kauffman Foundation and the U.S. Census Bureau, 2005.
DeYoung, Robert, Dennis Glennon, and Peter Nigro. ‘‘Borrower-Lender Distance, CreditScoring, and the Performance of Small Business Loans.’’ Presented at the FDIC fifthannual Banking Research Conference: Financial Sector Integrity and Emerging Risks inBanking, Arlington, Virginia, 22 September 2005.
Dunn, Thomas and Douglas Holtz-Eakin. ‘‘Financial Capital, Human Capital, and theTransition to Self-Employment: Evidence from Intergenerational Links.’’ Journal ofLabor Economics 18, No. 2 (2000): 282–305.
Stumbling Blocks to Entrepreneurship in Low- and Moderate-Income Communities 117
Evans, David and Linda Leighton. ‘‘Some Empirical Aspects of Entrepreneurship.’’ TheAmerican Economic Review 79, No. 3 (1989): 519–535.
Fairlie, Robert. ‘‘The Absence of the African-American Owned Business: An Analysis of theDynamics of Self-Employment.’’ Journal of Labor Economics 17, No. 1 (1999): 80–108.
Fairlie, Robert. ‘‘Kauffman Index of Entrepreneurial Activity.’’ The Ewing MarionKauffman Foundation, 2005.
Fairlie, Robert and Alicia Robb. ‘‘Families, Human Capital, and Small Business: Evidencefrom the Characteristics of Business Owners Survey.’’ Working Paper No. 1296 for theInstitute for the Study of Labor IZA and No. 871 for the Economic Growth Center, YaleUniversity, 2004.
Gentry, William and Robert Glenn Hubbard. ‘‘Entrepreneurship and Household Saving.’’Journal of Advances in Economic Analysis & Policy 4, No. 1 (2004): Article 8.
Gompers, Paul, Joshua Lerner, and David Scharfstein. ‘‘Entrepreneurial Spawning: PublicCorporations and the Genesis of NewVentures, 1986–1999.’’ Working Paper No. 4317–03of the Sloane School of Management at the Massachusetts Institute of Technology andNo. 03–37 of Negotiation, Organization, and Markets at Harvard University, 2003.
Guiso, Luigi and Fabiano Schivardi. ‘‘Learning to be an Entrepreneur.’’ Working Paper,2004.
Guiso, Luigi, Paola Sapienza and Luigi Zingales. ‘‘Does Local Financial DevelopmentMatter?’’ The Quarterly Journal of Economics 119, No. 3 (2004): 929–969.
Hamilton, Barton. ‘‘Does Entrepreneurship Pay? An Empirical Analysis of Returns ofSelf-Employment.’’ The Journal of Political Economy 108, No. 3 (2000): 604–631.
Hoening, Thomas. ‘‘Entrepreneurship and Growth.’’ Entrepreneur’s Experiences: A TownHall Meeting, Entrepreneur’s Exchange, Kansas City, Missouri. 28 April 2005.
Holtz-Eakin, Douglas, David Joulfaian, and Harvey Rosen. ‘‘Entrepreneurial Decisions andLiquidity Constraints.’’ The RAND Journal of Economics 25, No. 2 (1994a): 334–347.
Holtz-Eakin, Douglas, David Joulfaian, andHarvey Rosen. ‘‘Sticking It Out: EntrepreneurialSurvival and Liquidity Constraints.’’ The Journal of Political Economy 102,No. 1 (1994b):53–75.
Hurst, Erik and Annamaria Lusardi. ‘‘Liquidity Constraints, Household Wealth, andEntrepreneurship,’’ The Journal of Political Economy 112, No. 2 (2004): 319–347.
Immergluck, Dan and Geoff Smith. ‘‘Bigger, Faster . . . But Better? How Changes in theFinancial Services Industry Affect Small Business Lending in Urban Areas.’’ Prepared forthe Brookings Institution Center on Urban and Metropolitan Policy by the WoodstockInstitute, 2001.
Kihlstrom, Richard and Jean-Jacques Laffont. ‘‘A General Equilibrium Theory of FirmFormation Based on Risk-Aversion.’’ The Journal of Political Economy 87, No. 4 (1979):719–48.
Knight, Frank. Risk, Uncertainty, and Profit. New York: Houghton Mifflin, 1921.Low, Sarah, Jason Henderson, and Stephan Weiler. ‘‘Gauging a Region’s Entrepreneurial
Potential.’’ Federal Reserve Bank of Kansas City Economic Review. Third Quarter 2005:61–89.
Lucas, Robert. ‘‘On the Size Distribution of Business Firms.’’Bell Journal of Economics 9, No.2 (1978): 508–523.
Meyer, Bruce. ‘‘Why are there so Few Black Entrepreneurs?’’ Working Paper No. 3537 for theNational Bureau of Economic Research, 1990.
Minority Business Development Agency ‘‘The State of Minority Business Enterprises: AnOverview of the 2002 Survey of Business Owners.’’ 2006.[not my highlight—ea]
Mitchell, Karlyn and Douglas Pearce. ‘‘Discrimination, Competition, and Relationship vs.Transaction Lending to Small Businesses: Evidence from the 1998 Survey of SmallBusiness Finances.’’ Preliminary Draft, November 2004.
Moore, Kevin. ‘‘Do Liquidity Constraints Matter for New Entrepreneurs?’’ Working Paper No.2004–42 of the Federal Reserve System Finance and Economics Discussion Series, 2004.
118 J. R. Barth et al.
Petersen, Mitchell and Raghuram Rajan. ‘‘Does Distance Still Matter? The InformationRevolution in Small Business Lending.’’ The Journal of Finance 57, No. 6 (2002):2,533–2,570.
Persad, Sandhya. ‘‘Bankruptcy Exemptions and Small Business Credit Re-examined: UsingLoan Guarantees to isolate Borrower Moral Hazard behavior,’’ The Wharton School ofBusiness: 2004.
Puri, Manju and David Robinson. ‘‘Optimism and Economic Choice.’’ Prepared for the AFA2006 Boston Meetings Papers, 2005.
Schumpeter, Joseph. The Theory of Economic Development. Cambridge: Harvard UniversityPress, 1911.
U.S. Small Business Administration Office of Advocacy and The Ewing Marion KauffmanFoundation. Entrepreneurship in the Twenty-First Century. Conference proceedings from26, March 2004.
Vos, Ed, Andrew Jia-Yuh Yeh, Sara Carter, and Stephen Tagg. ‘‘The Happy Story of SmallBusiness Financing.’’ Working Paper, 2005.
Yago, Glenn, Betsy Zeidman, and Bill Schmidt. Creating Capital, Jobs, and Wealth inEmerging Domestic Markets: Financial Technology Transfer to Low-Income Communities.Milken Institute, 2003.
Stumbling Blocks to Entrepreneurship in Low- and Moderate-Income Communities 119


The Role of Morris Plan Lending Institutions
in Expanding Consumer Microcredit
in the United States
David Mushinski and Ronnie J. Phillips
Economic theory supposes that an entrepreneur, confrontedwith an unmet social need, will take profit-making action.Annoyed by the darkness, he or she will light a candle. Inconsumer finance at that time and place, [Arthur J.] Morriswas this man of theory come to life.
James Grant, Money of the Mind, 1992.
Abstract This paper examines the rise of the Morris Plan banks, in the earlypart of the twentieth century, in providing consumer credit. Morris Plan banksemerged at a time when formal consumer credit markets were virtually non-existent. Credit unions appeared in the United States at the same time. Withintwenty years of their appearance, Morris Plan banks dominated consumerlending. The demise of Morris Plan banks began with the full recovery ofbanking after the Great Depression. This paper analyzes the structure ofMorrisPlan lending in light of the recent literature concerning joint-liability creditinstitutions. Our analysis suggests that the success of the Morris Plan lendingstructure may be attributed partly to how it alleviated informational asymme-tries and costs associated with lending. The analysis also suggests that theMorris Plan structure grew faster than credit unions because it imposed lessjoint liability on borrowers than did credit unions. Ultimately, the emergence ofMorris Plan banks during this period is an interesting historical example of aninstitution arising organically within the private sector to meet a credit need,and disappearing after alternative institutional forms, which were less costly toborrowers, emerged as consumer credit mark ets matured.
In late 1987, the assets of thirteen Colorado industrial banks were frozen by thestate banking regulator. With the prospect of the bankruptcy of the privatedeposit insurance fund to which the banks subscribed, the American Bankerlamented ‘‘one of the curiosities of the financial services business, seem to be on
D. MushinskiColorado State [email protected]
G. Yago et al. (eds.), Entrepreneurship in Emerging Domestic Markets.� Milken Institute 2008
121
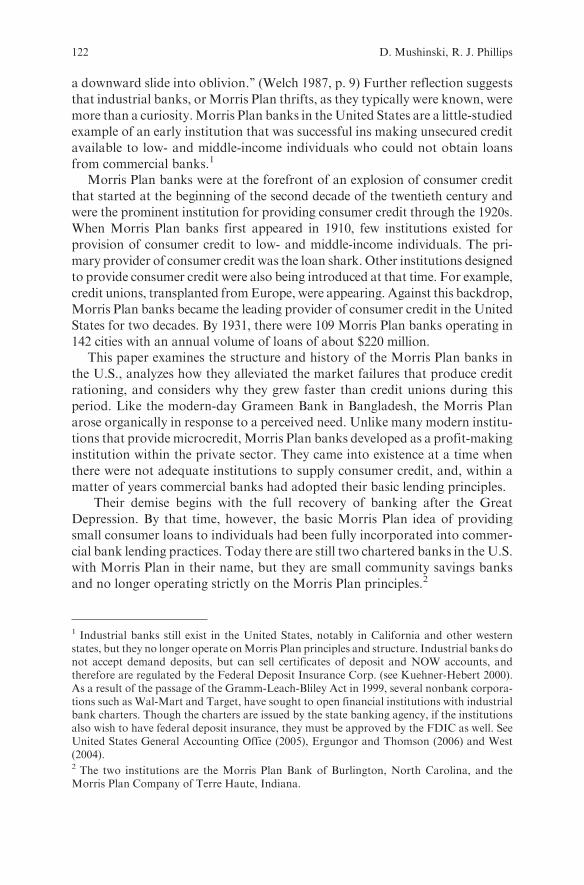
a downward slide into oblivion.’’ (Welch 1987, p. 9) Further reflection suggests
that industrial banks, orMorris Plan thrifts, as they typically were known, were
more than a curiosity.Morris Plan banks in theUnited States are a little-studiedexample of an early institution that was successful ins making unsecured credit
available to low- and middle-income individuals who could not obtain loansfrom commercial banks.1
Morris Plan banks were at the forefront of an explosion of consumer credit
that started at the beginning of the second decade of the twentieth century andwere the prominent institution for providing consumer credit through the 1920s.
When Morris Plan banks first appeared in 1910, few institutions existed forprovision of consumer credit to low- and middle-income individuals. The pri-
mary provider of consumer credit was the loan shark. Other institutions designedto provide consumer credit were also being introduced at that time. For example,
credit unions, transplanted fromEurope, were appearing. Against this backdrop,Morris Plan banks became the leading provider of consumer credit in the United
States for two decades. By 1931, there were 109 Morris Plan banks operating in142 cities with an annual volume of loans of about $220 million.
This paper examines the structure and history of the Morris Plan banks in
the U.S., analyzes how they alleviated the market failures that produce creditrationing, and considers why they grew faster than credit unions during this
period. Like the modern-day Grameen Bank in Bangladesh, the Morris Planarose organically in response to a perceived need. Unlike many modern institu-
tions that provide microcredit, Morris Plan banks developed as a profit-makinginstitution within the private sector. They came into existence at a time when
there were not adequate institutions to supply consumer credit, and, within amatter of years commercial banks had adopted their basic lending principles.
Their demise begins with the full recovery of banking after the Great
Depression. By that time, however, the basic Morris Plan idea of providingsmall consumer loans to individuals had been fully incorporated into commer-
cial bank lending practices. Today there are still two chartered banks in the U.S.with Morris Plan in their name, but they are small community savings banks
and no longer operating strictly on the Morris Plan principles.2
1 Industrial banks still exist in the United States, notably in California and other westernstates, but they no longer operate onMorris Plan principles and structure. Industrial banks donot accept demand deposits, but can sell certificates of deposit and NOW accounts, andtherefore are regulated by the Federal Deposit Insurance Corp. (see Kuehner-Hebert 2000).As a result of the passage of the Gramm-Leach-Bliley Act in 1999, several nonbank corpora-tions such as Wal-Mart and Target, have sought to open financial institutions with industrialbank charters. Though the charters are issued by the state banking agency, if the institutionsalso wish to have federal deposit insurance, they must be approved by the FDIC as well. SeeUnited States General Accounting Office (2005), Ergungor and Thomson (2006) and West(2004).2 The two institutions are the Morris Plan Bank of Burlington, North Carolina, and theMorris Plan Company of Terre Haute, Indiana.
122 D. Mushinski, R. J. Phillips

In retrospect, the success of Morris Plan banks was due to their reducing thetransaction costs associated with the lending process, and alleviating adverseselection and enforcement problems that in recent years have been identified assources of credit market failures. The Morris Plan lending structure required aloan applicant to find two cosigners who were well acquainted with the bor-rower, and who were of similar economic standing (i.e., they had similar andsteady earning power). The cosigner requirement imposed a type of jointliability whose effect was to reduce transaction costs and problems of adverseselection and enforcement. Evidence supports the presence of these incentives inthe Morris Plan lending structure.
The rise of Morris Plan banks is also interesting because they came intoprominence during a period in which an alternative lending institution that usedjoint liability—credit unions—was being introduced to the United States.Credit unions were an institutional transplant that had become popular andsuccessful in Germany. The contrast of two institutions using different levels ofjoint liability is interesting. We argue that the joint liability imposed under thecredit union contract was greater than that of the Morris Plan contract, andthat part of the success of theMorris Plan bank was a result of its lower liabilityon borrowers. Evidence regarding the contract terms of these two institutions,and those of loan sharks, comports with theoretical predictions of the literatureregarding joint-liability institutions.
The rest of this paper is organized as follows. Section 1 reviews the state ofconsumer credit at the beginning of the twentieth century, describes the MorrisPlan lending structure, and discusses the emergence of Morris Plan banks. Thenext section addresses three issues. We first analyze theMorris Plan structure inlight of recent theoretical analyses of microcredit institutions. We then reviewempirical data in light of those theoretical analyses. That discussion is followedby an analysis of why Morris Plan banks prevailed over credit unions duringthis period. Our conclusion follows.
1 The Democratization of Credit in the Early Twentieth Century
The emergence of the Morris Plan came in the middle of the Progressive Era inAmerican history. The policies of President TeddyRoosevelt to promote resourceconservation, antitrust actions by government to break up large corporations,and a general concern for the plight of the common man continued through thepresidency of WoodrowWilson. President William Howard Taft had created thepostal savings system for small, often foreign-born, savers, and in New York,the Russell Sage Foundation began its Remedial Loan program. The loan sharkwas viewed as a despicable character who exploited the poor solely for his ownprofits. There was a great campaign in New York, and indeed throughout thecountry, to end the menace of the loan shark. Pawnshops, which provided small,collateralized loans, were also an alternative for small borrowers (Caskey 1994).
The Role of Morris Plan Lending Institutions in Expanding 123

Although the loan shark was reviled, and modern-day economists would
consider the microlending area a market failure, the remedy for this failure was
threefold. The first addressed market failure by providing philanthropic means of
supplying credit. The resulting institutions, such as the Provident Loan Society,
never intended to make a profit. A second approach, less philanthropic but not
necessarily profit-oriented, was the creation of credit unions, the first of which was
established in theU.S. in 1909. The third approached the lending needs of the poor
as both a profit opportunity and a way to improve their standard of living by
establishing a means for them to save. At a time when institutions providing both
lending and saving services to poor people virtually nonexistent, a new type of
institution emerged: the industrial bank. The earliest and best known of the
industrial bankswere established under theMorris Plan. From1909–1917,Morris
Plan institutions grew more rapidly than credit unions, as depicted in Figure 1.As the story is told, Arthur J.Morris, a Virginia lawyer, found it troubling that
a securely employed worker seeking a small loan was denied access to credit from
local banks, and was forced to borrow from loan sharks. Morris thought that a
country that denied bank loans to a large part of its population had a ‘‘weak spot’’
in its banking system.He began to study banking laws in theU.S. in the hope that
some type of ‘‘banking institution could be evolved that would correct the
existing evils and supply credit to the needy’’ (Herzog, 1928, pp. 12–13). Morris’s
study led him to establish a set of principles for lending to the poor. They were:
1. Character, plus earning power, is a proper basis of credit.2. Loans made on this basis of credit must carry the privilege of repayment over
a period long enough to match the earning power of the borrower.
Fig. 1. Spread of Morris Plan Institutions and Credit Unions from 1909–1917.Source: Derived from Herzog (1928) and Clark (1931).
124 D. Mushinski, R. J. Phillips
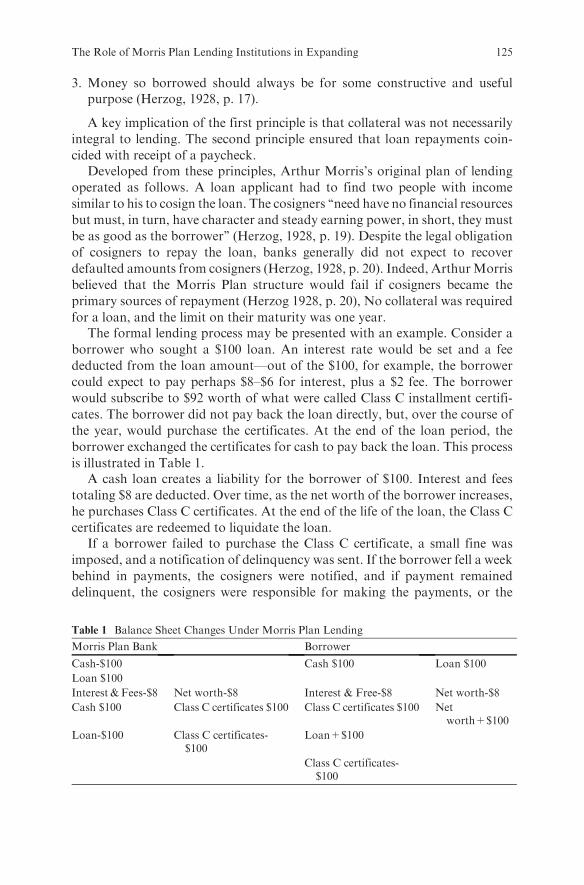
3. Money so borrowed should always be for some constructive and usefulpurpose (Herzog, 1928, p. 17).
A key implication of the first principle is that collateral was not necessarily
integral to lending. The second principle ensured that loan repayments coin-
cided with receipt of a paycheck.Developed from these principles, Arthur Morris’s original plan of lending
operated as follows. A loan applicant had to find two people with income
similar to his to cosign the loan. The cosigners ‘‘need have no financial resources
but must, in turn, have character and steady earning power, in short, they must
be as good as the borrower’’ (Herzog, 1928, p. 19). Despite the legal obligation
of cosigners to repay the loan, banks generally did not expect to recover
defaulted amounts from cosigners (Herzog, 1928, p. 20). Indeed, ArthurMorris
believed that the Morris Plan structure would fail if cosigners became the
primary sources of repayment (Herzog 1928, p. 20), No collateral was required
for a loan, and the limit on their maturity was one year.The formal lending process may be presented with an example. Consider a
borrower who sought a $100 loan. An interest rate would be set and a fee
deducted from the loan amount—out of the $100, for example, the borrower
could expect to pay perhaps $8–$6 for interest, plus a $2 fee. The borrower
would subscribe to $92 worth of what were called Class C installment certifi-
cates. The borrower did not pay back the loan directly, but, over the course of
the year, would purchase the certificates. At the end of the loan period, the
borrower exchanged the certificates for cash to pay back the loan. This process
is illustrated in Table 1.A cash loan creates a liability for the borrower of $100. Interest and fees
totaling $8 are deducted. Over time, as the net worth of the borrower increases,
he purchases Class C certificates. At the end of the life of the loan, the Class C
certificates are redeemed to liquidate the loan.If a borrower failed to purchase the Class C certificate, a small fine was
imposed, and a notification of delinquency was sent. If the borrower fell a week
behind in payments, the cosigners were notified, and if payment remained
delinquent, the cosigners were responsible for making the payments, or the
Table 1 Balance Sheet Changes Under Morris Plan Lending
Morris Plan Bank Borrower
Cash-$100 Cash $100 Loan $100
Loan $100
Interest & Fees-$8 Net worth-$8 Interest & Free-$8 Net worth-$8
Cash $100 Class C certificates $100 Class C certificates $100 Networth+$100
Loan-$100 Class C certificates-$100
Loan+$100
Class C certificates-$100
The Role of Morris Plan Lending Institutions in Expanding 125

full note became due. If all methods of collecting failed, the final recourse waslegal action to recover the amount of the loan from the borrower and cosigners(Herzog, 1928, pp. 21–22).
The initial capital of the Morris Plan institution was provided by issuingClass A stock certificates, which carried voting privileges. Additional capitalwas provided by issuing Class B 5 percent investment certificates, sold tocustomers. Sometimes, Morris Plan institutions secured loans from commercialbanks (Herzog, 1928, p. 22). The Class C, or installment, certificates also servedas a source of funds. Morris Plan institutions that were chartered and regulatedbanks also used time deposits as a source of funding.
The first Morris Plan institution was the Fidelity Savings and Trust Com-pany of Norfolk, Virginia, established March 23, 1910. In 1911, the AtlantaLoan and Savings Company became the secondMorris Plan institution, and in1912, it was followed by institutions in Baltimore, Maryland; Washington,D.C.; and Richmond, Virginia. The Fidelity Corporation of America wasformed to hold stock in Morris Plan institutions, but these resources wereinadequate, given the demand for Morris Plan institutions (Herzog, 1928,pp. 24–25).
In 1914, the Industrial Finance Corporation (IFC) was established with thefinancial backing of several prominent businessmen and philanthropists: JuliusRosenwald, Dr. E.R.L. Gould, Andrew Carnegie, and Vincent Astor. Thepurpose of the IFC was to aid the establishment of a nationwide system ofMorris Plan institutions. With an authorized capital of $7 million ($5 millionpreferred stock, $2 million common), the IFC acquired all of the assets of theFidelity Corporation of America. The IFC enjoyed wide support in the businesscommunity, including the Wall Street Journal and Banker’s Magazine. Thelatter noted, in referring to the establishment of the IFC: ‘‘This enterprise iscertainly a laudable one, and backed up by men of capital and successfulbusiness experience, it is reasonably certain to accomplish the ends for whichit is designed. ... We are rapidly building up a financial and banking system inthis country—the Federal Reserve banks, land credit banks, and the loanassociation just referred to, all constitute important links of the chain’’ (quotedin Herzog, 1928, p. 29).
The IFC subscribed to the stock of every newMorris Plan institution, taking10 percent to 25 percent stock in each. For the relatively few in which the IFCdid not hold stock, the new Morris Plan companies paid a franchise fee for theMorris Plan rights. Subsequently, the stock of the Morris Plan institutionsowned by the IFC, and all Morris Plan-related activities, were taken over bythe Morris Plan Corporation of America. The IFC’s three subsidiaries areengaged in insurance, automobile financing, and securities. A trade associationwas formed in 1919 to promote Morris Plan institutions. This association laterchanged its name to the Consumer Bankers Association and still exists today.The corporate structure is presented in Figure 2.
Credit unions emerged at the same time as Morris Plan banks. In 1910, oneMorris Plan bank and one credit union existed in the United States (Robinson
126 D. Mushinski, R. J. Phillips
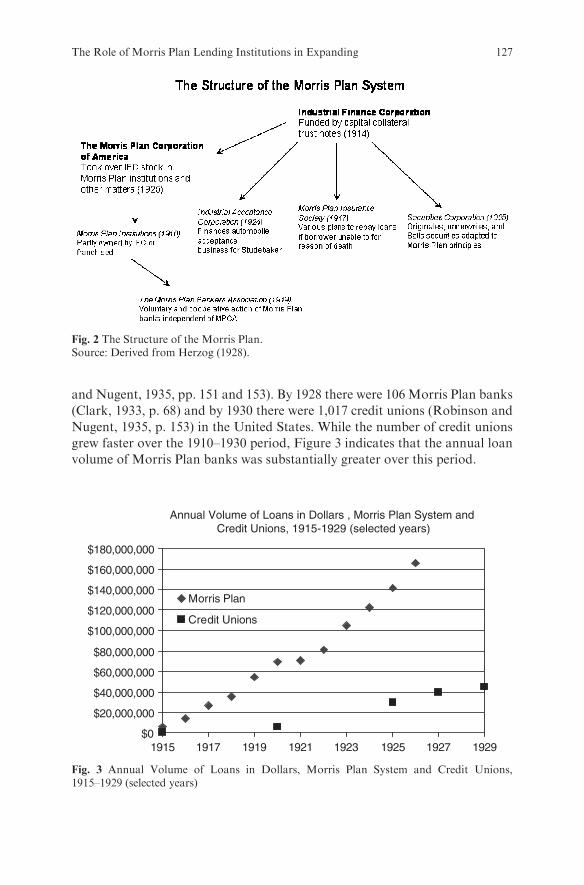
and Nugent, 1935, pp. 151 and 153). By 1928 there were 106Morris Plan banks
(Clark, 1933, p. 68) and by 1930 there were 1,017 credit unions (Robinson and
Nugent, 1935, p. 153) in the United States. While the number of credit unions
grew faster over the 1910–1930 period, Figure 3 indicates that the annual loan
volume of Morris Plan banks was substantially greater over this period.
Fig. 2 The Structure of the Morris Plan.Source: Derived from Herzog (1928).
Annual Volume of Loans in Dollars , Morris Plan System and Credit Unions, 1915-1929 (selected years)
$0
$20,000,000
$40,000,000
$60,000,000
$80,000,000
$100,000,000
$120,000,000
$140,000,000
$160,000,000
$180,000,000
1915 1917 1919 1921 1923 1925 1927 1929
Morris Plan
Credit Unions
Fig. 3 Annual Volume of Loans in Dollars, Morris Plan System and Credit Unions,1915–1929 (selected years)
The Role of Morris Plan Lending Institutions in Expanding 127
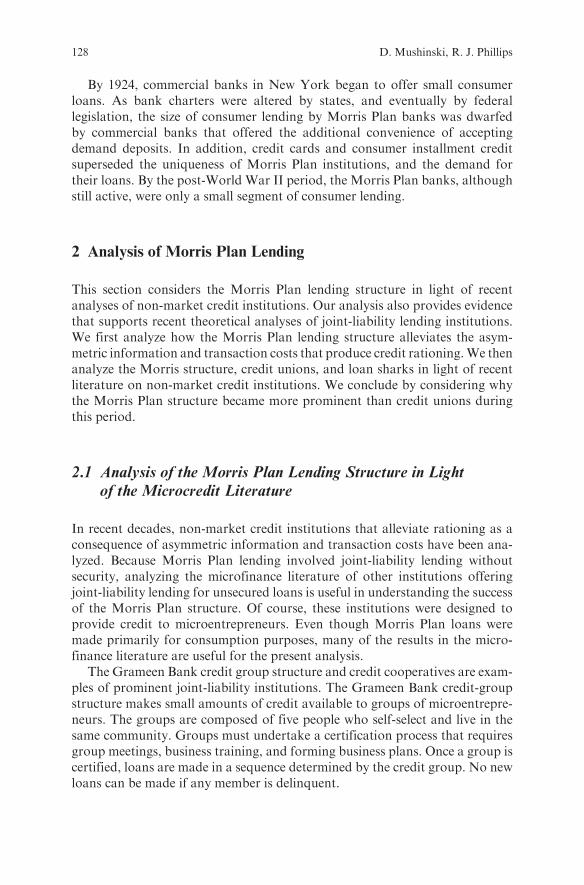
By 1924, commercial banks in New York began to offer small consumerloans. As bank charters were altered by states, and eventually by federallegislation, the size of consumer lending by Morris Plan banks was dwarfedby commercial banks that offered the additional convenience of acceptingdemand deposits. In addition, credit cards and consumer installment creditsuperseded the uniqueness of Morris Plan institutions, and the demand fortheir loans. By the post-World War II period, the Morris Plan banks, althoughstill active, were only a small segment of consumer lending.
2 Analysis of Morris Plan Lending
This section considers the Morris Plan lending structure in light of recentanalyses of non-market credit institutions. Our analysis also provides evidencethat supports recent theoretical analyses of joint-liability lending institutions.We first analyze how the Morris Plan lending structure alleviates the asym-metric information and transaction costs that produce credit rationing.We thenanalyze the Morris structure, credit unions, and loan sharks in light of recentliterature on non-market credit institutions. We conclude by considering whythe Morris Plan structure became more prominent than credit unions duringthis period.
2.1 Analysis of the Morris Plan Lending Structure in Lightof the Microcredit Literature
In recent decades, non-market credit institutions that alleviate rationing as aconsequence of asymmetric information and transaction costs have been ana-lyzed. Because Morris Plan lending involved joint-liability lending withoutsecurity, analyzing the microfinance literature of other institutions offeringjoint-liability lending for unsecured loans is useful in understanding the successof the Morris Plan structure. Of course, these institutions were designed toprovide credit to microentrepreneurs. Even though Morris Plan loans weremade primarily for consumption purposes, many of the results in the micro-finance literature are useful for the present analysis.
The Grameen Bank credit group structure and credit cooperatives are exam-ples of prominent joint-liability institutions. The Grameen Bank credit-groupstructure makes small amounts of credit available to groups of microentrepre-neurs. The groups are composed of five people who self-select and live in thesame community. Groups must undertake a certification process that requiresgroup meetings, business training, and forming business plans. Once a group iscertified, loans are made in a sequence determined by the credit group. No newloans can be made if any member is delinquent.
128 D. Mushinski, R. J. Phillips
Credit unions may take a variety of forms (e.g., Banerjee, et. al., 1994).Within the United States, state laws define how credit unions function. Creditunions were organized, generally, ‘‘within groups of people who had somecommon interest, such as labor unions, employee associations, fraternal orders,or neighborhood groups’’ (Robinson and Nugent, 1935, p. 96). Credit unionssold shares to members and, when appropriate, issued dividends on thoseshares. Membership was determined by membership within the group servedby the credit union and ownership of at least one share in the credit union.Members were eligible to receive unsecured loans. At times, cosigners wererequired on those loans.
The key characteristic of the Morris Plan lending structure was the cosignerrequirement. Requiring cosigners on a loan helped reduce Morris Plan banks’costs of reviewing a loan application, alleviate the banks’ informational asym-metries, and lower their monitoring costs. The cosigner requirement reducedbank costs of loan review at the time of application Herzog (1928, pp. 19–20)noted that ‘‘[t]he cosigners’ endorsement meant the saving of extra time andexpense in sifting evidence bearing upon the prospective borrower’s character.’’
Requiring applicants to find cosigners also alleviated adverse-selection pro-blems. Co-signers whowere required to cosign the note would presumably do sofor people who were likely to repay the loan. The cosigner aspect of the MorrisPlan lending structure is similar to the Grameen Bank requiring credit groupmembers to find several other people willing to form a credit group with them.Ghatak (1999) and Van Tassel (1999) have shown that lenders can sort groupscomposed solely of high-type (low-risk) individuals (high-type groups) fromgroups composed of low-type (high-risk) individuals (low-type groups) throughtheir choice of joint liability in a lending contract. Joint liability is more costlyfor low-type individuals because they are more likely to face a default by agroupmember. Low-type individuals, therefore, prefer contracts with low levelsof joint liability. In light of this observation, a lender can separate high-typegroups from low-type groups by offering two different contracts to each group.Low-type groups will prefer contracts with low joint liability and higher interestrates, and high-type groups will prefer contracts with high joint liability andlower interest rates (Ghatak 1999). Van Tassel (1999, p. 14) finds that lendersoffer contracts with no joint liability to low-type individuals and contracts withsome joint liability to high-type individuals, With this sorting of groups, lenderswill make loans that otherwise would not have been made, improving efficiency(Guinnane 1994, 202).
The foregoing equilibrium that separates high- and low-type groups dependson an assortative-matching finding. The assortative-matching result states,basically, that the joint-liability characteristic of group lending induces equili-brium, in that borrowers of the same type form groups (Ghatak 1999, p. 29).Both Ghatak (1999) and Van Tassel (1999) found that joint-liability contractswould induce such matching.
We would not necessarily expect assortative matching to arise naturallywhen an applicant must find cosigners for consumption loans. The
The Role of Morris Plan Lending Institutions in Expanding 129

assortative-matching result arose in the context of providing credit to micro-
entrepreneurs for productive purposes. In the production context, the returns of
each group member depended on the other group members.; joint liability
affected the decisions of all members. In the consumption loan setting with
cosigners, the returns of the borrower do not depend on the cosigners, so an
applicant does not necessarily have the incentive to seek out cosigners of the
same type; the borrower would be willing to find anyone to be a cosigner. Thus,
the joint liability that induces assortative matching and enables lenders to
separate low- and high-type groups may not necessarily arise.The need for assortative matching to induce a separating equilibrium may
explain the Morris Plan requirement that cosigners be of the same standing as
the loan applicant. Such a requirement, especially in terms of employment,
imposes on cosigners the possibility of real loss. When faced with possible real
losses from cosigning, cosigners presumably would cosign only if an applicant
was a high type, or likely to repay the loan. This requirement, then, may have
created the type of joint liability need to achieve the separating equilibrium.The separating equilibrium identified by Ghatak (1999) and Van Tassel
(1999) may explain part of the success of the Morris Plan structure. Given the
assortative matching required by theMorris Plan, the joint liability and interest
rates offered may have induced only high-type individuals to seek loans, with
the costs of cosigning on the loan of a low-type individual too great for that
individual to obtain co-signers.The costs to an applicant of finding cosigners might also alleviate adverse
selection problems. Conlin (1999) has noted that the group-certification process
of the Grameen Bank credit groups may reduce adverse selection problems
because the costs of group certification may be less burdensome to high-type
individuals than to low-type individuals. Under these circumstances, the greater
costs of group certification for low-type individuals may induce them not to
form groups. While Conlin did not apply his idea to the group-formation
process, the idea would seem transferable to group formation. The costs to an
individual of finding cosigners would be expected to be lower for high-type
individuals. Requiring two cosigners, rather than one or three, may have served
to separate the high-types from the low-types while not making the loan
application process too burdensome for the high-type individuals.Cosigners also served to lessen both the bank’s costs of loan monitoring and
enforcement of loan repayment.3 In the event of delinquency of at least a week,
the bank would contact cosigners in the hope that they would rectify the default
3 Analyses of microfinance institutions such as the Grameen Bank credit groups have focusedon the extent to which the joint liability in a credit groups reduces moral hazard problems (e.g.,Stiglitz, 1990). These analyses focus on how group members might affect the productiveoutcomes of fellow group members. Because the present analysis focuses on consumptioncredit provided to employed individuals, the moral hazard analyses are not directly relevant.
130 D. Mushinski, R. J. Phillips
(Herzog, 1928, pp. 22, 68). The lower monitoring costs of using endorsers tocheck up on a borrower is apparent (Armendariz de Aghion 1999).
Analyses of the enforcement of loan repayment concern a borrower’swillingness to repay a loan. These analyses consider the situation where aborrower has the funds to repay a loan but may not apply them to the loan.Besley and Coate (1995) analyzed the impact of both joint liability and socialsanctions on borrower willingness to repay loans. They observed that jointliability had opposing effects. In the event that a party has a high return, thatparty can repay the loan of a defaulting member. On the other hand, if a groupmember has a moderate return, leaving her unable to repay the loan and theloan of a defaulting member, she might choose to default. Thus, the equilibriumdepended on a group member’s production outcome. Besley and Coate (1995)found that, in the absence of social sanctions, group lending dominated indivi-dual lending at low interest rates (pp. 8–9. When social sanctions were intro-duced into the model, they found that group lending dominated individuallending if social sanctions were sufficiently high (Besley and Coate, 1995,p. 13). They concluded by noting that ‘‘[t]he idea of drawing on the punishmentcapability of some agents to improve upon outcomes, may be of wider signifi-cance in contract design in situations where market and non-market institutionsinteract’’ (Besley and Coate, 1995, p. 16).
The enforcement ideas cited by Besley and Coate (1995) would only bestronger in the Morris Plan setting. The Besley and Coate model involved twoproducers who could realize from good to bad production outcomes. Defaultoccurred when neither party could repay his loan (i.e., both had bad outcomes)or when one party could not repay both loans. The Morris Plan provided loansto individuals who were working and whose cosigners were working. In somesense, therefore, all parties to the loan were likely to attain outcomes where theloan could be repaid. In this context, we would expect joint liability to induce anequilibrium with loan repayment. Of course, social sanctions were also presentunder the Morris Plan structure. The cosigners obtained by loan applicantswould necessarily be well acquainted with the applicant and could, upondelinquency, impose social sanctions on the applicant. For example, a lettercarrier named Ed Stephens obtained two endorsers who were fellow lettercarriers (McBlair, 1913, p. 14). These possible social sanctions, while not with-out cost to a borrower, would only increase the likelihood of repayment.
2.2 The Place of Morris Plan Lending in ProvidingConsumer Credit
We have observed that Morris Plan lending was one of several types of lendinginstitutions for the provision of unsecured consumer credit that were presentaround 1910. Loan sharks were a major source of consumer credit. While loansharks would accept any security they could get for a loan, they would make
The Role of Morris Plan Lending Institutions in Expanding 131
unsecured loans as well for people who had little or no security (Moulton 1930,
p. 681; Clark 1933, p. 175). Credit unions were emerging as a possible alter-native to Morris Plan lending. Robinson and Nugent (1935) observed that ‘‘[a]tthe close of the year 1910, the credit union and Morris Plan of IndustrialBanking were little more than potential forces’’ (p. 96). While credit unionsalso grew between 1910 and 1930, the Morris Plan emerged as the largestprovider of consumer credit. We will analyze all three lending institutions inlight of the theoretical literature regarding micro-credit institutions.4
Our comparison of the Morris Plan lending structure with credit unionsand loan sharks is informed, in part, by the adverse selection analyses ofGhatak (1999) and Van Tassel (1999). We recall that they explained thesuccess of group lending in terms of a trade- off between joint liability andinterest rates charged, with lenders separating high-type individuals from low-type individuals by offering contracts of differing joint liability and interestrates. They modeled joint liability as the cost of having to repay all or aportion of another person’s loan. We use their basic insight regarding the jointliability-interest rate trade-off, but expand the costs of joint liability to includeall costs of such a contract. Those costs may include social sanctions and anypecuniary losses arising from nonpayment of a loan. Inclusion of these as the
‘‘costs of joint liability’’ makes sense because they may differ across contrac-tual forms, and should affect an individual’s decision to apply for a loanunder a given institutional form.5
The joint liability-interest rate dichotomy provides a means of comparingthese three lending structures.6 Because joint liability is a critical instrument inthe contract structure, we analyze the institutions in terms of the joint liabilityimposed under each. This discussion under the loan-shark contract is brief;there was no joint liability. So the core of our discussion focuses on the relativejoint liability of credit unions and the Morris Plan lending structure. Wesubsume the discussion of the Morris Plan lending structure within the discus-sion of credit unions.
Guinnane (1994, p. 214) has noted that two groups generally may exist undercredit-group lending. The first group consists of a borrower and cosigners,while the second group consists of the whole credit union. The extent andcosts of joint liability that arise under each group differs. For the first group,the costs of joint liability to a borrower arise from economic loss and socialsanctions subsequent to loan default. In the context of consumer credit, a
4 Robinson and Nugent (1935, p. 156) observed that no commercial banks entered the fieldcovered by the Morris Plan until 1924.5 We do not discuss the cost of lost access to future credit because it exists in both cases.6 Van Tassel (1999, pp. 17–18) found that if lenders were permitted not to offer a loan if itgenerated no profit, an equilibrium could arise in which different lenders specialized indifferent types of lending. This result might explain the apparent specialization of thesethree types of lenders.
132 D. Mushinski, R. J. Phillips
borrower without collateral would incur no direct economic loss, but wouldexpect costs to arise from social sanctions imposed by cosigners.
Several costs of joint liability arise from membership in the second, larger,group: the credit union. In becoming a credit union member, an individualexposed her stock interests to loss, and her rights to dividends to reduction orloss if the individual or a credit unionmember failed to repay her loan.7 Becausecredit unions were composed of individuals closely associated in their dailylives, a group member who defaulted on a loan could become the object ofsocial sanctions by people with whom she worked every day. Further, defaulton a loan affected the overall health of the credit union. Overall, joint liabilitywas broader in that one’s liability extended to a larger group of people. On theother hand, the impact of an individual member of any given default was less.
In examining the relative costs of joint liability arising from credit unionloans and the Morris Plan structure, we argue that the costs of joint liabilitywere greater under credit unions as compared to Morris Plan lending. We noteat the outset that not all credit union loans required cosigners. In 1933, theCredit Union Bureau estimated that 50 percent of all of its loans required nocosigners, while 30 percent of its secured loans required cosigners (Clark, 1933,p. 96). Cosigner contracts required two cosigners (Clark, 1933, p. 95). In light ofthe fact that not all credit union loans involved cosigners, a discussion of therelative strength of joint-liability lending under both credit unions and theMorris Plan must analyze credit union loans with and without cosigners. Inthe case of credit union loans with cosigners, joint liability was clearly strongerbecause it included the type of joint liability arising under Morris Plan lendingplus the broader form of joint liability arising from credit union membership.
We argue that the costs of joint liability arising from credit union loans withno cosigners would be higher than those under Morris Plan loans. We havenoted that the economic loss to a Morris Plan borrower from default was,effectively, zero. For credit unions, default entailed losing one’s share(s). Thecredit union member also exposed herself to loss in the event of default of othercredit union members. That loss was not present in Morris Plan lending. Forboth lending structures, default prompted social sanctions. In the Morris Plancase, the sanctions came from the cosigners, with whom the borrower may ormay not interact daily. In the credit union case with no cosigners, the sanctionscame potentially from all its members, with whom the borrower might interactevery day. The power of the sanctions from one person probably varied. Thesocial sanctions from one credit union member because of default would not beas powerful as those from a cosigner. Of course, the aggregate social sanctionsmight be larger in the credit union case compared with the cosigner case,because more people would be affected by a default.
7 Dividends were important. Froman (1935, p. 294) notes that dividend rates were typically7 percent before 1930. We also note that because credit unions were corporations, membershad limited liability for the obligations of the credit union.
The Role of Morris Plan Lending Institutions in Expanding 133

We now review empirical data in light of the foregoing theoretical analysis of
the Morris Plan lending structure and the comparative analysis of the three
lending institutions. We first consider the borrower’s interest rates, and the
costs of the loan. The joint-liability analyses of Ghatak (1999) and Van Tassel
(1999) imply that the lender’s interest rates should be highest for loan sharks
and lowest for credit unions. Table 2 identifies average costs to a borrower on
loans made by these three types of lenders obtained from Moulton (1930). The
average cost measures seek to make the costs of the different lending structures
comparable by accounting not only for differences in interest rates charged but
also any deductions from the loan amount taken at the time of borrowing and
differences in the timing of payments. We were only able to obtain loan shark
cost measures for wage assignments and chattel mortgage loans. We report
costs for wage assignments. Since unsecured loans would have the greatest risk
among all of the loans made by loan sharks, the reported costs are likely lower
than the actual rates for unsecured loans. The borrower costs reported in Table 2
comport with theoretical predictions. Loan sharks have, by far, the highest
costs. Morris Plan lending is in the middle, and credit unions have the lowest
interest costs.8
Our theoretical discussion has implications for the expected typical loan term
under these various lending structures. In analyzing credit cooperatives in
Germany, Guinnane (2001) observed that we might expect credit cooperatives
to provide smaller loans to members with whom they were more familiar,
because the fixed costs of loan review would be lower for such members. In
the present context, we would expect credit unions to have better information
about borrowers than Morris Plan lenders because of credit unions’ greater
familiarity with a loan applicant. Thus, we might expect credit unions to
provide smaller loans than the Morris Plan banks. In his analysis of consumer
credit lenders, Clark observed that ‘‘[m]ost of the loans made by credit unions
average much lower in amount than those made by the industrial banks ....’’
(Clark 1933, p. 96) He noted that the average loan in the states with credit
Table 2 Comparison of contract terms of three lenders
Institution Loan Cost to Borrowera(%) Loan Amountb(Dollars)
Loan Shark 240–480
Morris Plan 17–35 225
Credit Unions 37086 50–125a Source:Moulton (1930, p. 691). See also: Clark (1933, pp. 119, 128–129) for similar numbers.b Source: Clark (1933, pp. 72 and 97).
8 See also: Froman (1935, pp. 294–295) for an analysis of the interest rates charged by 1,010credit unions in 1927. Neifeld (1931, 325) contains similar costs to borrowers.
134 D. Mushinski, R. J. Phillips
unions was, at that time, $50–125, while the average small loan for Morris Plan
banks was $225. (Clark 1933, pp. 72 and 97).9
Moving away from a comparison of Morris Plan lending and credit unions,
some evidence indicates that the Morris Plan lending structure alleviated informa-
tional asymmetries. If we expect the presence of cosigners to alleviate informational
asymmetries and lower the costs of loan review, we might expect smaller loan
amounts for cosigner notes as compared to unsecured, single-name notes. Data
fromeightMorris Plan banks in Indiana between 1936 and 1938 that provided both
types of loans indicated that cosigner loans were, on average, smaller than unse-
cured loans (Saulnier 1940, p. 86). In 1937, for example, the average cosigner loan
was $172, and the average unsecured loan was $249. Data of a large Morris Plan
bank for the 1936–1939 period also supported these findings (Saulnier 1940, p. 87).
2.3 Why the Morris Plan Lending Structure GrewFaster than Credit Unions
Figure 3 indicates that the Morris Plan grew at a substantially faster rate than
credit unions during this period. Of course, the Morris Plan structure faded
away as less costly loans became available, but it’s interesting to ask why the
Morris Plan lending structure prevailed over credit unions at one time.A discussion of why the Morris Plan structure prevailed should start with an
observation made when the Morris Plan first appeared and which is made in
current discussions of microcredit in the United States. Americans are, gener-
ally, individualists. Peter Herzog (1928) observed that ‘‘such a plan [the coop-
erative principle] is not fitted for application to such a degree of success in
America [as compared to Europe] ... Here we find the idea of cooperation to be
a relatively new thing. The idea of individual independence ... continues to be
the predominating feature of American thought’’ (p. 16). Ghatak andGuinnane
(1999), observed, with regard to transplanting the Grameen Bank credit group
structure to the United States, that ‘‘people in Bangladesh derive more of their
identity frommembership in groups such as the family than do Americans, who
very much express individualism.’’10 This characteristic of Americans may
explain why the Morris Plan, which evolved organically in the United States
9 Saulnier (1940) noted that limited evidence was available regarding loan size. He presentedanecdotal evidence regarding loan size for specific Morris Plan companies (pp. 83–90). Hisreported numbers are consistent with those ofClark.Davis (1914) observed that industrial banks‘‘[i]n general ... are unable to loan money profitably in amounts smaller than $50 ....’’ (p. 6)10 Of course, this view of Americans is a generalization. An exception to this perception ofAmericans may be Native American reservations in the United States. Pickering andMushinski (2001) observed that ties among individuals in traditional kinship groups wereprevalent especially on the Pine Ridge Indian Reservation.
The Role of Morris Plan Lending Institutions in Expanding 135
in response to a perceived need, grew faster than an institutional transplant thatarose under different circumstances.
American individualism affects the efficacy of lending structures in alleviat-ing informational asymmetries and transaction costs. Individualism implies,generally, that a given person will have less information about her neighborsand co-workers. Less information about other people makes joint liabilitycostlier for an individual. Greater costs of joint liability will cause people tochoose a lending structure with lower levels of joint liability. Thus, we mightexpect people to choose, when possible, the Morris Plan lending structure overcredit unions.11 The seeds for the demise of the Morris Plan lending structurelay also in the individualism of Americans. Once the consumer credit marketmatured, and lending contracts arose with no joint liability, or less than theMorris Plan, we would expect people to choose the contract with less jointliability. As noted earlier, the Morris Plan lending structure faded away afterthe second world war, prompted by the growth of consumer lending by com-mercial banks, installment credit, and credit cards.12
Laws in the United States regarding credit unions also may have had animpact on the success of credit unions in the United States. State laws limitedcredit unions to a defined membership, such as all the employees in a firm or allof the members of some organization. Under these circumstances, an individualin need of consumer credit would be less likely to obtain a loan from a creditunion. Indeed, any one who was not a member of a group that had formed acredit union could not obtain a credit union loan. American individualism mayhave been an impediment to the initial formation of credit unions, and it’spossible that the existing laws regarding credit unions reflected the individual-ism of Americans—with little experience in cooperation, the drafters of thelegislation could not appreciate the subtleties of cooperative action.
3 Conclusion
The emergence of Morris Plan banks in the early twentieth century is anexample of an institutional structure appearing organically and through theprivate sector to satisfy a consumer need. When analyzed in light of the recent
11 We must recognize that some loan shark contracts had no joint liability. That people chosethe Morris Plan over loan sharks is a testament to the severity of the terms of the loan sharkcontract.12 Pickering andMushinski (2001) found evidence of a similar movement away from a costliercredit structure on the Pine Ridge Indian Reservation. They noted that after the federalgovernment mandated direct deposit of federal funds into bank accounts, some groupmembers with such direct deposits obtained bank loans for their microenterprises ratherthan credit-group loans. The banks loans, supported by direct deposits as security, imposedfewer costs on borrowers because, for example, individuals were not exposed to possible socialsanctions and or attended regular meetings.
136 D. Mushinski, R. J. Phillips
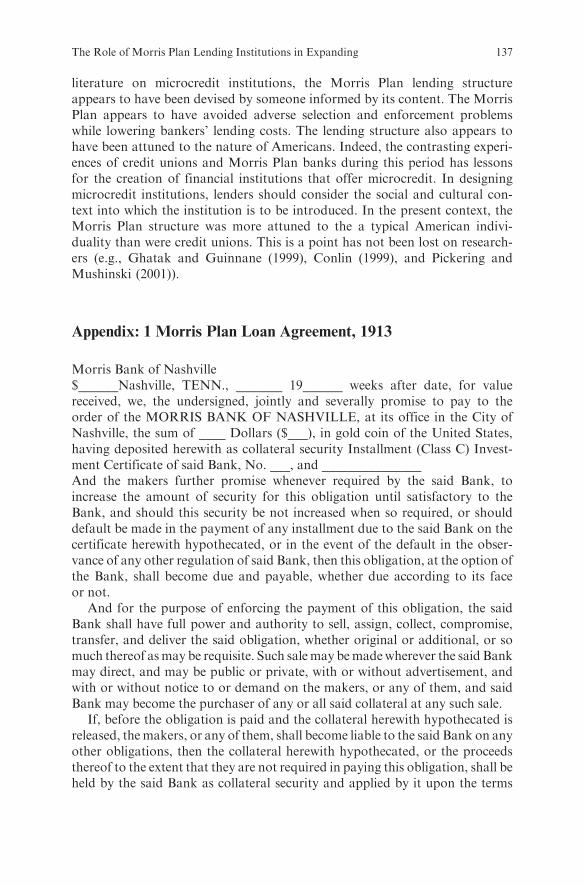
literature on microcredit institutions, the Morris Plan lending structureappears to have been devised by someone informed by its content. The MorrisPlan appears to have avoided adverse selection and enforcement problemswhile lowering bankers’ lending costs. The lending structure also appears tohave been attuned to the nature of Americans. Indeed, the contrasting experi-ences of credit unions and Morris Plan banks during this period has lessonsfor the creation of financial institutions that offer microcredit. In designingmicrocredit institutions, lenders should consider the social and cultural con-text into which the institution is to be introduced. In the present context, theMorris Plan structure was more attuned to the a typical American indivi-duality than were credit unions. This is a point has not been lost on research-ers (e.g., Ghatak and Guinnane (1999), Conlin (1999), and Pickering andMushinski (2001)).
Appendix: 1 Morris Plan Loan Agreement, 1913
Morris Bank of Nashville$______Nashville, TENN., _______ 19______ weeks after date, for valuereceived, we, the undersigned, jointly and severally promise to pay to theorder of the MORRIS BANK OF NASHVILLE, at its office in the City ofNashville, the sum of ____ Dollars ($___), in gold coin of the United States,having deposited herewith as collateral security Installment (Class C) Invest-ment Certificate of said Bank, No. ___, and _______________And the makers further promise whenever required by the said Bank, toincrease the amount of security for this obligation until satisfactory to theBank, and should this security be not increased when so required, or shoulddefault be made in the payment of any installment due to the said Bank on thecertificate herewith hypothecated, or in the event of the default in the obser-vance of any other regulation of said Bank, then this obligation, at the option ofthe Bank, shall become due and payable, whether due according to its faceor not.
And for the purpose of enforcing the payment of this obligation, the saidBank shall have full power and authority to sell, assign, collect, compromise,transfer, and deliver the said obligation, whether original or additional, or somuch thereof asmay be requisite. Such salemay bemadewherever the said Bankmay direct, and may be public or private, with or without advertisement, andwith or without notice to or demand on the makers, or any of them, and saidBank may become the purchaser of any or all said collateral at any such sale.
If, before the obligation is paid and the collateral herewith hypothecated isreleased, themakers, or any of them, shall become liable to the said Bank on anyother obligations, then the collateral herewith hypothecated, or the proceedsthereof to the extent that they are not required in paying this obligation, shall beheld by the said Bank as collateral security and applied by it upon the terms
The Role of Morris Plan Lending Institutions in Expanding 137

herein set forth on such other obligations of the makers as the Bank may elect;
and the makers, and each of them, do hereby appoint the President or the
Attorney of this Bank their true and lawful attorney in fact to assign or transfer
any or all of the above mentioned securities substitutes therefor.The makers hereby constitute and appoint the Attorney of this Bank, with
the power of substitution, their true and lawful attorney in fact for them and in
their name, place and stead to acknowledge service of any and all legal process
in any action or suit brought for the collection of this obligation, and to
acknowledge and confess judgment upon such obligation, including a reason-
able fee for the services of such attorney, hereby ratifying and confirming the
acts of said attorney in fact, as full as if done by them in person.If at the maturity of this note all installment payments and fines, if any, for
the period shall have been paid on the Installment (Class C) Investment Certi-
ficates hypothecated herewith, then the maker hereof who hypothecated the
same may surrender to the Bank the said certificate and with the cash received
therefrom discharge the obligation provided notice of such intention be given to
the Bank within ten days before the maturity of this note.It is understood and agreed, however, that the Bank shall not be compelled to
resort first to the collateral hypothecated for the security of this obligation, but
may at its election require said obligation to be paid by any maker or makers
hereon, and to this agreement saidmaker ormakers hereby specifically give their
assent, and upon the payment of this obligation by the said makers, or any of
them, this note, together with the collateral aforesaid, shall be transferred to the
maker or makers who pay this note without recourse against the Bank.And each of us, whether principal, surety, guarantor, or other party hereto,
hereby severally waives any or all benefit or relief from any exemption laws of
any State now in force or hereafter to be passed as against this debt or any
renewal thereof; and each further waives demand protest and notice of demand,
protest and nonpayment.
SIGNATURES: ADDRESSES:
__________________________________________________________________
__________________________________________________________________
__________________________________________________________________
References
Armendariz de Aghion, Beatriz (1999). ‘‘On the design of a credit agreement with peermonitoring,’’ Journal of Development Economics 60, 79–104.
Banerjee, Abhijit V., Timothy Besley, and Timothy W. Guinnane (1994). ‘‘Thy Neighbor’sKeeper: The Design of A Credit Cooperative With Theory and a Test,’’ Quarterly Journalof Economics, 109, 491–515.
138 D. Mushinski, R. J. Phillips

Besley, Timothy and Stephen Coate (1995). ‘‘Group lending, repayment incentives and socialcollateral,’’ Journal of Development Economics, 46, 1–18.
Caskey, John (1994). Fringe Banking: Check-Cashing Outlets, Pawnshops, and the Poor.New York: Russell Sage Foundation.
Clark, Evans (1933). Financing the Consumer. New York and London: Harper and BrothersPublishers.
Conlin, Michael (1999). ‘‘Peer group microlending programs in Canada and the UnitedStates,’’ Journal of Development Economics, 60, 249–269.
Ergungor, Emre and Thomson B. James (2006). ‘‘Industrial Loan Companies.’’ EconomicCommentary, (October), 1–3.
Froman, Lewis A. (1935). ‘‘Credit Unions.’’ Journal of Business of the University of Chicago,8(3), 284–296.
Ghatak, Maitreesh (1999). ‘‘Group lending, local information and peer selection,’’ Journal ofDevelopment Economics, 60, 27–50.
Ghatak, Maitreesh and Timothy W. Guinnane (1999). ‘‘The economics of lending with jointliability: theory and practice.’’ Journal of Development Economics, 60, 195–228.
Grant, James (1992). Money of the Mind: Borrowing and Lending in America from the CivilWar to Michael Milken. New York: Farrar Straus Giroux.
Guinnane, Timothy W. (2001). ‘‘Cooperatives as Information Machines: German RuralCredit Cooperatives, 1883–1914,’’ Journal of Economic History.
Guinnane, TimothyW. (1994). ‘‘A Failed Institutional Transplant: Raiffeisen’s Credit Coop-eratives in Ireland, 1894–1914,’’ Explorations in Economic History 31, 38–61.
Herzog, Peter W. (1928). The Morris Plan of Industrial Banking. A. W. Shaw Company:Chicago.
Kuehner-Hebert, Katie (2000) ‘‘California Broadens Industrial Banks’ Powers,’’ AmericanBanker, 165(226), November 27, 1.
McBlair, Robert (1913). The Morris Plan of Industrial Banking. Fidelity Corporation ofAmerica.
Moulton, Harold G. (1930).The Financial Organization of Society.TheUniversity of ChicagoPress: Chicago.
Neifeld, M.R. (1931). ‘‘Credit Unions in the United States.’’ Journal of Business of theUniversity of Chicago, 4(4), 320–345.
Pickering, Kathleen and David Mushinski (2001). ‘‘Cultural Aspects of Credit Institutions:Transplanting the Grameen Bank Credit Group Structure to the Pine Ridge IndianReservation,’’ Journal of Economics Issues.
Robinson, Louis N. and Rolf Nugent (1935). Regulation of the Small Loan Business.New York: Russell Sage Foundation.
Saulnier, Raymond J. (1940). Industrial Banking Companies and Their Credit Practices.New York: National Bureau of Economic Research.
Stiglitz, Joseph E. (1990). ‘‘Peer Monitoring and Credit Markets,’’ TheWorld Bank EconomicReview, 4, 351–366.
Van Tassel, Eric (1999). ‘‘Group Lending Under Asymmetric Information,’’ Journal ofDevelopment Economics, 60, 3–25.
Welch, Randy. (1987). ‘‘Insurance FundWoes Spur Run in Colorado: Crisis Seen Worseningat Tiny Industrial Banks,’’ American Banker, November 16, 9.
West, Mindy. (2004). ‘‘The FDIC’s Supervision of Industrial Loan Companies: A HistoricalPerspective,’’ Federal Deposit Insurance Corporation, Supervisory Insights (Summer),5–13.
The Role of Morris Plan Lending Institutions in Expanding 139


Policies to Expand Minority Entrepreneurship:
Closing Comments
Michael S. Barr
1 Introduction
This has been a productive conversation. In my closing comments, I want toshift our focus somewhat, from entrepreneurship in low-income communities tominority entrepreneurship generally. I want to do so because many minorityentrepreneurs are connected to or hire from low-income communities, andbecause minority entrepreneurs face critical barriers even when they attemptto create and grow firms outside of distressed communities. In this comment, Iwant to highlight key barriers and suggest five steps for Congress, the bankingregulators, and business leaders that may help the United States benefit morefully from the talents of minority entrepreneurs.
2 Minority Entrepreneurship
2.1 Trends in Minority Entrepreneurship
Despite significant gains in minority entrepreneurship over the past decade,African-American-owned firms and Hispanic-owned firms are underrepre-sented relative to their proportion of the U.S. population. According to themost recent data, in 2002 there were more than four million minority-ownedfirms, employing nearly five million people, with more than $700 million in reven-ues.1 Minority-owned firms constituted more than 17 percent of all U.S. firms,
M. S. BarrUniversity of Michigan Law School and The Brookings Institution.Delivered at the Conference on Entrepreneurship in Low- and Moderate-IncomeCommunities, November 3–4, 2005, co-sponsored by the Kauffman Foundation and theFederal Reserve Bank of Kansas [email protected]
1 U.S. Census Bureau, 2002 Economic Census, Survey of Business Owners (SBO).
G. Yago et al. (eds), Entrepreneurship in Emerging Domestic Markets.� Springer 2008
141
employed 4 percent of U.S. workers, and earned 3 percent of business reven-
ues.2 African-American-owned firms constituted 5 percent of all firms; Hispa-
nics, 7 percent; and Asian Americans nearly 5 percent.3 African Americans and
Hispanics each constituted more than 12 percent of the population, and Asian
Americans, 3.6 percent.4 In 2002, African-American-owned businesses had $93
billion in revenues; Hispanic firms had $226 billion in revenues; and Asian-
American-owned firms had $343 billion in revenues. Three-quarters of minor-
ity-owned firms have no paid employees. African-American- and Hispanic-
owned firms overwhelmingly have no paid employees.5
From 1997–2002, minority-owned firms grew at a much faster rate than U.S.
firms as a whole. The number of U.S. firms grew 10 percent, and receipts grew
22 percent over the period. At the same time, Hispanic-owned firms grew
31 percent in number, and 22 percent in receipts; African-American-owned
firms grew 45 percent in number, and 30 percent in receipts; Asian-American-
owned firms grew 24 percent in number, but only 13 percent in receipts.6 Almost
all of the growth occurred in firms with no paid employees; Hispanic firms with
paid employees actually declined in number.Despite overall growth for minority-owned firms, however, minority-owned
firms failed at a higher rate than other firms. Minority-owned firms with
employees in 1997 ‘‘had lower survival rates than non-minority-owned
employer establishments’’ in the four years following. The survival rate for
non-minority firms was 72.6 percent; 61 percent for African-American-owned
firms; 68.6 percent forHispanic owned firms; and 72.1 percent (close to the non-
minority average) for Asian-American-owned firms.7
Minority entrepreneurship is growing, but still lags far behind the rates for
whites. There likely are myriad reasons for these differences. Broader societal
factors that influence minority entry and success in business, such as the sig-
nificant gap in wealth between minority households and white households,8 and
the effects of our educational system, are far beyond the scope of this comment.
2 Ibid.3 Ibid.4 See U.S. Census Bureau, http://quickfacts.census.gov/qfd/states/00000.html.5 U.S. Census Bureau, 2002 SBO, supra.6 Ibid.7 Ibid.8 The median African-American household has about six to seven times less wealth than themedian white household: $19,000 compared to $120,900. Ana M. Aizcorbe et al., RecentChanges in U.S. Family Finances: Evidence from the 1998 and 2001 Survey of ConsumerFinances, 89 FED. RES. BULL. 1, 7–8 (2003). ‘‘The net worth of black and Hispanic collegegraduates is similar to the net worth of white high school graduates, and the net worth of blackandHispanic high school graduates is similar to the net worth of white high school dropouts.’’John Karl Scholz and Kara Levine, ‘‘U.S. Black-White Wealth Inequality: A Survey,’’ 4(2003), http://www.ssc.wisc.edu/�scholz/Research/Wealth_Survey_v5.pdf.
142 M. S. Barr
But the next section describes financial andmarket barriers that affectminorities
who pursue entrepreneurial endeavors.
2.2 Barriers to Minority Entrepreneurship
Minority entrepreneurs, like other entrepreneurs, need access to credit and
equity to create and grow their businesses. They need access to business rela-
tionships that invite new opportunities. They need access to financial, technical,
and managerial talent that enable businesses to thrive. In these areas, minority
entrepreneurs may face significant barriers.Small businesses in general have a harder time getting access to credit than
larger firms in part because it is more difficult for them to demonstrate
creditworthiness. Despite gains over the past decade in financial innovation
and technology that make it possible for large banks to generate credit scores
for small-business loans and sell government-guaranteed, real-estate secured,
and other small business loans on secondary markets,9 small-business bor-
rowers still rely disproportionately on a relatively small number of local
lenders. They can provide credit based on judgment, relationships, and local
knowledge.10 Relationship lending is critical for small firms.11 For minority
firms, evidence suggests that this sometimes presents significant barriers to
accessing credit.A number of studies have determined that minority-owned small businesses
have a more difficult time getting access to credit than other businesses even
after controlling for a wide variety of factors related to creditworthiness.12 For
example, one study found that African-American business owners receive
smaller bank loans than similarly situated whites after controlling for net
worth, education, age, and other factors.13 In the study, smaller loan size was
9 See, e.g., Zoltan Acs, The Development and Expansion of Secondary Markets for SmallBusiness Loans, in J. Blanton et al., eds., ‘‘Business Access to Capital and Credit,’’ a FederalReserve System Research Conference, 8–9 March 8–9 1999.10 See, e.g., Arnoud W.A. Boot, Relationship Banking: What do we Know? 9 J. of Fin.Intermediation 7, 9–12 (2000).11 See, e.g., BrianUzzi and JamesGillespie, ‘‘What Small Firms get Capital and atWhat Cost:Notes on the Role of Social Capital and BankingNetworks,’’ inBusiness Access to Capital andCredit, supra.12 See Michael S. Barr, et al., ‘‘The Community Reinvestment Act: Its Impact on Lending inLow-Income Communities in theUnited States,’’ in E.Mayo and C. Guene, eds., Banking andSocial Cohesion (2001).13 Timothy Bates, ‘‘Commercial Bank Financing of White- and Black-Owned Small BusinessStartups’’, 31Quarterly Review of Economics & Business 64 (1991); Timothy Bates, ‘‘UnequalAccess: Financial Institution Lending to Black- and White-Owned Small Business Startups’’,19Journal of Urban Affairs 487 (1997).
Policies to Expand Minority Entrepreneurship 143
found to be an important determinative of higher failure rates for African-
American-owned firms.14 A follow-up study found that, all other things being
equal, African-Americans received only $0.92 worth of additional credit for
every additional dollar of equity they put into their businesses, while white
borrowers received $1.17.15 White borrowers were able to leverage their educa-
tion and experience into better loans, while black applicants with similar
educational backgrounds and experience were not.16
Another study found that African-American-owned firms, controlling for
firm creditworthiness, firm size, age and business location, industry type, and
education of owners, were about 25 percent more likely to be denied a loan than
white-owned businesses.17 In addition, African-American firms paid more in
interest, even after accounting for business credit histories.18 Moreover, Afri-
can-American-owned firms and Hispanic-owned firms were much more likely
to report not applying for a loan for fear of rejection, even after controlling for
firm creditworthiness.19 Controlling for a wide range of factors relating to the
risk of borrowers and the market structure of the banking sector, another study
found that African-American-owned firms and Hispanic-owned firms were
one-third more likely to be turned down for business loans than their similarly
situated white counterparts.20 The study also found that, all else being equal,
Hispanic firms (but not African-American firms) paid higher interest rates than
white borrowers as a function of market concentration.21 African-American-
owned businesses, white-owned businesses, and Hispanic-owned businesses
had similar demand for credit.22
A final study adds further controls for the economic health of local commu-
nities.23 In this study, African-American-owned firms again were found to have
lower approval rates than white firms, but the differences were smaller than in
other studies. The study found no statistically different disparities between
Hispanic-owned and white-owned firms.24 As their authors are aware, each
14 Ibid.15 Bates, Unequal Access supra.16 Ibid.17 David Blanchflower, Phillip Levine, and David Zimmerman, ‘‘Discrimination in the SmallBusiness Credit Market,’’ NBER Working Paper No. 6840, December 1998.18 Ibid.19 Ibid.20 Ken Cavalluzzo and Linda Cavalluzzo, Market Structure and Discrimination: The Case ofSmall Business, 30 Journal of Money, Credit, and Banking 771 (1998).21 Ibid.22 Ibid.23 Raphael Bostic and Patrick Lampani, ‘‘Racial Differences in Patterns of Small BusinessFinance: The Importance of Local Geography,’’ Business Access to Capital and Credit, supra.24 Ibid.
144 M. S. Barr
study suffers from limitations of available data,25 and more research is war-
ranted to further our understanding of minority firms’ access to credit.In addition to credit, businesses need equity, both for business formation and
expansion. Equity provides the patient capital firms need in the early stages of
development before they can generate sufficient cash flow, and gives firms
leverage to access credit. Equity is also critical to weathering downturns in theeconomy. And such capital is essential to expand businesses rapidly to capture
gains from innovation and new market opportunities. The U.S. venture capital
industry is the envy of the world for its ability to translate innovative ideas from
new firms into commercial reality.26
Yet venture capital, critical for the rapid growth of small firms, is likely to beharder to attract for minority entrepreneurs than credit. Even during the hey-
day of venture capital’s growth in the late 1990s, venture capital funding was
highly concentrated in a few sectors and geographic regions.27 High technology,
Internet, biomedical, and related firms focused in a handful of geographic areas
attracted the bulk of venture capital funding. Most small businesses, including
minority-owned firms, rely, instead, on banks, finance companies, credit cards,and their family and friends for financing. In that regard, the significant wealth
gap affects comes into play in reducing the ability of many minority firms to
start new businesses with the equity they need. Minority-owned firms are not a
core focus of most venture capital firms.Yet whenminority firms are able to access venture capital, their performance
has proved strong.28 Venture capital firms focused on minority-owned busi-
nesses had 20 percent returns in the 1990s, on a par with private equity funds
generally.29 Two dozen minority-focused venture capital firms had raised a
total of more than $1.3 billion in equity by 2000, a peak year for venture capital.
The money came mostly from pension funds, but also from banks, insurancecompanies, and other sources.30 These funds have invested in a more diverse
range of sectors than the venture capital industry as a whole.31
Business relationships and expertise are just as critical to business formation
and growth as is access to capital.32 Business relationships contribute to new
25 See, e.g., Richard W. Lang, The Conference on Business Access to Capital and Credit: AnOverview, ** What’s this? >> Business Access to Capital and Credit, supra.26 See Ronald J. Gilson, Engineering a Venture Capital Market: Lessons from the AmericanExperience, 55 Stanford L. Rev. 1067 (2003).27 See generally, National Venture Capital Association at http://www.nvca.org.28 Timothy Bates & William Bradford, Minorities & Venture Capital: A New Wave inAmerican Business (Kauffman Foundation, 2003).29 Ibid.30 Ibid.31 Ibid.32 See U.S. Department of the Treasury, ‘‘BusinessLINC: Business-to-Business Relationshipsthat Increase the Economic Competitiveness of Firms’’ (1998).
Policies to Expand Minority Entrepreneurship 145
economic opportunities as well as to a firm’s reputation in the market. Businessrelationships provide opportunities for sharing business expertise, and formanagerial development.33 Minority entrepreneurs need connections to busi-ness networks that provide these benefits, but many minority entrepreneursoften find themselves outside such networks.
3 Policies to Expand Minority Entrepreneurship
These barriers to minority entrepreneurship may be amenable to change.Despite remaining problems, the growth of minority entrepreneurship and theexpansion of access to capital during the 1990s suggest that positive marketdevelopments for minority entrepreneurs can be catalyzed further by bothpolicy and concerted action by the private sector. This comment outlines fivekey steps that Congress, the banking regulators, and business leaders can taketo open up opportunities for minority entrepreneurs.
3.1 New Markets Tax Credit
In the bipartisan Community Renewal Tax Relief Act of 2000,34 Congressenacted a New Markets Tax Credit (NMTC) to spur new equity investmentsfor business growth. Private investment funds compete for allocations from theTreasury Department, authorizing the funds to issue as much as $15 billion ofequity on which investors may claim tax credits worth 39 percent of their invest-ment. The NMTC leaves investment decisions in the hands of market partici-pants. Investment funds that receive allocations raise private funds, mostly frompassive institutional investors, just as in the venture capital industry generally,and then invest or lend to businesses in low- and moderate-income communities.Unlike many federal programs, these communities are drawn broadly so thatlarge areas of the United States are eligible. Under a recent change, these invest-ment funds also may invest in minority-owned or other firms that otherwise lackadequate access to loans or equity investments, regardless of location.35
The NMTC draws on the strength of America’s venture capital and com-mercial real estate industries. Equity raised using theNMTC can spur growth ofminority businesses and should be expanded. Congress extend the NMTC foranother five years,36 and should provide greater flexibility to investment funds
33 Ibid.34 Pub. L. No. 106-554 (December 21, 2000).35 American Jobs Creation Act of 2004, Pub. L. No. 108-357, x221 ( October 22, 2004).36 See S. 1800 and H.R. 3957 (introduced September 29, 2005).
146 M. S. Barr

to offer deeper credit allocations to investors in order to broaden the range ofinvestment strategies these funds can profitably pursue.
3.2 Capital Access Programs
State-run capital access programs (CAPs) have a strong track record of expand-ing access to credit for small businesses.37 Under these programs, operated byabout 20 states, small businesses pay an insurance fee that goes into a loan lossreserve fund held at the originating bank; the insurance premium is matched bythe state CAP. The bank makes its own underwriting, pricing, and insurancedecisions. Since they were first launched in 1986, state CAPs have enabled morethan $1.5 billion in small-business loans to be made at low cost and low risk,reaching significant numbers of minority entrepreneurs.38 As one banker put it:‘‘CAP borrowers typically are emerging businesses lacking the kind of trackrecord they would normally need to establish eligibility for a conventional loan.Often they need working capital, but lack the necessary collateral, or theprincipals have insufficient personal assets. They are unlikely to be able toattract venture capital or private equity. But these businesses often are thebackbone of their communities. Supporting them is the right thing to do, anda CAP loan is often the right way to meet their needs.’’39
Despite the success of CAPs in supporting small-business growth, manystates are finding it difficult to maintain the programs in the face of severestate budget constraints. The federal government could bolster state-run CAPsby providing funding to states for initiating or increasing their programs, andreaching out to minority entrepreneurs. For example, if the federal governmentwere to provide a 2 percent match into state-funded loan loss reserves, a$1 billion federal government investment over the next five years would leverage$50 billion in bank loans to small businesses.
3.3 Data Collection for the Community Reinvestment Act
Under the Community Reinvestment Act (CRA), banks and thrifts are exam-ined and rated on their performance in providing loans, investments, and
37 See U.S. Department of the Treasury, ‘‘Capital Access Programs: A Summary of Nation-wide Performance’’ (2001).38 Ibid. at 16.39 Thomas Doherty, Make No Little Plans: How a Midwest Bank Uses a Capital AccessProgram to Help Small Businesses, Office of the Comptroller of the Currency, CommunityDevelopments, Winter 2003.
Policies to Expand Minority Entrepreneurship 147
services in their entire community.40 Bank regulators also take account of CRA
performance during merger reviews. It is likely that CRA has helped to increaselending to small businesses.41 One study found, for example, that CRAincreases the number of small businesses that can access credit by 4 percent to
6 percent.42 Moreover, the study determined that the increased lending to smallbusinesses induced by CRA provided benefits to the real economy in the formof increased payrolls and reduced bankruptcies without any evidence that suchlending either crowded out other financing available to small businesses or
adversely affected bank profitability or loan performance.43
Despite these and other gains from CRA, recent regulatory changes couldundermine progress.44 Under a banking agency joint rule, banks and thriftswith less than $1 billion in assets are considered ‘‘small’’ for purposes of CRAand exempt from small-business lending disclosure requirements and full-scope
CRA review. Even banks and thrifts that are part of mammoth holding com-panies would be considered small if the bank or thrift itself held less than $1billion in assets. Under current law, banks and thrifts are considered small if
they have assets of only $250 million or less, and are independent, or are part ofa holding company with less than $1 billion in bank and thrift assets. Drama-tically increasing the asset threshold, and considering institutions small even ifthey are affiliated with large holding companies are misguided policies.
Small businesses rely disproportionately on smaller banks for retail services
and lending in their local communities. Thus, it makes little sense to stopcollecting small-business data from these smaller banks, or evaluating institu-tions on their small-business lending and retail services. Even more problematicis the plan to ignore the asset size of the holding company in defining a bank as
‘‘small.’’ Holding companies provide scale economies and expertise to theirsubsidiaries in complying with bank regulations.
CRA small-business data collection should be enhanced by including infor-mation about loan applications that are denied, distinguishing better among thesizes and types of loans made (for example, small-business credit card accounts
compared with capital equipment loans), and providing more precise informa-tion about the geographic location where loan proceeds are used. And the newcommunity development test for intermediate-sized banks must take account
explicitly of small business lending.
40 See 12 U.S.C. x2901–2908.41 See Michael S. Barr, ‘‘Credit Where it Counts: The Community Reinvestment Act and ItsCritics,’’ 80 New York University Law Review 513 (2005); Jonathan Zinman, ‘‘The Efficacyand Efficiency of Credit Market Interventions: Evidence from the Community ReinvestmentAct’’ (Harvard Univ. Joint Ctr. For Housing Studies, Working Paper CRA02–2, 2002).42 See Zinman, supra, at 20.43 Ibid. at 3–4.44 See Michael S. Barr, Credit Where It Counts: Maintaining a Strong Community Reinvest-ment Act, Brookings Institution Metropolitan Program Research Brief, May 2005.
148 M. S. Barr
3.4 Fair Lending Disclosure
Under the Home Mortgage Disclosure Act, creditors are required to report on
the race, ethnicity, gender, and income of home mortgage borrowers and loanapplicants in order to advance the goal of equal opportunity in home mortgage
lending. There is evidence that such disclosures have contributed to increasedhome ownership opportunities for minority households over the past decade.45
By contrast, Federal Reserve Board regulations under the Equal CreditOpportunity Act (ECOA) bar creditors from even voluntarily recording the
race, ethnicity, and gender of small business and consumer borrowers and loanapplicants. This rule is an unwarranted restriction on the ability of lenders to
obtain the information they need to serve minority small-business borrowers.46
Banks that want to design programs to serve minority entrepreneurs cannot
track progress in their programs compared to other lending.The inability to measure whether new marketing or products are reaching
minority small businesses is a significant barrier to expanding minority access tobusiness credit. Moreover, the lack of available data on small business and
consumer lending undermines the ability of fair lending enforcement agenciesto monitor and enforce ECOA. The Federal Reserve Board has the authority to
alter their regulations to permit creditors to record such data, and twice has takenup the issue, but has declined to lift the prohibition.47 The board should finalize
the rule it proposed previously to permit creditors to keep track of such informa-tion as a means of expanding access to credit to minority entrepreneurs.48
3.5 Business-to-Business Partnerships
Business relationships between minority-owned small- and medium-sized busi-
nesses and larger firms can be mutually beneficial. Minority-owned firms maybe cut off from business opportunities because they lack connections to businessnetworks. Greater levels of engagement between executives of larger firms and
minority-owned businesses can increase opportunities for minority firms to
45 See Barr, Credit Where it Counts, supra.46 See Letter from U.S. Department of the Treasury, U.S. Department of Justice, U.S.Department of Housing and Urban Development, Office of the Comptroller of the Currency,Office of Thrift Supervision, U.S. Small Business Administration, Federal Trade Commis-sion, and Office of Federal Housing Enterprise Oversight, to Board of Governors of theFederal Reserve System, November 15,1999.47 See Board of Governors of the Federal Reserve System, Final rule, Equal Credit Oppor-tunity, 68 Fed. Reg. 13143, March 18, 2003.48 Board of Governors of the Federal Reserve System, Proposed rule, Equal Credit Oppor-tunity, 64 Fed. Reg. 44582, August 16, 1999.
Policies to Expand Minority Entrepreneurship 149
form partnerships and generate new business, and larger corporations canbenefit from a diversified supplier base, flexible production, and innovationsby smaller firms. Access to business opportunities and relationships canenhance business credibility and growth potential, thereby increasing minorityfirms’ access to both debt and equity for expansion.
The National Urban League, the Business Roundtable, and the KauffmanFoundation launched a partnership recently to open one-stop business advicecenters in a number of communities around the country. This effort builds onBusinessLINC, an initiative led by the Business Roundtable and launched byPresident Clinton and then Treasury Secretary Robert E. Rubin. It links Fortune500 and other large companies with smaller firms.49 These linkages providesmaller firms with business opportunities, advice, and technical assistance.These are not government programs, but private-sector-led, market-tested initia-tives to bring the experience of larger corporations to minority-owned firms,which are often cut off from business networks. BusinessLINC has establishedmore than 20 chapters. Cleveland’s has launched a $25 million venture fund withsupport from local corporate leaders, including Sandy Cutler, the chief executiveof Eaton Corporation. The most important factor in these programs is theengagement of the chief executives of major companies. As Ramani Ayer, chair-man andCEOof theHartfordFinancial ServicesGroup, has said, ‘‘This programis the right thing to do from a corporate responsibility standpoint. And frankly, itis the smart thing to do from a competitive standpoint. Shareholders clearlybenefit from our ability to partner with the brightest, most creative talent avail-able, which we might just miss without this type of outreach program.’’
4 Conclusion
Minority entrepreneurs are playing an increasingly important role in the UnitedStates, but may face important barriers. Access to capital, business expertise,and market opportunities are essential for entrepreneurs to succeed. Congressshould expand the New Markets Tax Credit and fund state-run Capital AccessPrograms. Banking regulators should maintain a strong Community Reinvest-ment Act and enhance fair lending disclosure. Business leaders should look tominority entrepreneurs for new partnerships that enhance shareholder valueand strengthen community. Targeted policy initiatives and the focused atten-tion of America’s business leaders can contribute to the growth of minorityentrepreneurship in the years ahead.
49 See Michael S. Barr, ‘‘Access to Financial Services in the 21st Century: Five Opportunitiesfor the Bush Administration and the 107th Congress,’’ 16 Notre Dame Journal of Law, Ethics& Public Policy 447, 455 (2002); BusinessLINC Report, supra.
150 M. S. Barr
Index
African-American-owned businesses,81, 105, 141–143
American individualism, 136Appalachian Regional Commission, 28–29Appalachian Regional Development Act, 28Area revitalization, 17Asian-American-owned business, 142
population of, 99Atlanta Loan and Savings Company, 126
Banking regulators, 150Bank loans, 75, 136, 143, 147
denied, 124Basic regional economic development
theories, 22–24Borrower costs, 134Brandow Company Inc, 30–31Bureau of Census, 104Bureau of Economic Analysis, 57, 59Bureau of Labor Statistics, 57, 59, 104Business
characteristics of, 79–81loans, 6, 54–56, 75–76, 143–144owners, characteristics of, 79ownership, 69, 71, 73–74specialization rate, 34
BusinessLINC, 150Business Roundtable, 150Business-to-business
efforts, 25partnerships, 149–150
Capital access by African-Americanentrepreneurs, 105
Capital access programs, 104, 147, 150Capital accumulation, 21Cluster formation, 26Coal mining, economies of, 28–29Colorado industrial banks, 121–122
Commercial banks, 52, 55, 122, 126–127, 136Community-basedorganizations (CBOs), 25–26Community Reinvestment Act (CRA), 74,
147–148, 150data collection for the, 147–148
CommunityRenewal TaxReliefAct, 146–147Competitive threats, 10Consumer Bankers Association, 126–128Consumer credit markets, 121, 136Consumer installment credit, 128Credit, democratization of, 123–128Credit-assessment skills, 41Credit cards, 128, 136, 145
banks, 55Credit-group lending, 132–135Credit-market frictions, 55, 57Credit rationing, 48–54, 55–57, 63, 122, 128Credit unions, 7, 121–124, 126–131, 132–137
bureau estimated, 133Cross-sectional variation in
entrepreneurship, 90–91Current population survey, 104
Demand-driven model, 23Demand theories, 23Depressed areas, 3–4, 9–15, 17
attempts to revitalize, 13employers, 11
Deregulation of the banking industry, 40Disadvantaged people, 5, 37Disinvestment program, 16Drug addiction treatment system, 38–39
Economically depressed communities, 9–10Economic base
industries, 16theory of regional development, 22–24
Economic development, recent theories of, 24Economic stagnation, 15
151
Economic underdevelopment, 10–13Educational attainment, 2–5, 32, 34, 61Employment rate percentage variable
(EMPR), 59–63Empowerment zones, 4, 14Enterprise-level training, 39–40Enterprise-zone incentives, 14, 16Entrepreneurial-friendly environments, 69–70Entrepreneurship, 1–8, 21–22, 24–27, 35–36,
69–74, 79–87, 90–95, 105databases and studies of, 79–87
terms used in, 115–117determinants of, 90driven business activities, 11economic impact of, 70–74importance of, 70–71individual-level aspects of, 26–27macro-level aspects of, 24–26measures, 81–87, 103–106obstacles to, 3policies, 22, 38–42regulatory stumbling blocks to, 87–89role of, 3–8, 21–22, 24, 42
Equal Credit Opportunity Act (ECOA), 149Ewing Marion Kauffman Foundation, 3, 71
See also Kauffman FoundationExport-based manufacturer, 16–19External loan guarantees, 51–54
Fair Lending Disclosure, 149Federal Deposit Insurance Corporation, 57Federal Reserve Bank of Kansas City,
3, 70–71, 103–104, 141Federal Reserve Board, 80, 149Fidelity Savings and Trust Company, 126Financial capital and educational
attainment, 27Firm creditworthiness, 144Fiscal capacity, 12, 14–15Fixed-effects class variable, 61–62Fortune 500 corporations, 17
Global entrepreneurship monitor, 24–26, 33Global supply chain, 17–18Governmental tax or regulatory policies, 87–88Grameen Bank, 122, 128–131, 135–136Group-formation process, 130
Hartford Financial Services Group, 150Herfindahl index (HERF), 58–59, 61–62Hispanic-owned businesses, 141–143, 144Home Mortgage Disclosure Act
(HMDA), 149
Homeownership, 96, 116Household income, 10, 91–92, 95, 101–102,
150Human Capital, 2–4, 8, 11, 24, 27, 32–33, 35,
40, 61, 83
Industrial Finance Corporation (IFC), 126Informal on-the-job training, 35Infrastructure funding, 13Innovation and economic growth, 21–22Installment credit, 136Investment Certificate, 126, 137–138
Job creation, process of, 71Job-referral systems, 25Joint liability, 7, 129, 133
KauffmanFoundation, 103–104, 105, 141, 150Index of Entrepreneurial Activity,
103–104See also Ewing Marion Kauffman
FoundationKnowledge
filter, 33production function, 27
Labor-cost disadvantages, 18–19Labor-force
improvement programs, 42participation, 29
Labor-market employment, 48, 63–64Labor utilization, effective level of, 48Legal form of organization, 116–117Lending relationships, 50–51Loan applicants, 123, 125, 130–131,
134–135, 149Loan bias, 101
measure of, 70, 76–79racial disparity of, 81
Loan guarantee program, 51–54, 56–57, 81See also SBA Loan guarantee programs
Loan monitoring, costs of, 130–131Loan repayment, enforcement of, 130–131Loan sharks, 122–124, 128, 131–132, 134, 136Local market employment rate, 54, 60, 63–64Local market per capita income, 60Low- and moderate-income communities
(LMI), 6, 75–76, 78–79, 81–87, 91,101, 104–105
entrepreneurial activity in, 21–22, 74–76loan activity in, 100–101
Low-income (LI) markets, 47–49, 55–57,63–64
152 Index

Management toolkit, 41Market-driven capitalist economy, 11Market-functioning mechanisms, 40–41Market variables, 6, 27, 56–63, 82–92, 104
deposits per capital, 59–60per capita income, 59
Metropolitan statistical area (MSA), 34, 48,57, 74–76, 116–117
Micro-credits, 7, 53, 122–123, 128, 132, 135,137
Microeconomic model, 103, 105Microenterprise, 27, 35, 41Minority business enterprises, 75, 141–143,
145–147, 149–150Minority entrepreneurship, 141
barriers to, 143policies to expand, 141, 146
Morris Plan banks, 7, 121–123, 126–129,134–137
analysis of, 128–131rise of, 123role of, 121
Morris Plan loans, 7, 128, 133
National Bureau of Economic Research(NBER), 57
National Federation of IndependentBusiness, 87
National Urban League, 150Natural disasters, loans to victims of, 54Newmarkets tax credit (NMTC), 146–147, 150Non-bank lenders, 52, 55Non-base
industries, 12–13, 16Nonprofit organizations, 7, 36, 38, 56Null hypothesis, 48, 57, 58–59, 63–64
Open Society Institute (OSI), 38–39Organization for Economic Cooperation
and Development (OECD), 28,31–32, 41–42
Ossified economy, 4, 31Out-migration of well-educated adults, 12
Panel study of entrepreneurial dynamics(PSED), 2
Per capita income in the local market,58–59, 61
Personal bankruptcy exemptions, 90Philanthropy, 25, 40, 42Post-World War II period, 128Progressive era in American history, 123–128Public-private partnerships, 38
Reconstruction Finance Corporation(RFC), 54
Regional cumulative underdevelopment,dynamics of, 10–13
Regional technology industries, 30–31Remedial loan program, 123Risk-sharing programs, 39Russell Sage Foundation, 123
School dropouts, 32Self-employed people, 1–2, 69, 71, 74, 103
characteristics of, 79–87Shift in industry dominance, 30Short-run cash flows, 12Silicon Valley, 15–16, 32Small and Medium-size enterprises (SMEs),
22–25, 28, 31–32, 35, 39, 40–41Small Business
Administration (SBA), 7–8, 47, 54,59, 71
borrowers, 53, 56–57, 143, 149credit card accounts, 148credit market, 49–50, 51–52credit scoring, 53customers, 51finances, survey of, 90guarantee programs, 5, 47, 49, 53–57, 60,
63–64loans, 49–50, 52, 54, 57, 83, 143problems and priorities, 6role for, 51Small Business Act, 54
Small Defense Plants Agency, 54Small-firm credit market, 48, 50–54, 63Social entrepreneurship, 5, 22, 35–38, 42
defining, 36Social impact theory, 37Social mobility, 40Soros Foundations Network, 39Structured training, 35Supply-and-demand model of the
economy, 22Supply-side theory of regional development,
23–24Survey of small business finances (SSBF), 90
Tax-cut policies, 14Tax-incentive programs, 14Tightening credit availability, 13T-test, 63
Unincorporated business owners, 90, 116–117Unreasonable government regulation, 6
Index 153

U.S. Census Bureau, 71, 75, 141Economic Census Data, 115
U.S. economyfeatures of the, 11functioning of the, 13
Variance inflation-factor (VIF), 61
Venture capital, 28, 80, 84, 145–147
firms, 145public venture programs, 40
Wage assignments, 90, 134White-collar employment, 4, 27–28White-owned firms, 144Worker-training strategy, 14
Zero-employee establishments, 100
154 Index


Related Documents