CllSfB 1 (21) 1 Xi1 1 (53) Date November 1994 STUDY REPORT NO. 54 (1993) REPORT ON RACKING RESISTANCE OF LONG SHEATHED TIMBER FRAMED WALLS WITH OPENINGS S.J. Thurston ISSN: 01 13-3675

Welcome message from author
This document is posted to help you gain knowledge. Please leave a comment to let me know what you think about it! Share it to your friends and learn new things together.
Transcript
CllSfB 1 (21) 1 Xi1 1 (53)
Date November 1994
STUDY REPORT NO. 54 (1993)
REPORT ON RACKING RESISTANCE OF LONG SHEATHED TIMBER
FRAMED WALLS WITH OPENINGS
S.J. Thurston
ISSN: 01 13-3675

PREFACE
This study forms the first phase of an investigation into the wind and earthquake racking resistance of timber framed New Zealand houses from roof to ground floor level. The second phase involves computer analytical simulation. The racking resistance of pile foundation systems is currently the subject of a separate study.
ACKNOWLEDGMENTS
The author acknowledges financial support for this project from the Building Research Levy and the Foundation for Research, Science and Technology from the Public Good Science Fund. The author wishes to thank the following manufacturers for providing material for this project: Carter Holt Harvey Timber Ltd., (Timber framing), Winstone Wallboards Ltd. (Gibraltar Board sheets), James Hardie and Co. Pty. Ltd. (Harditex sheets), Plywood Manufacturers Association (plywood sheets), and Altherm Aluminium Ltd for the glazed aluminium framed window.
NOTE
This report is intended for structural engineers, architects, designers, manufacturers and others researching earthquake and wind resistance on low rise buildings.
RACKING RESISTANCE OF LONG SHEATHED TIMBER FRAMED WALLS WITH OPENINGS
BRANZ Study Report SR 54 SJ . Thurston
REFERENCE
Thurston, S.J. 1994. Racking Resistance of Long Sheathed Timber Framed Walls With Openings. Building Research Association of New Zealand. Study Report SR 54., Judgeford, Wellington.
KEYWORDS Timber; Walls; Earthquake; Seismic; Wind; Racking; Cyclic; Tests; Experimental; Houses; Bracing.
ABSTRACT
Design codes provide guidance for estimating the distribution of lateral earthquake and wind forces to bracing walls in houses. The racking resistance of walls is often determined by summing the strength of relatively short panels between door and window openings. The strength of these short panels is found by tests in which the wall panel is either entirely (most countries) or partially (New Zealand) prevented from rocking as a rigid body. Australian standard tests are the exception, where no external forces are applied to prevent this rigid body niotion.
To investigate the above methodologies, 10 racking tests &ere conducted with five different long (up to 6.6 m) wall configurations, incorporating wall returns and typical openings, and using various combinations of sheathings. No external uplift restraints were used. Generally, only standard nailing between the bottom plate and the foundation beam provided wall uplift restraint. However, in a few instances light steel end straps were also used. Additional gravity load was imposed in only one instance. The measured strengths were compared to the summation of component panel strengths. The component panel behaviour was obtained using the theoretical response for panels with total uplift restraint (based on nail slip tests) and then the additional deformations due to predicted uplift (from BRANZ P21 tests where partial uplift restraint is applied) added. (Most wall bracing systems in New Zealand are tested and evaluated according to the BRANZ P21 test method).
For fully sheathed walls with large window (but no door) openings, experimental wall load versus deflection hysteretic curves could be fairly accurately (and conservatively) predicted if one assumed the component panels were hlly restrained against uplift. For walls with door openings the measured strengths were only about 70% of that predicted. The long walls were far stronger than would have been predicted from the Australian test method.
The measurements presented also include uplift at wall corners and opening edges (panel deflected shapes), slip between sheathing and frame and panel shear strains. A detailed literature survey is given and the results of small sample testing to determine nail load-slip characteristics presented.

CONTENTS Page
1.0 INTRODUCTfON .............................................................................................................. 1
2.0 LITERATURE REVIEW ................................................................................................... 3 2.1 Background: Factors Influencing Bracing Strength .............................................. 3
2.1.1 Panel Uplift Restraints ........................................................................... 3
2.1.2 Effect of Wall Openings ........................................................................ 4
2.1.3 Gravity Load .......................................................................................... 6
2.1.4 Wall Strength Enhancement Due to Lining on Second Side ................. 9
2.1.5 Test Regime ........................................................................................... 9 2.1.6 Other Factors .......................................................................................... 9
2.2. Literature Summary .............................................................................................. 9
.............................................................................. 2.2.1 Wall Racking Tests 10 ............................................................................ 2.2.2 Methods of Analysis 14
............................................................................... 2.2.3 Full House Testing 16
.............................................................................................................. 2.3 Summary 19
................................................................................. 3.0 DYNAMIC ANALYSIS MODELS 19 . ................................................................ 3.1 The LPM Model (Ewing et a1 1987) 19
3.2 The Stewart Model (Stewart et a1 . 1984) ............................................................. 23 ................................................... 3.3 The Cecotti Model (Cecotti and Vignoli 1991) 23
.................................................................................................. 3.4 The Dean Model 23
4.0 TEST PROGRAMME ...................................................................................................... 23 . . .............................................................................................................. 4.1 Ob~ectlve 23
4.2 Description of Test Specimens ............................................................................ 23 ............................................................................................................ 4.3 Test Setup 31
4.4 Test Procedures .................................................................................................... 34 4.5 Observations ........................................................................................................ 34
4.5.1 General Observations ........................................................................... 34 4.5.2 Wall W1 ............................................................................................... 34 4.5.3 Wall W2 ............................................................................................... 35 4.5.4 Wall W3 ............................................................................................... 36
4.5.5 Wall W4 .......................................... .................................................... 36 4.5.6 Wall W5 ................................................................................................ 36
............................................ 4.6 Results : ..................................................................... 36

4.6.1 Wall Load . Deflection Plots ............................................................... 36 ............................................................................... 4.6.1.1 Wall W1 36
................................ .............................................. 4.6.1.2 Wall W2 : 37 ............................................................................... 4.6.1.3 Wall W3 37
...................................................... ........................ 4.6.1.4 Wall W4 : 37 ............................................................................... 4.6.1.5 Wall W5 37
4.6.2 Influence of Installed Window ............................................................ 45
4.6.3 Sheathing Shear Forces ........................................................................ 45 4.6.3.1 Wall W1 ............................................................................... 45 4.6.3.2 Wall W2 ............................................................................... 46
............................................................................... 4.6.3.3 Wall W3 48
4.6.4 Stud Vertical Movement ...................................................................... 48 4.6.4.1 Wall W1 ............................................................................... 48 4.6.4.2 Wall W2 ........................................................................... 54
............................................................................... 4.6.4.3 Wall W3 54 4.6.4.4 Wall W4 ............................................................................ 54
............................................................................... 4.6.4.5 Wall W5 54 ..................................................... 4.6.5 Slip Between Sheathing and Frame 61
5.0 COMPARlSON OF EXPERIMENTAL RESULTS AND THEORETICAL .............................................................................................................. PREDICTIONS .63.
5.1 Wall WlLl .......................................................................................................... 65
5.2 Wall W1L2 .......................................................................................................... 65 5.3 Wall W1L3 ................................................................................................. i ........ 65
.......................................................................................................... 5.4 Wall W2Ll 65
5.6 Wall W3L1 ........................................................................................................... 66 5.7 Wall W3L2 .......................................................................................................... 66 5.8 Wall W3L3 .......................................................................................................... 66
5.9 Wall W4 ............................................................................................................... 66
5.10 Wall W5 ............................................................................................................. 66 5.1 1 Summary of Findings From Comparisons ........................................................ 66
6.0 CONCLUSIONS .............................................................................................................. 67
7.0 RECOMMENDATIONS ........... ...................................................................................... 68
8.0 FUTURE WORK .............................................................................................................. 69

I Appendix A. Tests of a Wall Where Sheet Bracing Stopped Short a ~f Top Plate .................. 75
.............................................................................. I Appendix B. Tests on Glued Only Panels 79
Appendix C. Nail Pull-out Tests ............................................................................................ 82
........... Appendix D. Derivation of Parent Curves For P21 Type Tests From Nail Slip Data 85
I ................................................................................. Appendix E. Proprietary Products Used 99
Tables ................................................................................................................................... 100

Racking Resistance of Long Sheathed Timber Framed Walls With Openings
1.0 INTRODUCTION
Design codes provide guidance for estimating the distribution of earthquake and wind forces to bracing walls in houses. The racking resistance of walls is often determined by summing the strength of relatively short panels between door and window openings. The strength of these panels is found by tests wherethe rocking of the panels is prevented either entirely (most countries, e.g. ASTM 1980) or partially (New Zealand). The exception is in Australia where no external forces are applied in the standard tests to prevent this rigid body motion (Reardon, 1980). Figure I shows the distortion of a bracing panel due to shear only (i.e., total. rocking restraint) and due to rocking only.
Sheet rotates abovt its centroid b u ~ remains A
Rocked Frame (shear only)
Shear Component Rocking Component
Figure 1. The Two Major Components of Racking Deflection
Most wall bracing systems in New Zealand are tested and evaluated using the BRANZ P21 test method (Cooney and Collins 1979) and revision R10 (King and Lim 1991). The P21 test method has been adopted in NZS 3604 (SANZ 1990a). The method requires bracing panels to be tested by pseudo-static reverse cyclic racking of three test specimens, f M to a serviceability limit state displacement (8 mm), and then to an ultimate limit state displacement. The resistance to wind load is taken as 0.9 times the average of the peak resisted load for the two test directions. The resistance to earthquake load is the average fourth cycle ultimate limit state peak load factored to take account of panel ductility. Occasionally, the serviceability limit state criteria govern and different equations are then used to obtain the appropriate level of resistance.
Generally, the wall bracing panels used in most New Zealand houses are only nailed to the floors - i.e., they do not use cyclone rods or anchorage bolts as is common in northern Australia. If these bracing panels are isolated from the surrounding structure and laboratoty tested under horizontal (racking) loads without any external rocking restraint, they will generally uplift off the foundation beam at relatively low loads at the panel tension end (i.e. rock about one end of the panel). This rigid body rocking motion can result in large horizontal displacements with little panel resistance. However, it is recognised that

when panels are built into a house, the wall sheathing, framing continuity and gravity effects help resist panel uplifting, bringing about a significant increase in resistance to panel racking. Panel uplift is entirely restrained by external means in the test method employed in the USA (ASTM 1976, 1980) to determine the racking resistance of isolated bracing panels. In contrast, no external uplift restraint at all is employed in the Australian tests (Reardon 1980) and panel rocking resistance relies entirely on fastening details used in house panel construction. The P21 method uses an intermediate method i.e. a partial uplift restraint. The most suitable restraints to be used in tests need to be determined.
The New Zealand Standard (SANZ 1990a) allows house wall linings to provide the entire lateral resistance required to satisfy specified racking loads (SANZ 1990). Set-in braces thus become unnecessary in New Zealand houses, with a consequent cost saving. (Relatively inexpensive light metal braces are commonly used in New Zealand to provide stability during construction.) Confirmation of good racking performance of New Zealand houses is necessary. Australian plasterboard manufacturers provide brochures detailing rated bracing wall systems with special hold-down details and with only nail (not glue) lining fastenings (e.g. Boral 1992). However, most Australian houses are constructed with un-rated glued plasterboard lining. These house bracing designs make use of nominal bracing strengths attributed to these un-rated walls implicitly (the National Timber Framing Code AS 1684, 1992) or explicitly (Timber framing manuals, TRADAC 1992). A very low bracing strength is prescribed for plasterboard walls in the Uniform Building Code in the USA (ICBO 1991). Reliance is instead placed on claddings (e.g. plywood) and robust braces.
Australian cyclones may impose wind-driven rain conditions for long periods (say 24 hours) and significant water ingress can be expected inside the house. The durability of sheathings and reduction of nail-to-sheathing shear strength under these wet conditions has not been considered in this report.
This project investigates the earthquake and wind resistance of buildings where the P21 test is used to determine the bracing rating of the main panel bracing elements. Tests of long walls incorporating bracing panels separated by typical- window and door openings are reported. The purpose of the research is summarised below and the Conclusions (see Section 6) which cover these aspects are noted:
whether the P21 end restraint should be used in small racking tests (see Conclusion 1); whether the bracing strength of a wall can be found by adding component panel strengths, irrespective of differing panel stiffness or lengths (see Conclusion 1); determine suitable serviceability limit states and the influence of lining type on the wall deflections at which significant damage occurs (cracking of lining at window comers), and a distortion level which would render doors and windows inoperable. (See Conclusions 2,3 and 5)
'In addition, a research objective was to provide data for calibrating existing computer models for long walls. This includes the effects of openings, so that results of these tests can be extrapolated to other wall configurations.

The test programme was not intended to examine:
The effect of wind uplift and (roof and ceiling) gravity load on the racking resistance of the walls. (Computer models should be able to extrapolate results to predict these effects.) The effect of having the top edge of the exterior cladding 300 mm below the top plate, as is common practice in New Zealand. A limited test programme (described in Appendix A) was conducted to examine this effect; . The racking resistance of walls with the lining glued to the framing rather than nailed, as is common practice overseas. A preliminary investigation into this aspect is covered by testing described in Appendix B.
2.0 LITERATURE REVIEW
2.1 Background: Factors Influencing Bracing Strength
Many of papers describe the lateral resistance of sheathed light timber frame (LTF) walls. This literature survey concentrates on low-rise (one or two storeys) long walls (or whole houses). In particular, the review looks at the influence of openings on wall response, and whether the bracing resistance of a long wall with openings is simply considered to be the sum of the individual component bracing panels (as derived from the various test methods as implied by many codes). Windows and doors are installed in the openings in some reported tests; others merely leave an unfilled opening. Other factors influencing wall bracing strength, that need to be borne in mind when interpreting relevant literature, are discussed below.
2.1.1 Panel Uplift Restraints
Many writers comment on the degree of end restraint used to restrict panel uplift and/or the degree of wall uplift movement monitored. Most standards allow isolated bracing panels (say 1.2 or 2.4 m long) to be tested to derive bracing strengths.These results are then extrapolated to real wall lengths to determine a particular building's resistance to lateral loads. The ASTM (1976, 1980) test procedures stipulate total panel end uplift restraint in these tests, whereas the 1988 revision of the BRANZ P21 test method (Cooney and Collins 1988) allows for only partial uplift restraint for normal wall construction. Australian testing organisations do not provide any uplift restraints on their test panel (Reardon 1980); instead, they rely entirely on the fixing details used in actual construction. The restraint specified in the P21 method is effectively three 100 x 4 mm nails through timber in shear (irrespective of panel length) as shown in Figure 2. Any real wall uplift restraint used in practice (such as end straps) can also be used in the P21 test. Note that no external uplift restraint (such as the P21 restraint shown in Figure I) was used with the long walls described in this report. The P21 uplift restraint is based on work by Gerlich (1987) who found that there was at least this mount of restraint at the ends of bracing panels bounding wall openings or at wall corners in typical New Zealand construction. For panelised wall systems, the P21 procedure only allows for the base fixity connections actually used within the panel and, in general the procedure does not allow additional uplift restraints to be used at the ends of the tests panels to simulate panel continuity.

Foundation Beam
r
Figure 2. Typical P21 Uplift Restraint (Used in Most P21 Tests)
a=r, Load .
Uplift of tinber Mock prevented 4; 3 of 100 x 4
Nok
Timber Block
2.13 Effect of Wall Openings
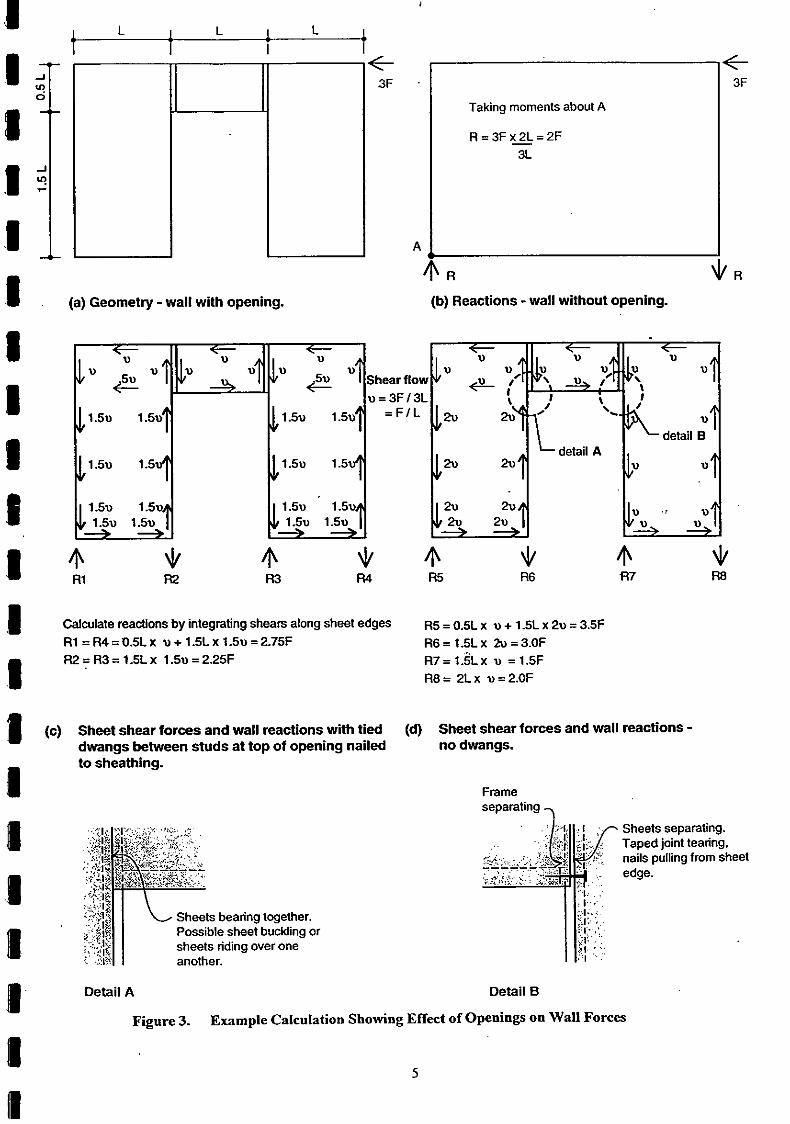
The effect of openings on the racking-load induced shear distribution in sheathing and wall reactions, is illustrated by an example in Figure 3. The analysis assumes that the wall is constructed from discrete panels but that it will approximate a homogeneous construction (i.e., fully taped and stopped wall lining). If the wall has dwangs (noggings) between the studs at the top and bottom of the opening, and if these dwangs have adequate tension straps connecting them to the studs, then the sheathing is still loaded in uniform shear as shown in Figure 3c. Note that the shear force, v, (in the wall plate directly above the opening) is distributed equally to the dwangs on either side of the opening. The shear distribution shown in Figure 3c agrees closely with that found using Dean et als. (1984) analysis method and their non-linear finite element analysis. However, theoretical and experimental analysis of a multi-storey wall with separate plywood panels @earn 1994a), indicated that the shear flow could be greater in the sheathing above the opening and lower in the panels either side.
-- -- --
In Figure 3c, the maximum sheathing shear stress has increased by 50% compared to the wall without an opening. Likewise, the end reaction (R1 in Figure 3c) is 38% higher than the wall without an opening, and an internal reaction couple (R2 = R3) is also generated (12.5% greater than the end reaction in the wall without openings). If there were no dwangs (Figure 3d) one side panel carries the residual exha shear generated by the opening. Tbis is because there is no transfer across the opening from the other side panel (Detail B). This results in still higher shear stresses and uplift forces. Without plasterboard lining joint taping and stopping it is common for sheets to slide over each other at the window corners and for sheet buckling to occur. Without tied dwangs the nails may pull through the side of the sheet, or separation may occur as shown in Detail B. The extreme case of no load transfer to the RHS sheet is also shown.
\ / / / / / / / / / / / / s " / / /
A- L
(a) Geometry - wall with opening.
Taking moments about A
(b) Reactions - wall without opening.
Calculate readions by integrating shears along sheet edges ~5 = 0 . 5 ~ x u + 1 . 5 ~ x 2u = 3.5F R1 =R4=0.5Lx u+1.5Lx1.5~=2.75F R6 = 1.5L x Zu = 3.OF R2=R3=1.5Lx 1.5u=2.25F ~ 7 = 1 . 5 ~ x u =1.5F
R8= 2Lx u =2.OF
(c) Sheet shear forces and wall reactions with tied (d) Sheet shear forces and wall reactions - dwangs belween studs at top of opening nailed no dwangs. to sheathing.
Frame separating 3
Sheets separating. Taped joint tearing. nails pulling from sheet edge.
Detail A Detail B
Figure 3. Example Calculation Showing Eflect of Openings on Wall Forces
Although common practice in New Zealand is to use dwangs (both to aid. wall climbing during construction and to resist wall warping (twisting)), no dwangs were used in the testing described in this report, because (a) it is not required by NZS 3604 (SANZ 1990a) and their absence is therefore considered to be a lower bound condition, (b) the more common use of kiln dried and finger jointed framing will reduce the tendency for studs to warp when drying, and (c) dwangs will be at different levels to the opening trimmer.
Some of the literature cited below suggests that the wall zones with openings can be effectively ignored for the purpose of wall analysis. There are factors that may make a wall with openings weaker and others that may make it stronger than a shorter wall made up by combining the portions of the wall not penetrated (as illustrated in Figure 4b). The stress' concentration at the opening corners (Figure 4a), and large shear stresses in the remaining wall, can induce sheet rupture. However, separating bracing panels with a window can help to prevent an actual wall system from overtuming (Figure 4a), if the sheathed wall portion above and below the openings is strong and stiff enough to transmit the vertical shear forces across the openings. This is because there are more bottom plate fasteners in the longer wall, and they generally act as a larger lever arm (see Figure 4). The increased overturning is analogous to the I beam principle where end studs as flanges at greater distances allow greater moment resistance. (Note, high internal reactions and higher internal shear are also generated). In Figure 4, this simplified analysis indicates that the wall with openings has more than 3 times the overtuming strength. The fastener shear loads at the top and bottom plate are only 58% of that calculated for the wall wiihout openings. Nevertheless, for panels tested with total uplift end restrainc the following literature survey generally indicates that' test walls with windows show little total strength gain compared to the component bracing panels.
2.13 Gravity Load . . Gravity load helps resist panel uplift resulting from lateral forces. To take advantage of this beneficial effect when designing real buildings, one must be sure that gravity load is present on the bracing panels. This is influenced by construction details such as ceiling joist and roof buss orientation and the roof truss support system. However, if the required vertical shear can be transmitted from abutting walls (on which the ceiling joists or trusses are supported) and through the wall comer connections to the ends of the bracing panels, this brings about less dependence on ceiling joist and truss orientation (see the example in Figure 5).
Often, wind uplift forces on a roof exert far more demand on the wall uplift restraints than horizontal racking forces due to wind (see example calculations in Figure 5. However, the uplift at foundation level forces are commonly ignored in the New Zealand code (SANZ, 2 1990a), a s the forces are assumed to be dispersed, momentary only, and resisted by building weight and mass inertia. Ignoring wind uplift, the example in Figure 5 shows that the building self-weight is sufficient to resist racking uplift forces if the wall strength is sufficient to transmit vertical shear forces (even though the wall was short and assumed to be constructed of light-weight materials). However, if the wind uplift forces are included, there is a large net uplift force at one end of the wall. This suggests that the wall must be strongly anchored to the foundations to prevent the wall lifting from the foundations in a severe wind. This failure mode is rarely observed in practice, however, even when no anchorage is provided. (The simplified analysis in Figure 5 ignores the effect that wall openings have on uplift reactions.)
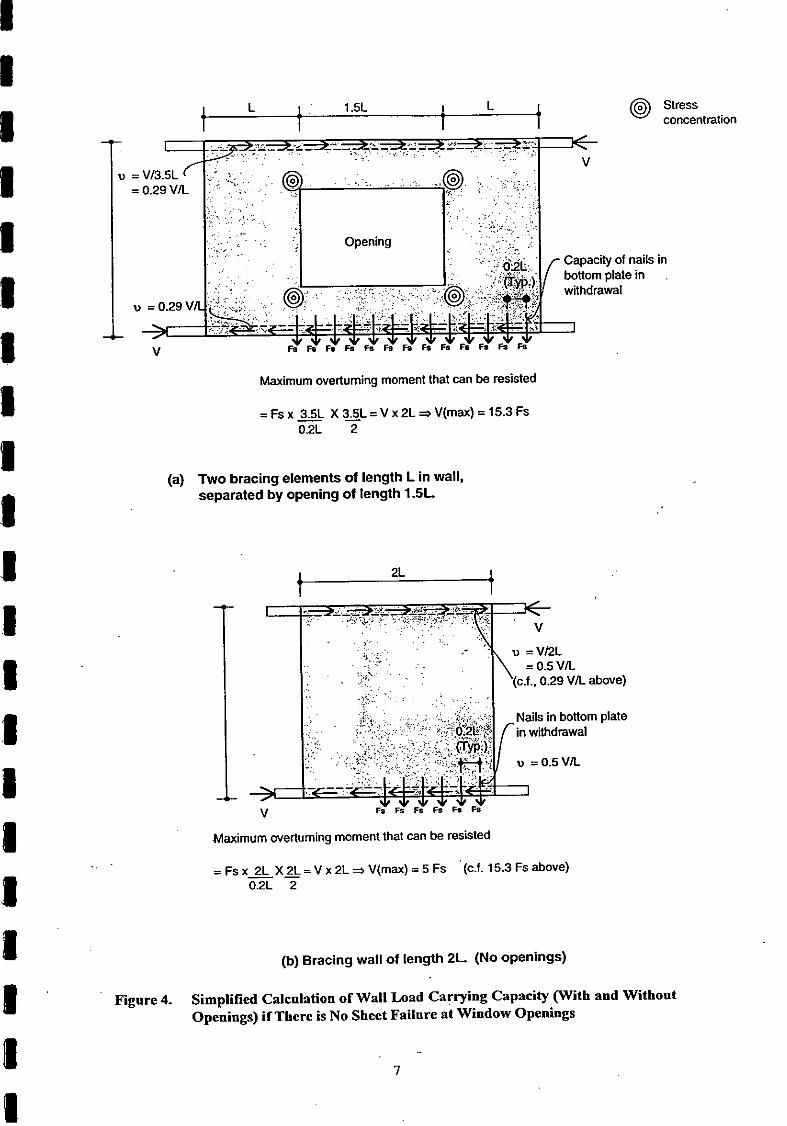
t L 1 ' 1.5L 1 L t @ Stress I concentration
I . . : .
Capacity of nails in bottom plate in
Maximum overturning moment that can be resisted
= Fs x 3.5L X 3.5L = V x 2L V(max) = 15.3 Fs - 0.2L 2
(a) Two bracing elements of length L in wall, separated by opening of length 1.5L
. . . . ,.: . . . ; ..?. , ,. U = V12L
. . : . I
= 0.5 VA ... . . . (c.f., 0.29 VA above)
Maximum overturning moment that can be resisted
= Fs x 2L X 2L = V x 2L =, V(max) = 5 Fs (c.f. 15.3 Fs above) 0.2L 2
(b) Bracing wall o f length 2 L (No openings)
Figure 4. Simplif ied Calcnlation of Wall Load Carrying Capacity (With and Without Openings) if There is No Sheet Failure at Window Openings
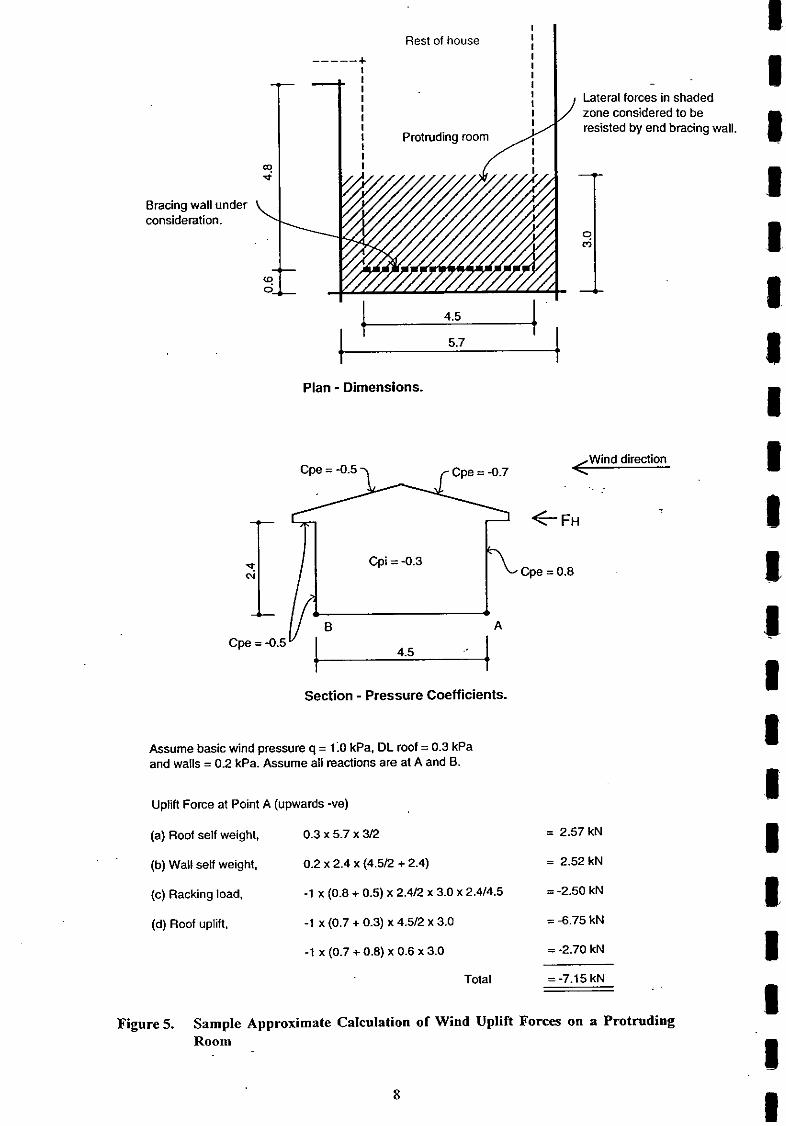
Bracing wall under consideration.
Rest of house I I
I I Protruding room 1 I I
Lateral forces in shaded j zone considered to be
resisted by end bracing wall.
Plan - Dimensions.
Wind direction Cpe = -0.5
. . .
t FH
Cpi = -0.3 Cpe = 0.8
Cpe = -0.5
Section - Pressure Coefficients.
Assume basic wind pressure q = 1:O kPa. DL roof = 0.3 kPa and walls = 0 2 kPa. Assume all reactions are at A and B.
Uplift Force at Point A (upwards -ve)
(a) Roof self weight. 0.3 x 5.7 x 312 = 2.57 kN
(b) Wall self weight. 0.2 x 2.4 x (4.5/2 + 2.4) = 2.52 kN
(c) Racking load. -1 x (0.8 + 0.5) x 2.4/2 x 3.0 x 2.414.5 = -2.50 kN
(d) Roof uplift. -1 x (0.7 + 0.3) x 4.512 x 3.0 = -6.75 kN
-1 x (0.7 + 0.8) x 0.6 X 3.0 = -2.70 kN
Total = -7.1 5 kN
Figure 5. Sample Approximate Calculation of Wind Uplift Forces on a Protruding Room

Because of the potential for wind uplift in real buildings, the walls tested in this study (apart from one instance) did not have gravity load added to simulate roof and ceiling weight. However, gravity load and wind uplift should be considered when modelling total houses. Some full house tests reported below do not include wind uplift on the windward side which will negate some if not all of the benefits of gravity load in resisting wall uplift. For earthquake analysis the coincidence of significant wind uplift with earthquake is unlikely, and as the gravity loads are high in critical cases, consideration of gravity load to resist uplift is justified. (Note, earthquake uplift forces will not induce significant rocking action and can be ignored.)
2.1.4 Wall Strength Enhancement Due to Lining on Second Side
Tests (mainly monotonic), based on total uplift restraint discussed in Section 2.2, indicate that the bracing strength of components (diagonal braces, linings on either side) can be added to give the total panel strength. On the other hand, walls tested to the BRANZ P21 (cyclic) test procedure often have their assessed resistance governed by the strength of the uplift restraint provided. The BRANZ (1992) Fix list for bracing sh-engths shows that the addition of linings on the second side, or diagonal braces, result in very little increase in the bracing rating of wall panels which do not have special strong panel to foundation uplift connections.
2.1.5 Test Regime
Much of the reported testing in the literature is for a monotonic test regime. This may be reasonable for deriving wind loads, but it is inappropriate for earthquake loads, which are reverse cyclic by nature. For most reversed cyclic tested 2.4 m high walls subject to deformations less than about 8 mm, I have found that the envelope to the fourth cycle pinched hysteresis loop peaks is generally close to the monotonic curve. However, at greater displacements a significant drop-off occurs in the fourth cycle peak loads relative to the monotonic curve - especially in plasterboards. In some materials (eg. plywood) at deflections greater than the previous peak displacement, the resisted load rapidly approaches tGe monotonic curve values. In other materials (particularly plasterboard), sheet damage precludes this load being applied. For this reason, Dean (pers. comm. 1993) suggested that the cyclic test regime should be to a specified load rather than to a predetermined deflection.
2.1.6 Other Factors.
This study attempted to identify any other factors which influence strength, such as corner connections and stopping and taping gypsum plasterboard joints.
2.2. Literature Summary
Moss (1991) detailed wind and earthquake damage to low rise buildings in New Zealand. The major earthquakes near urban areas were the 1848 and 1855 Wellington, 1929 Murchison, 1931 Napier and 1968 Inangahua earthquakes. The moderate 1987 Edgecombe earthquake is also of significance because of the damage caused. Most earthquake damage to houses is to chimneys and pile foundations, although Cooney (1979) reports damage due to inadequate racking resistance of lower storey walls. Moss did not note any wind storm damage to fully constructed houses as a result of inadequate racking resistance. As no large earthquake has occurred in major New Zealand urban areas since the 1931 Napier earthquake, modem construction has not been well tested. The trend towards landscape windows, large sliding doors, underhouse garaging and irregular house shapes will reduce house racking resistance. Widespread damage and failures due to these features have been
reported in the San Fernando (Housner et al. 1971) and Loma Prieta (Shephard et al. 1990) earthquakes.
Cooney (1979) reported on damage noted to houses in New Zealand earthquakes. Before 1930 most houses were lined with horizontal boarding (match lining). The nail couples in this boarding would have added some bracing strength but the main strength arose from diagonal bracing. Subsequently, plaster sheets (rather than horizontal boards) became the norm, and this provided far more effective bracing, and the size of diagonal braces being used gradually reduced over the following years. Cooney reported on some racking damage to house walls from earthquakes, but few complete failures. However, he noted that modem constmction had fewer internal walls (due to use of long trusses) and a larger proportion of windows in exterior walls, and was thus more vulnerable to racking damage. He also noted that lower storey garaging was becoming prevalent and that the large garage door openings could result in little bracing strength being retained at this location.
Walker (1986) noted that (worldwide) over 1 million houses had been destroyed by earthquake over the preceding 15 years, with 95% of these being unreinforced masonry or adobe construction. Damage to these two materials represented 50% of the structural damage cost. However, 80% ofNew Zealand houses were expected to suffer some damage in a MM 1X earthquake with an average loss being 15% of the replacement value. Despite this, less than 1% of the world earthquake engineering research was spent on domestic housing.
Gupta and Stalnaker (1991) produced a summary of the dollar values of wind and earthquake damage to light timber frame buildings in the USA. Based on an extensive literature survey of disaster reconnaissance reports and full-house testing, they concluded that nail connections were commonest cause of failure. This was often naivsheathing failure. They also noted that where tie rods were not used that damaged occurred to the steel straps connecting the walls to the foundations. This, in turn caused studs to be uplifted and the nails connecting the bottom plywood sheathing to the sole plate were punched out of the sheathing. Wall hold-down anchorage failure and houses sliding off their foundations were cbmmon. Sheathing buckling failure was not common but could occur around openings where nail withdrawal resistance was low. There were several reports of fractured gypsum plasterboard around openings.
2.2.1 Wall Racking Tests
A comprehensive bibliography of plywood sheathed diaphragms tests is given by Carney (1975) and has been updated by Stewart (1987), Tissell(1990) and Deam (1994a). Thurston and Flack (1980), and Thurston and Hutchison (1984) detailed experimental results from racking tests and compared experimental measurements with theoretical predictions. Stewart (1987) and Dolan (1989) investigated the dynamic earthquake performance of plywood walls by testing and by using non-linear dynamic analysis. Stewart et al. (1984) and Stewart and Dean (1989) published design procedures for timber sheathed shear walls. Deam (1994a) presented the results of an experimental program and a design procedure for multi- storey LTF shear walls.
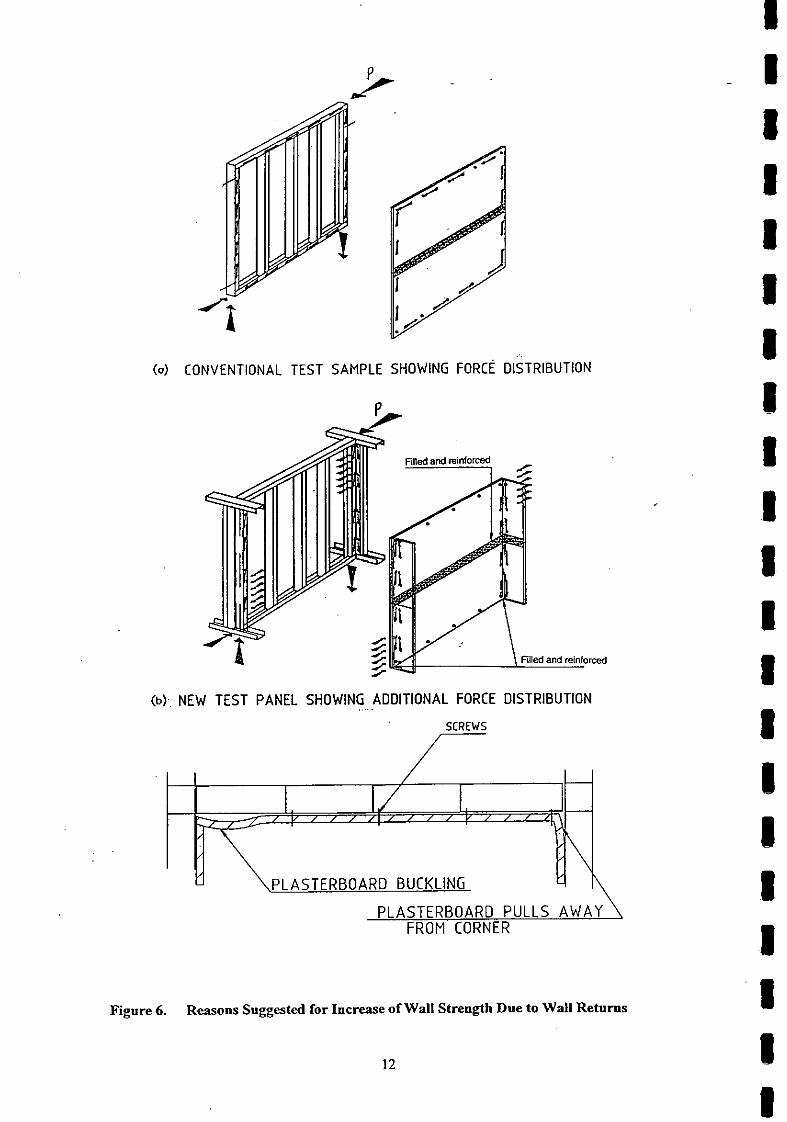
Gollege et al. (undated) tested a series of 2.4 m long steel stud wall panels, lined with plasterboard on one or both sides. Rollers resisted panel over-turning forces. Half of the walls were conventional test panels. The remainder had very short end wall returns. Plasterboard continuity at the internal corners was obtained from the usual bonding through reinforced joints (tilling the gap between the sheets with gypsum plaster containing embedded reinforcing tape). It was found that lining walls (without end returns) on two sides
instead of one, increased the ultimate wall strength by between 85 and 90%. With wall returns and reinforced corners the strength increased by an average of about 50%. The reasons suggested by the authors for this increase are illustrated in Figure 6, and are caused by different load transfer mechanisms to the sheets. Without wall returns the load must be transferred from the top plate to the sheets by the nail fasteners at this location, this proved to be the weak link in the system where failure occurred. With wall returns the load was transferred to the sheet by bearing against at the sheet edge as shown in Figure 6b. Failure initiated from buckling of the sheetat this location as shown in Figure 6c. The method Golledge et al. used to load the wall (Figure 6b) is questionable, as in practice, much of this load is introduced as a distributed load along the top plate. Failure, therefore, be induced at the top plate fasteners.
Collins (1977) performed racking tests (using typical P21 type end restraints) on a 2.4 m square, gypsum plasterboard lined, metal angle braced, wall panel (both with and without a 1150 x 1130 mm opening cut in the lining). At *8 mm cycling, the opening caused a 30% strength loss over walls without opening. For walls without openings, the braced (but unlined) wall had only 50% of stiffness of the braced and lined wall. Increases in wall strength were small when fairly large vertical loadings were added.
Suzuki (1990) studied the effects of cross walls on the lateral stiffness of a large number of l13rd scale models of 4.5 m square plywood buildings under monotonic loading. Every second stud was fastened with a strap. He demonstrated clearly that the plywood cross walls significantly increased the stiffness by reducing rigid body rotation; however, cross walls had no effect on the shear stiffness when the rigid body motion was subtracted. Suzuki's tests showed large relative vertical movement of the studs bounding the opposing sides of openings.
Panon-Mallory et al. (1984) tested a series of small-scale plywood and gypsum plasterboard clad timber frames under monotonic racking load. A steel topbeam resisted overturning forces. The gypsum plasterboard was screwed but not stopped and the plywood was nailed. They found that double sided wall behaviour was simply the sum of the single sided values, and that the strength and stiffness of the walls was to the wall length. The authors also presented nail load slip curves.
Kamiya et al. (1981) tested a series of nailed plywood walls (between 0.9 and 5.5 m length) under reverse cyclic loading. Some walls had openings. End uplift restraints were either tie rods, steel straps or 2 Wlm gravity loads. In all instances, end vertical movement was still significant (*5-10 mm), although with longer walls this movement contributed little to the total racking displacement. The vertical movement of studs on either side of openings was large, but it was concluded that total wall stiffness and strength could conservatively be estimated from the component panels. Openings could be ignored.
Hayashi (1988) tested a series of 1.8 m wide plywood clad walls with various sized openings. Glued walls had end tie rods whereas nailed walls had end straps. Significant strength loss with increasing opening size was found.
Dishongh and Fowler (1980) compared the behaviour of walls clad on both sides with gypsum plasterboard sheathing, with and without openings. They concluded that a wall with a centred window opening could be treated as two separate shear walls.
(b). NEW TEST PANEL SHOWING .... ADDITIONAL FORCE DISTRIBUTION
PLASTERBOARD PULLS A W A Y \ FROM CORNER
Figure 6. Reasons Suggested for Increase of Wall Strength Due to Wall Returns

Tissell and Rose (1988) tested a series of plywood walls with differentsized openings. They found that the wall area beneath the opening contributed significantly to the wall strength and stiffness. Their tested wall, with a window opening height of one third of the wall heighf was 71% stiffer and 57% stronger than another wall with full height opening but othenvise identical.
Yasumura (1991) reported that the stiffness of a structure with windows was approximately twice as stiff as was estimated from the component panels. He reported briefly on a large number of Japanese tests on long walls with openings. It seems there has been a lot more research in this field in Japan than other countries. (Further details were unavailable as the cited references were written in Japanese). The Japanese approach appears to be to provide reduction factors for wall strength, (relative to the unperforated wall) as a function of the ratio of opening area to wall area. Non-linear finite element analytical studies of long walls with openings were also cited.
Wolfe (1983) tested 40 nailed-gypsum plasterboard lined walls (up to 24 feet long) under monotonic load. Uplift was restrained at the ends of the walls. Some walls had braces, (either let-in wood braces or steel tension strap). He found that the total wall behaviour was simply the sum of the lined wall without braces plus an unlined wall with braces. When an unlined wall was racked to induce (metal) strap tension, the ultimate resisted load was approximately 5.3 kN per brace. With wood braces the wall bracing strength was almost independent of whether the braces were loaded in tension or compression, and the wall racking strength was approximately one third the steel tension brace value. The failure mode for walls with braces tended to be nail failure starting from the braced comer, with associated separation of top plate and stud. In walls without braces, the nail heads tended to pull through the gypsum plasterboard paper face lining in a fairly uniform manner along bottom (and sometimes) top plate.
Wolfe found that gypsum plasterboard laid horiztonally was 40% stronger and stiffer than when in a vertical orientation; he attributed this to the paper being stronger in one direction than the other. The gypsum plasterboard sheets Wolfe used had an unconfined edge at the ends but were confined by paper on the faces and sides. with horizontal orientation this end weakness is protected by taping and stopping, whereas with vertical orientation it is not. Consequently, sheet distress was more common at top and bottom plate nail locations with the vertical orientation. Also, New Zealand gypsum plasterboards have only the side edges protected by paper when installed vertically. Unpublished BRANZ tests in New Zealand have also indicated some strength gain with horizontal construction (although somewhat less than 40%).
Walls with taped and stopped joints were only slightly stronger than walls with unfilled joints for the 2.4 m length tested. However, by extrapolating his test results Wolfe predicted a 30% strength increase (per unit wall length) for 6 m long walls compared to 2.4 m long .walls. The walls with taped and stopped joints acted as a single diaphragm with no sign of joint failure between sheets. Those not taped and stopped slipped relative to one another at the interior vertical joints.
Wolfe found that the strength of walls with taped and stopped joints (without openings) was proportional to the wall length to the power A. The value of A decreased from 1.46 at 1 mm wall displacement to 1.22 at 10 mm wall displacement. At ultimate wall load the value of A was 1.19. Thus, using these results to extrapolate shorter walls to longer ones will give conservative values. The value of A was closer to 1.0 for walls without taped and stopped joints.

Short wall returns at the ends of the walls increased wall strength and stiffness by 22%. This is a smaller increase than found by Golledge et al. (undated) above for steel stud walls.
Wolfe also tested walls with actual windows and doors present rather than just leaving openings in the walls). The windows were small and their total opening width was 72% of the panel length. He found that the stiffness and strength of the walls with openings was approximately 72% of the walls without openings, so he concluded that the zone of wall with openings should be omitted from the design bracing length. This conclusion may not be valid for walls without end overturning restraint. The walls without openings always failed by nail slip in the sheet, with no other sign of sheet distress. Those with openings always failed by sheet fracture initiated at opening comers. After fracture the resisted load reduced rapidly. No glazing damage was reported, but the doors and windows were noted to bind from 3 mm wall racking displacement.
2.2.2 Methods of Analysis
Patton-Mallory and McCutcheon (1987) obtained excellent agreement between the theory derived by McCutcheon (1985) and test data reported by Patton-Mallory et al. (1984) for isolated walls with total upliA restraint. They found that Eqn. I predicted the nail load slip relationship and Eqn. 2 best predicted the wall load (R) deflection (AF) relationship. The formulae are only valid where there is no separation between the framing joints and where there is no sheathing buckling or rupture. The deflection, Af, is the wall horizontal deflection due to fastener slip alone. The additional deflection, 4 due to panel shear distortion by equation 3) usually accounts for about 5-10% of thetotal deflection. The constant C was not used by Patton-Mallory and McCutcheon (i.e., it was 1.0), but it has been inserted in the equations below because changing the value of C can provide a better fit to experimental data (see Appendix A).
where:
P = nail load (kN) at slip 6, (mm)
A = constant = peak nail load
B = constant = slip at load A12
C = constant
where K'= sina/(f.-.)'.o'
(nail coordinates x,y and panel geometry H, Land a are defined in Figure 7).

- A
*- Nail position
H
1 -
Figure 7. Panel Geometry Used to Describe Fastener Placement
where G = sheathing shear modulus
t = sheathing thickness
The nail load-slip test specimens used by Patton-Mallory and McCutcbeon (1987) had two layers of teflon in the slip plane between the framing timber and the plywdod, standard fastener tests over-estimated the initial stiffness of the fasteners when used in walls. Presumably, this was because the friction between the sheet and frame reduced as the timber shrank as the normal "clamping" force reduced. This wouid imply that the teflon should not be used in the slip tests for wall load prediction if the wall timber was dry and the testing commenced shortly after wall construction. Also, over time, nail "corrosion" would tend to increase the nail "grip" in the timber due to a nail surfaceltimber fibre binding action. Gypsum plasterboard has a paper facing which would reduce friction between sheathing and framing, so the use of teflon in the slip tests is unnecessaty. In this instance the softness of the gypsum probably a 1 6 causes a low nail clamping force and hence a small friction component.
Various researchers have used finite element computer models incorporating nail (linear and non-linear) slip elements to predict wall racking behaviour. One of the first finite element
. .models was developed by Foschi (1977). The timber frame was modelled with beam elements, plane stress finite elements were used for the sheathing, and non-linear springs were used for the fasteners. To reduce the computational effort, Itani and Cheung (1984) altered this model by modelling the connectors as a group. This was somewhat improved by Falk and Itani (1989). Two other effects ignored by the above researchers were included by Dolan (1989). His model allowed slip between framing member connections and also considered the effects of plywood panels touching each other. The influence of these additional effects was found to be small for typical shear walls. Easley and Dodds (1982) obtained excellent agreement between results of plywood test walls, using a finite element program (POLY-FINITE) and a proposed formula. This formula gives similar results to those
of Eqns 1-3 above but it is expected to be slightly less accurate as it assumes nail forces between sheathing and studs act parallel to the studs.
Gupta and Kuo (1985, 1987) developed a more general (and complex) analysis method than used in Eqns 1-3. This was also based on an energy concept and also included the effects of stud and top plate bending, but they did not assume a predetermined nail deformation pattern. The method could also incorporate a non-uniform nail load-slip relationship. They obtained good agreement with the Easley and Dodds results and showed that the effects of stud bending were small. Kuo and Gupta (1989) used the same method to compare their theoretical model with the experimental full house behaviour reported by others. They found that a good agreement only occurred if their model took account of uplift of studs and bottom plate. Yoon and Gupta (1991) developed similar equations based on a static equilibrium analysis and extended this to include panel uplift. A computer program (N-HOUSE) was developed to analyse three-dimensional buildings; this gave good agreement with 'other worker's published data.
Ge et al. (1991) used a finite element analysis method to predict the stiffness (but not strength) of walls with openings. In this method, the lining shear stiffness was reduced depending on the percent of wall openings, and additional panels with negative stiffness were added to represent the windows. The method was not well explained and is too complex to be used as the basis of a design model.
Dean et al. (1984) described a simple design procedure for analysing rectangular openings in shear walls. The procedure was limited to nailed (or screwed) panels, full sheet size openings, and construction where the dwangs were provided with fully effective end straps. The method used a simple equilibrium approach to compute shear stresses in the sheathing and the axial forces in the framing members around the opening. The authors obtained good agreement with their non-linear finite element solution.
Stewart et al. (1984, 1988) and Dean et al. (1986) reported on full-scale reverse cyclic quasi- static tests and shake table tests conducted on plywood walls. The shake table behaviour
- compared well with theoretical time-history predictions from a single degree of freedom idealisation. This model was used to compare elasto-plastic and "pinched loop" earthquake behaviour.
Ochiumi et al. (1990) developed a truss model to compare the predicted racking behaviour of a three storey plywood clad house with experimental behaviour reported by Yasumury (1991) as discussed in Section 2.2.1. The stiffness of the component shear walls was estimated using a modified form of Tuomi and McCmcheon's (1974) model to calculate equivalent diagonal brace dimensions. The actual stud stiffness was modified to incorporate connection strengths at the top and bottom plates. Generally the agreement was good, although uplift restraint forces were overestimated unless a low modulus of elasticity was used for the stud.
2.23 Full House Testing
Generally, full house testing is disappointing as it fails to compare the total house racking strengthktiffness with the strength/stiffiess of the component bracing elements. The reader cannot, therefore, readily determine the additional strength due to the composite action or "system effect",. Some researchers have compared the results from full house testing with predictions made with models they have developed; this must have been difficult as many construction details and fastener strengths were omitted from the original reports.

Tuomi and McCutcheon (1974) tksted a house which had the exterior walls clad with 10 mm thick plywood, and the interior walls lined with nailed (but not jointed) 12.5 mm thick gypsum plasterboard sheets. The bottom plate was bolted using 12 mm diameter bolts, to a steel foundation system at the corners and at 2.5 m centres along its length.. (This spacing was greater than the NZS 3604 ( S A N Z 1990a) requirement of 1.4 m between bolt centres.) The front walls were face loaded with air bags which caused a 25 mm out-of-plane deformation at a pressure of 3 kPa and significant bonom plate slip. The bonom plate split so it was then nailed to the boundary joist below to enable testing to proceed. Additional studs were added to the wall to enable them to resist a greater face load pressure. At 3.4 kPa pressure the racking displacement of the side walls was only 2.5 mm, and at 5.9 kPa the racking displacement was small (although not monitored) and there was no indication of uplift or distress. Doors and windows were installed after these tests to give an opening area which was 21.5% of the total area. The wall stiffness with openings averaged 62% of the stiffness of the same walls without openings. However, the doors began to bind at wall deflections of 2.5 mm.
Many very realistic whole-house cyclonic racking tests have been conducted at the Townsville Cyclone testing station using the test rig shown in Figure 8. The rig allows cyclonic wind uplift to be applied simultaneously with the wind racking load. Boughton and Reardon (1984) described the testing of the 3-bedroom house (doors and windows not installed) which was designed to comply with the 1981 North Queensland building code. The external cladding was fibre cement and the internal lining was plasterboard. Tie rods connected the roof trusses to floor joists. These tie rods almost entirely prevent building uplift and are commonly used in northern Australia and other cyclone prone areas of the world but are rare in New Zealand. Onedirectional cyclic loading was used with 80 cycles to 518 of the design load and 20 cycles to the design load. Other tests at various stages of construction enabled the following conclusions to be drawn: (a) both the steel roof sheeting and the ceiling cladding functioned effectively as stiff diaphragms. Although the strip flooring transferred loads effectively, in-plane deflections contributed significantly to the total deflection;, (b) the transverse walls behaved in a near rigid manner with no failure, even at 4.75 times the design load or when large portions of the exterior wall were removed simulating debris damage. This load factor indicated sufficient strength to safely resist 65 m/s winds.
Figure 8. Test Rig Used at TownsvilleCyclone Testing Station

Reardon (1988, 1989) reported tests on full scale houses with gypsum plasterboard internal cladding and an external brick veneer. It was concluded that even the nominally non- structural internal walls had the capacity to brace the structure more efficiently than conventional diagonal bracing. The walls were found to have 70% of the load capacity of engineered structural walls. The ceiling and roof structures formed a rigid horizontal diaphragm, transferring forces from external to internal walls. Racking tests to low load levels were conducted at four stages during construction to estimate the stiffness contribution of the different components. As an example of the contributions, installation of the roof and ceiling reduced the lateral deflection of one wall to a quarter of its previous deflection. Installation of the cornices between the walls and ceilings reduced the deflection by a further 60% (to 16% of the original deflection).
Reardon (1990) also used the rig shown in Figure 8 when he tested a steel framed house without tie rods. Some slab-to-wall bolts pulled out 10 mm during testing, but Reardon (1992, pers. corn.) commented that, generally, no significant wall u p l i b occurred in these type of tests even when cyclone tie rods were not used.
Yokel and Hsi (1973) field tested a two-storey house by jacking horizontally off braced fork lifts. The external cladding was mainly asbestos cement sheets and the interior lining was gypsum plasterboard. At an equivalent lateral wind pressure of 1.2 Wa, the drift at the upper level was only 1 mm and there was no uplift or damage.
Stewart et al. (1988) laboratory tested, under monotonic racking loads, a manufactured light timber framed (LTF) house with gypsum plasterboard lining and sheet steel formed wall and roof cladding. Window glazing and doors were omitted. The roof diaphragm was extremely stiff and the racking walls behaved on a way similar to an linear-elastic manner. At an equivalent wind pressure of 3.6 Wa, however, the gypsum plasterboard lining cracked at a window corner and the load capacity reduced to 1.2 Wa.
Sugiyama et al. (1988) tested, under cyclic reverse loading, a traditional Japanese timber beam and post construction open plan two-storey house ( I0 x 8 m). The house was clad with calcium silicate sheets, was unlined internally and used strong metal braces. Window glazing and doors were omitted. The house was tested at various construction phases. The addition of cladding to wall sections increased the strength by 50% over that when tested with braces alone. Strength increased by a further 15% when the spaces above and below the window and door openings were clad. Stable hysteresis loops were generated and *I65 kN racking load was resisted at 50 mm house deflection.
Yasumara et al. (1988) tested a three-storey full size plywood clad house under reverse cyclic loading, and compared the results with predictions made with Tuomi and McCutcheon's (1974) model. Failure occurred when the plywood buckled and failed in tension around window openings. A special uplift restraint was used at corners and the uplift force measured. This averaged 25 kN on each wall when the applied load averaged 80 kN. Despite the corners being prevented from uplifting, the uplift of the studs beside the window openings was noted to be 8 mm at inter storey deflection ratios of 1 :60. This was the clearest evidence found in the literature that house uplift is significant under full-house racking. Yasumara et al. obtained good agreement between measured and predicted racking behaviour based on the measured nail load-slip relationship, particularly when some allowance was taken for uplift.
2.3 S u m m a r y
The following general conclusions can be made from the preceding discussion and literature review.
If walls are tested with total uplift restraint, then the racking resistance is simply the sum of the resistance of the component items (i.e., sheathing on one or both sides, braces etc), and any wall zone with large openings can effectively be ignored. . Light timber framed (LTF) houses appear to have more resistance to lateral racking than the simple summation of the component bracing wall resistances would suggest. Generally, the racking strength of the conventional full-size tested houses has proved to be more than adequate to resist the likely in-service loads. However, modem construction with typically large wall openings may change this result.
Wind uplift forces on short lengths of house walls can exceed gravity load and thus it may be unconservative to ignore both these effects when studying house racking resistance.
3.0 DYNAMIC ANALYSIS M O D E L S
Several inelastic time-history dynamic computer analysis packages which are intended to model the earthquake behaviour of shear walls have been investigated. The methods of approximating the hysteresis loops are given below:
3.1 The LPM Model (Ewing e t al. 1987)
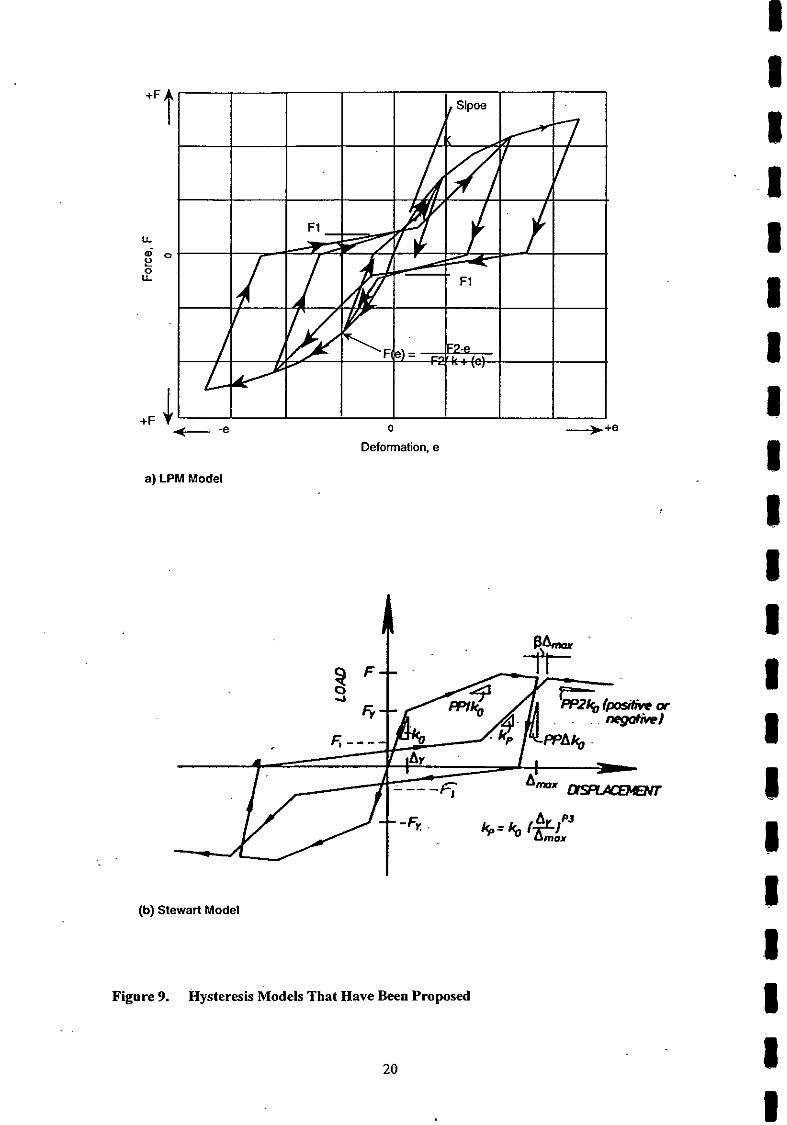
The general force-deformation relation for the shear element, which has identical properties in both deformation directions, is shown in Figure 9a. The force-deformation envelope of the shear element is defined by the second-order curve given by the following equation:
where F(e) = shear force e = shear deformation F2 = ultimate force capacity of spring at large values of e K = initial spring stiffness a t e = 0
The force-deformation response is defined by three parameters (K, F, and Fz ) Permanent compression and tension deformations can develop and accumulate, resulting in hysteretic behaviour. In regions that have not been entered previously (i.e., undamaged regions), loading follows the envelope CUNe. Reloading occurs along a slope defined by
After the load passes through zero, the stiffness is decreased so that the load at zero deflection is equal to the pinch force F,. At further deflection in this direction the slope is increased until the envelope is reached and the envelope is then followed.
Deformation, e
a) LPM Model
(b) Stewart Model
Figure 9. Hysteresis Models That Have Been Proposed
20

(c) Ceccoitti Model
I (a) Elasto-plastic (b) Separate
8 (d) Dean Model
I Figure 9. Hysteresis Models That Have Been Proposed

3.2 T h e Stewart Model (Stewart et al. 1984)
The hysteresis loops suggested (Figure 9b) have a backbone curve defined by three straight lines of stiffness KO, PPl& and PP&, and a yield force Fy. As with the LPM Model, an intercept force FI was used to define the slope of the pinched loop, which re-stiffens at a critical deflection to a slope of Kp (as defined by a parameter P3). Stewart's model allows the re-intersection with the envelope curve to be beyond the previous maximum deflection by an amount defined by a parameter P. The unloading curve is separately defined.
3.3 T h e Cecotti Model (Cecotti and Vignoli 1991)
Cecotti and Vignoli (1991) used the pinched hysteresis loop shown in Figure 9c. This has been incorporated into the well known DRAM-2D programme. Stiffness parameters/variable? (Stiffness's) KO, K,, K2, K3 and 5 yield moment M, and the load axis intersect point FI are required to define the response. ~ h k main variation from the above two models is that the pinched loop slope K3 is a constant.
3.4 T h e Dean Model
Rather than define a hysteresis loop by a series of parameters, the Dean model (pers. Comm. 1993) is based on an actual structure which consists of a number of elasto-plastic and separated springs, (Figure 9d), making it inherently stable. A defined number of the 10 springs in the model are nominated to be elastoplastic while the remainder are separated elastoplastic. Typical generated hysteresis loops (Figure 24) exhibit all the general characteristics of shear wall behaviour, including degradation. (Degradation was lacking in the other models.) Modelling a given hysteresis loop with Dean's model is relatively easy using a modification by Deam(1994b). An example where this is done for a wall tested in this study is given in Section 4.6.1.1.

4.0 TEST PROGRAMME
4.1 Objective
The test programme was designed to gain a greater understanding of the earthquake and wind racking resistance of light timber-framed sheathed walls with openings, and to provide data to calibrate and check computer models. A range of linings and combinations of linings were tested but the linings were only nailed (i.e., not glued or screwed) to the framing.
The amount of vertical movement experienced by the walls adjacent to the openings, at corners and at wall ends, was of particular interest. If this movement was small it suggests that total wall end uplift restraint could be used in tests on short panel lengths. 'Ihe test programme was not intended to examine:
The effect of wind uplift and (roof and ceiling) gravity load on the racking resistance of the walls. (Computer models should be able to extrapolate the measured results to predict these effects.) The effect of having the top edge of the exterior cladding 300 mm below the top plate as is common practice in New Zealand. A limited test programme (described in Appendix A) was conducted to examine this effect. The racking resistance of walls with the lining glued to the framing rather than nailed, as is common practice overseas. A preliminary investigation into this aspect is covered by testing described in Appendix B.
4.2 Description of Test Specimens
Five different wall configurations were tested with up to three different linings on &ch wall as shown in Figures 10-14 and Table I. (Because this table is referred to many times in the remainder of this report, it is reproduced below as well as at the back of the report). The lining materials are described in Appendix E.
TABLE 1 DESCRIPTION OF TEST WALLS
Wall Label Figure Sheathing
Legend * 25 x 1 mm straps used at each end of 800 and 1900 mm length panels
Side 1
PLB PLB PLB PLB PLB * PLB PLB PLB PLB PLB
- ** 25 x I mm straps used at each end of 800 mrn length PY cladding
Side 2
- PY** TX - - -
PY TX PLB PLB
not used within wall window opening zone. PLB 9.5 mm thick gypsum plasterboard sheet. TX 7.5 mm thick cellulose fibre cement board PY 7.5 mm thick plywood
I
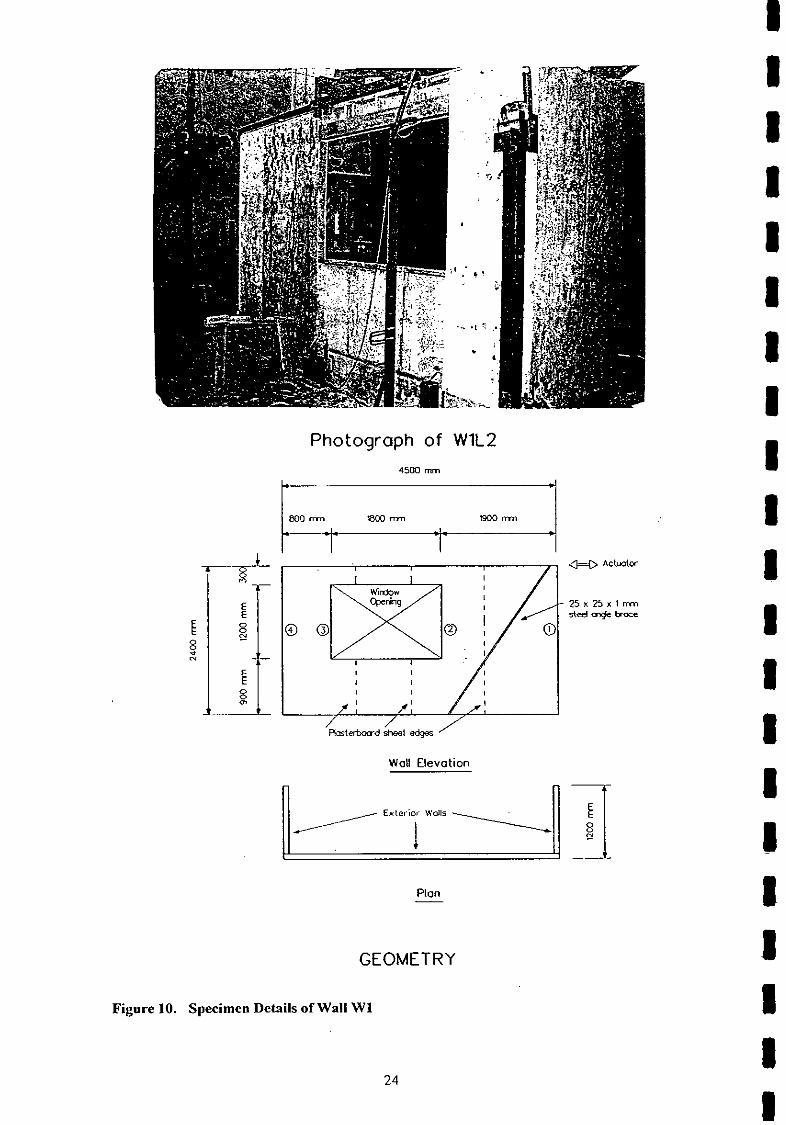
Photograph of W1L2
WaU Elevation
GEOMETRY
Figure 10. Specimen Details of Wall W1
24
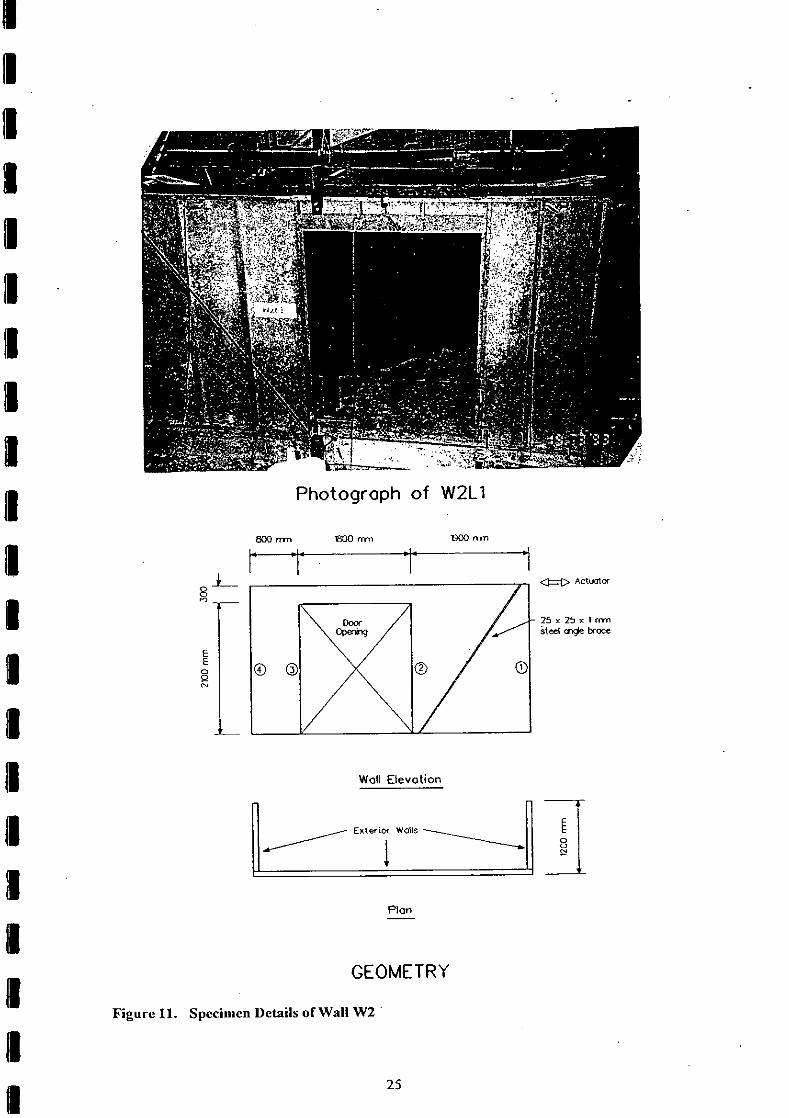
Photograph of W2L1
GEOMETRY
Figure 11. Specimen Details of Wall W2
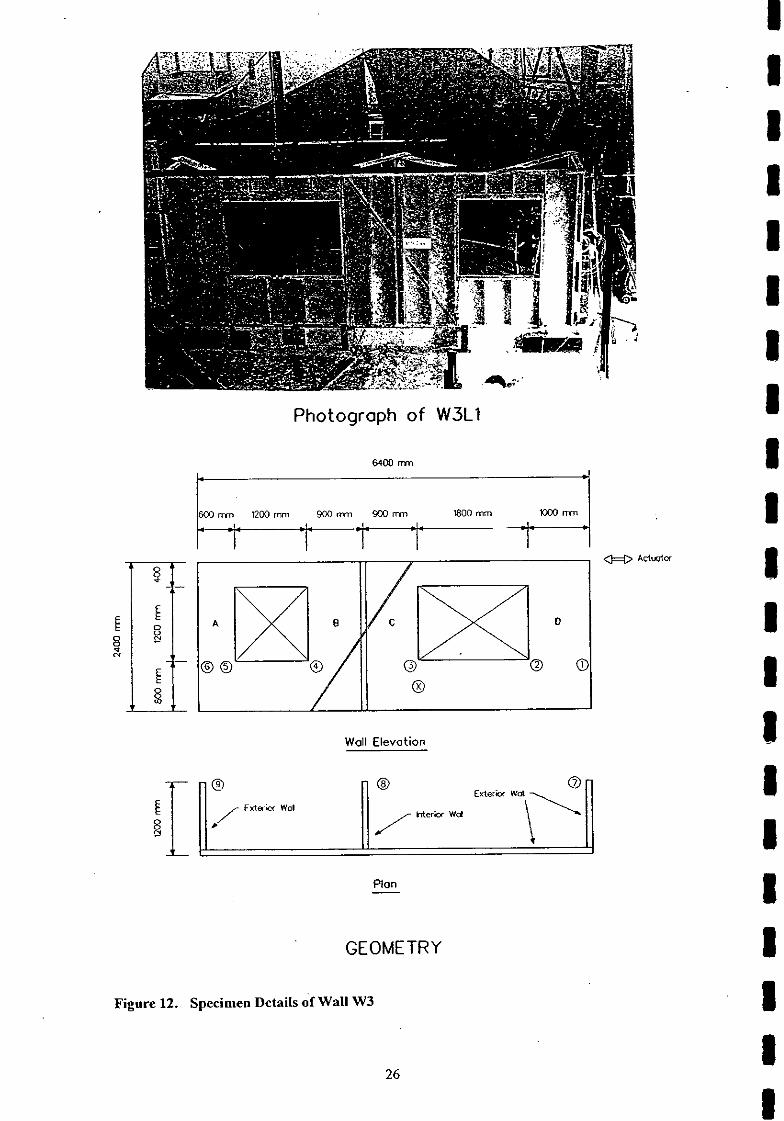
Photograph of W3L1
Wall Elevation
GEOMETRY
Figure 12. Specimen Details df wal l W3
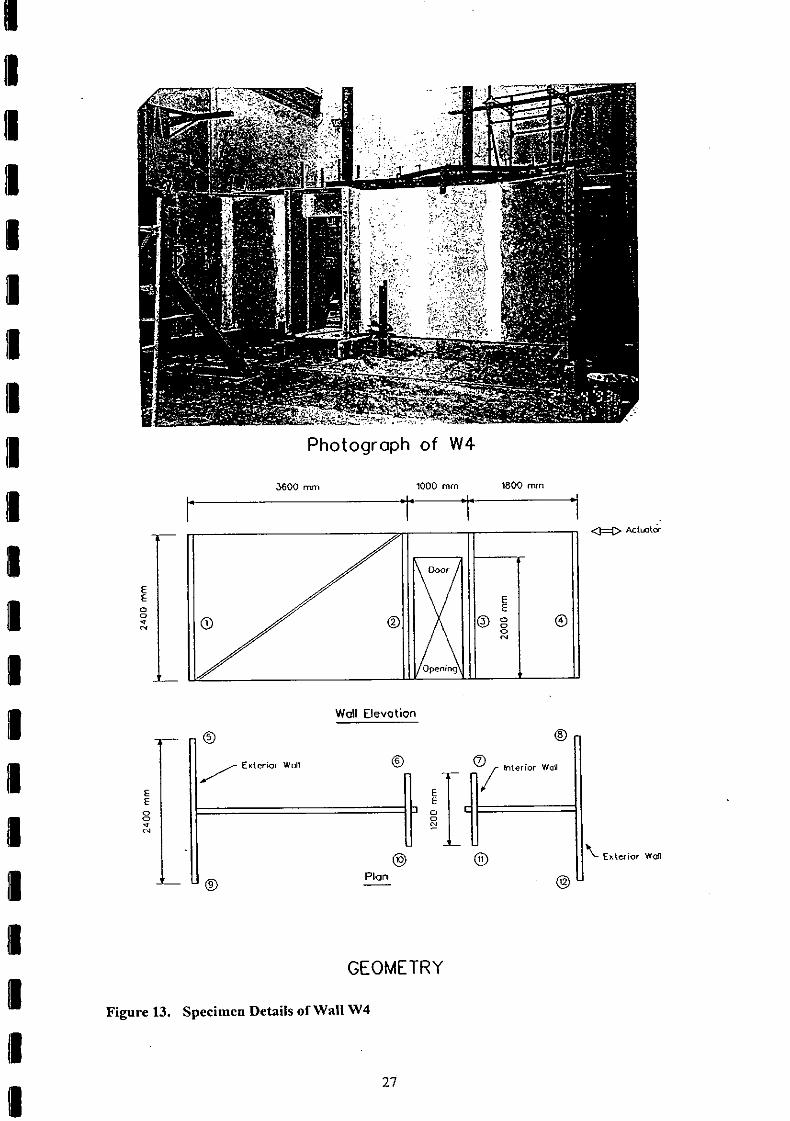
Photograph of W4
Wall Elevation
GEOMETRY
Specimen Details of Wall W4

Photograph of W5 2700 mm 3700 rnrn
Wall Elevation
Exterior W d l -.
GEOMETRY
Figure 14. Specimen Details of Wall W5

Walls W1 to W3 simulated exterior wall construction and walls W4 and W5 represented interior wall construction. Each of these walls had short exterior andlor interior wall returns. Walls W1 and W2 modelled the exterior wall of a protruding room with a typical size window or large sliding door, respectively. Wall W3 was longer, with two window openings, and modelled a two room exterior wall of a house. Wall W4 modelled a long unperforated interior wall linking into the mid-side of another room as shown in Figure 15; wall W5 modelled a hallway wall with doors to two adjacent rooms as shown in Figure 16. All the walls had PLB lining with fully stopped and taped joints on the interior faces (including at the corners) as per the manufacturer's instructions (Winstones Wallboards 199l), as this is typical of New Zealand construction. Walls W4 and W5 were lined on both faces, except the exterior face of the exterior wall returns (which were not clad). The exterior face of the wall W2 return wall was also unclad, whereas walls WI and W3 had a variety of exterior claddings as detailed below.
WALL W 4
Figure 15. Plan of Structure Simulated by Wall W4
All sections of the main wall longer than 1.6 m had PLB lining nailed as a bracing panel, i.e., nails spaced at 150 mm centres around the bracing panel perimeter. Elsewhere, the PLB lining was nailed to the framing with 30 x 2.5 mm clouts at 300 mm centres around each sheet, and to the studs between sheet edges with pairs of nails at 300 mm centres.
The TX and PY claddings were both nailed at 150 mm centres around the perimeter of each sheet This spacing was also used on internal studs for the TX cladding, but was increased to 300 mm for the PY cladding. The TX was nailed with 40 x 2.5 mm nails and the joints tilled and reinforced as per the manufacturer's instructions. The PY was nailed with 30 x 2.5 mm flat head nails, (nail head slightly thicker but smaller diameter then the clout). After testing it was noticed that two of the nails in wall W3L2 intended to connect PY to the window stud had missed the stud (See 'X' Figure 12).
To prevent shrinkage cracking, the opening was cut out of the sheathing for walls WI so that joints made at the vertical sheet edges were approximately 300 mm away from the openings, as is recommended by all of the sheathing manufacturers. However, in other walls, sheathing sheet edges coincided with the window (or door) trimmer studs (as is common New Zealand practice) for all other walls.
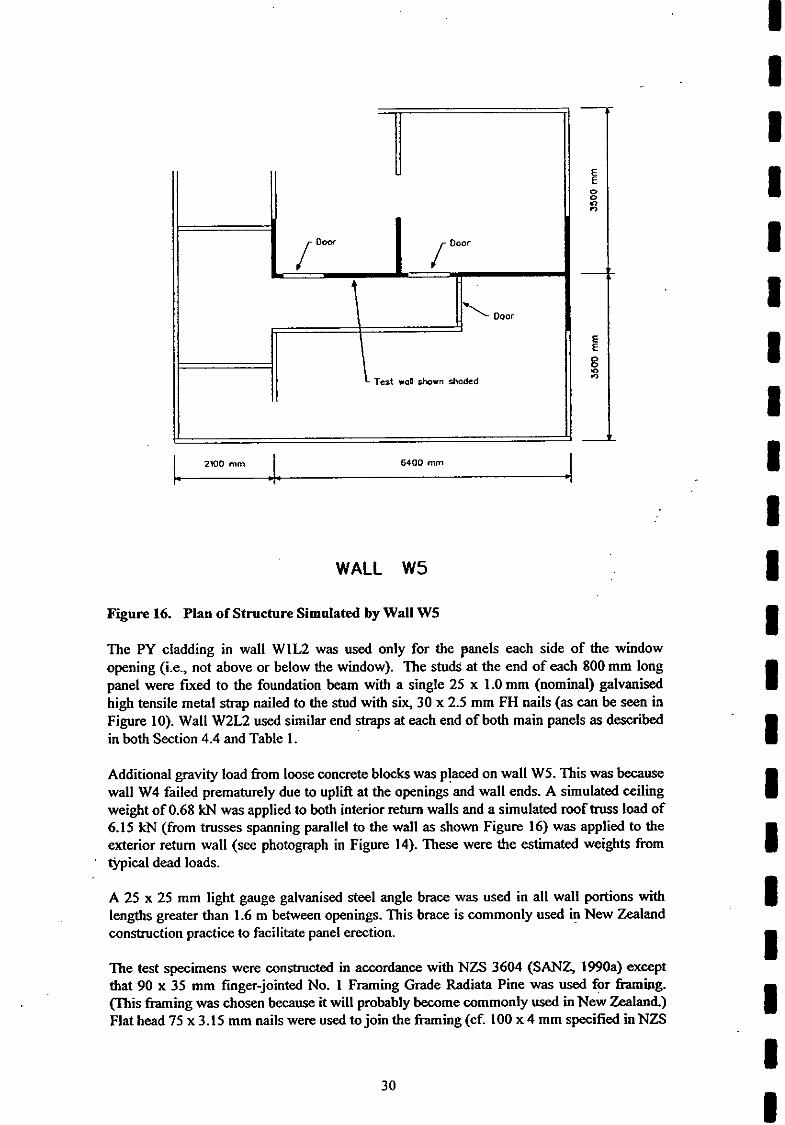
WALL W 5
Fignre 16. Plan of Structure Simulated by Wall W5
The PY cladding in wall W1L2 was used only for the panels each side of the window opening (i.e., not above or below the window). The s tud at the end of each 800 mm long panel were f d to the foundation beam with a single 25 x 1.0 mm (nominal) galvanised high tensile metal strap nailed to the stud with six, 30 x 2.5 mm FH nails (as can be seen in Figure 10). Wall W2L2 used similar end straps at each end of both main panels as described in both Section 4.4 and Table 1.
Additional gravity load from loose concrete blocks was placed on wall W5. This was because wall W4 failed prematurely due to uplift at the openings'and wall ends. A simulated ceiling weight of 0.68 W was applied to both interior return walls and a simulated roof truss load of 6.15 W (from trusses spanning parallel to the wall as shown Figure 16) was applied to the exterior return wall (see photograph in Figure 14). These were the estimated weights from typical dead loads.
A 25 x 25 mm light gauge galvanised steel angle brace was used in all wall portions with lengths greater than 1.6 m between openings. This brace is commonly used in New Zealand construction practice to facilitate panel emtion.
The test specimens were constructed in accordance with NZS 3604 (SANZ, 1990a) except that 90 x 35 mm finger-jointed No. 1 Framing Grade Radiata Pine was used for framing. (This framing was chosen because it will probably become commonly used in New Zealand.) Flat head 75 x 3.15 mm nails were used to join the framing (cf. 100 x 4 mm specified in NZS

3604) because the timber was thinner than used traditionally for New Zealand construction. The bottom plates of the exterior walls were nailed to the foundation beam with pairs of 100 x 4 mm flat head nails at 600 mm centres, except for the wall returns of W1 and W2 (which were nailed at twice this density). The nail density was doubled for these two wall returns to simulate twice the length of wall returns actually used. Interior walls were also nailed with pain of 100 x 4 mm nails at 600 mm centres, except only nail at 600 mm centres was used for wall returns of these walls.
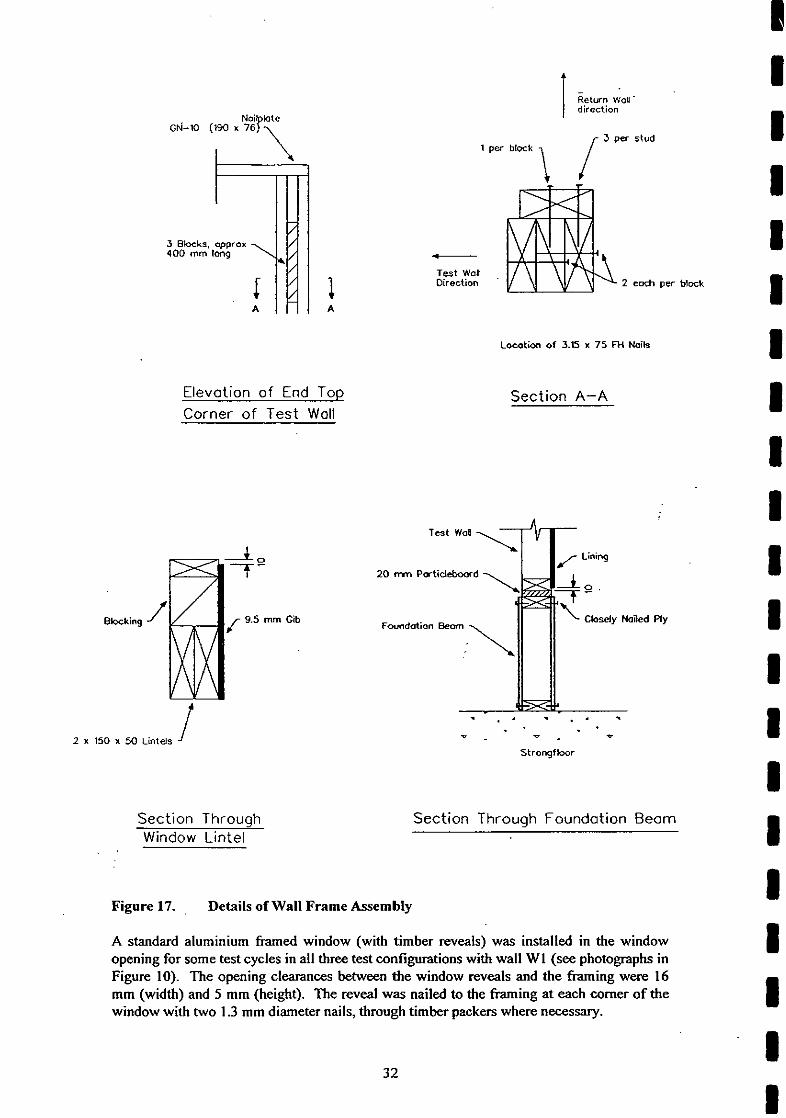
The foundation beam was a closely nailed plywood box beam which was bolted rigidly to the strong-floor as shown in Figure 17. The nailing details at the wall corners and at the lintels are also shown in Figure 17. A claw nail-plate was used to join the top plates at the corners (Fig. 17). The particle board flooring below the wall returns was 400 mm wide, and extended under the main wall to strongly connect the foundations of the main and return walls together. A 200 mm wide strip of 9 mm plywood was attached to the end of the wall return top plate and to the main wall, to simulate a ceiling or dragon tie and reduce the possibility of tearing the taped corner PLB joints.
A standard aluminium framed window (with timber reveals) was installed in the window opening for some test cycles in all three test configurations with wall W1 (see photographs in Figure 10). The opening clearances between the window reveals and the framing were 16 mm (width) and 5 mm (height). The reveal was nailed to the framing at each corner of the window with two 1.3 mm diameter nails, through timber packers where necessary.
4.3 Test Setup
The walls were tested in the vertical orientation as shown in the photographs. Rollers provided out-of-plane buckling restraint for the top plate where spans between return walls exceeded 3 m. Load was applied with a 90 kN closed loop electro hydraulic ram reacting against a strongwall, and was measured with a 100 W load cell; the equipment being within Grade 1 accuracy (1610,1985).
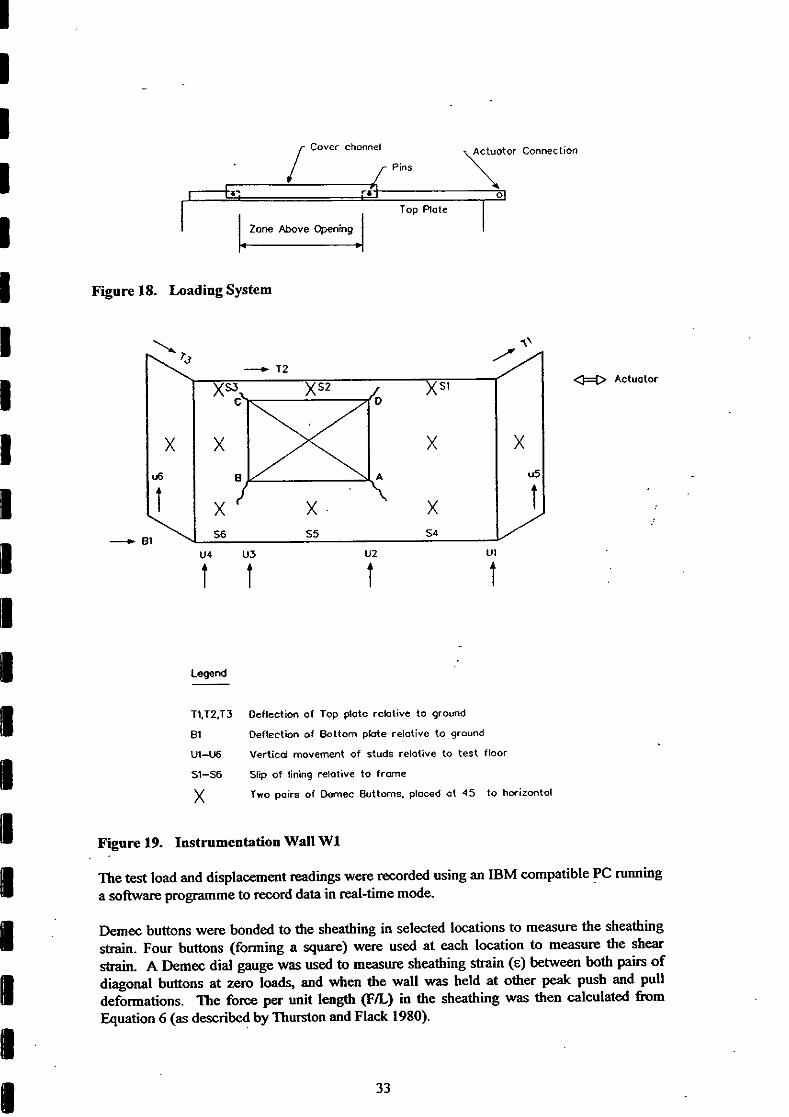
Steel channels, screwed to the top plate along the length of the test wall but not above the openings (Figure IS), transferred the actuator load to the wall. A cover channel (not screwed to the test wall) was connected by a pin to the channels on either side of the opening to prevent any artificial uplift restraint at the edge of the openings.
Linear potentiometers accurate to 0.25%) measured the following wall deformations:
lining or cladding slip relative to the frame;
stud uplift relative to the ground.
0 horizontal deflections of the top and bottom plate of both main and return walls; and
sheathing diagonal strains.
The instrumentation for wall W1 is shown in Figure 19.
Elevation of End Top Corner of Test Wall
Section Through
I Return WOY direction
- Test won Direction 2 coch per block
Location of 3.6 x 75 FH Noib
Section A-A
Section Throuqh Foundation Beam Window Lintel
Figure 17. Details of Wall Frame Assembly
A standard aluminium framed window (with timber reveals) was installed in the window opening for some test cycles in all three test configurations with wall WI (see photographs in Figure 10). The opening clearances between the window reveals and the fiaming were 16 mm (width) and 5 mm freight). The reveal was nailed to the framing at each comer of the window with two 1.3 mm diameter nails, through timber packers where necessay.
Cover channel
Pins
Top Plate
Zone Above Opening
I- - 1
Figure 18. Loading System
Tl.TZ.T3 Deflection 01 Top plate relative to ground
61 Deflection of Bottom plate relative to ground
U1-M Verticd movement of studs relative to test floor
S1-S6 SI@ of lining relative to frame
X Two pairs of Demec Butt-s. ploced a t 45 to horizontal
Figure 19. Instrumentation Wall W1
Actuator
The test load and displacement readings were recorded using an IBM compatible PC ~ n n i n g a software programme to record data in real-time mode.
Demec buttons were bonded to the sheathing in selected locations to measure the sheathing strain. Four buttons (forming a square) were used at each location to measure the shear strain. A Demec dial gauge was used to measure sheathing strain (E) between both pairs of diagonal buttons at zero loads, and when the wall was held at other peak push and pull deformations. The force per unit length ( F L ) in the sheathing was then calculated lium Equation 6 (as described by Thurston and Flack 1980).
where G = sheathing material shear modulus. See Section 4.6.3 for values used.
t = sheathing material thickness
~ ( a v ) = average strain from the two 45" diagonals recorded by the Demec gauge.
4.4 Test Procedures
The basic wall cyclic test regime is recorded in Table 2. At each displacement level. the cyclic loading was applied, using a sinusoidal displacement function, at a rate of 0.1 Hertz. After the 4, 8 and 24 mm cycles, the walls were moved to the previous maximum positive and negative displacements and the Demec readings recorded. Some additional cycles were applied to walls WlLl and W2Ll to investigate the shape of hysteresis loops at deflections lower than those the wall had already been cycled to. Additional cycles (to previous maximum imposed deflections) were applied to wall W1 with the window installed. The window was then removed for subsequent cycles.
After testing wall W2L1 to *24 mm, it was observed that the only distress was in the naiVPLB connection along the bottom plate. These nails were removed and replaced with new nails which were offset 50 mm from the origilial nail holes. A single 25 x 1.0 mm (nominal) high tensile steel strip was then nailed to the studs at the ends of both the 1.9 m and the 0.8 m wide panels with 6, 30 x 2.5 mm FH nails. The wall was relabelled as W2L2 and the test cycles marked with asterisks in Table 2 were applied.
4.5 Observations
4.5.1 General Observations
Three types of damage were observed in the test walls: '
rupture of the sheathing at corners of the openings or parting of the joint at this location; localised sheathing damage at nail locations; and separation of the studs from the bottom plate or the bottom plate from the foundation beam.
The stopped and taped joints at the orthogonal wall junctions and the full height sheet joints were never damaged.
Sheathing distortions were commonly seen next to nail heads. This occurred as the nail heads rotated and embedded in the sheathing and it resulted in localised cracking and nail hole enlargement with sheathing fraying at the edges. When this occurred in lining PLB the surface paper ripped around the nail head and some plaster fell out. To describe this phenomena the term "nail working" or "working hard" (depending on the severity) has been used in the observations below. Where the nails broke out a wedge of the sheathing through to the adjacent sheathing edge the term nails "pulled through" is used.
4.5.2 Wall W1
The window opening was cut out of the sheathing sheets for this wall so that the sheet joints within the window region were a minimum of'300 mm distance from the edges of the opening.
The only rupture in lining PLB was at the window openings; the ruptures tended to be at about 30" to the vertical. The rupture lengths after various imposed wall cyclic deflection are recorded in Table 3 for the locations defined in Figure 19. Generally, the amount of rupture after the *6 mm cycling was small. However, afier the *16 mm cycling the sheathing rupture at the window corners had essentially separated the wall into three separate panels (i.e., a window lintel panel and a panel on either side).
No rupture had occurred in cladding TX until the *16 mm cycling, when ruptures propagated the full height for three of the four window corners. The vertical TX joints beneath the window separated.
The cladding PY did not extend above and below the windows and consequently did not rupture.at the window comer.
Some nails in the bottom plate wereobserved to be "working" in lining PLB during the 8 mm cycling. All bottom plate nails (including those in the return walls) had "worked hard" after the 24 mm cycling and many had "pulled through". Only a few of the top plate lining nails showed signs of "working" at this stage. Nail "working" in the PY. and TX was less significant. The steel straps at the ends of the PY panels in wall W1L2 began to buckle during the 8 mm cycling and had developed significant "slop" by 24 mm.
Generally, the studs lifted from the bottom plate in the return walls and the plates lifted from the foundation beam in the main wall.
There was little additional damage to the wall when the window was present although the window distorted during the racking as shown in Figure 10e. The window distortion was largely recovered when the wall was returned to zero deflection. During the 75 mm cycling the top window catch dislodged, and the window slipped out of plane at the base and was wedged in an open position.
45.3 Wall W2
No damage was observed until the 6 mm cycle when a 90 mm long crack developed in the PLB, propagating from the top of the door towards the top of the wall. The lining joint above one door comer had also parted over a height of 100 mm. After the 8 mm cycling, the lining had parted at the joint above both door corners (about 150 mm long), and this extended to the top plate after the 12 mm cycling. The nails joining the lining to the bottom plate then "pulled through" the sheet close to the opening and in the return wall nearest the actuator. This extended along the bottom plate during the 16 mm cycling, until after 24 mm cycling all of the bottom nails in the assembly had pulled through the sheets. This resulted in apparently independent rotation of the 1.8 m wide and 0.9 m wide panels. The studs were lifting from the bottom plate and there was little restraint to the rocking motion. The only other distress noted was some "working" of a few of the lining nails in the studs bounding the opening.
The studs were then strapped to resist overturning and the nails between the lining and bottom plate were replaced (as described in Section 4.4). The strengthened wall was stiffer than the original and fairly uniform "nail working" developed around the sheet perimeter after the 24 mm cycling. The steel brace buckled and the stud straps developed significant "slop".
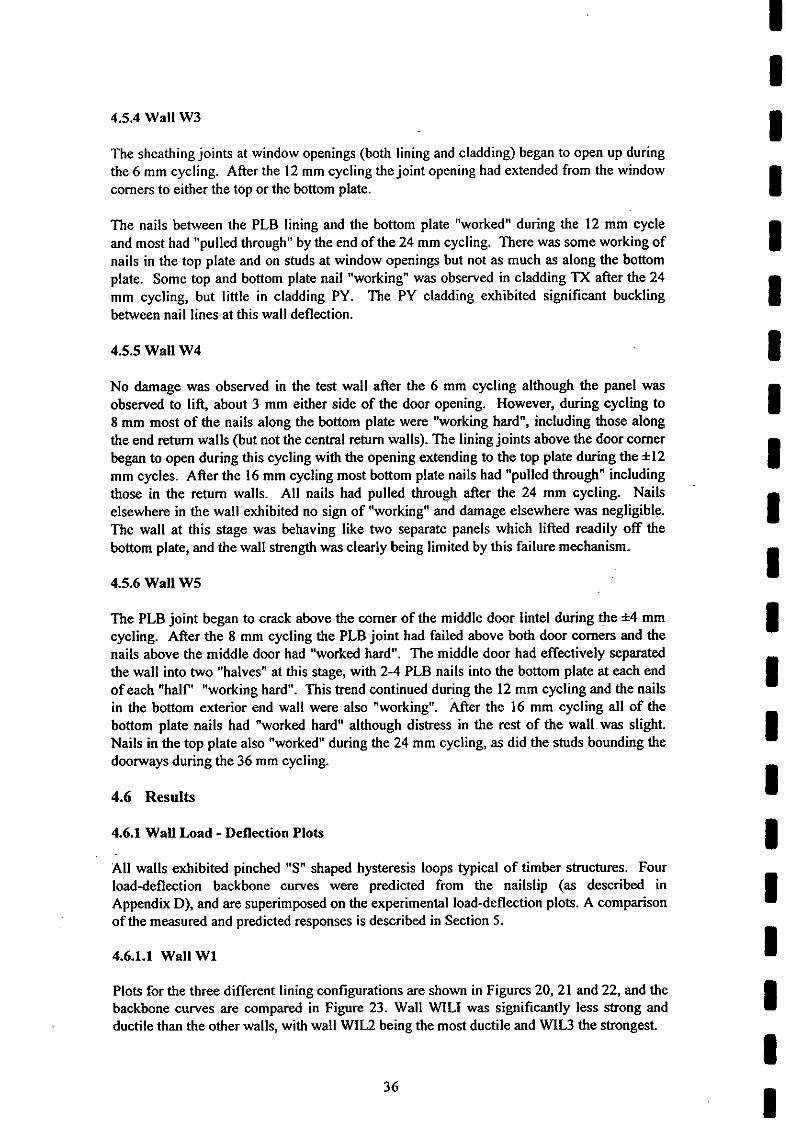
4.5.4 Wall W3
The sheathing joints at window openings (both lining and cladding) began to open up during the 6 mm cycling. After the 12 mm cycling the joint opening had extended from the window corners to either the top or the bottom plate.
The nails between the PLB lining and the bottom plate "worked" during the 12 mm cycle and most had "pulled through" by the end of the 24 mm cycling. There was some working of nails in the top plate and on studs at window openings but not as much as along the bottom plate. Some top and bottom plate nail "workingn was observed in cladding TX after the 24 mm cycling, but little in cladding PY. The PY cladding exhibited significant buckling between nail lines at this wall deflection.
4.5.5 Wall W4
No damage was observed in the test wall after the 6 mm cycling although the panel was observed to lift, about 3 mm either side of the door opening. However, during cycling to 8 mm most of the nails along the bottom plate were "working hard", including those along the end return walls (but not the central return walls). The lining joints above the door corner began to open during this cycling with the opening extending to the top plate during the *12 mm cycles. After the 16 mm cycling most bottom plate nails had "pulled throughn including those in the return walls. All nails had pulled through after the 24 mm cycling. Nails elsewhere in the wall exhibited no sign of "working" and damage elsewhere was negligible. The wall at this stage was behaving like two separate panels which lifted readily off the bottom plate, and the wall strength was clearly being limited by this failure mechanism.
4.5.6 Wall W5
The PLB joint began to crack above the corner of the middle door lintel during the *4 mm cycling. After the 8 mm cycling the PLB joint had failed above both door corners and the nails above the middle door had "worked hard". The middle door had effectively separated the wall into two "halves" at this stage, with 2-4 PLB nails into the bottom plate at each end of each "half' "working hard". This trend continued during the 12 mm cycling and the nails in the bottom exterior end wall were also "working". After the 16 mm cycling all of the bottom plate nails had "worked hard" although distress in the rest of the wallwas slight. Nails in the top plate also "worked" during the 24 mm cycling, as did the studs bounding the doorways during the 36 mm cycling.
4.6 Results
4.6.1 Wall Load - Deflection Plots
All walls exhibited pinched "S" shaped hysteresis loops typical of timber structures. Four load-deflection backbone curves were predicted from the nailslip (as described in Appendix D), and are superimposed on the experimental load-deflection plots. A comparison of the measured and predicted responses is described in Section 5.
4.6.1.1 Wall W1
Plots for the three different lining configurations are shown in Figures 20,21 and 22, and the backbone curves are compared in Figure 23. Wall WILI was significantly less strong and ductile than the other walls, with wall WIL2 being the most ductile and WIL3 the strongest.
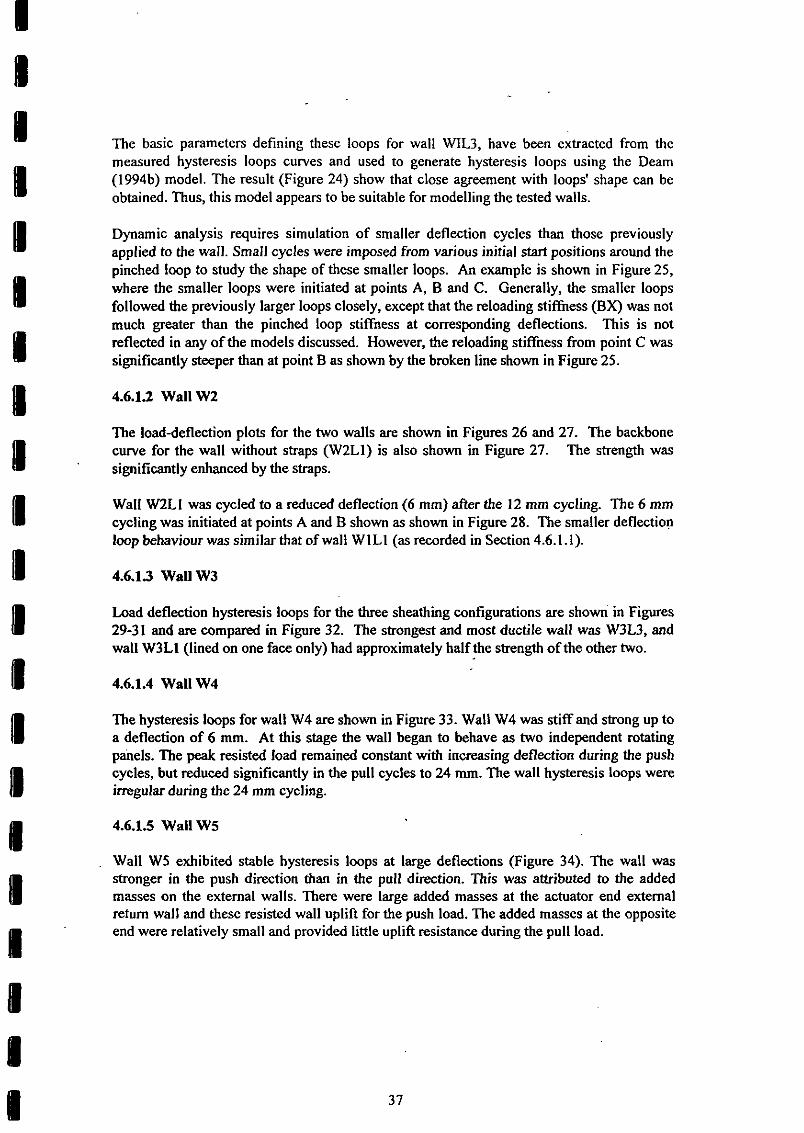
The basic parameters defining these loops for wall WIL3, have been extracted from the measured hysteresis loops curves and used to generate hysteresis loops using the Deam (1994b) model. The result (Figure 24) show that close agreement with loops' shape can be obtained. Thus, this model appears to be suitable for modelling the tested walls.
Dynamic analysis requires simulation of smaller deflection cycles than those previously applied to the wall. Small cycles were imposed from various initial start positions around the pinched loop to study the shape of these smaller loops. An example is shown in Figure 25, where the smaller loops were initiated at points A, B and C. Generally, the smaller loops followed the previously larger loops closely, except that the reloading stiffness (BX) was not much greater than the pinched loop stiffness at corresponding deflections. This is not reflected in any of the models discussed. However, the reloading stiffness from point C was significantly steeper than at point B as shown by the broken line shown in Figure 25.
4.6.1.2 Wall W2
The load-deflection plots for the two walls are shown in Figures 26 and 27. The backbone curve for the wall without straps (W2L1) is also shown in Figure 27. The strength was significantly enhanced by the straps.
Wall W2LI was cycled to a reduced deflection (6 mm) after the 12 mm cycling. The 6 mm cycling was initiated at points A and B shown as shown in Figure 28. The smaller deflection loop behaviour was similar that of wall WlL1 (as recorded in Section 4.6.1.1).
4.6.13 Wall W3
Load deflection hysteresis loops for the three sheathing configurations are shown in Figures 29-31 and are compared in Figure 32. The strongest and most ductile wall was W3L3, and wall W3L1 (lined on one face only) had approximately half the swngth of the other two.
4.6.1.4 Wall W4
The hysteresis loops for wall W4 are shown in Figure 33. Wall W4 was stiff and strong up to a deflection of 6 mm. At this stage the wall began to behave as two independent rotating panels. The peak resisted load remained constant with increasing deflection during the push cycles, but reduced significantly in the pull cycles to 24 mm. The wall hysteresis loops were irregular during the 24 mm cycling.
4.6.1.5 Wall W5
Wall W5 exhibited stable hysteresis loops at large deflections (Figure 34). The wall was stronger in the push direction than in the pull direction. This was attributed to the added masses on the external walls. There were large added masses at the actuator end external return wall and these resisted wall uplift for the push load. The added masses at the opposite end were relatively small and provided little uplift resistance during the pull load.

TOP DEFECTION (mrn)
Figure 20. Load Versus Deflection For Wall W l L l
?I WALL I W1L2 5 t
TOP DEFLECTION (rnrn)
Figure 21. Load Versus Deflection For Wall W1L2
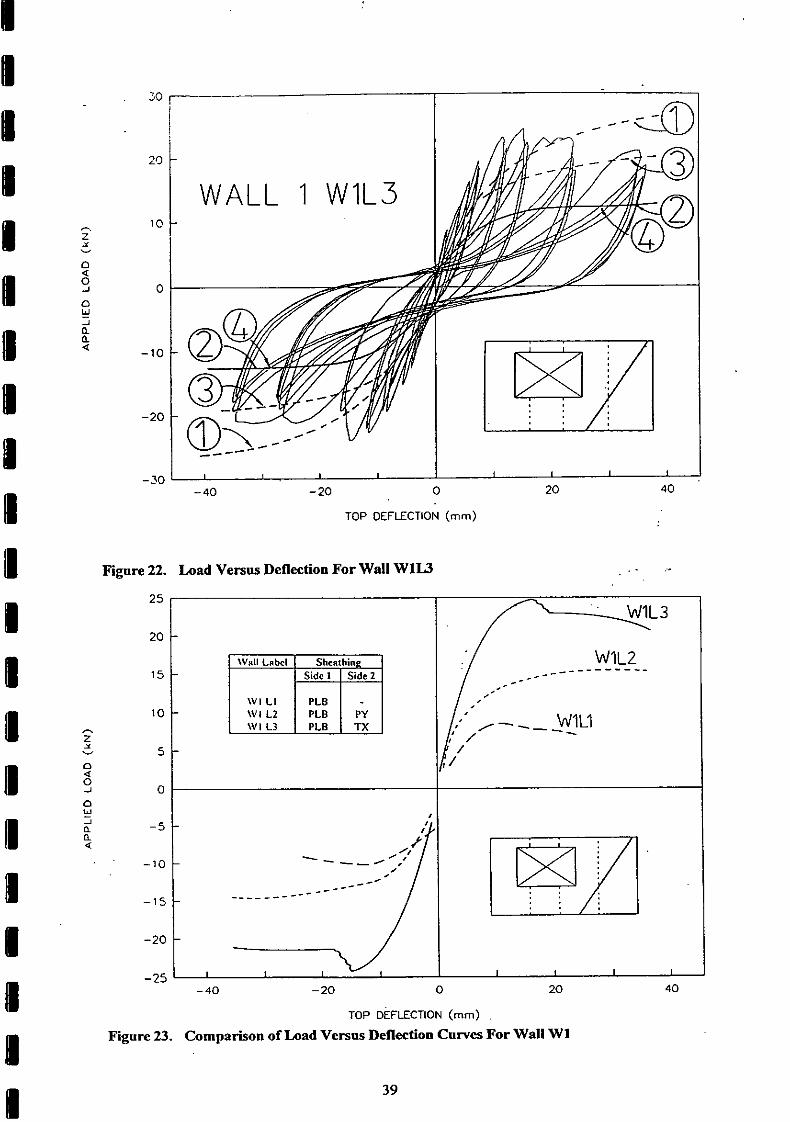
TOP OEFLECTlON (mrn)
Figure 22. Load Versus Deflection For Wall W1L3 . . ...
Wal l Label ( Shenthinz Side 1 ( Side 2
I \V I LI 1 W I L2 l q n l W I L3 PLB TX
- 40 - 20 0 20 40
TOP DEFLECTION (rnrn)
Figure 23. Comparison of Load Versus Deflection Curves For Wall W1
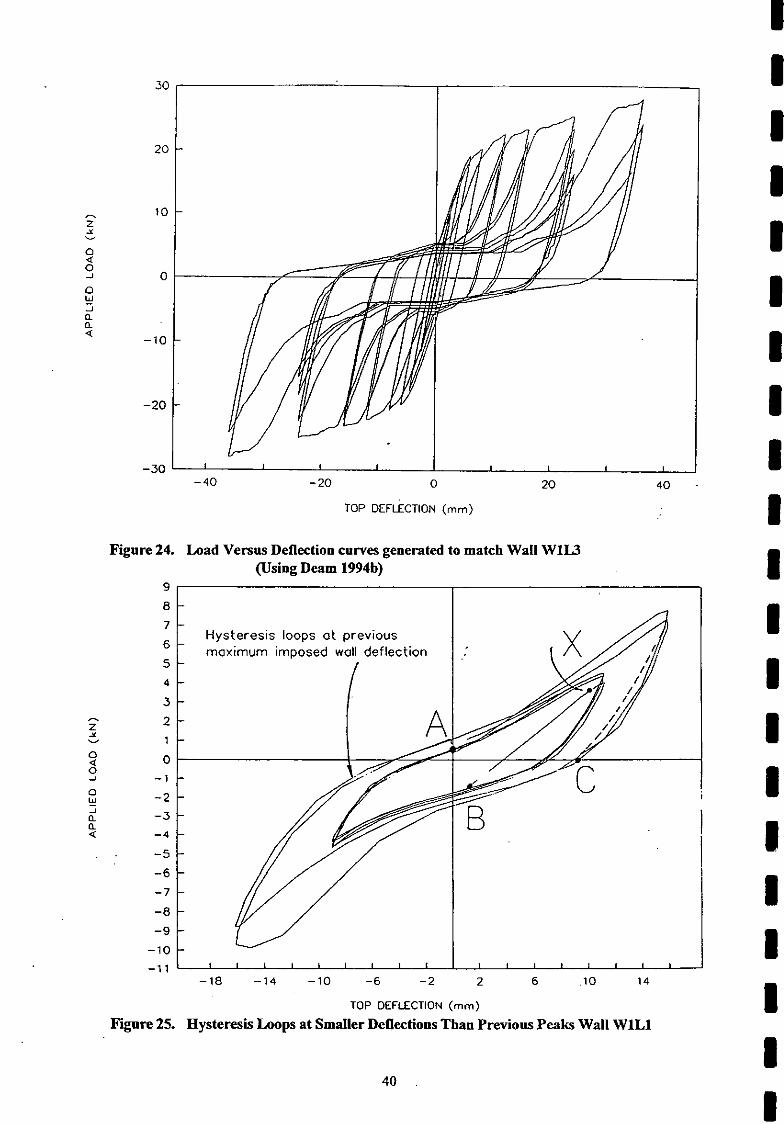
- 40 - 20 0 2 0
TOP DEFLECTION (mm)
Figure 24. Load Versus Deflection curves generated to match Wall W1L3 (Using Deam 1994h)
TOP DEFLECTION (mm)
Figure 25. Hysteresis Loops at Smaller Deflections Than Previous Peaks Wall WlLl

TOP DEFLECTION (rnm)
Figure 26. Load Versus Deflection For Wall W2L1
- 40 - 20 0 20
TOP DEFLECTION (mrn)
Figure 27. Load Versus Deflection For Wall W2L2

.
Hysteresis loops ot previous
-12 -8 -4 0 4 8 12
TOP DEFLECTION (rnrn)
Figure 28. Hysteresis Loops at Smaller Deflections Than Previous Peaks Wall'W2Ll
l o 8 W A L L 3 W 3 L 1
TOP DEFLECTION (rnrn)
Figure 29. h a d Versus Deflection For Wall W3L1

W A L L 3 W3L2
- 40 - 20 0 20 40
TOP DEFLECTION (mm)
Finre 30. Load Versus Deflection For Wall W3L2
W A L L 3 W S L 3
- 20 0 2 0
TOP DEFLECTION (mm)
Figure 31. Load Versus Deflection For Wall W3L3
43

- 4 0 - 2 0 0 20 40
TOP DEFLECTION (mm)
Figure 32. Comparison of Load Versus Deflection Curves For Wall W3
-25 -15 -5 5 15 25
TOP DEFLECTION (mm)
Figure 33. Load Versus Deflection For Wall W4
44
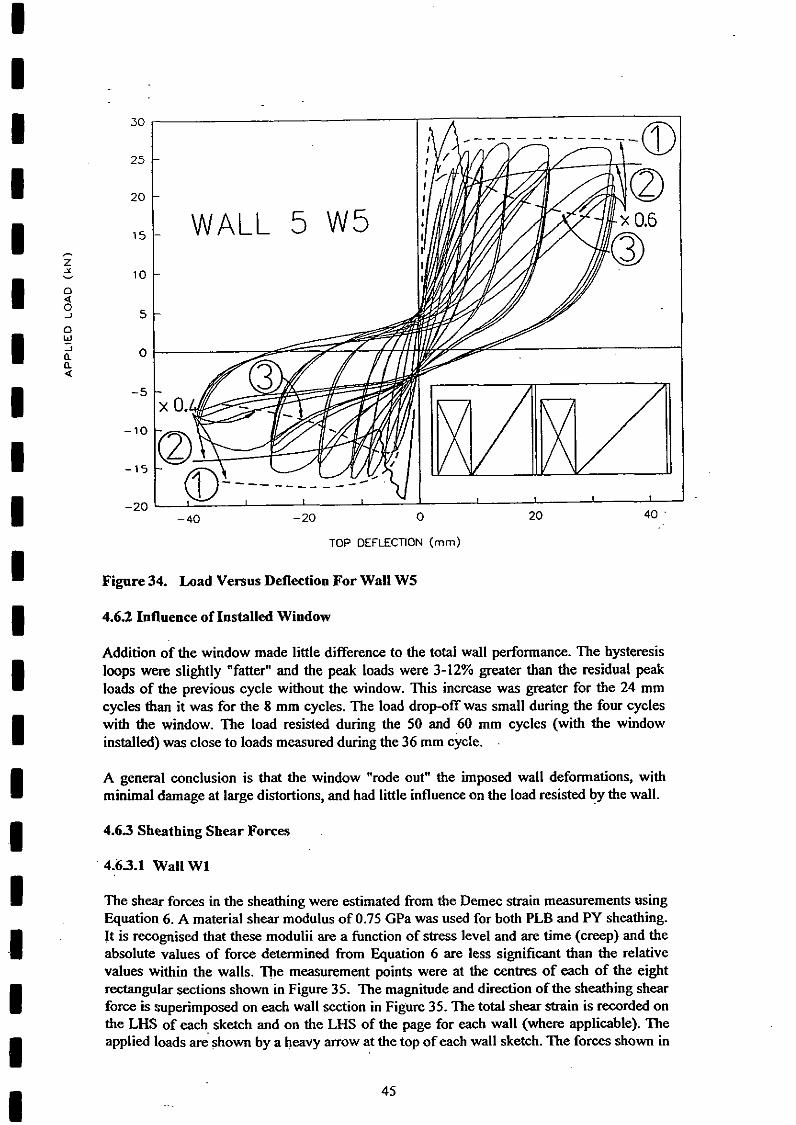
Figure 34. Load Versus Deflection For Wall W5
4.6.2 Influence of Installed Window
Addition of the window made little difference to the total wall performance. The hysteresis loops were slightly "fatter" and the peak loads were 3-12% greater than the residual peak loads of the previous cycle without the window. This increase was greater for the 24 mm cycles than it was for the 8 mm cycles. The load drop-off was small during the four cycles with the window. The load resisted during the 50 and 60 mm cycles (with the window installed) was close to loads measured during the 36 mm cycle.
A general conclusion is that the window "rode out" the imposed wall deformations, with minimal damage at large distortions, and had little influence on the load resisted by the wall.
4.63 Sheathing Shear Forces
4.63.1 Wall W1
The shear forces in the sheathing were estimated from the Demec strain measurements using Equation 6. A material shear modulus of 0.75 GPa was used for both PLB and PY sheathing. It is recagnised that these modulii are a function of stress level and are time (creep) and the absolute values of force determined from Equation 6 are less significant than the relative values within the walls. The measurement points were at the centres of each of the eight rectangular sections shown in Figure 35. The magnitude and direction of the sheathing shear force is superimposed on each wall section in Figure 35. The total shear strain is recorded on the LHS of each sketch and on the LHS of the page for each wall (where applicable). The applied loads ak shown by a heavy arrow at the top of each wall sketch. The forces shown in
Figure 35 are the difference between the peak push and the peak pull loads at the indicated deflections. The applied forces are slightly lower than those plotted on the hysteresis loops, as the demec strains were read during a subsequent cycle (held at the peak deflections for the measurement to be recorded).
Tearing of the sheathing at window corners would have affected the sheet strain distributions during the e 4 mm cycles. The bond between the Demec buttons and cladding TX was unreliable so these results are not presented. The forces shown in Figure 35c, however, indicate that cladding TX was carrying twice the load of lining PLB at lower deflections and this proportion increased at greater deflections. The reliable Demec measurements indicated that the shear modulus of cladding TX was of the order of 3-4 GPa.
Although the summation of the sheathing loads from the Demec readings (at any level) do not completely agree with the applied loads, there is a general consistency in Figure 35 which enables the following conclusions to be drawn.
The forces above and below the window level in the LHS (narrow) panel are low. In all PLB linings, the force below the window level was in the reverse direction to the forces elsewhere in the lining. The force in the RHS (wide) PLB panel generally reduced significantly below the window level. This did not occur in the PY cladding, where there was no cladding above and below the window opening.
The force in the PLB above the window level was significantly lower than the force in the PLB in the top of the RHS (wide) panel when there is no cladding, but significantly greater when there was a discontinuous cladding on the reverse side (i.e., cladding PY).
Generally, the force in the PLB above the window was significantly lower than it was below the window.
The forces in the PLB were similar at corresponding deflections for WlLl and WlL2 (where additional straps resisted panel uplift). Howkver, they were lower in W1L3 where the larger forces resulted in greater panel uplift (contributing more to total panel deflection). This indicates that where panel uplift is restrained, the strength contribution of linings may be added together to obtain the total strength.
The forces in the cladding PY were smaller than they were in the lining PLB at low deflections, but were greater at high deflections. This indicates that the initial stiffness of the PLB was higher than the PY at low loads but reduced as the PLB cracked at the window corners and deteriorated around the fasteners. The forces in the TX were significantly greater than they were in the PLB.
4.63.2 Wall W2
The demec strains were only measured at the mid-height of the wide and narrow panels. Forces derived from the demec strains showed good agreement with applied load (Table 4). The wide panels carried a slightly greater force per unit length than the narrow panels. The shear forces in the PLB were generally slightly lower than those of wall W1, at corresponding deflections (Figure 35). This was probably because a significant proportion of the applied wall deflection was attributed to wall uplift.

Wall W l L l at f 4 mm Wall W l L l at f 8 mm
PLB lining PY dadding Wall W I D at f 4 mm
PLB lining PY cladding Wall W l U a t f 8 m m
- Wall W I U at f 24
PY cladding
PLB lining PCB lining NOTE: PI = 21.6 kN. P2 = 32.6 kN. forces in cladding TX unknown Wall W1L3 at f 4 mm Wall W1L3 at k 24 mm
Figure 35. Forces in Sheathing W1 as Measured by Demec Gauge

4.63.3 Wall W3
The demec strains were only measured at wall mid-height with this wall configuration. A material shear modulus of 3 GPa was assumed for the shear modulus of material TX in the results presented in Table 5. This gave good agreement between the applied load and the estimated shear forces in Wall W3L3. The estimated shear forces were slightly lower than the applied forces in walls W3L1 and W3L2.
The wall had three panels between the window openings. The wide centre panel (Panels B+C in Figure 12) carried slightly higher force per unit length than the narrower end panels (A and D). The lining PLB carried almost the same shear forces as the cladding at corresponding deflections.
4.6.4 Stud Vertical Movement
4.6.4.1 Wall W1
Measured stud vertical movement is recorded in Table 6 and the horizontal deflection, AR attributable to this vertical movement is compared with the applied deflection in Figure 36. This was calculated using Equation 7 and is based on the rigid body rotation shown in Figure 37(a).
Where Vi and Vj are vertical movements at i and j, Lij is horizontal distance between i and j, and H is the wall height = 2.4 m..
The relationship between the stud uplift and the applied deflection was remarkably stable during successive cycles to the same deflection (see Figure 38).
The bottom plate remained attached firmly to the studs and so the bottom plate and stud uplift were the same. Racking uplift forces withdrew the bottom plate nails from the foundation beam during the loading phase of the cycle, leaving them protruding from the bottom plate at the end of the cycle. These nails were removed after the 12 mm cycling (wall WILl) and replaced with others in close proximity, but this strengthening did not appear to be reflected in the Figure 36 plots.
The Figure 36 plots show that the proportion of the deflection due to rotation was similar for both narrow and wide panels (averaging about 75% of the total deflection) and the proportion ihcreased with increasing deflection. At large imposed deflections the proportion exceeded 100Y0. In this instance it is expected that some of the vertical movement monitored was flexing of the top and bottom plates, as illustrated in Figure 37(b), rather than being completely attributable to rigid body rotation.
The stud uplift at 8 and 24 mm applied deflection is plotted in Figure 39. The stud uplift magnitude was much greater than the magnitude of the downward stud movement. The uplift of the window jamb studs was similar to uplift at the corresponding wall ends. For clarity, uglift of the short panel for wall W1L3 has not been plotted on Figure 39, as the entire panel and wall return lifted. However, the rotation of this panel was still similar to that in preceding walls, as can be seen from Figure 36.
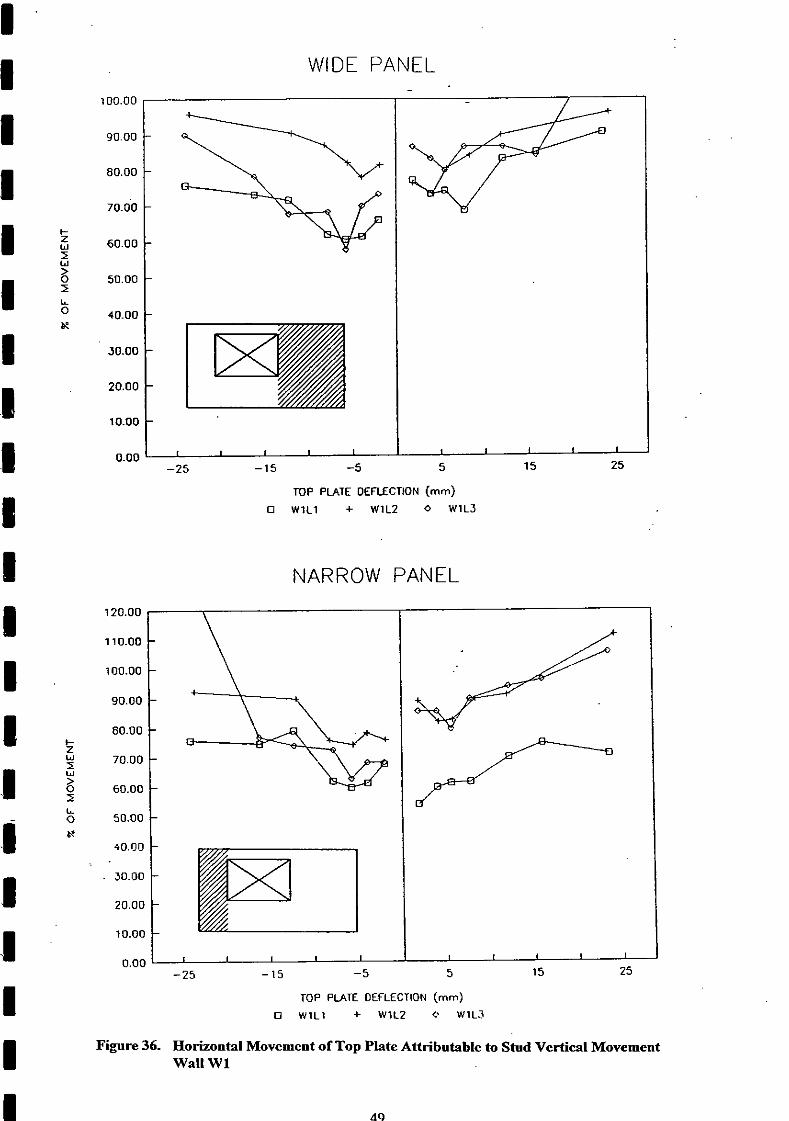
WIDE PANEL -
RIP PLATE DEFECTION (mm) 0 W l L l + W 1 L 2 0 W 1 L 3
NARROW PANEL
TOP PLATE OEFLECTION (mm) 0 W l L l + W 1 L 2 0 W 1 L 3
Figure 36. Horizontal Movement of Top Plate Attributable to Stud Vertical Movement Wall W1

(0) Solid Body Rotation (b) Flexing of Top & Bottom Plotes
Figure 37. Horizontal Deflection Due to Stud Vertical Movement
16 15 14 13 12 11
.-. 10 E 9 E ./ 8 t - 7 2 a 6 3 0 5 3 t V)
4
3 2 1
0 - 1
- 2 - 3
- 30 -10 10 30
TOP DEFLECTION (mrn) - u 1 - U2 - u3 - U4
Figure 38. Stud Uplift Versus Deflection for WlLl

Pull 8 mm
Pull 8 mm
Figure 39. Stud Uplift of Wall W1
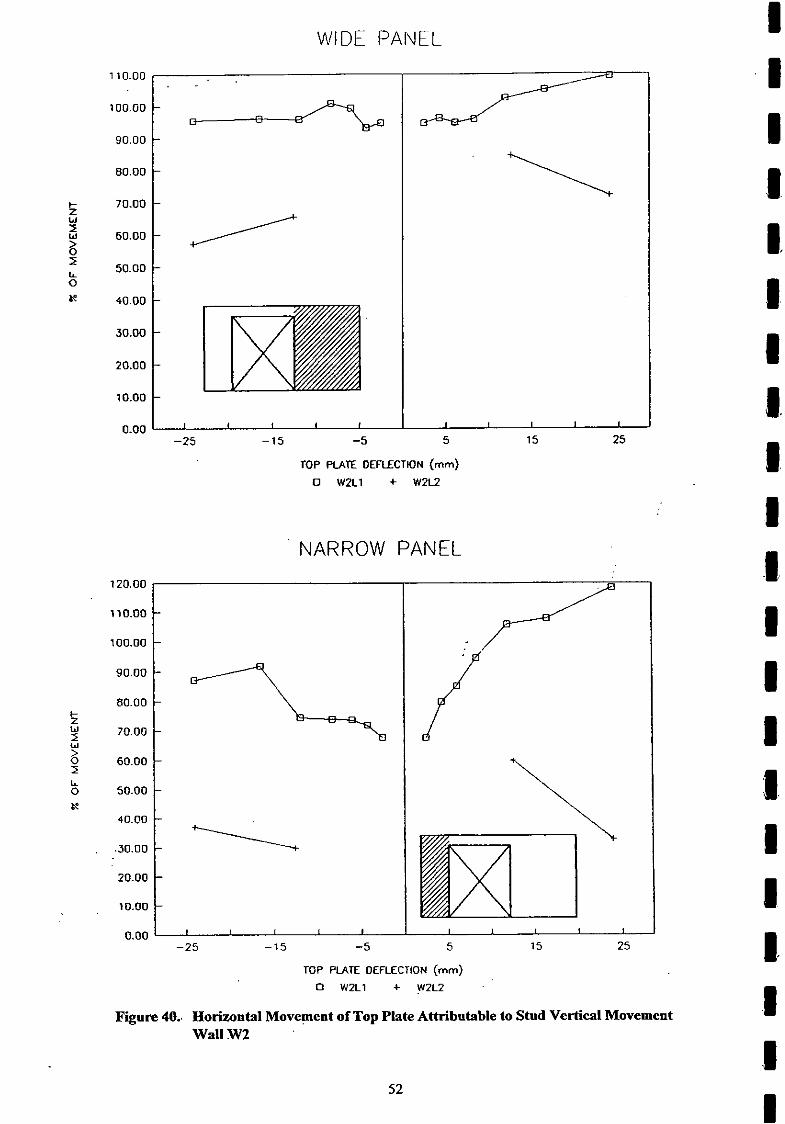
WIDE PANEL
0.00 I , I 1 I I I 1
-25 -15 -5 5
TOP PLATE DEFLECTON (mm) 0 WZL1 + W2L2
NARROW PANEL
TOP PLATE OEFLECTION (mm) 0 W2Ll + WZLZ
Figure 40.. Horizontal Movement of Top Plate Attributable to Stud Vertical Movement Wall W Z
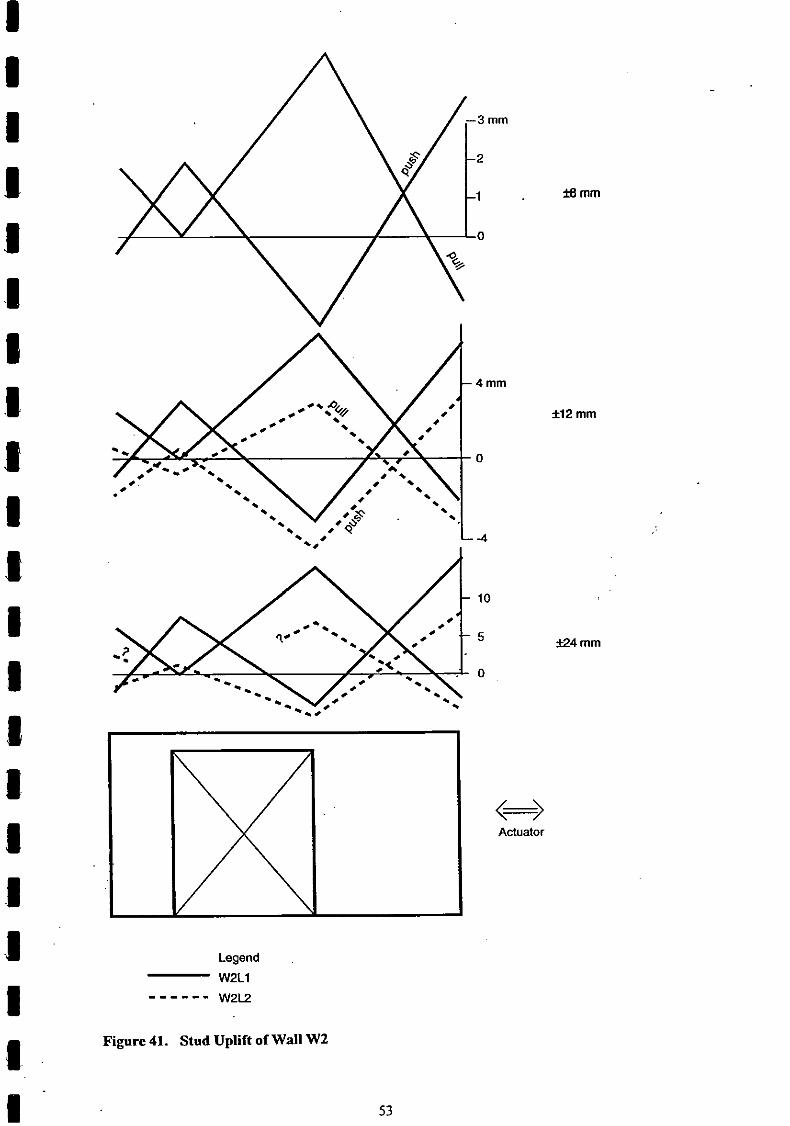
ffl mm
<=> Actuator
Legend W2L1 - - - - - - W2L2
Figure 41. Stud Uplift of Wall W2
4.6.4.2 Wall W2
The measured stud vertical movement is recorded in Table 7 and the horizontal deflection, Aq (from Equation 7) is compared with the applied deflection in Figure 40. This indicates that most of the applied deflection was due to rigid body rotation in wall W2L1. However, the end fasteners in W2L2 inhibited this rotation.
The stud uplift is plotted in Figure 41. There was far less uplift in W2L2 than there was in W2L1. However, the greater loads resisted by W2L2 and the preceding loading from W2L1 resulted in the panel corners settling more than they did with W2L1.
4.6.43 Wall W3
The measured stud vertical movement is recorded in Table 8 and the horizontal deflection-, Aq (from Equation 7) is compared with applied deflection in Figure 42. This indicates that most of the applied deflection was due to rigid body rotation, particularly at larger deflections in the walls sheathed on both sides.
The stud uplift is plotted in Figure 43 for applied deflections of 8 and 24 mm. (Proportioning was used where the applied deflections differed slightly from these target values.) The uplift was similar for all three walls except the small panel at the far end which translated (up or down, along with the adjacent end return wall) as well as rotated for walls W3L2 and W3L3.
4.6.4.4 Wall W4
The measured stud vertical movement is recorded in Table 9 and the horizontal deflection, Aq (from Equation 7) is compared with applied deflection in Figure 44. This indiktes that most of the applied deflection was due to rigid body rotation, particularly at larger deflections in the shorter panels.
The stud uplift is plotted in Figure 45 for applied deflectmns of 8 and 24 mm. Wall uplift around the centre door was high but stud sinking was low. This reflects the low loads resisted by this wall.
4.6.4.5 Wall W5
The measured stud vertical movement is recorded in Table 10 and the horizontal deflection, AR (from Equation 7) is compared with applied deflection in Figure 46. This indicates that most of the applied deflection was due to rigid body rotation, particularly at larger deflections in the shorter panels.
The stud uplift is plotted in Figure 47 for applied deflections of 8 and 24 mm. Vertical deflections at the wall opposite to the actuator were low, indicating that little vertical shear load was transferred across the adjacent doorway lintel. Uplift at the actuator end of the wall was less than at the other end of this panel, probably due to the additional gravity load carried by the end wall return.
A comparison of the vertical deflection profiles measured in all walls at 8 mm racking deflection is given in Figure 48.
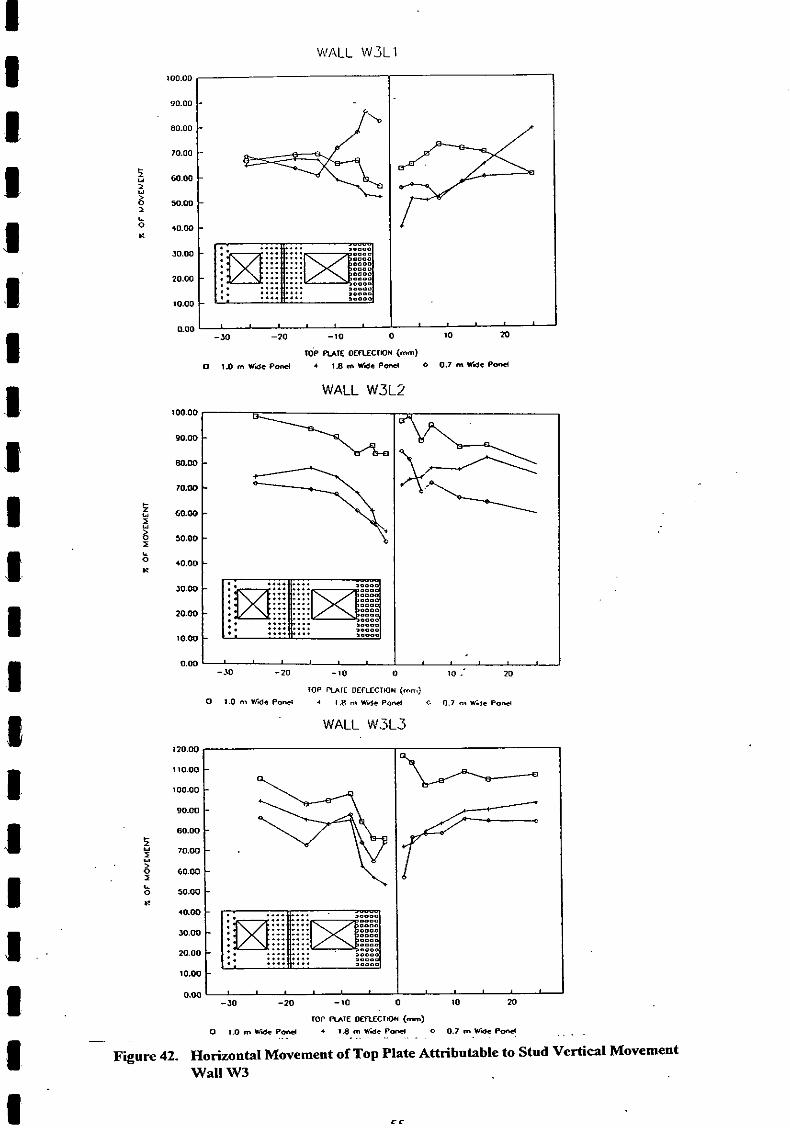
WALL W 3 L 1 100.00
90.00
,,I ' I -2n -20 -10 0 10 m
m~ RIE o c n m m (mm) 0 la m wdc P d * I s m Wac P o d 0 0.7 rn Wdc Pa*
W A L L W 3 L 2
WALL W 3 L 3
mp RI~E ooucrl~ (-) . . . . o n n m w a e P a ... + I s m u a c P o n c l . . . . . . . . o 0.7mwaepond - .
Figure 42. Horizontal Movement of Top Plate Attributable to Stud Vertical Movement Wall W3

push 8 mm
Legend - W3L1 -10 mm .......... ~ 3 ~ 2 ----- W3L3
..- 0 mm v - p ' ...........*
pull 8 mm
push 24 mm
p:. %. ..ya %a-. /.
;i'
pull 10 mm
-10 mm
<=> Actuator
Figure 43. Stud Uplift of Wall W3
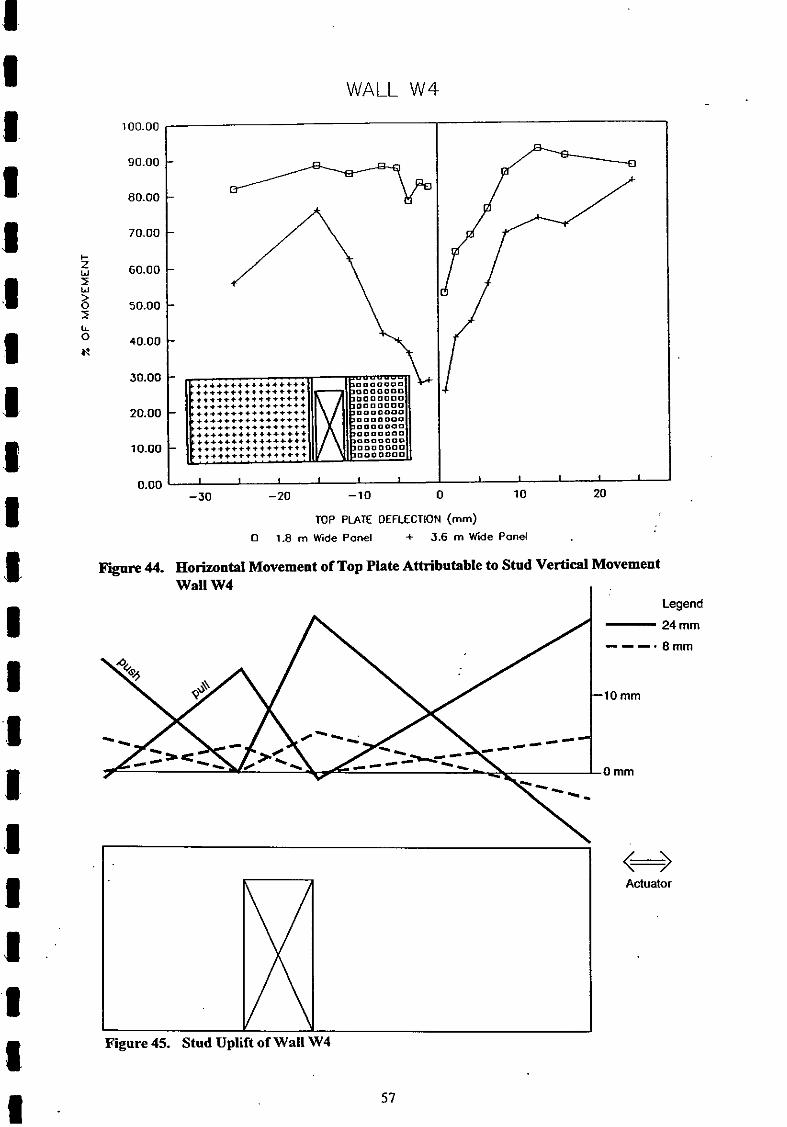
WALL W 4
TOP PLATE DEFLECTION (mm) 0 1.8 m Wide Panel + 3.6 m Wde Pand
Fire 44. Horizontal Movement of Top Plate Attributable to Stud Vertical Movement Wall W4 I :
Legend - 24mm - - - - 8 m m
-10 mm
0 mm
Figure 45. Stud Uplift of Wall W4
<=> Actuator

WALL Vd5
TOP PLATE OEFLECTION (mm) 0 2.65 m Wide Panel + 1.8 rn Wide Pond
Figure 46. ~ o t k o n t a l Movement of Top Plate Attributable to Stud Vertical Movement Wall W5
Legend - lomm - 2 4 m m ---- 8 m m
0 rnm
<=> Actuator
Figure 47. Stud Uplift of Wall W5

Legend
- Window Opening
--- Door Opening
Figure 48. Comparison of Wall Vertical Deflection Profiles at 8 mm Racking Deflection
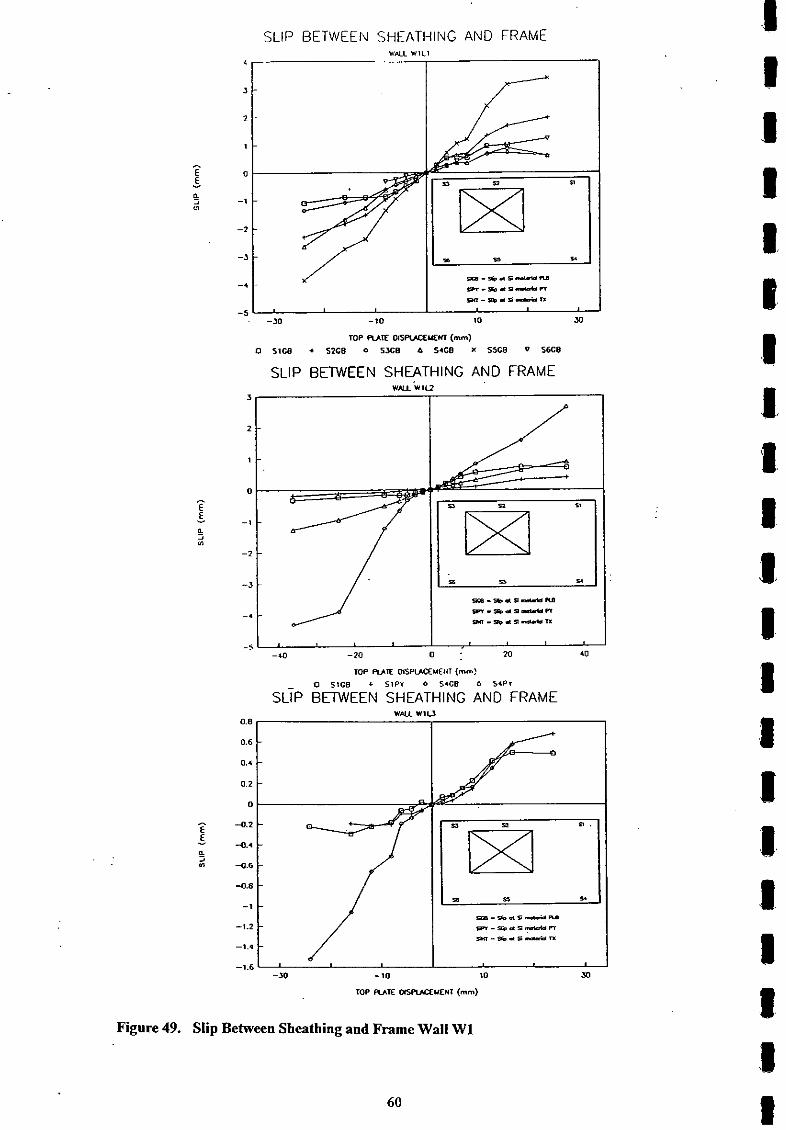
SLlP BETWEEN SHEATHING AND FRAME
SLlP BETWEEN SHEATHING AND FRAME WLLL'WIU
3 r
roe WE ~ P U C E U E H T (mm!
o SICB + SIP" o S<CB a SaPr
S ~ P BETWEEN SHEATHING AND FRAME
Figure 49. Slip Between Sheathing and Frame Wall W1
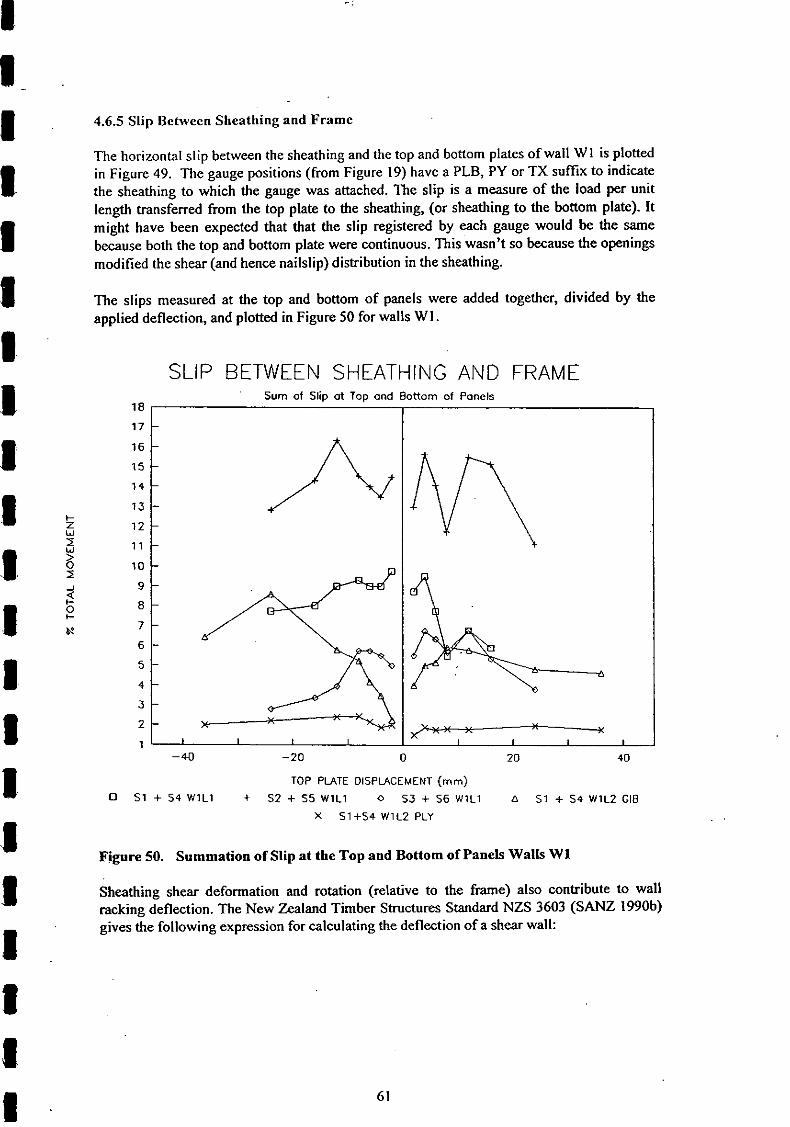
4.6.5 Slip Between Sl~eathing and Frame
The horizontal slip between the sheathing and the top and bottom plates of wall WI is plotted in Figure 49. The gauge positions (from Figure 19) have a PLB, PY or TX suffix to indicate the sheathing to which the gauge was attached. The slip is a measure of the load per unit length transferred from the top plate to the sheathing, (or sheathing to the bottom plate). It might have been expected that that the slip registered by each gauge would be the same because both the top and bottom plate were continuous. This wasn't so because the openings modified the shear (and hence nailslip) distribution in the sheathing.
The slips measured at the top and bottom of panels were added together, divided by the applied deflection, and plotted in Figure 50 for walls WI.
SLIP BETWEEN SHEATHING AND FRAME Sum of Slip ot Top and Bottom of Panels
TOP PLATE DISPLACEMENT (mm) 0 51 + 54 V4lLI t 52 + SS WlLl 0 53 + 56 WlLl A 51 + 5 4 W1L2 GI8
X 51+54 W1L2 PLY
Figure 50. Summation of Slip a t the Top and Bottom of Panels Walls W1
Sheathing shear deformation and rotation (relative to the frame) also contribute to wall racking deflection. The New Zealand Timber Structures Standard NZS 3603 (SANZ 1990b) gives the following expression for calculating the deflection of a shear wall:
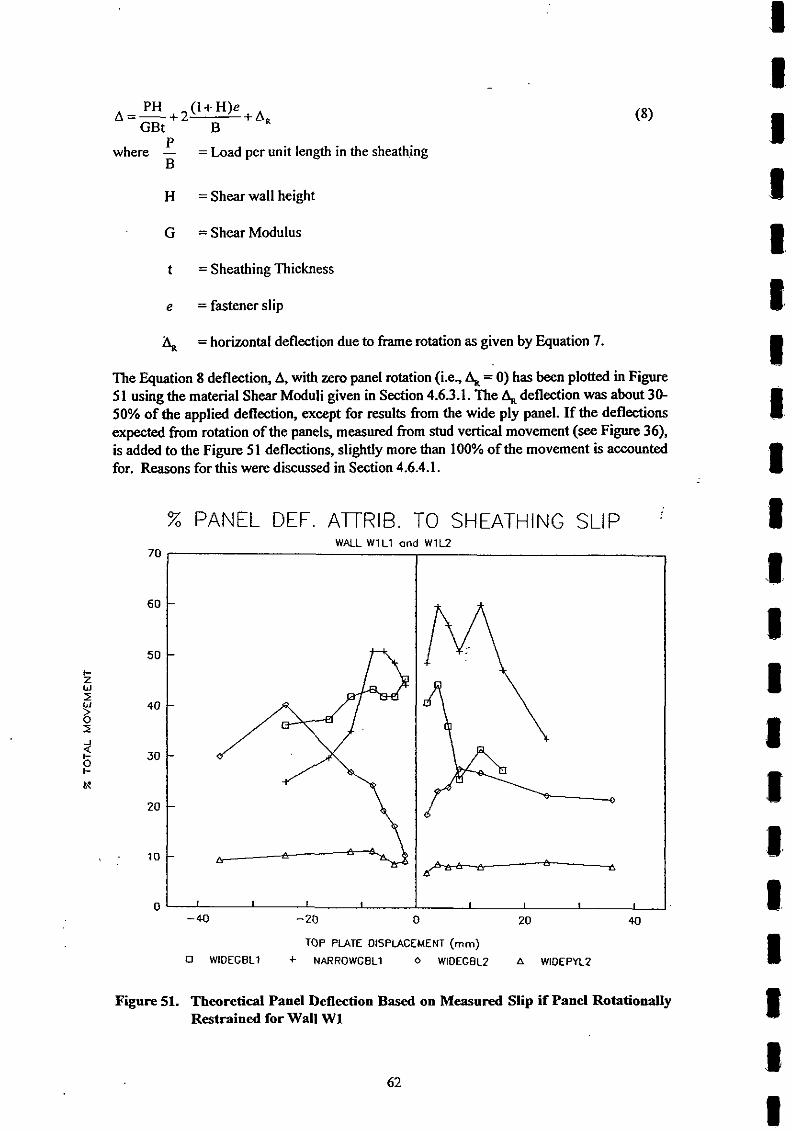
PH +2(1+ H)e A = - GBt B + 4
P where - = Load per unit length in the sheathing B
H = Shear wall height
G = Shear Modulus
t = Sheathing Thickness
e = fastener slip
& = horizontal deflection due to frame rotation as given by Equation 7.
l l e Equation 8 deflection, A, with zero panel rotation (i.e., 4, = 0) has been plotted in Figure 5 1 using the material Shear Moduli given in Section 4.63.1. The 4 deflection was about 30- 50% of the applied deflection, except for results from the wide ply panel. If the deflections expected from rotation of the panels, measud from stud vertical movement (see Figure 36), is added to the Figure 51 deflections, slightly more than 100% of the movement is accounted for. Reasons for this were discussed in Section 4.6.4.1.
% PANEL DEF. ATTRIB. TO SHEATHING SLIP
TOP PLATE DISPLACEMENT (mm) 0 WlDEGBLl + NARROWGBLl 0 WIOECBL2 A WIDEPYLZ
Figure 51. Theoretical Panel Deflection Based on Measured Slip if Panel Rotalionally Restrained for Wall W1

5.0 COMPARISON OF EXPERIMENTAL RESULTS AND THEORETICAL PREDICTIONS
Panel racking deflections due to nail slip between sheathing and framing and sheathing shear deformations can be calculated using the theory proposed by Patton-Mallory and McCutcheon (1987); (i.e., Equations 1 - 3 in Section 2.2.1). The theoly predicts the monotonic panel load-deflection curve for walls with complete rocking restraint. (With' cyclic loading this can be taken as the envelope, backbone or parent curve - all meaning the curve joining the hysteretic peak points.) The other major component of the horizontal deflection arises from panel rotation due to lifting of the studs at the tension end and crushing of the bottom plate beneath the stud at the compression end. (Deflection due to panel flexure is negligible.) A method of predicting this deflection component for panels with P21 Type end restraint is outlined in Appendix D. By combining these two deflection components a complete P21 load-deflection prediction can be made.
Load-deflection predictions were made for both the parent curve and the curve joining the residual peak loads at the fourth cycle, to the same deflection and for both rotationally restrained and P21 restrained walls (i.e., four theoretical predictions for each wall). The predictions were made using the nail slip envelope equations presented in Appendix D and were superimposed upon the load-deflection plots presented in Section 4.6.1. The methodology considered each panel between wall openings separately, then added the resultant panel load-deflection envelopes together to obtain total wall load-deflection envelopes.
The theory assumes that sheets rotate around their centroid, which is probably reasonable for the cladding. At comers, however, the lining was jointed to the wall returns. This would have imposed some additional restraint against slip between lining and framing at this location. Therefore, walls were expected to be stiffer and stronger than predicted.
The PLB sheets which were taped and stopped at the joints (between full height sheets) never failed in the test specimens, so the theoretical analysis forthis material assumed the sheets between openings were effectively combined into a single (wide) sheet.
The four total wall theoretical load-deflection relationships derived for each test wall (labelled 1 to 4 on the Section 4.6.1 graphs) are as follows:
1. The parent curve for the predicted wall load-displacement response with separated panels and complete uplift restraint;
2. The parent curve for the predicted wall load-displacement response with separated panels and P21 type uplift restraint;
3. The residual peak-load envelope for the predicted wall loaddisplacement response with separated panels and complete uplift restraint; and
4. The residual peak-load envelope for the predicted wall load-displacement response with separated panels and P21 type uplift restraint.
The theoretical load predictions were significantly higher than the experimental measurements for some plots, so the theoretical predictions were plotted to the correct scale until they "ran off' the plot. The theoretical predictions were then factored by a selected value to enable the theoretical curves to fit within the same plot borders as the experimental data. The unfactored and factored theoretical curves were joined by a "wiggly" line to indicate the change in scale and the factors (where used) are noted on the affected plots.

-omLD3-
Fire 52. All Wall Load Versus Deflection Hysteresis Plots
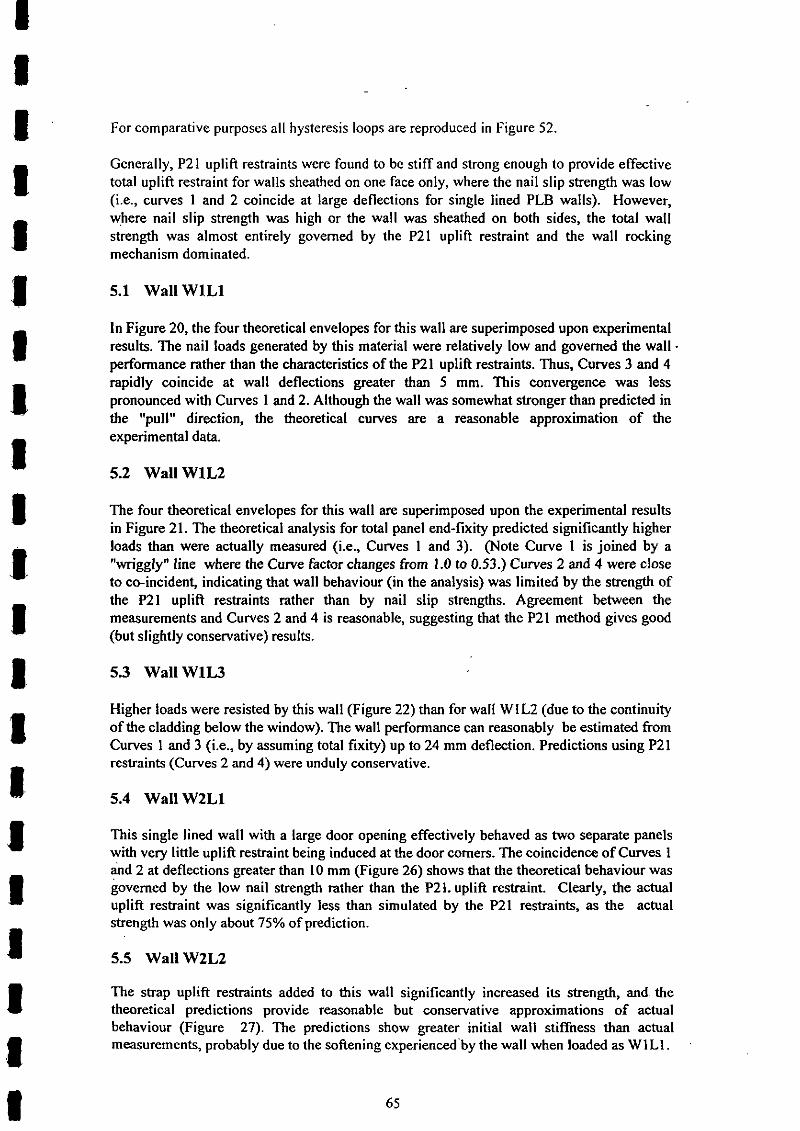
For comparative purposes all hysteresis loops are reproduced in Figure 52.
Generally, P21 uplift restraints were found to be stiff and strong enough to provide effective total uplift restraint for walls sheathed on one face only, where the nail slip strength was low (i.e., curves 1 and 2 coincide at large deflections for single lined PLB walls). However, where nail slip strength was high or the wall was sheathed on both sides, the total wall strength was almost entirely governed by the P21 uplift restraint and the wall rocking mechanism dominated.
5.1 Wall WlLl
In Figure 20, the four theoretical envelopes for this wall are superimposed upon experimental results. The nail loads generated by this material were relatively low and governed the wall. performance rather than the characteristics of the P21 uplift restraints. Thus, Curves 3 and 4 rapidly coincide at wall deflections greater than 5 mm. This convergence was less pronounced with Curves 1 and 2. Although the wall was somewhat stronger than predicted in the "pull" direction, the theoretical curves are a reasonable approximation of the experimental data.
5.2 Wall W1L2
The four theoretical envelopes for this wall are superimposed upon the experimental results in Figure 21. The theoretical analysis for total panel end-fixity predicted significantly higher loads than were actually measured (i.e., Curves 1 and 3). (Note Curve 1 is joined by a "wriggly" line where the Curve factor changes from 1.0 to 0.53.) Curves 2 and 4 were close to co-incident, indicating that wall behaviour (in the analysis) was limited by the strength of the P21 uplift restraints rather than by nail slip strengths. Agreement between the measurements and Curves 2 and 4 is reasonable, suggesting that the P21 method gives good (but slightly conservative) results.
5.3 Wall W l W
Higher loads were resisted by this wall (Figure 22) than for wall WIL2 (due to the continuity of the cladding below the window). The wall performance can reasonably be estimated from Curves 1 and 3 (i.e., by assuming total fixity) up to 24 mm deflection. Predictions using P21 restraints (Curves 2 and 4) were unduly conservative.
5.4 Wall W2L1
This single lined wall with a large door opening effectively behaved as two separate panels with very little uplift restraint being induced at the door corners. The coincidence of Curves 1 ahd 2 at deflections greater than 10 mm (Figure 26) shows that the theoretical behaviour was governed by the low nail strength rather than the P21. uplift restraint. Clearly, the actual uplift restraint was significantly less than simulated by the P21 restraints, as the actual strength was only about 75% of prediction.
5.5 Wall W2L2
The strap uplift restraints added to this wall significantly increased its strength, and the theoretical predictions provide reasonable but conservative approximations of actual behaviour (Figure 27). The predictions show greater initial wall stiffness than actual measurements, probably due to the softening experiencedby the wall when loaded as WlLI.
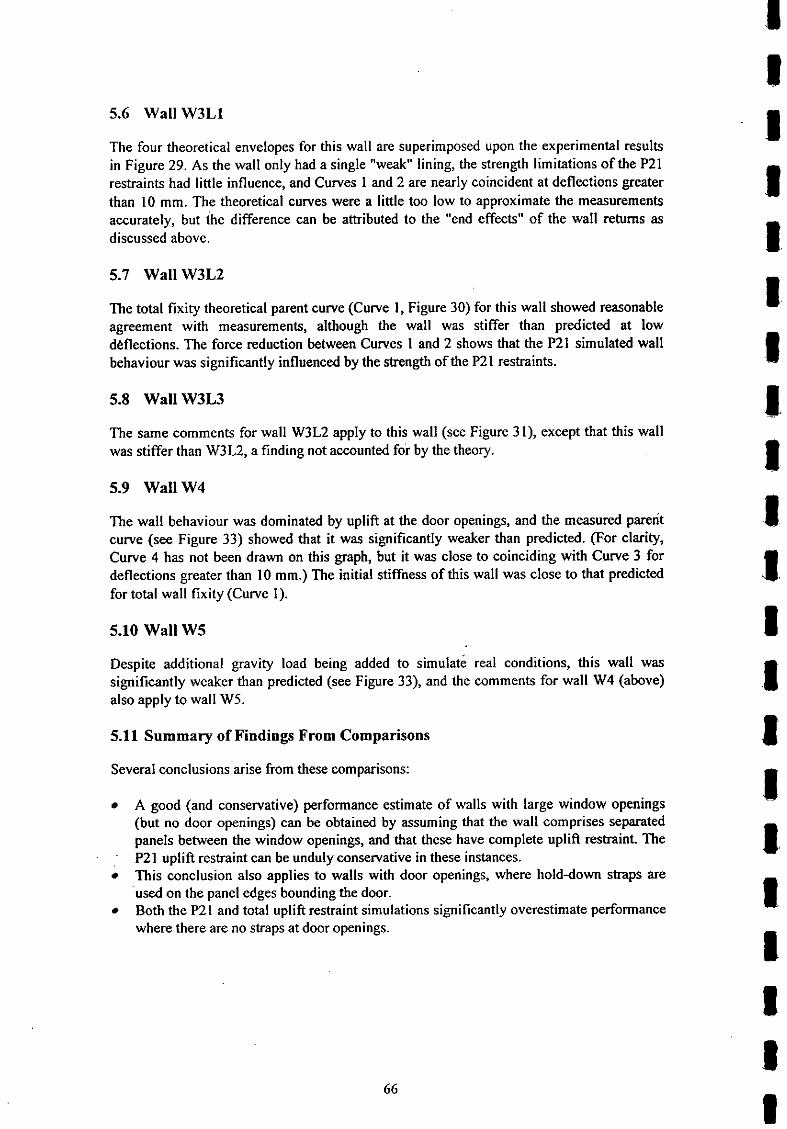
5.6 Wall W3L1
The four theoretical envelopes for this wall are superimposed upon the experimental results in Figure 29. As the wall only had a single "weak" lining, the strength limitations of the P21 restraints had little influence, and Curves 1 and 2 are nearly coincident at deflections greater than 10 mm. The theoretical curves were a little too low to approximate the measurements accurately, but the difference can be attributed to the "end effects" of the wall returns as discussed above.
5.7 Wall W3L2
The total fixity theoretical parent curve (Curve 1, Figure 30) for this wall showed reasonable agreement with measurements, although the wall was stiffer than predicted at low d8flections. The force reduction between Curves 1 and 2 shows that the P21 simulated wall behaviour was significantly influenced by the strength of the P21 restraints.
The same comments for wall W3L2 apply to this wall (see Figure 3 l), except that this wall was stiffer than W3L2, a finding not accounted for by the theory.
5.9 Wall W 4
The wall behaviour was dominated by uplift at the door openings, and the measured parerit curve (see Figure 33) showed that it was significantly weaker than predicted. (For clarity, Curve 4 has not been drawn on this graph, but it was close to coinciding with Curve 3 for deflections greater than 10 mm.) The initial stiffness of this wall was close to that predicted for total wall fixity (Curve 1).
5.10 Wall W 5
Despite additional gravity load being added to simulate real conditions, this wall was significantly weaker than predicted (see Figure 33), and the comments for wall W4 (above) also apply to wall W5.
5.11 Summary of Findings From Comparisons
Several conclusions arise from these comparisons:
A good (and conservative) performance estimate of walls with large window openings (but no door openings) can be obtained by assuming that the wall comprises separated panels behveen the window openings, and that these have complete uplift restraint The P21 uplift restraint can be unduly conservative in these instances. This conclusion also applies to walls with door openings, where holddown straps are used on the panel edges bounding the door. Both the P21 and total uplift restraint simulations significantly overestimate performance where there are no straps at door openings.
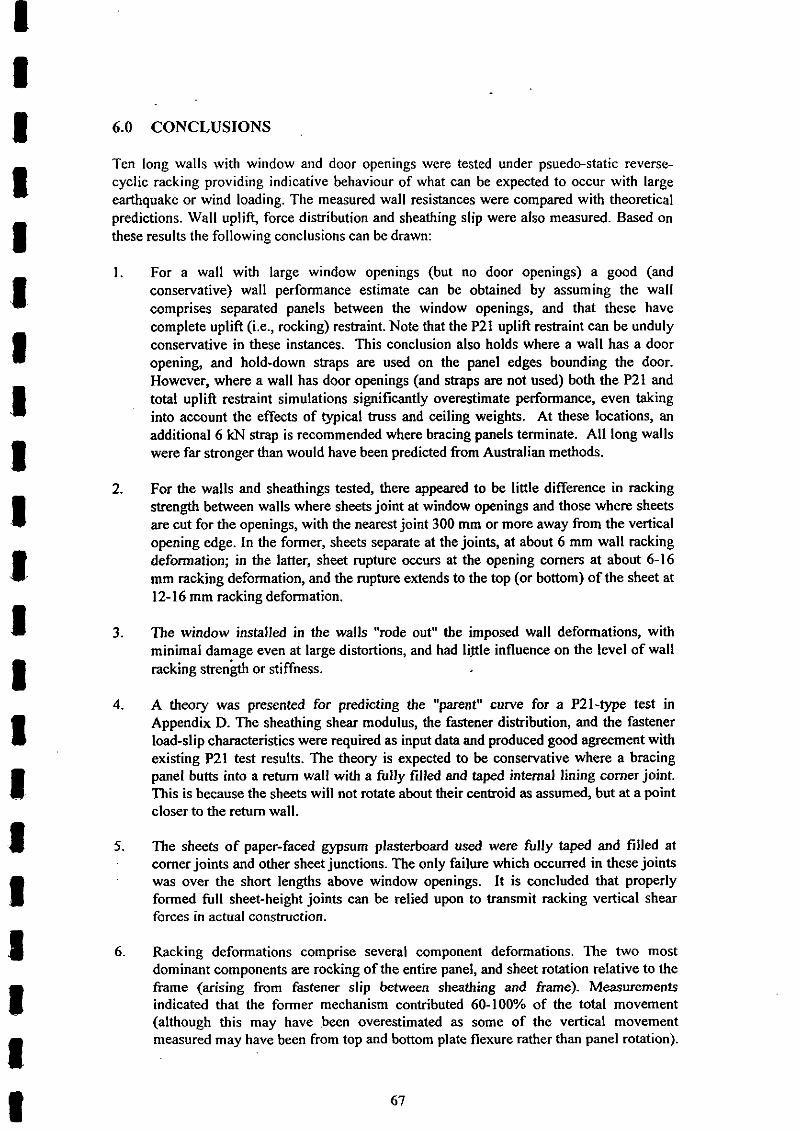
6.0 CONCLUSIONS
Ten long walls with window and door openings were tested under psuedo-static reverse- cyclic racking providing indicative behaviour of what can be expected to occur with large earthquake or wind loading. The measured wall resistances were compared with theoretical predictions. Wall uplift, force. distribution and sheathing slip were also measured. Based on these results the following conclusions can be drawn:
For a wall with large window openings (but no door openings) a good (and conservative) wall performance estimate can be obtained by assuming the wall comprises separated panels between the window openings, and that these have complete uplift (i.e., rocking) restraint. Note that the P21 uplift restraint can be unduly conservative in these instances. This conclusion also holds where a wall has a door opening, and hold-down straps are used on the panel edges bounding the door. However, where a wall has door openings (and straps are not used) both the P21 and total uplift restraint simulations significantly overestimate performance, even taking into account the effects of typical buss and ceiling weights. At these locations, an additional 6 kN strap is recommended where bracing panels terminate. All long walls were far stronger than would have been predicted from Australian methods.
For the walls and sheathings tested, there appeared to be little difference in racking strength between walls where sheets joint at window openings and those where sheets are cut for the openings, with the nearest joint 300 mm or more away from the vertical opening edge. In the former, sheets separate at the joints, at about 6 mm wall racking deformation; in the latter, sheet rupture occurs at the opening corners at about 6-16 mm racking deformation, and the rupture extends to the top (or bottom) of the sheet at 12-16 mm racking deformation.
The window installed in the walls "rode out" the imposed wall deformations, with minimal damage even at large distortions, and had liflle influence on the level of wall racking stre&h or stiffness.
A theory was presented for predicting the "parent" curve for a P21-type test in Appendix D. The sheathing shear modulus, the fastener distribution, and the fastener load-slip characteristics were required as input data and produced good agreement with existing P21 test results. The theory is expected to be conservative where a bracing panel butts into a return wall with a fully filled and taped internal lining corner joint. This is because the sheets will not rotate about their centroid as assumed, but at a point closer to the return wall.
The sheets of paper-faced gypsum plasterboard used were fully taped and filled at corner joints and other sheet junctions. The only failure which occurred in these joints was over the short lengths above window openings. It is concluded that properly formed full sheet-height joints can be relied upon to transmit racking vertical shear forces in actual construction.
Racking deformations comprise several component deformations. The two most dominant components are rocking of the entire panel, and sheet rotation relative to the frame (arising from fastener slip between sheathing and frame). Measurements indicated that the former mechanism contributed 60-100% of the total movement (although this may have been overestimated as some of the vertical movement measured may have been from top and bottom plate flexure rather than panel rotation).
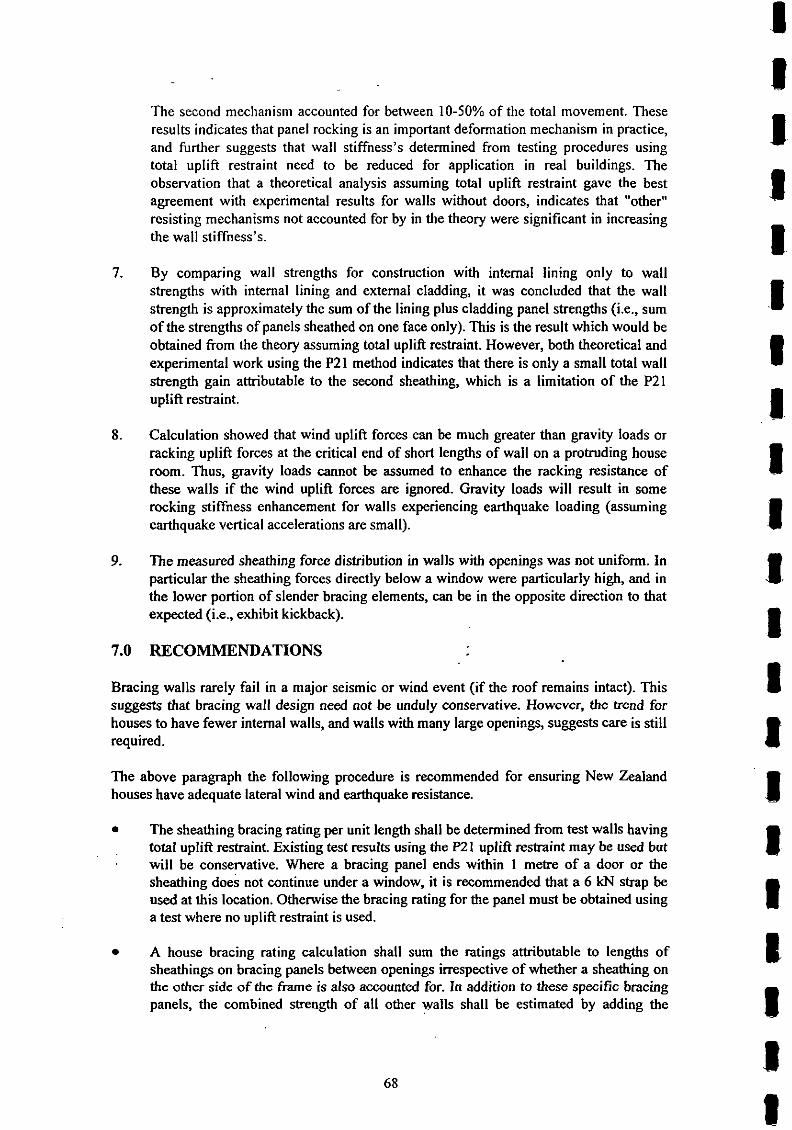
The second mechanism accounted for between 10-50% of the total movement. These results indicates that panel rocking is an important deformation mechanism in practice, and further suggests that wall stiffness's determined from testing procedures using total uplift restraint need to be reduced for application in real buildings. The observation that a theoretical analysis assuming total uplift restraint gave the best agreement with experimental results for walls without doors, indicates that "other" resisting mechanisms not accounted for by in the theory were significant in increasing the wall stiffness's.
7. By comparing wall strengths for construction with internal lining only to wall strengths with internal lining and external cladding, it was concluded that the wall strength is approximately the sum of the lining plus cladding panel strengths (i.e., sum of the strengths of panels sheathed on one face only). This is the result which would be obtained from the theory assuming total uplift restraint. However, both theoretical and experimental work using the P21 method indicates that there is only a small total wall strength gain attributable to the second sheathing, which is a limitation of the P21 uplift restraint.
8. Calculation showed that wind uplift forces can be much greater than gravity loads or racking uplift forces at the critical end of short lengths of wall on a protruding house room. Thus, gravity loads cannot be assumed to enhance the racking resistance of these walls if the wind uplift forces are ignored. Gravity loads will result in some rocking stiffness enhancement for walls experiencing earthquake loading (assuming earthquake vertical accelerations are small).
9. The measured sheathing force distribution in walls with openings was not uniform. in particular the sheathing forces directly below a window were particularly high, and in the lower portion of slender bracing elements, can be in the opposite direction to that expected (i.e., exhibit kickback).
7.0 RECOMMENDATIONS
Bracing walls rarely fail in a major seismic or wind event (if the roof remains intact). This suggests that bracing wall design need not be unduly conservative. However, the trend for houses to have fewer internal walls, and walls with many large openings, suggests care is still required.
The above paragraph the following procedure is recommended for ensuring New Zealand houses have adequate lateral wind and earthquake resistance.
The sheathing bracing rating per unit length shall be determined from test walls having total uplift restraint. Existing test results using the P21 uplift restraint may be used but will be conservative. Where a bracing panel ends within 1 metre of a door or the sheathing does not continue under a window, it is recommended that a 6 kN strap be used at this location. Otherwise the bracing rating for the panel must be obtained using a test where no uplift restraint is used.
A house bracing rating calculation shall sum the ratings attributable to lengths of sheathings on bracing panels between openings irrespective of whether a sheathing on the other side of the frame is also accounted for. In addition to these specific bracing panels, the combined strength of all other walls shall be estimated by adding the

lengths of these (nominal) walls and factoring by a nominal rating. h his is the Queensland practice - TRADAC 1992.)
The earthquake and wind forces specified in NZS 3604 (SANZ 1990) shall be taken from NZS 4203 (SNZ 1992) and factored by Feq or Fw, respectively, to account for torsion on the building and the non-uniform stiffness's of wall elements.
0 A procedure is being developed for evaluation of ultimate limit state bracing ratings from test results. The earthquake design load can be obtained directly from the test wall hysteresis loops using Deam's (1994) computer analysis program (which overcomes the dificulty of assigning a ductility factor and yield point to the measured tests hysteresis loops). The wind design load shall be taken as 0.9 times the maximum resisted load on the test specimen (in the weakest direction) to account for weakening under wind turbulence effects.
The evaluation must also consider serviceabilitv. It is recommended that serviceabilitv - forces be taken as the ultimate limit state bracing ratings (from the paragraph above) factored by the ratio of serviceability to ultimate loads from NZS 4203 (SANZ 1992). It is also recommended that the test wall should exhibit no significant damage or deflect more than 8 mm at the serviceability loads.
If the above procedure is adopted, it is recommended that a theoretical study be made of the maximum size for a window opening can be before it is necessary for 3 or 6 kN uplift restraints to be used at studs bounding the window.
The work in this report has shown that if additional uplift restraints are used at door (and large window) boundary studs, wall performance is reasonably represented by summation of the tested component bracing panels, derived using total panel uplift fixity. For a given set of hysteresis loops the earthquake bracing rating can be.determined from analysis of the hysteresis loops using Deam's (1994a) method, and the wind bracing reading found directly from the peak resisted loads. This approach is being developed further in a separate BTL study, so that earthquake evaluation of test hysteresis loops can be achieved by extraction of critical parameters from the loops. This avoids the need to run Dean's program. However, for prediction of total house performance in extreme winds and earthquakes it is necessary to also include the effects of gravity load resisting uplift, wind uplift, torsion and load distribution effects and influence of non-structural elements. Without undertaking many expensive full house racking tests, it is necessary to further develop computer models to investigate effects of these parameters.
To take advantage of the detailed experimental results presented in this report, it is recommended that they be used to calibrate the computer model recommended above. This can be done by using the MSA computer package (held by BRANZ) and m e a s u d nail slip and uplift properties. The theoretical model can then be used to study the influence of other variables such as axial load, window opening size etc. on single walls; eventually, this can be extended to full house modelling.
9.0 REFERENCES
American Society for Testing and Materials (ASTM). 1976. Standard method for static load test for shear resistance of framed walls for buildings, ASTM E564, Philadelphia., USA
American Society for Testing and Materials. (ASTM) 1980. The standard method of conducting strength testes of panels for building construction. ASTM Designation E 72, Philadelphia, PA, USA.
Boughton, G.N. and Reardon, G.F. 1984. Simulated cyclone wind tests on a timber framed house. Proc. Pacific Timber Engineering Conf. Vol2, pp 527-534, Auckland New Zealand.
Boral Plasterboards, 1992. Structural Wall Bracing, Boral, Melbourne.
British Standards Institute (BSI), 1985. Materials testing machines and force verification equipment. BS 16 10. London.
BRANZ 1992. Fix list for bracing elements. Building Research Association of New Zealand. Judgeford, New Zealand.
Carney, J.M. 1975. Bibliography on wood and plywood diaphragms. Journal of the Structural Division, ASCE, 101, ST1 1: pp 2423 - 2436.
Ceccotti, A and Vignoli, A, 1991. Seismic behaviour of low-rise portal frames. Proc. workshop Watford U.K. Aug. 23-30, 1991. Full-scale behaviour of wood-framed buildings. North Carolina State University, Raleigh, USA.
Collins, M.J. 1977. Effect of window opening on wall racking stiffness. Forest products Laboratory Reports. Timber Engineering No. FPKE 79. Rotoma, New Zealand.
Cooney, RC. 1979. The structural performance of houses in earthquakes. Bulletin of the New Zealand national Society for Earthquake Engineering 12 (3): 223-237.
Cooney, RC. and Collins, M.J. 1979 (revised 1982, 1987, 1988). A wall bracing test and evaluation procedure. Building Research Association of New Zealand Technical Paper P2 1. Judgeford, New Zealand.
Deam, B.L. 1994a. Seismic behaviour and design of multi-stored plywood sheathed shear walls, PhD. thesis under preparation. Canterbury University, Christchurch, New Zealand.
Deam, B.L. 1994b. Seismic analysis of house pile foundation systems. Building Research Association of New Zealand, Study Report (in press). Judgeford, New Zealand.
Deam, B.L., Dean, J.A. and Buchanan A.H. 1991. Full scale testing of 3-storey plywood sheathed sheanvalls, Proceedings, Pacific Conference on Earthquake Engineering, Vol 3 - 357, Auckland, New Zealand.
Dean, J.A., Moss, P.J. and Stewarf W. 1984. A design procedure for rectangular openings in sheanvalls and diaphragms. Proc. Pacific Timber Engineering Conf. Vol 2, pp 513-518, Auckland New Zealand.
Dean J.A., Stewart, W.G., Cam, A.J. 1986. The seismic behaviour of plywood sheathed sheanvalls. Bulletin, New Zealand National Society for Earthquake Engineering 19(1): 48-63.
Dean, J.A. and Lapish, E.B. 1989. The lateral bracing properties of gibraltar board sheathed walls, Proceedings, Second Pacific Timber Engineering Conference, 3: 25-30 Auckland, New Zealand.
Dean, J.A. and Lapish, E.B. 1989. Gibraltar board sheathed bracing walls. Unpublished report by CLC Consulting Group for Winstone Wallboards.
Dishongh, B.E. and Fowler, D.W. 1980. Structural performance of gypsum paneled shear walls for mobile homes. Report. MH4., Dept. of Civil Eng. Univ. of Texas at Austin, Austin, ~ e & , U.S.A.
Dolan, J.D. 1989. The dynamic response of timber shear walls. Unpublished Ph.D. Thesis, The University of British Colombia, Vancouver, Canada.
Dolan, J.D. and Foschi, RO. 1989. Structural analysis model for timber shear walls. Structural Design, Analysis and Testing Proceedings of the sessions at Structures Congress '89, San Francisco, CA, USA.
Easley, J.T. and Dodds, R.H. 1982. Formulas for wood shear walls, Journal of the Structu~'?l Division, ASCE Vol 108, No. ST1 I.
Ewing, R.D., Kariotis J.C., kEl-Must apha, A. 1987. LPWI. A computer program for the non linear, lynamic analysis of lumped parameter models. US-Japan Co-ordinated program for Masonry Building Research Report 2(3):1.
Falk, RH. and Itani , R.Y. 1989. Finite element modelling of wood diaphragms. ASCE Journal of the Structural Division, Vol 115, No 3, pp. 543-559.
Foschi, RO. 1977. Analysis of wood diaphragms and trusses. Part 1: Diaphragms. Canadian Journal of Civil Engineering 4(3): 345-352.
Ge, Y.E., Gopalaratnam, V.S., Liu, H. 1991. Effect of openings on the stiffness of wood- frame walls. Forest Products Journal 41(1): 61-70.
Gerlich, J.T. 1987 The end restraint of timber framed panels in wall bracing tests. Building Research Association of New Zealand Study Report SR2. Judgeford, New Zealand.
Golledge, B., Clayton, T., Reardon, .G. (undated). Racking performance of plasterboard-clad steel stud walls. Report prepared for Lysaght Building Industries, BHP, Australia. Report also available from James Cook Cyclone Testing Station, Queensland, Australia.
Gupta, A.K. and Kuo, G.P. 198Sa:. Behaviour of wood-framed shear walls. J. Struct. Eng., Vol 1 l I, No 8, ASCE Pap 19946.
Gupta, A.K. and Kuo, G.P. 1987. Wood-framed shear walls with uplifting. Journal of Structural Engineering. 113(2): 241-259.

Gupta, A.K. and Kuo, G.P. 1987. Modelling of a wood-framed house. Journal of Structural Engineering 113(2): 260-278.
Gupta, A.K. and Stalnaker, J.J. 1991. Modelling of the building behaviour under wind and earthquake forces. Proc. workshop Watford U.K. Aug. 23-30, 1991. Full-scale behaviour of wood-framed buildings. North Carolina State University, Raleigh, USA.
Hayashi, K. 1988. Studies on methods to estimate the racking resistance of houses with wooden wall panel sheathed. 1988 International Conference on Timber Engineering, Washington State University, USA, pp. 774-781.
Housner, G.W. et al. 1971. Engineering features of the San Fernando earthquake. Report 71- 02. California Inst. of Tech. Earthquake Engineering Research Laboratory. Pasadena, California, USA.
ICBO, 1991. Uniform Building Code, Whittier, U.S.A.
Itani, RY. and Cheung C.K. 1984. Non-linear analysis of sheathed wood diaphragms. Journal of the Structural Division, asce, 110 (S): 2137-2147.
Kamiya, F., Yoshihiko, H., Hatayama, Y. and Kanaya, N. 1981. Studies on wood-panel construction. Ef f s t on racking resistance of bearing wall due to testing methods and wall length. Bulletin of the Forestry and Forest Products Institute No 3 15. Ibaraki, Japan.
King, A.B. and Lim, K.Y.S. 1991. Supplement to P21: an evaluation method of P21 test results for use with NZS 36041990. Building Research Association of New Zealand Technical Recommendation No. 10. Judgeford, New Zealand.
Kuo, G.P. and Gupta, A.K. 1989. A three dimensional macro-element model for wood- framed buildings. Dept. of Civil Eng. North Carolina State University, Raleigh, North Carolina, USA.
McCutcheon, W.J. 1985. Racking deformations in wood shear walls. Journal of Structural Engineering, ASCE, 11 1(2):257-269.
Moss, P.J. 1991. The performance of low-rise timber buildings in New Zealand when subjected to seismic, wind and snow loads. Proc. workshop Watford U.K. Aug. 23-30, 1991. full-scale behaviour of wood-framed buildings. North Carolina State University Raleigh, USA.
Ochiumi, K., Yasumuru, M. and Murota, M. 1990. Design procedure for wood-framed buildings using bussed frame models. Proc International Timber Engineering Conference, Vol 1, pp 155-163, Oct. 1990, Tokyo, Japan.
Patton-Mallory, M., Gutkowski, RM. and Soltis. 1984. Racking Performance of Light-Frame Walls Sheathed on Two Sides. US Department of Agriculture Forest Service, Forest Products Laboratory, USA
Patton-Mallory, M. and McCutcheon, W.J. 1987. Predicting racking performance of walls sheathed on both sides. Forest Products Journal, 39(a): 27-32.
Reardon, G.F. 1980. Recommendations for the testing of roofs and walls to resist high wind forces. Technical Report No. 5. Cyclone Testing Station, James Cook Structural Testing Station, Queensland.
Reardon, G.F. 1988. Effects of Non-structural Cladding on Timber Framed House Construction, Proceedings, International Conference on Timber Engineering, Seattle, Vol2: pp 287-281.
Reardon, G.F. 1989. Effect of Claddings on the Response of Houses to Wind Forces, Proceedings, Second Pacific Timber Engineering Conference, Auckland Vol 2: pp 101-105, Auckland, New Zealand.
Reardon, G.F. 1990. Simulated cyclone wind loading of a Nu-steel house. Technical Report No. 36. Cyclone Testing Station, James Cook Structural Testing Station, Queensland.
Shephard et al. 1990. The Lorna Prieta California Earthquake of October 17 1989. Report of NZNSEE Reconnaissance Team. Bulletin, New Zealand National Society for Earthquake Engineering 23(1).
Standards Association of Australia (SAA) 1992. National timber framing code. Australian Standard, AS 1684, Sydney, Australia
Standards Association of New Zealand, (SANZ) 1990a. Code of practice for light timber frame buildings not requiring specific design. New Zealand Standard, NZS 3604. Wellington. New Zealand.
Standards Association of New Zealand (SANZ) 1990b. Code of practice for timber design. New Zealand Standard, NZS 3603. Wellington. New Zealand.
Standards Association of New Zealand (SANZ) 1992. General structural design and design loadings for buildings. New Zealand Standard, NZS 4203. Wellington. New Zealand.
Stewarf W.G., Dean, J.A. and Cam, A.J. 1984. The seismic performance of timber sheathed shearwalk, Proceedings, Pacific Timber Engineering Conference, Auckland, Vol. 2: 486-495.
Stewart, W.G. 1987. The seismic design of plywood sheathed sheanvalls. Unpublished Ph.D. Thesis, Department of Civil Engineering, University of Canterbury, New Zealand, 395 PP.
Stewart, A.G., Goodman, J.R., Kliewer, A, Salsbury, E.M. 1988. Full-scale tests of manufactured houses under simulated wind loads, Proceedings, International Conference on Timber Engineering, Seattle, Vol. 2: pp 97-1 11.
Stewart, W.G. and Dean, J.A. 1989. A procedure for the seismic design of timber sheathed sheanvalls, Proceedings, Second Pacific Timber Engineering Conference, Auckland, Vol. 2: pp 273-282.
Sugiyama, H, Andoh, N., Hirano, S. Uchisako, T., Nakamum, N. 1988. Full scale test on a Japanese type of two-story wooden house subjected to lateral load. International Conf. on Timber Eng. 1988, Proc., Vol2,pp 55-61.

Tinsell, J.R. and Rose, J.D. 1988. Plywood end walls in mobile homes. Res. Rept. 151. Am. Plywood Assoc. Tacoma, Wash. USA.
Tissell, J.R. 1990. Structural panel shear walls. Research report 154. America Plywood Association, Tacoma, Washington, USA.
Suzuki, S. 1990. Effect of cross-walls on lateral stiffness of light-frame buildings. Proc International Timber Engineering Conference, Vol 1, pp 140-146, Oct. 1990, Tokyo, Japan.
Thurston, S.J. and Flack, P.F. 1980. Cyclic load performance of timber sheathed bracing walls. Report 5-80110, Central Laboratories, Ministry of Works, Wellington, 90 pp.
Thurston, S.J. 1984. In-plane cyclic shear tests on ply-sheathed bracing walls, Report 5-8412, Central Laboratories, Ministry of Works, Wellington, 155 pp.
Thurston, S.J. and Hutchison, D.L. (1984) Cyclic load testing of timber-sheathed wall panels, Proceedings, Pacific Timber Engineering Conference, Auckland, 2: 496-503.
Timber Research and Advisory Council of Queensland (TRADAC) 1992.. Timber framing manual;, W60C.
Tuomi, R.L. and McCutcheon, W.J. 1974. Testing a full scale house under simulated snow loads and windloads. Research paper FPL234. USA Forest Sew., Forest Prod. Lab.
Walker, R 1986. Earthquakes and domestic housing. Earthquake Engineering Symposium, Sydney.
Yasumura, M., Nishiyama, I., Murota, T., Yamaguchi, N. 1988. Experiments on a three- storey wooden frame building subjected to horizontal load. 1988 International Conference on Timber Engineering, Washington State University, pp. 262-275.
Yasumum, M. 1991. Structural research on wood-framed construction in Japan. Proc. workshop Watford U.K. Aug. 23-30, 1991. Full-scale behaviour of wood-framed buildings. North Carolina State University Raleigh, USA.
Winstones, 1991. Gibraltar Board Wall Bracing Systems. Winstone Wallboards Ltd., Auckland.
Wolfe, R. 1983. Contribution of gypsum wallboard to racking resistance of light-frame walls. Research Paper FPL 439. Department of Agriculture, Forest Service, Forest Products Laboratory, Madison, USA.
Yokel, F.Y. and Hsi, G. 1973. Full scale test on a two-storey house subjected to lateral load. Building Science Series 44. US Dept. of Commerce, Centre for Building Technology, Institute for Applied Technology, National Bureau of Standards, Washington, D.C.
Yoon,T. and Gupta, A.K. (1991) Behaviour and failure modes of low rise wood-framed buildings subjected to seismic and wind forces. Dept. of Civil Eng. North Carolina State University, Raleigh, North Carolina, USA.
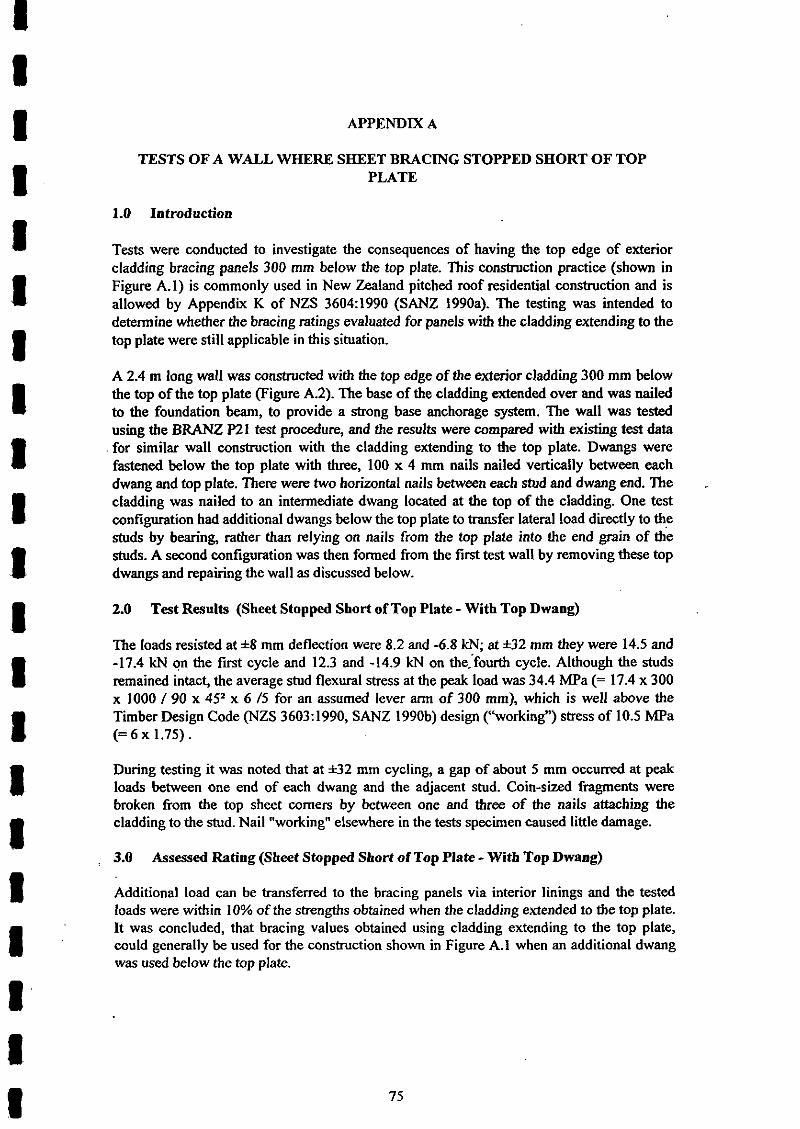
APPENDIX A
TESTS O F A WALL WHERE SHEET BRACING STOPPED SHORT O F TOP PLATE
1.0 Introduction
Tests were conducted to investigate the consequences of having the top edge of exterior cladding bracing panels 300 mm below the top plate. This construction practice (shown in Figure A.l) is commonly used in New Zealand pitched roof residential construction and is allowed by Appendix K of NZS 3604:1990 (SANZ 1990a). The testing was intended to determine whether the bracing ratings evaluated for panels with the cladding extending to the top plate were still applicable in this situation.
A 2.4 m long wall was constructed with the top edge of the exterior cladding 300 mm below the top of the top plate (Figure A.2). The base of the cladding extended over and was nailed to the foundation beam, to provide a strong base anchorage system. The wall was tested using the BRANZ P21 test procedure, and the results were compared with existing test data for similar wall construction with the cladding extending to the top plate. Dwangs were fastened below the top plate with three, 100 x 4 mm nails nailed vertically between each dwang and top plate. There were two horizontal nails between each stud and dwang end. The cladding was nailed to an intermediate dwang located at the top of the cladding. One test configuration had additional dwangs below the top plate to transfer lateral load directly to the studs by bearing, rather than relying on nails from the top plate into the end grain of the studs. A second configuration was then formed from the fust test wall by removing these top dwangs and repairing the wall as discussed below.
2.0 Test Results (Sheet Stopped Short of Top Plate - With Top Dwaog)
The loads resisted at +8 mm deflection were 8.2 and -6.8 kN; at *32 mm they were 14.5 and -17.4 kN on the fust cycle and 12.3 and -14.9 kN on the,'fourth cycle. Although the studs remained intact, the average stud flexural stress at the peak load was 34.4 MPa (= 17.4 x 300 x 1000 / 90 x 4 S x 6 /5 for an assumed lever arm of 300 mm), which is well above the Timber Design Code (NZS 3603: 1990, SANZ 1990b) design ("working") stress of 10.5 MPa (= 6 x 1.75).
During testing it was noted that at 2~32 mm cycling, a gap of about 5 mm occurred at peak loads between one end of each dwang and the adjacent stud. Coin-sized Fragments were broken from the top sheet corners by between one and three of the nails attaching the cladding to the stud. Nail "working" elsewhere in the tests specimen caused little damage.
3.0 Assessed Rating (Sheet Stopped Short of Top Plate - With Top Dwang)
Additional load can be transferred to the bracing panels via interior linings and the tested loads were within 10% of the strengths obtained when the cladding extended to the top plate. It was concluded, that bracing values obtained using cladding extending to the top plate, could generally be used for the construction shown in Figure A.l when an additional dwang was used below the top plate.
4.0 Further Tests (Sheet Stopped Short of Top Plate - Without Top Dwang)
The specimen was repaired by replacing nails at damaged sheet locations and the top dwang was removed. An additional 100 x 4 mm vertical nail was added between stud and top plate at each end of the panel and also at one intermediate stud, i.e., studs 1,4 and 5. The specimen was retested to i 4 0 mm and resisted loads of 12 and -12.6 kN during the first cycle and 9.8 and -1 1.2 kN at the fourth cycle. Stud 2 broke on the first pull cycle and the slip between the stud and top plate was *20 mm at studs 3 and 4 and *10 mm at studs 1 and 5. However, studs 1 and 5 pulled away from the cladding at the five highest cladding nails in each stud. The specimen was then cycled to 60 mm with peak resisted loads of 12.8 and -10.1 kN during the first cycle and 6.2 and 7.4 kN during the fourth cycle. The horizontal slip at studs 3 and 4 was h40 mm.
5.0 Plots
Indicative test hysteresis plots are shown in Figures A.3 (with top dwang) and A.4 (without top dwang).
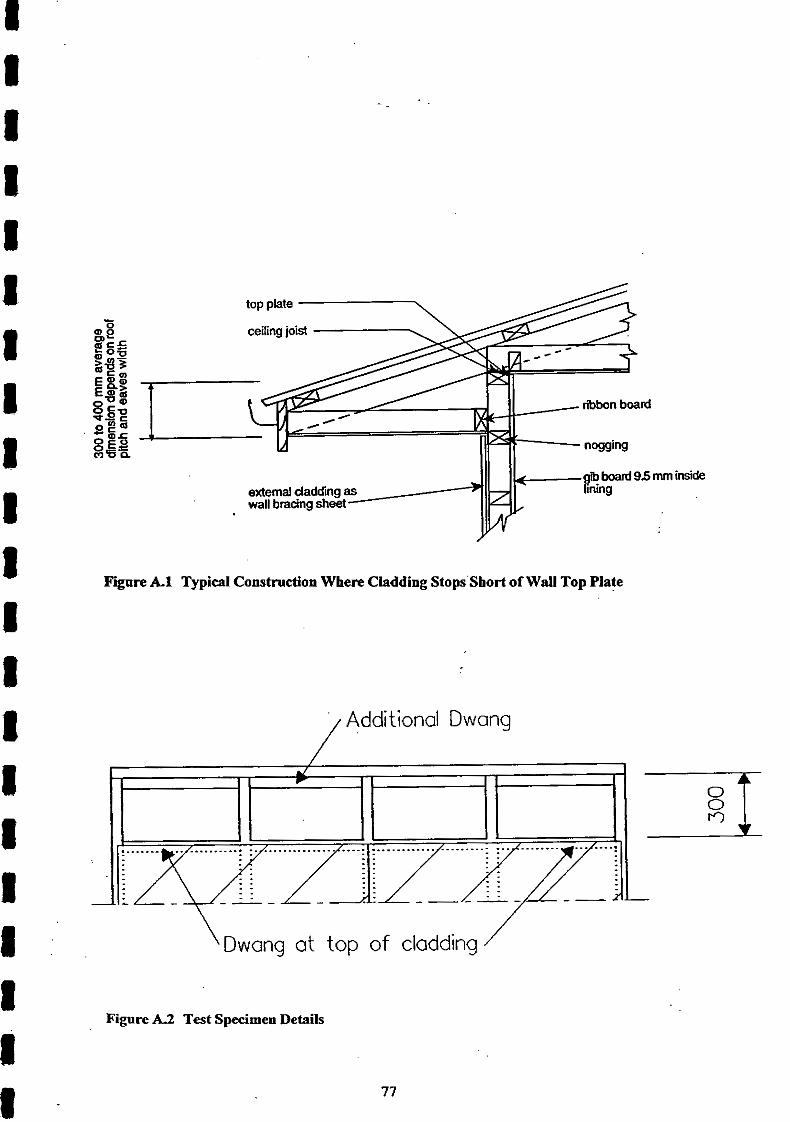
Finre A1 Typical Construction Where Cladding StopsShort of Wall Top Plate
/ Additional Dwang
\Dwang at top of cladding /
Figure A2 Test Specimen Details
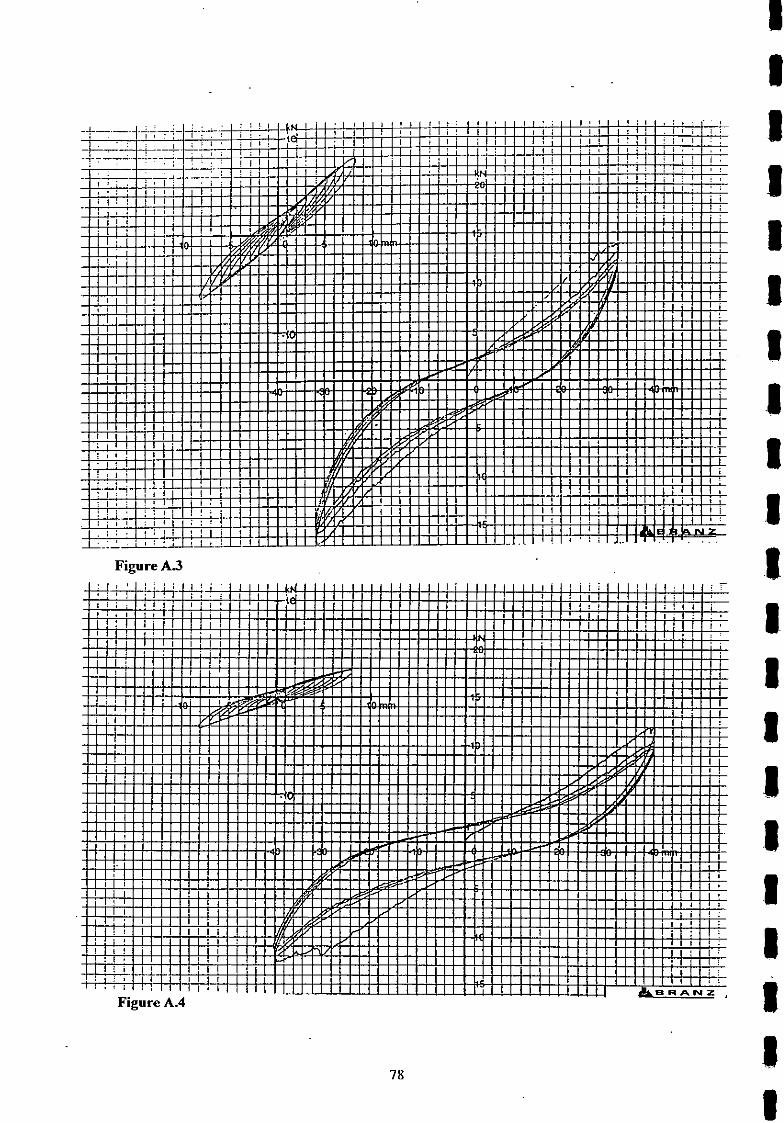
Figure A 3
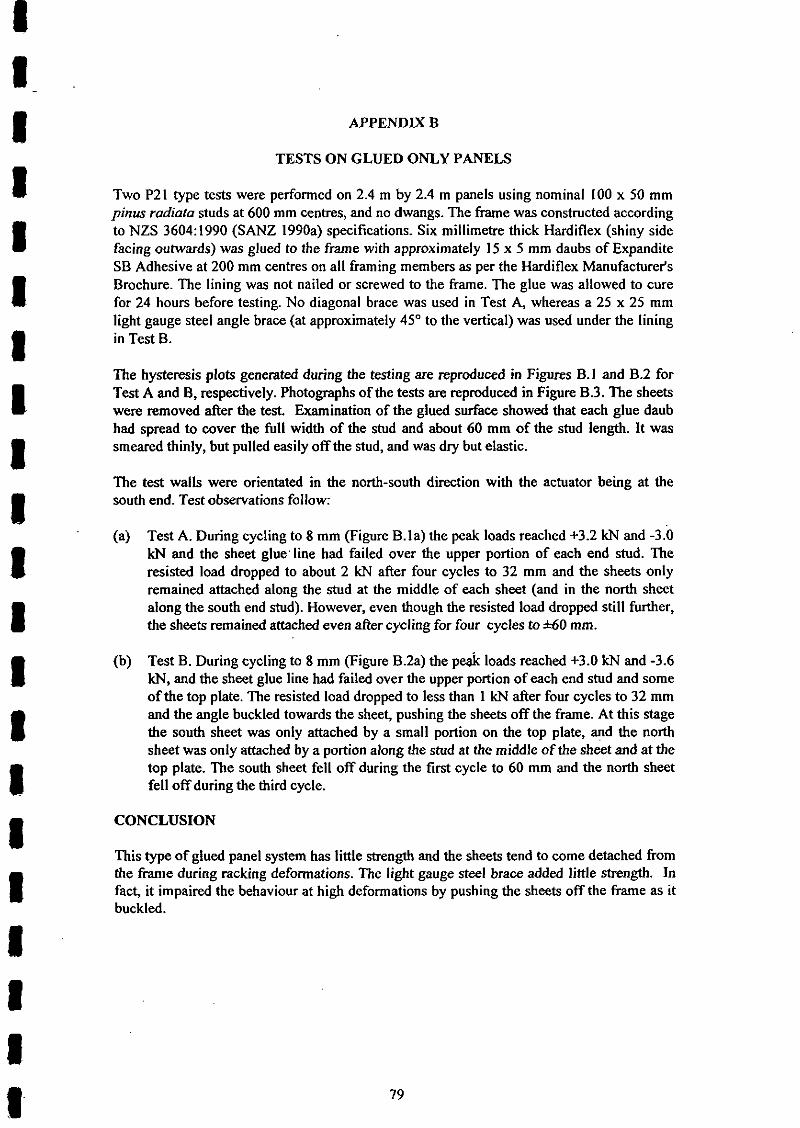
APPENDIX B
TESTS ON GLUED ONLY PANELS
Two P21 type tests were performed on 2.4 m by 2.4 m panels using nominal 100 x 50 mm pinus radiata studs at 600 mm centres, and no dwangs. The frame was constructed according to NZS 3604:1990 (SANZ 1990a) specifications. Six millimetre thick Hardiflex (shiny side facing outwards) was glued to the frame with approximately 15 x 5 mm daubs of Expandite SB Adhesive at 200 mm centres on all framing members as per the Hardiflex Manufacturer's Brochure. The lining was not nailed or screwed to the frame. The glue was allowed to cure for 24 hours before testing. No diagonal brace was used in Test A, whereas a 25 x 25 mm light gauge steel angle brace (at approximately 45" to the vertical) was used under the lining in Test B.
The hysteresis plots generated during the testing are reproduced in Figures 9.1 and B.2 for Test A and 9, respectively. Photographs of the tests are reproduced in Figure B.3. The sheets were removed after the test Examination of the glued surface showed that each glue daub had spread to cover the full width of the stud and about 60 mm of the stud length. It was smeared thinly, but pulled easily off the stud, and was dry but elastic.
The test walls were orientated in the north-south direction with the actuator being at the south end. Test observations follow:
(a) Test A. During cycling to 8 mm (Figure B.la) the peak loads reached +3.2 kN and -3.0 kN and the sheet glwline had failed over the upper portion of each end stud. The resisted load dropped to about 2 kN afier four cycles to 32 mm and the sheets only remained attached along the stud at the middle of each sheet (and in the north sheet along the south end stud). However, even though the resisted load dropped still further, the sheets remained attached even after cycling for four cycles to 6 0 mm.
(b) Test B. During cycling to 8 mm (Figure B.24 the peak loads reached +3.0 kN and -3.6 kN, and the sheet glue line had failed over the upper portion of each end stud and some of the top plate. The resisted load dropped to less than 1 kN after four cycles to 32 mm and the angle buckled towards the sheet, pushing the sheets off the frame. At this stage the south sheet was only attached by a small portion on the top plate, and the north sheet was only attached by a portion along the stud at the middle of the sheet and at the top plate. The south sheet fell off during the first cycle to 60 mm and the north sheet fell off during the third cycle.
CONCLUSION
This type of glued panel system has little strength and the sheets tend to come detached from the frame during racking deformations. The light gauge steel brace added little strength. In fact, it impaired the behaviour at high deformations by pushing the sheets off the frame as it buckled.
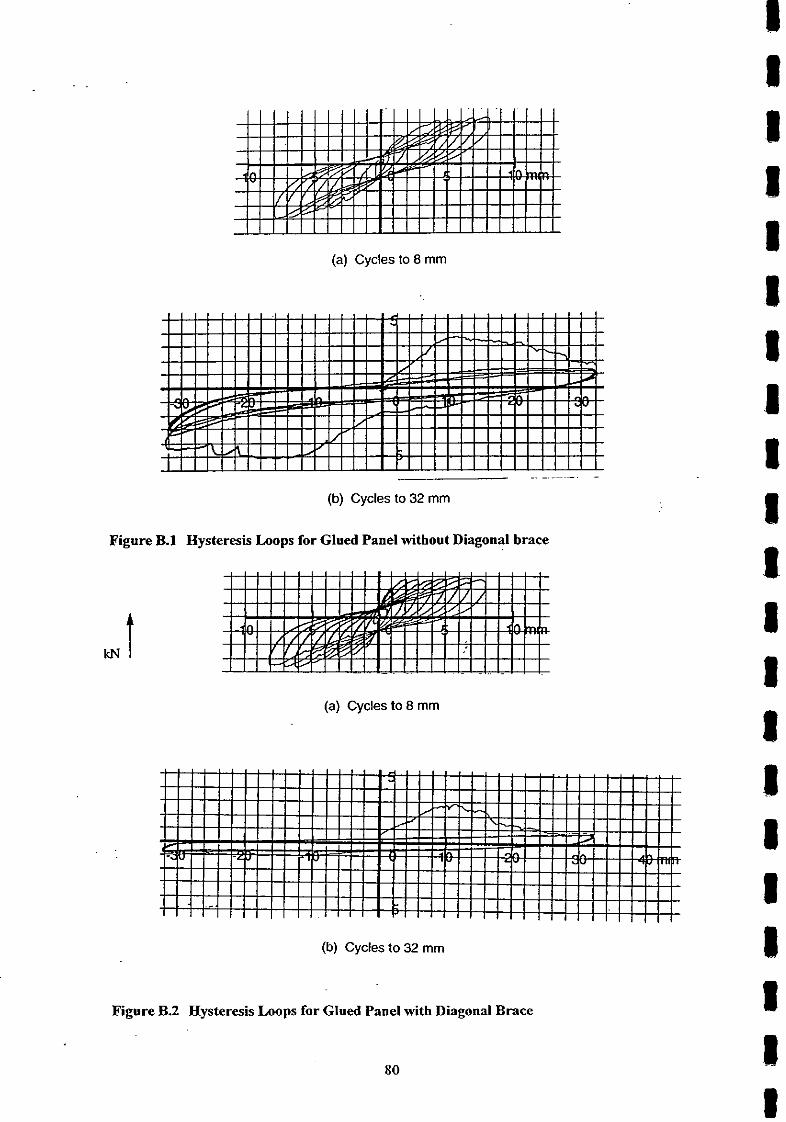
(a) Cycles to 8 mm
(b) Cycles to 32 mm
Figure B.l Hysteresis Loops for Glued Panel without Diagonal brace
(a) Cycles to 8 mm
(b) Cycles to 32 mm
Figure B.2 Hysteresis Loops for GIued Panel with Diagonal Brace
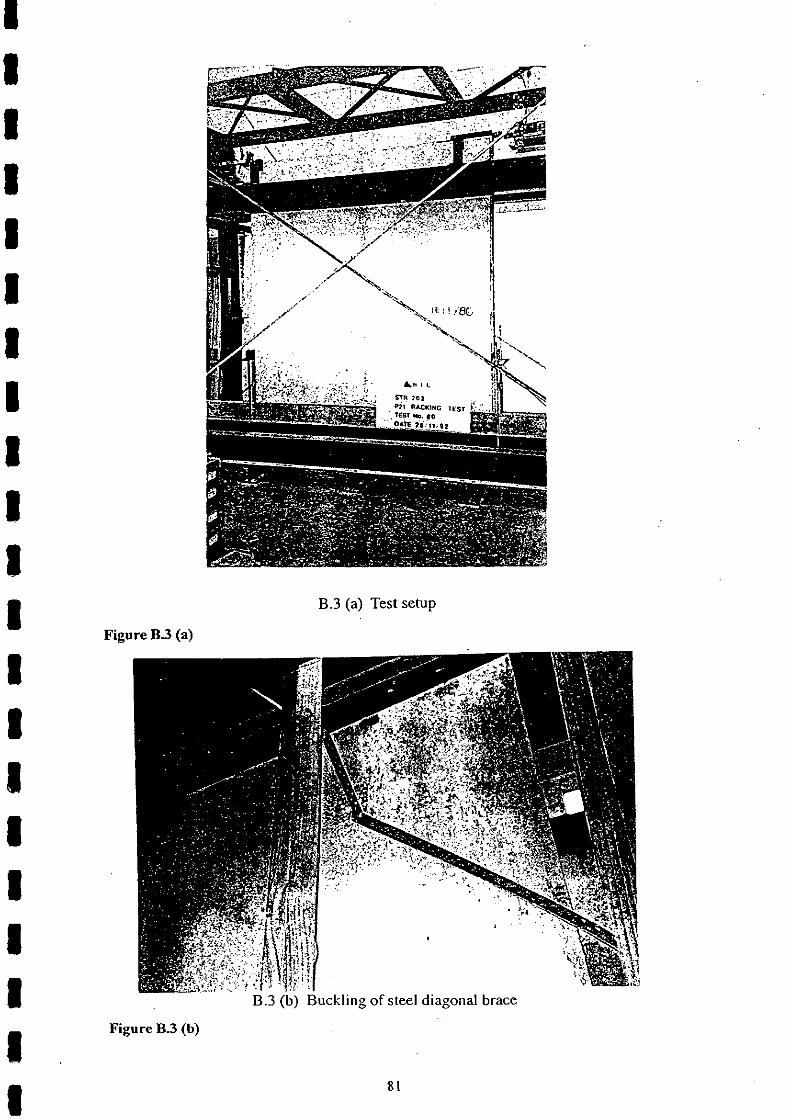
B.3 (a) Test setup
Figure B.3 (a)
Figure B.3 (b)
8 1

APPENDIX C
NAIL PULLOUT TESTS
Section 8 of the main text recommends that computer modelling be used to extend the test results. This will need to model the strength and stiffness under uplift load of the wall nailed connection to the foundation beam. The data presented below measures the uplift strength of this nailed connection.
Nail pull-out tests were performed on 10 samples using an A-grade Instron Test Machine as sketched in Figure C.2. Load rate was 1 kNIminute. A typical load-displacement curve is shown in Figure C.1. This was plotted by the test machine after the test using the measured load and displacement of the machine crossheads. It is considered that the first linear portion of the curve represented a combination of nail head embedment, elastic deflection of the component timber "beams", and crosshead deformation of the MSTRON Test Machine. It was assumed that there was no slip of the nail in the particle board or timber over this zone. Subsequently there is some load drop-off, which represented the nail withdrawing from the bottom timber rail, but no slip of the nail relative to the particle board. The second load drop- off represented the nail withdrawing from both materials and the load deformation curve represented the kinetic friction for this action. This load sometimes increased again due to wedging action when the driven nail was actuaIly slightly skewed. The test results are summarised in Table C.1. Nail head embedment at the end of the test was small.
A second series of nail withdrawal tests were performed on the timber top plate to stud connection. Two flat head nails were driven through the top plate into the end grain of the stud. However, the members were of section 90 x 45 mm rather than 90 x 35 mm (as used in the walls reported in the main text), and the nails were 100 x 4 mm rather than-the 75 x 3.15 mm used in the walls. Ten "Tee-shaped" specimens were assembled from two 300 mm long members. The simulated top plate formed the top horizontal portion of the "Tee". The top plate was clasped 50 mm either side of the stud and this was pulled by the top plate of the BTL Dartec machine. The stud was screwed to a metal device attached to the bottom platen of the Dartec. Load was measured with a 10 kN A-grade load cell and loaded at a rate of 2 kN per minute. The average peak load of 2.05 kN (i.e., 1.025 kNlnail) was similar to that of the bottom plate to timber foundation beam connection.

TABLE C.1 RESULTS OF NAIL PULL-OUT TESTS (Refer to Figure C.l)
Spec. Deform. First Second Deform. Resid. Load at Notes No. at l kN Peak Peak at 2nd Load 6 mm
Load * Load Load Peak Deform. (mm) OcN) 1 (mm) OcN) (-1 A B C D E F
NPI 0.58 1.06 1.35 1.20 0.68 1.01 1 NP2 0.52 0.79 1.20 0.89 0.77 0.82 1 NP3 0.50 1 .09 1.42 1.12 0.93 1.10 1 NP4 0.53 --- 0.87 0.46 0.54 1.68 2 NP5 0.54 0.94 1.14 1.33 0.73 1.09 3 NP6 0.57 1.17 1.35 0.92 0.85 1.25 3 NP7 0.46 - 1.22 0.55 0.53 0.60 4 NP8 0.58 0.85 1.27 0.84 0.93 1.78 3 NP9 0.58 --- 1.15 0.48 0.75 1.11 4 , M I 0 0.58 --- 1.79 0.73 0.97 1.43 4
1 A V E 0.50 0.98 1.32 0.90 0.79 1.13
* Where the force at the first peak was less than 1 kN, the deformation was extrapolated to 1 kN.
NOTES
1. Typical plot as per Fig. C.l (which actually plots sample NPI).
2. This plot had only a single peak before dropping to E and then the load rose strongly, somewhat like the dotted line in Fig C.1. Nail was skewed. Values ignored when obtaining average.
3. As per plot in Figure C.l, but load rose somewhat l i e the dotted line in Figure C.1. The nail was slightly skewed .
4. As per plot in Figure C.1 but second peak lower than the first. The second peak value was ignored.
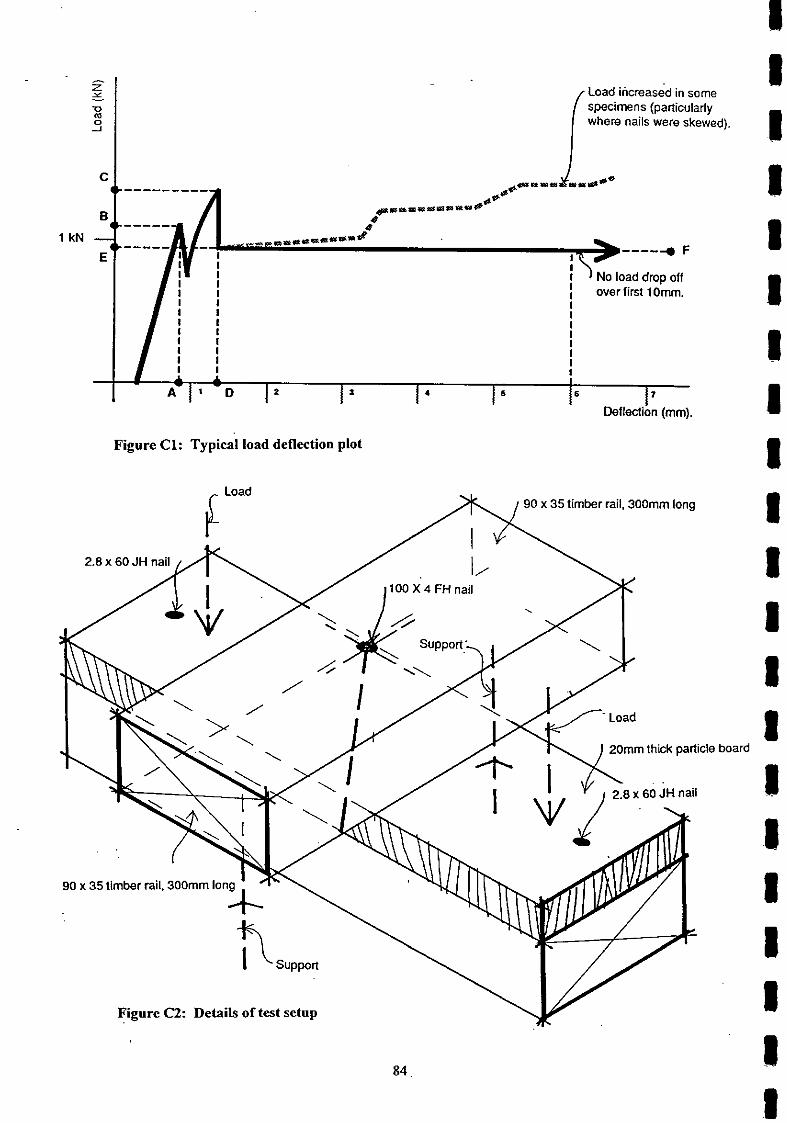
Figure C1: Typical load deflection plot
90 x 35 timber rail. 300mm long
20mm thick particle board
.I 90 x 35 timber rail. 300mm Ion I
I Figure C2: Details of test setup 1
90 x 35 timber rail. 300mm long
2.8 x 60 JH nail
20mm th~ck part~cle board
I 90 x 35 timber rail. 300mm Ion I
APPENDIX D
DERIVATION OF PARENT CURVES FOR P21 TYPE TESTS FROM NAIL SLIP DATA
D.l Introduction and Overview
Panel racking deflections due to nail slip between sheathing and framing and sheathing shear deformations, can be calculated using the theory proposed by Patton-Mallory and McCutcheon (1987); (i.e., equations 1 - 3 in Section 2.2.1 of the main text). The other major component of the horizontal deflection was due to panel rotation from lifting of the studs at the tension end and crushing of the bottom plate at the compression end. (Deflection due to panel flexure is negligible.)
This appendix describes a method for combining these two major deflection components and predicting the parent curve (i.e., envelope for panel load-deflection relationships) for P21 tests. The FORTRAN computer program listed at the end of this appendix was used for this purpose.
Only partial end restraint is allowed in a P21 test (discussed in more detail in Section 2.1.1 of the main text). Past P21 test results were re-analysed to obtain the relationship between racking load and racking displacement attributable to panel end vertical movement. Load versus deflection relationships were derived for various panel lengths, sheathing materials, and fasteners by adding the theoretical displacements for full panel end restraint ( h m Patton-Mallory and McCutcheon 1987), to the displacements attributed to end vertical movement (from re-analysis of past P21 test results). These theoretical curves are compared with actual P21 test measurements in this Appendix.
The computer program was used to calculate the cumulative parent curve for all of the component panel bracing lengths between openings for each of the long walls described in this report. These predicted results are compared with the experimental measurements.
D.2 Fastener LoadISlip Relationships
Nail slip specimens were fabricated as shown in Figure D.l using the BRANZ BTL Structures Laboratory Standard Procedure No 5. Three monotonic and three cyclic tests were performed on each of the TX, PLB, and PY sheathings, using the same nails as used in the wall tests described in the main text. The tests were performed in a Dartec Test Machime. A clevis (screwed into the top platen of the test machine) was screwed to the centre rail of the test specimen to transmit the load to the sheets through the lightly nailed test joint. The sheets were nailed heavily to the outer rails and screwed to a second clevice attached to the bottom platen of the Dartec Test Machine. Slip between the outside and inside rails was measured with two 20 mm potentiometers (accurate to 025%) and the averaged slip measurements are reported herein. Test load and displacement readings were recorded using an IBM compatible PC running a s o h a r e program to record the data.
The cyclically tested specimens were loaded for two cycles to M.4 and il.O mm slip and then four cycles to i 2 and M mm slip between the rails, before a final pull to failure. The loading rate was at approximately 20 seconds per cycle. The monotonically tested specimens were loaded at a rate of 5 kN per minute.
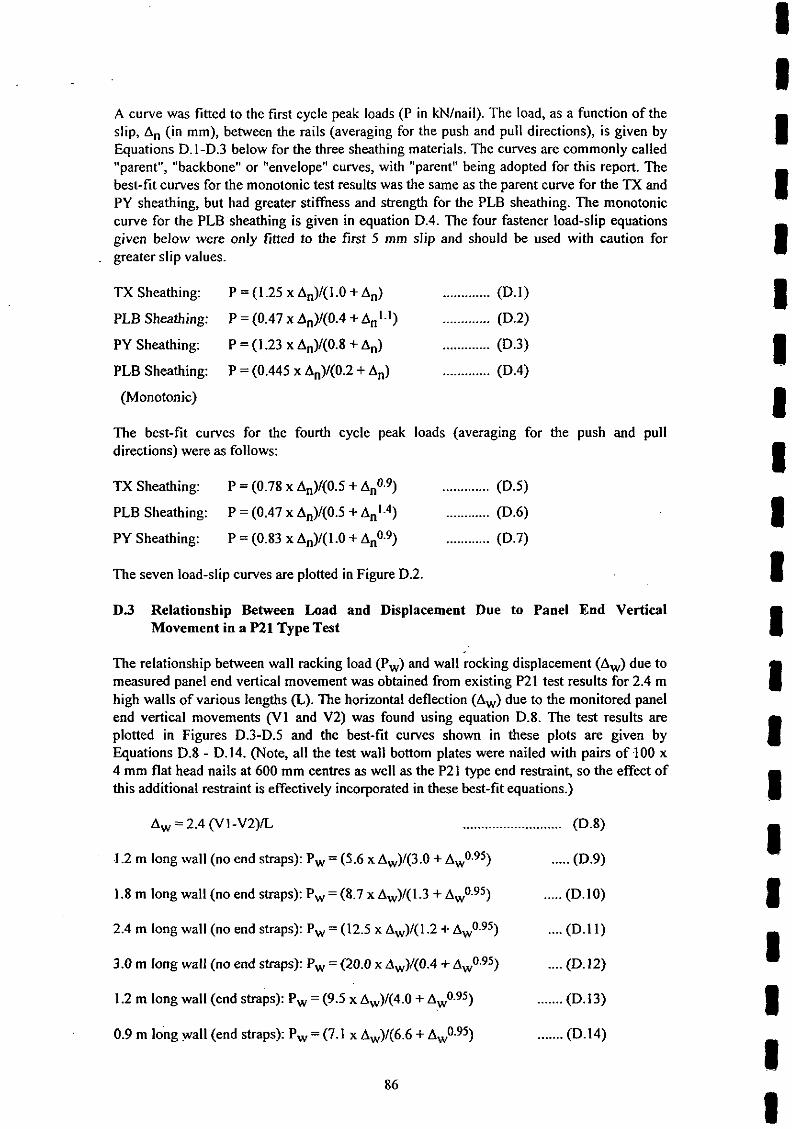
A curve was fitted to the first cycle peak loads (P in kN/nail). The load, as a function of the slip, An (in mm), between the rails (averaging for the push and pull directions), is given by Equations D.l-D.3 below for the three sheathing materials. The curves are commonly called "parent", "backbone" or "envelope" curves, with "parent" being adopted for this report. The best-fit curves for the monotonic test results was the same as the parent curve for the TX and PY sheathing, but had greater stiffness and strength for the PLB sheathing. The monotonic curve for the PLB sheathing is given in equation D.4. The four fastener load-slip equations given below were only fitted to the first 5 mm slip and should be used with caution for greater slip values.
TX Sheathing: P = (1.25 x An)/(l.O +An) ............. (D.1)
PLB Sheathing: P = (0.47 x An)/(0.4 + Anl.I) ............. (D.2)
PY Sheathing: P = (1.23 x An)/(0.8 +An) ............. 0 3 )
PLB Sheathing: P = (0.445 x An)/(0.2 +An) ............. (D.4)
(Monotonic)
The best-fit curves for the fourth cycle peak loads (averaging for the push and pull directions) were as follows:
TX Sheathing: P = (0.78 x An)/(0.5 + A ~ ~ . ~ ) ............. (D.9
PLB Sheathing: P = (0.47 x An)/(0.5 + ............ (D.6)
PY Sheathing: P = (0.83 x An)/(l.O + A,O.~) ............ (D.7)
The seven load-slip curves are plotted in Figure D.2
D 3 Relationship Between Load and Displacement Due to Panel End Vertical Movement in a P21 Type Test
The relationship between wall racking load (P,) and wall rocking displacement (Aw) due to measured panel end vertical movement was obtained from existing P21 test results for 2.4 m high walls of various lengths (L). The horizontal deflection (Aw) due to the monitored panel end vertical movements (V1 and V2) was found using equation D.8. The test results are plotted in Figures D.3-D.5 and the best-fit curves shown in these plots are given by Equations D.8 - D.14. (Note, all the test wall bottom plates were nailed with pairs of 100 x 4 mm flat head nails at 600 mm centres as well as the P21 type end restraint, so the effect of this additional restraint is effectively incorporated in these best-fit equations.)
1.2 m long wall (no end straps): Pw = (5.6 x Aw)/(3.0 ..... (D.9)
1.8 m long wall (no end straps): Pw = (8.7 x Aw)/(1.3 + Aw0-95) ..... (D.10)
2.4 m long wall (no end straps): Pw = (12.5 x Aw)/(1.2 + ~ ~ 0 . 9 ~ ) .... (D.l 1)
3.0 m long wall (no end straps): P, = (20.0 x Aw)/(0.4 + ~ ~ O . 9 9 .... (D.12)
1.2 m long wall (end straps): Pw = (9.5 x Aw)/(4.0 + Aw0.95) ....... (D.13)
0.9 m long wall (end straps): Pw = (7.1 x Aw)/(6.6 + Aw0.95) ....... (D.14)

The above equations can be used to find the effective maximum uplift restraint force imposed on the wall by the P21 uplift restraint. For A, = 30 mm, the values of Pw are 4.9, 5.4 and 5.9 kN from equations D.9-D.11, respectively. (These values increase with wall length because they also include the total effect of nailing between the bottom plate and foundation beam, which will increase with wall length.) Thus, the maximum uplift force imposed by the P21 uplift restraint alone will not exceed 6 kN (i.e., 2 kN per horizontal nail used in the restraint). This value is used in the recommendations in Section 6 of the main text.
D.4 Comparison of Predicted Racking Test Parent Curves (Full Uplift Restraint and P21 Type Restraint)
The predicted parent curves are plotted in Figures D.6 - D.8 for various length walls. The full uplift restraint curve is based on Equations 1-3 (Section 2.2.2) and the nail slip curve given in equation D.1. The deflections due to end vertical movement (from equations D.7 - D.13) were then added, resulting in the second curve. The graphs show that for single lined 3.0 m long walls, the use of P21 end restraints results in almost the same wall behaviour as when the wall is fully restrained against vertical movement. For shorter walls the P21 end restraints effectively govern the wall racking resistance. The difference in response between the P21 restrained walls and the walls fully restrained against vertical movement will be significantly greater than shown in these figures if a wall is sheathed on both sides. This can be seen in the plots in Section 6 of the main text.
D.5 Comparison of Predicted P21 Racking Parent Curves with Test Measurements
The predicted P21 test racking backbone curves shown in Figures D.5 - D.7 are compared with actual measurements in Figures D.9-D.10 for two randomly selected tests. The excellent agreement indicates that the theoretical method of predicting the backbone curve can be used where no unusual failure mode occurs in the tests, P21 end restraints are used to hold down the wall, and standard nailing into a timber foundation be& is used. (End straps can also be used in 900 or 1200 mm long walls if the appropriate equations (D.13 - D.14 above) are used.) The method is not applicable where other uplift restraints are used, such as sheathing nailed to the foundation beam, bolting down of bottom plate etc.
D.6 Prediction of Behaviour of Long Test Walls With Openings From Nail-Slip Data
Designers commonly treat long walls as a series of discrete panels (between openings), and these panels are analysed (and tested) as though they had complete vertical movement restraint (as discussed in the literature survey in Section 2). The experimental results in Section 4.6.4 showed that than 50-80% of the top plate horizontal movement could be attributed to vertical movement at panel ends. For each long wall configuration tested, as discussed in the main text, two theoretical wall analyses were made to investigate (a) the accuracy of assuming discrete panels in long walls have full vertical restraint, and (b) the accuracy of the P21 end restraints in simulating actual construction.
The analyses were performed using the computer program listed at the back of this appendix. Input data included the dimensions of each panel, nail locations, the nail slip curve for each sheathing (equations D.l - D.7) material, and the wall rocking curve (equations D.9 - D.14). A discussion of the results is given in Section 6.
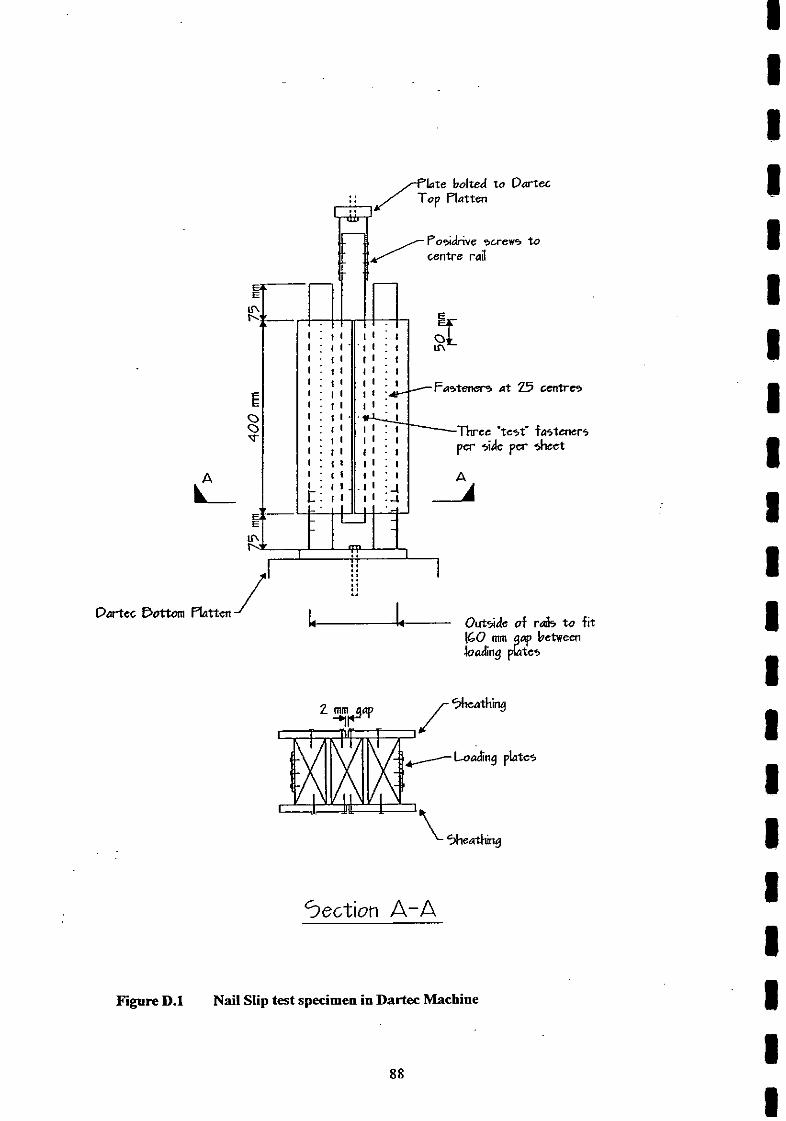
lare bolted to D u m a Top flatten
PoGdme 4crex5 to centre rail
5ection A-A
Figure D.1 Nail Slip test specimen in Dartex Machine

Load Slip C u r v e s For GB
Slip (mrn) 0 Eq. 0.2 + Eq. 0.4 0 Eq. 0.6
Load Slip Curves For TX and PY
Slip (rnm) 0 Eq.O.l + Eq.0.3 0 Eq.0.5 A Eq.0.7
Figure D.2
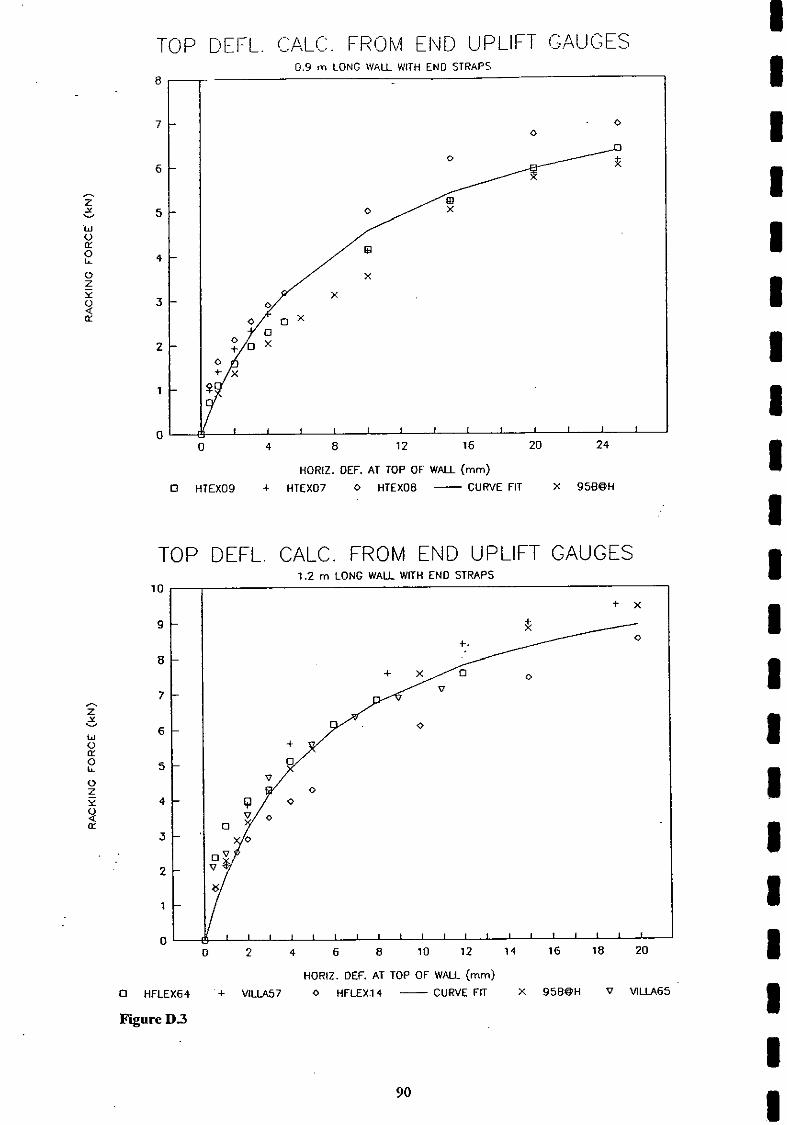
TOP DEFL. A . FROM END UPLIFT GAC!GES 0.9 rn LONG WALL WlTH EN0 STRAPS
-
HORIZ. OEF. AT TOP OF WALL (mm) 0 HTEX09 + HTEX07 0 HTEXOB - CURVE FIT X 9 5 W H
TOP DEFL. CALC. FROM END UPLIFT GAUGES 1.2 m LONG WALL WlTH EN0 STRAPS
+ X
HORIZ. OEF. AT TOP OF WALL (mm) 0 HFLEX64 + V I L W 7 0 HFLEXl4 - CURVE FIT X 95B%H V VlLlA65
Figure D3
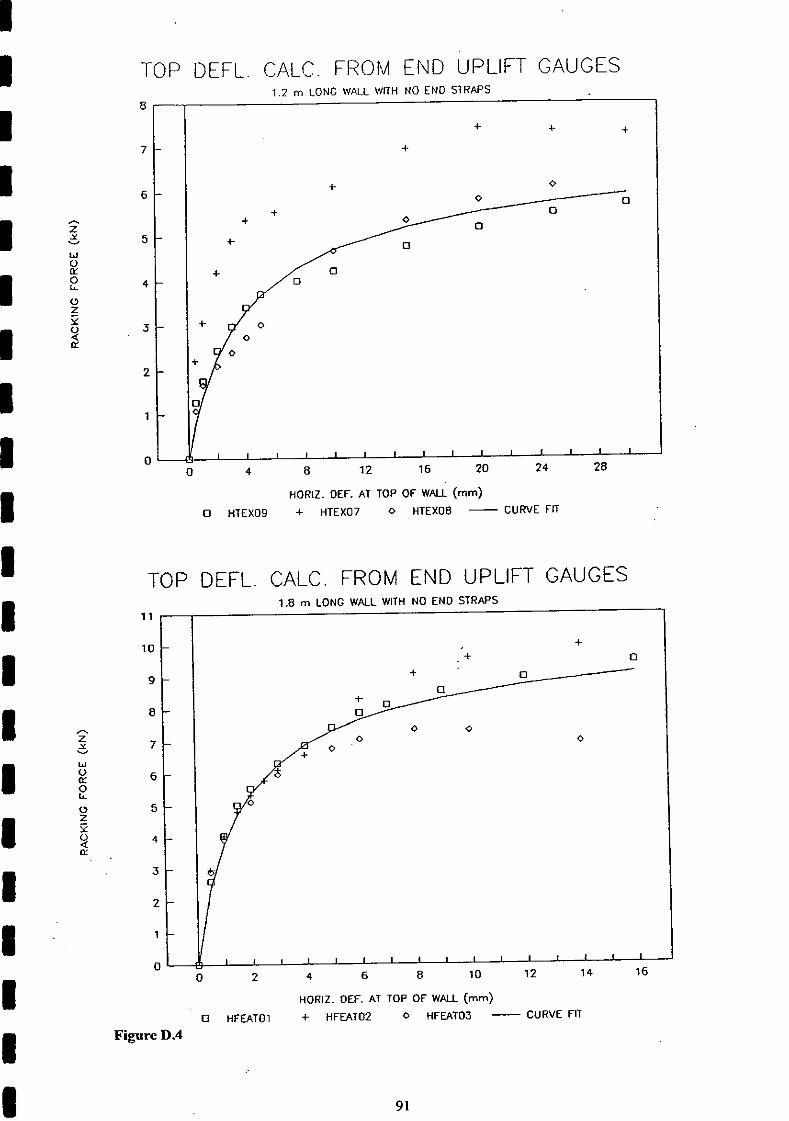
HORIZ. DEF. AT TOP OF WALL (mm) 0 HTEXO9 + HTEX07 0 HTEXOB - CURVE FIT
TOP DEFL. CALC. FROM END UPLIFT GAUGES 1 .2 m LONG WALL WITH NO EN0 STRAPS
TOP DEFL. CALC. FROM END UPLIFT GAUGES
8
7
6
Figure D.4
1.8 m LONG WALL WlTH NO EN0 STRAPS
+ 0
+ 0 + 5 - t
4 -
3 -
2 -
1 -
I I , I 0 -
0 4 8 1 2 1 6 20 24 2 8
-
-
-
HORIZ. OEF. AT TOP OF WALL (mm) 0 HFEATOl + HFEAT02 0 HFEAT03 - CURVE FIT
+ + + +
+ 0 0 0

TOP DEFL. CALC. FROM END UPLIFT GAUGES 2.4 m LONG WALL WITH NO END STRAPS .
HORIZ. OEF. AT TOP OF WALL (mm) 0 HFLEXlO + HFLEX11 0 HFLEX12 A VlLLA59 X HFLEX17 - CURVE FIT
TOP DEFL. CALC. FROM END UPLIFT GAUGES 3.0 m LONG WALL WilH NO END STRAPS
HORIZ. OEF. AT TOP OF WALL (mm) 0 WALL RWl + WAU RW2 0 WALL RW3 - CURVE FIT
Figure D.5

PREDICTED ivlOl\lOTONIC V!ALL RESPOI'dSE 0 .9 METRE LONG HT WALL WlTH STRAPS
DEFLECTION (mm) - FULL END RESTRAINT + P21 TYPE RESTRAN1
PREDICTED MONOTONIC WALL RESPONSE 1.2 METRE LONG HT WAU WITH STRAPS
DEFLECTION (mm) - FULL END RESTRAINT + P21 TYPE RESTRANT
Figure D.6
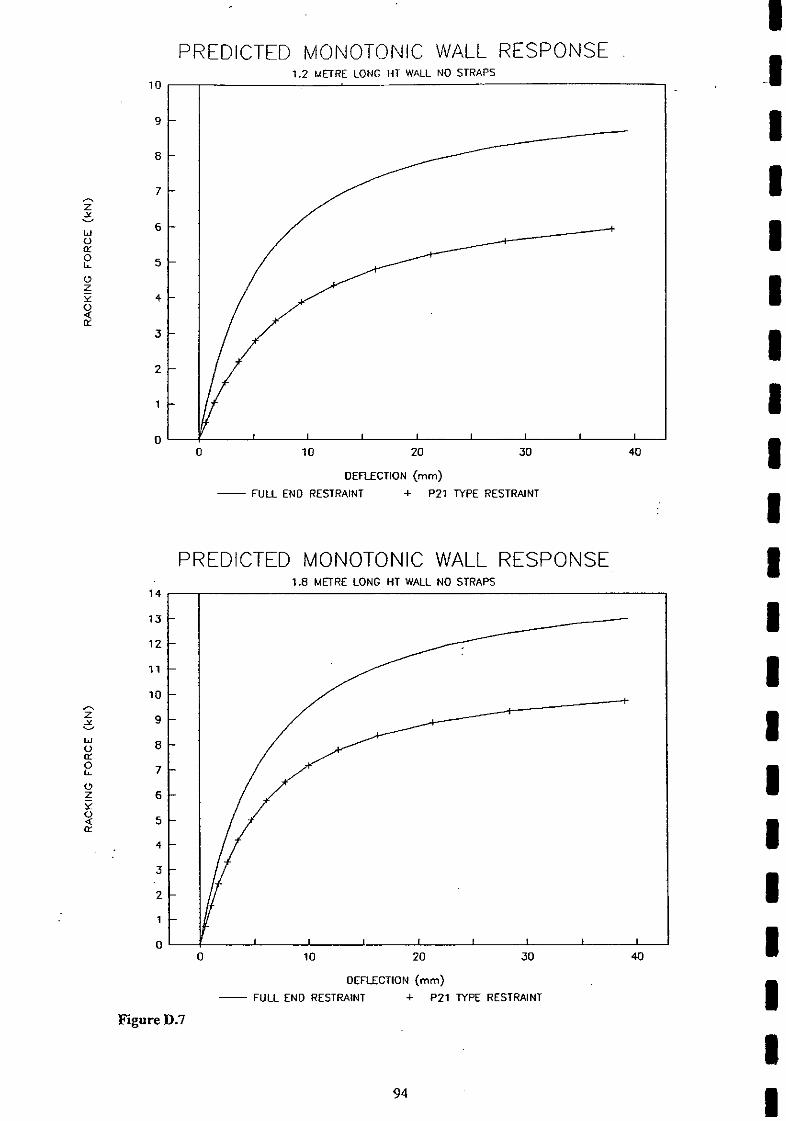
PREDICTED I\/IONOTONIC WALL RESPONSE 1.2 MElRE LONG HT WALL NO STRAPS
0 10 2 0 30 40
DEFLECTION (mm) - F U U END RESTRAINT + P 2 1 TYPE RESTRAINT
PREDICTED MONOTONIC WALL RESPONSE 1.8 METRE LONG H T WALL NO STRAPS
DEFLECTION (mm) - FULL E N 0 RESTRAINT + P21 TYPE RESTRAINT
Figure D.7

PREDICTED MOI\JOTOI'\IIC WALL RESPONSE 2.4 METRE LONG HT WALL NO STRAPS
Figure D.8
DEFLECTION (mm) - FULL EN0 RESTRAINT + PZ1 N P E RESTRAIN1
PREDICTED MONOTONIC WALL RESPONSE 3.0 METRE LONG HT WALL NO STRAPS
I I 4 I I I
1 0 2 0 3 0 40
DEFLECTION (mm) - FULL END RESTRAINT + PZ1 TYPE RESTRAINT

Comparison of theor. & expt. P21 test Sample 1200 wide T X clad wall
7
6
5
4
3
2 /. z 1 1 - w " 0 L 0 L -1
-2
-3
-4
-5
-6
-7 -40 -20 0 20 40
Deflection (mm) - Ex~erimentol - Theareticol
Figure D.9 Comparison of theor. & expt P21 test
Comparison of theor. & expt. P21 test Som~le ,2400 wide TX clad wall
Deflection (mm) - Experimental - Theoreticd
Figure D.1OComparison of theor. & expt P21 test
96

PROGRAM LTF THIS PROGRAM PRINTS A LOAD DEFLECTION PLOT FOR AN UPLIFT RESTRAINED WALL WITH LINING ON ONE OR TWO SIDES BASED ON A NAIL SLIP RELATIONSHIP CAN ALSO BE ADDED UNITS kN, mm. A P21 END UPLIFT RELATIONSHIP CAN ALSO BE ADDED. REAL L, LTOT, G(2), T(2), A(2), B(2), X(2,50), Y(2,50), K(2,50), FACT (2, 50) REAL FORCE (2), DEFL(2), P2 1 F(60), P2 1 D(60), TITLE (20), NSHEET(2) INTEGER NFAST(2) CHARACTER * 12 INPUT, OUTPUT, DUMP OPEN FILES DUMF'='DUMP' WRITE(*,2001) FORMAT(//, 5X, 'TYPE INPUT FILE NAME') READ(*,2000) INPUT FORMAT(A 12) OuTPUT='OuTF'UT' FORCE(2)=O. DEFy2)=0. OPEN(l0, FILE=INPUT,STATUS='OLD') OPEN(l1, FILE=OUTPUT,STATUS='NEWY) OPEN(12, FILE=DUMP,STATUS='NEW') READ INPUT PARAMETERS, NOT ALPHA IS IN RADIANS READ(lO,999)(TITLE(i), I=1,20) WRITE(11,999) (TITLE@, I=l, 20)\ FORMAT(20a4) READ(l0,l OOO)LTOT,H,ALPHA,NLIN FORMAT(3F10.0.110) DO 1 I=l, NLM READ(l0,lOO 1 )G(I),T(I),A(I),B(I),NFAST(I),NSHEET@) FORMAT(4F10.3,I 10,F10.2) L=LTOTMSHEET(I) N=NFAST(I) DO 2 J=l, N READ(1 O,1002)X(I,J),Y@,J),FACT(l,J) K(I,J)=SIN(ALPHA)*SQRT((X(I,J)/L*COS(ALPHA))* *2 + +(Y(I,J)lh*SIN(ALPHA))**2) FORMAT(5F10.3) CONTINUE READ IN P2 1 LOAD/DEFLECTION RELATIONSHIP FOR SUPPORT UPLIFT FORM OF EQN. IS AU.DEF/(BU+DEF**CU) READ(10,1002)AU,BU,CU DEF=O. DO 22 (=lJ 1 P2 I D(I)=DEF P21F(I)=AU*DEF/(BU+DEF**CU) WRITE(12,1002)P2 1D(I),P2 lF(I),AU,BU,CU DEF=DEF+0.5+0.07*i CALCULATE WALL FORCE AT EVERY 1.0 MM WALL DISPLACEMENT (DUE TO NAIL SLIP) AND THEN ADD ON TO WALL DISPLACEMENT THAT DUE TO SHEAR DEFORMATION OF THE SHEETING. DEF=O. DO 3 M=1,30

DEF=DEF+0.2+2+0.07*M DO 4 I=l, NLIN R=O. N-NFAST(1) DO 5 J=I,N R=R+A(I)*4*NSHEET(I)*FACT(I,J)*K(I,J)*K~,J)*DEF/(B(I)+K(IIJ)*DEF)
5 CONTINUE DEFL(I)=DEF+R*W(G(I)*T(I)*LTOT)
4 FORCE(I)=R C **** CALCULATE WALL DEFLECTION DUE TO P21 TYPE UPLIFT C **** INTERPOLATE DEFLECTION AT EACH FORCE LEVEL
R=FORCE(l)+FORCE(2) DO 7 I=l, 30 IF(R.GT.P21F(I))GO TO 7 DEF021=p21d(i-l)+(F'21D(I-I))* + (R-P2 1F(I- I))/(P21F(I)-P21F(I- I)) GO TO 8 CONTINUE DEFP2 1 =I 00. CONTMLTE WRITE( I l,1003)FORCE(1),FORCE(2),DEFL(I),DEFL(2),DEFP21 FORMAT(5F8.2) CONTINUE END
APPENDIX E
Proprietary Products Used
Three proprietary sheathings were used in the experimental programme described in this report and referred to as Type PLB, PY or TX. These products are:
1. Type PLB was nominal 9.5 mm standard Winstone Gibraltar Board. This was an off- white paper faced gypsum plaster-based board with a measured thickness of 9.54 mm and density of 6.93 kg/m2.
2. Type TX was a nominal 7.5 mm thick, pink smooth-faced fibre cement Harditex sheet, with a measured thickness of 7.9 mm and density of 11.3 kg/sq. m.
3. Type PY was nominal 7.5 mm thick plywood sheet with three laminates. The sheet had a measwed thickness of 7.1 mm and density of 4.0 kg/sq. m.
The metal straps were 25 x 1.0 mm (nominal) galvanised high tensile steel manufactured by Lumberlok. This was used to form a diagonal brace as well as to fasten the wall down in places specified in the construction.
The standard glazed aluminium framed window was supplied by Altherm Aluminium Ltd.
Note: Results obtained in this study relate only to the samples tested, and not to any other item of the same or similar description. BRANZ does not necessarily test all brands or types available within the class of items tested and exclusion of any brand or type is not to be taken as any reflection on i t
This work was carried out for specific research purposes, +d BRANZ may not have assessed all aspects of the products named which would be relevant in any specific use. For this reason, BRANZ disclaims all liability for any loss or other deficit, following use of the named products, which is claimed to be reliance on the results published here.
Further, the listing of any trade or brand names above does not represent endorsement of any named product nor imply that it is better or worse than any other available product of its type. A Laboratory tests may not be exactly representative of the performance of the item in general use.

Wall Label
TABLES
TABLE 1 DESCRIPTION OF TEST WALLS
Configuration She: Side 1
PLB PLB PLB PLB PLB* PLB PLB PLB PLB PLB
ing Side 2
PY" TX -
PY TX PLB PLB
Legend 25 x 1 mm maps used at each end of 800 and 1900 mm leugib panels - ** 25 x 1 mm straps used at each end of 800 mm length p m e l : ~ ~ cladding not
used within wall window zone.
TABLE 2 WALL CYCLIC TEST REGIME
Deflection (mm) I No. of Cycles I Demees Read Afterwards * 2 1 I No
Legend Wall W2L2 only had the cycles applied indicated by an asterisk. See Section 4.4.
- f 4 * 6 * 8 f 12' f I6
*24 * *36* * 50
2 1 2 2 2 4 4 4
Yes No Yes No NO Yes No No
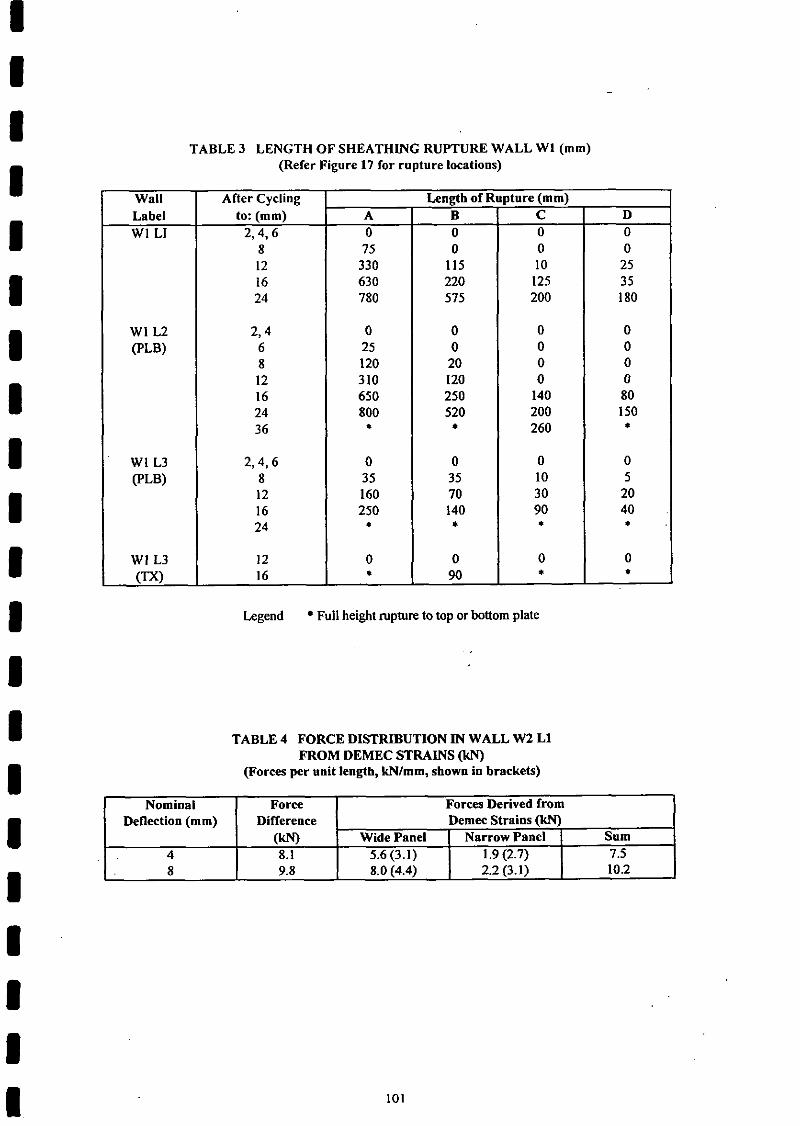
Wall Label W1 LI
W1 L2 (PLW
W1 L3 (PLW
WI L3 (W
TABLE 3 LENGTH O F SHEATHING RUPTURE WALL W1 (mm) (Refer Figure 17 for rupture locations)
Legend Full height rupture to top or bottom plate
After Cycling to: (mm)
2,4,6
TABLE 4 FORCE DISTRIBUTION IN WALL W2 L1 FROM DEMEC STRAINS (kN)
(Forces per unit length, kNlmm, shown in brackets)
A o
Nominal Deflection (mm)
4 8
Length of B 0
Rupture (mm) C 0
Force Difference
( k N 8.1 9.8
Forces Derived from Demec Strains (kN)
Sum 7.5 10.2
Wide Panel 5.6 (3.1) 8.0 (4.4)
Narrow Panel 1.9 (2.7) 2.2 (3.1)

WALL LABEL
W3 L1
W3 L2
WB L3
Lining Type -
PLB
- PLB
PY
Sum
PLB
PY
Sum -
PLB
TX
Sum
PLB
TX
Sum -
TABLE 5 FORCE DISTRIBUTION IN WALL W3 FROM DEMEC STRAINS (kN)
(Refer to Figure 9 for Panel Locations) (Forces per unit length, kNlmm, shown in brackets)
Panel Label Applied
Load (Kn)
16.2
21.8
17.3
Imposed Deflection
(mm)
4
8
24

TABLE 6 STUD VERTICAL MOVEMENT (mm) WALL W1 (See Figure 8 for Location)
WALL LABEL
Av. Peak Deflection
(mm)
2.0 3.9 5.7 7.7 12.1 16.0 23.9
1.9 3.9 5.5 8.1 11.8 23.8 35.0
2.5 4.4 5.9 8.4 12.2 16.2 25.9
TABLE 7 STUD VERTICAL MOVEMENT (mm) WALL W2 (See Figure 9 for Location)
Push
Push
Pull
Pull
LABEL I= Deflection (mm)
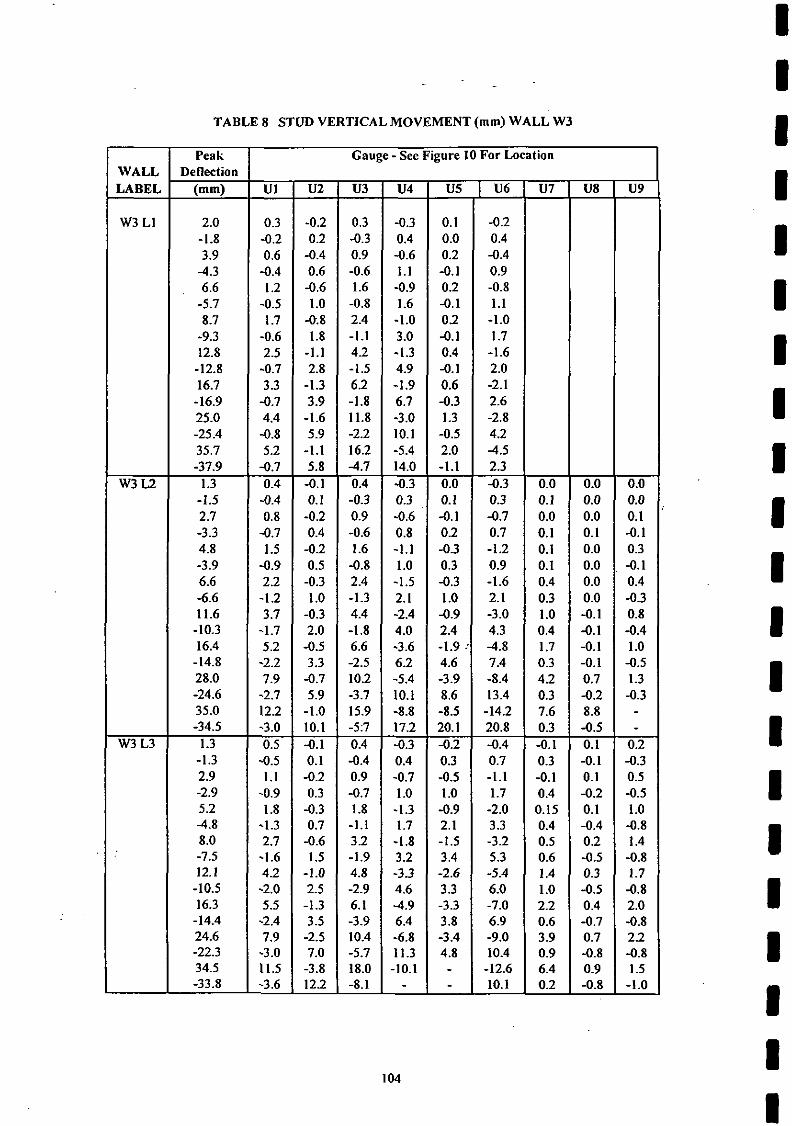
WALL LABEL - w 3 LI
W3LZ
- W3 L3
.
TABLE 8 STUD VERTICAL MOVEMENT (mm) WALL W3
Peak Deflection
(mm)
2.0 -1.8 3.9
4.3 6.6
-5.7 8.7
-9.3 12.8
-12.8 16.7
-16.9 25.0 -25.4 35.7 -37.9
1.3 -1.5 2.7 -3.3 4.8 -3.9 6.6 -6.6 11.6
-10.3 16.4
-14.8 28.0 -24.6 35.0 -34.5
1.3 -1.3 2.9 -2.9 5.2 4 .8 8.0 -7.5 12.1
-10.5 16.3 -14.4 24.6 -22.3 34.5 -33.8
Gauge - See Figure 10 For Location
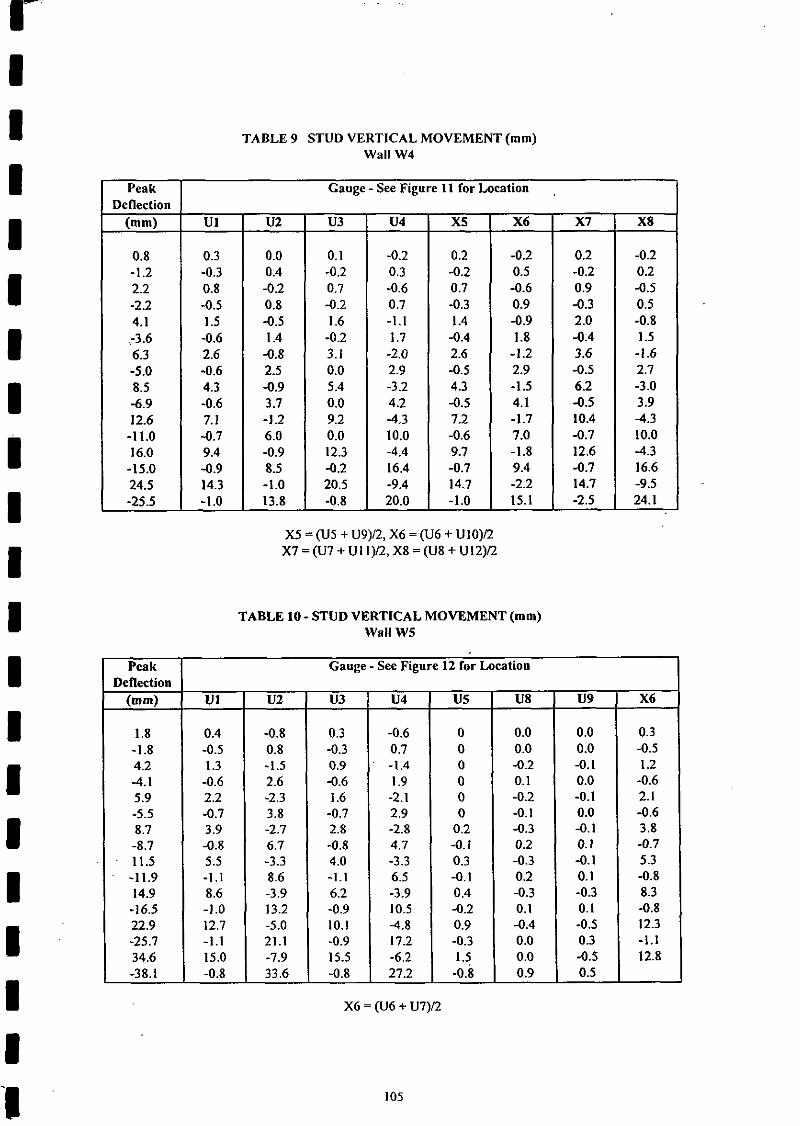
Peak Deflection
(mm)
0.8 -1.2 2.2 -2.2 4.1 -3.6 6.3 -5.0 8.5 -6.9 12.6
-11.0 16.0
-15.0 24.5 -25.5
Peak Deflection
(mm)
TABLE 9 STUD VERTICAL MOVEMENT (mm) Wall W4
Cauge - See Figure 11 for Location
TABLE 10 - STUD VERTICAL MOVEMENT (mm) Wall W5
Gauge - See Figure 12 for Location

R A N 2 THE RESOURCE CENTRE FOR BUILDING uCaLENCE
BRANZ MISSION
To promote better building through the application of acquired knowledge,
technology and expertw.
HEAD OFFICE AND RESEARCH CENTRE
Moonshine Road, Judgeford Postal Address - Private Bag 50908, Porirua
Telephone - (04) 235-7MX), FAX - (04) 235-6070
REGIONAL ADVISORY OFFICES
AUCKLAND Telephone - (09) 524-7018
FAX - (09) 524-7069 118 Carlton Gore Road, Newmarket
PO Box 99-186, Newmarket
WELLINGTON Telephone - (04) 235-7600
FAX - (04) 235-6070 ~oonshifre Road, Judgeford
CHRISTCHURCH Telephone - (03) 366-3435
FAX - (03) 366-8552 GRE Building
79-83 Hereford Street PO Box 496
Related Documents