Citation: Wang, W.; Zhang, X.; Liu, Q.; Lin, Y.; Zhang, Z.; Li, S. Study on Extraction and Antioxidant Activity of Flavonoids from Hemerocallis fulva (Daylily) Leaves. Molecules 2022, 27, 2916. https://doi.org/10.3390/ molecules27092916 Academic Editor: Giovanni D 0 Orazio Received: 2 April 2022 Accepted: 2 May 2022 Published: 3 May 2022 Publisher’s Note: MDPI stays neutral with regard to jurisdictional claims in published maps and institutional affil- iations. Copyright: © 2022 by the authors. Licensee MDPI, Basel, Switzerland. This article is an open access article distributed under the terms and conditions of the Creative Commons Attribution (CC BY) license (https:// creativecommons.org/licenses/by/ 4.0/). molecules Article Study on Extraction and Antioxidant Activity of Flavonoids from Hemerocallis fulva (Daylily) Leaves Wei Wang 1 , Xiaoli Zhang 1 , Qinglei Liu 1 , Yucheng Lin 1 , Zhiguo Zhang 2 and Shanshan Li 1, * 1 Engineering Research Center of Perfume & Aroma and Cosmetics of Ministry of Education, School of Perfume and Aroma Technology, Shanghai Institute of Technology, Shanghai 201418, China; [email protected] (W.W.); [email protected] (X.Z.); [email protected] (Q.L.); [email protected] (Y.L.) 2 School of Ecological Technology and Engineering, Shanghai Institute of Technology, Shanghai 201418, China; [email protected] * Correspondence: [email protected]; Tel.: +86-18217311580 Abstract: Hemerocallis fulva is a medical and edible plant. In this study, we optimized the ultrasound- assisted extraction (UAE) process of extracting flavonoids from Hemerocallis fulva leaves by single- factor experiments and response surface methodology (RSM). The optimum extraction conditions gen- erating the maximal total flavonoids content was as follows: 70.6% ethanol concentration; 43.9:1 mL/g solvent to sample ratio; 61.7 ◦ C extraction temperature. Under the optimized extraction conditions, the total flavonoid content (TFC) in eight Hemerocallis fulva varieties were determined, and H. fulva (L.) L. var. kwanso Regel had the highest TFC. The cytotoxicity of the extract was studied using the Cell Counting Kit-8 (CCK-8 assay). When the concentration was less than 1.25 mg/mL, the extract had no significant cytotoxicity to HaCaT cells. The antioxidant activity was measured via chemical antioxidant activity methods in vitro and via cellular antioxidant activity methods. The results indicated that the extract had a strong ABTS and •OH radical scavenging activity. Additionally, the extract had an excellent protective effect against H 2 O 2 -induced oxidative damage at a concentration of 1.25 mg/mL, which could effectively reduce the level of ROS to 106.681 ± 9.733% (p < 0.001), compared with the 163.995 ± 6.308% of the H 2 O 2 group. We identified five flavonoids in the extracts using high-performance liquid chromatography (HPLC). Infrared spectroscopy indicated that the extract contained the structure of flavonoids. The results showed that the extract of Hemerocallis fulva leaves had excellent biocompatibility and antioxidant activity, and could be used as a cheap and potential source of antioxidants in the food, cosmetics, and medicine industries. Keywords: Hemerocallis fulva leaves; response surface methodology; flavonoids; antioxidant activity; in cellulo; in vitro 1. Introduction Hemerocallis fulva also known as daylily and golden needle, is a perennial herb of Hemerocallis in Liliaceae [1]. Hemerocallis fulva has been widely planted in eastern Asia including in China, South Korea, and Japan [2]. It is a traditional Chinese plant that has been recorded in ancient books as being an edible and medicinal crop for thousands of years [3]. Hemerocallis fulva has been used as a conventional food in East Asia, with antivomiting, anti-inflammatory, diuretic, antidepressant, and sedation properties [2]. Some studies have shown that it has the effect of promoting sleep, and also is commonly used as an anti- inflammatory, for the treatment of skin burns [4]. Therefore, Hemerocallis fulva has attracted increasing attention from researchers because of its application potential in healthcare products and medicine [5]. Hemerocallis fulva is also a cheap source of bioactive substances as the leaves are a by-product of its cultivation [6]. A large number of leaves can be obtained during the necessary pruning of Hemerocallis fulva at maturity. The study indicated that flavonoids widely exist in Hemerocallis fulva, and they are one of the active components of Molecules 2022, 27, 2916. https://doi.org/10.3390/molecules27092916 https://www.mdpi.com/journal/molecules

Welcome message from author
This document is posted to help you gain knowledge. Please leave a comment to let me know what you think about it! Share it to your friends and learn new things together.
Transcript
Citation: Wang, W.; Zhang, X.; Liu,
Q.; Lin, Y.; Zhang, Z.; Li, S. Study on
Extraction and Antioxidant Activity
of Flavonoids from Hemerocallis fulva
(Daylily) Leaves. Molecules 2022, 27,
2916. https://doi.org/10.3390/
molecules27092916
Academic Editor: Giovanni D′Orazio
Received: 2 April 2022
Accepted: 2 May 2022
Published: 3 May 2022
Publisher’s Note: MDPI stays neutral
with regard to jurisdictional claims in
published maps and institutional affil-
iations.
Copyright: © 2022 by the authors.
Licensee MDPI, Basel, Switzerland.
This article is an open access article
distributed under the terms and
conditions of the Creative Commons
Attribution (CC BY) license (https://
creativecommons.org/licenses/by/
4.0/).
molecules
Article
Study on Extraction and Antioxidant Activity of Flavonoidsfrom Hemerocallis fulva (Daylily) LeavesWei Wang 1, Xiaoli Zhang 1, Qinglei Liu 1, Yucheng Lin 1, Zhiguo Zhang 2 and Shanshan Li 1,*
1 Engineering Research Center of Perfume & Aroma and Cosmetics of Ministry of Education,School of Perfume and Aroma Technology, Shanghai Institute of Technology, Shanghai 201418, China;[email protected] (W.W.); [email protected] (X.Z.); [email protected] (Q.L.);[email protected] (Y.L.)
2 School of Ecological Technology and Engineering, Shanghai Institute of Technology, Shanghai 201418, China;[email protected]
* Correspondence: [email protected]; Tel.: +86-18217311580
Abstract: Hemerocallis fulva is a medical and edible plant. In this study, we optimized the ultrasound-assisted extraction (UAE) process of extracting flavonoids from Hemerocallis fulva leaves by single-factor experiments and response surface methodology (RSM). The optimum extraction conditions gen-erating the maximal total flavonoids content was as follows: 70.6% ethanol concentration; 43.9:1 mL/gsolvent to sample ratio; 61.7 ◦C extraction temperature. Under the optimized extraction conditions,the total flavonoid content (TFC) in eight Hemerocallis fulva varieties were determined, and H. fulva(L.) L. var. kwanso Regel had the highest TFC. The cytotoxicity of the extract was studied using theCell Counting Kit-8 (CCK-8 assay). When the concentration was less than 1.25 mg/mL, the extracthad no significant cytotoxicity to HaCaT cells. The antioxidant activity was measured via chemicalantioxidant activity methods in vitro and via cellular antioxidant activity methods. The resultsindicated that the extract had a strong ABTS and •OH radical scavenging activity. Additionally, theextract had an excellent protective effect against H2O2-induced oxidative damage at a concentrationof 1.25 mg/mL, which could effectively reduce the level of ROS to 106.681 ± 9.733% (p < 0.001),compared with the 163.995 ± 6.308% of the H2O2 group. We identified five flavonoids in the extractsusing high-performance liquid chromatography (HPLC). Infrared spectroscopy indicated that theextract contained the structure of flavonoids. The results showed that the extract of Hemerocallis fulvaleaves had excellent biocompatibility and antioxidant activity, and could be used as a cheap andpotential source of antioxidants in the food, cosmetics, and medicine industries.
Keywords: Hemerocallis fulva leaves; response surface methodology; flavonoids; antioxidant activity;in cellulo; in vitro
1. Introduction
Hemerocallis fulva also known as daylily and golden needle, is a perennial herb ofHemerocallis in Liliaceae [1]. Hemerocallis fulva has been widely planted in eastern Asiaincluding in China, South Korea, and Japan [2]. It is a traditional Chinese plant that has beenrecorded in ancient books as being an edible and medicinal crop for thousands of years [3].Hemerocallis fulva has been used as a conventional food in East Asia, with antivomiting,anti-inflammatory, diuretic, antidepressant, and sedation properties [2]. Some studies haveshown that it has the effect of promoting sleep, and also is commonly used as an anti-inflammatory, for the treatment of skin burns [4]. Therefore, Hemerocallis fulva has attractedincreasing attention from researchers because of its application potential in healthcareproducts and medicine [5]. Hemerocallis fulva is also a cheap source of bioactive substancesas the leaves are a by-product of its cultivation [6]. A large number of leaves can be obtainedduring the necessary pruning of Hemerocallis fulva at maturity. The study indicated thatflavonoids widely exist in Hemerocallis fulva, and they are one of the active components of
Molecules 2022, 27, 2916. https://doi.org/10.3390/molecules27092916 https://www.mdpi.com/journal/molecules
Molecules 2022, 27, 2916 2 of 18
Hemerocallis fulva [7]. Additionally, flavonoids have the functions of preventing and treatingcardiovascular and cerebrovascular diseases, relieving cough, inhibiting bacteria, protectingthe liver, and scavenging free radicals as antioxidants [8]. Therefore, it is important to studythe content of total flavonoids in Hemerocallis fulva leaves. Oxidative stress is an imbalancebetween oxidation and antioxidation, which tends to increase oxidization and producea large number of oxidative intermediates [9]. Excessive production of reactive oxygenspecies (ROS) can cause tissue damage and changes in cell function [10]. Oxidative stressis considered to be an important factor leading to disease and aging, which is due to thenegative effect of free radicals in the body [11]. An increase in ROS has been associatedwith many diseases, including neurodegenerative diseases, cardiovascular diseases, anddiabetes mellitus [12,13]. Natural antioxidants have attracted increasing attention sincesynthetic antioxidants may impart cytotoxicity and side effects on the body [14]. The mainsources of natural antioxidants are herbs, fruits, vegetables, grains, and green and blacktea [13,15]. Due to their potential anti-oxidation effect, extracting flavonoids from naturalproducts is a major research focus in natural pharmaceutical chemistry [16].
ABTS and •OH assays are commonly used to determine antioxidant activity in vitro.Deseo et al. found that sugarcane molasses extract has excellent antioxidant activity, asdetermined by an ABTS assay [17]. Zhou et al. reported that the scavenging ability of yampolysaccharide against hydroxyl radicals reached the same level as ascorbic acid using an•OH assay [18]. Souto et al. used HaCaT (Human immortal keratinocyte) cells to evaluatethe antioxidant activity and cytotoxicity of sustained-release drugs [19]. The ROS methodis usually used to test the antioxidant activity at the cellular level [20]. Acero et al. detectedchanges in ROS concentration in the HepG2 cell line treated with cherry extracts using theROS method [21].
In order to achieve optimal extraction conditions, we investigated the ultrasound-assisted extraction (UAE) process and explored the effects of ethanol concentration, solventto sample ratio, and extraction temperature on the total flavonoid content (TFC) [22]. TheTFC in leaves of eight Hemerocallis fulva varieties was analyzed to find the variety with themost abundant total flavonoid content. Furthermore, the antioxidant activity of extractswas studied by ABTS and •OH assays in vitro, and its cell-level antioxidant activity wasinvestigated by the ROS method. Finally, the components of flavonoids in Hemerocallisfulva leaves were detected by HPLC. This study hoped to provide a basis for the large-scaleindustrial application of Hemerocallis fulva leaves as antioxidants.
2. Results and Discussion2.1. Single-Factor Experiments
In the preliminary condition–optimization experiment, several important factors(ethanol concentration, solvent to sample ratio, extraction temperature, ultrasonic power,and extraction time) affecting the extraction of flavonoids were studied and analyzed.
2.1.1. The Effect of Ethanol Concentration
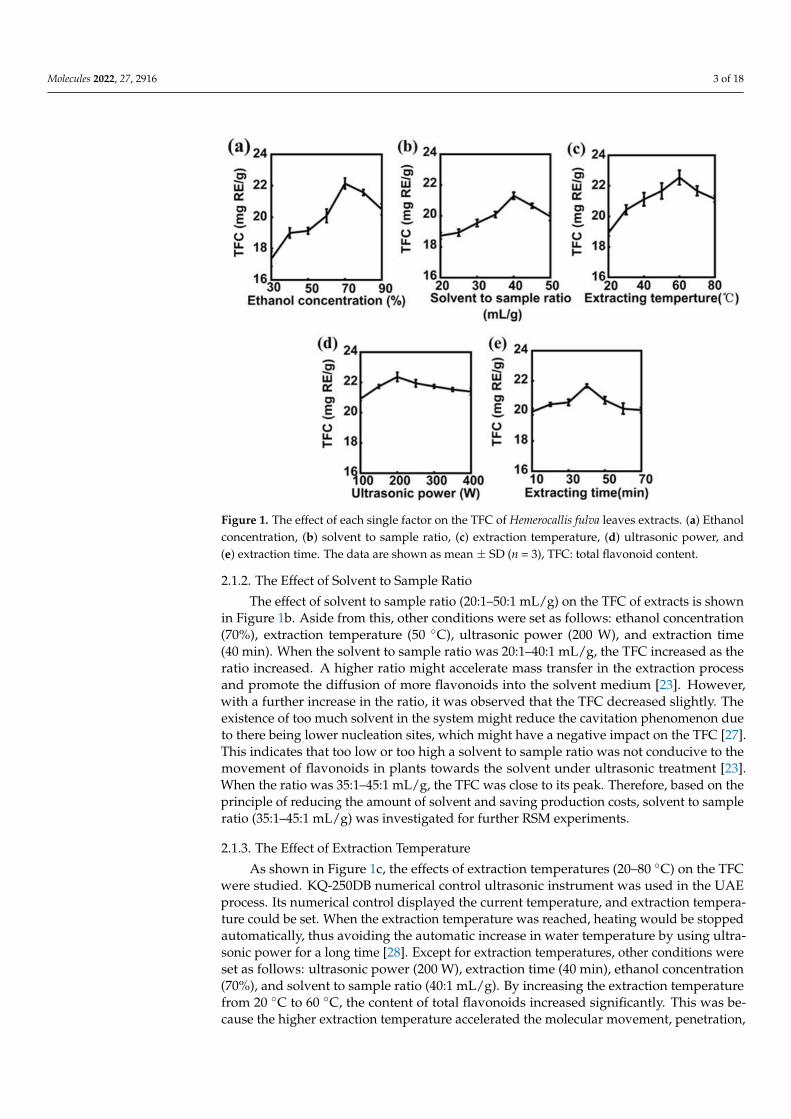
Generally, methanol, ethanol, and acetone are suitable for extracting flavonoids [23].Considering its safety and green extraction, ethanol was selected as the solvent [24]. Inthe single-factor experiments, we first studied the effect of ethanol concentration (30–90%)on the TFC in the extracts (Figure 1a). Aside from ethanol concentration, other conditionswere set as follows: extraction temperature (50 ◦C), ultrasonic power (200 W), extractiontime (40 min), and solvent to sample ratio (40:1 mL/g). At low concentration, the TFCmaintained a stable increase with increasing ethanol concentration (30–70%). The TFCdecreased when the ethanol concentration exceeded 70%. The extraction rate of othersubstances’ extracts other than flavonoids also increased, which affected the extraction offlavonoids and decreased the total flavonoids extracted from Hemerocallis fulva leaves [25,26].Therefore, ethanol concentration (60–80%) was selected for the following RSM experiment.
Molecules 2022, 27, 2916 3 of 18
Molecules 2022, 27, x FOR PEER REVIEW 4 of 19
2.1.5. The Effect of Extraction Time
As shown in Figure 1e, the effects of extraction time (10–80 min) on the TFC were
studied. Aside from extraction time, other conditions were set as follows: ethanol con-
centration (70%), solvent to sample ratio (40:1 mL/g), extraction temperature (50 °C), and
ultrasonic power (200 W). At about 10–40 min, the TFC increased with the extension of
extraction time. After extraction for 40 min, the content of total flavonoids reached its
maximum and then showed a downward trend. Short-term ultrasonic treatment could
promote the dissolution of flavonoids, while long-term ultrasonic treatment might de-
stroy their structure [32,33]. Therefore, the extraction time was set to 40 min in the RSM
experiment.
Figure 1. The effect of each single factor on the TFC of Hemerocallis fulva leaves extracts. (a) Ethanol
concentration, (b) solvent to sample ratio, (c) extraction temperature, (d) ultrasonic power, and (e)
extraction time. The data are shown as mean ± SD (n = 3), TFC: total flavonoid content.
2.2. Optimization of UAE of Total Flavonoids from Hemerocallis Fulva Leaves
2.2.1. Effect of Extraction Variables on Total Flavonoids
Based on the results of single-factor experiment, three factors were selected for fur-
ther RSM optimization using the Box–Behnken design (BBD) [34]. All variables were set
at three levels, represented by −1, 0, and 1, respectively. As shown in Table 1, three fac-
tors were selected as variables to optimize the UAE, and the model was established and
statistically analyzed in Tables 1 and 2.
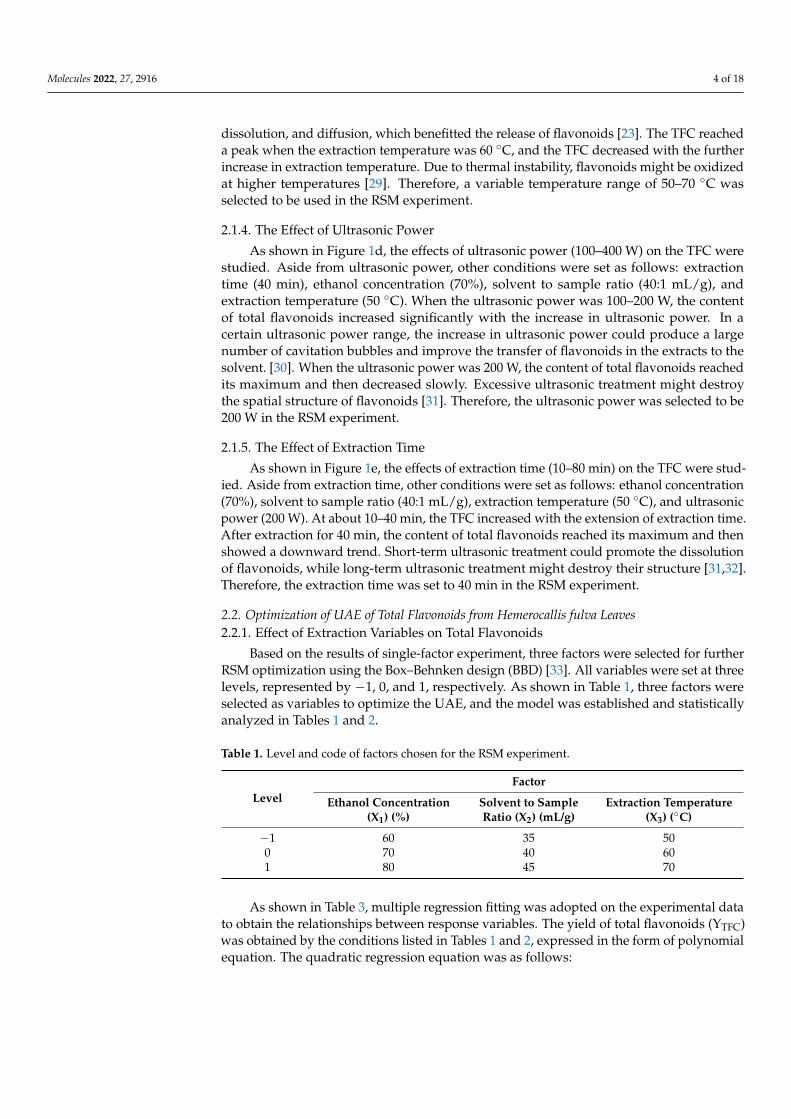
Table 1. Level and code of factors chosen for the RSM experiment.
Level
Factor
Ethanol Concentration
(X1) (%)
Solvent to Sample Ratio
(X2) (mL/g)
Extraction Temperature
(X3) (°C)
−1 60 35 50
0 70 40 60
1 80 45 70
Figure 1. The effect of each single factor on the TFC of Hemerocallis fulva leaves extracts. (a) Ethanolconcentration, (b) solvent to sample ratio, (c) extraction temperature, (d) ultrasonic power, and(e) extraction time. The data are shown as mean ± SD (n = 3), TFC: total flavonoid content.
2.1.2. The Effect of Solvent to Sample Ratio
The effect of solvent to sample ratio (20:1–50:1 mL/g) on the TFC of extracts is shownin Figure 1b. Aside from this, other conditions were set as follows: ethanol concentration(70%), extraction temperature (50 ◦C), ultrasonic power (200 W), and extraction time(40 min). When the solvent to sample ratio was 20:1–40:1 mL/g, the TFC increased as theratio increased. A higher ratio might accelerate mass transfer in the extraction processand promote the diffusion of more flavonoids into the solvent medium [23]. However,with a further increase in the ratio, it was observed that the TFC decreased slightly. Theexistence of too much solvent in the system might reduce the cavitation phenomenon dueto there being lower nucleation sites, which might have a negative impact on the TFC [27].This indicates that too low or too high a solvent to sample ratio was not conducive to themovement of flavonoids in plants towards the solvent under ultrasonic treatment [23].When the ratio was 35:1–45:1 mL/g, the TFC was close to its peak. Therefore, based on theprinciple of reducing the amount of solvent and saving production costs, solvent to sampleratio (35:1–45:1 mL/g) was investigated for further RSM experiments.
2.1.3. The Effect of Extraction Temperature
As shown in Figure 1c, the effects of extraction temperatures (20–80 ◦C) on the TFCwere studied. KQ-250DB numerical control ultrasonic instrument was used in the UAEprocess. Its numerical control displayed the current temperature, and extraction tempera-ture could be set. When the extraction temperature was reached, heating would be stoppedautomatically, thus avoiding the automatic increase in water temperature by using ultra-sonic power for a long time [28]. Except for extraction temperatures, other conditions wereset as follows: ultrasonic power (200 W), extraction time (40 min), ethanol concentration(70%), and solvent to sample ratio (40:1 mL/g). By increasing the extraction temperaturefrom 20 ◦C to 60 ◦C, the content of total flavonoids increased significantly. This was be-cause the higher extraction temperature accelerated the molecular movement, penetration,
Molecules 2022, 27, 2916 4 of 18
dissolution, and diffusion, which benefitted the release of flavonoids [23]. The TFC reacheda peak when the extraction temperature was 60 ◦C, and the TFC decreased with the furtherincrease in extraction temperature. Due to thermal instability, flavonoids might be oxidizedat higher temperatures [29]. Therefore, a variable temperature range of 50–70 ◦C wasselected to be used in the RSM experiment.
2.1.4. The Effect of Ultrasonic Power
As shown in Figure 1d, the effects of ultrasonic power (100–400 W) on the TFC werestudied. Aside from ultrasonic power, other conditions were set as follows: extractiontime (40 min), ethanol concentration (70%), solvent to sample ratio (40:1 mL/g), andextraction temperature (50 ◦C). When the ultrasonic power was 100–200 W, the contentof total flavonoids increased significantly with the increase in ultrasonic power. In acertain ultrasonic power range, the increase in ultrasonic power could produce a largenumber of cavitation bubbles and improve the transfer of flavonoids in the extracts to thesolvent. [30]. When the ultrasonic power was 200 W, the content of total flavonoids reachedits maximum and then decreased slowly. Excessive ultrasonic treatment might destroythe spatial structure of flavonoids [31]. Therefore, the ultrasonic power was selected to be200 W in the RSM experiment.
2.1.5. The Effect of Extraction Time
As shown in Figure 1e, the effects of extraction time (10–80 min) on the TFC were stud-ied. Aside from extraction time, other conditions were set as follows: ethanol concentration(70%), solvent to sample ratio (40:1 mL/g), extraction temperature (50 ◦C), and ultrasonicpower (200 W). At about 10–40 min, the TFC increased with the extension of extraction time.After extraction for 40 min, the content of total flavonoids reached its maximum and thenshowed a downward trend. Short-term ultrasonic treatment could promote the dissolutionof flavonoids, while long-term ultrasonic treatment might destroy their structure [31,32].Therefore, the extraction time was set to 40 min in the RSM experiment.
2.2. Optimization of UAE of Total Flavonoids from Hemerocallis fulva Leaves2.2.1. Effect of Extraction Variables on Total Flavonoids
Based on the results of single-factor experiment, three factors were selected for furtherRSM optimization using the Box–Behnken design (BBD) [33]. All variables were set at threelevels, represented by −1, 0, and 1, respectively. As shown in Table 1, three factors wereselected as variables to optimize the UAE, and the model was established and statisticallyanalyzed in Tables 1 and 2.
Table 1. Level and code of factors chosen for the RSM experiment.
LevelFactor
Ethanol Concentration(X1) (%)
Solvent to SampleRatio (X2) (mL/g)
Extraction Temperature(X3) (◦C)
−1 60 35 500 70 40 601 80 45 70
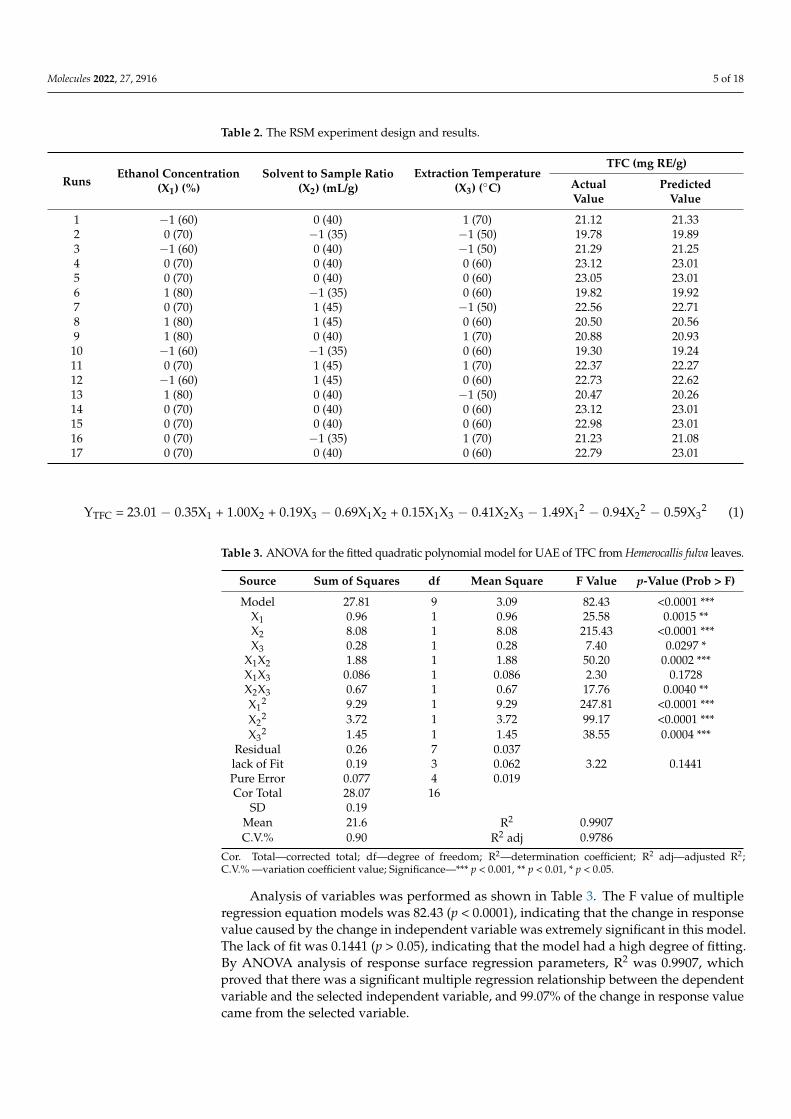
As shown in Table 3, multiple regression fitting was adopted on the experimental datato obtain the relationships between response variables. The yield of total flavonoids (YTFC)was obtained by the conditions listed in Tables 1 and 2, expressed in the form of polynomialequation. The quadratic regression equation was as follows:
Molecules 2022, 27, 2916 5 of 18
Table 2. The RSM experiment design and results.
RunsEthanol Concentration
(X1) (%)Solvent to Sample Ratio
(X2) (mL/g)Extraction Temperature
(X3) (◦C)
TFC (mg RE/g)
ActualValue
PredictedValue
1 −1 (60) 0 (40) 1 (70) 21.12 21.332 0 (70) −1 (35) −1 (50) 19.78 19.893 −1 (60) 0 (40) −1 (50) 21.29 21.254 0 (70) 0 (40) 0 (60) 23.12 23.015 0 (70) 0 (40) 0 (60) 23.05 23.016 1 (80) −1 (35) 0 (60) 19.82 19.927 0 (70) 1 (45) −1 (50) 22.56 22.718 1 (80) 1 (45) 0 (60) 20.50 20.569 1 (80) 0 (40) 1 (70) 20.88 20.93
10 −1 (60) −1 (35) 0 (60) 19.30 19.2411 0 (70) 1 (45) 1 (70) 22.37 22.2712 −1 (60) 1 (45) 0 (60) 22.73 22.6213 1 (80) 0 (40) −1 (50) 20.47 20.2614 0 (70) 0 (40) 0 (60) 23.12 23.0115 0 (70) 0 (40) 0 (60) 22.98 23.0116 0 (70) −1 (35) 1 (70) 21.23 21.0817 0 (70) 0 (40) 0 (60) 22.79 23.01
YTFC = 23.01 − 0.35X1 + 1.00X2 + 0.19X3 − 0.69X1X2 + 0.15X1X3 − 0.41X2X3 − 1.49X12 − 0.94X2
2 − 0.59X32 (1)
Table 3. ANOVA for the fitted quadratic polynomial model for UAE of TFC from Hemerocallis fulva leaves.
Source Sum of Squares df Mean Square F Value p-Value (Prob > F)
Model 27.81 9 3.09 82.43 <0.0001 ***X1 0.96 1 0.96 25.58 0.0015 **X2 8.08 1 8.08 215.43 <0.0001 ***X3 0.28 1 0.28 7.40 0.0297 *
X1X2 1.88 1 1.88 50.20 0.0002 ***X1X3 0.086 1 0.086 2.30 0.1728X2X3 0.67 1 0.67 17.76 0.0040 **X1
2 9.29 1 9.29 247.81 <0.0001 ***X2
2 3.72 1 3.72 99.17 <0.0001 ***X3
2 1.45 1 1.45 38.55 0.0004 ***Residual 0.26 7 0.037lack of Fit 0.19 3 0.062 3.22 0.1441Pure Error 0.077 4 0.019Cor Total 28.07 16
SD 0.19Mean 21.6 R2 0.9907C.V.% 0.90 R2 adj 0.9786
Cor. Total—corrected total; df—degree of freedom; R2—determination coefficient; R2 adj—adjusted R2;C.V.% —variation coefficient value; Significance—*** p < 0.001, ** p < 0.01, * p < 0.05.
Analysis of variables was performed as shown in Table 3. The F value of multipleregression equation models was 82.43 (p < 0.0001), indicating that the change in responsevalue caused by the change in independent variable was extremely significant in this model.The lack of fit was 0.1441 (p > 0.05), indicating that the model had a high degree of fitting.By ANOVA analysis of response surface regression parameters, R2 was 0.9907, whichproved that there was a significant multiple regression relationship between the dependentvariable and the selected independent variable, and 99.07% of the change in response valuecame from the selected variable.
Molecules 2022, 27, 2916 6 of 18
According to the analysis of variance of the response value of the multiple regressionequation, the primary terms (X1, X2, and X3) of the model were significantly different;the interactive terms (X1X2 and X2X3) were also significantly different. The difference inquadratic terms (X1
2, X22, and X3
2) was very significant. This shows that the responsesurface and independent variables did not have a simple linear relationship.
2.2.2. Response Surface Analysis
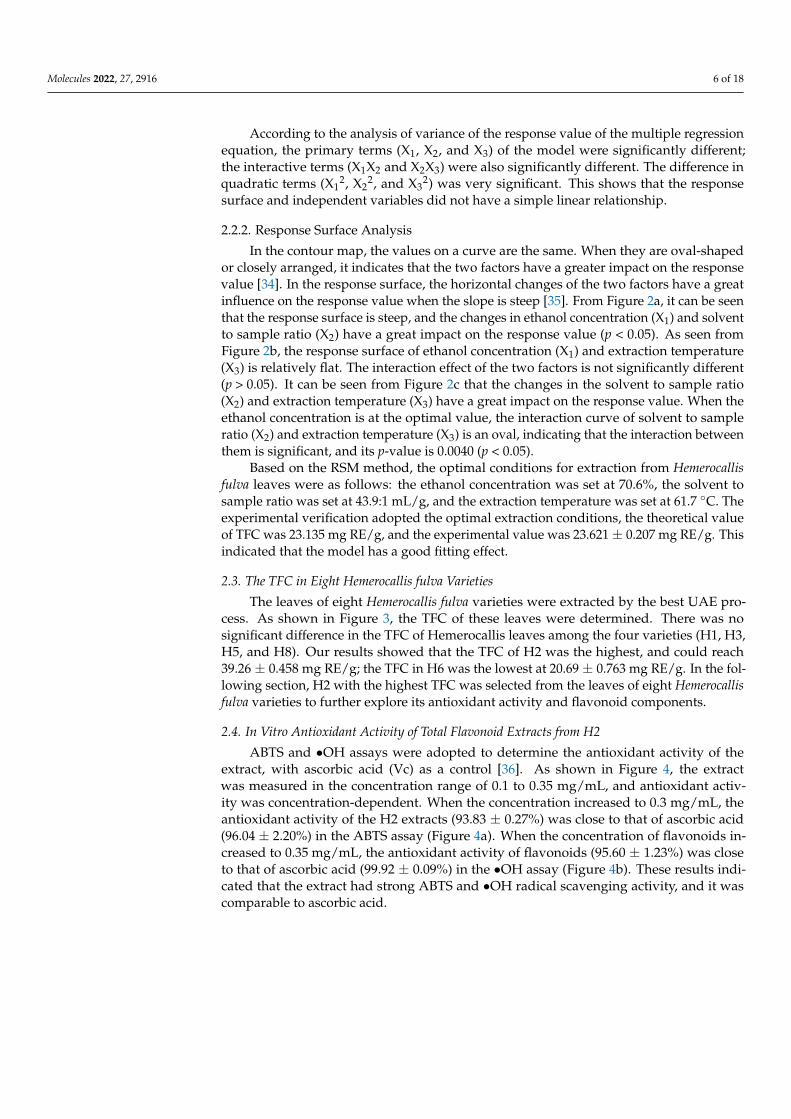
In the contour map, the values on a curve are the same. When they are oval-shapedor closely arranged, it indicates that the two factors have a greater impact on the responsevalue [34]. In the response surface, the horizontal changes of the two factors have a greatinfluence on the response value when the slope is steep [35]. From Figure 2a, it can be seenthat the response surface is steep, and the changes in ethanol concentration (X1) and solventto sample ratio (X2) have a great impact on the response value (p < 0.05). As seen fromFigure 2b, the response surface of ethanol concentration (X1) and extraction temperature(X3) is relatively flat. The interaction effect of the two factors is not significantly different(p > 0.05). It can be seen from Figure 2c that the changes in the solvent to sample ratio(X2) and extraction temperature (X3) have a great impact on the response value. When theethanol concentration is at the optimal value, the interaction curve of solvent to sampleratio (X2) and extraction temperature (X3) is an oval, indicating that the interaction betweenthem is significant, and its p-value is 0.0040 (p < 0.05).
Based on the RSM method, the optimal conditions for extraction from Hemerocallisfulva leaves were as follows: the ethanol concentration was set at 70.6%, the solvent tosample ratio was set at 43.9:1 mL/g, and the extraction temperature was set at 61.7 ◦C. Theexperimental verification adopted the optimal extraction conditions, the theoretical valueof TFC was 23.135 mg RE/g, and the experimental value was 23.621 ± 0.207 mg RE/g. Thisindicated that the model has a good fitting effect.
2.3. The TFC in Eight Hemerocallis fulva Varieties
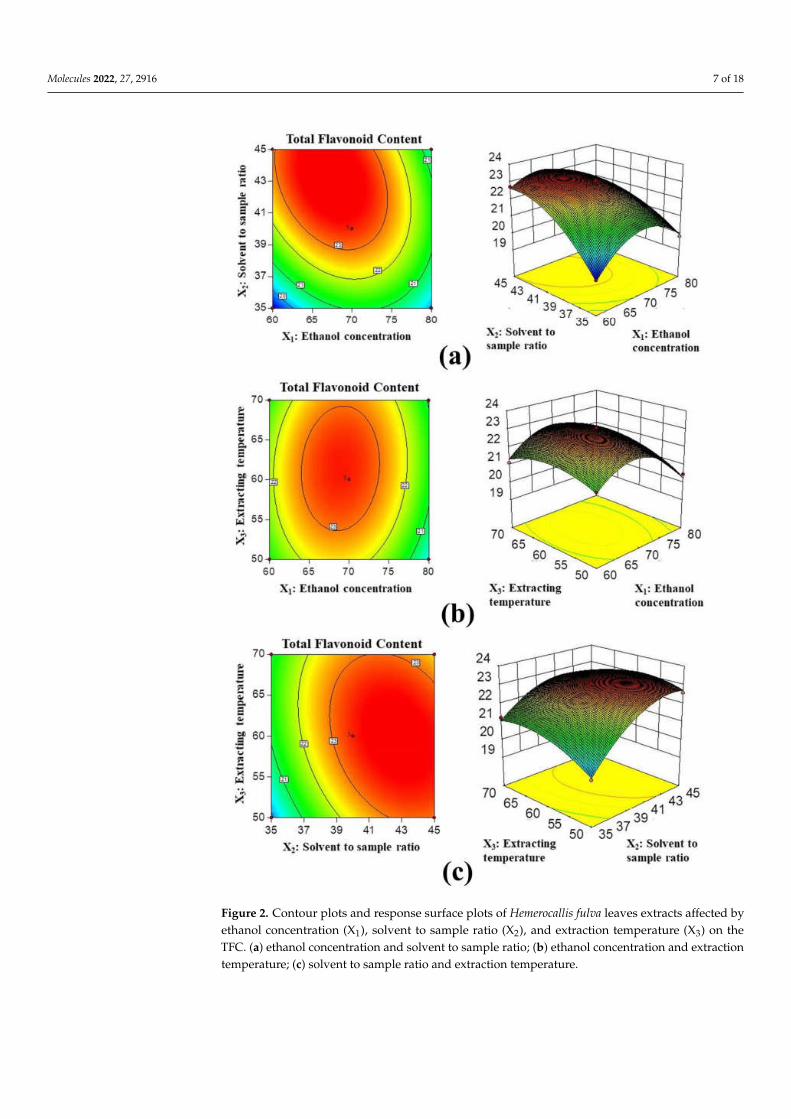
The leaves of eight Hemerocallis fulva varieties were extracted by the best UAE pro-cess. As shown in Figure 3, the TFC of these leaves were determined. There was nosignificant difference in the TFC of Hemerocallis leaves among the four varieties (H1, H3,H5, and H8). Our results showed that the TFC of H2 was the highest, and could reach39.26 ± 0.458 mg RE/g; the TFC in H6 was the lowest at 20.69 ± 0.763 mg RE/g. In the fol-lowing section, H2 with the highest TFC was selected from the leaves of eight Hemerocallisfulva varieties to further explore its antioxidant activity and flavonoid components.
2.4. In Vitro Antioxidant Activity of Total Flavonoid Extracts from H2
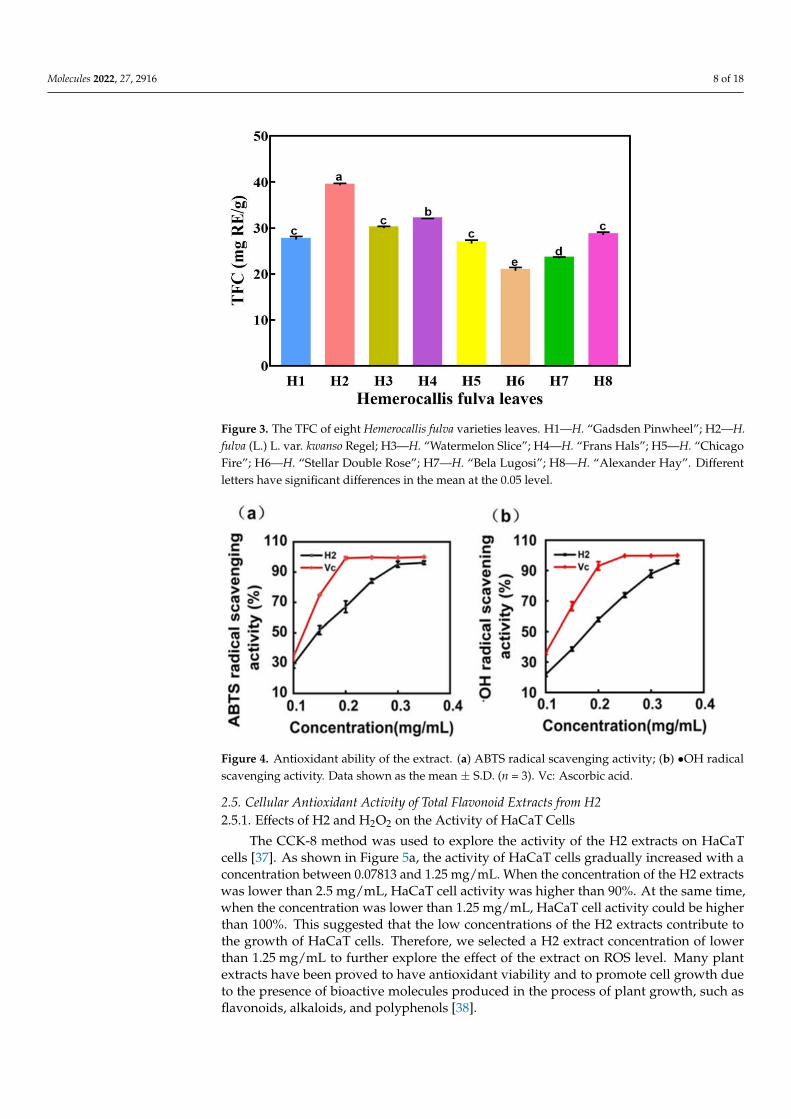
ABTS and •OH assays were adopted to determine the antioxidant activity of theextract, with ascorbic acid (Vc) as a control [36]. As shown in Figure 4, the extractwas measured in the concentration range of 0.1 to 0.35 mg/mL, and antioxidant activ-ity was concentration-dependent. When the concentration increased to 0.3 mg/mL, theantioxidant activity of the H2 extracts (93.83 ± 0.27%) was close to that of ascorbic acid(96.04 ± 2.20%) in the ABTS assay (Figure 4a). When the concentration of flavonoids in-creased to 0.35 mg/mL, the antioxidant activity of flavonoids (95.60 ± 1.23%) was closeto that of ascorbic acid (99.92 ± 0.09%) in the •OH assay (Figure 4b). These results indi-cated that the extract had strong ABTS and •OH radical scavenging activity, and it wascomparable to ascorbic acid.
Molecules 2022, 27, 2916 7 of 18Molecules 2022, 27, x FOR PEER REVIEW 7 of 19
Figure 2. Contour plots and response surface plots of Hemerocallis fulva leaves extracts affected by
ethanol concentration (X1), solvent to sample ratio (X2), and extraction temperature (X3) on the TFC.
(a) ethanol concentration and solvent to sample ratio; (b) ethanol concentration and extraction
temperature; (c) solvent to sample ratio and extraction temperature.
2.3. The TFC in Eight Hemerocallis Fulva Varieties
The leaves of eight Hemerocallis fulva varieties were extracted by the best UAE pro-
cess. As shown in Figure 3, the TFC of these leaves were determined. There was no sig-
nificant difference in the TFC of Hemerocallis leaves among the four varieties (H1, H3,
H5, and H8). Our results showed that the TFC of H2 was the highest, and could reach
39.26 ± 0.458 mg RE/g; the TFC in H6 was the lowest at 20.69 ± 0.763 mg RE/g. In the fol-
lowing section, H2 with the highest TFC was selected from the leaves of eight Hemerocal-
lis fulva varieties to further explore its antioxidant activity and flavonoid components.
Figure 2. Contour plots and response surface plots of Hemerocallis fulva leaves extracts affected byethanol concentration (X1), solvent to sample ratio (X2), and extraction temperature (X3) on theTFC. (a) ethanol concentration and solvent to sample ratio; (b) ethanol concentration and extractiontemperature; (c) solvent to sample ratio and extraction temperature.
Molecules 2022, 27, 2916 8 of 18
Molecules 2022, 27, x FOR PEER REVIEW 8 of 19
Figure 3. The TFC of eight Hemerocallis fulva varieties leaves. H1—H. “Gadsden Pinwheel”; H2—H.
fulva (L.) L. var. kwanso Regel; H3—H. “Watermelon Slice”; H4—H. “Frans Hals”; H5—H. “Chicago
Fire”; H6—H. “Stellar Double Rose”; H7—H. “Bela Lugosi”; H8—H. “Alexander Hay”. Different
letters have significant differences in the mean at the 0.05 level.
2.4. In Vitro Antioxidant Activity of Total Flavonoid Extracts from H2
ABTS and •OH assays were adopted to determine the antioxidant activity of the
extract, with ascorbic acid (Vc) as a control [37]. As shown in Figure 4, the extract was
measured in the concentration range of 0.1 to 0.35 mg/mL, and antioxidant activity was
concentration-dependent. When the concentration increased to 0.3 mg/mL, the antioxi-
dant activity of the H2 extracts (93.83 ± 0.27%) was close to that of ascorbic acid (96.04 ±
2.20%) in the ABTS assay (Figure 4a). When the concentration of flavonoids increased to
0.35 mg/mL, the antioxidant activity of flavonoids (95.60 ± 1.23%) was close to that of
ascorbic acid (99.92 ± 0.09%) in the •OH assay (Figure 4b). These results indicated that
the extract had strong ABTS and •OH radical scavenging activity, and it was compara-
ble to ascorbic acid.
Figure 4. Antioxidant ability of the extract. (a) ABTS radical scavenging activity; (b) •OH radical
scavenging activity. Data shown as the mean ± S.D. (n = 3). Vc: Ascorbic acid.
Figure 3. The TFC of eight Hemerocallis fulva varieties leaves. H1—H. “Gadsden Pinwheel”; H2—H.fulva (L.) L. var. kwanso Regel; H3—H. “Watermelon Slice”; H4—H. “Frans Hals”; H5—H. “ChicagoFire”; H6—H. “Stellar Double Rose”; H7—H. “Bela Lugosi”; H8—H. “Alexander Hay”. Differentletters have significant differences in the mean at the 0.05 level.
Molecules 2022, 27, x FOR PEER REVIEW 8 of 19
Figure 3. The TFC of eight Hemerocallis fulva varieties leaves. H1—H. “Gadsden Pinwheel”; H2—H.
fulva (L.) L. var. kwanso Regel; H3—H. “Watermelon Slice”; H4—H. “Frans Hals”; H5—H. “Chicago
Fire”; H6—H. “Stellar Double Rose”; H7—H. “Bela Lugosi”; H8—H. “Alexander Hay”. Different
letters have significant differences in the mean at the 0.05 level.
2.4. In Vitro Antioxidant Activity of Total Flavonoid Extracts from H2
ABTS and •OH assays were adopted to determine the antioxidant activity of the
extract, with ascorbic acid (Vc) as a control [37]. As shown in Figure 4, the extract was
measured in the concentration range of 0.1 to 0.35 mg/mL, and antioxidant activity was
concentration-dependent. When the concentration increased to 0.3 mg/mL, the antioxi-
dant activity of the H2 extracts (93.83 ± 0.27%) was close to that of ascorbic acid (96.04 ±
2.20%) in the ABTS assay (Figure 4a). When the concentration of flavonoids increased to
0.35 mg/mL, the antioxidant activity of flavonoids (95.60 ± 1.23%) was close to that of
ascorbic acid (99.92 ± 0.09%) in the •OH assay (Figure 4b). These results indicated that
the extract had strong ABTS and •OH radical scavenging activity, and it was compara-
ble to ascorbic acid.
Figure 4. Antioxidant ability of the extract. (a) ABTS radical scavenging activity; (b) •OH radical
scavenging activity. Data shown as the mean ± S.D. (n = 3). Vc: Ascorbic acid.
Figure 4. Antioxidant ability of the extract. (a) ABTS radical scavenging activity; (b) •OH radicalscavenging activity. Data shown as the mean ± S.D. (n = 3). Vc: Ascorbic acid.
2.5. Cellular Antioxidant Activity of Total Flavonoid Extracts from H22.5.1. Effects of H2 and H2O2 on the Activity of HaCaT Cells
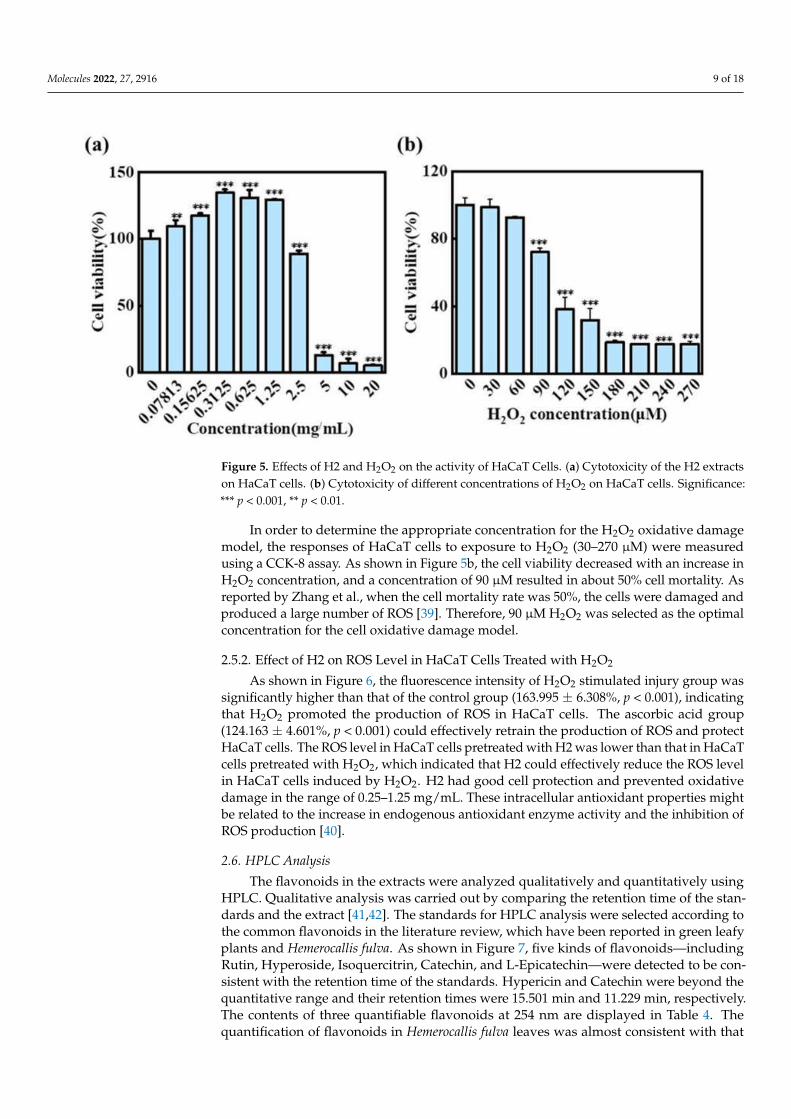
The CCK-8 method was used to explore the activity of the H2 extracts on HaCaTcells [37]. As shown in Figure 5a, the activity of HaCaT cells gradually increased with aconcentration between 0.07813 and 1.25 mg/mL. When the concentration of the H2 extractswas lower than 2.5 mg/mL, HaCaT cell activity was higher than 90%. At the same time,when the concentration was lower than 1.25 mg/mL, HaCaT cell activity could be higherthan 100%. This suggested that the low concentrations of the H2 extracts contribute tothe growth of HaCaT cells. Therefore, we selected a H2 extract concentration of lowerthan 1.25 mg/mL to further explore the effect of the extract on ROS level. Many plantextracts have been proved to have antioxidant viability and to promote cell growth dueto the presence of bioactive molecules produced in the process of plant growth, such asflavonoids, alkaloids, and polyphenols [38].
Molecules 2022, 27, 2916 9 of 18
Molecules 2022, 27, x FOR PEER REVIEW 9 of 19
2.5. Cellular Antioxidant Activity of Total Flavonoid Extracts from H2
2.5.1. Effects of H2 and H2O2 on the Activity of HaCaT Cells
The CCK-8 method was used to explore the activity of the H2 extracts on HaCaT
cells [38]. As shown in Figure 5a, the activity of HaCaT cells gradually increased with a
concentration between 0.07813 and 1.25 mg/mL. When the concentration of the H2 ex-
tracts was lower than 2.5 mg/mL, HaCaT cell activity was higher than 90%. At the same
time, when the concentration was lower than 1.25 mg/mL, HaCaT cell activity could be
higher than 100%. This suggested that the low concentrations of the H2 extracts contrib-
ute to the growth of HaCaT cells. Therefore, we selected a H2 extract concentration of
lower than 1.25 mg/mL to further explore the effect of the extract on ROS level. Many
plant extracts have been proved to have antioxidant viability and to promote cell growth
due to the presence of bioactive molecules produced in the process of plant growth, such
as flavonoids, alkaloids, and polyphenols [39].
In order to determine the appropriate concentration for the H2O2 oxidative damage
model, the responses of HaCaT cells to exposure to H2O2 (30–270 μM) were measured
using a CCK-8 assay. As shown in Figure 5b, the cell viability decreased with an increase
in H2O2 concentration, and a concentration of 90 μM resulted in about 50% cell mortali-
ty. As reported by Zhang et al., when the cell mortality rate was 50%, the cells were
damaged and produced a large number of ROS [40]. Therefore, 90 μM H2O2 was selected
as the optimal concentration for the cell oxidative damage model.
Figure 5. Effects of H2 and H2O2 on the activity of HaCaT Cells. (a) Cytotoxicity of the H2 extracts
on HaCaT cells. (b) Cytotoxicity of different concentrations of H2O2 on HaCaT cells. Significance:
*** p < 0.001, ** p < 0.01.
2.5.2. Effect of H2 on ROS Level in HaCaT Cells Treated with H2O2
As shown in Figure 6, the fluorescence intensity of H2O2 stimulated injury group
was significantly higher than that of the control group (163.995 ± 6.308%, p < 0.001), in-
dicating that H2O2 promoted the production of ROS in HaCaT cells. The ascorbic acid
group (124.163 ± 4.601%, p < 0.001) could effectively retrain the production of ROS and
protect HaCaT cells. The ROS level in HaCaT cells pretreated with H2 was lower than
that in HaCaT cells pretreated with H2O2, which indicated that H2 could effectively re-
duce the ROS level in HaCaT cells induced by H2O2. H2 had good cell protection and
prevented oxidative damage in the range of 0.25–1.25 mg/mL. These intracellular anti-
oxidant properties might be related to the increase in endogenous antioxidant enzyme
activity and the inhibition of ROS production [41].
Figure 5. Effects of H2 and H2O2 on the activity of HaCaT Cells. (a) Cytotoxicity of the H2 extractson HaCaT cells. (b) Cytotoxicity of different concentrations of H2O2 on HaCaT cells. Significance:*** p < 0.001, ** p < 0.01.
In order to determine the appropriate concentration for the H2O2 oxidative damagemodel, the responses of HaCaT cells to exposure to H2O2 (30–270 µM) were measuredusing a CCK-8 assay. As shown in Figure 5b, the cell viability decreased with an increase inH2O2 concentration, and a concentration of 90 µM resulted in about 50% cell mortality. Asreported by Zhang et al., when the cell mortality rate was 50%, the cells were damaged andproduced a large number of ROS [39]. Therefore, 90 µM H2O2 was selected as the optimalconcentration for the cell oxidative damage model.
2.5.2. Effect of H2 on ROS Level in HaCaT Cells Treated with H2O2
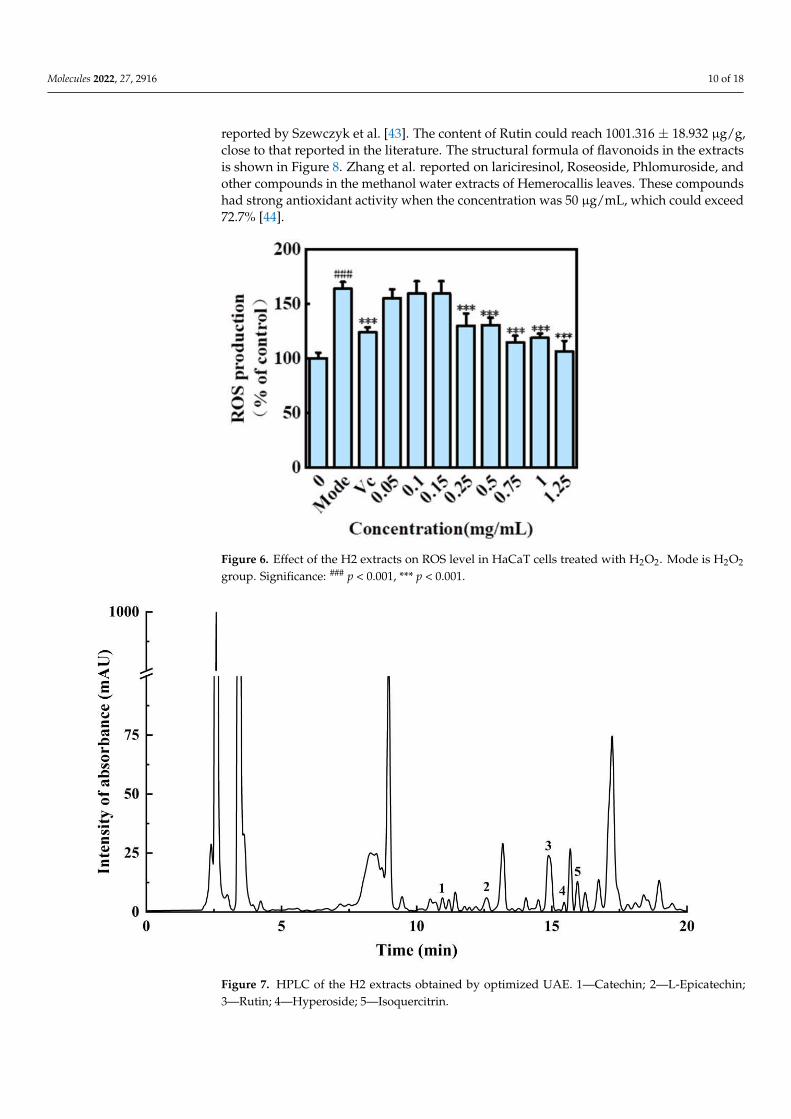
As shown in Figure 6, the fluorescence intensity of H2O2 stimulated injury group wassignificantly higher than that of the control group (163.995 ± 6.308%, p < 0.001), indicatingthat H2O2 promoted the production of ROS in HaCaT cells. The ascorbic acid group(124.163 ± 4.601%, p < 0.001) could effectively retrain the production of ROS and protectHaCaT cells. The ROS level in HaCaT cells pretreated with H2 was lower than that in HaCaTcells pretreated with H2O2, which indicated that H2 could effectively reduce the ROS levelin HaCaT cells induced by H2O2. H2 had good cell protection and prevented oxidativedamage in the range of 0.25–1.25 mg/mL. These intracellular antioxidant properties mightbe related to the increase in endogenous antioxidant enzyme activity and the inhibition ofROS production [40].
2.6. HPLC Analysis
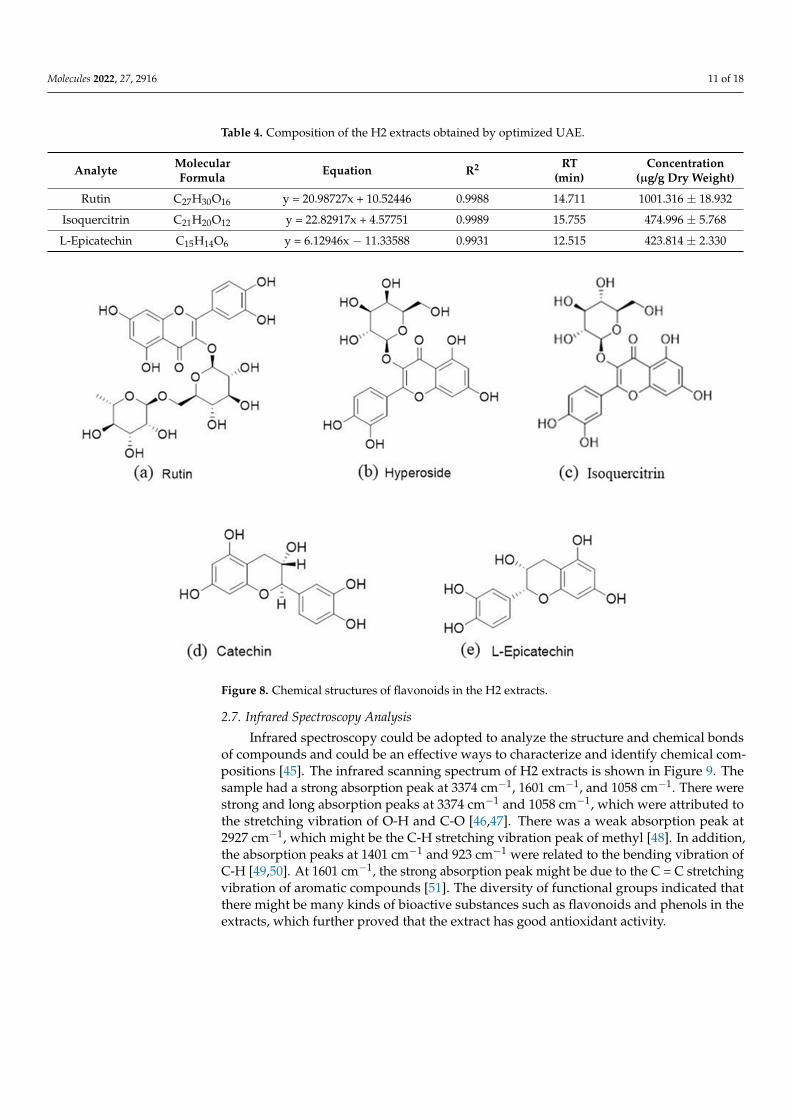
The flavonoids in the extracts were analyzed qualitatively and quantitatively usingHPLC. Qualitative analysis was carried out by comparing the retention time of the stan-dards and the extract [41,42]. The standards for HPLC analysis were selected according tothe common flavonoids in the literature review, which have been reported in green leafyplants and Hemerocallis fulva. As shown in Figure 7, five kinds of flavonoids—includingRutin, Hyperoside, Isoquercitrin, Catechin, and L-Epicatechin—were detected to be con-sistent with the retention time of the standards. Hypericin and Catechin were beyond thequantitative range and their retention times were 15.501 min and 11.229 min, respectively.The contents of three quantifiable flavonoids at 254 nm are displayed in Table 4. Thequantification of flavonoids in Hemerocallis fulva leaves was almost consistent with that
Molecules 2022, 27, 2916 10 of 18
reported by Szewczyk et al. [43]. The content of Rutin could reach 1001.316 ± 18.932 µg/g,close to that reported in the literature. The structural formula of flavonoids in the extractsis shown in Figure 8. Zhang et al. reported on lariciresinol, Roseoside, Phlomuroside, andother compounds in the methanol water extracts of Hemerocallis leaves. These compoundshad strong antioxidant activity when the concentration was 50 µg/mL, which could exceed72.7% [44].
Molecules 2022, 27, x FOR PEER REVIEW 10 of 19
.
Figure 6. Effect of the H2 extracts on ROS level in HaCaT cells treated with H2O2. Mode is H2O2
group. Significance: ### p < 0.001, *** p < 0.001.
2.6. HPLC Analysis
The flavonoids in the extracts were analyzed qualitatively and quantitatively using
HPLC. Qualitative analysis was carried out by comparing the retention time of the
standards and the extract [42,43]. The standards for HPLC analysis were selected ac-
cording to the common flavonoids in the literature review, which have been reported in
green leafy plants and Hemerocallis fulva. As shown in Figure 7, five kinds of flavo-
noids—including Rutin, Hyperoside, Isoquercitrin, Catechin, and L-Epicatechin—were
detected to be consistent with the retention time of the standards. Hypericin and Cate-
chin were beyond the quantitative range and their retention times were 15.501 min and
11.229 min, respectively. The contents of three quantifiable flavonoids at 254 nm are dis-
played in Table 4. The quantification of flavonoids in Hemerocallis fulva leaves was al-
most consistent with that reported by Szewczyk et al. [44]. The content of Rutin could
reach 1001.316 ± 18.932 μg/g, close to that reported in the literature. The structural for-
mula of flavonoids in the extracts is shown in Figure 8. Zhang et al. reported on
lariciresinol, Roseoside, Phlomuroside, and other compounds in the methanol water ex-
tracts of Hemerocallis leaves. These compounds had strong antioxidant activity when
the concentration was 50 μg/mL, which could exceed 72.7% [45].
Figure 6. Effect of the H2 extracts on ROS level in HaCaT cells treated with H2O2. Mode is H2O2
group. Significance: ### p < 0.001, *** p < 0.001.
Molecules 2022, 27, x FOR PEER REVIEW 11 of 19
Figure 7. HPLC of the H2 extracts obtained by optimized UAE. 1—Catechin; 2—L-Epicatechin;
3—Rutin; 4—Hyperoside; 5—Isoquercitrin.
Figure 8. Chemical structures of flavonoids in the H2 extracts.
Table 4. Composition of the H2 extracts obtained by optimized UAE.
Analyte Molecular
Formula Equation R2
RT
(min)
Concentration
(μg/g Dry
Weight)
Rutin C27H30O16 y = 20.98727x +
10.52446 0.9988 14.711 1001.316 ± 18.932
Isoquercitrin C21H20O12 y = 22.82917x +
4.57751 0.9989 15.755 474.996 ± 5.768
L-Epicatechin C15H14O6 y = 6.12946x −
11.33588 0.9931 12.515 423.814 ± 2.330
Figure 7. HPLC of the H2 extracts obtained by optimized UAE. 1—Catechin; 2—L-Epicatechin;3—Rutin; 4—Hyperoside; 5—Isoquercitrin.
Molecules 2022, 27, 2916 11 of 18
Table 4. Composition of the H2 extracts obtained by optimized UAE.
Analyte MolecularFormula Equation R2 RT
(min)Concentration
(µg/g Dry Weight)
Rutin C27H30O16 y = 20.98727x + 10.52446 0.9988 14.711 1001.316 ± 18.932
Isoquercitrin C21H20O12 y = 22.82917x + 4.57751 0.9989 15.755 474.996 ± 5.768
L-Epicatechin C15H14O6 y = 6.12946x − 11.33588 0.9931 12.515 423.814 ± 2.330
Molecules 2022, 27, x FOR PEER REVIEW 11 of 19
Figure 7. HPLC of the H2 extracts obtained by optimized UAE. 1—Catechin; 2—L-Epicatechin;
3—Rutin; 4—Hyperoside; 5—Isoquercitrin.
Figure 8. Chemical structures of flavonoids in the H2 extracts.
Table 4. Composition of the H2 extracts obtained by optimized UAE.
Analyte Molecular
Formula Equation R2
RT
(min)
Concentration
(μg/g Dry
Weight)
Rutin C27H30O16 y = 20.98727x +
10.52446 0.9988 14.711 1001.316 ± 18.932
Isoquercitrin C21H20O12 y = 22.82917x +
4.57751 0.9989 15.755 474.996 ± 5.768
L-Epicatechin C15H14O6 y = 6.12946x −
11.33588 0.9931 12.515 423.814 ± 2.330
Figure 8. Chemical structures of flavonoids in the H2 extracts.
2.7. Infrared Spectroscopy Analysis
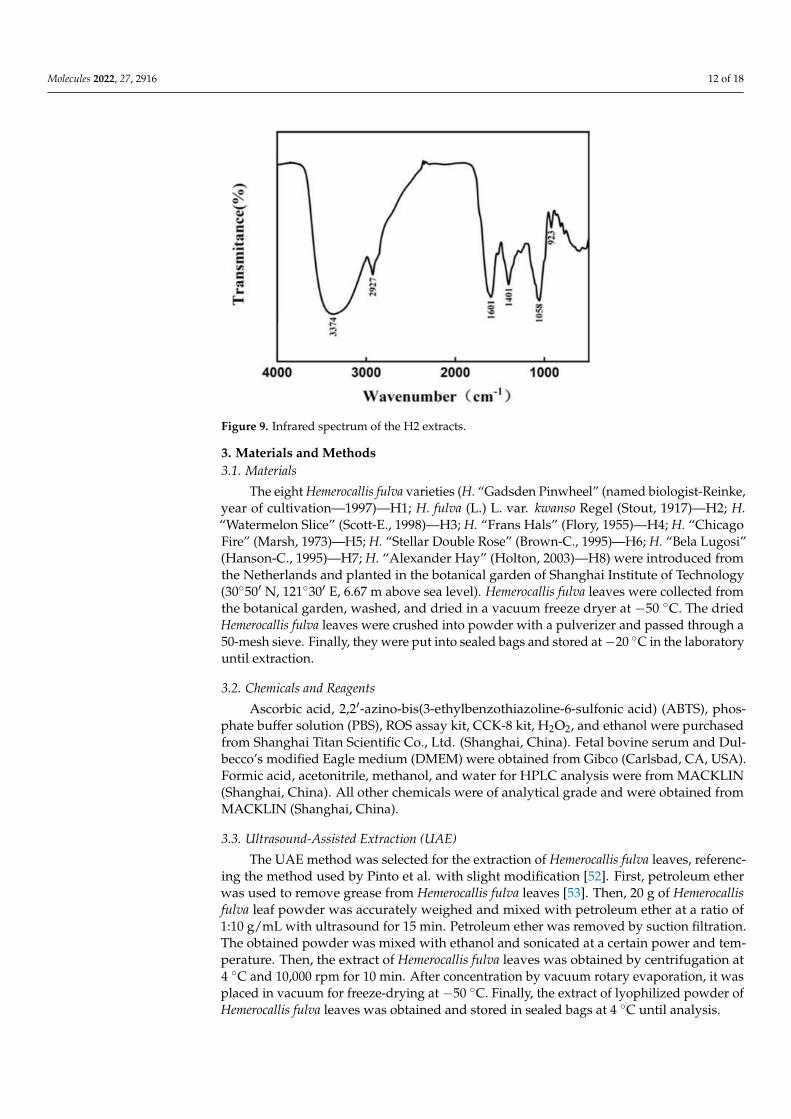
Infrared spectroscopy could be adopted to analyze the structure and chemical bondsof compounds and could be an effective ways to characterize and identify chemical com-positions [45]. The infrared scanning spectrum of H2 extracts is shown in Figure 9. Thesample had a strong absorption peak at 3374 cm−1, 1601 cm−1, and 1058 cm−1. There werestrong and long absorption peaks at 3374 cm−1 and 1058 cm−1, which were attributed tothe stretching vibration of O-H and C-O [46,47]. There was a weak absorption peak at2927 cm−1, which might be the C-H stretching vibration peak of methyl [48]. In addition,the absorption peaks at 1401 cm−1 and 923 cm−1 were related to the bending vibration ofC-H [49,50]. At 1601 cm−1, the strong absorption peak might be due to the C = C stretchingvibration of aromatic compounds [51]. The diversity of functional groups indicated thatthere might be many kinds of bioactive substances such as flavonoids and phenols in theextracts, which further proved that the extract has good antioxidant activity.
Molecules 2022, 27, 2916 12 of 18
Molecules 2022, 27, x FOR PEER REVIEW 12 of 19
2.7. Infrared Spectroscopy Analysis
Infrared spectroscopy could be adopted to analyze the structure and chemical
bonds of compounds and could be an effective ways to characterize and identify chemi-
cal compositions [46]. The infrared scanning spectrum of H2 extracts is shown in Figure
9. The sample had a strong absorption peak at 3374 cm−1, 1601 cm−1, and 1058 cm−1. There
were strong and long absorption peaks at 3374 cm−1 and 1058 cm−1, which were attribut-
ed to the stretching vibration of O-H and C-O [47,48]. There was a weak absorption peak
at 2927 cm−1, which might be the C-H stretching vibration peak of methyl [49]. In addi-
tion, the absorption peaks at 1401 cm−1 and 923 cm−1 were related to the bending vibra-
tion of C-H [50,51]. At 1601 cm−1, the strong absorption peak might be due to the C = C
stretching vibration of aromatic compounds [52]. The diversity of functional groups in-
dicated that there might be many kinds of bioactive substances such as flavonoids and
phenols in the extracts, which further proved that the extract has good antioxidant activ-
ity.
Figure 9. Infrared spectrum of the H2 extracts.
3. Materials and Methods
3.1. Materials
The eight Hemerocallis fulva varieties (H. “Gadsden Pinwheel” (named
biologist-Reinke, year of cultivation—1997)—H1; H. fulva (L.) L. var. kwanso Regel (Stout,
1917)—H2; H. “Watermelon Slice” (Scott-E., 1998)—H3; H. “Frans Hals” (Flory,
1955)—H4; H. “Chicago Fire” (Marsh, 1973)—H5; H. “Stellar Double Rose” (Brown-C.,
1995)—H6; H. “Bela Lugosi” (Hanson-C., 1995)—H7; H. “Alexander Hay” (Holton,
2003)—H8) were introduced from the Netherlands and planted in the botanical garden of
Shanghai Institute of Technology (30°50′ N, 121°30′ E, 6.67 m above sea level). Hemerocal-
lis fulva leaves were collected from the botanical garden, washed, and dried in a vacuum
freeze dryer at −50 °C. The dried Hemerocallis fulva leaves were crushed into powder with
a pulverizer and passed through a 50-mesh sieve. Finally, they were put into sealed bags
and stored at −20 °C in the laboratory until extraction.
3.2. Chemicals and Reagents
Ascorbic acid, 2, 2’-azino-bis(3-ethylbenzothiazoline-6-sulfonic acid) (ABTS), phos-
phate buffer solution (PBS), ROS assay kit, CCK-8 kit, H2O2, and ethanol were purchased
from Shanghai Titan Scientific Co., Ltd. (Shanghai, China). Fetal bovine serum and Dul-
becco’s modified Eagle medium (DMEM) were obtained from Gibco (Carlsbad, CA,
USA). Formic acid, acetonitrile, methanol, and water for HPLC analysis were from
Figure 9. Infrared spectrum of the H2 extracts.
3. Materials and Methods3.1. Materials
The eight Hemerocallis fulva varieties (H. “Gadsden Pinwheel” (named biologist-Reinke,year of cultivation—1997)—H1; H. fulva (L.) L. var. kwanso Regel (Stout, 1917)—H2; H.“Watermelon Slice” (Scott-E., 1998)—H3; H. “Frans Hals” (Flory, 1955)—H4; H. “ChicagoFire” (Marsh, 1973)—H5; H. “Stellar Double Rose” (Brown-C., 1995)—H6; H. “Bela Lugosi”(Hanson-C., 1995)—H7; H. “Alexander Hay” (Holton, 2003)—H8) were introduced fromthe Netherlands and planted in the botanical garden of Shanghai Institute of Technology(30◦50′ N, 121◦30′ E, 6.67 m above sea level). Hemerocallis fulva leaves were collected fromthe botanical garden, washed, and dried in a vacuum freeze dryer at −50 ◦C. The driedHemerocallis fulva leaves were crushed into powder with a pulverizer and passed through a50-mesh sieve. Finally, they were put into sealed bags and stored at−20 ◦C in the laboratoryuntil extraction.
3.2. Chemicals and Reagents
Ascorbic acid, 2,2′-azino-bis(3-ethylbenzothiazoline-6-sulfonic acid) (ABTS), phos-phate buffer solution (PBS), ROS assay kit, CCK-8 kit, H2O2, and ethanol were purchasedfrom Shanghai Titan Scientific Co., Ltd. (Shanghai, China). Fetal bovine serum and Dul-becco’s modified Eagle medium (DMEM) were obtained from Gibco (Carlsbad, CA, USA).Formic acid, acetonitrile, methanol, and water for HPLC analysis were from MACKLIN(Shanghai, China). All other chemicals were of analytical grade and were obtained fromMACKLIN (Shanghai, China).
3.3. Ultrasound-Assisted Extraction (UAE)
The UAE method was selected for the extraction of Hemerocallis fulva leaves, referenc-ing the method used by Pinto et al. with slight modification [52]. First, petroleum etherwas used to remove grease from Hemerocallis fulva leaves [53]. Then, 20 g of Hemerocallisfulva leaf powder was accurately weighed and mixed with petroleum ether at a ratio of1:10 g/mL with ultrasound for 15 min. Petroleum ether was removed by suction filtration.The obtained powder was mixed with ethanol and sonicated at a certain power and tem-perature. Then, the extract of Hemerocallis fulva leaves was obtained by centrifugation at4 ◦C and 10,000 rpm for 10 min. After concentration by vacuum rotary evaporation, it wasplaced in vacuum for freeze-drying at −50 ◦C. Finally, the extract of lyophilized powder ofHemerocallis fulva leaves was obtained and stored in sealed bags at 4 ◦C until analysis.
Molecules 2022, 27, 2916 13 of 18
3.4. Determination of Total Flavonoid Content (TFC)
The TFC was measured using the aluminum nitrate colorimetric method, as describedby Cao et al. with modifications [54]. The extract (1 mL) and 5% NaNO2 solutions (1 mL)were mixed and reacted for 6 min. Then, 10% Al (NO3)3 solution (1 mL) was added andallowed to stand for 6 min. Finally, 4% NaOH solution (10 mL) was added and fully reacted.After 15 min, the absorbance was measured using an ultraviolet spectrophotometer at510 nm [55]. The TFC was used as Rutin equivalent (RE)/g of the extract of Hemerocallisfulva leaves.
3.5. Selection of Variables
Multiple factors, such as solvent to sample ratio [56], extraction time [57], ethanolconcentration [58], extraction temperature [59], and ultrasonic power [60] had significanteffects on the TFC. Therefore, for the extraction of flavonoids from Hemerocallis fulvaleaves, we selected ethanol concentration (30, 40, 50, 60, 70, 80, 90%), solvent to sampleratio (20, 25, 30, 35, 40, 45, 50 mL/g), extraction temperature (20, 30, 40, 50, 60, 70, 80 ◦C),ultrasonic power (100, 150, 200, 250, 300, 350, 400 W), and extraction time (10, 20, 30, 40, 50,60, 70 min) as variables for single-factor experiments.
3.6. RSM Experiment Design
Based on single-factor experiment, the UAE extraction process of Hemerocallis fulvaleaves was further optimized with the TFC. The three-factors-three-levels of the Box–Behnken design (BBD) was used to optimize the UAE extraction process [61]. Three factors(X1, X2, and X3) were used as independent variables and Y was used as response value.The fitting second-order polynomial regression model was as follows:
Y = β0 +k
∑i=1
βiXi +k
∑i=1
βii X2i +
k−1
∑i=1
k
∑j>1
βijXiXj
where Y is TFC (mg RE/g), Xi and Xj are independent variables (i 6= j), and K representsthe number of test variables (k = 3). The regression coefficient was defined as the intercept(β0), linear (βi), quadratic (βii ), and interaction terms (βij). Design Expert 10 was used forthe analysis of variance (ANOVA) to determine the regression coefficients (β) of the model.The coefficient of determination (R2) was used to estimate the fitness of the polynomialequation. The significances of the dependent variables were statistically analyzed using theF-value and p-value (p < 0.05).
3.7. Antioxidant Assays3.7.1. Determination of ABTS Radical Scavenging Activity
ABTS radical scavenging activity was based on the method described by Cruz et al.with minor modifications [14]. First, 7-mM ABTS solution was mixed with 2.45-mMpotassium persulfate in the same volume and reacted in the dark for 12–16 h. ABTS•+
stock solution was obtained by adjusting the absorbance value to 0.7 ± 0.02. The extractand ABTS•+ stock solution were thoroughly mixed and reacted at room temperature for30 min under dark conditions. The absorbance was measured at 734 nm in a microplatereader [62].
3.7.2. Determination of Hydroxyl (•OH) Radical Scavenging Activity
•OH radical scavenging activity was determined referring to the method describedby Zhou et al. with slight modifications [63]. The extract (2 mL) was mixed with 9 mMsalicylic acid (5 mL) and 9 mM ferrous sulfate (0.5 mL). Then, 8.8 mM H2O2 (0.5 mL) wasadded to the reaction, and the absorbance value was measured at 510 nm after 30 min.
Molecules 2022, 27, 2916 14 of 18
3.8. Cellular Antioxidant Assay3.8.1. Cell Culture
HaCaT cells were acquired from the cell bank of the Chinese Academy of Sciences(Shanghai, China). DMEM included 10% fetal bovine serum and 1% antibiotic (100 U/mL ofpenicillin and 10 µg/mL of streptomycin). All cells were added to the DMEM and culturedin a carbon dioxide incubator (ESCO celmate) under a 5% CO2 atmosphere at 37 ◦C [64].
3.8.2. Effects of H2 and H2O2 on the Activity of HaCaT Cells
The CCK-8 assay was adopted to measure the activity of the H2 extracts and H2O2on HaCaT cells, as described by Zhang et al. [65]. HaCaT cells were cultured in 96-wellplates at a density of 10,000 per well and placed in a carbon dioxide incubator at 37 ◦C and5% CO2. After the cells adhered to the wall, the extract was added and cultured for 24 h.Finally, CCK-8 was added for 4 h to determine the absorbance value. The absorbance valuewas measured at 450 nm by a microplate reader. The percentage of HaCaT cell viabilitywas calculated in the extracts and compared with the control group.
3.8.3. Effects of H2 on the ROS Level in HaCaT Cells Treated with H2O2
ROS assay was used to determine the antioxidant activity of the H2 extracts on HaCaTcells, as described by Kostka et al. [66]. To explore the cellular antioxidant activity of the H2extracts, the extract solution (20 mg/mL) was filtered by a 220 nm microporous membraneand diluted with the medium into the sample with concentrations of 0.07813–10 mg/mL.HaCaT cells were inoculated at a density of 1 × 10⁴ per well and were treated with thesample for 24 h before oxidative damage. Then, HaCaT cells were stimulated with the90 µM concentration H2O2 for 2 h to construct a H2O2-induced oxidative damage modelin vitro. The level of ROS in HaCaT cells was detected by the fluorescent probe DCFH-DA. After being cultured in the incubator for 20 min, the cells were washed with DMEMmedium [67]. Finally, the fluorescence intensity was detected by a fluorescent enzymelabeling instrument. The emission wavelength was 488 nm, and the excitation wavelengthwas 525 nm.
3.9. HPLC Analysis3.9.1. Preparation of Standard Solution
We weighed 2.5 mg of Rutin, Hyperoside, Isoquercitrin, Catechin, and L-Epicatechinin a 25-mL brown volumetric flask, dissolved them with methanol, fixed the volume asstandard stock solution and stored them in a refrigerator at 4 ◦C.
3.9.2. HPLC Conditions
In this study, HPLC (Agilent, Santa Clara, CA, USA) was used for qualitative andquantitative analysis of the extract. The chromatographic column was Agilent Eclipse PlusC18 (4.6 mm × 250 mm, 5 µm). The mobile phase was an aqueous phase (A) (0.1% formicacid, V/V) and acetonitrile (B), and the flow rate was 1 mL/min. The column temperaturewas 35 ◦C. The gradient elution program was as follows: 0–2 min, 95–95% A; 2–10 min,95%–80% A; 10–20 min, 80%–75% A; 20–25 min, 75%–75% A; 30–45 min, 75%–40% A. Thedetection wavelength of Rutin, Hyperoside, Isoquercitrin, Catechin, and L-Epicatechin was254 nm with UV scanning.
3.10. Infrared Spectroscopy
The extract was mixed with potassium bromide at a ratio of 1:100, pressed into thinslices, and then analyzed with FTIR (Fourier Transform Infrared) Spectroscopy (ThermoFisher Scientific, Waltham, MA, USA) [68]. The detection range of the infrared spectrumwas 4000 cm−1 to 500 cm−1.
Molecules 2022, 27, 2916 15 of 18
3.11. Statistical Analyses
Design Expert 10 was used to design the response surface experiment in order tooptimize the extraction process. A p-value below 0.05 was considered statistically sig-nificant. All results were expressed in the form of mean ± standard deviation (SD) ofthree independent tests. Origin 2021, GraphPad Prism 7, and SPSS 25 were used for dataprocessing and analysis.
4. Conclusions
In this paper, the ultrasound-assisted extraction method was successfully utilizedfor flavonoids from Hemerocallis fulva leaves with Box–Behnken design. In this work, theoptimal extraction conditions were obtained by evaluating three factors and verified bythe experimental value. H2 had the highest total flavone content (39.26 ± 0.458 mg RE/g)in the leaves of eight Hemerocallis fulva varieties. The extract indicated strong free radicalscavenging ability against ABTS and •OH free radicals. At a concentration of 1.25 mg/mL,the extract had no cytotoxicity towards HaCaT cells and had a protective effect againstH2O2-induced oxidative damage in the cells. HPLC was applied for qualitative andquantitative analysis of three flavonoids including Rutin, Isoquercitrin, and L-Epicatechinin the extracts. This study provides data-backed support regarding the efficiency of theextraction process, excellent antioxidant ability, and protective effect towards H2O2-injuredcells of the flavonoids of Hemerocallis fulva leaves. Based on these results, Hemerocallisfulva leaves can provide potential and cheap raw materials for the development of naturalantioxidants in drugs, cosmetics, and functional foods.
Author Contributions: Conceptualization, W.W., X.Z. and S.L.; data curation, X.Z. and S.L.; formalanalysis, W.W., X.Z., Q.L., Y.L. and S.L.; funding acquisition, W.W. and S.L.; investigation, X.Z., Y.L.and S.L.; methodology, W.W., X.Z. and S.L.; project administration, S.L.; resources, W.W., Q.L. andZ.Z.; software, X.Z. and S.L.; supervision, X.Z. and S.L.; validation, S.L.; visualization, X.Z. and S.L.;writing–original draft, X.Z. and S.L.; writing–review & editing, W.W., X.Z. and S.L. All authors haveread and agreed to the published version of the manuscript.
Funding: This research was funded by National Natural Science Foundation of China, Grant/AwardNumber: 31700816; the young and middle-aged talent development fund of Shanghai Institute ofTechnology, Grant/Award Number: ZQ2021-23.
Institutional Review Board Statement: Not applicable.
Informed Consent Statement: Not applicable.
Data Availability Statement: The data presented in this study are available on request from thecorresponding author.
Conflicts of Interest: The authors declare no conflict of interest.
Sample Availability: Samples of Hemerocallis fulva leaves extracts are available from the authors.
References1. Liu, Y.; Gao, Y.; Yuan, L.; Zhang, Q. Molecular Characterization and Expression Patterns of the HkSVP Gene Reveal Distinct Roles
in Inflorescence Structure and Floral Organ Development in Hemerocallis fulva. Int. J. Mol. Sci. 2021, 22, 12010. [CrossRef]2. Wu, W.-T.; Mong, M.-C.; Yang, Y.-C.; Wang, Z.-H.; Yin, M.-C. Aqueous and Ethanol Extracts of Daylily Flower (Hemerocallis fulva L.)
Protect HUVE Cells Against High Glucose. J. Food Sci. 2018, 83, 1463–1469. [CrossRef]3. Yang, Y.; Qin, N.; Huang, J.; Guo, A.; Kang, X.; Li, S.; Xing, G. Dynamic changes of pectin epitopes and daylily tepals during
flower opening and senescence of Hemerocallis citrina. Sci. Hortic. 2021, 288, 110367. [CrossRef]4. Liu, W.; Zhao, Y.; Sun, J.; Li, G.; Shan, Y.; Chen, P. Study the effects of drying processes on chemical compositions in daylily
flowers using flow injection mass spectrometric fingerprinting method and chemometrics. Food Res. Int. 2017, 102, 493–503.[CrossRef]
5. Matraszek-Gawron, R.; Chwil, M.; Terlecka, P.; Skoczylas, M.M. Recent Studies on Anti-Depressant Bioactive Substances inSelected Species from the Genera Hemerocallis and Gladiolus: A Systematic Review. Pharmaceuticals 2019, 12, 172. [CrossRef]
6. Chung, I.-M.; Malathy, R.; Kim, S.-H.; Kalaiselvi, K.; Prabakaran, M.; Gopiraman, M. Ecofriendly green inhibitor from Hemerocallisfulva against aluminum corrosion in sulphuric acid medium. J. Adhes. Sci. Technol. 2020, 34, 1483–1506. [CrossRef]
Molecules 2022, 27, 2916 16 of 18
7. Sun, J.; Liu, W.; Zhang, M.; Geng, P.; Shan, Y.; Li, G.; Zhao, Y.; Chen, P. The analysis of phenolic compounds in daylily usingUHPLC-HRMSn and evaluation of drying processing method by fingerprinting and metabolomic approaches. J. Food Process.Preserv. 2018, 42, e13325. [CrossRef]
8. Karak, P. Biological activities of flavonoids: An overview. Int. J. Pharm. Sci. Res. 2019, 10, 1567–1574. [CrossRef]9. Hayes, J.D.; Dinkova-Kostova, A.T.; Tew, K.D. Oxidative Stress in Cancer. Cancer Cell 2020, 38, 167–197. [CrossRef]10. Arfin, S.; Jha, N.K.; Jha, S.K.; Kesari, K.K.; Ruokolainen, J.; Roychoudhury, S.; Rathi, B.; Kumar, D. Oxidative Stress in Cancer Cell
Metabolism. Antioxidants 2021, 10, 642. [CrossRef]11. Izzo, C.; Vitillo, P.; Di Pietro, P.; Visco, V.; Strianese, A.; Virtuoso, N.; Ciccarelli, M.; Galasso, G.; Carrizzo, A.; Vecchione, C. The
Role of Oxidative Stress in Cardiovascular Aging and Cardiovascular Diseases. Life 2021, 11, 60. [CrossRef]12. Mladenovic Djordjevic, A.; Loncarevic-Vasiljkovic, N.; Gonos, E.S. Dietary Restriction and Oxidative Stress: Friends or Enemies?
Antioxid. Redox Signal. 2021, 34, 421–438. [CrossRef]13. Pisoschi, A.M.; Pop, A.; Iordache, F.; Stanca, L.; Predoi, G.; Serban, A.I. Oxidative stress mitigation by antioxidants—An overview
on their chemistry and influences on health status. Eur. J. Med. Chem. 2021, 209, 112891. [CrossRef]14. Cruz, R.G.D.; Beney, L.; Gervais, P.; Lira, S.P.; Vieira, T.; Dupont, S. Comparison of the antioxidant property of acerola extracts
with synthetic antioxidants using an in vivo method with yeasts. Food Chem. 2019, 277, 698–705. [CrossRef]15. Granato, D.; Shahidi, F.; Wrolstad, R.; Kilmartin, P.; Melton, L.D.; Hidalgo, F.J.; Miyashita, K.; Camp, J.V.; Alasalvar, C.;
Ismail, A.B.; et al. Antioxidant activity, total phenolics and flavonoids contents: Should we ban in vitro screening methods? FoodChem. 2018, 264, 471–475. [CrossRef]
16. Tungmunnithum, D.; Drouet, S.; Hano, C. Validation of a High-Performance Liquid Chromatography with Photodiode ArrayDetection Method for the Separation and Quantification of Antioxidant and Skin Anti-Aging Flavonoids from Nelumbo nuciferaGaertn. Stamen Extract. Molecules 2022, 27, 1102. [CrossRef]
17. Deseo, M.A.; Elkins, A.; Rochfort, S.; Kitchen, B. Antioxidant activity and polyphenol composition of sugarcane molasses extract.Food Chem. 2020, 314, 126180. [CrossRef]
18. Zhou, S.; Huang, G.; Chen, G. Extraction, structural analysis, derivatization and antioxidant activity of polysaccharide fromChinese yam. Food Chem. 2021, 361, 130089. [CrossRef]
19. Souto, E.B.; Zielinska, A.; Souto, S.B.; Durazzo, A.; Lucarini, M.; Santini, A.; Silva, A.M.; Atanasov, A.G.; Marques, C.;Andrade, L.N.; et al. (+)-Limonene 1,2-Epoxide-Loaded SLNs: Evaluation of Drug Release, Antioxidant Activity, and Cyto-toxicity in an HaCaT Cell Line. Int. J. Mol. Sci. 2020, 21, 1449. [CrossRef]
20. Kósa, D.; Peto, Á.; Fenyvesi, F.; Váradi, J.; Vecsernyés, M.; Gonda, S.; Vasas, G.; Fehér, P.; Bácskay, I.; Ujhelyi, Z. Formulationof novel liquid crystal (Lc) formulations with skin-permeation-enhancing abilities of plantago lanceolata (pl) extract and theirassessment on hacat cells. Molecules 2021, 26, 1023. [CrossRef]
21. Acero, N.; Gradillas, A.; Beltran, M.; Garcia, A.; Munoz Mingarro, D. Comparison of phenolic compounds profile and antioxidantproperties of different sweet cherry (Prunus avium L.) varieties. Food Chem. 2019, 279, 260–271. [CrossRef]
22. Pollini, L.; Blasi, F.; Ianni, F.; Grispoldi, L.; Moretti, S.; Di Veroli, A.; Cossignani, L.; Cenci-Goga, B.T. Ultrasound-AssistedExtraction and Characterization of Polyphenols from Apple Pomace, Functional Ingredients for Beef Burger Fortification.Molecules 2022, 27, 1933. [CrossRef]
23. Zhou, J.; Zhang, L.; Li, Q.; Jin, W.; Chen, W.; Han, J.; Zhang, Y. Simultaneous Optimization for Ultrasound-Assisted Extractionand Antioxidant Activity of Flavonoids from Sophora flavescens Using Response Surface Methodology. Molecules 2019, 24, 112.[CrossRef]
24. Tungmunnithum, D.; Drouet, S.; Kabra, A.; Hano, C. Enrichment in Antioxidant Flavonoids of Stamen Extracts from Nymphaealotus L. Using Ultrasonic-Assisted Extraction and Macroporous Resin Adsorption. Antioxidants 2020, 9, 576. [CrossRef]
25. Mrkonjic, Ž.; Rakic, D.; Kaplan, M.; Teslic, N.; Zekovic, Z.; Pavlic, B. Pressurized-liquid extraction as an efficient methodfor valorization of Thymus serpyllum herbal dust towards sustainable production of antioxidants. Molecules 2021, 26, 2548.[CrossRef]
26. Yan, J.-K.; Wang, C.; Yu, Y.-B.; Wu, L.-X.; Chen, T.-T.; Wang, Z.-W. Physicochemical characteristics and in vitro biological activitiesof polysaccharides derived from raw garlic (Allium sativum L.) bulbs via three-phase partitioning combined with gradient ethanolprecipitation method. Food Chem. 2021, 339, 128081. [CrossRef]
27. Yang, B.; Zhang, M.; Weng, H.; Xu, Y.; Zeng, L. Optimization of ultrasound assisted extraction (UAE) of Kinsenoside compoundfrom Anoectochilus roxburghii (Wall.) Lindl by response surface methodology (RSM). Molecules 2020, 25, 193. [CrossRef]
28. Jin, S.; Gao, M.; Kong, W.; Yang, B.; Kuang, H.; Yang, B.; Fu, Y.; Cheng, Y.; Li, H. Enhanced and sustainable pretreatment forbioconversion and extraction of resveratrol from peanut skin using ultrasound-assisted surfactant aqueous system with microbialconsortia immobilized on cellulose. 3 Biotech 2020, 10, 293. [CrossRef]
29. Li, D.; Qian, Y.; Tian, Y.J.; Yuan, S.M.; Wei, W.; Wang, G. Optimization of Ionic Liquid-Assisted Extraction of Biflavonoids fromSelaginella doederleinii and Evaluation of Its Antioxidant and Antitumor Activity. Molecules 2017, 22, 586. [CrossRef]
30. Nuerxiati, R.; Abuduwaili, A.; Mutailifu, P.; Wubulikasimu, A.; Rustamova, N.; Jingxue, C.; Aisa, H.A.; Yili, A. Optimization ofultrasonic-assisted extraction, characterization and biological activities of polysaccharides from Orchis chusua D. Don (Salep).Int. J. Biol. Macromol. 2019, 141, 431–443. [CrossRef]
Molecules 2022, 27, 2916 17 of 18
31. Ji, Q.; Yu, X.; Yagoub, A.E.A.; Chen, L.; Fakayode, O.A.; Zhou, C. Synergism of sweeping frequency ultrasound and deep eutecticsolvents pretreatment for fractionation of sugarcane bagasse and enhancing enzymatic hydrolysis. Ultrason. Sonochem 2021,73, 105470. [CrossRef]
32. Peanparkdee, M.; Patrawart, J.; Iwamoto, S. Effect of extraction conditions on phenolic content, anthocyanin content andantioxidant activity of bran extracts from Thai rice cultivars. J. Cereal Sci. 2019, 86, 86–91. [CrossRef]
33. Kamairudin, N.; Hoong, S.S.; Abdullah, L.C.; Ariffin, H.; Biak, D.R.A. Optimisation of Epoxide Ring-Opening Reaction for theSynthesis of Bio-Polyol from Palm Oil Derivative Using Response Surface Methodology. Molecules 2021, 26, 648. [CrossRef]
34. Prabhu, D.; Prabhu, P.R.; Rao, P. Thermodynamics, adsorption, and response surface methodology investigation of the corrosioninhibition of aluminum by Terminalia chebula Ritz. extract in H3PO4. Chem. Pap. 2020, 75, 653–667. [CrossRef]
35. Chen, S.; Zeng, Z.; Hu, N.; Bai, B.; Wang, H.; Suo, Y. Simultaneous optimization of the ultrasound-assisted extraction for phenoliccompounds content and antioxidant activity of Lycium ruthenicum Murr. fruit using response surface methodology. Food Chem.2018, 242, 1–8. [CrossRef]
36. Shah, M.; Jan, H.; Drouet, S.; Tungmunnithum, D.; Shirazi, J.H.; Hano, C.; Abbasi, B.H. Chitosan elicitation impacts flavonolignanbiosynthesis in Silybum marianum (L.) Gaertn cell suspension and enhances antioxidant and anti-inflammatory activities of cellextracts. Molecules 2021, 26, 791. [CrossRef]
37. El Hallal, R.; Lyu, N.; Wang, Y. Effect of Cetuximab-Conjugated Gold Nanoparticles on the Cytotoxicity and Phenotypic Evolutionof Colorectal Cancer Cells. Molecules 2021, 26, 567. [CrossRef]
38. Suraiya, S.; Lee, J.M.; Cho, H.J.; Jang, W.J.; Kim, D.-G.; Kim, Y.-O.; Kong, I.-S. Monascus spp. fermented brown seaweeds extractsenhance bio-functional activities. Food Biosci. 2018, 21, 90–99. [CrossRef]
39. Zhang, J.; Wang, W.; Mao, X. Chitopentaose protects HaCaT cells against H2O2-induced oxidative damage through modulatingMAPKs and Nrf2/ARE signaling pathways. J. Funct. Foods 2020, 72, 104086. [CrossRef]
40. Zhang, Q.; Yang, W.; Liu, J.; Liu, H.; Lv, Z.; Zhang, C.; Chen, D.; Jiao, Z. Identification of Six Flavonoids as Novel CellularAntioxidants and Their Structure-Activity Relationship. Oxid. Med. Cell. Longev. 2020, 2020, 4150897. [CrossRef]
41. Seal, T. Quantitative HPLC analysis of phenolic acids, flavonoids and ascorbic acid in four different solvent extracts of twowild edible leaves, Sonchus arvensis and Oenanthe linearis of North-Eastern region in India. J. Appl. Pharm. Sci. 2016, 6, 157–166.[CrossRef]
42. Fu, M.; Xu, Y.; Chen, Y.; Wu, J.; Yu, Y.; Zou, B.; An, K.; Xiao, G. Evaluation of bioactive flavonoids and antioxidant activity inPericarpium Citri Reticulatae (Citrus reticulata ‘Chachi’) during storage. Food Chem. 2017, 230, 649–656. [CrossRef]
43. Szewczyk, K.; Miazga-Karska, M.; Pietrzak, W.; Komsta, L.; Krzeminska, B.; Grzywa-Celinska, A. Phenolic Composition andSkin-Related Properties of the Aerial Parts Extract of Different Hemerocallis Cultivars. Antioxidants 2020, 9, 690. [CrossRef]
44. Zhang, Y.; Cichewicz, R.H.; Nair, M.G. Lipid peroxidation inhibitory compounds from daylily (Hemerocallis fulva) leaves. Life Sci.2004, 75, 753–763. [CrossRef]
45. Pasquini, C. Near infrared spectroscopy: A mature analytical technique with new perspectives—A review. Anal. Chim. Acta 2018,1026, 8–36. [CrossRef]
46. Ahmed, T.; Wu, Z.; Jiang, H.; Luo, J.; Noman, M.; Shahid, M.; Manzoor, I.; Allemailem, K.S.; Alrumaihi, F.; Li, B. BioinspiredGreen Synthesis of Zinc Oxide Nanoparticles from a Native Bacillus cereus Strain RNT6: Characterization and AntibacterialActivity against Rice Panicle Blight Pathogens Burkholderia glumae and B. gladioli. Nanomaterials 2021, 11, 884. [CrossRef]
47. Zhao, S.; Chen, Z.; Dong, Y.; Lu, W.; Zhu, D. The Preparation and Properties of Composite Hydrogels Based on Gelatin and(3-Aminopropyl) Trimethoxysilane Grafted Cellulose Nanocrystals Covalently Linked with Microbial Transglutaminase. Gels2022, 8, 146. [CrossRef]
48. Arik, N.; Horzum, N.; Truong, Y.B. Development and Characterizations of Engineered Electrospun Bio-Based PolyurethaneContaining Essential Oils. Membranes 2022, 12, 209. [CrossRef]
49. Oudghiri-Hassani, H.; Al Wadaani, F. Preparation, Characterization and Catalytic Activity of Nickel Molybdate (NiMoO(4))Nanoparticles. Molecules 2018, 23, 273. [CrossRef]
50. Wang, W.; Gao, Y.T.; Wei, J.W.; Chen, Y.F.; Liu, Q.L.; Liu, H.M. Optimization of Ultrasonic Cellulase-Assisted Extraction andAntioxidant Activity of Natural Polyphenols from Passion Fruit. Molecules 2021, 26, 2494. [CrossRef]
51. Kim, J.Y.; Iqbal, S.; Jang, H.J.; Jung, E.Y.; Bae, G.T.; Park, C.S.; Tae, H.S. In-Situ Iodine Doping Characteristics of ConductivePolyaniline Film Polymerized by Low-Voltage-Driven Atmospheric Pressure Plasma. Polymers 2021, 13, 418. [CrossRef] [PubMed]
52. Pinto, D.; Lameirão, F.; Delerue-Matos, C.; Rodrigues, F.; Costa, P. Characterization and Stability of a Formulation ContainingAntioxidants-Enriched Castanea sativa Shells Extract. Cosmetics 2021, 8, 49. [CrossRef]
53. Nikkhah, A.A.; Zilouei, H.; Asadinezhad, A.; Keshavarz, A. Removal of oil from water using polyurethane foam modified withnanoclay. Chem. Eng. J. 2015, 262, 278–285. [CrossRef]
54. Cao, Q.; Yan, J.; Sun, Z.; Gong, L.; Wu, H.; Tan, S.; Lei, Y.; Jiang, B.; Wang, Y. Simultaneous optimization of ultrasound-assistedextraction for total flavonoid content and antioxidant activity of the tender stem of Triarrhena lutarioriparia using response surfacemethodology. Food Sci. Biotechnol. 2021, 30, 37–45. [CrossRef]
55. Sharifi-Rad, M.; Pohl, P.; Epifano, F.; Zengin, G.; Jaradat, N.; Messaoudi, M. Teucrium polium (L.): Phytochemical Screening andBiological Activities at Different Phenological Stages. Molecules 2022, 27, 1561. [CrossRef]
56. Ulmer, C.Z.; Jones, C.M.; Yost, R.A.; Garrett, T.J.; Bowden, J.A. Optimization of Folch, Bligh-Dyer, and Matyash sample-to-extraction solvent ratios for human plasma-based lipidomics studies. Anal. Chim. Acta 2018, 1037, 351–357. [CrossRef]
Molecules 2022, 27, 2916 18 of 18
57. Ummat, V.; Tiwari, B.K.; Jaiswal, A.K.; Condon, K.; Garcia-Vaquero, M.; O’Doherty, J.; O’Donnell, C.; Rajauria, G. Optimisation ofUltrasound Frequency, Extraction Time and Solvent for the Recovery of Polyphenols, Phlorotannins and Associated AntioxidantActivity from Brown Seaweeds. Mar. Drugs 2020, 18, 250. [CrossRef]
58. Huaman-Castilla, N.L.; Martinez-Cifuentes, M.; Camilo, C.; Pedreschi, F.; Mariotti-Celis, M.; Perez-Correa, J.R. The Impact ofTemperature and Ethanol Concentration on the Global Recovery of Specific Polyphenols in an Integrated HPLE/RP Process onCarmenere Pomace Extracts. Molecules 2019, 24, 3145. [CrossRef]
59. Rosello-Soto, E.; Marti-Quijal, F.J.; Cilla, A.; Munekata, P.E.S.; Lorenzo, J.M.; Remize, F.; Barba, F.J. Influence of Temperature,Solvent and pH on the Selective Extraction of Phenolic Compounds from Tiger Nuts by-Products: Triple-TOF-LC-MS-MSCharacterization. Molecules 2019, 24, 797. [CrossRef]
60. Gao, H.; Ma, L.; Li, T.; Sun, D.; Hou, J.; Li, A.; Jiang, Z. Impact of ultrasonic power on the structure and emulsifying properties ofwhey protein isolate under various pH conditions. Process Biochem. 2019, 81, 113–122. [CrossRef]
61. Alam, P.; Noman, O.M.; Herqash, R.N.; Almarfadi, O.M.; Akhtar, A.; Alqahtani, A.S. Response Surface Methodology (RSM)-BasedOptimization of Ultrasound-Assisted Extraction of Sennoside A, Sennoside B, Aloe-Emodin, Emodin, and Chrysophanol fromSenna alexandrina (Aerial Parts): HPLC-UV and Antioxidant Analysis. Molecules 2022, 27, 298. [CrossRef] [PubMed]
62. Messaoudi, M.; Rebiai, A.; Sawicka, B.; Atanassova, M.; Ouakouak, H.; Larkem, I.; Egbuna, C.; Awuchi, C.G.; Boubekeur, S.;Ferhat, M.A.; et al. Effect of Extraction Methods on Polyphenols, Flavonoids, Mineral Elements, and Biological Activities ofEssential Oil and Extracts of Mentha pulegium L. Molecules 2021, 27, 11. [CrossRef] [PubMed]
63. Zhou, H.; Li, X.; Shang, Y.; Chen, K. Radical Scavenging Activity of Puerarin: A Theoretical Study. Antioxidants 2019, 8, 590.[CrossRef] [PubMed]
64. Li, S.S.; Gao, S.; Chen, Y.; Bao, H.; Li, Z.T.; Yao, Q.P.; Liu, J.T.; Wang, Y.; Qi, Y.X. Platelet-derived microvesicles induce calciumoscillations and promote VSMC migration via TRPV4. Theranostics 2021, 11, 2410–2423. [CrossRef] [PubMed]
65. Zhang, Q.; Lin, S.; Wang, L.; Peng, S.; Tian, T.; Li, S.; Xiao, J.; Lin, Y. Tetrahedral framework nucleic acids act as antioxidants inacute kidney injury treatment. Chem. Eng. J. 2021, 413, 127426. [CrossRef]
66. Kostka, T.; Ostberg-Potthoff, J.J.; Stärke, J.; Guigas, C.; Matsugo, S.; Mirceski, V.; Stojanov, L.; Velickovska, S.K.; Winterhalter, P.;Esatbeyoglu, T. Bioactive Phenolic Compounds from Lingonberry (Vaccinium vitis-idaea L.): Extraction, Chemical Characterization,Fractionation and Cellular Antioxidant Activity. Antioxidants 2022, 11, 467. [CrossRef]
67. Liu, H.-M.; Xu, P.-F.; Cheng, M.-Y.; Lei, S.-N.; Liu, Q.-L.; Wang, W. Optimization of Fermentation Process of Pomegranate Peeland Schisandra Chinensis and the Biological Activities of Fermentation Broth: Antioxidant Activity and Protective Effect AgainstH2O2-induced Oxidative Damage in HaCaT Cells. Molecules 2021, 26, 3432. [CrossRef]
68. Zeng, J.; Guo, Y.; Han, Y.; Li, Z.; Yang, Z.; Chai, Q.; Wang, W.; Zhang, Y.; Fu, C. A Review of the Discriminant Analysis Methodsfor Food Quality Based on Near-Infrared Spectroscopy and Pattern Recognition. Molecules 2021, 26, 749. [CrossRef]
Related Documents