STUDY OF CANOPY-MACHINE INTERACTION IN MASS MECHANICAL HARVEST OF FRESH MARKET APPLES By XIN ZHANG A dissertation submitted in partial fulfillment of the requirements for the degree of DOCTOR OF PHILOSOPHY WASHINGTON STATE UNIVERSITY Department of Biological Systems Engineering MAY 2020 © Copyright by XIN ZHANG, 2020 All Rights Reserved

Welcome message from author
This document is posted to help you gain knowledge. Please leave a comment to let me know what you think about it! Share it to your friends and learn new things together.
Transcript

STUDY OF CANOPY-MACHINE INTERACTION IN MASS MECHANICAL HARVEST
OF FRESH MARKET APPLES
By
XIN ZHANG
A dissertation submitted in partial fulfillment of
the requirements for the degree of
DOCTOR OF PHILOSOPHY
WASHINGTON STATE UNIVERSITY
Department of Biological Systems Engineering
MAY 2020
© Copyright by XIN ZHANG, 2020
All Rights Reserved

© Copyright by XIN ZHANG, 2020
All Rights Reserved
ii
To the Faculty of Washington State University:
The members of the Committee appointed to examine the dissertation of XIN ZHANG
find it satisfactory and recommend that it be accepted.
Qin Zhang, Ph.D., Chair
Manoj Karkee, Ph.D., Co-Chair
Matthew D. Whiting, Ph.D.

iii
ACKNOWLEDGMENT
I would like to take this opportunity to express my greatest appreciations to the people who
have been very supportive and helpful to me during my Ph.D. program at Washington State
University (WSU). I particularly would like to first thank my both research committee co-chairs,
Dr. Qin Zhang and Dr. Manoj Karkee, who are also my academic co-advisors at WSU. I am very
grateful that Dr. Zhang offered me this precious opportunity to join the Center for Precision and
Automated Agricultural Systems (CPAAS). With his very accomplished academic and industrial
experiences, Dr. Zhang generously guided me through most of the difficulties that I have
encountered during my Ph.D. study. He also asked me to meet him regularly to ensure my research
progress is on track. He not only helped me to define my research goal and objectives, but also
taught me so much more than just knowing “how to do research” that I am certainly benefited for
lifetime.
I have been feeling lucky enough to have Dr. Karkee as my co-advisor at WSU, who has
very strong and outstanding records in the area of agricultural robotics and automations. Dr.
Karkee kindly provided me all necessary guidance and resources with his time and patience
whenever I seek for help from him. Dr. Karkee always encourages me to “stay cool and
optimistically confident” when I was feeling low and anxious. I am so inspired by his caring and
wise personality. I sincerely appreciate him for helping me to “grow up” not only as an independent
researcher in the field I study, but also as an individual in the community.
Meanwhile, I am also deeply grateful to have Dr. Matthew D. Whiting from WSU
Department of Horticulture in my academic committee. With his wide background in biological
and horticultural fields, Dr. Whiting helped to make my research results much more meaningful
and promising as the applied engineering for local apple growers. He helped me to improve my

iv
data presentation and oral communication skills by always encouraging me to express my ideas
and opinions during group meetings. It would never have been possible for me to finish this
journey without my three committee members’ support, dedication, and challenge.
In addition, I would like to give my sincere thanks to a former CPAAS research engineer,
Dr. Long He, for his great help for my experimental plan and setup, machine configuration, and
data analysis, although very soon he was offered a faculty position at The Pennsylvania State
University after I joined the lab. However, he still helps me in revising manuscripts and providing
constructive suggestions to my research progress. I highly acknowledge Mr. Patrick A. Scharf, a
CPAAS engineering technician, for his great support in fabricating and maintaining the shake-and-
catch platform, which I worked with throughout my Ph.D. study. I also acknowledge Ms. Linda S.
Root for her great efforts in managing CPAAS a very comfortable place to work.
This is a great chance to express my special thanks to one of CPAAS collaborators, Mr.
David Allan, who has always generously provided his commercial apple orchards to me for
conducting all my research experiments and data collections. I worked closely with his research
manager, Ms. Elvia Munoz, to set up the experimental sites.
The journey to pursue a Ph.D. degree could be very painful, but the people who I daily
worked with made my life much happier and easier. I would like to acknowledge all my current
and previous colleagues at CPAAS, especially my colleagues at #AgRobotics lab who I worked
closely. I particularly want to thank those who have been helping me out in intensive field data
collections, including Dr. Yunxiang Ye, Dr. Jing Zhang, Dr. Shenglian Lu, Dr. Lin Chen, Dr.
Yanru Zhao, Dr. Longsheng Fu, Santosh Bhusal, Zixuan He, Connor M. Dykes, Yaqoob Majeed,
Sushma Thapa, and Uddhav Bhattarai. For many of those are also my close friends in daily life.

v
I would like to give thanks to my friends at WSU who have also been very thoughtful to
me whenever I need some personal help or talk, including Dr. Esther Hernandez, Rakesh Ranjan,
Behnaz Molaei, Martin Churuvija, Zheng Zhou, Katherine C. Taylor, Rosbelys G. Diverres
Naranjo, Chongyuan Zhang, Momtanu Chakraborty, and many others. I also want to give a special
memory to one person, Yue Qing, who accidently lost her young life in 2018. She is a very happy
person who made me laugh a lot even though we just knew each other for a short period. Her death
made me very sad and made me to rethink of my own life. In 2016, I came to the U.S. alone and I
do not think I could survive at the beginning without my friends’ cares from China, including
Luding Yue, Yachao Mao, Jing Zhao, and Yang Liu. They are all extraordinary friends.
I highly acknowledge that Washington State Scholarship Fund and China Scholarship
Council (CSC) financially covered all my tuition fee and living stipend since August 2016 for
pursuing my Ph.D. degree at WSU.
I know my words are absolutely too plain to express my “thanks” to my mother, Xiwen
Yuan, and my father, Yuanjie Zhang, for their unconditional love and support, spiritually and
financially, for years. I appreciate they give me such a huge space to grow up freely. They let me
be educated very well, go wherever I want to go, do whatever I want to do, and be whoever I want
to be. They give me so much respect as an individual even I am the only child to them.
My life in Prosser has been very simple but very enjoyable during the past 3.5 years. It is
so much more than just the clean air, quiet streets and river, beautiful sunrise and sunset, and
friendly neighbors. I enjoyed every subtle thing that this small city has to offer.
This is a tough but rewarding journey. I have been losing so many things and an important
person to complete it, but I wish I would never look back.
Xin Zhang
vi
STUDY OF CANOPY-MACHINE INTERACTION IN MASS MECHANICAL HARVEST
OF FRESH MARKET APPLES
Abstract
by Xin Zhang, Ph.D.
Washington State University
May 2020
Chair: Qin Zhang
Co-Chair: Manoj Karkee
Fresh-market apple is one of the high-value agricultural produces in the United States and
Washington. These apples are harvested manually worldwide, which requires a large seasonal
workforce. Due to uncertain availability and rising cost of labor, the need for mechanical
harvesting technologies has become critically important. Shake-and-catch harvesting technology
has been studied to address this issue. Major challenges for mechanically harvesting fresh-market
fruit include insufficient fruit removal, high fruit damage, and low labor productivity. As a way to
address these challenges, this study focused on understanding canopy responses to the harvesting
system through employing a supervised machine learning algorithm. Specifically, it aimed at
identifying the most relevant canopy parameters influencing the fruit removal during mechanical
harvesting. Based on the analysis of apples ‘harvested’ mechanically and those that remained on
the trees after harvesting operation, fruit load, branch diameter, and shoot length/diameter were
found to be the canopy parameters highly relevant to the success of mechanical harvesting
techniques. Field tests, therefore, revealed that the pruning strategies have a remarkable influence

vii
on fruit removal efficiency. It was found that, to maintain a minimum removal efficiency of 85%,
the shoot length should be less than 15 cm or S-index (the ratio of shoot diameter to length) should
be >0.03.
This study also included a comprehensive evaluation for comparing different harvesting
systems based on multi-year/cultivar field trials. The results showed that the semi-automated
system was more effective (fruit removal efficiency of 90%) compared to the hand-held (87%)
and the manually operated hydraulic systems (84%). To further advance the automated machine
operation, a machine vision (deep learning-based) system was developed for detecting and
localizing tree trunks and branches, which achieved an intersection over union (the ratio of
overlapping to total area) of 0.69 in trunk/branch detection. Polynomial curves were then employed
for fitting the branches/trunks through the detected segments, which was used in estimating
shaking locations on those branches. This research served as a basis for optimizing and advancing
shake-and-catch harvesting technologies on fresh-market apple harvesting, which is expected to
make a huge, positive impact on the long-term economic sustainability of apple industry.
viii
TABLE OF CONTENTS
Page
ACKNOWLEDGMENT................................................................................................................ iii
ABSTRACT ................................................................................................................................... vi
LIST OF TABLES ....................................................................................................................... xiii
LIST OF FIGURES ...................................................................................................................... xv
CHAPTER ONE ............................................................................................................................. 1
INTRODUCTION ....................................................................................................................... 1
1.1. Background ................................................................................................................... 1
1.2. Research Goal and Objectives ...................................................................................... 7
1.3. Organization of the Dissertation ................................................................................... 9
REFERENCES .......................................................................................................................... 11
CHAPTER TWO .......................................................................................................................... 14
MECHANIZED AND AUTOMATED TREE FRUIT HARVESTING .................................. 14
2.1. Abstract ....................................................................................................................... 14
2.2. Introduction and Problem Statement .......................................................................... 15
2.3. Tree Fruit Crop Architecture and Mechanized/Robotic Harvesting .......................... 18
2.3.1. Crop/canopy management for harvesting ........................................................... 19
2.3.2. Crop selection for harvesting .............................................................................. 23
2.4. Concluding Remarks and Future Direction ................................................................ 25
REFERENCES .......................................................................................................................... 28
CHAPTER THREE ...................................................................................................................... 34
ix
DETERMINATION OF KEY CANOPY PARAMETERS FOR MASS MECHANICAL
APPLE HARVESTING USING SUPERVISED MACHINE LEARNING AND PRINCIPAL
COMPONENT ANALYSIS ..................................................................................................... 34
3.1. Abstract ....................................................................................................................... 34
3.2. Introduction ................................................................................................................ 35
3.3. Materials and Methods ............................................................................................... 38
3.3.1. Field characteristics and trials ............................................................................. 38
3.3.1.1. Commercial orchards ....................................................................................... 38
3.3.1.2. Canopy parameters .......................................................................................... 39
3.3.1.3. Harvesting trials ............................................................................................... 43
3.3.2. Supervised machine learning .............................................................................. 44
3.3.2.1. System components ......................................................................................... 44
3.3.2.2. Model selection................................................................................................ 47
3.3.2.3. Model optimization and evaluation ................................................................. 48
3.4. Results and Discussion ............................................................................................... 54
3.4.1. Supervised machine learning .............................................................................. 54
3.4.1.1. Model training and cross-validation ................................................................ 54
3.4.1.2. Model testing ................................................................................................... 58
3.4.2. Principal components (PCs) ................................................................................ 60
3.5. Conclusions ................................................................................................................ 65
REFERENCES .......................................................................................................................... 68
CHAPTER FOUR ......................................................................................................................... 74
A PRECISION PRUNING STRATEGY FOR IMPROVING EFFICIENCY OF VIBRATORY
MECHANICAL HARVESTING OF APPLES ........................................................................ 74
4.1. Abstract ....................................................................................................................... 74
x
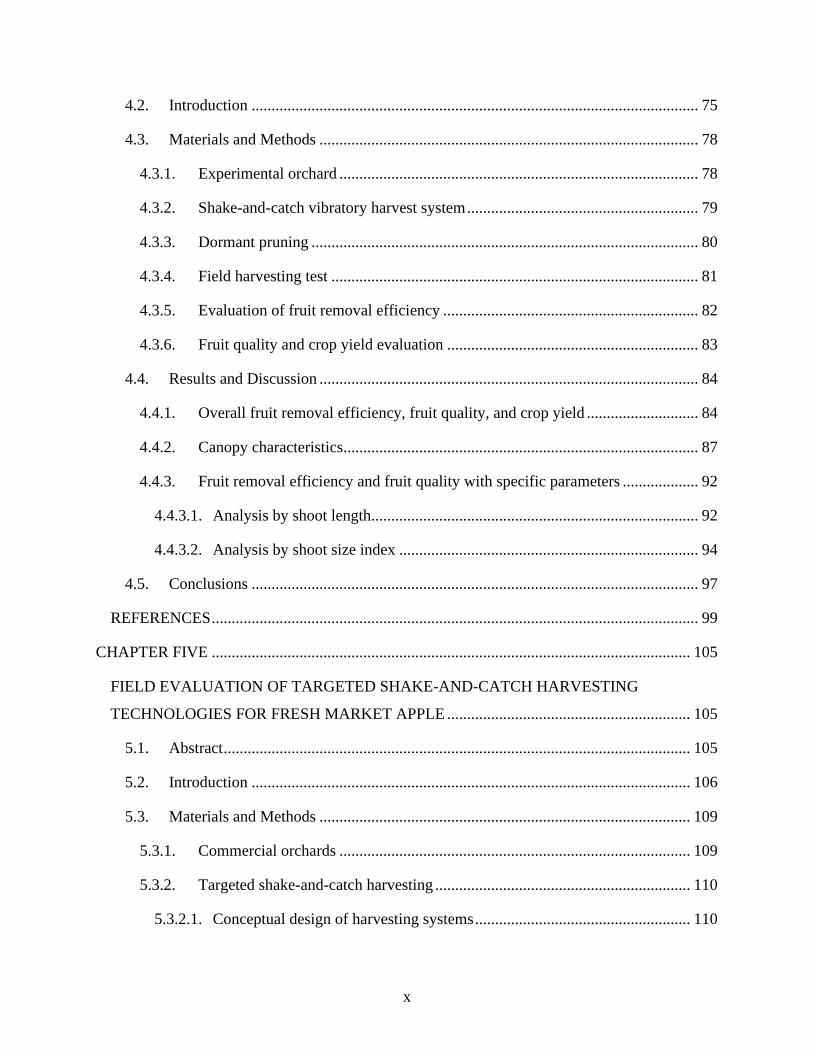
4.2. Introduction ................................................................................................................ 75
4.3. Materials and Methods ............................................................................................... 78
4.3.1. Experimental orchard .......................................................................................... 78
4.3.2. Shake-and-catch vibratory harvest system .......................................................... 79
4.3.3. Dormant pruning ................................................................................................. 80
4.3.4. Field harvesting test ............................................................................................ 81
4.3.5. Evaluation of fruit removal efficiency ................................................................ 82
4.3.6. Fruit quality and crop yield evaluation ............................................................... 83
4.4. Results and Discussion ............................................................................................... 84
4.4.1. Overall fruit removal efficiency, fruit quality, and crop yield ............................ 84
4.4.2. Canopy characteristics......................................................................................... 87
4.4.3. Fruit removal efficiency and fruit quality with specific parameters ................... 92
4.4.3.1. Analysis by shoot length.................................................................................. 92
4.4.3.2. Analysis by shoot size index ........................................................................... 94
4.5. Conclusions ................................................................................................................ 97
REFERENCES .......................................................................................................................... 99
CHAPTER FIVE ........................................................................................................................ 105
FIELD EVALUATION OF TARGETED SHAKE-AND-CATCH HARVESTING
TECHNOLOGIES FOR FRESH MARKET APPLE ............................................................. 105
5.1. Abstract ..................................................................................................................... 105
5.2. Introduction .............................................................................................................. 106
5.3. Materials and Methods ............................................................................................. 109
5.3.1. Commercial orchards ........................................................................................ 109
5.3.2. Targeted shake-and-catch harvesting ................................................................ 110
5.3.2.1. Conceptual design of harvesting systems ...................................................... 110

xi
5.3.2.2. Vibratory shaking methods ............................................................................ 111
5.3.2.3. Shake-and-catch harvesting systems ............................................................. 115
5.3.2.4. A semi-automated harvest system ................................................................. 117
5.3.3. Performance measures....................................................................................... 121
5.3.3.1. Fruit harvesting efficiency ............................................................................. 121
5.3.3.2. Fruit quality ................................................................................................... 122
5.3.3.3. Time efficiency .............................................................................................. 123
5.4. Results and Discussion ............................................................................................. 124
5.4.1. Effect of apple cultivar ...................................................................................... 124
5.4.2. Evaluation of shaking methods ......................................................................... 126
5.4.3. Evaluation of harvesting systems ...................................................................... 129
5.4.4. Time efficiency of semi-automated harvest system .......................................... 131
5.5. Conclusions .............................................................................................................. 134
REFERENCES ........................................................................................................................ 136
CHAPTER SIX ........................................................................................................................... 141
COMPUTER VISION BASED TREE TRUNK AND BRANCH IDENTIFICATION AND
SHAKING POINTS DETECTION IN DENSE-FOLIAGE CANOPY FOR MECHANICAL
HARVESTING OF APPLES .................................................................................................. 141
6.1. Abstract ..................................................................................................................... 141
6.2. Introduction .............................................................................................................. 142
6.3. Materials and Methods ............................................................................................. 146
6.3.1. Experimental orchards....................................................................................... 146
6.3.2. Image acquisition .............................................................................................. 148
6.3.3. Image pre-processing ........................................................................................ 150
6.3.4. Semantic segmentation using deep learning ..................................................... 152
xii
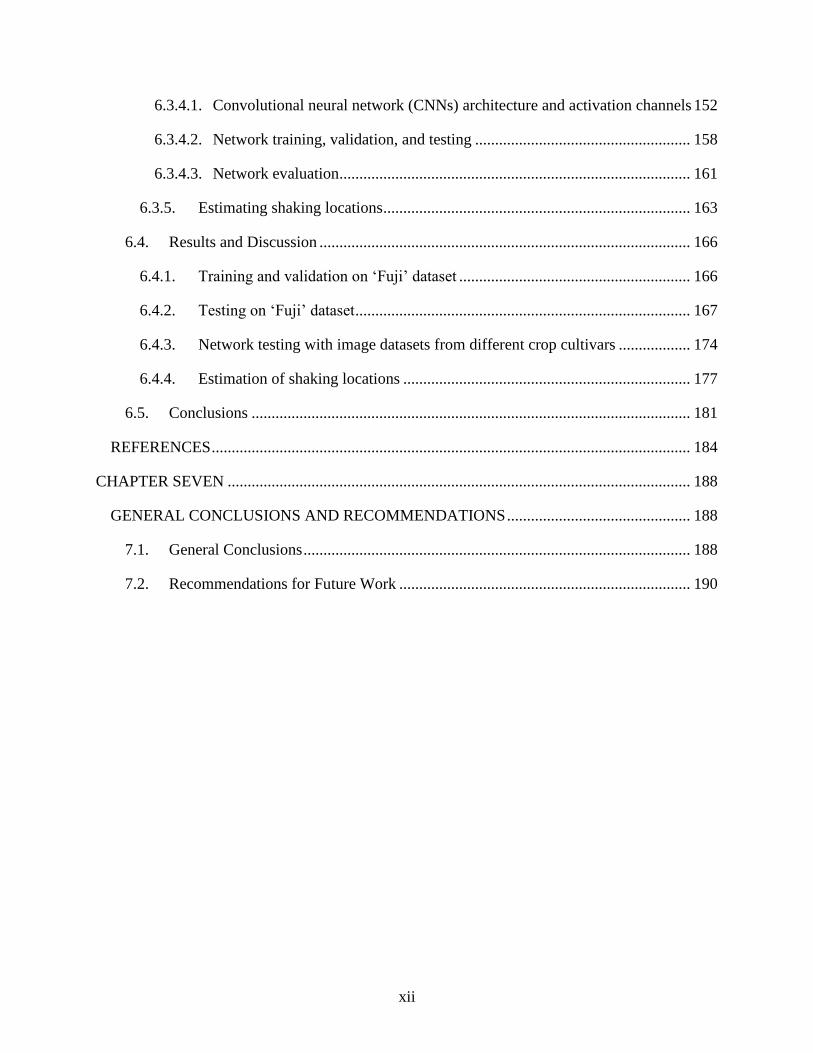
6.3.4.1. Convolutional neural network (CNNs) architecture and activation channels 152
6.3.4.2. Network training, validation, and testing ...................................................... 158
6.3.4.3. Network evaluation ........................................................................................ 161
6.3.5. Estimating shaking locations ............................................................................. 163
6.4. Results and Discussion ............................................................................................. 166
6.4.1. Training and validation on ‘Fuji’ dataset .......................................................... 166
6.4.2. Testing on ‘Fuji’ dataset .................................................................................... 167
6.4.3. Network testing with image datasets from different crop cultivars .................. 174
6.4.4. Estimation of shaking locations ........................................................................ 177
6.5. Conclusions .............................................................................................................. 181
REFERENCES ........................................................................................................................ 184
CHAPTER SEVEN .................................................................................................................... 188
GENERAL CONCLUSIONS AND RECOMMENDATIONS .............................................. 188
7.1. General Conclusions ................................................................................................. 188
7.2. Recommendations for Future Work ......................................................................... 190
xiii
LIST OF TABLES
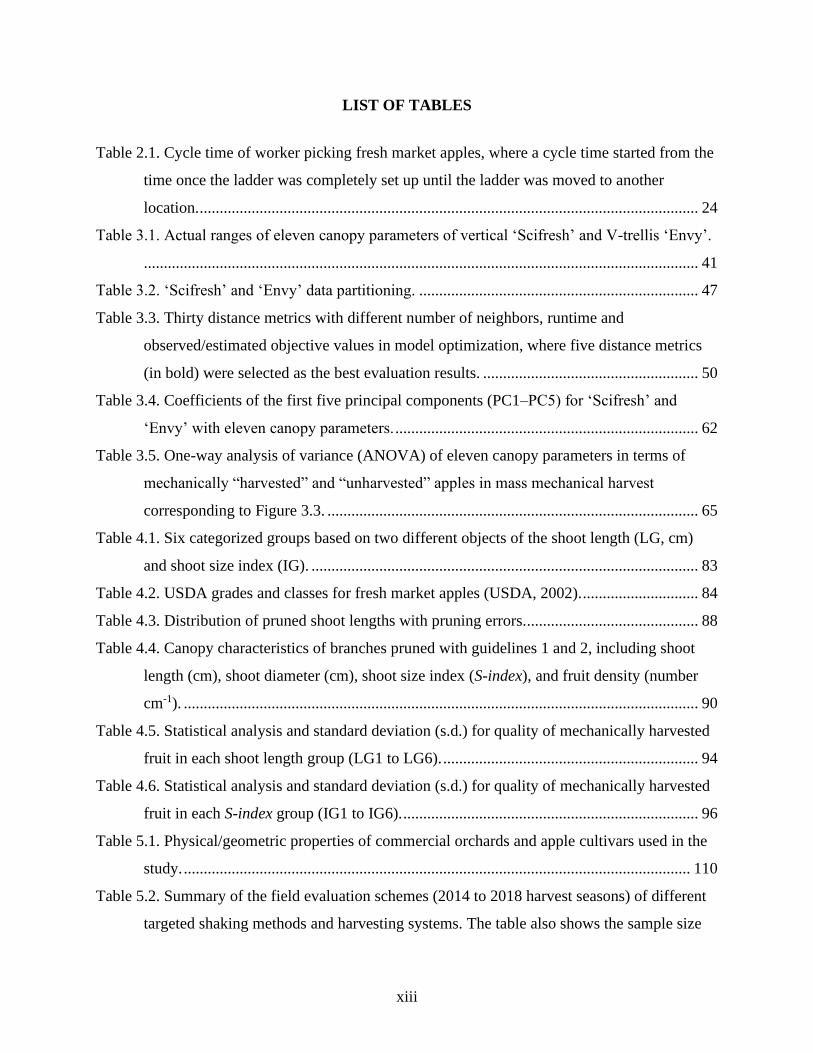
Table 2.1. Cycle time of worker picking fresh market apples, where a cycle time started from the
time once the ladder was completely set up until the ladder was moved to another
location. ............................................................................................................................. 24
Table 3.1. Actual ranges of eleven canopy parameters of vertical ‘Scifresh’ and V-trellis ‘Envy’.
........................................................................................................................................... 41
Table 3.2. ‘Scifresh’ and ‘Envy’ data partitioning. ...................................................................... 47
Table 3.3. Thirty distance metrics with different number of neighbors, runtime and
observed/estimated objective values in model optimization, where five distance metrics
(in bold) were selected as the best evaluation results. ...................................................... 50
Table 3.4. Coefficients of the first five principal components (PC1–PC5) for ‘Scifresh’ and
‘Envy’ with eleven canopy parameters. ............................................................................ 62
Table 3.5. One-way analysis of variance (ANOVA) of eleven canopy parameters in terms of
mechanically “harvested” and “unharvested” apples in mass mechanical harvest
corresponding to Figure 3.3. ............................................................................................. 65
Table 4.1. Six categorized groups based on two different objects of the shoot length (LG, cm)
and shoot size index (IG). ................................................................................................. 83
Table 4.2. USDA grades and classes for fresh market apples (USDA, 2002). ............................. 84
Table 4.3. Distribution of pruned shoot lengths with pruning errors. ........................................... 88
Table 4.4. Canopy characteristics of branches pruned with guidelines 1 and 2, including shoot
length (cm), shoot diameter (cm), shoot size index (S-index), and fruit density (number
cm-1). ................................................................................................................................. 90
Table 4.5. Statistical analysis and standard deviation (s.d.) for quality of mechanically harvested
fruit in each shoot length group (LG1 to LG6). ................................................................ 94
Table 4.6. Statistical analysis and standard deviation (s.d.) for quality of mechanically harvested
fruit in each S-index group (IG1 to IG6). .......................................................................... 96
Table 5.1. Physical/geometric properties of commercial orchards and apple cultivars used in the
study. ............................................................................................................................... 110
Table 5.2. Summary of the field evaluation schemes (2014 to 2018 harvest seasons) of different
targeted shaking methods and harvesting systems. The table also shows the sample size
xiv
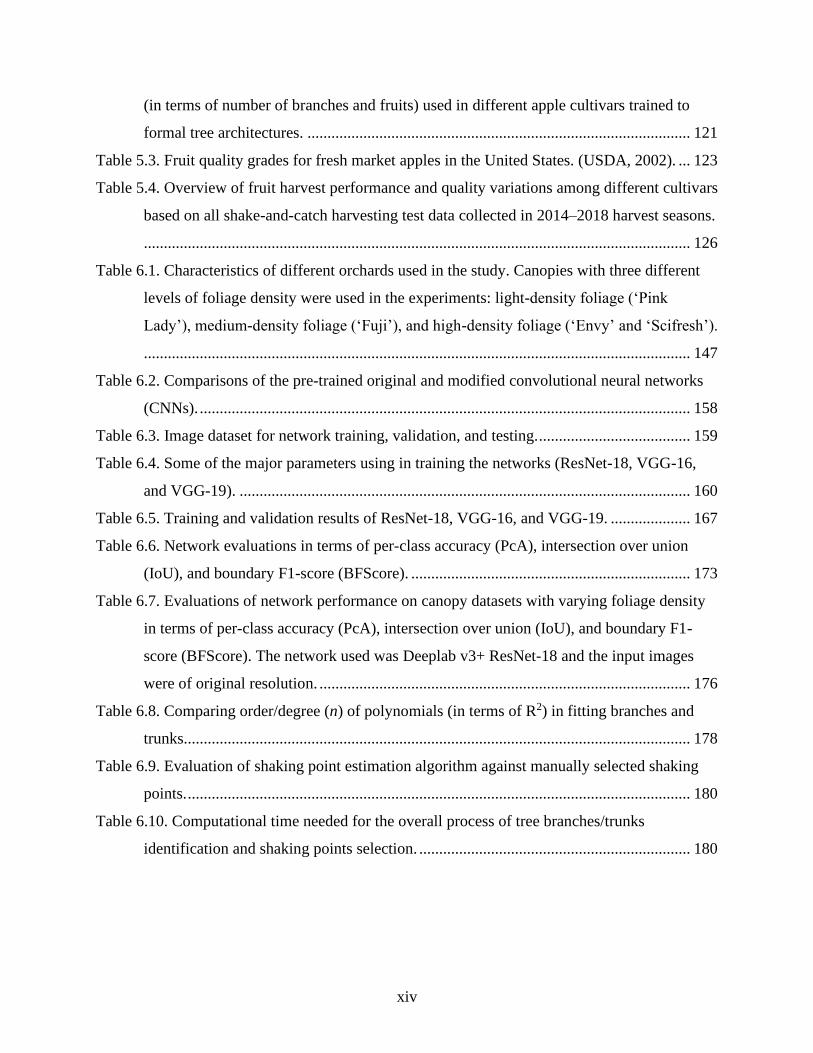
(in terms of number of branches and fruits) used in different apple cultivars trained to
formal tree architectures. ................................................................................................ 121
Table 5.3. Fruit quality grades for fresh market apples in the United States. (USDA, 2002). ... 123
Table 5.4. Overview of fruit harvest performance and quality variations among different cultivars
based on all shake-and-catch harvesting test data collected in 2014–2018 harvest seasons.
......................................................................................................................................... 126
Table 6.1. Characteristics of different orchards used in the study. Canopies with three different
levels of foliage density were used in the experiments: light-density foliage (‘Pink
Lady’), medium-density foliage (‘Fuji’), and high-density foliage (‘Envy’ and ‘Scifresh’).
......................................................................................................................................... 147
Table 6.2. Comparisons of the pre-trained original and modified convolutional neural networks
(CNNs). ........................................................................................................................... 158
Table 6.3. Image dataset for network training, validation, and testing. ...................................... 159
Table 6.4. Some of the major parameters using in training the networks (ResNet-18, VGG-16,
and VGG-19). ................................................................................................................. 160
Table 6.5. Training and validation results of ResNet-18, VGG-16, and VGG-19. .................... 167
Table 6.6. Network evaluations in terms of per-class accuracy (PcA), intersection over union
(IoU), and boundary F1-score (BFScore). ...................................................................... 173
Table 6.7. Evaluations of network performance on canopy datasets with varying foliage density
in terms of per-class accuracy (PcA), intersection over union (IoU), and boundary F1-
score (BFScore). The network used was Deeplab v3+ ResNet-18 and the input images
were of original resolution. ............................................................................................. 176
Table 6.8. Comparing order/degree (n) of polynomials (in terms of R2) in fitting branches and
trunks............................................................................................................................... 178
Table 6.9. Evaluation of shaking point estimation algorithm against manually selected shaking
points. .............................................................................................................................. 180
Table 6.10. Computational time needed for the overall process of tree branches/trunks
identification and shaking points selection. .................................................................... 180

xv
LIST OF FIGURES
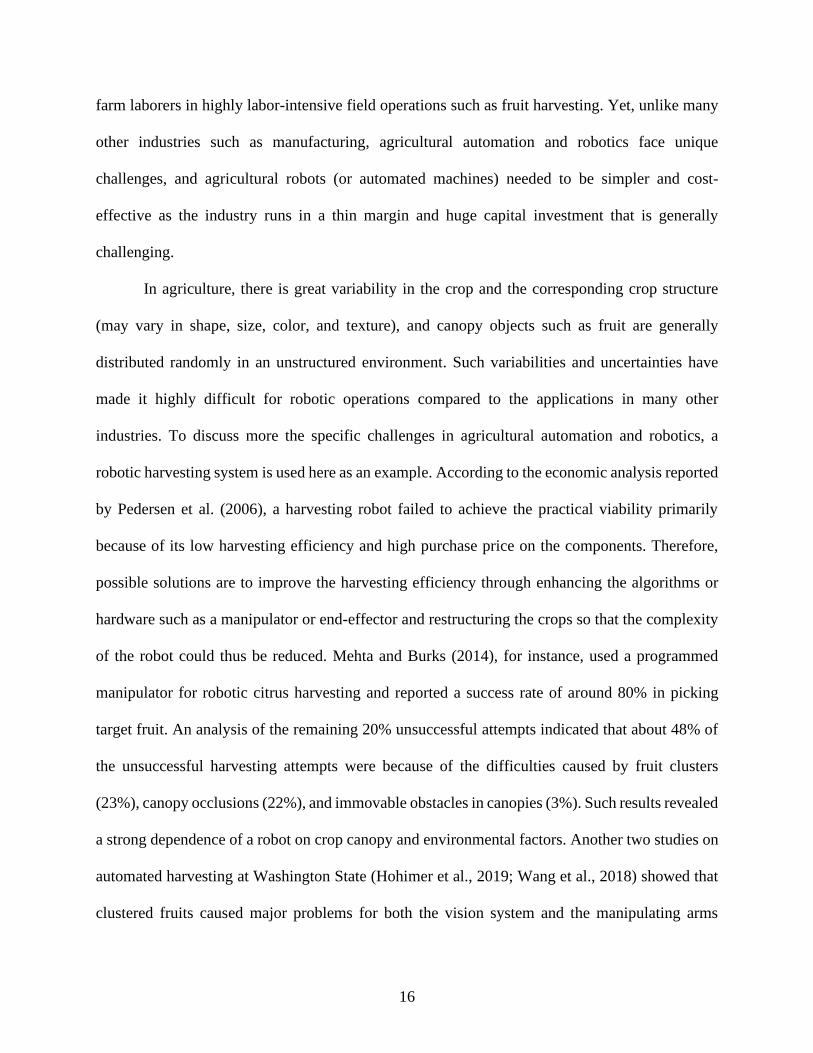
Figure 2.1. An unstructured, conventional apple tree (a) and a structured, modern apple tree (b)
in Washington State, USA. ............................................................................................... 17
Figure 2.2. An example of unsuccessful fruit detaching by a robot because of a long and thin
offshoot bearing the fruit (Silwal et al., 2017). ................................................................. 18
Figure 2.3. A vertical apple tree architecture (a) in Washington State; and its canopy intercepted
photosynthetically active radiation (PAR) ratio (at the middle tier) in a day (in September
2017) (b), where “P-10” referred to a 10-inch (more severe) pruning and “P-23” referred
to a 23-inch (less severe) pruning (the higher ratio, the more PAR intercepted). ............ 21
Figure 2.4. A typical citrus orchard in California with a conventional, conical tree architecture
(a), from Phillips et al. (1990), and mechanical harvesting on citrus in Spain for juice
industry (b), from Bordas et al. (2012). ............................................................................ 23
Figure 2.5. An illustration of trellis-trained, fruiting-wall tree architecture, which is considered
well-suited for multi-layer shake-and-catch mechanical apple harvesting. In this
architecture, the tree trunk was vertically positioned, and six to eight pairs of tree
branches were horizontally trained to trellis wires at regular intervals. With this
architecture, most of the fruits would grow along the branches and be present at the
surface of the canopy. ....................................................................................................... 27
Figure 3.1. ‘Scifresh’ (a) and ‘Envy’ (b) commercial apple trees trained in formal vertical and V-
trellis fruiting-wall architectures. ...................................................................................... 39
Figure 3.2. A typical canopy structure in these commercial apple orchards during harvest season,
where eleven physically measured canopy parameters include (1) four branch parameters,
(2) four fruit parameters, and (3) three shoot parameters. ................................................ 40
Figure 3.3. Actual probability distributions of manually measured eleven canopy parameters
(four branch parameters (a–d); noted as “B”; four fruit parameters (e–h); noted as “F”;
and three shoot parameters (i–k); noted as “S”) in terms of mechanically “harvested (-
Ha)” and “unharvested (-Un)” apples in mass mechanical harvest. ................................. 42
Figure 3.4. Natural logarithm expression, ln(SIndex), was used instead of raw data of “SIndex”
in Figure 3.3k. ................................................................................................................... 43
xvi
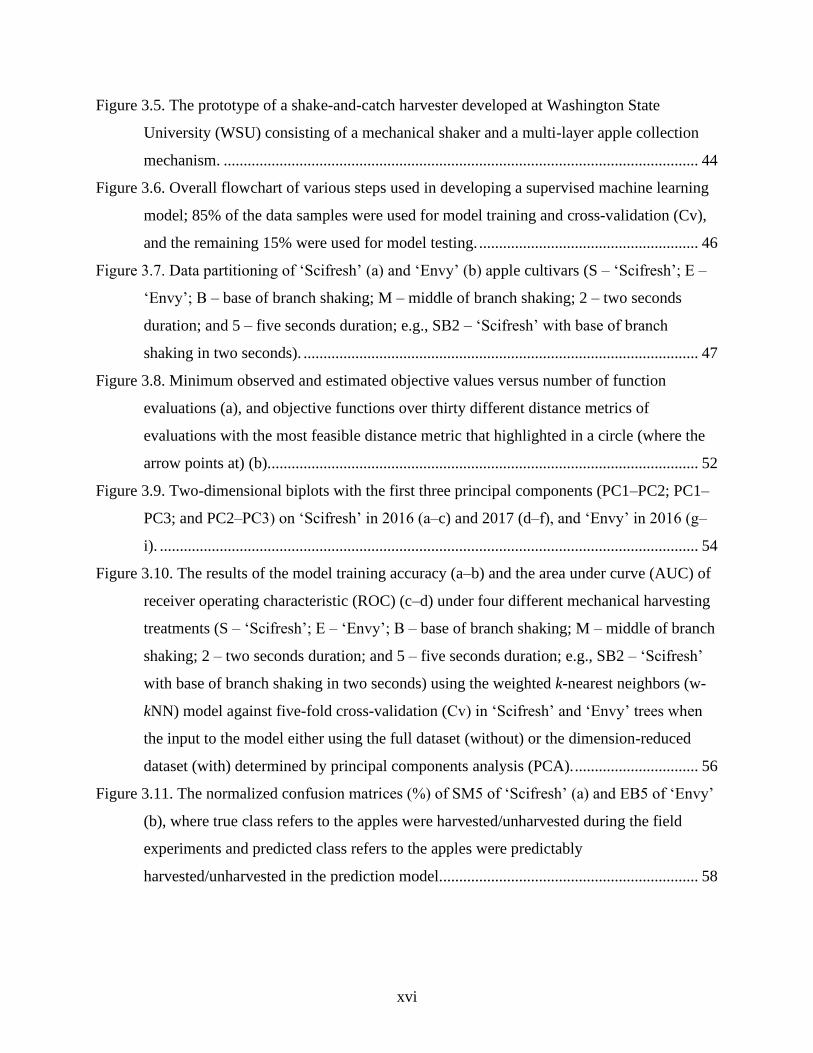
Figure 3.5. The prototype of a shake-and-catch harvester developed at Washington State
University (WSU) consisting of a mechanical shaker and a multi-layer apple collection
mechanism. ....................................................................................................................... 44
Figure 3.6. Overall flowchart of various steps used in developing a supervised machine learning
model; 85% of the data samples were used for model training and cross-validation (Cv),
and the remaining 15% were used for model testing. ....................................................... 46
Figure 3.7. Data partitioning of ‘Scifresh’ (a) and ‘Envy’ (b) apple cultivars (S – ‘Scifresh’; E –
‘Envy’; B – base of branch shaking; M – middle of branch shaking; 2 – two seconds
duration; and 5 – five seconds duration; e.g., SB2 – ‘Scifresh’ with base of branch
shaking in two seconds). ................................................................................................... 47
Figure 3.8. Minimum observed and estimated objective values versus number of function
evaluations (a), and objective functions over thirty different distance metrics of
evaluations with the most feasible distance metric that highlighted in a circle (where the
arrow points at) (b)............................................................................................................ 52
Figure 3.9. Two-dimensional biplots with the first three principal components (PC1–PC2; PC1–
PC3; and PC2–PC3) on ‘Scifresh’ in 2016 (a–c) and 2017 (d–f), and ‘Envy’ in 2016 (g–
i). ....................................................................................................................................... 54
Figure 3.10. The results of the model training accuracy (a–b) and the area under curve (AUC) of
receiver operating characteristic (ROC) (c–d) under four different mechanical harvesting
treatments (S – ‘Scifresh’; E – ‘Envy’; B – base of branch shaking; M – middle of branch
shaking; 2 – two seconds duration; and 5 – five seconds duration; e.g., SB2 – ‘Scifresh’
with base of branch shaking in two seconds) using the weighted k-nearest neighbors (w-
kNN) model against five-fold cross-validation (Cv) in ‘Scifresh’ and ‘Envy’ trees when
the input to the model either using the full dataset (without) or the dimension-reduced
dataset (with) determined by principal components analysis (PCA). ............................... 56
Figure 3.11. The normalized confusion matrices (%) of SM5 of ‘Scifresh’ (a) and EB5 of ‘Envy’
(b), where true class refers to the apples were harvested/unharvested during the field
experiments and predicted class refers to the apples were predictably
harvested/unharvested in the prediction model................................................................. 58
xvii
Figure 3.12. The results of the model testing accuracy under four different mechanical harvesting
treatments (S – ‘Scifresh’; E – ‘Envy’; B – base of branch shaking; M – middle of branch
shaking; 2 – two seconds duration; and 5 – five seconds duration; e.g., SB2 – ‘Scifresh’
with base of branch shaking in two seconds) using the trained weighted k-nearest
neighbors (w-kNN) model in ‘Scifresh’ (a) and ‘Envy’ (b) trees when the input to the
model either using the full dataset (without) or the dimension-reduced dataset (with)
determined by principal components analysis (PCA). ...................................................... 58
Figure 3.13. Cumulative variances explained by principal components (PCs) for ‘Scifresh’ (a)
and ‘Envy’ (b) (S – ‘Scifresh’; E – ‘Envy’; B – base of branch shaking; M – middle of
branch shaking; 2 – two seconds duration; and 5 – five seconds duration; e.g., SB2 –
‘Scifresh’ with base of branch shaking in two seconds). .................................................. 61
Figure 3.14. Number of times (frequency) canopy parameters deemed highly relevant
(coefficient >0.5) through the first five principal components (PC1–PC5) (where the
branch parameters were noted as “B”; fruit parameters were noted as “F”; and shoot
parameters were noted as “S”). ......................................................................................... 64
Figure 4.1. Commercial apple orchard (near Prosser, WA) used in the study: trees in the orchard
(‘Scifresh/M.9’ cultivar) were trained to vertical-trellised architecture with the row
oriented SW–NE (a), and horizontal branches of these trees were spaced about 50 cm
apart (b). ............................................................................................................................ 79
Figure 4.2. Overall shake-and-catch vibratory harvesting platform (a) developed at Washington
State University, components of mechanical shaker (b), and multi-layer fruit collection
mechanism at an elevation angle of α (c). ........................................................................ 80
Figure 4.3. Diagram of an experimental unit (branch inside the rectangle), shaking points, and
trellis wires along the target branches (a), and example of pruning by skilled workers
with specific guidelines (b). .............................................................................................. 81
Figure 4.4. Fruit removal efficiency (FRE) with pruning guidelines 1 and 2 (FRE for untreated
shoots is shown as a horizontal dashed line) (a), and quality grades (Extra Fancy, Fancy,
and Downgrade) of mechanically harvested fruits based on U.S. standards (USDA, 2002)
(b) using shake-and-catch harvesting platform and pruning guidelines 1 and 2. ............. 85
xviii
Figure 4.5. Histograms and cumulative distributions (%, solid line for guideline 1 and dashed
line for guideline 2) for shoot length (cm) (a), shoot diameter (cm) (b), shoot size index
(S-index) (c), and fruit density on branches (number cm-1) (d). ....................................... 90
Figure 4.6. Fruit removal efficiency (FRE) (a) and means percentages of mechanically harvested
fruit quality grades (b) with six shoot length groups (LG1 to LG6). ................................ 93
Figure 4.7. Fruit removal efficiency (FRE) (a) and means of percentage of mechanically
removed fruit quality (b) along with six predefined shoot size index groups (IG1 to IG6).
........................................................................................................................................... 95
Figure 5.1. Formally trained tree architectures in commercial fresh market apple orchards near
Prosser and Othello, WA, during harvest season; front view of the architecture showing
layers of tree branches trained horizontally to trellis wires (a); and side views of vertical
axis (b) and V-axis (c)..................................................................................................... 110
Figure 5.2. Conceptual design of a targeted shake-and-catch harvesting system in which the
harvest process is confined within target branches. ........................................................ 111
Figure 5.3. A pair of dual motor actuator (in which a vibrating shaft is eccentrically coupled)
based shaking mechanism (a) with the branch graspers (b) (De Kleine and Karkee, 2015);
and its actuation trajectories (left to right: linear (non-reciprocating), circle, and ‘figure-
eight’) (c). These trajectories represent the displacement of the end-effector on a planar
surface (De Kleine et al., 2016). ..................................................................................... 113
Figure 5.4. A crank-slider mechanism used to convert the rotational motion induced by the
power unit to a linear, reciprocating motion of the vibrating end-effector/head. ........... 114
Figure 5.5. Three modes of oscillation of apples under the external vibration: swinging (left),
tilting (middle), and rotating (right) (adapted from Diener et al. (1965)). ...................... 115
Figure 5.6. A hand-held shaker adapted from a commercial reciprocating saw (a); and a fruit-
catching device with a foam padded surface and bouncing and rolling buffers (b) (He et
al., 2017). ........................................................................................................................ 116
Figure 5.7. A hydraulically driven shake-and-catch harvesting platform (a); a hydraulic shaker
used in the system (b), and mirrored (two sided) operation of the multi-layer fruit
catching mechanism (c). ................................................................................................. 117

xix
Figure 5.8. A semi-automated hydraulically driven shake-and-catch harvesting system (a)
adapted from the previous prototype (Figure 5.7a) with a control panel for actuation
system (b) and an improved fruit catching mechanism (three open sections on each
catching surface with a group of rubber rods added) (c). These padded holes allow the
catchers to penetrate through the tree trunks (d), which was expected to improve fruit
catching efficiency by closing the gap between two mirrored catching mechanisms. ... 119
Figure 5.9. Fruit removal efficiency (ηr) and percentage of marketable fruit (extra fancy plus
fancy; pe + pf) of six different apple cultivars under the same shaking method
(continuous linear reciprocating harvest); different alphabetical letters represent for
significant differences. .................................................................................................... 125
Figure 5.10. The comparison of fruit removal efficiency (ηr), catching efficiency (ηc), and the
rate of marketable fruit (extra fancy plus fancy; pe + pf) resulted from continuous non-
linear shaking and continuous linear shaking on ‘Gala’ cultivar (a), and from continuous
linear shaking and intermittent linear shaking on ‘Scifresh’ cultivar (b) (statistical
analyses were conducted between each two groups under the same performance
measures; different alphabetical letters represent for significant differences). .............. 128
Figure 5.11. Fruit removal efficiency (ηr), catching efficiency (ηc), and percentage of
marketable fruit (extra fancy plus fancy; pe + pf) resulted in by a hand-held, a
hydraulically driven, and a semi-automated hydraulically driven harvest systems on
‘Scifresh’ (statistical analyses were conducted between each three groups under the same
performance measures; different alphabetical letters represent for significant differences).
......................................................................................................................................... 130
Figure 5.12. Time spent on various activities during semi-automated, hydraulically driven
harvesting (mean ±standard deviation, s.d.) of ‘Scifresh’ apples in a commercial orchard.
......................................................................................................................................... 133
Figure 6.1. Example of formally trained apple orchards in V-axis (a) and vertical axis (b)
architectures (Prosser, WA). ........................................................................................... 147
Figure 6.2. A Kinect V2 imaging sensor (a); overall work pipeline for image acquisition (b) and
pre-processing (c); and applications of the convolutional neural networks (CNNs) in
processing the collected data (d). .................................................................................... 149
xx
Figure 6.3. A customized image acquisition platform mounted on a Toro® Utility Vehicle in field
environment (a), and closeup of the imaging system set up in an inclination such that it
faces the V-axis canopies orthogonally (b). .................................................................... 149
Figure 6.4. The illustration (e.g., medium-density foliage canopy of ‘Fuji’) of a canopy points
cloud data (a), its RGB image (b), its RGB-D image after a depth threshold (1.9 m) was
applied (c), its contrast-enhanced image using histogram equalization (d), and its
corresponding pixel-wise segmented (ground-truth) image (e). ..................................... 151
Figure 6.5. Distribution of four class labels in the full dataset. .................................................. 152
Figure 6.6. The network architecture (a) and activations of channels in convolutional layers (only
the strongest activation channels were shown as examples) of the modified, pre-trained
convolutional neural networks (CNNs) implemented in this work using Deeplab v3+
ResNet-18 (b–q). ............................................................................................................. 157
Figure 6.7. Positive activation channels for four classes of ‘branches’ (a), ‘apples’ (b),
‘leaves’(c), and ‘trunks’ (d) at ‘scorer’ convolutional layer (Figure 6.6p) of the modified
Deeplab v3+ ResNet-18. ................................................................................................. 157
Figure 6.8. Flow chart of the shaking points detection technique using the segmented classes of
‘branches’ and ‘trunks’. .................................................................................................. 166
Figure 6.9. Examples of segmentation results with test images (left) using Deeplab v3+ ResNet-
18 with original image size (a) and with resized images (b), VGG-16 (c), VGG-19 (d),
along with comparison of test result and ground-truth (magenta and green regions
highlighted the areas where the segmented image varies from the ground-truth image;
right), and local boundary information of segmentation results (e) (left to right
correspond sequentially to cases from Figure 6.9a–d). ................................................... 169
Figure 6.10. Normalized confusion matrix (%) comprising the true class (vertical axis) and the
predicted class (horizontal axis) formed using the segmentation results generated by
modified Deeplab v3+ ResNet-18. The results used were generated using images with
original pixel resolution. ................................................................................................. 170
Figure 6.11. Histograms of mean intersection over union (IoU) and mean boundary-F1 score
(BFScore) using Deeplab v3+ ResNet-18 with original image size (a–b) and with resized

xxi
images (c–d), VGG-16 (e–f), and VGG-19 (g–h). In these plots, y-axis represents the
total number of images.................................................................................................... 172
Figure 6.12. Example of segmented trunk (in red) and branches (in yellow) mapped onto its
RGB-D image. ................................................................................................................ 173
Figure 6.13. Examples of segmented trunk (in red) and branches (in yellow) mapped onto
corresponding RGB-D images of light-density ‘Pink Lady’ canopies (a), and high-density
canopies of ‘Envy’ (b) and ‘Scifresh’ (c). The segmentation results were generated by
Deeplab v3+ ResNet-18 model with original image size. .............................................. 175
Figure 6.14. Illustrations of shaking points selection process described in Figure 6.8: binary mask
of tree ‘trunks’ (a), binary mask of tree ‘branches’ (b), fitted polynomial curve (degree n
= 3; blue vertical line) over ‘trunks’ (c), and fitted and mapped polynomial curves
(degree n = 3; blue horizontal lines) over ‘branches’ (d). In the plots, green ‘*’ represents
estimated shaking points at branch bases derived by solving Equations 6.10–6.12, green
‘o’ represents the error tolerance for the points (along y-axis) solved in Equation 6.14. 179
xxii
Dedication
To my dear parents, Xiwen Yuan and Yuanjie Zhang.
献给我挚爱的双亲,袁希文和张元杰。

1
CHAPTER ONE
INTRODUCTION
1.1. Background
Agriculture has always been one of the most important and labor-intensive human
productions in the world. The rapid development of industrial techniques, new tools, and
technologies have been gradually introduced into the agriculture area to increase the production
efficiency and profitability and to reduce the use of labors. Over the last decades, great
achievements of farming mechanization and automation have been made with major field crops,
such as corn, wheat, rice, and soybeans. For example, the average rice field acreage was about
945,000 acres in the 1930s in the United States, and this number was approximately 2,838,000
acres in the 2010s, which was almost three times larger. Meanwhile, the overall number of farm
laborers for field crops has greatly decreased by more than 13 times in the United States (USDA,
2019). This decrease was mainly attributed to the fast realization of mechanizations in farming
field crops. In contrast, this progress was relatively slow in specialty crops such as tree fruits (e.g.,
apple, sweet cherry, and citrus) due to the greater complexity of the orchard configuration and crop
structure, as well as the higher requirement for crop quality.
Fresh market apples comprise one of the most important high-value agricultural products
in the United States and the number one agricultural commodity in Washington State. About
300,000 acres of apple (approximately 5.2 billion kilograms) are harvested each year nationally,
and about 190,000 acres come from Washington State (USDA, 2019). Traditionally, apple (and
other tree fruit crops) harvesting requires a large workforce in a small harvesting window. Given
a huge production volume requiring high labor demand coupled with decreasing labor availability
2
and unreliable sources of this labor force, apple growers around the country are facing an
increasingly challenging situation to hire and keep skilled harvest laborers.
Mechanized/automated solutions, therefore, need to be developed to relieve the rising issue
of the aging farm population (average ages of farmers in the United States and Japan are 58 and
67 years, respectively (Johr, 2012)) and the related labor shortage faced by farmers in the United
States and around the world, especially in developed countries. In the past, the following two
approaches have been investigated around the world as alternative solutions for mechanized tree
fruit harvesting: selective/robotic harvesting and mass mechanical harvesting.
Selective harvesting of apples requires integrating various components into a complex
robotic machine. Generally, a robotic harvesting system contains three main components: a
sensing system for fruit detection and localization, a computational system to implement vision
and control system algorithms, and a manipulator and end-effector system that is controlled to
approach and detach the target fruit. According to the economic analysis conducted by Harrell et
al. (1990) and Pedersen et al. (2006), a harvesting robot failed to achieve viability for commercial
adoption primarily because of low harvesting efficiency. One of the critical issues limiting the
harvesting efficiency has been the highly unstructured and uncertain agricultural environment that
robots have to operate in compared to the more structured environment available for industrial
applications (Bac et al., 2014). For example, Mehta and Burks (2014) used a programmed
manipulator for robotic citrus harvesting. Unsuccessful attempts showed a clear trend in the
interaction between a robot and the canopy environment: about 48% of the unsuccessful harvesting
attempts were attributed to the difficulties caused by fruit clusters (23%), canopy occlusions
(22%), and immovable obstacles in canopies (3%). The results showed a strong dependence on the
success of a robotic system on horticultural factors, such as the overall tree or canopy structures.
3
Additional research on automated harvesting conducted by Hohimer et al. (2019) and Wang et al.
(2018) at Washington State University (WSU) showed that clustered apples caused major
problems for both the vision system and the manipulating arms for effective harvesting. Besides,
most of the currently available robotic systems for fruit picking are still highly expensive (both for
acquisition and maintain price) to be affordable for commercial adoption by growers in the near
future. Furthermore, the systems are relatively unreliable and are complex, thus requiring highly
skilled manpower to repair and maintain the system. Mass mechanical harvesting systems, as an
alternative to robotic picking, showed promise in addressing many of the challenges listed for a
robotic harvesting system, thus increasing the likelihood for commercial adoption. It is expected
that mass mechanical harvesting technology could be economically more affordable and
technically more feasible for current in-field utilization than selective/robotic harvesting.
Mass mechanical harvesting systems for tree fruit crops have also been studied for decades
(Adrian and Fridley, 1965; Burks et al., 2005). Early attempts for the mechanical harvesting of
tree fruit crops began in the 1960s both in the United States and in Europe, primarily for citrus
(Schertz and Brown, 1968), using either canopy shakers or trunk impactors (Burks et al., 2005).
Vibratory fruit harvesters have already been commercially adopted for the processing industry.
However, it has not been successful yet in harvesting fruit for fresh market. The major reasons for
the limited success in harvesting fresh market fruit have been low fruit removal efficiency and/or
fruit quality. Previous studies have underscored the importance of canopy management on fruit
removal efficiency and/or excessive fruit damage during mass harvesting. For apples, weak and
pendant fruiting branches prevent shaking energy from being effectively transmitted to the target
fruits. This effect is attributed to the higher energy dissipation on thin and long lateral branches
(De Kleine and Karkee, 2015; Zhou et al., 2016). Therefore, tree architectural modifications such

4
as pruning-for-mechanical-harvesting have been suggested to improve system efficiency (He et
al., 2017). Tombesi et al. (2017) investigated the effectiveness of removing weak branches to
increase fruit removal efficiency and found that mechanical harvesting performance could be
enhanced by over 12% (from 83.4% to 95.6%) on free vase-trained olive trees. Peterson et al.
(1999) studied the mechanical harvesting of apple in trees trained to a Y-trellis architecture. Their
results suggested that high efficiency could be achieved if precision pruning strategies were
adopted.
These findings suggest that complex crop conditions could be major hurdles for the success
of robotic/mechanical harvesting, which could be minimized by implementing specific pruning
strategies to create a highly structured environment. Partly because of the lack of efforts in canopy
management, a long effort in developing robotic or mechanical harvesting systems has not yielded
commercially successful solutions. Therefore, the tree architecture should be designed for
successful automation, and the cultural practices should be optimized to provide a simpler and
friendlier crop environment for the practical use of robotic machines.
To minimize the complexity of crop canopies, modifications and improvements of tree
canopy architecture are continually being investigated that can facilitate machine operations in
orchards (Tombesi et al., 2017). One of the optimal tree architectures for effective
automated/robotic harvesting would be a vertical or slightly inclined fruiting-wall system in a
medium- to high-density planting, which generally offers a uniform, smooth, and consistent tree
structure throughout an orchard. In such a canopy architecture, fruits would be primarily located
on the canopy surface with minimal occlusions. In actual practical field conditions, the amount of
completely exposed fruit would vary based on how well the orchards are managed. However, such
a canopy architecture provides insight into what would be a desirable canopy structure for a tree
5
fruit harvester to achieve and maintain harvesting efficiency and productivity comparable to
trained human labor. Such a goal can potentially be achieved by adopting proper tree/canopy
management practices to keep a relatively compact tree canopy shape and size. As an example of
a modern orchard design that can facilitate emerging mechanized solutions, a formally trained
architecture is introduced here. Formal training is one of the commonly used trellis systems for
apples and was the architecture used throughout this study. Formally trellis-trained architecture is
one of the basic concepts of modern medium/high-density (3,000–4,500 trees per hectare) apple
tree architectures that can offer increased productivity and profitability to growers. With such a
system, main tree trunks are vertically positioned, and six to eight tiers of primary branches are
horizontally trained with the trellis wires on both sides using tapes. This architecture has been
adopted substantially in the U.S. Pacific Northwest region because of various advantages including
highly simplified, compact, planar canopy structures that can facilitate canopy management by
both labors and machines and good light penetration inside the canopy with the potential for high
yield and quality of fruits (Whiting, 2018). Dormant and summer pruning are normally required
on those secondary fruiting shoots to maintain the compactness of the tree architecture.
Another issue with past efforts on shake-and-catch harvesting techniques is the fact that
several workers were required to manually operate the machines to complete the harvest tasks
repeatedly. For example, the fruit harvesting equipment used by He et al. (2017) was a hand-held
shake-and-catch mechanism, which needed at least three workers at the same time to complete a
harvest task. When a larger harvest platform was employed, even one or two more workers were
needed to cooperate on the mirrored side of the catching mechanism (He et al., 2019). The
harvesting process could be slowed down because of the dense-foliage canopy conditions caused
by high-vigor rootstocks. Thus, the operators often needed to spend most of the time to locate the

6
occluded target branches for the vibration engagement. Such laborious involvement could also
induce some health risks to workers, for example, the operators might inhale excessive dust
because of the long period of exposure in the dusty air during the harvest process.
To address these issues, one feasible solution is to fully or partially automate the
mechanical harvest system by implementing the machine vision and actuation systems to
automatically locate the target tree branches and/or trunk for shaking. Therefore, the development
of a robust machine vision system seems to be the critical first step. Recently, an emerging image
processing technique named deep learning has been introduced into agricultural areas to address
great variations of the light conditions in orchards. Among all deep learning techniques,
convolutional neural networks (CNNs) are a class of most employed, deep, feed-forward neural
networks. In the past few years, CNNs have been the key techniques used in various agricultural
applications including identifying weeds in high-value crop fields, classifying land-covers (e.g., in
remote sensing), recognizing plants, and counting fruits (e.g., for robotic fruit harvesting). Studies
found that the applications of CNNs could outperform traditional techniques to address these
challenges. For example, results have shown that CNNs achieved 41% higher classification
accuracy in detecting target agricultural objects than the same achieved by conventional image
processing approaches (Kamilaris and Prenafeta-Boldú, 2018). These findings have implied that
CNNs-based methods have the potential to provide more reliable and robust techniques with
various types of machine vision applications in a complex and unstructured agricultural
environment. Zhang et al. (2018) adopted an R-CNN based object detection technique to detect
visible parts of apple tree branches that were trained to a formal canopy architecture. With the
modification of a pre-trained AlexNet (Krizhevsky et al., 2012) deep learning architecture (where
the network has already been trained with informative features from an image dataset such as the

7
ImageNet dataset), branch skeletons (trajectories) were generated with up to 92% and 86% of
average recall and accuracy. However, this work was conducted in the dormant season and needs
to be further improved for practical application in automated shake-and-catch harvesting during
the harvesting season when tree canopies covered with foliage.
In brief, shake-and-catch technologies have been adopted in harvesting apples for the
processing market, but no commercial success has been achieved for fresh market fruit. The lack
of such technology is a great loss for the industry because of the uncertainty of labor sources and
the rapid increment of labor costs. Therefore, there is an urgent need to work on these techniques
to further improve the potential for commercial success. The success of such a system may reduce
human labor dependency in fresh market apple harvesting, leading to a substantial positive impact
on the long-term economic and social sustainability of the U.S. apple industry. Most of the past
studies focused on designing and optimizing only the mechanical components of the harvesting
systems. However, machine-plant interaction remained an area without much attention. Therefore,
it is necessary to investigate the responses of canopy elements to the mass mechanical harvesting
system to further optimize the harvesting system in terms of its efficiency and resulting fruit
quality. In addition, there have been few efforts toward the automation of the operation of such a
harvesting system, which is crucial to improve the overall productivity of the system. Therefore,
there is a need for developing machine vision, control, and actuation systems for increasing the
autonomy of these harvesting systems.
1.2. Research Goal and Objectives
This research was endeavored to improve the efficiency of the mass mechanical harvesting
system for fresh market apples by considering the two most important components of the overall

8
system: crop canopy effects, and machine integration and automation. This study, therefore,
focused on (1) studying machine-plant interactions using machine learning techniques and
precision canopy management techniques, and (2) investigating machine vision techniques
(including deep learning) for automating shake-and-catch harvesting. The specific objectives of
this research were as follows:
I. To identify the most relevant canopy parameters affecting the fruit removal efficiency of
mass mechanical harvesting of fresh market apples in formally trained fruiting-wall
orchards. To be able to represent typical canopies of apple trees commonly seen in the
Pacific Northwest region, various canopy parameters were considered including branch
length and position, lateral shoot size and length, and geometric and inertial parameters of
fruit.
II. To study the influence of a precision canopy management (more specifically, dormant
pruning strategy) on the performance of shake-and-catch harvesting that can be used for
developing adequate pruning guidelines more suitable for mechanical harvesting. The
guidelines would consider not only the fruit removal efficiency (FRE) and quality of
harvested fruits, but also the total yield. Such guidelines are expected to be transferable to
other tree fruit.
III. To perform a comprehensive evaluation of different shake-and-catch harvesting systems
in commercial orchards. Results obtained from the multi-year/multi-cultivar field tests are
presented to show technology accomplishments and thus to discuss its future potential. All
the results from current and past field evaluations are analyzed using some standard
performance measures to allow a comparison of findings of various vibratory shaking
strategies as well as the overall harvest systems.
9
IV. To develop a computer vision system for identifying tree branches and trunks and suitable
shaking locations in dense-foliage canopies for automating mass mechanical harvesting
systems. A deep learning-based semantic segmentation is used. The developed end-to-end
pipeline for branches and trunks detection is expected to be accurate and robust against
varying lighting conditions and foliage densities during harvest season. Moreover, certain
algorithms should be created based on the rules for detecting shaking points. The machine
vision system is also expected to be computationally efficient (near real time) and provide
a fundamental component for developing a fully automated harvesting system.
1.3. Organization of the Dissertation
This dissertation is organized into seven chapters. Chapter one provides a general
background on the current research status of mechanical harvesting of fresh market apples (and
other similar fruit crops) and its long-term impacts on the U.S. apple industry. The chapter also
presents the needs for the new research efforts in this area and specifies the goals as well as the
specific objectives of the dissertation research. Chapter two is the review of past studies around
robotic operations in fruit crops (with specific examples of apples and citrus). The chapter also
discusses the potential benefits of the crop modifications for robotic operations through which a
deep understanding of the potential interactions between crops and robotic systems can be gained.
Chapters three to six present and discuss methodologies used and research findings on addressing
the four specific research objectives of this study, as listed in Subsection 1.2. More specifically,
Chapter three presents the analytical results from the two-year field trials in two commercial apple
orchards in identifying canopy parameters influencing the performance of the shake-and-catch
mechanical harvesting system (Objective I). In Chapter four (Objective II), a pruning rule for
10
dormant trees (considering either the shoot length only or the ratio of shoot diameter to length) is
proposed to optimize the efficiency of vibratory mechanical harvesting of apples using a shake-
and-catch system. Chapter five evaluates a semi-automated, targeted shake-and-catch harvesting
system in field conditions as a part of Objective III. This chapter also provides a comprehensive
evaluation and analysis of harvesting technologies developed at WSU over the past five years.
Chapter six (Objective IV) presents an end-to-end pipeline to first accurately identify tree branches
and trunks under various canopy foliage conditions for automated mechanical harvesting
operations in apple orchards. A machine vision system and the CNNs-based deep learning
techniques (i.e., semantic segmentation) were employed in this task. In addition, the algorithm was
developed to estimate suitable shaking locations on branches. Finally, Chapter seven compiles the
main conclusions and contributions of this dissertation research and presents several
recommendations for future work.
11
REFERENCES
Adrian, P. A., and Fridley, R. B. (1965). Dynamics and design criteria of inertia-type tree
shakers. Transactions of the ASAE, 3(5), 12–14.
Bac, C. W., van Henten, E. J., Hemming, J., and Edan, Y. (2014). Harvesting robots for high-
value crops: State-of-the-art review and challenges ahead. Journal of Field Robotics,
31(6), 888–911.
Burks, T., Villegas, F., Hannan, M., Flood, S., Sivaraman, B., Subramanian, V., and Sikes, J.
(2005). Engineering and horticultural aspects of robotic fruit harvesting: Opportunities
and constraints. HortTechnology, 15(1), 79–87.
De Kleine, M. E., and Karkee, M. (2015). A semi-automated harvesting prototype for shaking
fruit tree limbs. Transactions of the ASABE, 58(6), 1461–1470.
Harrell, R. C., Adsit, P. D., Pool, T. A., and Hoffman, R. (1990). The Florida robotic grove-lab.
Transactions of the ASAE, 33(2), 391–399.
He, L., Fu, H., Karkee, M., and Zhang, Q. (2017). Effect of fruit location on apple detachment
with mechanical shaking. Biosystems Engineering, 157, 63–71.
He, L., Zhang, X., Ye, Y., Karkee, M., and Zhang, Q. (2019). Effect of shaking location and
duration on mechanical harvesting of fresh market apples. Applied Engineering in
Agriculture, 35(2), 175–183.
Hohimer, C. J., Wang, H., Bhusal, S., Miller, J., Mo, C., and Karkee, M. (2019). Design and field
evaluation of a robot apple harvesting system with 3D printed soft-robotic end-effector.
Transactions of the ASABE, 62, 404–415.
Johr, H. (2012). Where are the future farmers to grow our food? International Food and
Agribusiness Management Review, 15, 9–11.

12
Kamilaris, A., and Prenafeta-Boldú, F. X. (2018). Deep learning in agriculture: A survey.
Computers and Electronics in Agriculture, 147, 70–90.
Krizhevsky, A., Sutskever, I., and Hinton, G. E. (2012). Imagenet classification with deep
convolutional neural networks. Advances in Neural Information Processing Systems,
1097–1105.
Mehta, S. S., and Burks, T. F. (2014). Vision-based control of robotic manipulator for citrus
harvesting. Computers and Electronics in Agriculture, 102, 146–158.
Pedersen, S. M., Fountas, S., Have, H., and Blackmore, B. S. (2006). Agricultural robots—
system analysis and economic feasibility. Precision Agriculture, 7(4), 295–308.
Peterson, D. L., Bennedsen, B. S., Anger, W. C., and Wolford, S. D. (1999). A systems approach
to robotic bulk harvesting of apples. Transactions of the ASAE, 42(4), 871–876.
Schertz, C. E., and Brown, G. K. (1968). Basic considerations in mechanizing citrus harvest.
Transactions of the ASAE, 11(3), 343–0346.
Tombesi, S., Poni, S., Palliotti, A., and Farinelli, D. (2017). Mechanical vibration transmission
and harvesting effectiveness is affected by the presence of branch suckers in olive trees.
Biosystems Engineering, 158, 1–9.
USDA. (2019). National agricultural statistics database. Washington, DC: USDA National
Agricultural Statistics Service. Retrieved from https://quickstats.nass.usda.gov
Wang, H., Hohimer, C. J., Bhusal, S., Karkee, M., Mo, C., and Miller, J. H. (2018). Simulation
as a tool in designing and evaluating a robotic apple harvesting system. IFAC-
PapersOnLine, 51(17), 135–140.
Whiting, M. D. (2018). Chapter 6: Precision orchard systems. Q. Zhang (Ed.), Automation in
Tree Fruit Production: Principles and Practice (pp. 93–111). Wallingford, UK: CABI.
13
Zhang, J., He, L., Karkee, M., Zhang, Q., Zhang, X., and Gao, Z. (2018). Branch detection for
apple trees trained in fruiting wall architecture using depth features and regions-
convolutional neural network (R-CNN). Computers and Electronics in Agriculture, 155,
386–393.
Zhou, J., He, L., Whiting, M., Amatya, S., Larbi, P. A., Karkee, M., and Zhang, Q. (2016). Field
evaluation of a mechanical-assist cherry harvesting system. Engineering in Agriculture,
Environment and Food, 9(4), 324–331.

14
CHAPTER TWO
MECHANIZED AND AUTOMATED TREE FRUIT HARVESTING
2.1. Abstract
The rapid development of the modern agricultural machinery has substantially advanced
farming operations in recent years, and researchers and engineers are working on developing
intelligent solutions to solve various challenging problems in production agriculture. There has
been a particular emphasis in developing automation and robotic solutions for tree fruit crops (e.g.,
apple and citrus) because of the critical need of the industry that currently many production
operations such as harvesting are completely manual, needing an influx of seasonal labors within
a small-time window (e.g., from August to October for harvesting apples in Washington State).
Despite these efforts, the progress in practically adopting smart, robotic solutions in tree fruit crops
has been slow because of the large variation and complexity in the farming environment. In
addition to fulfilling the important expectation of crop yield and quality improvements, the
adoption of proper crop modifications could also be one of the critical ways to facilitate further
advancement and adoption of mechanization and automation solutions in agriculture.
The external structure of the crop could be fundamentally important in developing robotics
and automation solutions for agriculture. Based on such assumptions, results obtained from
previous studies revealed that some simplified tree architectures and canopy practices through crop
and canopy management could be highly effective in decreasing the complexity of crop structure
and further assisting in the mechanized and robotic harvesting in fruit crops such as apples and
citrus. Moreover, the selection of appropriate rootstocks with the traits of tree size and/or vigor
control could also be helpful for improved productivity with both mechanical and manual

15
harvesting. Hybridized new cultivars might help to decrease the variation in both tree structures
and fruits (e.g., fruit ripening period, shape, color, and position), which can facilitate accurate and
robust object detection using computer vision, as well as single-pass harvesting and improved
tolerance of fruit to mechanical impact/contact. This chapter also shows that horticultural
modification/improvement is deeper and more widely adopted in the apple industry than in citrus
and other fruit industries, providing a good platform to study canopy-machine interactions and to
develop advanced automated/robotic solutions for tree fruit crops.
2.2. Introduction and Problem Statement
As the world has witnessed rapid advancement in sensing technologies, artificial
intelligence (including deep learning), computational infrastructure (including cloud computing),
and robotic technologies in recent decades, various industries have been increasingly adopting
smart and autonomous solutions. Agriculture has not been an exception and is developing and
testing several automated/robotic solutions for various applications in farming such as weed
control, chemical application, and fruit and vegetable harvesting. Interest in agriculture has been
particularly given to develop technologies to reduce labor use and improve labor health and safety.
Multiple mechanical and automated solutions have been studied over the past decades to try to
relieve the rising issue of an aging farmer population (e.g., average ages of farmers are 58 and 67,
respectively, in the United States and Japan (Johr, 2012)) and labor shortage faced by farmers. One
specific area of research and development, motivated by a large number of seasonal labor use, has
been tree fruit harvesting (in particular, emphasis has been given to apples and citrus) (Amatya et
al., 2016; Bac et al., 2014; Silwal et al., 2017; Zhang et al., 2018). When successfully adopted,
mechanization and automation technologies have the potential to substantially reduce the need for
16
farm laborers in highly labor-intensive field operations such as fruit harvesting. Yet, unlike many
other industries such as manufacturing, agricultural automation and robotics face unique
challenges, and agricultural robots (or automated machines) needed to be simpler and cost-
effective as the industry runs in a thin margin and huge capital investment that is generally
challenging.
In agriculture, there is great variability in the crop and the corresponding crop structure
(may vary in shape, size, color, and texture), and canopy objects such as fruit are generally
distributed randomly in an unstructured environment. Such variabilities and uncertainties have
made it highly difficult for robotic operations compared to the applications in many other
industries. To discuss more the specific challenges in agricultural automation and robotics, a
robotic harvesting system is used here as an example. According to the economic analysis reported
by Pedersen et al. (2006), a harvesting robot failed to achieve the practical viability primarily
because of its low harvesting efficiency and high purchase price on the components. Therefore,
possible solutions are to improve the harvesting efficiency through enhancing the algorithms or
hardware such as a manipulator or end-effector and restructuring the crops so that the complexity
of the robot could thus be reduced. Mehta and Burks (2014), for instance, used a programmed
manipulator for robotic citrus harvesting and reported a success rate of around 80% in picking
target fruit. An analysis of the remaining 20% unsuccessful attempts indicated that about 48% of
the unsuccessful harvesting attempts were because of the difficulties caused by fruit clusters
(23%), canopy occlusions (22%), and immovable obstacles in canopies (3%). Such results revealed
a strong dependence of a robot on crop canopy and environmental factors. Another two studies on
automated harvesting at Washington State (Hohimer et al., 2019; Wang et al., 2018) showed that
clustered fruits caused major problems for both the vision system and the manipulating arms
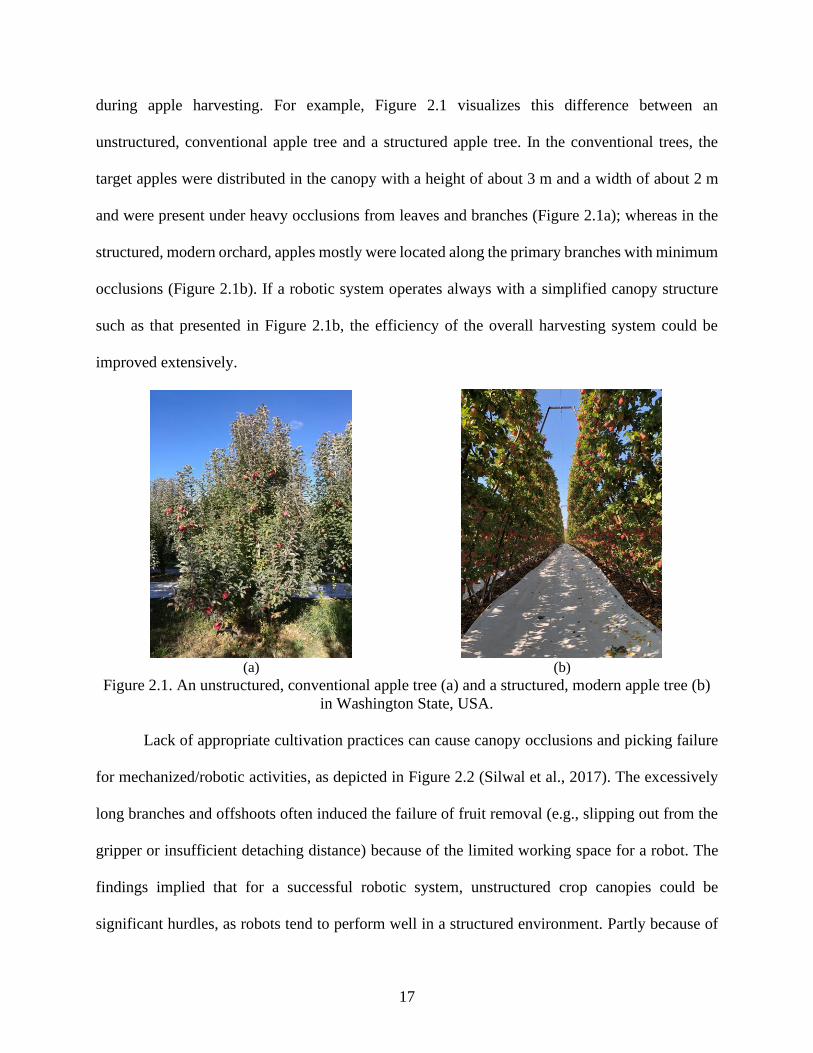
17
during apple harvesting. For example, Figure 2.1 visualizes this difference between an
unstructured, conventional apple tree and a structured apple tree. In the conventional trees, the
target apples were distributed in the canopy with a height of about 3 m and a width of about 2 m
and were present under heavy occlusions from leaves and branches (Figure 2.1a); whereas in the
structured, modern orchard, apples mostly were located along the primary branches with minimum
occlusions (Figure 2.1b). If a robotic system operates always with a simplified canopy structure
such as that presented in Figure 2.1b, the efficiency of the overall harvesting system could be
improved extensively.
(a) (b)
Figure 2.1. An unstructured, conventional apple tree (a) and a structured, modern apple tree (b)
in Washington State, USA.
Lack of appropriate cultivation practices can cause canopy occlusions and picking failure
for mechanized/robotic activities, as depicted in Figure 2.2 (Silwal et al., 2017). The excessively
long branches and offshoots often induced the failure of fruit removal (e.g., slipping out from the
gripper or insufficient detaching distance) because of the limited working space for a robot. The
findings implied that for a successful robotic system, unstructured crop canopies could be
significant hurdles, as robots tend to perform well in a structured environment. Partly because of
18
these hurdles, the long effort in developing robotic harvesting systems starting from the mid-1980s
(Bac et al., 2014; Sistler, 1987) has not yielded commercially successful solutions yet.
Figure 2.2. An example of unsuccessful fruit detaching by a robot because of a long and thin
offshoot bearing the fruit (Silwal et al., 2017).
This chapter, therefore, aims at understanding the significance of linkage between
biological aspects of tree fruit (e.g., apple and citrus) canopies and mechanized/automated
operations in harvesting fruits. Specifically, this chapter attempts at understanding; i) the potential
benefits of horticultural practices (e.g., crop and canopy management, rootstock selection) for
mechanized/automated fruit harvesting; and ii) the connections and interactions between the crops
and robotic harvesting systems through example datasets from Washington apple orchards. Two
main biological practices of tree fruit production are thus focused on including crop/canopy
management (Subsection 2.3.1) and rootstock selection and breeding efforts (Subsection 2.3.2).
Finally, the future directions of mechanized/robotic harvesting of tree fruit crops are also
discussed.
2.3. Tree Fruit Crop Architecture and Mechanized/Robotic Harvesting
Fruit tree crops are managed extensively throughout the life of the trees for improving fruit
yield and quality. In general, canopy management and crop-load management are the two

19
important aspects of crop management in tree fruit crops. Canopy management refers to a series
of horticultural practices including tree training (i.e., restructuring tree architecture) and pruning,
whereas crop-load management includes operations such as pollination and blossom or fruit
thinning. In this section, the potential impacts of tree pruning and crop thinning operations on
harvesting efficiency are discussed. In addition, rootstock selections and breeding efforts are
discussed as the ways crop modification could occur for facilitating mechanized/robotic
harvesting. To keep the focus, the chapter primarily covers studies on only apple and citrus fruits.
2.3.1. Crop/canopy management for harvesting
Some of the most important crop/canopy management operations including training,
pruning, and thinning (blossom and fruit) are discussed in this section in relation to their potential
impacts on enhancing the crop environment for mechanized and automated fruit harvesting.
Restructuring tree architectures (through tree training) is one of the most important practices in
improving productivity and fruit quality in apple orchards (Castle, 1995; Robinson et al., 1991).
Without any restrictions and modifications, a free-standing apple tree could grow up to a height of
about ten meters (Robinson et al., 1991). Using a training system in orchards could help to maintain
a dwarfed and compact tree canopy structure. Trellis system-based modern apple orchards in the
Pacific Northwest region is a good example of fruit tree training. Some studies concluded that
compact tree architectures could be a key factor for intercepting the sunlight (Green et al., 2003),
while some others clarified that the orchard density was a more critical factor for intercepting
sunlight when the same row spacing was used in an orchard (Clayton-Greene, 1993).
The tree training system is utilized to develop high-density, modern orchards. One of the
optimal tree architectures for facilitating mechanical harvesting is a vertical or slightly inclined
20
planner tree canopy. These canopy architectures, which are also called fruiting-wall systems, are
created with medium- to high-density planting of dwarfed trees (e.g., ~3,000–4,500 apple trees per
hectare) and by keeping the lateral growth of the trees as narrow as practically possible. Such a
training system generally offers a narrow and uniform tree structure throughout the orchard, and
thus, the fruits would generally be located on the canopy surface with minimal occlusions (Figure
2.1b) and a minimum number of obstacles such as branches or offshoots in the picking path. Fruit
visibility and accessibility for robotic harvesting could thus be highly enhanced, providing an
opportunity for simpler robotic systems. For example, a Cartesian coordinate robot with three
degrees of freedom; e.g., a Delta robot developed by Abundant Robotics, Inc. (Good Fruit Grower,
2016), has shown to be effective in picking most of the fruit. In recent years, researchers have
started to realize this benefit and are designing robotic systems to tap into the opportunity provided
by the simplified canopy structures (Bac et al., 2014).
In addition to training, tree pruning plays a critical role in achieving such a goal of creating
narrow canopy architectures. Both dormant and summer pruning strategies (Cooley et al., 1997;
Lakso and Robinson, 1996) could be used to seek for a balance between vegetative and
reproductive growth and thus maintaining a relatively compact tree canopy shape and size without
negatively affecting the yield and fruit quality of apples. Pruning can improve the light penetration
and distribution inside the tree canopies. For example, the canopy intercepted photosynthetically
active radiation (PAR) ratio (at the middle tier of a tree canopy) was recorded by the research team
at WSU in an apple orchard vertically trained, as shown in Figure 2.3 (where Figure 2.3a illustrates
the tree architecture and Figure 2.3b shows the PAR curves), during the full daylight hours
(September 2017) in Washington. Different levels of pruning severity were applied to the canopies
(e.g., “P-10” referred to a 10-inch more severe pruning, and “P-23” referred to a 23-inch less severe
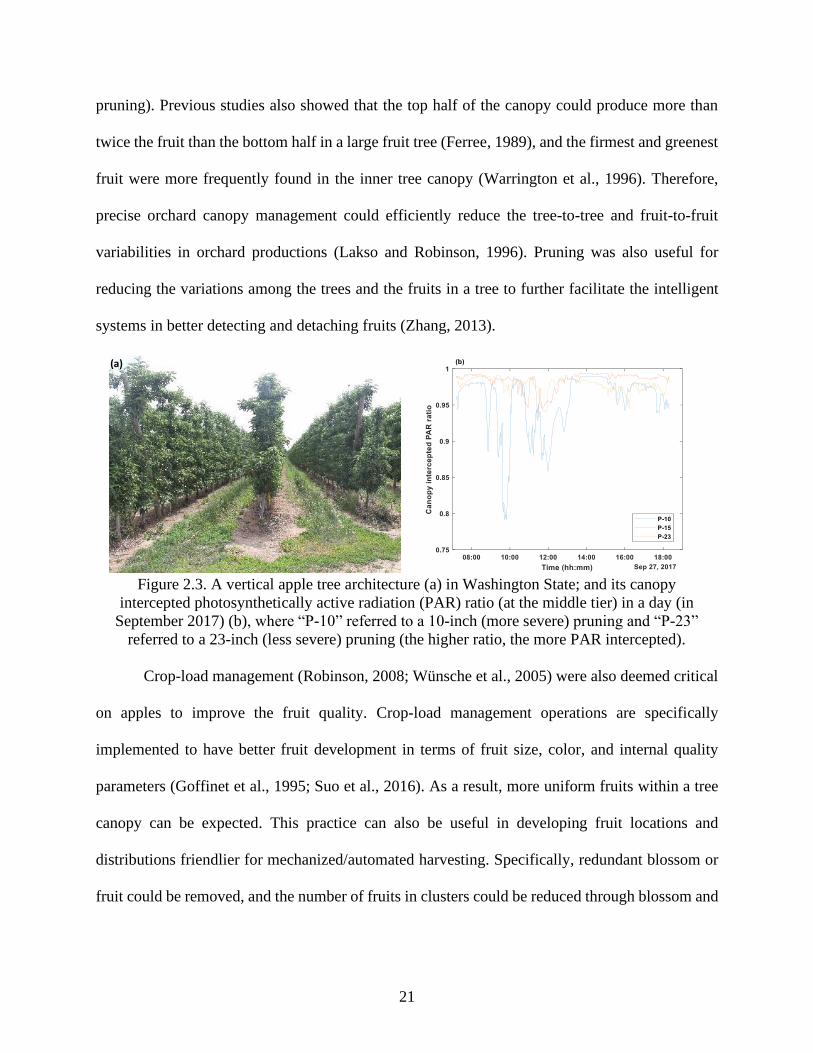
21
pruning). Previous studies also showed that the top half of the canopy could produce more than
twice the fruit than the bottom half in a large fruit tree (Ferree, 1989), and the firmest and greenest
fruit were more frequently found in the inner tree canopy (Warrington et al., 1996). Therefore,
precise orchard canopy management could efficiently reduce the tree-to-tree and fruit-to-fruit
variabilities in orchard productions (Lakso and Robinson, 1996). Pruning was also useful for
reducing the variations among the trees and the fruits in a tree to further facilitate the intelligent
systems in better detecting and detaching fruits (Zhang, 2013).
Figure 2.3. A vertical apple tree architecture (a) in Washington State; and its canopy
intercepted photosynthetically active radiation (PAR) ratio (at the middle tier) in a day (in
September 2017) (b), where “P-10” referred to a 10-inch (more severe) pruning and “P-23”
referred to a 23-inch (less severe) pruning (the higher ratio, the more PAR intercepted).
Crop-load management (Robinson, 2008; Wünsche et al., 2005) were also deemed critical
on apples to improve the fruit quality. Crop-load management operations are specifically
implemented to have better fruit development in terms of fruit size, color, and internal quality
parameters (Goffinet et al., 1995; Suo et al., 2016). As a result, more uniform fruits within a tree
canopy can be expected. This practice can also be useful in developing fruit locations and
distributions friendlier for mechanized/automated harvesting. Specifically, redundant blossom or
fruit could be removed, and the number of fruits in clusters could be reduced through blossom and
(a)
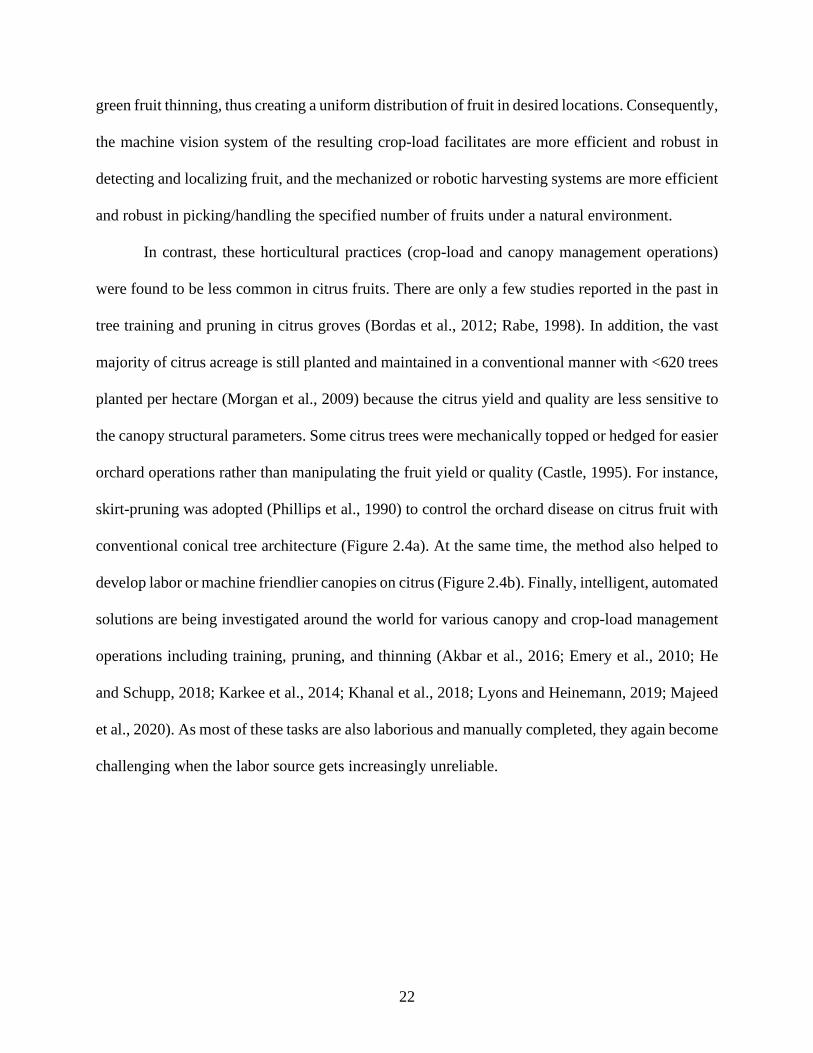
22
green fruit thinning, thus creating a uniform distribution of fruit in desired locations. Consequently,
the machine vision system of the resulting crop-load facilitates are more efficient and robust in
detecting and localizing fruit, and the mechanized or robotic harvesting systems are more efficient
and robust in picking/handling the specified number of fruits under a natural environment.
In contrast, these horticultural practices (crop-load and canopy management operations)
were found to be less common in citrus fruits. There are only a few studies reported in the past in
tree training and pruning in citrus groves (Bordas et al., 2012; Rabe, 1998). In addition, the vast
majority of citrus acreage is still planted and maintained in a conventional manner with <620 trees
planted per hectare (Morgan et al., 2009) because the citrus yield and quality are less sensitive to
the canopy structural parameters. Some citrus trees were mechanically topped or hedged for easier
orchard operations rather than manipulating the fruit yield or quality (Castle, 1995). For instance,
skirt-pruning was adopted (Phillips et al., 1990) to control the orchard disease on citrus fruit with
conventional conical tree architecture (Figure 2.4a). At the same time, the method also helped to
develop labor or machine friendlier canopies on citrus (Figure 2.4b). Finally, intelligent, automated
solutions are being investigated around the world for various canopy and crop-load management
operations including training, pruning, and thinning (Akbar et al., 2016; Emery et al., 2010; He
and Schupp, 2018; Karkee et al., 2014; Khanal et al., 2018; Lyons and Heinemann, 2019; Majeed
et al., 2020). As most of these tasks are also laborious and manually completed, they again become
challenging when the labor source gets increasingly unreliable.

23
Figure 2.4. A typical citrus orchard in California with a conventional, conical tree architecture
(a), from Phillips et al. (1990), and mechanical harvesting on citrus in Spain for juice industry
(b), from Bordas et al. (2012).
2.3.2. Crop selection for harvesting
The rootstock selections and breeding programs of apple and citrus were studied for
potentially facilitating the advancement of mechanization and automation solutions for harvesting.
Appropriate rootstock selection is one of the most important approaches to obtain high yield and
quality in tree fruit crops. Most of the rootstock selection efforts have focused around controlling
tree vigor or size (Fazio and Robinson, 2008). Especially with apples, dwarfed or semi-dwarfed
tree rootstocks have been more favored by farmers, as discussed earlier, because this minimized
tree size offered greater opportunities for many mechanized and automated (as well as manual)
harvesting tasks. Based on the in-field data of tracking different pickers who manually harvested
apples for fresh market (Table 2.1), it took approximately 43–99 s longer to harvest apples in each
picking cycle (started from the time once the ladder was completely set up until the ladder was
moved to another location) in conventional trees (‘Pink Lady’) compared to formally trained trees
(‘Scifresh’ in vertical and ‘Fuji’ in V-trellis). The data were collected in 2016 by randomly tracking
and recording 4–8 pickers in three different commercial orchards in Washington State. No studies
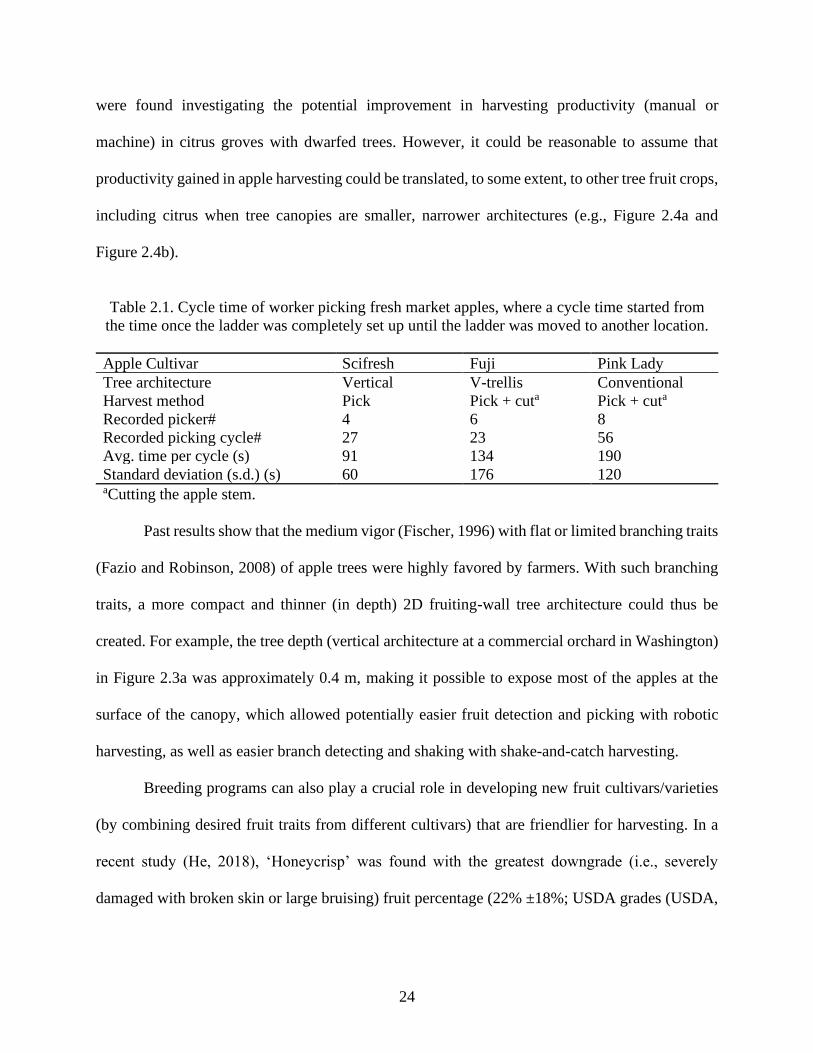
24
were found investigating the potential improvement in harvesting productivity (manual or
machine) in citrus groves with dwarfed trees. However, it could be reasonable to assume that
productivity gained in apple harvesting could be translated, to some extent, to other tree fruit crops,
including citrus when tree canopies are smaller, narrower architectures (e.g., Figure 2.4a and
Figure 2.4b).
Table 2.1. Cycle time of worker picking fresh market apples, where a cycle time started from
the time once the ladder was completely set up until the ladder was moved to another location.
Apple Cultivar Scifresh Fuji Pink Lady
Tree architecture Vertical V-trellis Conventional
Harvest method Pick Pick + cuta Pick + cuta
Recorded picker# 4 6 8
Recorded picking cycle# 27 23 56
Avg. time per cycle (s) 91 134 190
Standard deviation (s.d.) (s) 60 176 120 aCutting the apple stem.
Past results show that the medium vigor (Fischer, 1996) with flat or limited branching traits
(Fazio and Robinson, 2008) of apple trees were highly favored by farmers. With such branching
traits, a more compact and thinner (in depth) 2D fruiting-wall tree architecture could thus be
created. For example, the tree depth (vertical architecture at a commercial orchard in Washington)
in Figure 2.3a was approximately 0.4 m, making it possible to expose most of the apples at the
surface of the canopy, which allowed potentially easier fruit detection and picking with robotic
harvesting, as well as easier branch detecting and shaking with shake-and-catch harvesting.
Breeding programs can also play a crucial role in developing new fruit cultivars/varieties
(by combining desired fruit traits from different cultivars) that are friendlier for harvesting. In a
recent study (He, 2018), ‘Honeycrisp’ was found with the greatest downgrade (i.e., severely
damaged with broken skin or large bruising) fruit percentage (22% ±18%; USDA grades (USDA,
25
2018)) among all apple cultivars tested (specifically, ‘Fuji’, ‘Scifresh’, ‘Envy’, ‘Pacific Rose’, and
‘Pink Lady’) when a vibratory mechanical harvester was employed. The results indicated that this
cultivar was not suitable for mechanized harvesting. New cultivars developed could have both
favorable characteristics for the current consumer demand as well as for mechanized or automated
harvesting. For example, the ‘WA 38’ apple (‘Cosmic Crisp’; by WSU; Evans et al., 2012) released
to the market in 2019 was developed by crossing ‘Honeycrisp’ and ‘Enterprise’ cultivars. This
cultivar presents a good example of desirable traits for both marketability and harvestability. Like
‘Honeycrisp’, ‘WA 38’ is sweet, tangy, and crisp, which are the reasons why ‘Honeycrisp’ has
been deemed as one of the most favorable apple cultivars in the U.S. market since 1991. In contrast,
unlike ‘Honeycrisp’, ‘WA 38’ has a thick and firm skin that allows it to tolerate more intense
motion exerted during harvest or transportation. Different apple cultivars might have different
responses and tolerance to mechanized or robotic harvesting methods. To facilitate the robotic
harvesting efficiency, the responses from the five apple cultivars (same as aforementioned) to
handpicking patterns and postures were investigated (Davidson et al., 2016; Li et al., 2016). The
results show that the optimum picking pattern and fruit separation distance were different for each
apple cultivar.
2.4. Concluding Remarks and Future Direction
This chapter explored the potential advantages of crop modifications (canopy management,
crop-load management, rootstock, and breeding) in facilitating the advancement of mechanization
and automation solutions for fruit harvesting. The reviewed studies and experience of the author
indicated a positive impact of various cropping system practices and operations on improving the
accuracy and robustness of both robotic and shake-and-catch harvesting technologies. The chapter,

26
however, also indicated that some of the potential impacts of crop/canopy management or
modifications techniques for robotic harvesting were not practically evaluated in the field
conditions. For example, the visibility of fruits for robotic harvesting in canopies with different
foliage density (could be caused by different levels of pruning and/or thinning) was never assessed
during the harvest season.
Traditionally, scientists and engineers primarily aimed at improving the efficiency of the
harvest machines without much consideration of the potential effects regarding the crop cultivars
and canopies. However, the surveyed literature showed that it is fundamentally important to
understand that research and development of any new technology for agriculture should be pursued
in close interaction with the optimization of the target crop cultivars and its architecture. For
example, the concept of mass mechanical harvesting technology has been studied for decades since
the early-1960s. However, no commercial success has been achieved yet for fresh market fruit
harvesting. In recent years, development and adoption of formal tree architecture (i.e., trees were
trained in the vertical or V-axis that the tree trunk was vertically positioned, and six to eight pairs
of tree branches were horizontally trained to trellis wires at regular interval) orchards provided a
great opportunity for further developing such harvesting technology. With this architecture, most
of the fruits would grow along the branches and be present at the surface of the canopy. As shown
in Figure 2.5, a novel multi-layer harvesting approach could be developed for shake-and-catch
harvesting that can be confined within the target branches. Such tree architectures offer an
environment for achieving the improved FRE with the targeted shake-and-catch harvesting
machine by vibrating the individual branches and helping decrease the likelihood of fruit damage
by minimizing the fruit drop height. These types of benefits could be realized in the trellised tree
structures widely adopted in apple orchards. Inspired by the potential for machine harvesting and
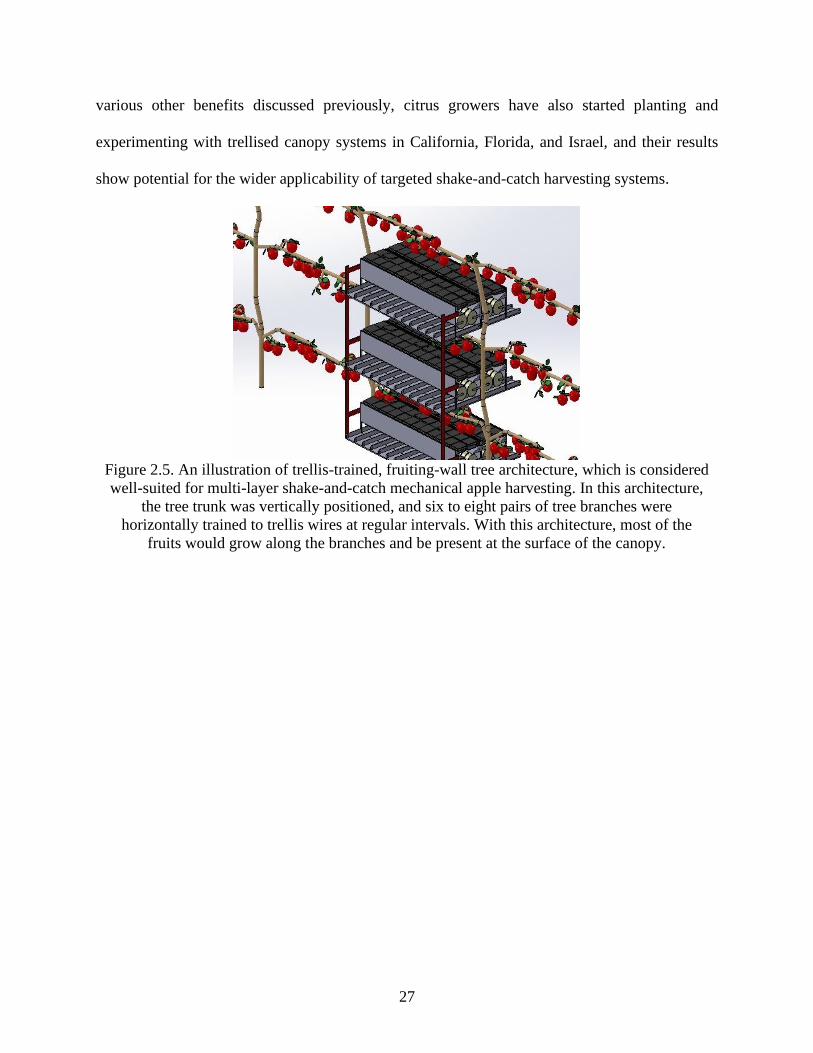
27
various other benefits discussed previously, citrus growers have also started planting and
experimenting with trellised canopy systems in California, Florida, and Israel, and their results
show potential for the wider applicability of targeted shake-and-catch harvesting systems.
Figure 2.5. An illustration of trellis-trained, fruiting-wall tree architecture, which is considered
well-suited for multi-layer shake-and-catch mechanical apple harvesting. In this architecture,
the tree trunk was vertically positioned, and six to eight pairs of tree branches were
horizontally trained to trellis wires at regular intervals. With this architecture, most of the
fruits would grow along the branches and be present at the surface of the canopy.
28
REFERENCES
Akbar, S. A., Elfiky, N. M., and Kak, A. (2016). A novel framework for modeling dormant apple
trees using single depth image for robotic pruning application. IEEE International
Conference on Robotics and Automation (ICRA), 5136–5142.
Amatya, S., Karkee, M., Gongal, A., Zhang, Q., and Whiting, M. D. (2016). Detection of cherry
tree branches with full foliage in planar architecture for automated sweet-cherry
harvesting. Biosystems Engineering, 146, 3–15.
Bac, C. W., van Henten, E. J., Hemming, J., and Edan, Y. (2014). Harvesting robots for high-
value crops: State-of-the-art review and challenges ahead. Journal of Field Robotics,
31(6), 888–911.
Bordas, M., Torrents, J., Arenas, F. J., and Hervalejo, A. (2012). High density plantation system
of the Spanish citrus industry. I International Symposium on Mechanical Harvesting and
Handling Systems of Fruits and Nuts, 965, 123–130.
Castle, W. S. (1995). Rootstock as a fruit quality factor in citrus and deciduous tree crops. New
Zealand Journal of Crop and Horticultural Science, 23(4), 383–394.
Choi, D., Lee, W. S., Ehsani, R., Schueller, J., and Roka, F. M. (2016). Detection of dropped
citrus fruit on the ground and evaluation of decay stages in varying illumination
conditions. Computers and Electronics in Agriculture, 127, 109–119.
Clayton-Greene, K. A. (1993). Influence of orchard management system on yield, quality and
vegetative characteristics of apple trees. Journal of Horticultural Science, 68(3), 365–
376.
Cooley, D. R., Gamble, J. W., and Autio, W. R. (1997). Summer pruning as a method for
reducing flyspeck disease on apple fruit. Plant Disease, 81(10), 1123–1126.
29
Davidson, J., Silwal, A., Karkee, M., Mo, C., and Zhang, Q. (2016). Hand-picking dynamic
analysis for undersensed robotic apple harvesting. Transactions of the ASABE, 59(4),
745–758.
Emery, K. G., Faubion, D. M., Walsh, C. S., and Tao, Y. (2010). Development of 3-D range
imaging system to scan peach branches for selective robotic blossom thinning. ASABE
Paper No. 1009202. St. Joseph, MI: ASABE.
Evans, K. M., Barritt, B. H., Konishi, B. S., Brutcher, L. J., and Ross, C. F. (2012). ‘WA 38’
apple. HortScience, 47(8), 1177–1179.
Fazio, G., and Robinson, T. (2008). Modification of nursery tree architecture with apple
rootstocks: A breeding perspective. New York Fruit Quarterly, 16(1), 13–16.
Ferree, D. C. (1989). Influence of orchard management systems on spur quality, light, and fruit
within the canopy of ‘Golden Delicious’ apple trees. Journal of the American Society for
Horticultural Science. 114, 869–875.
Fischer, M. (1996). The Pillnitz apple rootstock breeding methods and selection results. VI
International Symposium on Integrated Canopy, Rootstock, Environmental Physiology in
Orchard Systems, 451, 89–98.
Goffinet, M. C., Robinson, T. L., and Lakso, A. N. (1995). A comparison of ‘Empire’ apple fruit
size and anatomy in unthinned and hand-thinned trees. Journal of Horticultural Science,
70(3), 375–387.
Good Fruit Grower (2016). Mechanized vacuum apple picker demonstration. Retrieved from
https://www.youtube.com/watch?v=TBcWZcjXr-I
Green, S., McNaughton, K., Wünsche, J. N., and Clothier, B. (2003). Modeling light interception
and transpiration of apple tree canopies. Agronomy Journal, 95(6), 1380–1387.
30
He, L. (2018). Evaluation of a localized shake-and-catch harvesting system for fresh market
apples. Agricultural Engineering International: CIGR Journal, 19(4), 36–44.
He, L., and Schupp, J. (2018). Sensing and automation in pruning of apple trees: A review.
Agronomy, 8(10), 211.
Hohimer, C. J., Wang, H., Bhusal, S., Miller, J., Mo, C., and Karkee, M. (2019). Design and field
evaluation of a robot apple harvesting system with 3D printed soft-robotic end-effector.
Transactions of the ASABE, 62, 404–415.
Johr, H. (2012). Where are the future farmers to grow our food? International Food and
Agribusiness Management Review, 15, 9–11.
Karkee, M., Adhikari, B., Amatya, S., and Zhang, Q. (2014). Identification of pruning branches
in tall spindle apple trees for automated pruning. Computers and Electronics in
Agriculture, 103, 127–135.
Khanal, K., Bhusal, S., Karkee, M., and Zhang, Q. (2018). Raspberry primocanes bundling and
taping mechanisms. Transactions of the ASABE. 61(4), 1265–1274.
Lakso, A. N., and Robinson, T. L. (1996). Principles of orchard systems management optimizing
supply, demand and partitioning in apple trees. VI International Symposium on Integrated
Canopy, Rootstock, Environmental Physiology in Orchard Systems, 451, 405–416.
Li, J., Karkee, M., Zhang, Q., Xiao, K., and Feng, T. (2016). Characterizing apple picking
patterns for robotic harvesting. Computers and Electronics in Agriculture, 127, 633–640.
Lyons, D., and Heinemann, P. (2019). Selective automated blossom thinning. U.S. Patent No.
10,448,578. Washington, DC: U.S. Patent and Trademark Office.

31
Majeed, Y., Zhang, J., Zhang, X., Fu, L., Karkee, M., Whiting, M. D., and Zhang, Q. (2020).
Deep learning based segmentation for automated training of apple trees on trellis wires.
Computers and Electronics in Agriculture, 170, 105277.
Mehta, S. S., and Burks, T. F. (2014). Vision-based control of robotic manipulator for citrus
harvesting. Computers and Electronics in Agriculture, 102, 146–158.
Morgan, K. T., Schumann, A. W., Castle, W. S., Stover, E. W., Kadyampakeni, D., Spyke, P.,
Roka, F. M., Muraro, R., and Morris, R. A. (2009). Citrus production systems to survive
greening: Horticultural practices. Proceedings of the Florida State Horticultural Society,
122, 114–121.
Pedersen, S. M., Fountas, S., Have, H., and Blackmore, B. S. (2006). Agricultural robots—
system analysis and economic feasibility. Precision Agriculture, 7(4), 295–308.
Phillips, P., O'Connell, N., and Menge, J. (1990). Citrus skirt pruning–a management technique
for Phytophthora brown rot. California Agriculture, 44(6), 6–7.
Rabe, E. (1998). Citrus canopy management: Effect of nursery tree quality, trellising and spacing
on growth and initial yields. XXV International Horticultural Congress, Part 5: Culture
Techniques with Special Emphasis on Environmental Implications, 515, 273–280.
Robinson, T. (2008). Crop load management of new high-density apple orchards. New York
Fruit Quarterly, 16(2), 3–7.
Robinson, T. L., Lakso, A. N., and Ren, Z. (1991). Modifying apple tree canopies for improved
production efficiency. HortScience, 26(8), 1005–1012.
Sansavini, S., and Ventura, M. (1994). The apple breeding program at the University of Bologna.
Progress in Temperate Fruit Breeding (pp. 109–116). Springer, Dordrecht.
32
Silwal, A., Davidson, J. R., Karkee, M., Mo, C., Zhang, Q., and Lewis, K. (2017). Design,
integration, and field evaluation of a robotic apple harvester. Journal of Field Robotics,
34(6), 1140–1159.
Sistler, F. (1987). Robotics and intelligent machines in agriculture. IEEE Journal on Robotics
and Automation, 3(1), 3–6.
Suo, G. D., Xie, Y. S., Zhang, Y., Cai, M. Y., Wang, X. S., and Chuai, J. F. (2016). Crop load
management (CLM) for sustainable apple production in China. Scientia Horticulturae,
211, 213–219.
USDA. (2018). National agricultural statistics database. Washington, DC: USDA National
Agricultural Statistics Service. Retrieved from https://quickstats.nass.usda.gov
Wang, H., Hohimer, C. J., Bhusal, S., Karkee, M., Mo, C., and Miller, J. H. (2018). Simulation
as a tool in designing and evaluating a robotic apple harvesting system. IFAC-
PapersOnLine, 51(17), 135–140.
Warrington, I. J., Stanley, C. J., Tustin, D. S., Hirst, P. M., and Cashmore, W. M. (1996). Light
transmission, yield distribution, and fruit quality in six tree canopy forms of ‘Granny
Smith’ apple. Journal of Tree Fruit Production, 1(1), 27–54.
Wünsche, J. N., Greer, D. H., Laing, W. A., and Palmer, J. W. (2005). Physiological and
biochemical leaf and tree responses to crop load in apple. Tree Physiology, 25(10), 1253–
1263.
Zhang, Q. (2013). Opportunity of robotics in specialty crop production. IFAC Proceedings
Volumes, 46(4), 38–39.
Zhang, J., He, L., Karkee, M., Zhang, Q., Zhang, X., and Gao, Z. (2018). Branch detection for
apple trees trained in fruiting wall architecture using depth features and Regions-

33
Convolutional Neural Network (R-CNN). Computers and Electronics in Agriculture,
155, 386–393.
34
CHAPTER THREE
DETERMINATION OF KEY CANOPY PARAMETERS FOR MASS MECHANICAL
APPLE HARVESTING USING SUPERVISED MACHINE LEARNING AND
PRINCIPAL COMPONENT ANALYSIS
3.1. Abstract
As availability of skilled harvest labor is in decline, the sustainability of fresh market apple
production in the United States is threatened. A mass mechanical harvest approach to apple harvest
offers an alternative and promising solution. In addition to harvester design elements, it is
important to understand the key canopy parameters of apple trees as they are closely integrated
and interact with each other during the harvest process. In this study, the impact of eleven canopy
parameters on mechanical harvesting were investigated for vertically trained ‘Scifresh’ and V-
trellised ‘Envy’ trees during the harvesting trials. A supervised machine learning algorithm with
weighted k-nearest neighbors (kNN) was adopted to analyze the canopy datasets. Overall, 2,678
ground-truth data points (apples) were classified into two binary classes of fruit removal status:
“mechanically harvested” and “mechanically unharvested” apples. For the training dataset (85%),
the adopted algorithm achieved overall prediction accuracies of 76–92% and 62–74% for
‘Scifresh’ and ‘Envy’. With the remaining 15% dataset, the overall test accuracies were 81–91%
on ‘Scifresh’ but only 36–79% on ‘Envy’. The principal components analysis (PCA) was adopted
to determine the key canopy parameters by calculating the coefficients of principal components
(PCs). The PC1–PC5 explained at least 80% of the data variance. By assuming a coefficient greater
than 0.5 as being highly relevant, fruit load per branch, branch basal diameter, and shoot length
35
were the most relevant among all. These results provide guidance for growers in canopy
management that could improve efficiency of a mechanical harvesting system.
3.2. Introduction
In the United States, annual production of fresh market apples (Malus domestica Borkh.)
has increased by about 20% from 2.8 to 3.5 billion kilograms, while its annual production value
has increased from 2.3 to 3.1 billion USD in the past ten years (USDA, 2018). However, in the
same period, fewer seasonal labors were available due to various factors, including more restrictive
border policies (Brat, 2015). In addition, increasing economic activities in countries like Mexico
have led to a trend of return migrants from the United States to Mexico based on the data of labor
market from 1990–2010 (Fan et al., 2016; Parrado and Gutierrez, 2016). To ensure the
sustainability of the production of labor-intensive specialty crops while remaining competitive in
domestic as well as international markets, mass mechanical harvesting could be an alternative
solution to address this labor shortage issue. Promising results were reported by previous
researchers in developing various techniques for mechanical apple harvesting including the use of
tree trunk impacts (Peterson and Wolford, 2003; Peterson et al., 2003) or localized branch vibrating
method (He et al., 2017a; 2017b; 2018). These techniques offer the potential for higher harvesting
efficiency and lower cost (Karkee et al., 2018).
Modern apple tree training systems have played an important role in achieving desired
results with orchard mechanizations techniques such as a mechanical harvesting system (Whiting,
2018). Among all, formal, trellis-trained architecture (both vertical and inclined V-trellis systems),
is one of the most common commercial orchard systems used to produce fresh market apples in
the U.S. Pacific Northwest (PNW) region. These are high density systems, typically having 3,000–
36
4,500 trees per hectare. These orchard systems have compact canopies and improved light
exposure to the fruit compared with conventional trees (Stephan et al., 2008; Zhang et al., 2016).
However, even with the simplified tree structure, there are many variables that may affect the
performance of a mechanical harvest system. The hypothesis was that achieving an effective
mechanical harvesting system would need considering the machine-tree canopy interface which is
affected by a few canopy parameters, such as tree branch length or diameters.
There has been much research on mechanical apple harvesting in the past decades (Diener
et al., 1965; Domigan et al., 1988; Zhang et al., 2016). However, most research has focused on the
specification of machine inputs, and less attention has been given to the interaction between the
tree (canopy) and the machine. In this study, supervised machine learning techniques and principal
components analysis (PCA) were used as an attempt to find out decisive canopy parameters for
mechanical harvest. Supervised machine learning techniques such as support vector machines
(SVM), decision trees, and k-nearest neighbors (kNN) classifiers are commonly used in data
classification and regression studies for many other applications (Chlingaryan et al., 2018; Gongal
et al., 2015; Lee and Ehsani, 2015; Linker et al., 2012; Zion, 2012). Unlike unsupervised machine
learning (when only unidentified clusters of the dataset are involved), supervised machine learning
models use input-output dataset of known object classes or systems to “learn the pattern” from
example responses.
kNN was found to be an efficient classifier for categorizing dataset into different classes
based on common properties defined by the known input-output dataset using a total number of k
nearest neighbors (Shapiro, 1992), and has been used to solve various problems in agriculture in
both pre- and post-harvest applications. For example, kNN has been used to detect and distinguish
(when necessary) various types of fruits such as apples, bananas, and lemons based on their color,

37
shape, and size features (Seng and Mirisaee, 2009). In their study, the classification accuracy was
up to 90% when the model was developed using only 50 images, which showed the capability of
the algorithm in addressing this kind of problem. Kurtulmus et al. (2014) also adopted kNN
classifier to detect immature peaches under natural light conditions, showing a slightly better result
using 1-NN classifier compared to the same with a large k. Sankaran et al. (2011) adopted kNN as
one of the methods to analyze the data of visible-near infrared spectroscopy sensor, and achieved
an average classification accuracy of 86% when k was five. These studies indicate that it is
important to determine an optimal k for a specific application. In addition to image processing,
kNN classifier has also been adopted in the research area of plant science as a useful analytical
tool to locate various biotic or abiotic stress traits (Ma et al., 2014; Singh et al., 2016).
Supervised machine learning techniques are often used to learn patterns from bigdata,
which, in many cases, could contain a huge dimensionality. Principal components analysis (PCA)
is commonly used to minimize such high dimensionality in datasets so that computational speed
and classification accuracy could potentially be improved (Kamilaris et al., 2017; Nasrabadi, 2007;
Wold et al., 1987). This technique could be particularly helpful when the dimensionality of dataset
is large and the corresponding dimensions are highly corelated (e.g., selecting optimal wavelengths
for specific applications from hyperspectral imaging data (Liu et al., 2010; Sankaran et al., 2011)).
Zhao et al. (2016) efficiently selected six optimal wavelengths in detecting fungus in growing stage
of rapeseed (Brassica napus L.) plants using PCA with the best detection accuracy. Another study
by Karkee et al. (2009) adopted PCA to reduce the dimensionality of normalized differential
vegetation index (NDVI) dataset from 36 to 8 while preserving 99% variances in the dataset. As a
result, the performance of artificial neural network used in the study was improved in quantifying
sub-pixel land-use of rice field. These results indicated that PCA could effectively remove the

38
redundant information either to preserve a high classification accuracy or to decrease the
calculating time (or both) by shortening the connections between neural nodes.
In this study, the basic hypothesis was that different canopy parameters, such as tree branch
length or diameters, would respond differently to external vibration of a mechanical harvester. The
primary goal of this research was to identify the most relevant canopy parameters affecting the
fruit removal efficiency of mass mechanical harvesting of fresh market apples in formally trained
fruiting-wall orchards using supervised machine learning algorithm and PCA. The specific
research objectives were: 1) to develop and optimize a pattern-learning model using a kNN-based
supervised machine learning technique to represent the relationship between inputs (known) and
corresponding responses collected through field experiments (known); and 2) to determine the
most relevant canopy parameters using PCA technique.
3.3. Materials and Methods
3.3.1. Field characteristics and trials
3.3.1.1.Commercial orchards
The field trials for baseline data collection and validation were conducted in two
commercial apple orchards, including a vertical fruiting wall of ‘Scifresh’ apples (Figure 3.1a) and
a V-trellis architecture of ‘Envy’ apples (Figure 3.1b), both near Prosser, WA. Due to their
advantages in achieving high productivity and high accessibility to canopy parts (e.g., fruits and
branches) for human or machine operations, these architectures are currently some of the most
common systems for newly planted fresh market apple trees in U.S. PNW region (Whiting, 2018).
In these orchards, trees were trained to seven horizontal fruiting tiers spaced about half meter apart.
The pole spacing of ‘Scifresh’ and ‘Envy’ were fixed at approximately twelve and six meters,

39
respectively. The influences of trellis wires (e.g., tension of the wires) were not considered but
their effects to individual tree branches on vibrational harvest were assumed to be minimal and
homogeneous in this study. Detailed information on the layout of these two orchards could be
found in the previous studies (Davidson et al., 2016; He et al., 2019; Zhang et al., 2018). Data were
collected during harvesting seasons in both orchards, and the canopy management practices (e.g.,
pruning and thinning) were conducted manually by orchard workers.
Figure 3.1. ‘Scifresh’ (a) and ‘Envy’ (b) commercial apple trees trained in formal vertical and
V-trellis fruiting-wall architectures.
3.3.1.2.Canopy parameters
For both canopy architectures studied, seven pairs of branches, originating from the main
vertical trunk, were trained to horizontal trellis wires. Many short tertiary fruiting shoots were
borne laterally from these horizontal branches. Three major categories of canopy parameters were
identified in these architectures: (1) four branch geometric parameters, (2) four fruit geometric and
inertial parameters, and (3) three geometric parameters of lateral shoot (Figure 3.2). A complete
definition of each parameter is provided as follows: (1) branch length, denoted as “BLength”,
refers to the full length of the branch from the base to the end; (2) branch basal diameter, denoted
as “BBasalD”, refers to the diameter of the base of the branch; (3) branch middle diameter, denoted
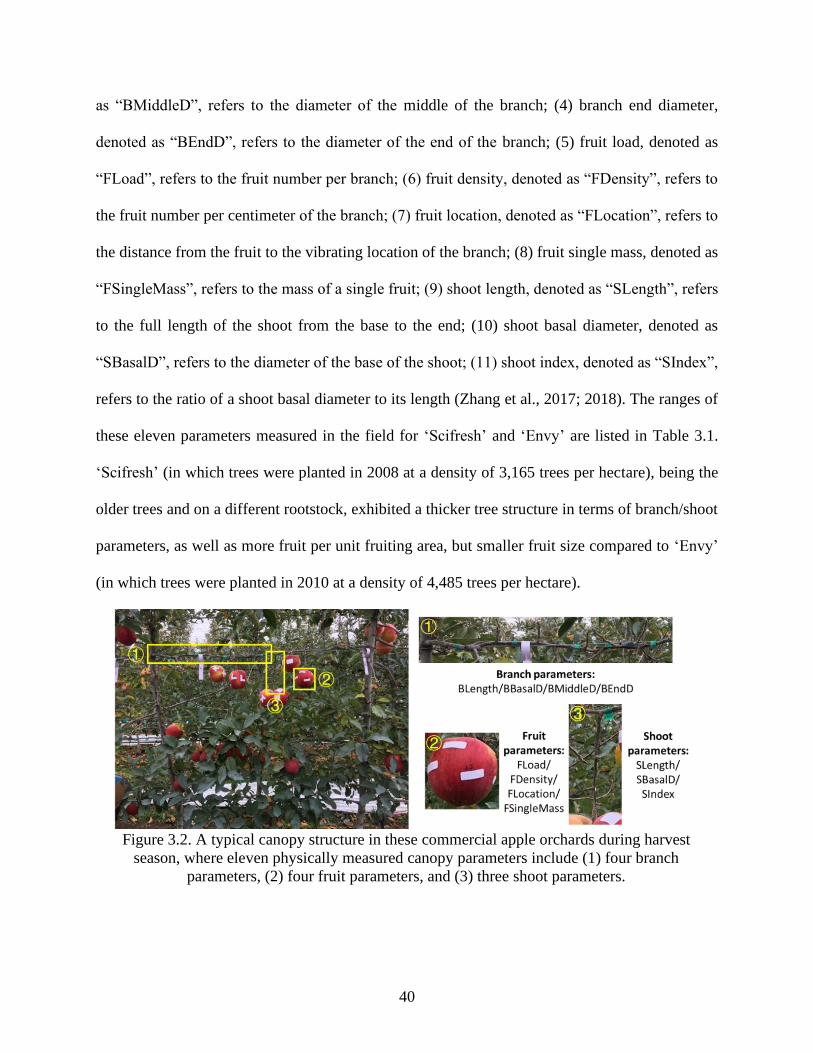
40
as “BMiddleD”, refers to the diameter of the middle of the branch; (4) branch end diameter,
denoted as “BEndD”, refers to the diameter of the end of the branch; (5) fruit load, denoted as
“FLoad”, refers to the fruit number per branch; (6) fruit density, denoted as “FDensity”, refers to
the fruit number per centimeter of the branch; (7) fruit location, denoted as “FLocation”, refers to
the distance from the fruit to the vibrating location of the branch; (8) fruit single mass, denoted as
“FSingleMass”, refers to the mass of a single fruit; (9) shoot length, denoted as “SLength”, refers
to the full length of the shoot from the base to the end; (10) shoot basal diameter, denoted as
“SBasalD”, refers to the diameter of the base of the shoot; (11) shoot index, denoted as “SIndex”,
refers to the ratio of a shoot basal diameter to its length (Zhang et al., 2017; 2018). The ranges of
these eleven parameters measured in the field for ‘Scifresh’ and ‘Envy’ are listed in Table 3.1.
‘Scifresh’ (in which trees were planted in 2008 at a density of 3,165 trees per hectare), being the
older trees and on a different rootstock, exhibited a thicker tree structure in terms of branch/shoot
parameters, as well as more fruit per unit fruiting area, but smaller fruit size compared to ‘Envy’
(in which trees were planted in 2010 at a density of 4,485 trees per hectare).
Figure 3.2. A typical canopy structure in these commercial apple orchards during harvest
season, where eleven physically measured canopy parameters include (1) four branch
parameters, (2) four fruit parameters, and (3) three shoot parameters.
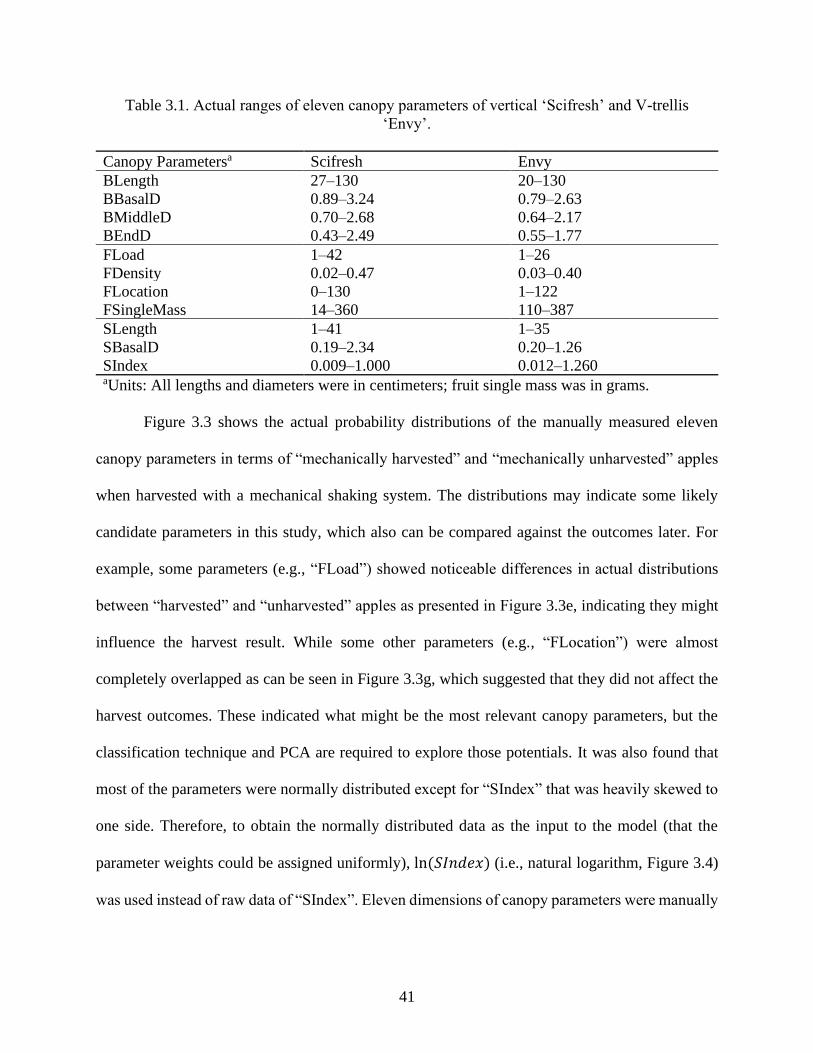
41
Table 3.1. Actual ranges of eleven canopy parameters of vertical ‘Scifresh’ and V-trellis
‘Envy’.
Canopy Parametersa Scifresh Envy
BLength 27–130 20–130
BBasalD 0.89–3.24 0.79–2.63
BMiddleD 0.70–2.68 0.64–2.17
BEndD 0.43–2.49 0.55–1.77
FLoad 1–42 1–26
FDensity 0.02–0.47 0.03–0.40
FLocation 0–130 1–122
FSingleMass 14–360 110–387
SLength 1–41 1–35
SBasalD 0.19–2.34 0.20–1.26
SIndex 0.009–1.000 0.012–1.260 aUnits: All lengths and diameters were in centimeters; fruit single mass was in grams.
Figure 3.3 shows the actual probability distributions of the manually measured eleven
canopy parameters in terms of “mechanically harvested” and “mechanically unharvested” apples
when harvested with a mechanical shaking system. The distributions may indicate some likely
candidate parameters in this study, which also can be compared against the outcomes later. For
example, some parameters (e.g., “FLoad”) showed noticeable differences in actual distributions
between “harvested” and “unharvested” apples as presented in Figure 3.3e, indicating they might
influence the harvest result. While some other parameters (e.g., “FLocation”) were almost
completely overlapped as can be seen in Figure 3.3g, which suggested that they did not affect the
harvest outcomes. These indicated what might be the most relevant canopy parameters, but the
classification technique and PCA are required to explore those potentials. It was also found that
most of the parameters were normally distributed except for “SIndex” that was heavily skewed to
one side. Therefore, to obtain the normally distributed data as the input to the model (that the
parameter weights could be assigned uniformly), ln(𝑆𝐼𝑛𝑑𝑒𝑥) (i.e., natural logarithm, Figure 3.4)
was used instead of raw data of “SIndex”. Eleven dimensions of canopy parameters were manually

42
measured right before (e.g., branch/shoot sizes) or after (e.g., single fruit mass) the field trials
using professional tape, a digital Vernier caliper, and an analytical balance (Adventurer Pro
AV2102C, Ohaus Corp., Pine Brook, NJ).
Figure 3.3. Actual probability distributions of manually measured eleven canopy parameters
(four branch parameters (a–d); noted as “B”; four fruit parameters (e–h); noted as “F”; and
three shoot parameters (i–k); noted as “S”) in terms of mechanically “harvested (-Ha)” and
“unharvested (-Un)” apples in mass mechanical harvest.
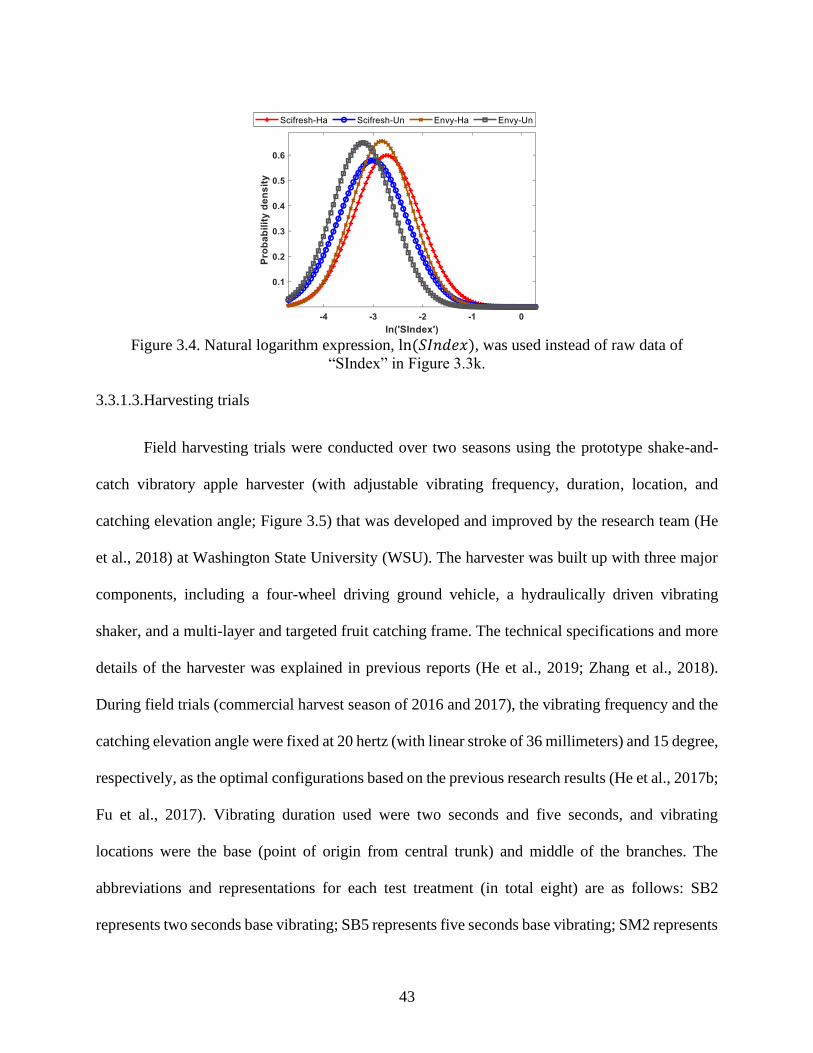
43
Figure 3.4. Natural logarithm expression, ln(𝑆𝐼𝑛𝑑𝑒𝑥), was used instead of raw data of
“SIndex” in Figure 3.3k.
3.3.1.3.Harvesting trials
Field harvesting trials were conducted over two seasons using the prototype shake-and-
catch vibratory apple harvester (with adjustable vibrating frequency, duration, location, and
catching elevation angle; Figure 3.5) that was developed and improved by the research team (He
et al., 2018) at Washington State University (WSU). The harvester was built up with three major
components, including a four-wheel driving ground vehicle, a hydraulically driven vibrating
shaker, and a multi-layer and targeted fruit catching frame. The technical specifications and more
details of the harvester was explained in previous reports (He et al., 2019; Zhang et al., 2018).
During field trials (commercial harvest season of 2016 and 2017), the vibrating frequency and the
catching elevation angle were fixed at 20 hertz (with linear stroke of 36 millimeters) and 15 degree,
respectively, as the optimal configurations based on the previous research results (He et al., 2017b;
Fu et al., 2017). Vibrating duration used were two seconds and five seconds, and vibrating
locations were the base (point of origin from central trunk) and middle of the branches. The
abbreviations and representations for each test treatment (in total eight) are as follows: SB2
represents two seconds base vibrating; SB5 represents five seconds base vibrating; SM2 represents
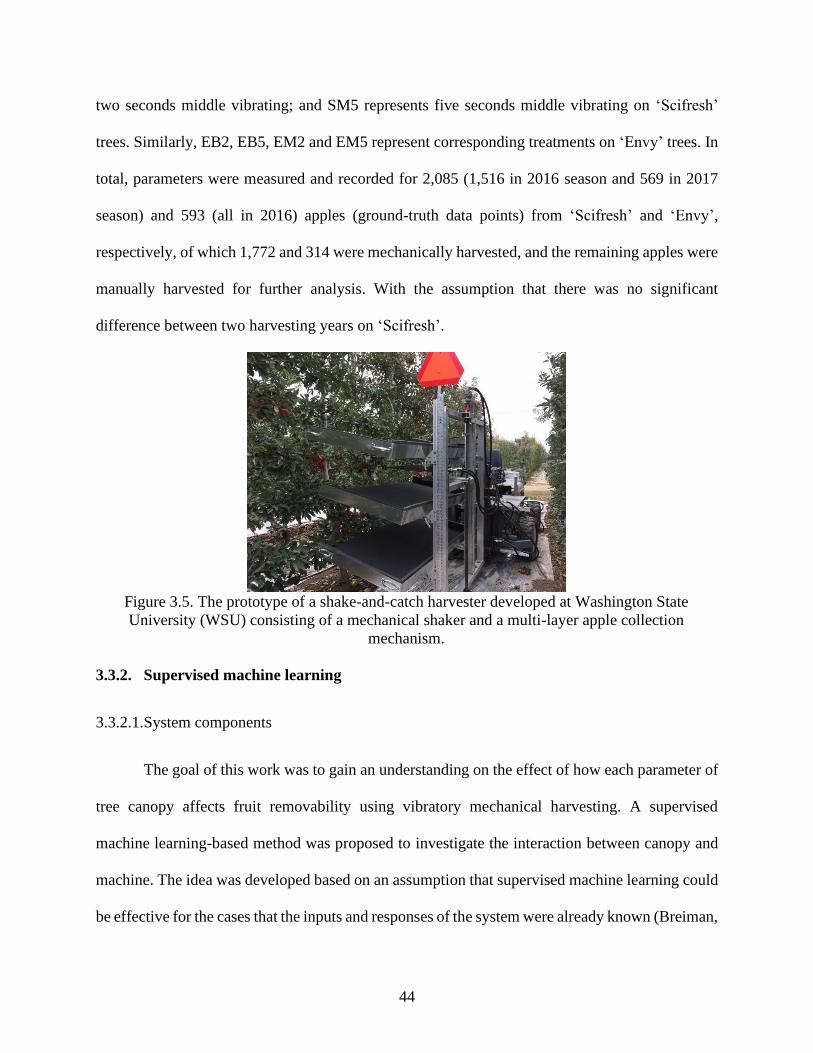
44
two seconds middle vibrating; and SM5 represents five seconds middle vibrating on ‘Scifresh’
trees. Similarly, EB2, EB5, EM2 and EM5 represent corresponding treatments on ‘Envy’ trees. In
total, parameters were measured and recorded for 2,085 (1,516 in 2016 season and 569 in 2017
season) and 593 (all in 2016) apples (ground-truth data points) from ‘Scifresh’ and ‘Envy’,
respectively, of which 1,772 and 314 were mechanically harvested, and the remaining apples were
manually harvested for further analysis. With the assumption that there was no significant
difference between two harvesting years on ‘Scifresh’.
Figure 3.5. The prototype of a shake-and-catch harvester developed at Washington State
University (WSU) consisting of a mechanical shaker and a multi-layer apple collection
mechanism.
3.3.2. Supervised machine learning
3.3.2.1.System components
The goal of this work was to gain an understanding on the effect of how each parameter of
tree canopy affects fruit removability using vibratory mechanical harvesting. A supervised
machine learning-based method was proposed to investigate the interaction between canopy and
machine. The idea was developed based on an assumption that supervised machine learning could
be effective for the cases that the inputs and responses of the system were already known (Breiman,
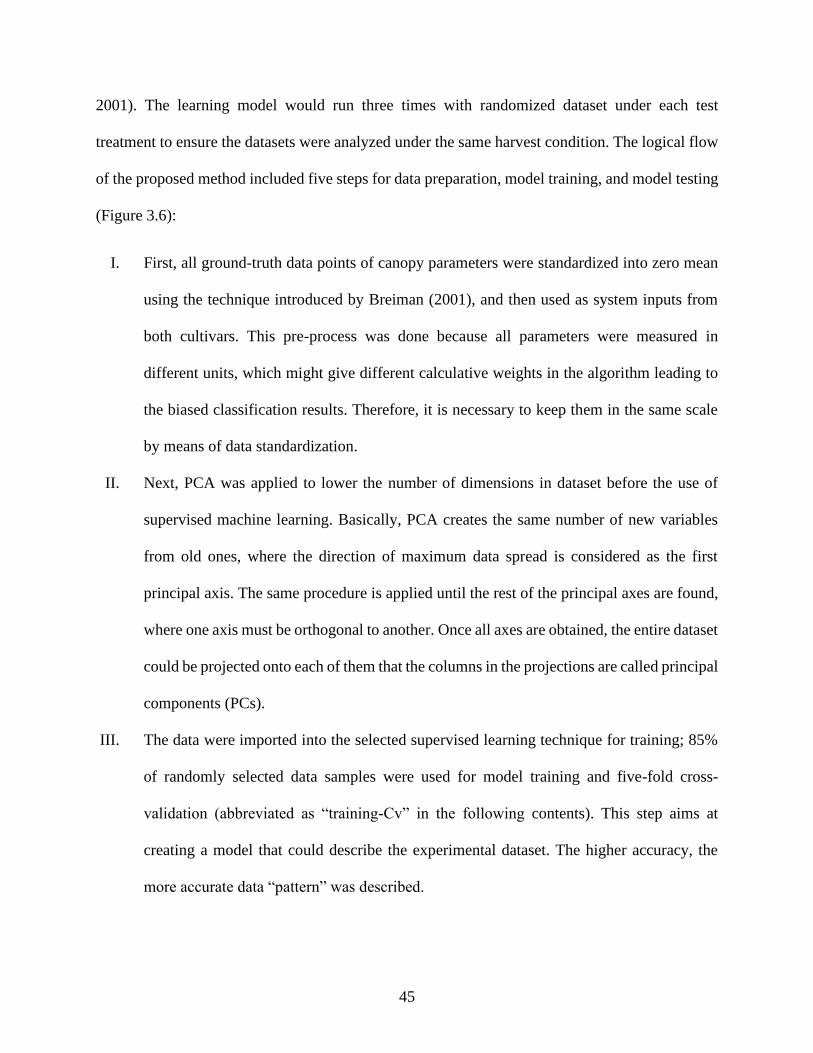
45
2001). The learning model would run three times with randomized dataset under each test
treatment to ensure the datasets were analyzed under the same harvest condition. The logical flow
of the proposed method included five steps for data preparation, model training, and model testing
(Figure 3.6):
I. First, all ground-truth data points of canopy parameters were standardized into zero mean
using the technique introduced by Breiman (2001), and then used as system inputs from
both cultivars. This pre-process was done because all parameters were measured in
different units, which might give different calculative weights in the algorithm leading to
the biased classification results. Therefore, it is necessary to keep them in the same scale
by means of data standardization.
II. Next, PCA was applied to lower the number of dimensions in dataset before the use of
supervised machine learning. Basically, PCA creates the same number of new variables
from old ones, where the direction of maximum data spread is considered as the first
principal axis. The same procedure is applied until the rest of the principal axes are found,
where one axis must be orthogonal to another. Once all axes are obtained, the entire dataset
could be projected onto each of them that the columns in the projections are called principal
components (PCs).
III. The data were imported into the selected supervised learning technique for training; 85%
of randomly selected data samples were used for model training and five-fold cross-
validation (abbreviated as “training-Cv” in the following contents). This step aims at
creating a model that could describe the experimental dataset. The higher accuracy, the
more accurate data “pattern” was described.

46
IV. When the model was well-trained, the remaining 15% of the data samples were used as
new dataset for model testing, where two (binary) classes were used as the known
responses to evaluate the accuracy in predicting the results (i.e., (1) true positive (TP) for
“mechanically harvested” fruits, and (2) true negative (TN) for “mechanically
unharvested” fruits in both actual experiment and predictive model). Details of data
partitioning for each treatment was shown in Figure 3.7. This step aims at verifying the
model that was created in the last step using the new dataset. The higher accuracy, the
better model was obtained. Specific data partitioning is shown in Table 3.2.
V. Finally, principal components (PCs) of canopy dataset were finalized based on the
cumulative explained variances of PCA (Wold et al., 1987). The first few PCs that
explained a large enough proportion (e.g., 80% or greater) of the entire dataset would be
considered as the main PCs. Key canopy parameters were thus determined based on ranked
coefficients of PCs.
Figure 3.6. Overall flowchart of various steps used in developing a supervised machine
learning model; 85% of the data samples were used for model training and cross-validation
(Cv), and the remaining 15% were used for model testing.
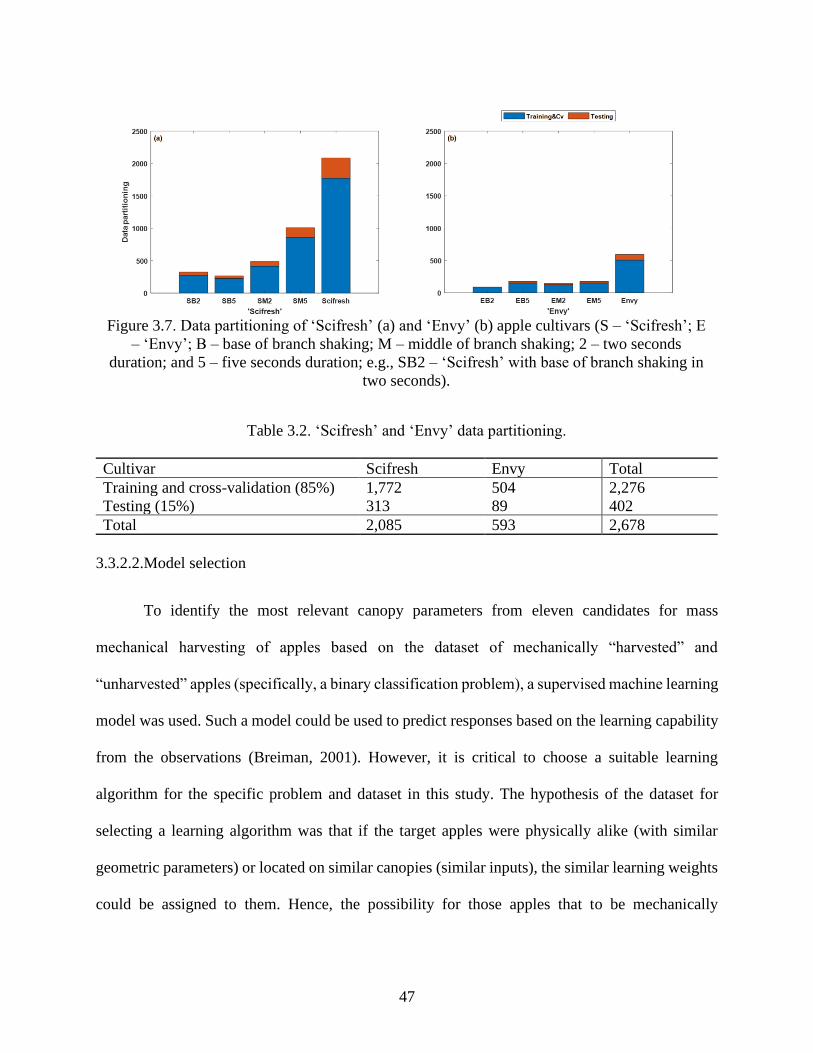
47
Figure 3.7. Data partitioning of ‘Scifresh’ (a) and ‘Envy’ (b) apple cultivars (S – ‘Scifresh’; E
– ‘Envy’; B – base of branch shaking; M – middle of branch shaking; 2 – two seconds
duration; and 5 – five seconds duration; e.g., SB2 – ‘Scifresh’ with base of branch shaking in
two seconds).
Table 3.2. ‘Scifresh’ and ‘Envy’ data partitioning.
Cultivar Scifresh Envy Total
Training and cross-validation (85%) 1,772 504 2,276
Testing (15%) 313 89 402
Total 2,085 593 2,678
3.3.2.2.Model selection
To identify the most relevant canopy parameters from eleven candidates for mass
mechanical harvesting of apples based on the dataset of mechanically “harvested” and
“unharvested” apples (specifically, a binary classification problem), a supervised machine learning
model was used. Such a model could be used to predict responses based on the learning capability
from the observations (Breiman, 2001). However, it is critical to choose a suitable learning
algorithm for the specific problem and dataset in this study. The hypothesis of the dataset for
selecting a learning algorithm was that if the target apples were physically alike (with similar
geometric parameters) or located on similar canopies (similar inputs), the similar learning weights
could be assigned to them. Hence, the possibility for those apples that to be mechanically

48
“harvested” or not under each test treatment in the harvest could be very close to each other (similar
outputs).
Based on this hypothesis, k-nearest neighbors (kNN) learning algorithm was first
considered due to its outperforming records in classifying the objects based on the classes of their
nearest neighbors in various datasets (Kurtulmus et al., 2014; Sankaran et al., 2011) and its
predictive assumption that the objects near each other share similar characteristics. Eventually,
weighted kNN (w-kNN) was finalized to classify the mechanically “harvested” and “unharvested”
apples using eleven canopy parameters based on some preliminary comparisons among all types
of kNNs in MATLAB® R2018b environment. The following three steps were performed in the
learning process: 1) finding the neighbor points in the training dataset that are nearest to the new
input data, through which the testing canopy parameters were compared with the trained data; 2)
locating the neighbor response values to those nearest input points, through which the testing
binary classes (mechanically “harvested” and “unharvested”) were compared with the trained data;
and 3) assigning the classification label as the new output response that has the largest posterior
probability among the values in actual responses, through which the class predictions for testing
dataset were completed by the model.
3.3.2.3.Model optimization and evaluation
Once a machine learning model has been selected, it needs to be fine-tuned by some hyper-
parameters (also referred as tuning parameters), such as the distance, distance weight and number
of neighbors in w-kNN. Model hyper-parameters are the configurations that are critical to the
model but whose values cannot be estimated from data. Therefore, they are often specified
manually regardless of the dataset used. In this work, instead of specifying the hyper-parameters
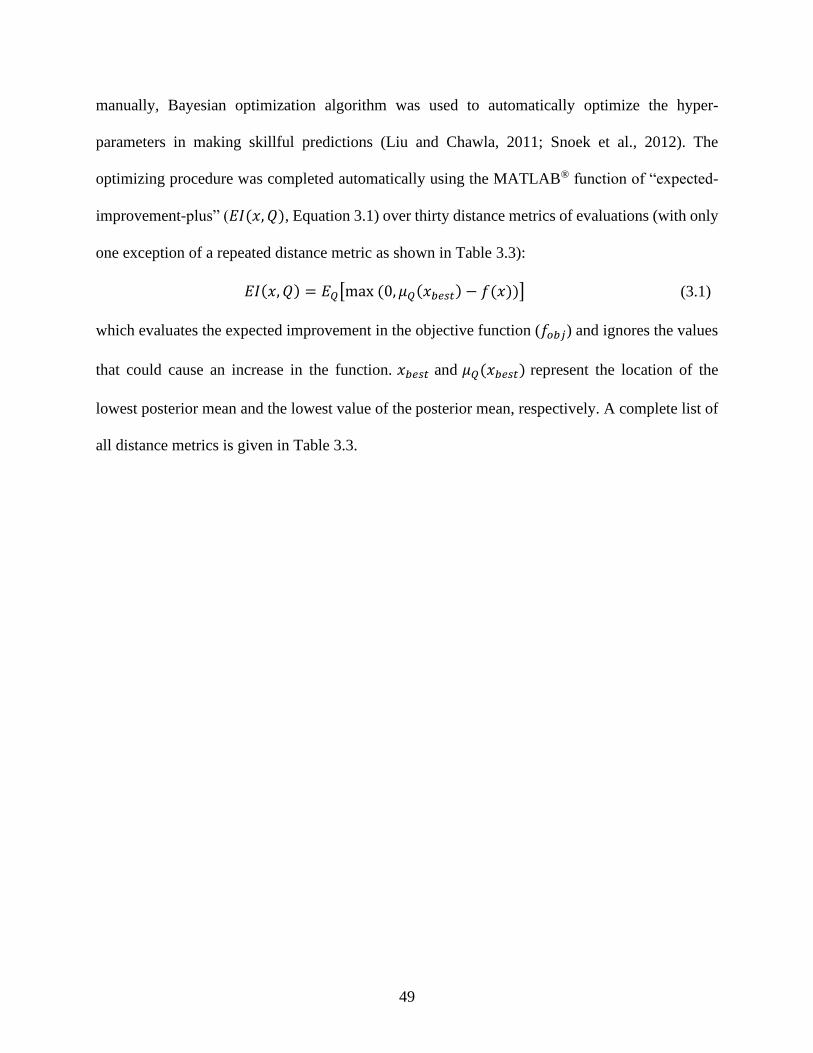
49
manually, Bayesian optimization algorithm was used to automatically optimize the hyper-
parameters in making skillful predictions (Liu and Chawla, 2011; Snoek et al., 2012). The
optimizing procedure was completed automatically using the MATLAB® function of “expected-
improvement-plus” (𝐸𝐼(𝑥, 𝑄), Equation 3.1) over thirty distance metrics of evaluations (with only
one exception of a repeated distance metric as shown in Table 3.3):
𝐸𝐼(𝑥, 𝑄) = 𝐸𝑄[max(0, 𝜇𝑄(𝑥𝑏𝑒𝑠𝑡) − 𝑓(𝑥))] (3.1)
which evaluates the expected improvement in the objective function (𝑓𝑜𝑏𝑗) and ignores the values
that could cause an increase in the function. 𝑥𝑏𝑒𝑠𝑡 and 𝜇𝑄(𝑥𝑏𝑒𝑠𝑡) represent the location of the
lowest posterior mean and the lowest value of the posterior mean, respectively. A complete list of
all distance metrics is given in Table 3.3.
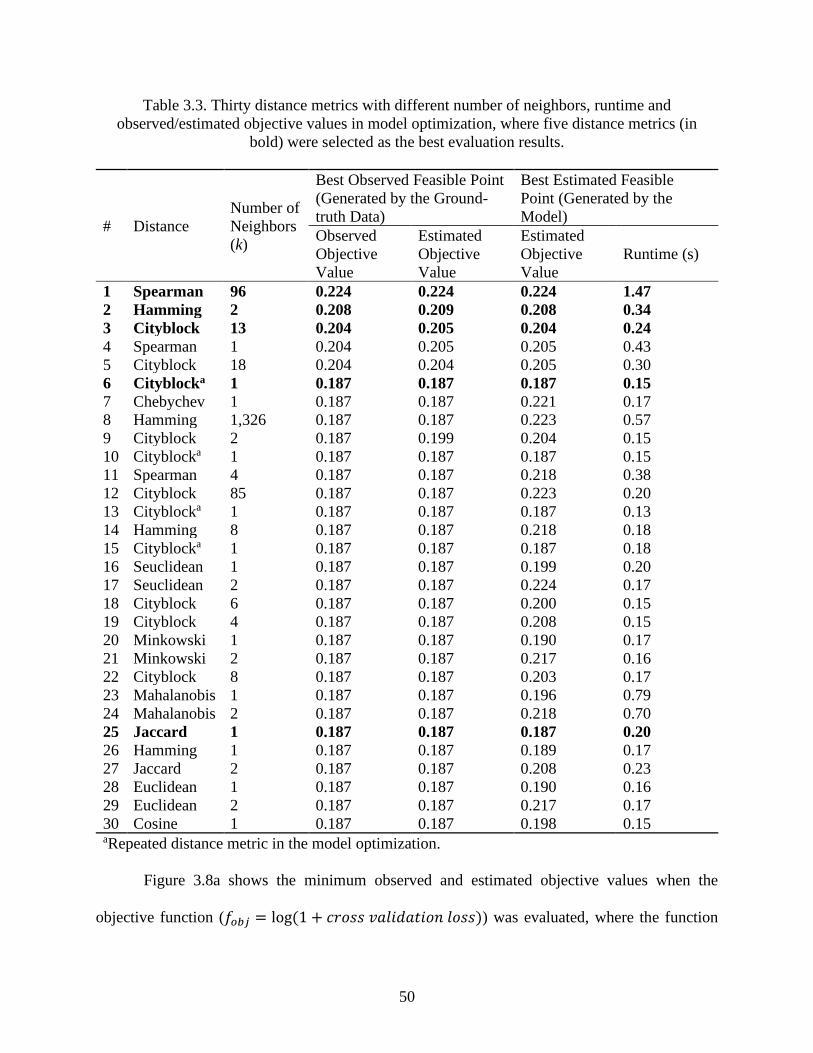
50
Table 3.3. Thirty distance metrics with different number of neighbors, runtime and
observed/estimated objective values in model optimization, where five distance metrics (in
bold) were selected as the best evaluation results.
# Distance
Number of
Neighbors
(k)
Best Observed Feasible Point
(Generated by the Ground-
truth Data)
Best Estimated Feasible
Point (Generated by the
Model)
Observed
Objective
Value
Estimated
Objective
Value
Estimated
Objective
Value
Runtime (s)
1 Spearman 96 0.224 0.224 0.224 1.47
2 Hamming 2 0.208 0.209 0.208 0.34
3 Cityblock 13 0.204 0.205 0.204 0.24
4 Spearman 1 0.204 0.205 0.205 0.43
5 Cityblock 18 0.204 0.204 0.205 0.30
6 Cityblocka 1 0.187 0.187 0.187 0.15
7 Chebychev 1 0.187 0.187 0.221 0.17
8 Hamming 1,326 0.187 0.187 0.223 0.57
9 Cityblock 2 0.187 0.199 0.204 0.15
10 Cityblocka 1 0.187 0.187 0.187 0.15
11 Spearman 4 0.187 0.187 0.218 0.38
12 Cityblock 85 0.187 0.187 0.223 0.20
13 Cityblocka 1 0.187 0.187 0.187 0.13
14 Hamming 8 0.187 0.187 0.218 0.18
15 Cityblocka 1 0.187 0.187 0.187 0.18
16 Seuclidean 1 0.187 0.187 0.199 0.20
17 Seuclidean 2 0.187 0.187 0.224 0.17
18 Cityblock 6 0.187 0.187 0.200 0.15
19 Cityblock 4 0.187 0.187 0.208 0.15
20 Minkowski 1 0.187 0.187 0.190 0.17
21 Minkowski 2 0.187 0.187 0.217 0.16
22 Cityblock 8 0.187 0.187 0.203 0.17
23 Mahalanobis 1 0.187 0.187 0.196 0.79
24 Mahalanobis 2 0.187 0.187 0.218 0.70
25 Jaccard 1 0.187 0.187 0.187 0.20
26 Hamming 1 0.187 0.187 0.189 0.17
27 Jaccard 2 0.187 0.187 0.208 0.23
28 Euclidean 1 0.187 0.187 0.190 0.16
29 Euclidean 2 0.187 0.187 0.217 0.17
30 Cosine 1 0.187 0.187 0.198 0.15 aRepeated distance metric in the model optimization.
Figure 3.8a shows the minimum observed and estimated objective values when the
objective function (𝑓𝑜𝑏𝑗 = log(1 + 𝑐𝑟𝑜𝑠𝑠𝑣𝑎𝑙𝑖𝑑𝑎𝑡𝑖𝑜𝑛𝑙𝑜𝑠𝑠)) was evaluated, where the function

51
(model error) was expected to be minimized as close to zero as possible. Five distance metrics
were selected as the best evaluation results (with minimum values that calculated by the 𝑓𝑜𝑏𝑗 and
faster runtime). The selected metrics include (1) “spearman” (k = 96, runtime = 1.47 s, where k
represents for the number of neighbors, 𝑓𝑜𝑏𝑗 = 0.224); (2) “hamming” (k = 2, runtime = 0.34 s,
𝑓𝑜𝑏𝑗 = 0.208); (3) “cityblock” (k = 13, runtime = 0.24 s, 𝑓𝑜𝑏𝑗 = 0.204); (4) “cityblock” (k = 1,
runtime = 0.15 s, 𝑓𝑜𝑏𝑗 = 0.187), and (5) “jaccard” (k = 1, runtime = 0.20 s, 𝑓𝑜𝑏𝑗 = 0.187) as bolded
in Table 3.3. Finally, Figure 3.8b visualizes the comparison of evaluation results of 𝑓𝑜𝑏𝑗 with the
most feasible distance metric (“cityblock”, Equation 3.2) that highlighted in a circle (where the
arrow points at). This distance metric was used to locate the nearest neighbors in w-kNN due to its
minimum number of neighbors (k = 1) and estimated 𝑓𝑜𝑏𝑗 value (minimum errors = 0.187) with
faster runtime of 0.15 s.
𝑑𝑠𝑡 = √∑|𝑥𝑠𝑗 − 𝑥𝑡𝑗|𝑝
𝑛
𝑗=1
𝑝
(3.2)
where 𝑑𝑠𝑡 represents the distance between two row vectors (sum of the absolute difference) in
Cartesian coordinates for a random row vector xs and another random row vector xt in a given m-
by-n data matrix (s = 1, 2, …, m; and t = 1, 2, …, m; where s and t are different), n = 11, and p =
1.
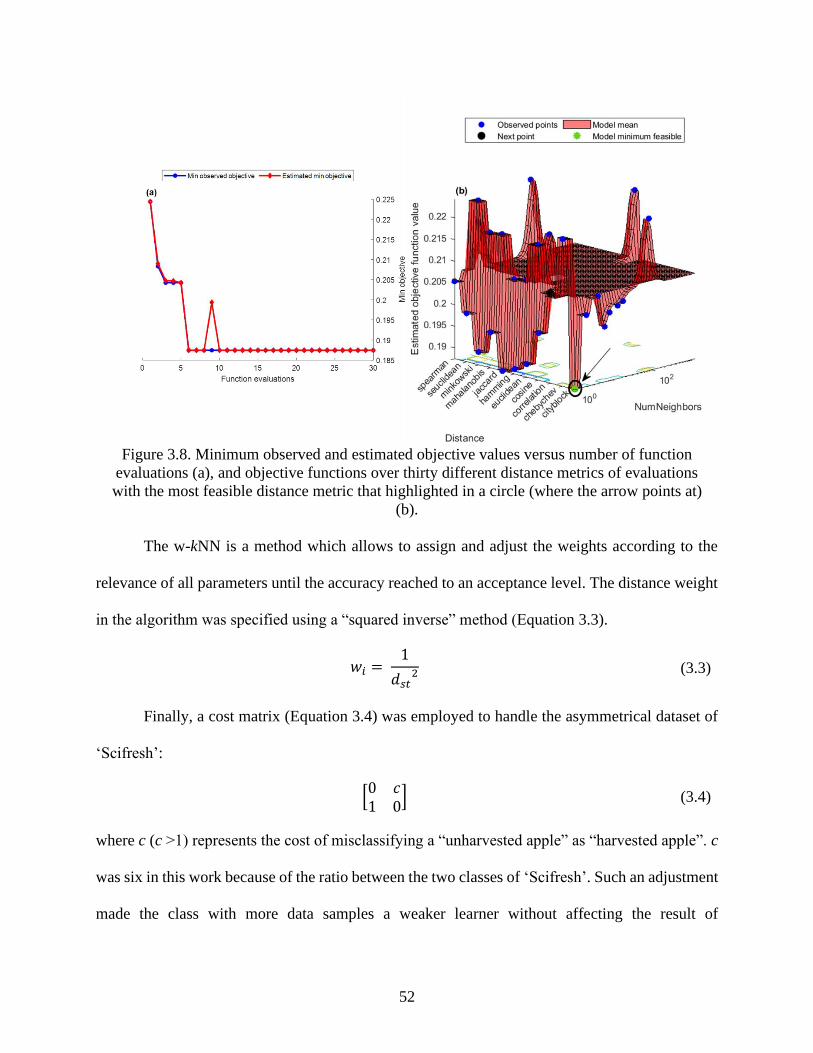
52
Figure 3.8. Minimum observed and estimated objective values versus number of function
evaluations (a), and objective functions over thirty different distance metrics of evaluations
with the most feasible distance metric that highlighted in a circle (where the arrow points at)
(b).
The w-kNN is a method which allows to assign and adjust the weights according to the
relevance of all parameters until the accuracy reached to an acceptance level. The distance weight
in the algorithm was specified using a “squared inverse” method (Equation 3.3).
𝑤𝑖 =1
𝑑𝑠𝑡2 (3.3)
Finally, a cost matrix (Equation 3.4) was employed to handle the asymmetrical dataset of
‘Scifresh’:
[0 𝑐1 0
] (3.4)
where c (c >1) represents the cost of misclassifying a “unharvested apple” as “harvested apple”. c
was six in this work because of the ratio between the two classes of ‘Scifresh’. Such an adjustment
made the class with more data samples a weaker learner without affecting the result of
53
classification (Zhou and Liu, 2010). Once the model was determined, trained, and optimized, two
common methods were adopted in this study to evaluate its performance. First, the results of the
table of confusion matrix could describe the classification accuracy (or specified as “correct rate”)
(Equations 3.5–3.7), which has been defined by Powers (2011).
𝐴𝑐𝑐𝑢𝑟𝑎𝑐𝑦 = ∑𝑇𝑃 + ∑𝑇𝑁
∑𝑃 + ∑𝑁 (3.5)
FN = 1 − TP (3.6)
FP = 1 − TN (3.7)
where “T”, “F”, “P”, and “N” represent for “True”, “False”, “Positive”, and “Negative”,
respectively.
Therefore, the percentage of TP class in the confusion matrix refers to the percentage of
actual apples that are correctly classified into the “mechanically harvested” class. Similarly, the
percentage of TN class refers to the percentage of actual apples that are correctly classified into
the “mechanically unharvested” class. It is also worth mentioning that the accuracy (or “correct
rate”) of the confusion matrix was referred (Equation 3.5) whenever the term of “accuracy” was
used in this paper. To further confirm the obtained accuracy, the “Area Under the Curve (AUC)”
of “Receiver Operating Characteristic (ROC)” was also checked using the approach described by
Fawcett (2006). It is useful especially when the dataset is skewed towards one class (Ling et al.,
2003). PCA was used to narrow down the dimensionality of the dataset in machine learning
algorithm (during data training process) and then to examine the cumulative explained variances
and coefficients of PCs in this study, where cumulative explained variance represents the
interpretation of the PCs against the entire dataset being explained. The absolute value of
coefficient reflects how close the variables are associated with that PC and a coefficient above 0.5
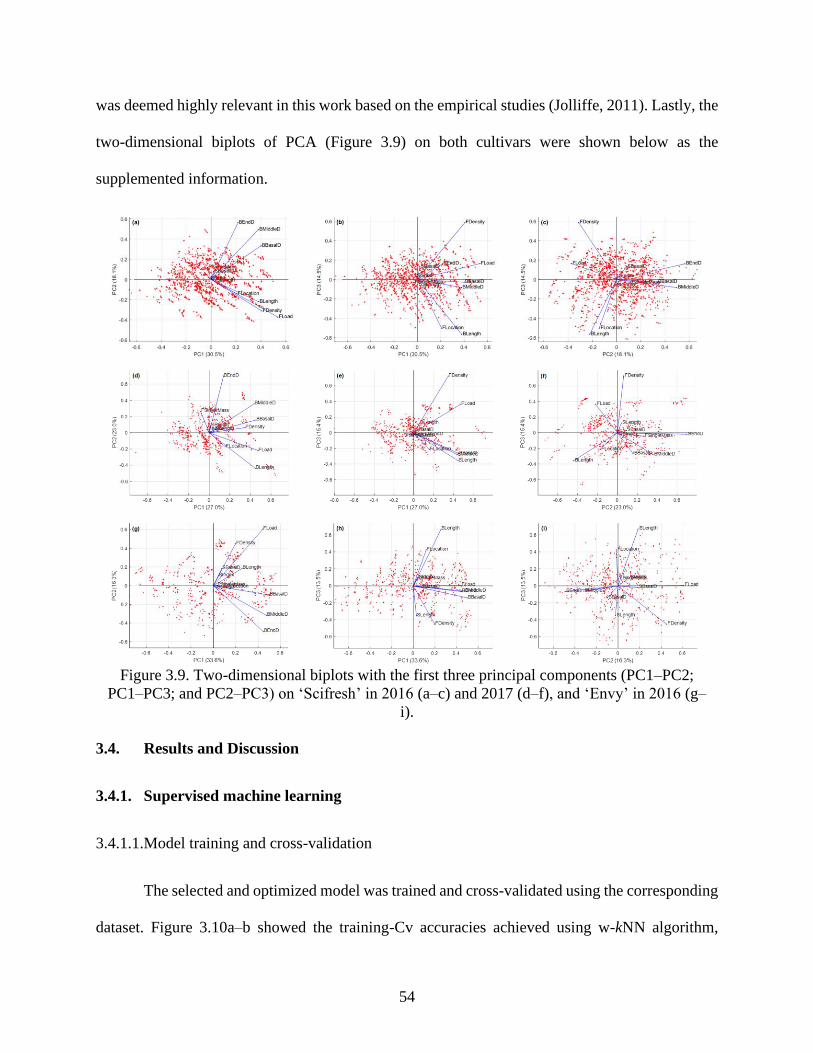
54
was deemed highly relevant in this work based on the empirical studies (Jolliffe, 2011). Lastly, the
two-dimensional biplots of PCA (Figure 3.9) on both cultivars were shown below as the
supplemented information.
Figure 3.9. Two-dimensional biplots with the first three principal components (PC1–PC2;
PC1–PC3; and PC2–PC3) on ‘Scifresh’ in 2016 (a–c) and 2017 (d–f), and ‘Envy’ in 2016 (g–
i).
3.4. Results and Discussion
3.4.1. Supervised machine learning
3.4.1.1.Model training and cross-validation
The selected and optimized model was trained and cross-validated using the corresponding
dataset. Figure 3.10a–b showed the training-Cv accuracies achieved using w-kNN algorithm,
55
where the last columns were mean values of four test treatments for each fruit cultivar studied. The
highest accuracy in ‘Scifresh’ was obtained for SM5 (91.9 ±0.5%, based on 1,008 input-output
samples) and the lowest was obtained for SB2 (76.3 ±0.9%, based on 324 samples). Overall, the
model achieved higher accuracy on ‘Scifresh’ (85.9 ±0.2%) than ‘Envy’ (68.5 ±0.5%), which
might be attributed to the fact of varietal physiological differences between ‘Scifresh’ and ‘Envy’
(Table 3.1). PCA was applied to reduce the dataset dimension; the analysis found eight principal
components could represent ≥95% variances in the original eleven-dimensional dataset. The
reduction of data dimension from eleven to eight resulted in a small difference in the results of
model training accuracy for both cultivars (most situations were ≤1%) as presented in Figure
3.10a–b. A total of three runs were performed with randomized dataset with the maximum standard
deviation (s.d.) being found at ±2.1% for ‘Scifresh’ and ±6.5% for ‘Envy’. Obtained results also
revealed that the developed model was stable and consistent in predicting the responses of apples
that could be mechanically “harvested” or “unharvested” based on input canopy parameters under
each treatment.
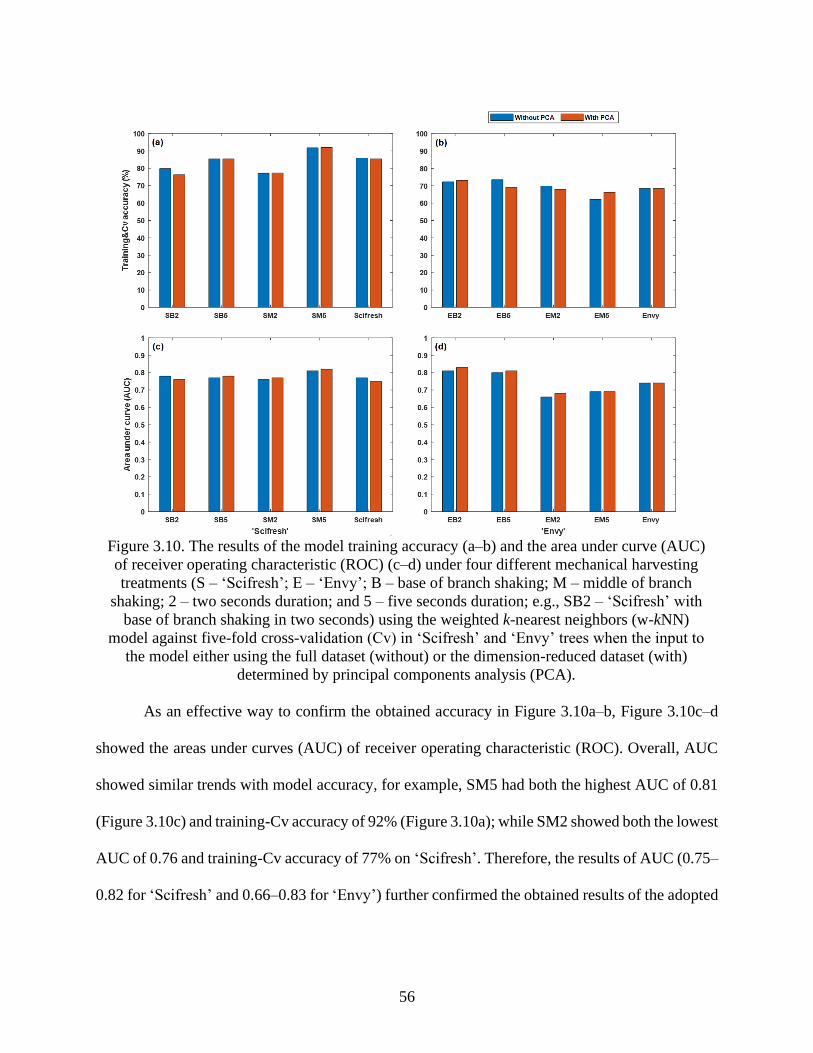
56
Figure 3.10. The results of the model training accuracy (a–b) and the area under curve (AUC)
of receiver operating characteristic (ROC) (c–d) under four different mechanical harvesting
treatments (S – ‘Scifresh’; E – ‘Envy’; B – base of branch shaking; M – middle of branch
shaking; 2 – two seconds duration; and 5 – five seconds duration; e.g., SB2 – ‘Scifresh’ with
base of branch shaking in two seconds) using the weighted k-nearest neighbors (w-kNN)
model against five-fold cross-validation (Cv) in ‘Scifresh’ and ‘Envy’ trees when the input to
the model either using the full dataset (without) or the dimension-reduced dataset (with)
determined by principal components analysis (PCA).
As an effective way to confirm the obtained accuracy in Figure 3.10a–b, Figure 3.10c–d
showed the areas under curves (AUC) of receiver operating characteristic (ROC). Overall, AUC
showed similar trends with model accuracy, for example, SM5 had both the highest AUC of 0.81
(Figure 3.10c) and training-Cv accuracy of 92% (Figure 3.10a); while SM2 showed both the lowest
AUC of 0.76 and training-Cv accuracy of 77% on ‘Scifresh’. Therefore, the results of AUC (0.75–
0.82 for ‘Scifresh’ and 0.66–0.83 for ‘Envy’) further confirmed the obtained results of the adopted
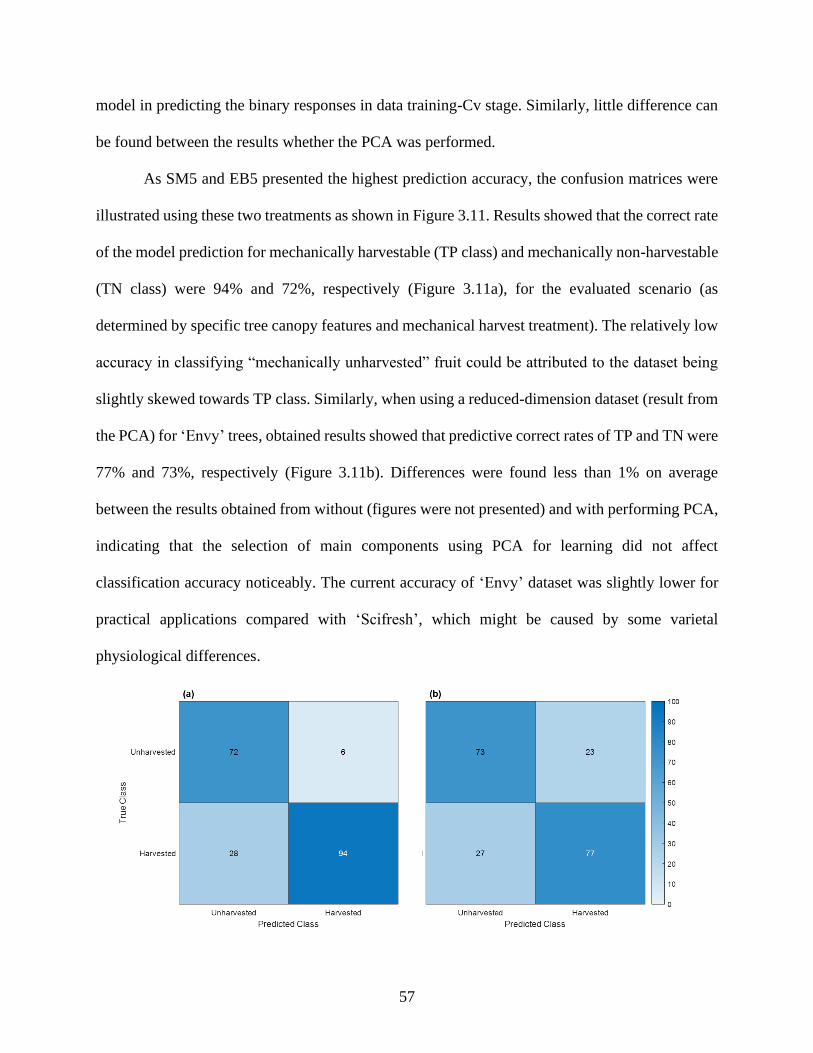
57
model in predicting the binary responses in data training-Cv stage. Similarly, little difference can
be found between the results whether the PCA was performed.
As SM5 and EB5 presented the highest prediction accuracy, the confusion matrices were
illustrated using these two treatments as shown in Figure 3.11. Results showed that the correct rate
of the model prediction for mechanically harvestable (TP class) and mechanically non-harvestable
(TN class) were 94% and 72%, respectively (Figure 3.11a), for the evaluated scenario (as
determined by specific tree canopy features and mechanical harvest treatment). The relatively low
accuracy in classifying “mechanically unharvested” fruit could be attributed to the dataset being
slightly skewed towards TP class. Similarly, when using a reduced-dimension dataset (result from
the PCA) for ‘Envy’ trees, obtained results showed that predictive correct rates of TP and TN were
77% and 73%, respectively (Figure 3.11b). Differences were found less than 1% on average
between the results obtained from without (figures were not presented) and with performing PCA,
indicating that the selection of main components using PCA for learning did not affect
classification accuracy noticeably. The current accuracy of ‘Envy’ dataset was slightly lower for
practical applications compared with ‘Scifresh’, which might be caused by some varietal
physiological differences.
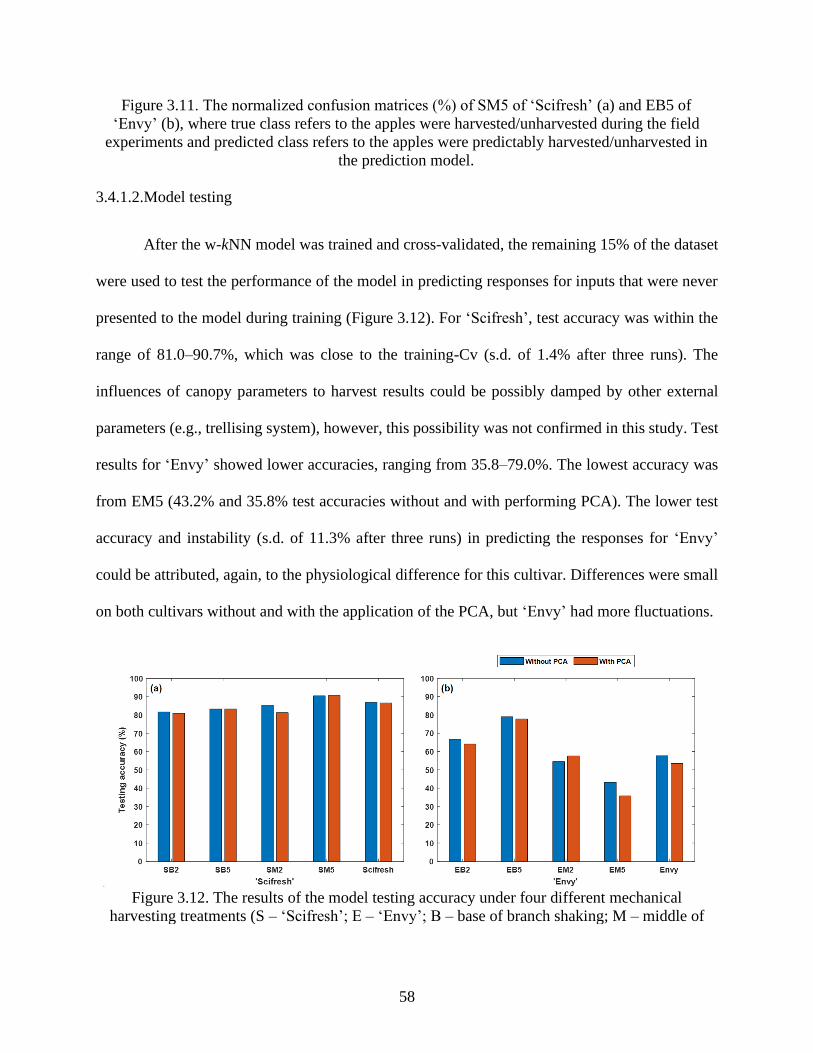
58
Figure 3.11. The normalized confusion matrices (%) of SM5 of ‘Scifresh’ (a) and EB5 of
‘Envy’ (b), where true class refers to the apples were harvested/unharvested during the field
experiments and predicted class refers to the apples were predictably harvested/unharvested in
the prediction model.
3.4.1.2.Model testing
After the w-kNN model was trained and cross-validated, the remaining 15% of the dataset
were used to test the performance of the model in predicting responses for inputs that were never
presented to the model during training (Figure 3.12). For ‘Scifresh’, test accuracy was within the
range of 81.0–90.7%, which was close to the training-Cv (s.d. of 1.4% after three runs). The
influences of canopy parameters to harvest results could be possibly damped by other external
parameters (e.g., trellising system), however, this possibility was not confirmed in this study. Test
results for ‘Envy’ showed lower accuracies, ranging from 35.8–79.0%. The lowest accuracy was
from EM5 (43.2% and 35.8% test accuracies without and with performing PCA). The lower test
accuracy and instability (s.d. of 11.3% after three runs) in predicting the responses for ‘Envy’
could be attributed, again, to the physiological difference for this cultivar. Differences were small
on both cultivars without and with the application of the PCA, but ‘Envy’ had more fluctuations.
Figure 3.12. The results of the model testing accuracy under four different mechanical
harvesting treatments (S – ‘Scifresh’; E – ‘Envy’; B – base of branch shaking; M – middle of

59
branch shaking; 2 – two seconds duration; and 5 – five seconds duration; e.g., SB2 – ‘Scifresh’
with base of branch shaking in two seconds) using the trained weighted k-nearest neighbors
(w-kNN) model in ‘Scifresh’ (a) and ‘Envy’ (b) trees when the input to the model either using
the full dataset (without) or the dimension-reduced dataset (with) determined by principal
components analysis (PCA).
Additionally, a bigger dataset could potentially help to improve the prediction accuracies
for both training-Cv and testing runs. One way to increase the data size was to combine data
collected from different harvest treatments. However, such a practice eventually caused the
accuracy to decrease as different test conditions (e.g., vibrating location or time) were mixed. In
other words, the selected canopy parameters were harvesting configuration dependent. For
example, when all 2,085 samples (full dataset) of ‘Scifresh’ harvesting cases were combined to
create a larger data size, it resulted in the training-Cv and test accuracies being as low as 85%,
lower than that of when only SM5 data being used (91–92%) due to the combination of distinct
vibrating locations (middle and base of the branch) and durations (two seconds and five seconds)
in mean value of ‘Scifresh’.
Finally, through checking the model accuracy (Figure 3.10a–b and Figure 3.12), AUC of
ROC (Figure 3.10c–d), and data partitioning effects discussed above, it was verified that w-kNN
supervised machine learning algorithm used in this study was able to give a reasonably acceptable
predictive accuracy using the input of canopy parameters only under each test treatment either
without or with PCA, except for two cases under the configurations of EM2 and EM5 as plotted
in Figure 3.12. These might be attributed to the varietal physiological differences between cultivars
as well as the relatively smaller data size of ‘Envy’. In addition, PCA was able to effectively select
reduced number of components compared to the dimensionality of the original dataset (eight out
of eleven principal components that explained ≥95% variances of data) without compromising the
classification accuracy in terms of training-Cv, testing, and AUC. Therefore, next section aims at

60
identifying key canopy parameters included in the model influencing the response of the system.
It was also noticeable that the higher classification accuracies were achieved for ‘Scifresh’ when
a longer duration was used (e.g., SB5 and SM5 in Figure 3.10a and Figure 3.12a); while the data
partitioning (Figure 3.6) indicated that even though SM5 had more data samples than SM2, data
samples of SB5 was clearly less than SB2. Similar situation was found on EB2 and EB5 for ‘Envy’
(Figure 3.10b and Figure 3.12b). Thus, the selected canopy parameters in the next section are
possibly dependent on certain varietal differences. Limitations may apply when the selected
parameters are used.
3.4.2. Principal components (PCs)
PCA was used to reduce the dimensionality of the dataset as well as to examine the
coefficients of PCs for more effective learning. Figure 3.13 shows the cumulative variances of
eleven PCs, where PC1–PC4 explained around 75% data variances, PC1–PC5 explained more than
80%, and PC1–PC8 explained no less than 95% (where the number of PCs that presented in the
previous learning model). Therefore, to cover most of the information while keeping the PCA
interpretable, the first five PCs (PC1–PC5) were considered as main components to interpret the
entire population. For ‘Scifresh’, the highest and lowest explanations were SM2 (PC1 = 33.1%,
PC2 = 20.7%, PC3 = 13.7%, PC4 = 10.3%, and PC5 = 6.4%) and mean of ‘Scifresh’ (PC1 =
29.9%, PC2 = 18.4%, PC3 = 14.4%, PC4 = 9.9%, and PC5 = 7.6%), which in total explained
84.1% and 80.3% variances, respectively. For ‘Envy’, the highest and lowest were EM5 (PC1 =
53.9%, PC2 = 10.1%, PC3 = 9.3%, PC4 = 7.8%, and PC5 = 5.8%) and mean of ‘Envy’ (PC1 =
33.6%, PC2 = 16.3%, PC3 = 13.5%, PC4 = 9.6%, and PC5 = 6.7%), which explained 86.9% and
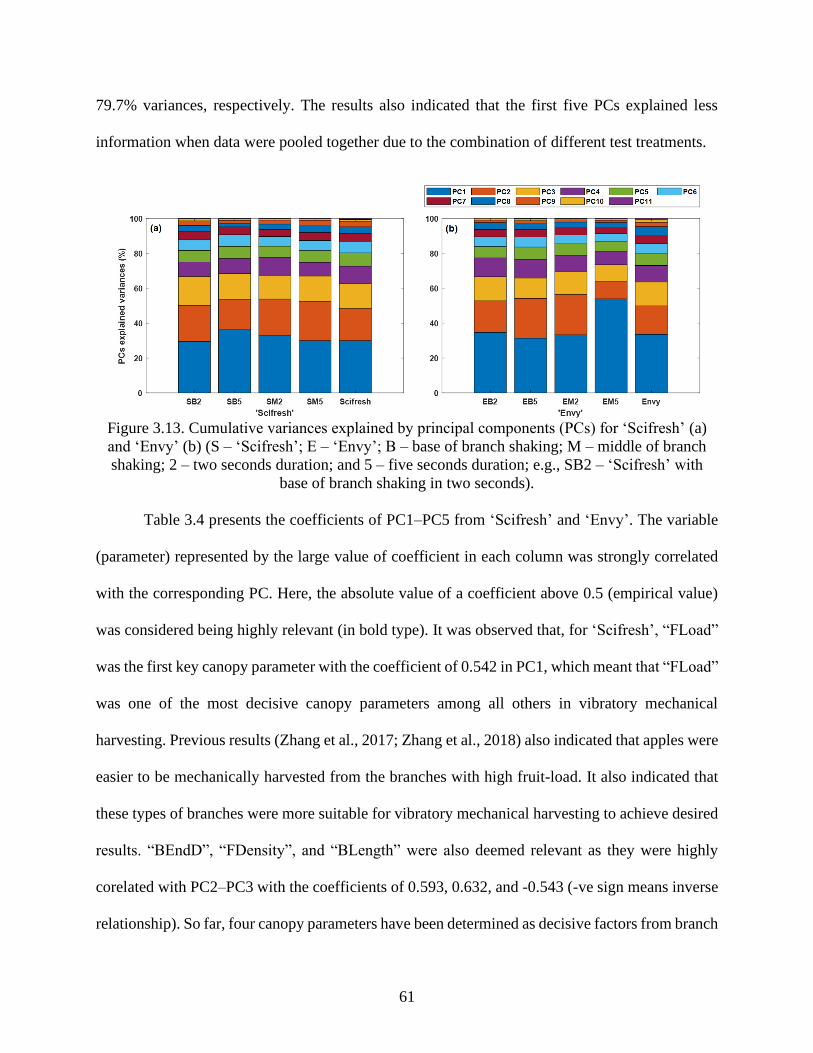
61
79.7% variances, respectively. The results also indicated that the first five PCs explained less
information when data were pooled together due to the combination of different test treatments.
Figure 3.13. Cumulative variances explained by principal components (PCs) for ‘Scifresh’ (a)
and ‘Envy’ (b) (S – ‘Scifresh’; E – ‘Envy’; B – base of branch shaking; M – middle of branch
shaking; 2 – two seconds duration; and 5 – five seconds duration; e.g., SB2 – ‘Scifresh’ with
base of branch shaking in two seconds).
Table 3.4 presents the coefficients of PC1–PC5 from ‘Scifresh’ and ‘Envy’. The variable
(parameter) represented by the large value of coefficient in each column was strongly correlated
with the corresponding PC. Here, the absolute value of a coefficient above 0.5 (empirical value)
was considered being highly relevant (in bold type). It was observed that, for ‘Scifresh’, “FLoad”
was the first key canopy parameter with the coefficient of 0.542 in PC1, which meant that “FLoad”
was one of the most decisive canopy parameters among all others in vibratory mechanical
harvesting. Previous results (Zhang et al., 2017; Zhang et al., 2018) also indicated that apples were
easier to be mechanically harvested from the branches with high fruit-load. It also indicated that
these types of branches were more suitable for vibratory mechanical harvesting to achieve desired
results. “BEndD”, “FDensity”, and “BLength” were also deemed relevant as they were highly
corelated with PC2–PC3 with the coefficients of 0.593, 0.632, and -0.543 (-ve sign means inverse
relationship). So far, four canopy parameters have been determined as decisive factors from branch

62
and fruit categories in mass mechanical harvesting of ‘Scifresh’ apples. Table 3.4 also provided a
key canopy parameter from shoot category, “SLength”, with the coefficients of 0.722 and 0.505
in PC4 and PC5, respectively. As discussed in the previous studies, shoot length critically
influenced the result of fruit removal in vibratory mechanical harvesting, and if canopy offshoots
were longer than twenty-five centimeters, a lower fruit removal efficiency (FRE) (~56%) was
achieved compared to shorter offshoots (Zhang et al., 2018). Two-dimensional biplots with the
first three PCs (Figure 3.9) revealed that similar canopy parameters were selected even from
different years (2016 versus 2017) on ‘Scifresh’ cultivar.
Table 3.4. Coefficients of the first five principal components (PC1–PC5) for ‘Scifresh’ and
‘Envy’ with eleven canopy parameters.
Scifresh Parametersa PC1
(29.9%)
PC2
(18.4%)
PC3
(14.4%) PC4 (9.9%) PC5 (7.6%)
1 BLength 0.398 -0.279 -0.543 0.073 -0.012
2 BBasalD 0.382 0.327 -0.125 -0.285 0.271
3 BMiddleD 0.360 0.491 -0.160 -0.201 0.168
4 BEndD 0.212 0.593 0.161 0.340 -0.321
5 FLoad 0.542 -0.340 0.205 0.000 0.004
6 FDensity 0.417 -0.227 0.632 -0.030 -0.049
7 FLocation 0.218 -0.177 -0.424 0.218 -0.441
8 FSingleMass -0.013 0.132 0.014 0.389 -0.188
9 SLength 0.063 -0.018 0.020 0.722 0.505
10 SBasalD 0.035 0.078 0.123 0.096 -0.404
11 SIndex -0.008 0.017 0.023 -0.166 -0.381
Envy Parametersa PC1
(33.6%)
PC2
(16.3%)
PC3
(13.5%) PC4 (9.6%) PC5 (6.7%)
1 BLength 0.257 0.186 0.668 0.141 0.214
2 BBasalD 0.501 -0.100 -0.142 -0.109 0.349
3 BMiddleD 0.475 -0.318 -0.062 -0.067 0.019
4 BEndD 0.446 -0.491 -0.068 -0.016 -0.340
5 FLoad 0.442 0.606 0.005 0.110 -0.031
6 FDensity 0.198 0.448 -0.451 0.058 -0.368
7 FLocation 0.120 -0.016 0.425 0.375 -0.317
8 FSingleMass 0.035 0.002 0.085 -0.187 0.431
9 SLength 0.029 -0.024 -0.352 0.565 0.461
10 SBasalD 0.076 0.183 -0.020 -0.495 0.226
11 SIndex 0.045 0.105 0.095 -0.457 -0.174 aAn absolute value of coefficient above 0.5 (in bold type) was deemed highly relevant in this study.

63
The first key parameter of ‘Envy’ was “BBasalD” in PC1 with the coefficient of 0.501,
followed by “FLoad” (0.606) and “BLength” (0.668) in PC2 and PC3, respectively, from branch
and fruit categories. Similarly, “SLength” (0.565) was deemed as a key factor in PC4 from shoot
category. Same PCA interpretations could be applied on both cultivars, where ‘Scifresh’ had five
decisive parameters while ‘Envy’ had four (three of them were the same (Table 3.4)). Individual
groups, such as SB2 and EB2, showed very similar trends of coefficients with ‘Scifresh’ and
‘Envy’. To avoid repetition of similar information, detailed results were not described again. While
the two-dimensional biplots on ‘Envy’ suggested its varietal differences compared with ‘Scifresh’
in Figure 3.9. To realize the research goal, the number of times each canopy parameter that was
deemed highly relevant (coefficient >0.5) was calculated through PC1 to PC5 for all groups
(Figure 3.14). It was clear that in PC1, “BBasalD” and “FLoad” (three times) were deemed the
most relevant. “BEndD” (four times) was also deemed relevant in PC2. In PC3, “FDensity” (four
times) was deemed as the most relevant factor, followed by “SLength” (eight times) in PC4. Lastly,
“SBasalD” (four times) was deemed relevant in PC5.

64
Figure 3.14. Number of times (frequency) canopy parameters deemed highly relevant
(coefficient >0.5) through the first five principal components (PC1–PC5) (where the branch
parameters were noted as “B”; fruit parameters were noted as “F”; and shoot parameters were
noted as “S”).
To sum up, the key canopy parameters referred to “FLoad” and “FDensity” in fruit
category, “BBasalD” and “BEndD” in branch category, and “SLength” and “SBasalD” in shoot
category. Such results can be assessed with the one-way analysis of variance (ANOVA) of
parameters as shown in Table 3.5 in terms of mechanically “harvested” and “unharvested” fruits
in mass mechanical harvest corresponding to Figure 3.3. Comparisons showed that most of the
determined key canopy parameters of ‘Scifresh’ were also showing statistically significant
differences between “harvested” and “unharvested” apples, e.g., “FLoad” and “FDensity” (both p-
values <0.0001), “BLength” (p-value = 0.0128), and “SLength” (p-value <0.0001). However, most
of the decisive canopy parameters of ‘Envy’ were not showing significant differences using
ANOVA; e.g., “BBasalD” (p-value = 0.4416), “BLength” (p-value = 0.9009) and “FLoad” (p-
value = 0.2302) did not cause significant difference in harvested/unharvested apples. This
significance or insignificance of parameters between “harvested” and “unharvested” apples might
also have been caused by some physiological differences of individual apple cultivars. For
example, ‘Envy’ itself has a much lower “FLoad” (maximum of twenty-six apples per branch)
compared with ‘Scifresh’ (maximum of forty-two apples per branch) as shown in Table 3.1.
Finally, it was worth mentioning that some external parameters (e.g., orchard trellising system;
harvesting year) could potentially influence the results, which were not discussed in this work.

65
Table 3.5. One-way analysis of variance (ANOVA) of eleven canopy parameters in terms of
mechanically “harvested” and “unharvested” apples in mass mechanical harvest corresponding
to Figure 3.3.
p-values Branch Parameters Fruit Parameters Shoot Parameters
Scifresh 0.0128 <0.0001 <0.0001
Envy 0.9009 0.2302 <0.0001
Scifresh 0.0063 <0.0001 0.0125
Envy 0.4416 0.3251 <0.0001
Scifresh 0.4058 <0.0001 -
Envy 0.1829 <0.0001 -
Scifresh 0.1280 <0.0001 <0.0001
Envy 0.1038 0.0007 <0.0001
3.5. Conclusions
This study aimed at identifying the most relevant canopy parameters (in formally trained
fruiting-wall orchards) among eleven candidate parameters in achieving better tree-machine
interaction for vibratory mass mechanical harvesting of fresh market apples. Data collected from
the two-year field trials in two commercial apple orchards were analyzed. A supervised machine
learning w-kNN based method was first created, and then a PCA method was used to select the
more relevant parameters for achieving the research goal. Two classes of “mechanically harvested”
and “mechanically unharvested” sample data (apples) were used in this analysis which included a
total 2,678 ground-truth data points (input-output pairs). Specific conclusions from this study were
drawn as follows:
• The w-kNN with “cityblock” distance metric (k = 1) could be used as the predictive
algorithm to classify mechanically “harvested” and “unharvested” apples as being verified
in this study. The training accuracy (correct rate) ranged between 76.3–91.9% and the area
under curve (AUC; the curve of receiver operating characteristic (ROC)) was within the

66
range of 0.75–0.82 for ‘Scifresh’ apple cultivar. They ranged between 62.2–73.5% and
0.66–0.83, respectively, for ‘Envy’ cultivar.
• With the 15% samples of the dataset used, test accuracy (correct rate) for ‘Scifresh’ ranged
between 81.0–90.7% with the maximum standard deviation (s.d.) of 1.4%. The same for
‘Envy’ was between 35.8–79.0% with the maximum s.d. of 11.3%. This result indicated
that the optimized algorithm showed greater variability in accuracy on ‘Scifresh’ and
‘Envy’ apple cultivars potentially due to their varietal physiological differences.
• The analysis of PCA revealed only slight differences between the accuracies when PCA
was used and not in terms of dataset training-Cv, testing, and AUC of ROC (within 1% on
average). To preserve most of the information from dataset while keeping the
interpretation/explanation of PCA as simple as possible, the PC1–PC5 (explained
variances ≥80%) were considered as main components.
• It was found that, for both ‘Scifresh’ and ‘Envy’ cultivars, “FLoad” and “FDensity” were
the most relevant canopy parameters from fruit category influencing the performance of a
mechanical harvesting system. Moreover, “BBasalD” and “BEndD” were found to be
highly relevant as branch parameters, while “SLength” and “SBasalD” were deemed highly
relevant from shoot category.
As a summary, given the dataset used in this study, some key canopy parameters (such as
“FLoad”, “BBasalD”, and “SLength”) showed higher relevancy for mechanical apple harvesting
technology in terms of fruit removal (mechanically harvested or not) using supervised machine
learning technique and PCA. The development of mass mechanical harvesting technology should
always be pursued in close interaction with the optimization of crop/canopy architecture, where
canopy parameter plays a critical role. Results suggest that different canopy parameters respond

67
differently to the proposed harvest method. Results suggested that the higher fruit load/density
with larger basal diameter of branch and shorter fruiting offshoot could potentially result in a
higher mechanical harvesting efficiency as observed from probability density of data distribution
between “mechanically harvested” and “mechanically unharvested” apples in Subsection 3.3.1.2.
Therefore, the obtained key canopy parameters in this work could potentially be considered to
guide the orchard managers and/or workers in conducting corresponding canopy management.
Future work could include i) the local/global sensitivity analysis on how a change in input (e.g.,
canopy parameters) would be translated into a change in output (e.g., mechanical harvest results);
ii) the consideration of external influences such as orchard trellising production system; and iii)
the adoption of more advanced feature selection algorithms such as minimum redundancy
maximum relevance (mRMR) instead of PCA.

68
REFERENCES
Brat, I. (2015). On U.S. farms, fewer hands for the harvest: Producers raise wages, enhance
benefits, but a worker shortage grows with tighter border. The Wall Street Journal (12
Aug. 2015). Retrieved from http://www.wsj.com/articles/on-u-s-farms-fewer-hands-for-
the-harvest-1439371802
Breiman, L. (2001). Random forests. Machine Learning, 45(1), 5–32.
Chlingaryan, A., Sukkarieh, S., and Whelan, B. (2018). Machine learning approaches for crop
yield prediction and nitrogen status estimation in precision agriculture: A review.
Computers and Electronics in Agriculture, 151, 61–69.
Davidson, J., Silwal, A., Karkee, M., Mo, C., and Zhang, Q. (2016). Hand-picking dynamic
analysis for undersensed robotic apple harvesting. Transactions of the ASABE, 59(4),
745–758.
Diener, R. G., Mohsenin, N. N., and Jenks, B. L. (1965). Vibration characteristics of trellis-
trained apple trees with reference to fruit detachment. Transactions of the ASAE, 8(1),
20–24.
Domigan, I. R., Diener, R. G., Elliott, K. C., Blizzard, S. H., Nesselroad, P. E., Singha, S., and
Ingle, M. (1988). A fresh fruit harvester for apples trained on horizontal trellises. Journal
of Agricultural Engineering Research, 41(4), 239–249.
Fan, M., Pena, A. A., and Perloff, J. M. (2016). Effects of the great recession on the US
agricultural labor market. American Journal of Agricultural Economics, 98(4), 1146–
1157.
Fawcett, T. (2006). An introduction to ROC analysis. Pattern Recognition Letters, 27(8), 861–
874.

69
Fu, H., He, L., Ma, S., Karkee, M., Chen, D., Zhang, Q., and Wang, S. (2017). “Jazz” apple
impact bruise responses to different cushioning materials. Transactions of the ASABE,
60(2), 327–336.
Gongal, A., Amatya, S., Karkee, M., Zhang, Q., and Lewis, K. (2015). Sensors and systems for
fruit detection and localization: A review. Computers and Electronics in Agriculture,
116, 8–19.
He, L., Fu, H., Karkee, M., and Zhang, Q. (2017a). Effect of fruit location on apple detachment
with mechanical shaking. Biosystems Engineering, 157, 63–71.
He, L., Fu, H., Sun, D., Karkee, M., and Zhang, Q. (2017b). Shake-and-catch harvesting for fresh
market apples in trellis-trained trees. Transactions of the ASABE, 60(2), 353–360.
He, L., Zhang, X., Karkee, M., and Zhang, Q. (2018). Fruit accessibility for mechanical
harvesting of fresh market apples. ASABE Paper No. 1801007. St. Joseph, MI: ASABE.
He, L., Zhang, X., Ye, Y., Karkee, M., and Zhang, Q. (2019). Effect of shaking location and
duration on mechanical harvesting of fresh market apples. Applied Engineering in
Agriculture, 35(2), 175–183.
Jolliffe, I. (2011). Principal component analysis. International Encyclopedia of Statistical
Science (pp. 1094–1096). Berlin, Germany: Springer.
Kamilaris, A., Kartakoullis, A., and Prenafeta-Boldú, F. X. (2017). A review on the practice of
big data analysis in agriculture. Computers and Electronics in Agriculture, 143, 23–37.
Karkee, M., Silwal, A., and Davidson, J. R. (2018). Chapter 10: Mechanical harvest and in-field
handling of tree fruit crops. Q. Zhang (Ed.), Automation in Tree Fruit Production:
Principles and Practice (pp. 179–233). Wallingford, UK: CABI.
70
Karkee, M., Steward, B. L., Tang, L., and Aziz, S. A. (2009). Quantifying sub-pixel signature of
paddy rice field using an artificial neural network. Computers and Electronics in
Agriculture, 65(1), 65–76.
Kurtulmus, F., Lee, W. S., and Vardar, A. (2014). Immature peach detection in colour images
acquired in natural illumination conditions using statistical classifiers and neural network.
Precision Agriculture, 15(1), 57–79.
Lee, W. S., and Ehsani, R. (2015). Sensing systems for precision agriculture in Florida.
Computers and Electronics in Agriculture, 112, 2–9.
Ling, C. X., Huang, J., and Zhang, H. (2003). AUC: A better measure than accuracy in
comparing learning algorithms. Conference of the Canadian Society for Computational
Studies of Intelligence (pp. 329–341). Berlin, Germany: Springer.
Linker, R., Cohen, O., and Naor, A. (2012). Determination of the number of green apples in
RGB images recorded in orchards. Computers and Electronics in Agriculture, 81, 45–57.
Liu, W., and Chawla, S. (2011). Class confidence weighted knn algorithms for imbalanced data
sets. Pacific-Asia Conference on Knowledge Discovery and Data Mining (pp. 345–356).
Berlin, Germany: Springer.
Liu, Z. Y., Wu, H. F., and Huang, J. F. (2010). Application of neural networks to discriminate
fungal infection levels in rice panicles using hyperspectral reflectance and principal
components analysis. Computers and Electronics in Agriculture, 72(2), 99–106.
Ma, C., Zhang, H. H., and Wang, X. (2014). Machine learning for big data analytics in plants.
Trends in Plant Science, 19(12), 798–808.
Nasrabadi, N. M. (2007). Pattern recognition and machine learning. Journal of Electronic
Imaging, 16(4), 049901.
71
Parrado, E. A., and Gutierrez, E. Y. (2016). The changing nature of return migration to Mexico,
1990–2010: Implications for labor market incorporation and development. Sociology of
Development, 2(2), 93–118.
Peterson, D. L., Whiting, M. D., and Wolford, S. D. (2003). Fresh market quality tree fruit
harvester: Part I. Sweet cherry. Applied Engineering in Agriculture, 19(5), 539–543.
Peterson, D. L., and Wolford, S. D. (2003). Fresh market quality tree fruit harvester: Part II.
Apples. Applied Engineering in Agriculture, 19(5), 545–548.
Powers, D. M. (2011). Evaluation: from precision, recall and F-measure to ROC, informedness,
markedness and correlation. International Journal of Machine Learning Technologies,
2(1), 37–63.
Sankaran, S., Mishra, A., Maja, J. M., and Ehsani, R. (2011). Visible-near infrared spectroscopy
for detection of Huanglongbing in citrus orchards. Computers and Electronics in
Agriculture, 77(2), 127–134.
Seng, W. C., and Mirisaee, S. H. (2009). A new method for fruits recognition system.
International Conference on Electrical Engineering and Informatics (pp. 130–134).
Selangor, Malaysia: IEEE.
Shapiro, L. (1992). Computer vision and image processing. Academic Press. Cambridge, MA:
Elsevier.
Singh, A., Ganapathysubramanian, B., Singh, A. K., and Sarkar, S. (2016). Machine learning for
high-throughput stress phenotyping in plants. Trends in Plant Science, 21(2), 110–124.
Snoek, J., Larochelle, H., and Adams, R. P. (2012). Practical Bayesian optimization of machine
learning algorithms. Advances in Neural Information Processing Systems (pp. 2951–
2959). Lake Tahoe, CA: NIPS.

72
Stephan, J., Sinoquet, H., Donès, N., Haddad, N., Talhouk, S., and Lauri, P. É. (2008). Light
interception and partitioning between shoots in apple cultivars influenced by training.
Tree Physiology, 28(3), 331–342.
USDA. (2018). National agricultural statistics database. Washington, DC: USDA National
Agricultural Statistics Service. Retrieved from https://quickstats.nass.usda.gov
Whiting, M. D. (2018). Chapter 6: Precision orchard systems. Q. Zhang (Ed.), Automation in
Tree Fruit Production: Principles and Practice (pp. 93–111). Wallingford, UK: CABI.
Wold, S., Esbensen, K., and Geladi, P. (1987). Principal component analysis. Chemometrics and
Intelligent Laboratory Systems, 2(1-3), 37–52.
Zhang, X., Fu, L., Majeed, Y., He, L., Karkee, M., Whiting, M. D., and Zhang, Q. (2018). Field
evaluation of data-based pruning severity levels (PSL) on mechanical harvesting of
apples. IFAC-PapersOnLine, 51(17), 477–482.
Zhang, X., He, L., Majeed, Y., Karkee, M., Whiting, M.D., and Zhang, Q. (2017). A study of the
influence of pruning strategy effect on vibrational harvesting of apples. ASABE Paper
No. 1700812. St. Joseph, MI: ASABE.
Zhang, X., He, L., Majeed, Y., Karkee, M., Whiting, M. D., and Zhang, Q. (2018). A precision
pruning strategy for improving efficiency of vibratory mechanical harvesting of apples.
Transactions of the ASABE, 61(5), 1565–1576.
Zhang, Z., Heinemann, P. H., Liu, J., Baugher, T. A., and Schupp, J. R. (2016). The development
of mechanical apple harvesting technology: A review. Transactions of the ASABE, 59(5),
1165–1180.

73
Zhang, J., Zhang, Q., and Whiting, M. D. (2016). Canopy light interception conversion in upright
fruiting offshoot (UFO) sweet cherry orchard. Transactions of the ASABE, 59(4), 727–
736.
Zhao, Y., Yu, K., Li, X., and He, Y. (2016). Detection of fungus infection on petals of rapeseed
(Brassica napus L.) using NIR hyperspectral imaging. Scientific Reports, 6, 38878.
Zhou, Z. H., and Liu, X. Y. (2010). On multi‐class cost‐sensitive learning. Computational
Intelligence, 26(3), 232–257.
Zion, B. (2012). The use of computer vision technologies in aquaculture–A review. Computers
and Electronics in Agriculture, 88, 125–132.

74
CHAPTER FOUR
A PRECISION PRUNING STRATEGY FOR IMPROVING EFFICIENCY OF
VIBRATORY MECHANICAL HARVESTING OF APPLES
4.1. Abstract
The state of Washington is the biggest fresh market apple (Malus domestica Borkh.)
producer in the United States, and the state’s annual apple production has exceeded 60% of the
national production. Due to the extensive labor requirements for harvesting fresh market apples,
there is burgeoning demand for mechanical harvest solutions. This transdisciplinary studies on
mechanical harvest systems for apples have shown that fruit removal efficiency (FRE) with a
vibratory system can be improved with precision canopy management. In this study, the effect of
precision pruning strategies on FRE was evaluated in two groups (106 and 107, respectively) of
randomly selected horizontal branches of ‘Scifresh/M.9’ apple trees in a commercial orchard.
Fruiting lateral branches were pruned to either shorter than 15 cm (guideline 1, G1) or 23 cm
(guideline 2, G2). Harvest tests were conducted using a shake-and-catch harvester prototype
developed by Washington State University with a fixed vibrating frequency of 20 Hz and shaking
duration of 5 s. FRE for branches treated with G1 was significantly higher (91%) than FRE for
branches treated with G2 (81%). A negative relationship between FRE and lateral shoot length
was recorded. FRE was up to 98% when shoots were shorter than 5 cm, and FRE was only 56%
for shoots of 25 cm or longer. A shoot diameter-to-length index (S-index) was developed to better
understand the effect of shoot size on FRE. FRE was as high as 98% when the S-index was greater
than 0.15. In addition, mechanically harvested fruit quality was assessed by categorizing the fruit
into Extra Fancy, Fancy, and Downgrade fresh market classes based on USDA standards; however,
75
no significant difference was found between the two treated groups. These results suggest that
pruning lateral fruiting branches to less than 15 cm or to an S-index greater than 0.03 is required
to achieve FRE of 85% with no negative impacts on fruit quality.
4.2. Introduction
In the past decade, apple (Malus domestica Borkh.) production in the state of Washington
has exceeded 2.7 billion kilograms, representing about 60% of U.S. national production (USDA,
2017). Fresh market apples are harvested manually, creating a demand for a large labor force. In
2014, the U.S. Department of Labor approved visas for 116,689 temporary workers, which is about
50% more than reported for 2011 (Brat, 2015). The average apple picker earned about $13 USD
for a full bin (typical size of 1.2 m×1.2 m×0.6 m with about 420 kg of fruit at full load) in 2001,
which increased to about $28 in 2016 (~$32 per bin in 2019) according to several local orchardists
in Washington. Harvest costs (e.g., picking, checking, and transport activities) for ‘Gala’ are about
$700 ha-1, accounting for about 30% of annual variable production costs ($2,300 ha-1) (Gallardo
et al., 2009; Zhang et al., 2016a). For the cultivar ‘Honeycrisp’, the harvest cost is even greater
(>$1,000 ha-1), accounting for nearly 40% of the total annual production costs in Washington
(Galinato and Gallardo, 2011). Brady et al. (2016) showed that the estimated labor input hours per
hectare of apples increased linearly from 1998 to 2010. Apple growers are facing increases in both
the need for skilled harvest labor and the costs of this labor force, and these pressures have led to
the investigation of more efficient and less labor-intensive means for harvesting apples and other
fruit crops, including robotic and massive mechanical harvesting techniques.
Early attempts at mechanical harvesting of tree fruit crops began in the 1960s in both the
United States and Europe (Adrian and Fridley, 1965; Schertz and Brown, 1968; Lenker, 1970).

76
Since then, numerous studies have been reported for mechanical harvesting of fruits, such as apples
(De Kleine and Karkee, 2015; Peterson and Wolford, 2003) and sweet cherries (Prunus avium L.)
(Peterson et al., 2003; Zhou et al., 2013). Harvesting machines have been commercially adopted
for some fruits destined for the processing industry, such as olives (Olea europaea) for oil pro-
duction (Ferguson et al., 2010), grapes (Vitis vinifera) for wine production (Pezzi and Caprara,
2009), and oranges (Citrus reticulata) for juice production (Brown, 2005). Among various
mechanisms for fruit removal, vibratory mechanical harvesting is one of the most used techniques.
An advantage of vibratory actuation is the ability to vary the excitation frequency and amplitude
to suit the target tree trunks or branches so that fruit removal can be optimized. Irrespective of the
actuation method, the input kinetic energy must exceed the fruit retention energy (e.g., between
the pedicel and the fruiting shoot) to successfully remove fruits (Erdoǧan et al., 2003). Compared
with other mechanical harvesting methods such as a vacuum sucker or a robotic picker, vibrational
actuation can remove many fruits in a short period. Due to this promising advantage, shake-and-
catch harvesters are being continually advanced for harvesting fresh market crops such as sweet
cherries (He et al., 2013; Zhou et al., 2016), apples (He et al., 2017a, 2017b; Zhang et al., 2016a,
2016b), table olives (Castro-Garcia et al., 2015), and Chinese jujubes (Fu et al., 2017) for fresh
market.
These previous studies demonstrated the potential for vibratory shake-and-catch harvesters
in a wide variety of tree fruit crops. However, none of these harvesters has been fully adopted in
commercial apple orchards due to low harvest efficiency and/or high fruit damage (Ben-Tal, 1984;
Zhang et al., 2016a), which may be primarily attributed to the canopy architecture. Previous studies
indicated that the overall apple removal rate with a mechanical harvest system was about 75%
(Burks et al., 2005), and citrus removal rate was 72% with trunk shaking (Torregrosa et al., 2009)

77
due to the branching complexity of traditional orchards. However, other studies showed that a
higher apple removal efficiency could be achieved. For example, using a targeted shaking device
developed by Washington State University, researchers produced a removal rate of ~86% on
‘Scifresh’ apple trees with a shaking frequency of 20 Hz (He et al., 2017b). This improved removal
efficiency was partly attributed to the vertical-trellis tree architecture composed of six or seven
compact horizontal fruiting zones.
The success of mechanical harvesting depends on the harvester mechanism as well as the
tree architecture because both influence system performance, fruit removal efficiency (FRE), and
fruit damage (Burks et al., 2005; Karkee et al., 2018; Robinson et al., 2013). In apple trees, weak,
pendant fruiting branches prevent the shaking energy from being effectively transmitted to the
target fruit; this effect is attributed to the higher energy dissipation of long, thin lateral branches
(De Kleine and Karkee, 2015; Zhang et al., 2016a; Zhou et al., 2016). Therefore, precision
(dormant) pruning has been suggested to improve FRE (He et al., 2017a; Whiting, 2018). Dormant
heading of fruiting lateral branches to limit their length may remove reproductive nodes, reducing
fruit load, and strengthen the branch, improving energy transfer for harvest. In addition, precision
pruning could potentially improve the transmission of vibrational energy and consequently
increase the removal efficiency and decrease fruit damage due to the reduction of fruit-to-branch
impacts. Tombesi et al. (2017) investigated the effectiveness of removing weak branches to
increase harvest efficiency and found that mechanical harvesting performance was enhanced by
12.2%, from 83.4% to 95.6%, on vase-trained olive (Olea europaea) trees. Peterson et al. (1999)
studied the mechanical harvesting of apple in trees trained to a Y-trellis architecture and found that
high harvest efficiency can be achieved if precision pruning management strategies (e.g., removing
weak, pendant lateral branches) are adopted.
78
This research tests the hypothesis that strategic dormant pruning of apple fruiting branches
can enhance FRE of vibratory mechanical harvesting systems. The primary goal is to study the
influence of a dormant pruning strategy (i.e., pruning all lateral branches to a maximum length) on
the performance of a vibratory (shaking) harvesting system. The specific research objectives for
achieving this goal include: (1) investigating the overall and staged effects of the tree canopy on
vibratory FRE and mechanically harvested fruit quality resulting from different pruning levels,
and (2) suggesting strategies for precision pruning of apple orchards trained to fruiting-wall
architecture so that shake-and-catch harvesting can be possible.
4.3. Materials and Methods
4.3.1. Experimental orchard
This study was conducted in a commercial apple orchard (cv. ‘Scifresh/M.9’, abbreviated
here as ‘Scifresh’, Figure 4.1a) near Prosser, Washington. All trees were trained to a vertical-
trellised architecture with seven horizontal fruiting tiers spaced about 50 cm apart (Figure 4.1b).
The tree spacing and row spacing were 1.50 and 2.70 m, respectively, and tree height was about
4.00 m. To simplify the experimental process, the second, third, and fourth horizontal tiers of
fruiting wood were used in this research. Two adjacent tree rows along a SW–NE orientation were
selected for field tests. In this orchard, regular canopy management (e.g., dormant pruning) was
conducted annually and equally applied to all blocks. Therefore, this research assumed there was
no difference among randomly selected test trees before any pruning was applied.
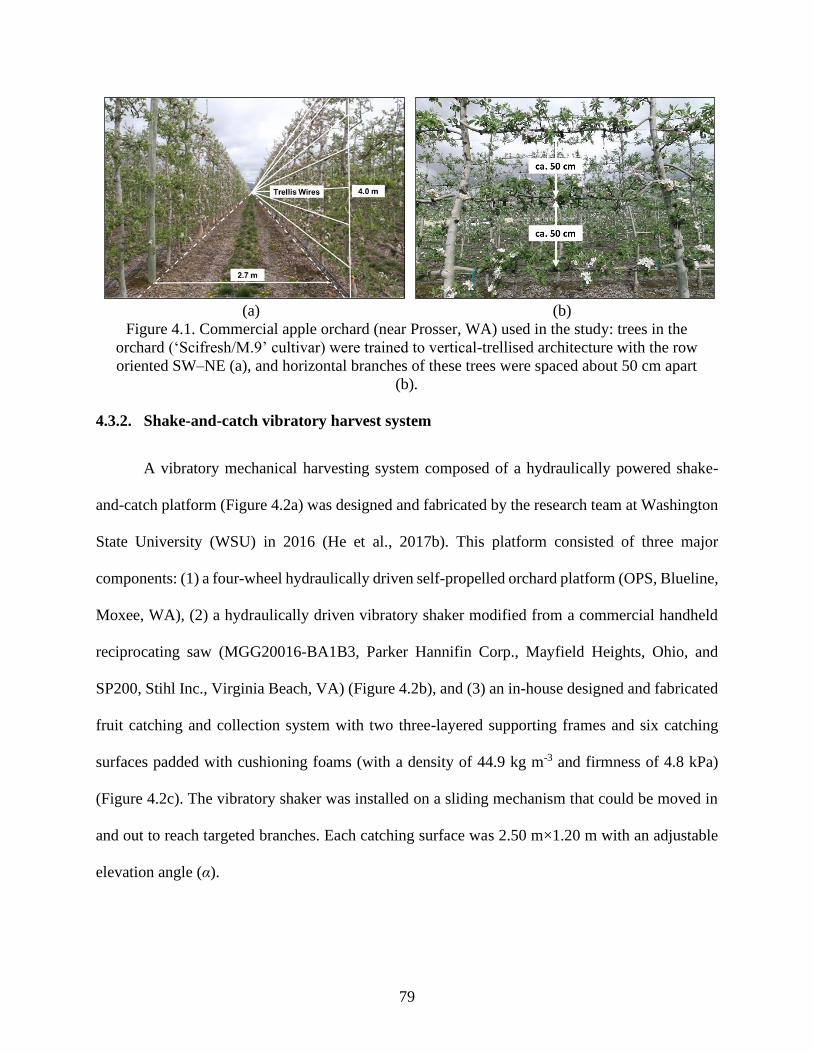
79
(a) (b)
Figure 4.1. Commercial apple orchard (near Prosser, WA) used in the study: trees in the
orchard (‘Scifresh/M.9’ cultivar) were trained to vertical-trellised architecture with the row
oriented SW–NE (a), and horizontal branches of these trees were spaced about 50 cm apart
(b).
4.3.2. Shake-and-catch vibratory harvest system
A vibratory mechanical harvesting system composed of a hydraulically powered shake-
and-catch platform (Figure 4.2a) was designed and fabricated by the research team at Washington
State University (WSU) in 2016 (He et al., 2017b). This platform consisted of three major
components: (1) a four-wheel hydraulically driven self-propelled orchard platform (OPS, Blueline,
Moxee, WA), (2) a hydraulically driven vibratory shaker modified from a commercial handheld
reciprocating saw (MGG20016-BA1B3, Parker Hannifin Corp., Mayfield Heights, Ohio, and
SP200, Stihl Inc., Virginia Beach, VA) (Figure 4.2b), and (3) an in-house designed and fabricated
fruit catching and collection system with two three-layered supporting frames and six catching
surfaces padded with cushioning foams (with a density of 44.9 kg m-3 and firmness of 4.8 kPa)
(Figure 4.2c). The vibratory shaker was installed on a sliding mechanism that could be moved in
and out to reach targeted branches. Each catching surface was 2.50 m×1.20 m with an adjustable
elevation angle (α).

80
(a) (b)
(c)
Figure 4.2. Overall shake-and-catch vibratory harvesting platform (a) developed at
Washington State University, components of mechanical shaker (b), and multi-layer fruit
collection mechanism at an elevation angle of α (c).
4.3.3. Dormant pruning
Figure 4.3a illustrates the experimental replicates (each branch inside the rectangle) used
in this study. The two pruning guidelines applied to the branches were maximum 15 cm (6 in.)
pruning (guideline 1, G1) and maximum 23 cm (9 in.) pruning (guideline 2, G2). In other words,
when branches were treated with G1, all lateral fruiting shoots were pruned to be no longer than
15 cm, and when branches were treated with G2, all lateral fruiting shoots were pruned to be no
longer than 23 cm. In a commercial operation, 23 cm pruning is close to the commonly applied

81
pruning length in Pacific Northwest (PNW) orchards (Figure 4.3b). In this study, a total of 213
branches were manually pruned (106 branches in 22 trees with G1 and 107 branches in 23 trees
with G2) within the same test block. Pruning activity was performed in winter 2016 (January to
March) by a group of skilled orchard workers. Six branches of each test tree were used in the study
unless fewer branches were available in a tree. This manual pruning task was prone to some human
errors that were defined as the percentage of inaccurately pruned branches in the total number of
target branches. Therefore, pruning error represents how well workers pruned to specifications,
disregarding the vegetative growth of shoots during the season gap. Before harvesting, 962 apples
were counted on the branches treated with G1, and 1,120 apples were counted on the branches
treated with G2. All apples were manually labeled and marked with shoot length and diameter
corresponding to where the apples were borne.
(a) (b)
Figure 4.3. Diagram of an experimental unit (branch inside the rectangle), shaking points, and
trellis wires along the target branches (a), and example of pruning by skilled workers with
specific guidelines (b).
4.3.4. Field harvesting test
To quantify the influence of pruning on the performance of a shake-and-catch harvesting
system, vibratory mechanical harvesting tests were conducted using a previously developed shake-
and-catch harvesting platform. The harvesting experiment was conducted from October 5 to 11,
2016. Among all the marked branches, 27 branches (with 286 fruits) with G1 and 21 branches
82
(with 255 fruits) with G2 were mechanically harvested in these tests. From the previous study on
shake-and-catch harvesting, shaking the branches using a 20 Hz shaking frequency (linear stroke
of 36 mm) for 5 s was most effective for trees with similar canopy architecture (He et al., 2017b),
and the shaking location was optimized at the middle of a branch (De Kleine and Karkee, 2015).
Furthermore, the previous study showed that an elevation angle (α) of 15° for the catching surface
minimized the risk of fruit damage (Fu et al., 2017). These previously optimized parameters were
used in performing the harvesting tests in this study. Harvest efficiency from a control (untreated)
set of 24 branches (with no pruning applied) was included to provide reference information. The
shake-and-catch harvesting tests in this study were conducted at the same time as the commercial
harvest. After harvesting, all the removed fruits were carefully collected and stored in paper bags
for subsequent analyses of fruit quality. Any unremoved fruits were manually counted, removed,
collected, and analyzed separately to determine their quality attributes. All field harvest tests were
conducted between 8:00 to 11:00 a.m. to avoid adverse effects of high temperature on harvested
fruit quality.
4.3.5. Evaluation of fruit removal efficiency
To analyze the underlying influence of pruning on the performance of the mechanical
harvesting system, the percentage of removed fruits from the tested branches was calculated and
defined as FRE (%). A digital camera with a slow-motion feature (Cyber-shot DSC-RX100 IV,
Sony Co., Tokyo, Japan) was used to observe the fruit removal process. In addition, a shoot size
index was defined based on the ratio of a shoot’s basal diameter to its length to assess the effect of
fruiting shoot size on mechanical harvesting efficiency. Equation 4.1 defines the index
mathematically:
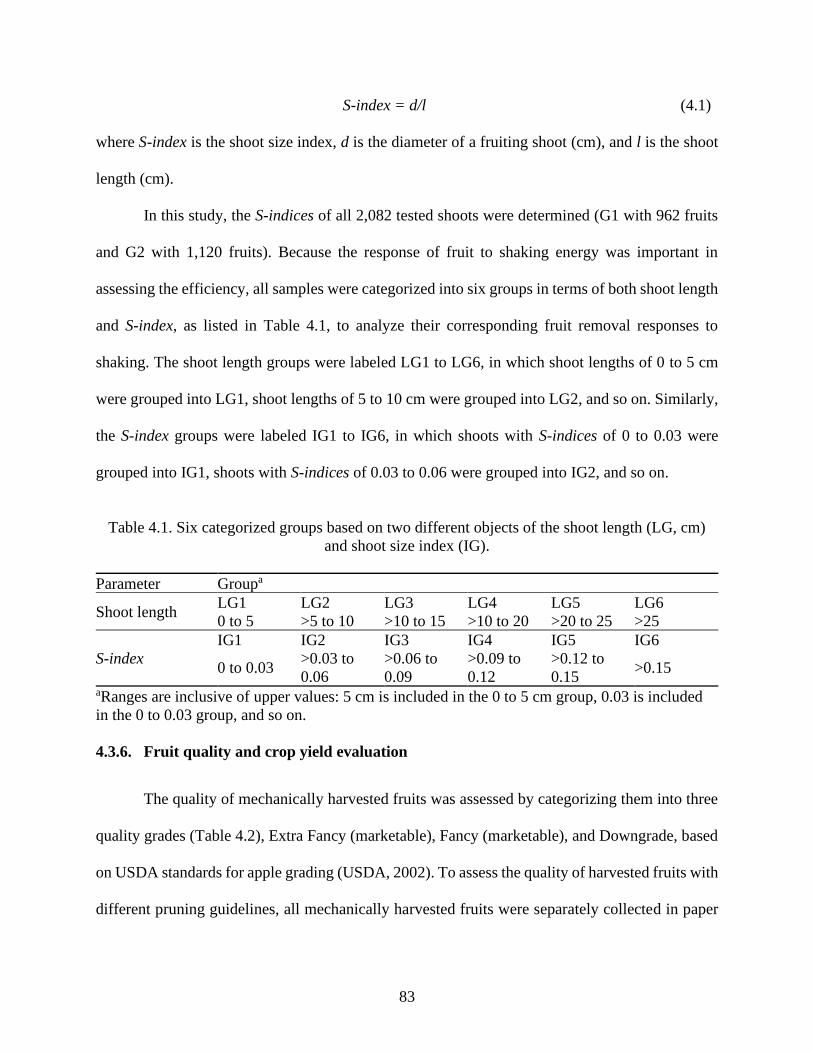
83
S-index = d/l (4.1)
where S-index is the shoot size index, d is the diameter of a fruiting shoot (cm), and l is the shoot
length (cm).
In this study, the S-indices of all 2,082 tested shoots were determined (G1 with 962 fruits
and G2 with 1,120 fruits). Because the response of fruit to shaking energy was important in
assessing the efficiency, all samples were categorized into six groups in terms of both shoot length
and S-index, as listed in Table 4.1, to analyze their corresponding fruit removal responses to
shaking. The shoot length groups were labeled LG1 to LG6, in which shoot lengths of 0 to 5 cm
were grouped into LG1, shoot lengths of 5 to 10 cm were grouped into LG2, and so on. Similarly,
the S-index groups were labeled IG1 to IG6, in which shoots with S-indices of 0 to 0.03 were
grouped into IG1, shoots with S-indices of 0.03 to 0.06 were grouped into IG2, and so on.
Table 4.1. Six categorized groups based on two different objects of the shoot length (LG, cm)
and shoot size index (IG).
Parameter Groupa
Shoot length LG1 LG2 LG3 LG4 LG5 LG6
0 to 5 >5 to 10 >10 to 15 >10 to 20 >20 to 25 >25
S-index
IG1 IG2 IG3 IG4 IG5 IG6
0 to 0.03 >0.03 to
0.06
>0.06 to
0.09
>0.09 to
0.12
>0.12 to
0.15 >0.15
aRanges are inclusive of upper values: 5 cm is included in the 0 to 5 cm group, 0.03 is included
in the 0 to 0.03 group, and so on.
4.3.6. Fruit quality and crop yield evaluation
The quality of mechanically harvested fruits was assessed by categorizing them into three
quality grades (Table 4.2), Extra Fancy (marketable), Fancy (marketable), and Downgrade, based
on USDA standards for apple grading (USDA, 2002). To assess the quality of harvested fruits with
different pruning guidelines, all mechanically harvested fruits were separately collected in paper

84
bags and immediately stored at room temperature (about 21°C) for at least 24 h. All fruits were
then manually checked for damage. Finally, the crop yield was examined at both the branch and
tree level for all 213 treated branches to evaluate the potential profit to growers. The data were
statistically analyzed using one-way ANOVA followed by Fisher’s least significant difference
(LSD) analysis considering a 0.05 confidence level.
Table 4.2. USDA grades and classes for fresh market apples (USDA, 2002).
Quality Grade Class Specified Injuries Injury Size (D = Diameter, A =
Total Area)
Extra Fancy (marketable)
1 No injury -
2 Bruises D3.2 mm
3 Bruises 3.2 mm<D6.4 mm
4 Bruises 6.4 mm<D12.7 mm or A127
mm2
Fancy (marketable) 5 Bruises 12.7 mm<D19.0 mm or
127<A285 mm2
Downgrade
6 Bruises D>19.0 mm or A>285 mm2
7 Cuts, punctures, or any
skin breaks Any size
4.4. Results and Discussion
4.4.1. Overall fruit removal efficiency, fruit quality, and crop yield
The FRE and quality of harvested fruits are the two most important measures of
performance for any mechanical harvesting system. In this study, the FRE values from trees pruned
to the two guidelines were 90.8% ±8.6% and 81.1% ±6.9% (mean ±s.d.), respectively, for G1 and
G2 (Figure 4.4a), revealing a significant effect of pruning treatment (p = 0.021). This difference
in FRE was likely caused by the difference in the transmission of vibrational energy on the pruned
shoots because the transmitted energy decreases with increasing transmission distance. Similarly,
Tombesi et al. (2017) reported that the effectiveness of a mechanical harvesting system was
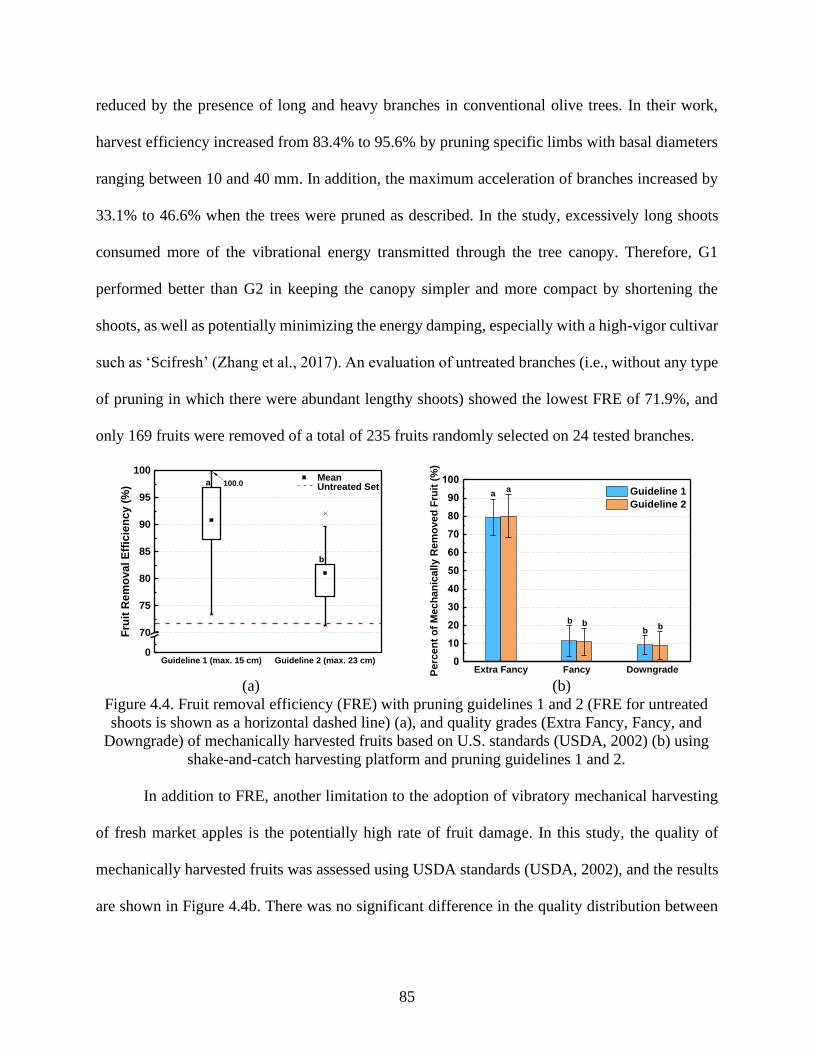
85
reduced by the presence of long and heavy branches in conventional olive trees. In their work,
harvest efficiency increased from 83.4% to 95.6% by pruning specific limbs with basal diameters
ranging between 10 and 40 mm. In addition, the maximum acceleration of branches increased by
33.1% to 46.6% when the trees were pruned as described. In the study, excessively long shoots
consumed more of the vibrational energy transmitted through the tree canopy. Therefore, G1
performed better than G2 in keeping the canopy simpler and more compact by shortening the
shoots, as well as potentially minimizing the energy damping, especially with a high-vigor cultivar
such as ‘Scifresh’ (Zhang et al., 2017). An evaluation of untreated branches (i.e., without any type
of pruning in which there were abundant lengthy shoots) showed the lowest FRE of 71.9%, and
only 169 fruits were removed of a total of 235 fruits randomly selected on 24 tested branches.
(a) (b)
Figure 4.4. Fruit removal efficiency (FRE) with pruning guidelines 1 and 2 (FRE for untreated
shoots is shown as a horizontal dashed line) (a), and quality grades (Extra Fancy, Fancy, and
Downgrade) of mechanically harvested fruits based on U.S. standards (USDA, 2002) (b) using
shake-and-catch harvesting platform and pruning guidelines 1 and 2.
In addition to FRE, another limitation to the adoption of vibratory mechanical harvesting
of fresh market apples is the potentially high rate of fruit damage. In this study, the quality of
mechanically harvested fruits was assessed using USDA standards (USDA, 2002), and the results
are shown in Figure 4.4b. There was no significant difference in the quality distribution between
Guideline 1 (max. 15 cm) Guideline 2 (max. 23 cm)0
70
75
80
85
90
95
100 Mean
Fru
it R
em
ov
al E
ffic
ien
cy
(%
) Untreated Seta
b
100.0
Extra Fancy Fancy Downgrade0
10
20
30
40
50
60
70
80
90
100
bb
b b
aa
Perc
en
t o
f M
ec
ha
nic
all
y R
em
ove
d F
ruit
(%
)
Guideline 1
Guideline 2
86
fruits harvested from shoots pruned to the different guidelines; 79.3% ±10.1% and 80.0% ±11.8%
Extra Fancy, 11.4% ±8.4% and 11.1% ±7.4% Fancy, and 9.2% ±5.1% and 9.1% ±7.8%
Downgrade were harvested from trees treated with G1 and G2, respectively. Overall, the quality
of the mechanically harvested fruits was about 91% marketable (Extra Fancy and Fancy) for both
pruning guidelines, which is comparable to the results obtained from 2015 harvesting tests with
‘Scifresh’ trees using the same shaking mechanism (He et al., 2017b). That previous study focused
on evaluating the shaking mechanism without considering effects of pruning. Although this
percentage is still lower than the ideal results of 100% marketable, the results show promise for
mechanized fresh market harvesting of ‘Scifresh’ and similar cultivars.
Fruits that remained on the branches after the field tests were manually harvested, and their
quality was assessed using the same standards (USDA, 2002); 82.6% and 84.4% Extra Fancy,
17.4% and 13.2% Fancy, and 0.0% and 2.4% Downgrade were manually harvested from trees
treated with G1 and G2, respectively. No cuts and only a few small punctures were found on the
fruits that remained on the branches, but smaller bruising spots were frequently found, perhaps
due to slight collisions with other fruit during vibration. Overall, unharvested fruit were 100% and
97.6% marketable with G1 and G2, respectively, showing that the remaining fruits were not
substantially damaged during application of mechanical vibration.
Regarding agronomic factors, G2 might cost slightly less because of less required pruning
compared to G1 (i.e., a shorter pruning length requires an increased number of shoots to be pruned
out) based on qualitative observations. To evaluate the potential profit to growers, crop yield was
assessed at both the branch and tree levels. Overall, branch yield was 9.6 and 10.1 fruits for G1
and G2, respectively, over the total of 213 treated branches, with a mean single fruit mass of 191
±45 g. No significant difference was found between the two guidelines. Only the second to fourth

87
fruiting tiers of the tested trees were examined in the study, which was extrapolated to full trees
with 7 tiers and 14 branches, resulting in an estimated full tree production of ~36 kg (including
branch and trunk fruits). In other words, about 122 tons per ha of yield could have been achieved
(3,403 trees per ha was confirmed by the orchard manager). Henriod et al. (2007) estimated low,
medium, and high crop-load for ‘Jazz (Scifresh)’ to be 6.3, 8.7, and 11.4 fruits per trunk cross-
sectional area (TCA), respectively, in New Zealand, and the mean mass of a single fruit to be 203,
195, and 184 g, respectively. Based on this estimation, 35 to 57 kg of tree yield could be obtained.
In other words, about 58 to 93 tons per ha of fruit yield was achieved (1,632 trees per ha was
assumed by the authors). Therefore, a reasonably high crop yield was achieved with both pruning
guidelines (G1 and G2) in PNW, although a different region, climate, and tree architecture might
lead to tremendously varying results.
4.4.2. Canopy characteristics
The performance of mechanical harvesting systems is affected by both mechanical (e.g.,
fruit removal and fruit collection methods and mechanisms) and biological (e.g., fruit position and
branch diameter) factors. Based on the results, the trees with lateral shoots pruned to a maximum
length of 15 cm (G1) had improved FRE (about +10%) compared with the FRE of lateral shoots
pruned to a maximum length of 23 cm (G2), with no significant difference in harvested fruit
quality. Thus, the pruning strategies changed the branch biophysics in a manner that improved the
FRE with vibratory mechanical harvesting. Therefore, it was essential to further investigate the
canopy characteristics resulting from the different pruning guidelines so that the primary source
of the differences in harvesting performance could be identified.
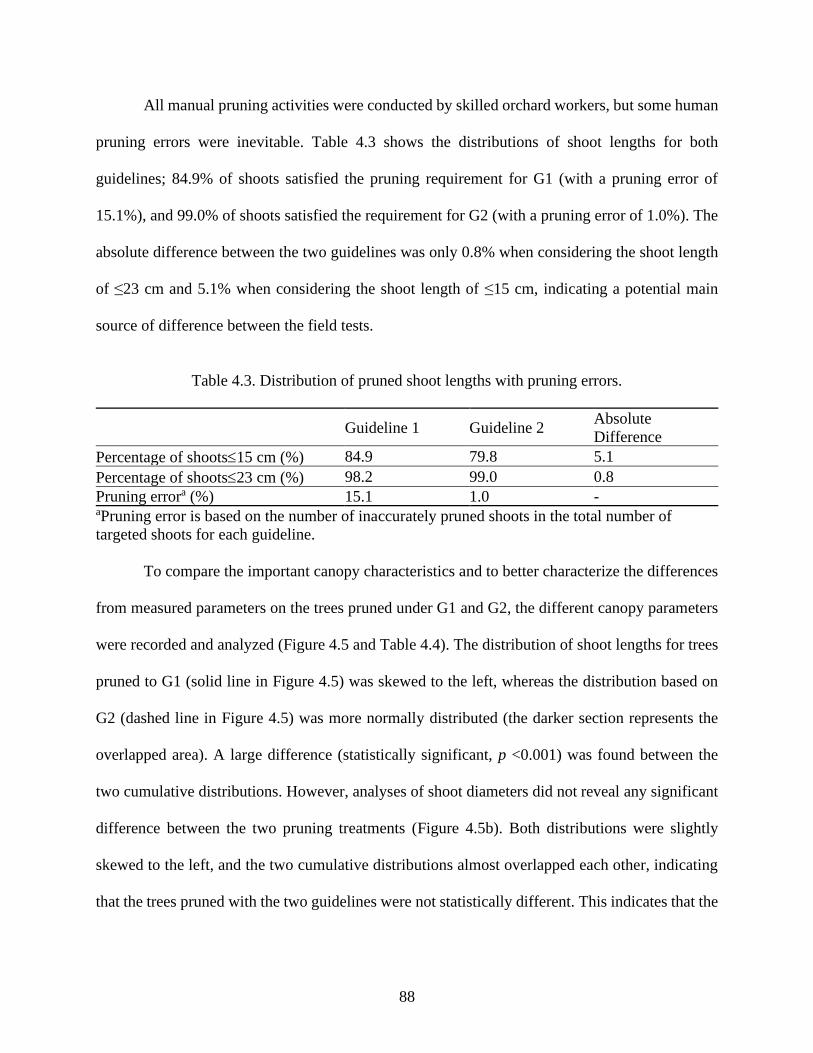
88
All manual pruning activities were conducted by skilled orchard workers, but some human
pruning errors were inevitable. Table 4.3 shows the distributions of shoot lengths for both
guidelines; 84.9% of shoots satisfied the pruning requirement for G1 (with a pruning error of
15.1%), and 99.0% of shoots satisfied the requirement for G2 (with a pruning error of 1.0%). The
absolute difference between the two guidelines was only 0.8% when considering the shoot length
of ≤23 cm and 5.1% when considering the shoot length of ≤15 cm, indicating a potential main
source of difference between the field tests.
Table 4.3. Distribution of pruned shoot lengths with pruning errors.
Guideline 1 Guideline 2 Absolute
Difference
Percentage of shoots15 cm (%) 84.9 79.8 5.1
Percentage of shoots23 cm (%) 98.2 99.0 0.8
Pruning errora (%) 15.1 1.0 - aPruning error is based on the number of inaccurately pruned shoots in the total number of
targeted shoots for each guideline.
To compare the important canopy characteristics and to better characterize the differences
from measured parameters on the trees pruned under G1 and G2, the different canopy parameters
were recorded and analyzed (Figure 4.5 and Table 4.4). The distribution of shoot lengths for trees
pruned to G1 (solid line in Figure 4.5) was skewed to the left, whereas the distribution based on
G2 (dashed line in Figure 4.5) was more normally distributed (the darker section represents the
overlapped area). A large difference (statistically significant, p <0.001) was found between the
two cumulative distributions. However, analyses of shoot diameters did not reveal any significant
difference between the two pruning treatments (Figure 4.5b). Both distributions were slightly
skewed to the left, and the two cumulative distributions almost overlapped each other, indicating
that the trees pruned with the two guidelines were not statistically different. This indicates that the
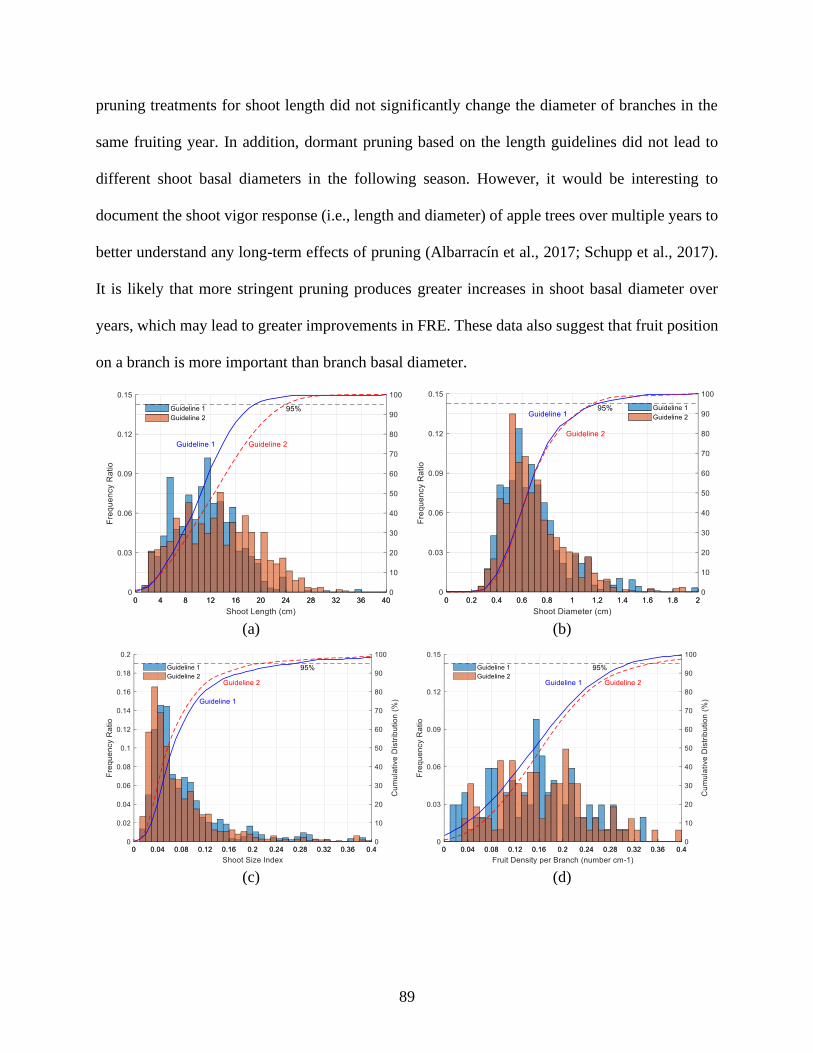
89
pruning treatments for shoot length did not significantly change the diameter of branches in the
same fruiting year. In addition, dormant pruning based on the length guidelines did not lead to
different shoot basal diameters in the following season. However, it would be interesting to
document the shoot vigor response (i.e., length and diameter) of apple trees over multiple years to
better understand any long-term effects of pruning (Albarracín et al., 2017; Schupp et al., 2017).
It is likely that more stringent pruning produces greater increases in shoot basal diameter over
years, which may lead to greater improvements in FRE. These data also suggest that fruit position
on a branch is more important than branch basal diameter.
(a) (b)
(c) (d)
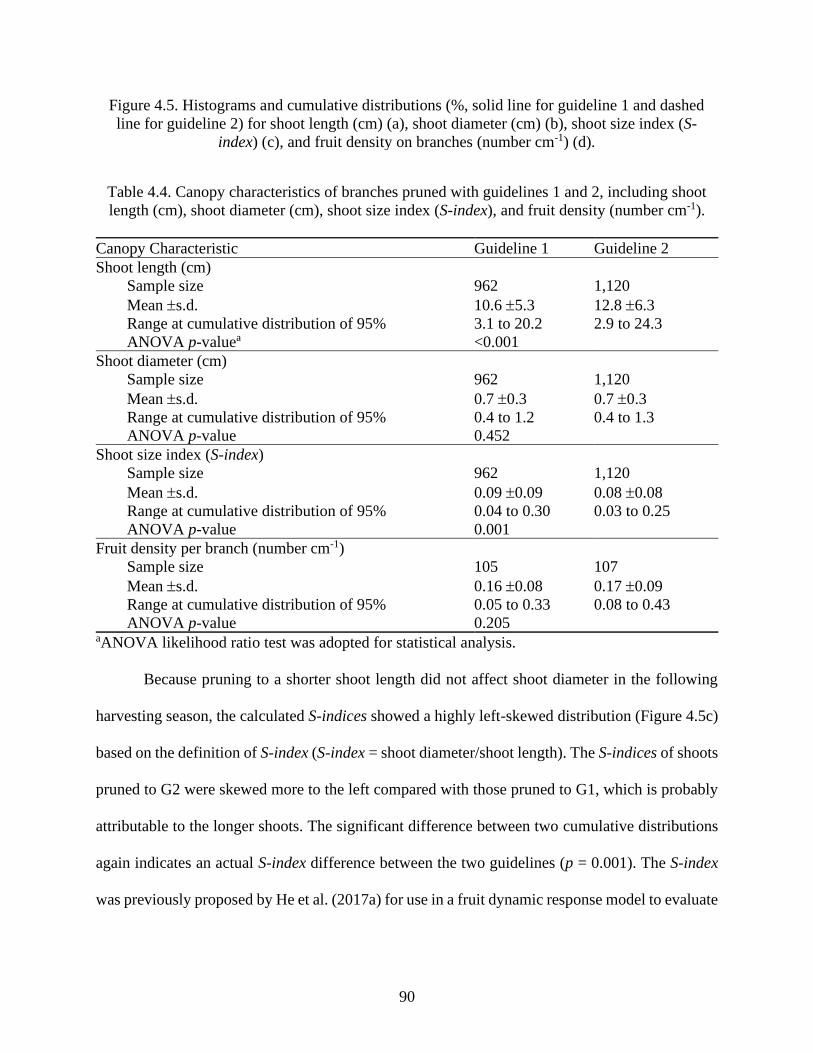
90
Figure 4.5. Histograms and cumulative distributions (%, solid line for guideline 1 and dashed
line for guideline 2) for shoot length (cm) (a), shoot diameter (cm) (b), shoot size index (S-
index) (c), and fruit density on branches (number cm-1) (d).
Table 4.4. Canopy characteristics of branches pruned with guidelines 1 and 2, including shoot
length (cm), shoot diameter (cm), shoot size index (S-index), and fruit density (number cm-1).
Canopy Characteristic Guideline 1 Guideline 2
Shoot length (cm)
Sample size 962 1,120
Mean s.d. 10.6 5.3 12.8 6.3
Range at cumulative distribution of 95% 3.1 to 20.2 2.9 to 24.3
ANOVA p-valuea <0.001
Shoot diameter (cm)
Sample size 962 1,120
Mean s.d. 0.7 0.3 0.7 0.3
Range at cumulative distribution of 95% 0.4 to 1.2 0.4 to 1.3
ANOVA p-value 0.452
Shoot size index (S-index)
Sample size 962 1,120
Mean s.d. 0.09 0.09 0.08 0.08
Range at cumulative distribution of 95% 0.04 to 0.30 0.03 to 0.25
ANOVA p-value 0.001
Fruit density per branch (number cm-1)
Sample size 105 107
Mean s.d. 0.16 0.08 0.17 0.09
Range at cumulative distribution of 95% 0.05 to 0.33 0.08 to 0.43
ANOVA p-value 0.205 aANOVA likelihood ratio test was adopted for statistical analysis.
Because pruning to a shorter shoot length did not affect shoot diameter in the following
harvesting season, the calculated S-indices showed a highly left-skewed distribution (Figure 4.5c)
based on the definition of S-index (S-index = shoot diameter/shoot length). The S-indices of shoots
pruned to G2 were skewed more to the left compared with those pruned to G1, which is probably
attributable to the longer shoots. The significant difference between two cumulative distributions
again indicates an actual S-index difference between the two guidelines (p = 0.001). The S-index
was previously proposed by He et al. (2017a) for use in a fruit dynamic response model to evaluate

91
mechanical harvesting. That previous work showed that fruit acceleration was smaller when the S-
index was smaller, mainly because there was greater difficulty in transmitting energy in longer and
thinner shoots to induce detachment between the fruit pedicel and bearing shoot.
Dormant pruning alters hormone and nutrient relationships within the limb and the canopy,
affecting the fruit density on pruned trees. Figure 4.5d shows the fruit density (number of fruits
per unit length of branch) on lateral branches for both pruning guidelines (all tested branches were
used). The fruit density on trees pruned to G1 was slightly skewed to the left, which is similar to
the shoot length distribution, while the fruit density on trees pruned to G2 was more normally
distributed. The cumulative distributions showed a similar result, indicating that heavier pruning
(G1) contributed to reduced fruit density; however, the difference was statistically insignificant (p
= 0.205). This result is slightly inconsistent with Oliveira et al. (2017), who showed that branch
tip pruning potentially increased both the number of panicles and the fruit per branch on mango
(Mangifera indica) trees. In the study, however, all fruiting branches were laterally trained (i.e.,
parallel to the ground); therefore, the apical dominance effect was minimized. Consequently,
reproductive buds that formed in the previous season on the apple trees were nearly unaffected by
pruning. At a mean fruit density of 0.2 cm-1, there would be about 2.4 and 3.7 fruits per shoot for
trees pruned to G1 and G2, respectively. In other words, a single fruit would be expected every 6.3
cm. Understanding these fruiting relationships may be important for industry practitioners as they
develop pruning strategies to maintain sufficient yield. The two pruning guidelines were based on
the current pruning levels used in the commercial orchard in this study and on discussions with
experienced growers. Based on the findings from this study, further study will be needed to
investigate the potential of pruning to even shorter lengths (e.g., 10 cm) and to include finer
intervals in the pruning guidelines. However, the data suggest that more aggressive pruning of
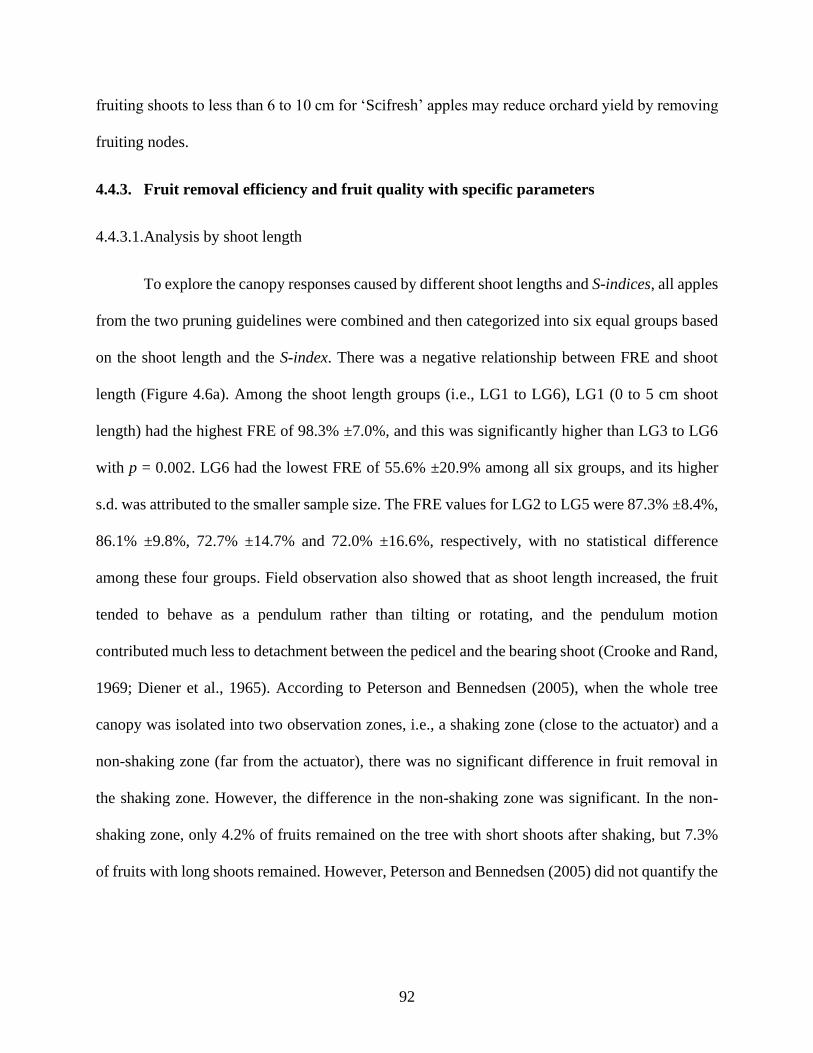
92
fruiting shoots to less than 6 to 10 cm for ‘Scifresh’ apples may reduce orchard yield by removing
fruiting nodes.
4.4.3. Fruit removal efficiency and fruit quality with specific parameters
4.4.3.1.Analysis by shoot length
To explore the canopy responses caused by different shoot lengths and S-indices, all apples
from the two pruning guidelines were combined and then categorized into six equal groups based
on the shoot length and the S-index. There was a negative relationship between FRE and shoot
length (Figure 4.6a). Among the shoot length groups (i.e., LG1 to LG6), LG1 (0 to 5 cm shoot
length) had the highest FRE of 98.3% ±7.0%, and this was significantly higher than LG3 to LG6
with p = 0.002. LG6 had the lowest FRE of 55.6% ±20.9% among all six groups, and its higher
s.d. was attributed to the smaller sample size. The FRE values for LG2 to LG5 were 87.3% ±8.4%,
86.1% ±9.8%, 72.7% ±14.7% and 72.0% ±16.6%, respectively, with no statistical difference
among these four groups. Field observation also showed that as shoot length increased, the fruit
tended to behave as a pendulum rather than tilting or rotating, and the pendulum motion
contributed much less to detachment between the pedicel and the bearing shoot (Crooke and Rand,
1969; Diener et al., 1965). According to Peterson and Bennedsen (2005), when the whole tree
canopy was isolated into two observation zones, i.e., a shaking zone (close to the actuator) and a
non-shaking zone (far from the actuator), there was no significant difference in fruit removal in
the shaking zone. However, the difference in the non-shaking zone was significant. In the non-
shaking zone, only 4.2% of fruits remained on the tree with short shoots after shaking, but 7.3%
of fruits with long shoots remained. However, Peterson and Bennedsen (2005) did not quantify the
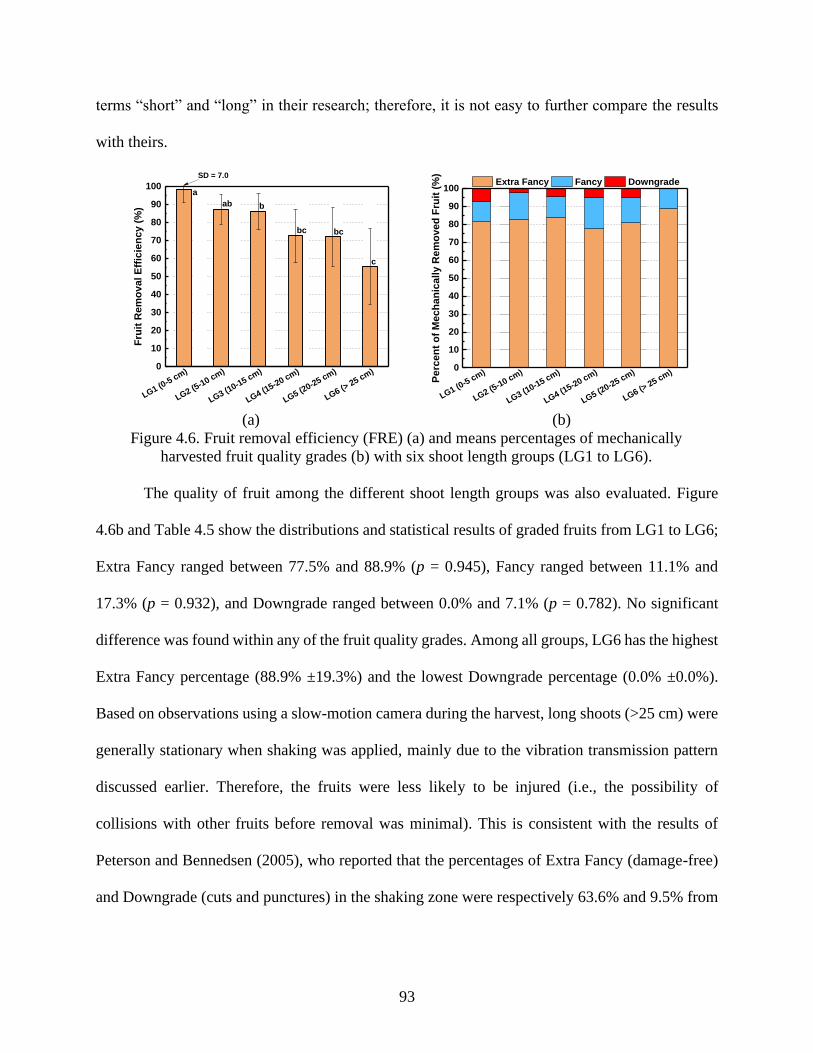
93
terms “short” and “long” in their research; therefore, it is not easy to further compare the results
with theirs.
(a) (b)
Figure 4.6. Fruit removal efficiency (FRE) (a) and means percentages of mechanically
harvested fruit quality grades (b) with six shoot length groups (LG1 to LG6).
The quality of fruit among the different shoot length groups was also evaluated. Figure
4.6b and Table 4.5 show the distributions and statistical results of graded fruits from LG1 to LG6;
Extra Fancy ranged between 77.5% and 88.9% (p = 0.945), Fancy ranged between 11.1% and
17.3% (p = 0.932), and Downgrade ranged between 0.0% and 7.1% (p = 0.782). No significant
difference was found within any of the fruit quality grades. Among all groups, LG6 has the highest
Extra Fancy percentage (88.9% ±19.3%) and the lowest Downgrade percentage (0.0% ±0.0%).
Based on observations using a slow-motion camera during the harvest, long shoots (>25 cm) were
generally stationary when shaking was applied, mainly due to the vibration transmission pattern
discussed earlier. Therefore, the fruits were less likely to be injured (i.e., the possibility of
collisions with other fruits before removal was minimal). This is consistent with the results of
Peterson and Bennedsen (2005), who reported that the percentages of Extra Fancy (damage-free)
and Downgrade (cuts and punctures) in the shaking zone were respectively 63.6% and 9.5% from
LG1 (0-5 cm)
LG2 (5-10 cm)
LG3 (10-15 cm)
LG4 (15-20 cm)
LG5 (20-25 cm)
LG6 (> 25 cm)
0
10
20
30
40
50
60
70
80
90
100
c
bcbc
bab
Fru
it R
em
ov
al
Eff
icie
nc
y (
%)
SD = 7.0
a
LG1 (0-5 cm)
LG2 (5-10 cm)
LG3 (10-15 cm)
LG4 (15-20 cm)
LG5 (20-25 cm)
LG6 (> 25 cm)
0
10
20
30
40
50
60
70
80
90
100
Pe
rce
nt
of
Me
ch
an
ica
lly
Re
mo
ve
d F
ruit
(%
)
Extra Fancy Fancy Downgrade
94
short branches and 70.6% and 9.3% from long branches. The results from the non-shaking zone
showed wider differences: 65.2% of Extra Fancy and 10.0% of Downgrade on short branches, and
72.1% and 7.0%, respectively, on long branches. This is because longer, thinner branches are less
efficient in transferring energy as distance increases. Similarly, no significant difference was found
for each pair of short and long branches using Duncan’s multiple range test.
Table 4.5. Statistical analysis and standard deviation (s.d.) for quality of mechanically harvested
fruit in each shoot length group (LG1 to LG6).
Shoot Length Group s.d. for Extra Fancy (%) s.d. for Fancy (%) s.d. for Downgrade (%)
LG1 (0 to 5 cm) 29.8 25.3 20.3
LG2 (5 to 10 cm) 23.9 23.6 6.9
LG3 (10 to 15 cm) 24.4 21.6 14.1
LG4 (15 to 20 cm) 22.3 20.5 12.9
LG5 (20 to 25 cm) 26.7 24.9 15.8
LG6 (>25 cm) 19.3 19.3 0.0
p-valuea 0.945 0.932 0.782 aThe p-values are for all six groups in the same grade, such as LG1 to LG6 in Extra Fancy.
4.4.3.2.Analysis by shoot size index
Considering the differently distributed S-indices (Figure 4.5c), the measured information
from the same samples was used to analyze the data based on six S-index groups (i.e., IG1 to IG6),
as defined in Table 4.1. Figure 4.7a shows the diametrically opposed trend of FRE compared with
Figure 4.6a. The lowest FRE of 74.5% ±19.5% was found for IG1 (0 to 0.03), and the highest FRE
of 97.8% ±8.0% was found for IG6 (>0.15) (p = 0.005). This trend was expected due to a higher
value of the S-index indicating a larger shoot basal diameter and shorter shoot length, and vice
versa. However, the difference between the FRE values was significant only for IG6 and IG1 or
IG2. The higher s.d. values for IG3 to IG6 were mostly due to the smaller sample sizes for these
groups, and this trend is consistent with the previous trend regarding shoot length and FRE (Figure
4.6a) because a longer shoot length generally leads to a smaller S-index. However, the S-index

95
provides a more integrative assessment than shoot length because the S-index includes shoot
diameter and thus can be used to make pruning decisions. For example, if both the shoot length
and shoot diameter are considered, some longer shoots with larger diameters could remain during
pruning; on the other hand, some shorter shoots with smaller diameters could be pruned. He et al.
(2017a) reported that fruit acceleration responded linearly and positively (R2 = 0.47 to 0.56) to an
input vibration of 15 to 25 Hz with increasing S-index in the range of 0 to 0.2. The previous study
on mechanical harvesting with the same tree system showed that vibration of 20 Hz could achieve
optimal performance in terms of FRE and fruit quality compared to 15 and 25 Hz (He et al., 2017b).
However, different pruning severity levels may change the resonant frequency of the tree or
branch, which needs to be further evaluated.
(a) (b)
Figure 4.7. Fruit removal efficiency (FRE) (a) and means of percentage of mechanically
removed fruit quality (b) along with six predefined shoot size index groups (IG1 to IG6).
As shown in Figure 4.7b and Table 4.6, the quality of the mechanically harvested fruits
was also analyzed. Figure 4.7b shows the quality classification in terms of USDA grades (Table
4.2); IG4 and IG3 had the highest Extra Fancy percentages (88.6% ±25.0% and 87.9% ±21.6%,
respectively), while the lowest percentage was for IG5 (77.3% ±31.4%). However, no significant
IG1 (0
-0.03)
IG2 (0
.03-0.06)
IG3 (0
.06-0.09)
IG4 (0
.09-0.12)
IG5 (0
.12-0.15)
IG6 (>
0.15)0
10
20
30
40
50
60
70
80
90
100
Fru
it R
em
ov
al
Eff
icie
nc
y (
%)
SD = 13.0
c
bc abc
ab ab a
SD = 15.3 SD = 13.9 SD = 8.0
IG1 (0
-0.03)
IG2 (0
.03-0.06)
IG3 (0
.06-0.09)
IG4 (0
.09-0.12)
IG5 (0
.12-0.15)
IG6 (>
0.15)0
10
20
30
40
50
60
70
80
90
100
Pe
rce
nt
of
Me
ch
an
ica
lly
Re
mo
ve
d F
ruit
(%
)
Extra Fancy Fancy Downgrade

96
difference was found among all six groups for each grade, with p = 0.596 for Extra Fancy, p =
0.633 for Fancy, and p = 0.637 for Downgrade.
Table 4.6. Statistical analysis and standard deviation (s.d.) for quality of mechanically harvested
fruit in each S-index group (IG1 to IG6).
S-Index Group s.d. for Extra Fancy (%) s.d. for Fancy (%) s.d. for Downgrade (%)
IG1 (0 to 0.03) 28.6 27.5 14.2
IG2 (0.03 to 0.06) 19.1 16.7 10.4
IG3 (0.06 to 0.09) 21.6 21.1 6.9
IG4 (0.09 to 0.12) 25.0 17.8 12.7
IG5 (0.12 to 0.15) 31.4 30.8 13.9
IG6 (>0.15) 29.8 23.4 22.7
p-valuea 0.596 0.633 0.637 aThe p-values are for all six groups in the same grade, such as IG1 to IG6 in Extra Fancy.
Compared with conventional apple trees, trees in fruiting-wall architectures may cause
fewer collisions between fruits and branches. However, a substantial chance still exists of fruit-to-
fruit and fruit-to-branch contact due because a fruiting-wall architecture still has a certain thickness
(about 35 to 45 cm in the previous study), which creates an environment with many fruits
surrounded by random shoots and branches. Therefore, fruit bruising in this study could be caused
by fruit-to-branch, fruit-to-fruit, and fruit-to-catching surface impacts (Castro-Garcia et al., 2009;
Fu et al., 2016, 2017; Peterson and Bennedsen, 2005). Shortening the shoots by pruning will
potentially reduce the possibility of fruit-to-branch impact, resulting in less fruit damage.
However, further studies to understand how each damage source contributes to the overall damage
distribution was needed.
Considering the results of the pruning treatments on both the canopy characteristics and
harvest results, practical pruning suggestions could be considered for vertical-trellised ‘Scifresh’
apple trees in the PNW region when shake-and-catch harvesting can be adopted: (1) if only the
shoot length is considered, a maximum shoot length of 15 cm is suggested to maintain an FRE of

97
85.0% or greater, and (2) if both shoot length and diameter are considered, a minimum S-index of
0.03 is suggested. Such guidelines are also intended to prove the concept of automated pruning in
similar apple orchards. In addition, the results derived from this study may be applicable to other
narrow, fruiting wall trained apple trees (e.g., V-trellised systems and other widely planted
cultivars in the PNW region) because (1) all fruiting branches are similarly trained (parallel to the
ground) on V-trellised tree architectures, and (2) the fruit retention force for ‘Scifresh’ is relatively
high, e.g., 30 ±10 N (thumb), 17 ±7 N (index finger), and 6 ±3 N (middle finger) using three fingers
in mature conditions (Davidson et al., 2016), compared to other cultivars requiring smaller forces
to induce detachment, e.g., ‘Fuji’ (11 N), ‘Pacific Rose’ (22 N), ‘Cripps Pink’ (20 N), ‘Pink Lady’
(17 N), and ‘Gala’ (24 N) (Peterson and Wolford, 2003).
4.5. Conclusions
This study aimed at better understanding of the effects of precision canopy management
(specifically dormant pruning) on vibratory mechanical harvesting efficiency of fresh market
apples using a shake-and-catch system. The experiment was conducted on ‘Scifresh’ because they
are one of the most widely grown apple cultivars in the PNW region of the United States, where
many of the orchards are planted in trellis-trained, vertical canopy architectures. This study
assessed both the FRE and the quality of mechanically harvested fruits (based on USDA standards)
with varying dormant pruning techniques.
The overall performance of 91% FRE achieved from shoots pruned based on G1 (15 cm
maximum shoot length) was significantly higher than that of 81% from shoots pruned based on
G2 (23 cm maximum shoot length). With increased shoot length, FRE significantly and
continuously decreased from about 98% to 56% as shoot length increased from LG1 to LG6.
98
However, it is difficult to achieve more than 98% FRE because the suggested minimum shoot
length is 10 cm (based on discussions with local growers). In addition, as the S-index increased
from IG1 to IG6, FRE was found to increase correspondingly from about 75% to 98%. These
findings verified the primary hypothesis that shorter shoots could improve the FRE without
sacrificing the quality of harvested fruits and validated that a larger S-index indicates that higher
FRE can be achieved in shake-and-catch harvesting of apples. No difference was found in the
quality of the harvested fruits; all fruits reached about 91% overall marketable quality (Extra Fancy
and Fancy grades).
Considering both the canopy characteristics and the results for shoot length and S-index
from the field tests, the following rules can be adopted to create pruning strategies for fruiting-
wall tree architectures that are more machine friendly: (1) if only the shoot length is considered,
the maximum shoot length should be less than 15 cm, and (2) if both the shoot length and diameter
are considered, a minimum S-index of 0.03 should be maintained. Based on the results obtained in
this study, an FRE of 85% or greater can be achieved if the pruned shoots satisfy these two rules
in vibratory shake-and-catch harvesting. The results also showed that a minimum of 91%
marketable fruit quality could be achieved for fresh market apples.

99
REFERENCES
Adrian, P. A., and Fridley, R. B. (1965). Dynamics and design criteria of inertia-type tree
shakers. Transactions of the ASAE, 8(1), 12–14.
Albarracín, V., Hall, A. J., Searles, P. S., and Rousseaux, M. C. (2017). Responses of vegetative
growth and fruit yield to winter and summer mechanical pruning in olive trees. Scientia
Horticulturae, 225, 185–194.
Ben-Tal, Y. (1984). Horticultural aspects of mechanical fruit harvesting. Proceedings of the
International Symposium on Fruit, Nut, and Vegetable Harvesting Mechanization, 372–
375. St. Joseph, MI: ASAE.
Brady, M. P., Gallardo, R. K., Badruddozza, S., and Jiang, X. (2016). Regional equilibrium wage
rate for hired farm workers in the tree fruit industry. Western Economics Forum, 15(1),
20–31.
Brat, I. (2015). On U.S. farms, fewer hands for the harvest: Producers raise wages, enhance
benefits, but a worker shortage grows with tighter border. The Wall Street Journal (12
Aug. 2015). Retrieved from http://www.wsj.com/articles/on-u-s-farms-fewer-hands-for-
the-harvest-1439371802
Brown, G. K. (2005). New mechanical harvesters for the Florida citrus juice industry.
HortTechnology, 15(1), 69–72.
Burks, T., Villegas, F., Hannan, M., Flood, S., Sivaraman, B., Subramanian, V., and Sikes, J.
(2005). Engineering and horticultural aspects of robotic fruit harvesting: Opportunities
and constraints. HortTechnology, 15(1), 79–87.

100
Castro-Garcia, S., Castillo-Ruiz, F. J., Jimenez-Jimenez, F., Gil-Ribes, J. A., and Blanco-Roldan,
G. L. (2015). Suitability of Spanish ‘Manzanilla’ table olive orchards for trunk shaker
harvesting. Biosystems Engineering, 129, 388–395.
Castro-Garcia, S., Rosa, U. A., Gliever, C. J., Smith, D., Burns, J. K., Krueger, W. H., Ferguson,
L., and Glozer, K. (2009). Video evaluation of table olive damage during harvest with a
canopy shaker. HortTechnology, 19(2), 260–266.
Crooke, J. R., and Rand, R. H. (1969). Vibratory fruit harvesting: A linear theory of fruit-stem
dynamics. Journal of Agricultural Engineering Research, 14(3), 195–209.
Davidson, J., Silwal, A., Karkee, M., Mo, C., and Zhang, Q. (2016). Hand-picking dynamic
analysis for undersensed robotic apple harvesting. Transactions of the ASABE, 59(4),
745–758.
De Kleine, M. E., and Karkee, M. (2015). A semi-automated harvesting prototype for shaking
fruit tree limbs. Transactions of the ASABE, 58(6), 1461–1470.
Diener, R. G., Mohsenin, N. N., and Jenks, B. L. (1965). Vibration characteristics of trellis-
trained apple trees with reference to fruit detachment. Transactions of the ASAE, 8(1),
20–24.
Erdoǧan, D., Guner, M., Dursun, E., and Gezer, I. (2003). Mechanical harvesting of apricots.
Biosystems Engineering, 85(1), 19–28.
Ferguson, L., Rosa, U. A., Castro-Garcia, S., Lee, S. M., Guinard, J. X., Burns, J., Krueger,
W.H., O'connell, N.V., and Glozer, K. (2010). Mechanical harvesting of California table
and oil olives. Advances in Horticultural Science, 24(1), 53–63.
Fu, H., He, L., Ma, S., Karkee, M., Chen, D., Zhang, Q., and Wang, S. (2016). Bruise responses
of apple-to-apple impact. IFAC-PapersOnLine, 49(16), 347–352.
101
Fu, L., Al-Mallahi, A., Peng, J., Sun, S., Feng, Y., Li, R., He, D., and Cui, Y. (2017). Harvesting
technologies for Chinese jujube fruits: A review. Engineering in Agriculture,
Environment and Food, 10(3), 171–177.
Fu, H., He, L., Ma, S., Karkee, M., Chen, D., Zhang, Q., and Wang, S. (2017). ‘Jazz’ apple
impact bruise responses to different cushioning materials. Transactions of the ASABE,
60(2), 327–336.
Galinato, S. P., and Gallardo, R. K. (2011). Cost estimates of establishing, producing, and
packing ‘Honeycrisp’ apples in Washington. Fact Sheet FS062E. Pullman: Washington
State University Extension. Retrieved from
http://cru.cahe.wsu.edu/CEPublications/FS062E/FS062E.pdf
Gallardo, R. K., Taylor, M., and Hinman, H. (2009). Cost estimates of establishing and
producing ‘Gala’ apples in Washington. Fact Sheet FS005E. Pullman: Washington State
University Extension. Retrieved from
http://cru.cahe.wsu.edu/CEPublications/FS005E/FS005E.pdf
He, L., Fu, H., Karkee, M., and Zhang, Q. (2017a). Effect of fruit location on apple detachment
with mechanical shaking. Biosystems Engineering, 157, 63–71.
He, L., Fu, H., Sun, D., Karkee, M., and Zhang, Q. (2017b). Shake-and-catch harvesting for fresh
market apples in trellis-trained trees. Transactions of the ASABE, 60(2), 353–360.
He, L., Zhou, J., Du, X., Chen, D., Zhang, Q., and Karkee, M. (2013). Energy efficacy analysis
of a mechanical shaker in sweet cherry harvesting. Biosystems Engineering, 116(4), 309–
315.
Henriod, R., Johnston, J., Palmer, J., Tustin, S., Breen, K., Dayatilake, D., Diack, R., Oliver, M.,
and Seymour, S. (2007). Effects of crop load and time of thinning on ‘Scifresh’ (Jazz)
102
apple fruit quality at harvest and after extended cold storage. Report No. 21011.
Auckland, New Zealand: Horticulture and Food Research Institute of New Zealand.
Retrieved from https://tandgtech.global/assets/Files/2007-Effects-of-crop-load-and-time-
of-thinning-on-Jazz.pdf
Karkee, M., Silwal, A., and Davidson, J. R. (2018). Chapter 10: Mechanical harvest and in-field
handling of tree fruit crops. Q. Zhang (Ed.), Automation in Tree Fruit Production:
Principles and Practice (pp. 179–233). Wallingford, UK: CABI.
Lenker, D. H. (1970). Development of an auger picking head for selectively harvesting fresh
market oranges. Transactions of the ASAE, 13(4), 500–504.
Oliveira, G. P., de Siqueira, D. L., Salomao, L. C. C., Cecon, P. R., and Machado, D. L. M.
(2017). Paclobutrazol and branch tip pruning on the flowering induction and quality of
mango tree fruits. Pesquisa Agropecuária Tropical, 47(1), 7–14.
Peterson, D. L., and Bennedsen, B. S. (2005). Isolating damage from mechanical harvesting of
apples. Applied Engineering in Agriculture, 21(1), 31–34.
Peterson, D. L., and Wolford, S. D. (2003). Fresh market quality tree fruit harvester: Part II.
Apples. Applied Engineering in Agriculture, 19(5), 545–548.
Peterson, D. L., Bennedsen, B. S., Anger, W. C., and Wolford, S. D. (1999). A systems approach
to robotic bulk harvesting of apples. Transactions of the ASAE, 42(4), 871–876.
Peterson, D. L., Whiting, M. D., and Wolford, S. D. (2003). Fresh market quality tree fruit
harvester: Part I. Sweet cherry. Applied Engineering in Agriculture, 19(5), 539–543.
Pezzi, F., and Caprara, C. (2009). Mechanical grape harvesting: Investigation of the transmission
of vibrations. Biosystems Engineering, 103(3), 281–286.

103
Robinson, T., Hoying, S., Sazo, M. M., DeMarree, A., and Dominguez, L. (2013). A vision for
apple orchard systems of the future. New York Fruit Quarterly, 21(3), 11–16.
Schertz, C. E., and Brown, G. K. (1968). Basic considerations in mechanizing citrus harvest.
Transactions of the ASAE, 11(3), 343–346.
Schupp, J. R., Winzeler, H. E., Kon, T. M., Marini, R. P., Baugher, T. A., Kime, L. F., and
Schupp, M. A. (2017). A method for quantifying whole-tree pruning severity in mature
tall spindle apple plantings. HortScience, 52(9), 1233–1240.
Tombesi, S., Poni, S., Palliotti, A., and Farinelli, D. (2017). Mechanical vibration transmission
and harvesting effectiveness is affected by the presence of branch suckers in olive trees.
Biosystems Engineering, 158, 1–9.
Torregrosa, A., Orti, E., Marti¬n, B., Gil, J., and Ortiz, C. (2009). Mechanical harvesting of
oranges and mandarins in Spain. Biosystems Engineering, 104(1), 18–24.
USDA. (2002). S51.300: United States standards for grades of apples. Washington, DC: USDA
Agricultural Marketing Service. https://www.ams.usda.gov/grades-standards/apple-
grades-standards
USDA. (2017). National agricultural statistics database. Washington, DC: USDA National
Agricultural Statistics Service. Retrieved from https://quickstats.nass.usda.gov
Whiting, M. D. (2018). Chapter 6: Precision orchard systems. Q. Zhang (Ed.), Automation in
Tree Fruit Production: Principles and Practice (pp. 93–111). Wallingford, UK: CABI.
Zhang, X., He, L., Majeed, Y., Karkee, M., Whiting, M. D., and Zhang, Q. (2017). A study of
the influence of pruning strategy effect on vibrational harvesting of apples. ASABE Paper
No. 1700812. St. Joseph, MI: ASABE.
104
Zhang, Z., Heinemann, P. H., Liu, J., Baugher, T. A., and Schupp, J. R. (2016a). The
development of mechanical apple harvesting technology: A review. Transactions of the
ASABE, 59(5), 1165–1180.
Zhang, Z., Heinemann, P. H., Liu, J., Schupp, J. R., and Baugher, T. A. (2016b). Design and
field test of a low-cost apple harvest-assist unit. Transactions of the ASABE, 59(5), 1149–
1156.
Zhou, J., He, L., Whiting, M., Amatya, S., Larbi, P. A., Karkee, M., and Zhang, Q. (2016). Field
evaluation of a mechanical-assist cherry harvesting system. Engineering in Agriculture,
Environment and Food, 9(4), 324–331.
Zhou, J., He, L., Zhang, Q., Du, X., Chen, D., and Karkee, M. (2013). Evaluation of the
influence of shaking frequency and duration in mechanical harvesting of sweet cherry.
Applied Engineering in Agriculture, 29(5), 607–612.
105
CHAPTER FIVE
FIELD EVALUATION OF TARGETED SHAKE-AND-CATCH HARVESTING
TECHNOLOGIES FOR FRESH MARKET APPLE
5.1. Abstract
Apple is the most economically important agricultural crop in Washington State. In 2018,
Washington State produced ~3.3 billion kilograms of apple, counting for approximately 63% of
the United States production. Fresh-market apple is currently harvested manually, requiring large
number seasonal semi-skilled labors within a small time-window of harvesting. To overcome the
increasing challenges of uncertainty in labor availability and raising labor costs, a promising
mechanical harvesting solution, using targeted shake-and-catch approach, is under development at
Washington State University. This study was to evaluate the developed system through analyzing
fruit harvest efficiency and fruit quality under three shaking methods, i.e., continuous non-linear,
continuous linear, and intermittent linear shaking, on up to six apple cultivars trained to formal
tree architectures. Results revealed that intermittent linear shaking achieved 90% of fruit removal
efficiency on ‘Scifresh’ cultivar, while the continuous linear shaking achieved 63% on ‘Gala’. This
study also compared three vibratory harvest systems: a hand-held system, a hydraulically driven
system, and a semi-automated hydraulic harvest system. The semi-automated harvest system
achieved the highest fruit removal efficiency (90%), followed by the hand-held (87%) and
hydraulic systems (84%), mainly attributing to the different shaking methods employed. However,
the differences were statistically insignificant. Fruit catching efficiency varied among systems with
the hand-held achieving the highest (97%), followed by the hydraulic (91%) and the semi-
automated systems (88%). Among all three tested technologies, the developed prototype of semi-

106
automated system achieved the highest level of mechanization, as well as the fruit removal
efficiency and best fruit quality. As the semi-automated system did not yet include the auto-
positioning function, it would take about eight times longer (~103 s) to position its shaker head
than the actual shaking time (~13 s), which suggests that a fully automated system would be
desirable in the future for further increasing the productivity. This study showed that the shake-
and-catch approach has a high potential for practical adoption in harvesting fresh-market apples,
and therefore, a potential to make an economically positive impact on the apple industry in the
United States.
5.2. Introduction
Fresh market apple (Malus domestica Borkh.) is one of the important agricultural products
in the United States and around the world. Washington produced ~3.3 billion kilograms of apples
in 2018, ca. 63% of the national production (USDA, 2018). Currently, all fresh market apples are
harvested manually, requiring a large semi-skilled workforce for a small harvest-window. In recent
years, labor costs have increased, and labor availability has become increasingly uncertain (Brat,
2015). In 2016, for example, 44% of farms in Washington lost up to $50,000 each in their
operations due to insufficient workforce, while 21% of farms lost $50,000–$250,000 (Clark,
2017). Between 2007–2014, up to 98 million kilograms of apple per year were not harvested due
to the same reason (USDA, 2018). To reduce growers’ dependency on the increasingly expensive
and uncertain seasonal agricultural employees, it is necessary to develop more efficient and less
labor-intensive solutions for fresh market apple harvesting (and other tree fruit crops). Mechanical
harvest systems have the potential to reduce labor demand and improve the worker health and
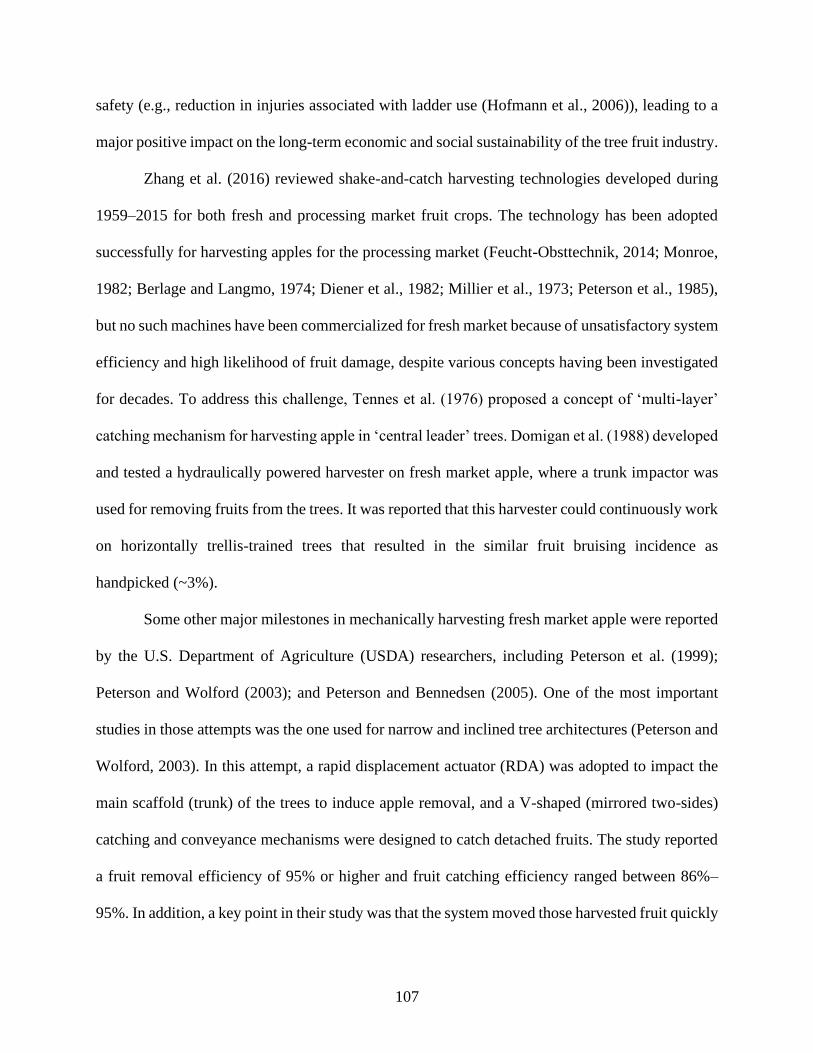
107
safety (e.g., reduction in injuries associated with ladder use (Hofmann et al., 2006)), leading to a
major positive impact on the long-term economic and social sustainability of the tree fruit industry.
Zhang et al. (2016) reviewed shake-and-catch harvesting technologies developed during
1959–2015 for both fresh and processing market fruit crops. The technology has been adopted
successfully for harvesting apples for the processing market (Feucht-Obsttechnik, 2014; Monroe,
1982; Berlage and Langmo, 1974; Diener et al., 1982; Millier et al., 1973; Peterson et al., 1985),
but no such machines have been commercialized for fresh market because of unsatisfactory system
efficiency and high likelihood of fruit damage, despite various concepts having been investigated
for decades. To address this challenge, Tennes et al. (1976) proposed a concept of ‘multi-layer’
catching mechanism for harvesting apple in ‘central leader’ trees. Domigan et al. (1988) developed
and tested a hydraulically powered harvester on fresh market apple, where a trunk impactor was
used for removing fruits from the trees. It was reported that this harvester could continuously work
on horizontally trellis-trained trees that resulted in the similar fruit bruising incidence as
handpicked (~3%).
Some other major milestones in mechanically harvesting fresh market apple were reported
by the U.S. Department of Agriculture (USDA) researchers, including Peterson et al. (1999);
Peterson and Wolford (2003); and Peterson and Bennedsen (2005). One of the most important
studies in those attempts was the one used for narrow and inclined tree architectures (Peterson and
Wolford, 2003). In this attempt, a rapid displacement actuator (RDA) was adopted to impact the
main scaffold (trunk) of the trees to induce apple removal, and a V-shaped (mirrored two-sides)
catching and conveyance mechanisms were designed to catch detached fruits. The study reported
a fruit removal efficiency of 95% or higher and fruit catching efficiency ranged between 86%–
95%. In addition, a key point in their study was that the system moved those harvested fruit quickly
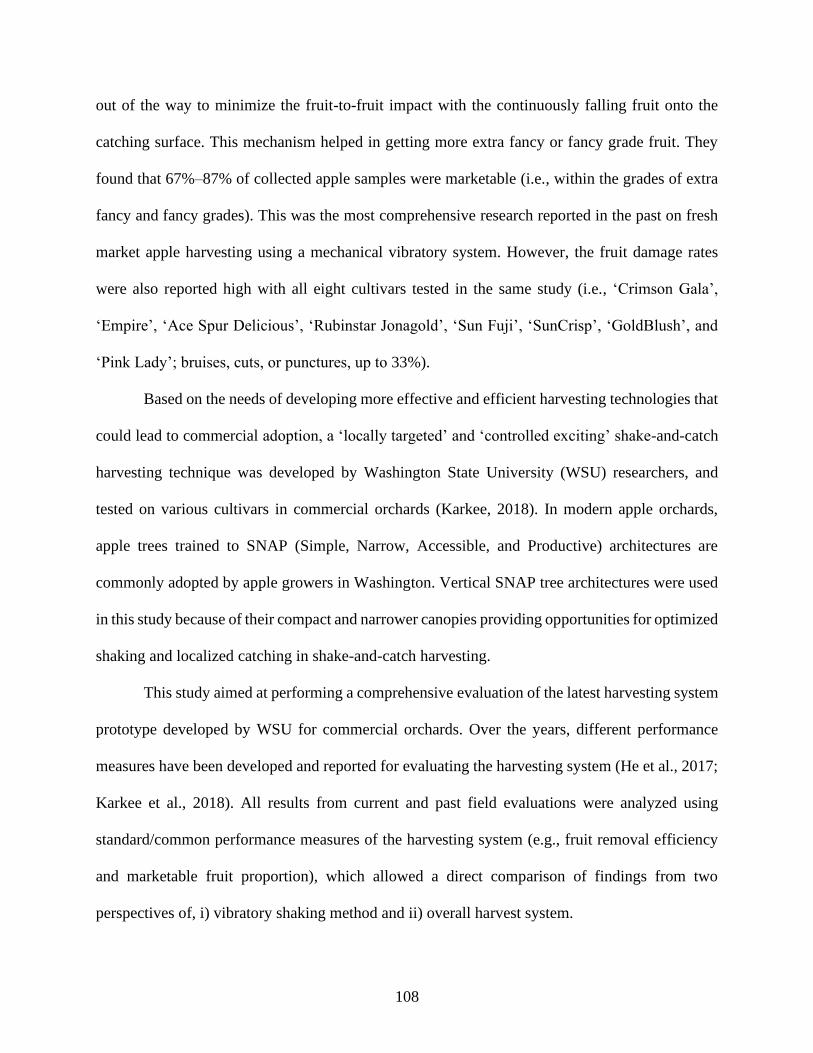
108
out of the way to minimize the fruit-to-fruit impact with the continuously falling fruit onto the
catching surface. This mechanism helped in getting more extra fancy or fancy grade fruit. They
found that 67%–87% of collected apple samples were marketable (i.e., within the grades of extra
fancy and fancy grades). This was the most comprehensive research reported in the past on fresh
market apple harvesting using a mechanical vibratory system. However, the fruit damage rates
were also reported high with all eight cultivars tested in the same study (i.e., ‘Crimson Gala’,
‘Empire’, ‘Ace Spur Delicious’, ‘Rubinstar Jonagold’, ‘Sun Fuji’, ‘SunCrisp’, ‘GoldBlush’, and
‘Pink Lady’; bruises, cuts, or punctures, up to 33%).
Based on the needs of developing more effective and efficient harvesting technologies that
could lead to commercial adoption, a ‘locally targeted’ and ‘controlled exciting’ shake-and-catch
harvesting technique was developed by Washington State University (WSU) researchers, and
tested on various cultivars in commercial orchards (Karkee, 2018). In modern apple orchards,
apple trees trained to SNAP (Simple, Narrow, Accessible, and Productive) architectures are
commonly adopted by apple growers in Washington. Vertical SNAP tree architectures were used
in this study because of their compact and narrower canopies providing opportunities for optimized
shaking and localized catching in shake-and-catch harvesting.
This study aimed at performing a comprehensive evaluation of the latest harvesting system
prototype developed by WSU for commercial orchards. Over the years, different performance
measures have been developed and reported for evaluating the harvesting system (He et al., 2017;
Karkee et al., 2018). All results from current and past field evaluations were analyzed using
standard/common performance measures of the harvesting system (e.g., fruit removal efficiency
and marketable fruit proportion), which allowed a direct comparison of findings from two
perspectives of, i) vibratory shaking method and ii) overall harvest system.

109
5.3. Materials and Methods
5.3.1. Commercial orchards
Field evaluations of this shake-and-catch system were conducted in commercial orchards
near Prosser and Othello in Washington. The trees in these orchards were trained to the formal
architectures (i.e., in vertical or V-axis; with vertical trunk and horizontal branches trained to trellis
wires; Figure 5.1a). Six commonly planted apple cultivars, ‘Pacific Rose’, ‘Pink Lady’, and
‘Scifresh’ (vertically trained, Figure 5.1b), ‘Envy’, ‘Fuji’, and ‘Gala’ (V-axis, Figure 5.1c), were
tested in 2014–2018 harvest seasons. In these orchards, six to eight horizontal trellis wires spaced
~0.5 m apart were used to train the trees. The trees in these orchards were spaced at 0.5–1.5 m in
rows spaced 1.8–3.8 m apart, and at their full production level with the average tree height of 2.7–
4.0 m (Table 5.1). Table 5.1 provides other related information, such as average number of fruits
per branch and average fruit size for all six cultivars. Figure 5.1a shows a typical canopy layout of
the formally trained trees during harvest. One could find that most of the fruits are found along the
horizontal branches which provided the needed accessibility for targeted shaking (individual
horizontal branches) and fruit catching right underneath the branch (He et al., 2018).
(a)
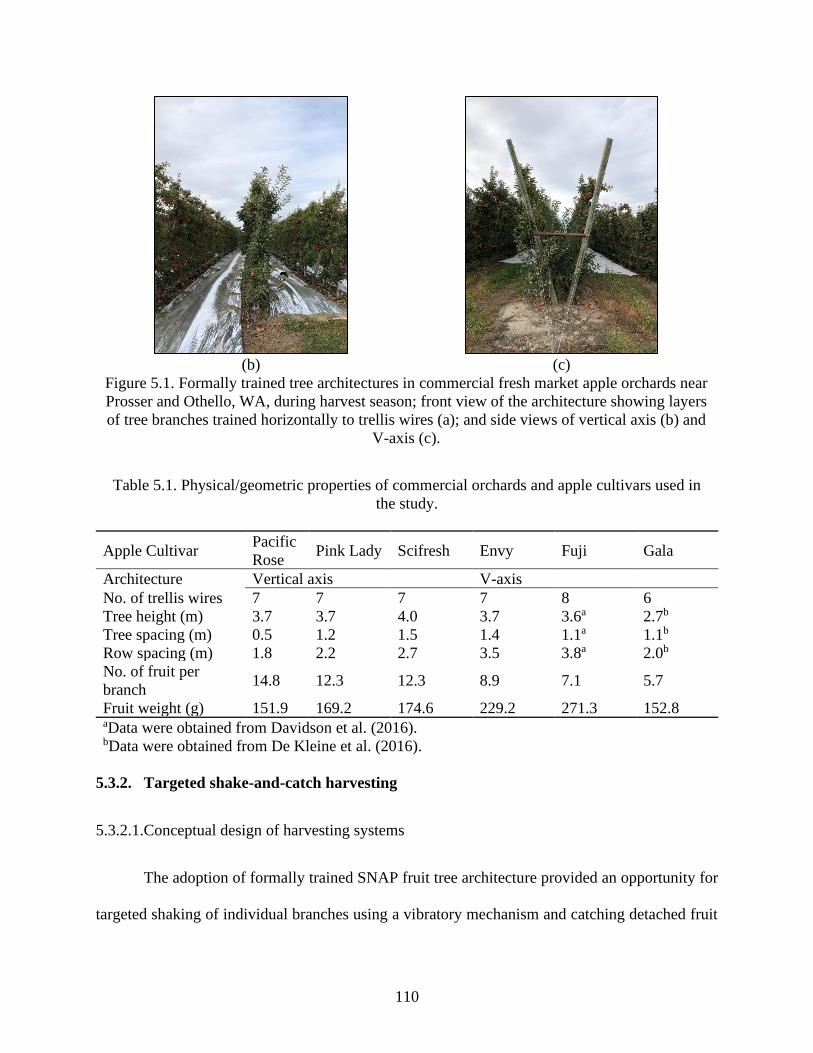
110
(b) (c)
Figure 5.1. Formally trained tree architectures in commercial fresh market apple orchards near
Prosser and Othello, WA, during harvest season; front view of the architecture showing layers
of tree branches trained horizontally to trellis wires (a); and side views of vertical axis (b) and
V-axis (c).
Table 5.1. Physical/geometric properties of commercial orchards and apple cultivars used in
the study.
Apple Cultivar Pacific
Rose Pink Lady Scifresh Envy Fuji Gala
Architecture Vertical axis V-axis
No. of trellis wires 7 7 7 7 8 6
Tree height (m) 3.7 3.7 4.0 3.7 3.6a 2.7b
Tree spacing (m) 0.5 1.2 1.5 1.4 1.1a 1.1b
Row spacing (m) 1.8 2.2 2.7 3.5 3.8a 2.0b
No. of fruit per
branch 14.8 12.3 12.3 8.9 7.1 5.7
Fruit weight (g) 151.9 169.2 174.6 229.2 271.3 152.8 aData were obtained from Davidson et al. (2016). bData were obtained from De Kleine et al. (2016).
5.3.2. Targeted shake-and-catch harvesting
5.3.2.1.Conceptual design of harvesting systems
The adoption of formally trained SNAP fruit tree architecture provided an opportunity for
targeted shaking of individual branches using a vibratory mechanism and catching detached fruit

111
right underneath those branches. Figure 5.2 shows the conceptual design of such a harvest system
in which the harvest process is confined within target branches. It used an approach of shaking
individual branches instead of impacting the entire tree trunk for improving the fruit removal
efficiency and reducing harvest-induced fruit damages (Karkee et al., 2018). Based on this concept,
three different shaking methods, i) continuous non-linear shaking (De Kleine and Karkee, 2015),
ii) continuous linear shaking (He et al., 2017), and iii) intermittent linear shaking mechanisms were
created and then tested using three harvesting systems, including a hand-held system (He et al.,
2017), a hydraulically driven system (He et al., 2019), and a semi-automated hydraulic harvest
system (developed in this stage of study on top of what has been investigated in early years) in
commercial orchards.
Figure 5.2. Conceptual design of a targeted shake-and-catch harvesting system in which the
harvest process is confined within target branches.
5.3.2.2.Vibratory shaking methods
5.3.2.2.1. Continuous non-linear reciprocating
In vibratory mechanical harvesting, the input kinetic energy must exceed the retention
energy at the abscission layer (i.e., between the pedicel and the fruiting branches/offshoot) to
successfully detach the fruit (Diener et al., 1965). Different shaking methods would lead to

112
different fruit removal/detachment results. De Kleine et al. (2016) proposed and evaluated a
concept of non-linear reciprocating shaking which used a dual motor actuator to drive two
eccentrically coupled shafts (Figure 5.3a–b) to form different shaking methods on a planar surface
through coordinately controlling the patterns of individual motors, including the direction
(clockwise or counter-clockwise). Three resulted trajectories of movement included linear (non-
reciprocating, which was considered as “non-linear” due to its movement trajectory was an arc
shape; Figure 5.3c, left), circle (Figure 5.3c, middle), and ‘figure-eight’ (Figure 5.3c, right), where
rhythms of 175, 200, and 250 rpm, and time of 5, 15, and 25 s were used, respectively, for each
movement pattern. The longer time used, the longer displacement of the shaking pattern was
expected, for example, the displacement of ‘figure-eight’ was longer than the linear (non-
reciprocating) pattern. All three patterns were included in this study and the averaged numbers
were used based on De Kleine and Karkee (2015). The vibration was applied at the middle location
between two adjacent trees. A flexible catcher (122 cm×91 cm) was used to catch the detached
fruit below the end-effector (De Kleine and Karkee, 2015).
(a) (b)

113
(c)
Figure 5.3. A pair of dual motor actuator (in which a vibrating shaft is eccentrically coupled)
based shaking mechanism (a) with the branch graspers (b) (De Kleine and Karkee, 2015); and
its actuation trajectories (left to right: linear (non-reciprocating), circle, and ‘figure-eight’) (c).
These trajectories represent the displacement of the end-effector on a planar surface (De
Kleine et al., 2016).
5.3.2.2.2. Continuous linear reciprocating
In this study, a crank-slider mechanism was used to convert the rotational motion (by
crank) to continuous linear reciprocating motion on the shaker. The resulted movement pattern
was a straight line and was different from “linear (non-reciprocating)” as discussed above (Figure
5.3c; left). As illustrated in Figure 5.4, this linear shaking device consisted of four core components
of a crank (with the fixed radius of 18 mm that could eventually provide an oscillatory linear stroke
of 36 mm), a pinned and connected metal rod, a metal slider constrained by a pair of bearing
blocks, and an electrical or hydraulic driver. It could continuously adjust shaking frequencies
between 15 and 25 Hz (below 25 Hz of shaking frequency, the tree branches will not be damaged
during the harvest based on preliminary results) whereas the time/duration of shaking ranged from
2–5 s, and the shaking location was selected to be at either the middle or base of the target branch
as needed in field tests (He et al., 2016).
114
Figure 5.4. A crank-slider mechanism used to convert the rotational motion induced by the
power unit to a linear, reciprocating motion of the vibrating end-effector/head.
Due to the aforementioned two strategies used completely different harvest platforms over
time, and thus the shaking power and other external factors such as machine configurations could
be completely different, the averaged numbers were used to make the overall comparisons (e.g.,
fruit removal efficiency was averaged from the three movement patterns in the continuous non-
linear shaking (De Kleine and Karkee, 2015); it was averaged from the different shaking
frequencies of 15, 20, and 25 Hz in the continuous linear shaking (He et al., 2016)).
5.3.2.2.3. Intermittent linear reciprocating
Another shaking method used in this study was intermittent, linear reciprocating shaking,
which is similar to continuous linear reciprocating vibration, but is interrupted and resumed
abruptly (within a second) back to the original condition. Fruit hanging on a tree branch could have
three modes of oscillation under the external vibratory excitation: swinging, tilting, and rotating
(Figure 5.5). This method was created based on an assumption that a sudden interruption in a
vibratory motion could potentially changes swinging mode of fruit motion (a comparatively less
effective mode for fruit removal) to tilting and/or rotating modes (more effective mode for fruit
removal) (Diener et al., 1965). In this study, a vibration frequency of 20 Hz was used, and the
shaking location used was either the middle or the base of target branches based on preliminary
results (He et al., 2019). The displacement of the motion was 36 mm. The operator made decisions
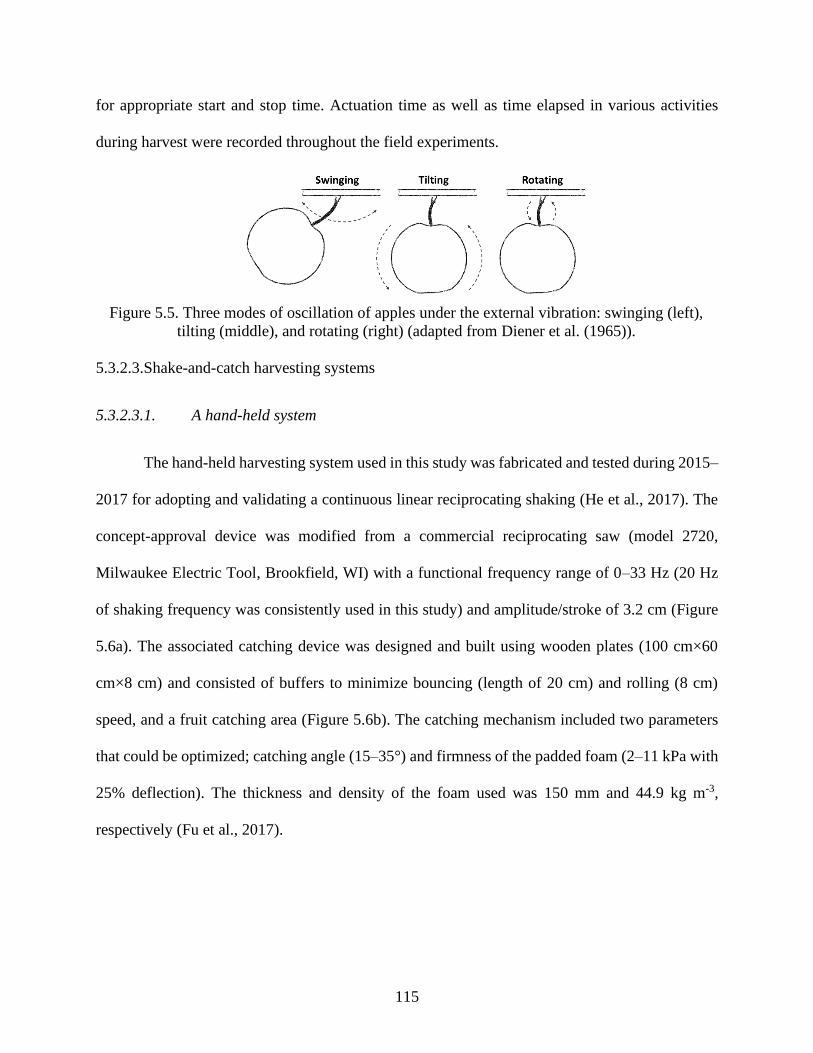
115
for appropriate start and stop time. Actuation time as well as time elapsed in various activities
during harvest were recorded throughout the field experiments.
Figure 5.5. Three modes of oscillation of apples under the external vibration: swinging (left),
tilting (middle), and rotating (right) (adapted from Diener et al. (1965)).
5.3.2.3.Shake-and-catch harvesting systems
5.3.2.3.1. A hand-held system
The hand-held harvesting system used in this study was fabricated and tested during 2015–
2017 for adopting and validating a continuous linear reciprocating shaking (He et al., 2017). The
concept-approval device was modified from a commercial reciprocating saw (model 2720,
Milwaukee Electric Tool, Brookfield, WI) with a functional frequency range of 0–33 Hz (20 Hz
of shaking frequency was consistently used in this study) and amplitude/stroke of 3.2 cm (Figure
5.6a). The associated catching device was designed and built using wooden plates (100 cm×60
cm×8 cm) and consisted of buffers to minimize bouncing (length of 20 cm) and rolling (8 cm)
speed, and a fruit catching area (Figure 5.6b). The catching mechanism included two parameters
that could be optimized; catching angle (15–35°) and firmness of the padded foam (2–11 kPa with
25% deflection). The thickness and density of the foam used was 150 mm and 44.9 kg m-3,
respectively (Fu et al., 2017).
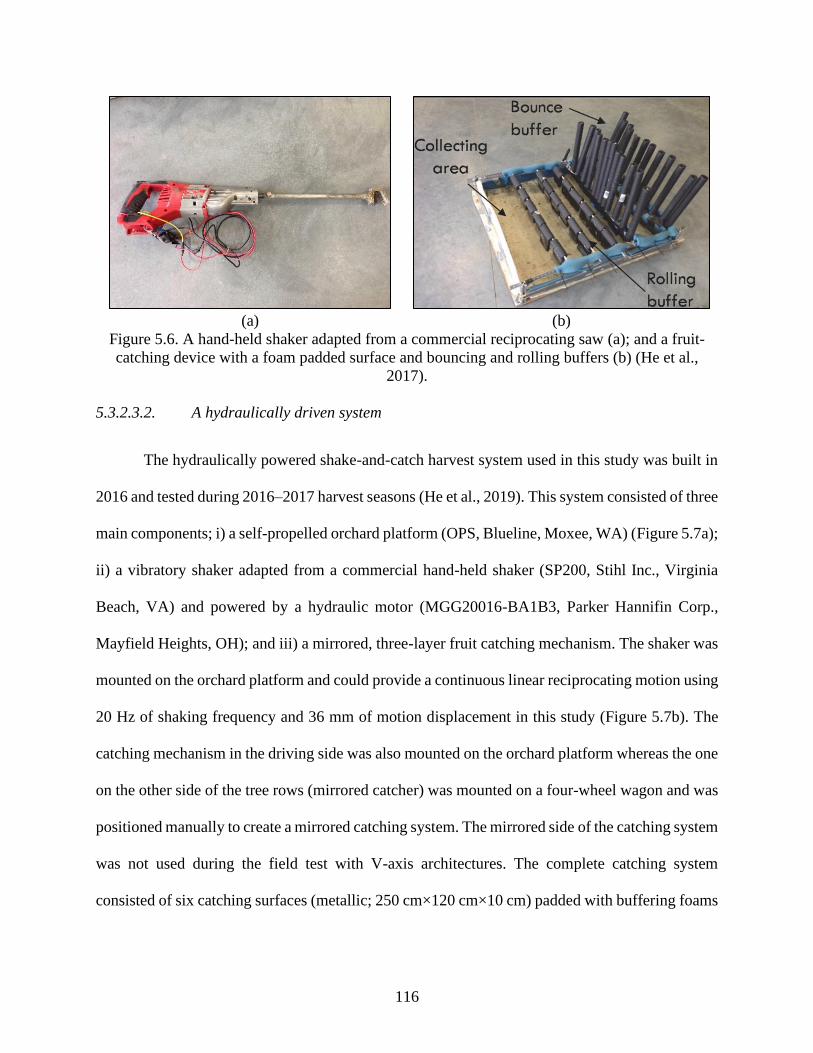
116
(a) (b)
Figure 5.6. A hand-held shaker adapted from a commercial reciprocating saw (a); and a fruit-
catching device with a foam padded surface and bouncing and rolling buffers (b) (He et al.,
2017).
5.3.2.3.2. A hydraulically driven system
The hydraulically powered shake-and-catch harvest system used in this study was built in
2016 and tested during 2016–2017 harvest seasons (He et al., 2019). This system consisted of three
main components; i) a self-propelled orchard platform (OPS, Blueline, Moxee, WA) (Figure 5.7a);
ii) a vibratory shaker adapted from a commercial hand-held shaker (SP200, Stihl Inc., Virginia
Beach, VA) and powered by a hydraulic motor (MGG20016-BA1B3, Parker Hannifin Corp.,
Mayfield Heights, OH); and iii) a mirrored, three-layer fruit catching mechanism. The shaker was
mounted on the orchard platform and could provide a continuous linear reciprocating motion using
20 Hz of shaking frequency and 36 mm of motion displacement in this study (Figure 5.7b). The
catching mechanism in the driving side was also mounted on the orchard platform whereas the one
on the other side of the tree rows (mirrored catcher) was mounted on a four-wheel wagon and was
positioned manually to create a mirrored catching system. The mirrored side of the catching system
was not used during the field test with V-axis architectures. The complete catching system
consisted of six catching surfaces (metallic; 250 cm×120 cm×10 cm) padded with buffering foams

117
(Figure 5.7c). Tilt angle of each of the catching surfaces was adjustable. The integrated shaking
and catching system on the driving side could be mechanically moved in and out of the canopy
together.
(a) (b)
(c)
Figure 5.7. A hydraulically driven shake-and-catch harvesting platform (a); a hydraulic shaker
used in the system (b), and mirrored (two sided) operation of the multi-layer fruit catching
mechanism (c).
5.3.2.4.A semi-automated harvest system
As afore introduced, different shaking methods and devices have been developed and tested
over time led us to gain certain understanding for optimizing the system. Incorporating the
knowledge investigated in those experiments, a semi-automated shake-and-catch harvest system
118
was designed and fabricated (Figure 5.8a; He et al., 2019). Most of the mechanical configurations
remained the same except an actuation system that was added to the platform. The newly added
actuation system included six solenoid, directional control valves (model RPE3-06, Argo-Hytos
S.R.O., Zug, Switzerland) and two four-station parallel flow aluminum manifolds (model D03,
Daman Products Company Inc., Mishawaka, IN). With this improvement, the new configuration
of this redesigned system made it easier to place the shaker and catcher into the canopy as it
allowed convenient movement of catching surfaces up and down. In addition, the actuation system
allowed the shaker to move up-and-down and in-and-out the canopies, and actuation of vibratory
motion (with intermittent linear shaking). Finally, the actuation system was used to move entire
machine in and out of the canopy using control switches (Figure 5.8b). The number of catchers on
driving side was reduced to two from three due to the concerns about the weight of the frame and
because the two-layer catching was sufficient to evaluate the performance of the machine. The
fruit catching mechanism was also improved by adding three groups of rubber rods (diameter of
19 mm, tensile strength of 1,050 psi, and durometer of 75A) on each layer (Figure 5.8c) that
allowed the catchers to penetrate past the tree trunk (Figure 5.8d). With this redesign, it was
supposed to improve fruit catching efficiency as the gap between two sides of mirrored catching
system would be minimized. This semi-automated system was then evaluated in a commercial
orchard in normal harvesting process.
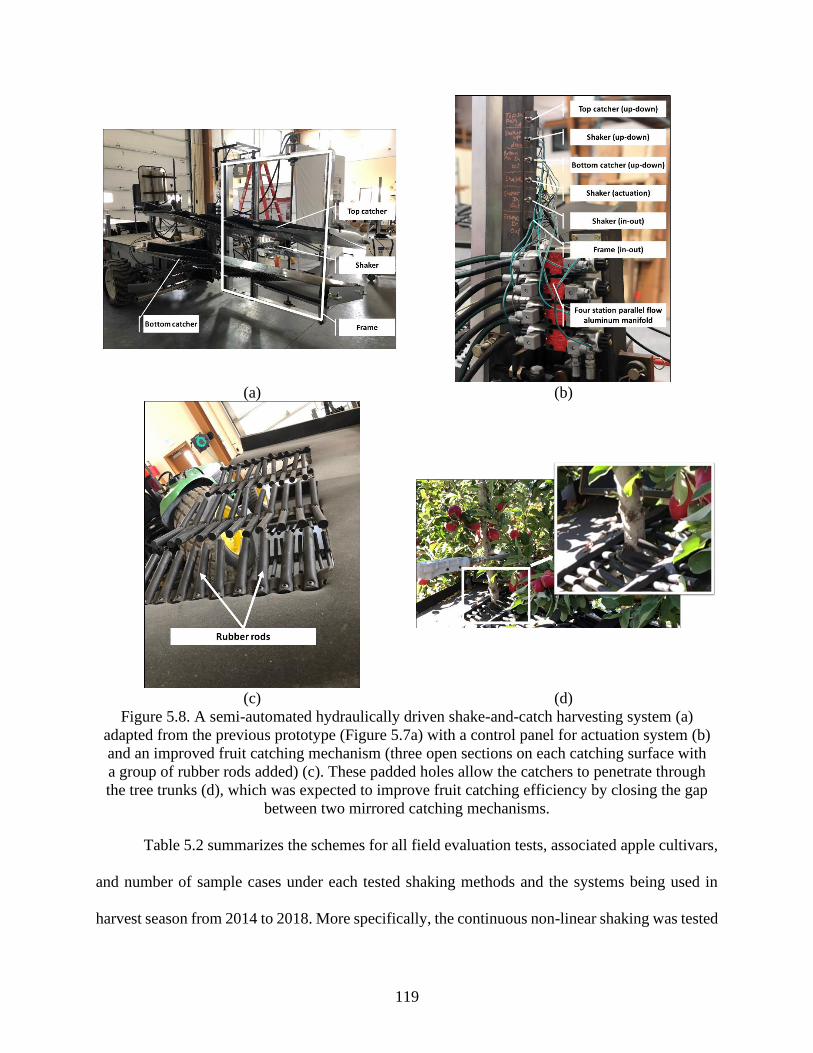
119
(a) (b)
(c) (d)
Figure 5.8. A semi-automated hydraulically driven shake-and-catch harvesting system (a)
adapted from the previous prototype (Figure 5.7a) with a control panel for actuation system (b)
and an improved fruit catching mechanism (three open sections on each catching surface with
a group of rubber rods added) (c). These padded holes allow the catchers to penetrate through
the tree trunks (d), which was expected to improve fruit catching efficiency by closing the gap
between two mirrored catching mechanisms.
Table 5.2 summarizes the schemes for all field evaluation tests, associated apple cultivars,
and number of sample cases under each tested shaking methods and the systems being used in
harvest season from 2014 to 2018. More specifically, the continuous non-linear shaking was tested

120
on ‘Gala’ cultivar using continuous linear shaking with 216 branches being tested in 2014. For the
season of 2015–2017, six cultivars of a total 911 branches being shaken harvested using continuous
linear shaking. In 2018, the intermittent linear shaking was tested on ‘Scifresh’ with 105 branches.
The hand-held system was tested on all six cultivars in 2015 with a total of 280 branches whereas
the hydraulic system was tested with four different cultivars during 2016–2017 harvest seasons
involving 631 target branches. The semi-automated hydraulic harvest system was tested on
‘Scifresh’ in 2018 with 105 branches in total. As shown in Table 5.2, certain shaking methods and
harvest systems were a part of the same experiments, for example, the same 105 branches were
tested in 2018 for both intermittent linear shaking and semi-automated hydraulic system.
Altogether, 1,232 branches were used in the field tests conducted in commercial orchards and
12,432 apples were harvested and manually examined using the performance measures including
fruit harvesting efficiency, fruit quality, and time efficiency. Since different apple cultivars may
respond differently to the vibratory signals, three shaking methods were evaluated over years with
the same cultivars. Three harvesting systems (including the semi-automated hydraulic system)
were compared for harvesting using one specific apple cultivar (i.e., ‘Scifresh’).
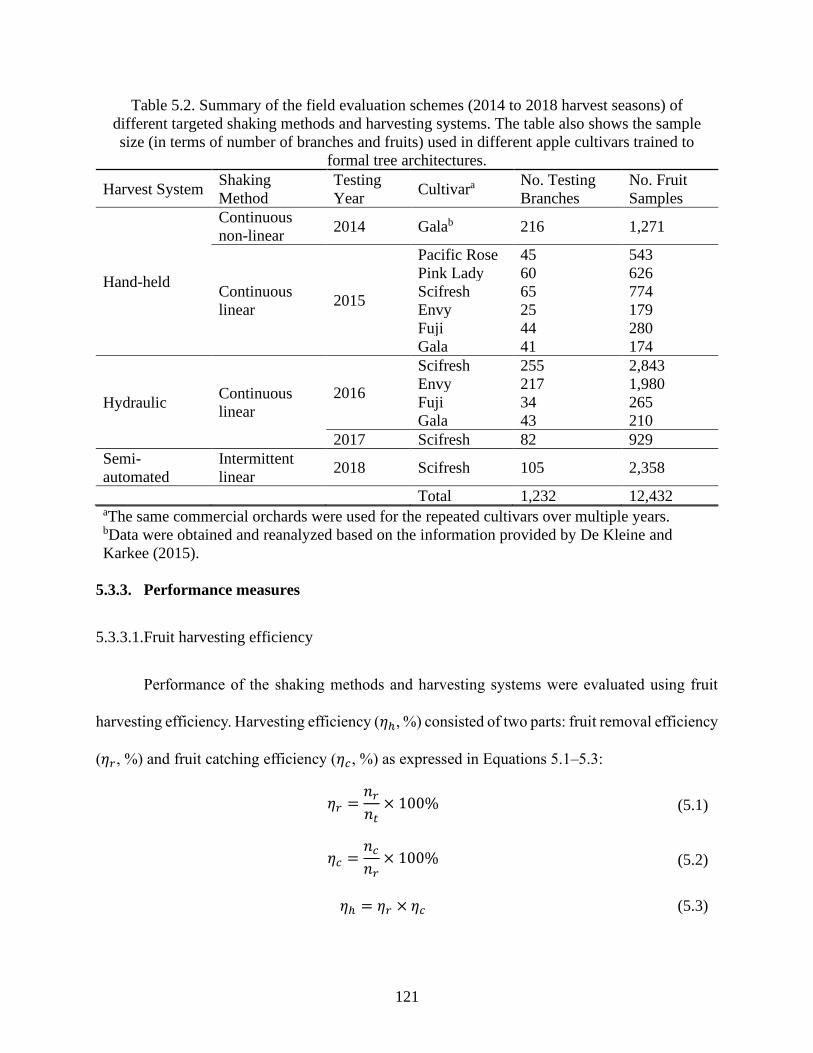
121
Table 5.2. Summary of the field evaluation schemes (2014 to 2018 harvest seasons) of
different targeted shaking methods and harvesting systems. The table also shows the sample
size (in terms of number of branches and fruits) used in different apple cultivars trained to
formal tree architectures.
Harvest System Shaking
Method
Testing
Year Cultivara
No. Testing
Branches
No. Fruit
Samples
Hand-held
Continuous
non-linear 2014 Galab 216 1,271
Continuous
linear 2015
Pacific Rose 45 543
Pink Lady 60 626
Scifresh 65 774
Envy 25 179
Fuji 44 280
Gala 41 174
Hydraulic Continuous
linear
2016
Scifresh 255 2,843
Envy 217 1,980
Fuji 34 265
Gala 43 210
2017 Scifresh 82 929
Semi-
automated
Intermittent
linear 2018 Scifresh 105 2,358
Total 1,232 12,432 aThe same commercial orchards were used for the repeated cultivars over multiple years. bData were obtained and reanalyzed based on the information provided by De Kleine and
Karkee (2015).
5.3.3. Performance measures
5.3.3.1.Fruit harvesting efficiency
Performance of the shaking methods and harvesting systems were evaluated using fruit
harvesting efficiency. Harvesting efficiency (𝜂ℎ, %) consisted of two parts: fruit removal efficiency
(𝜂𝑟, %) and fruit catching efficiency (𝜂𝑐, %) as expressed in Equations 5.1–5.3:
𝜂𝑟 =𝑛𝑟𝑛𝑡
× 100% (5.1)
𝜂𝑐 =𝑛𝑐𝑛𝑟
× 100% (5.2)
𝜂ℎ = 𝜂𝑟 × 𝜂𝑐 (5.3)

122
where, 𝑛𝑟 represents the number of fruits that were detached/removed from the target branch, 𝑛𝑡
represents the total number of fruits on the target branch before shaking, and 𝑛𝑐 represents the
number of removed fruits that were successfully collected by the catching mechanism. Data were
statistically analyzed using one-way analysis of variance (ANOVA) followed by Fisher’s least
significant difference (LSD) considering a 0.05 confidence level on 𝜂𝑟, 𝜂𝑐, and 𝜂ℎ.
5.3.3.2.Fruit quality
Fruit quality measure was also used to analyze and compare the fruit damage conditions
achieved by each shaking method and harvesting system in all field evaluations. Quality analysis
was based on the standard fruit quality grades for the United States fresh market apples (USDA,
2002), where the extra fancy (𝑝𝑒, %) and fancy (𝑝𝑓, %) grades are classified into marketable fruit
(𝑝𝑚, %), while the downgrade (𝑝𝑑, %) is considered not marketable (Equations 5.4–5.7). Per the
USDA standards, classification decisions were made based upon the manual assessment of the
specified types of injuries (i.e., bruises, cuts, and punctures) and the size/diameter for bruising
injury (Table 5.3). For example, fruits were directly classified into downgrade whenever a cut or
a puncture was present on a fruit surface. The diameter of bruising (if any) was measured using a
digital caliper only when no cut or puncture was present.
𝑝𝑒 =𝑛𝑒𝑛𝑐
× 100% (5.4)
𝑝𝑓 =𝑛𝑓
𝑛𝑐× 100% (5.5)
𝑝𝑑 =𝑛𝑑𝑛𝑐
× 100% (5.6)
𝑝𝑚 = 𝑝𝑒 + 𝑝𝑓 (5.7)
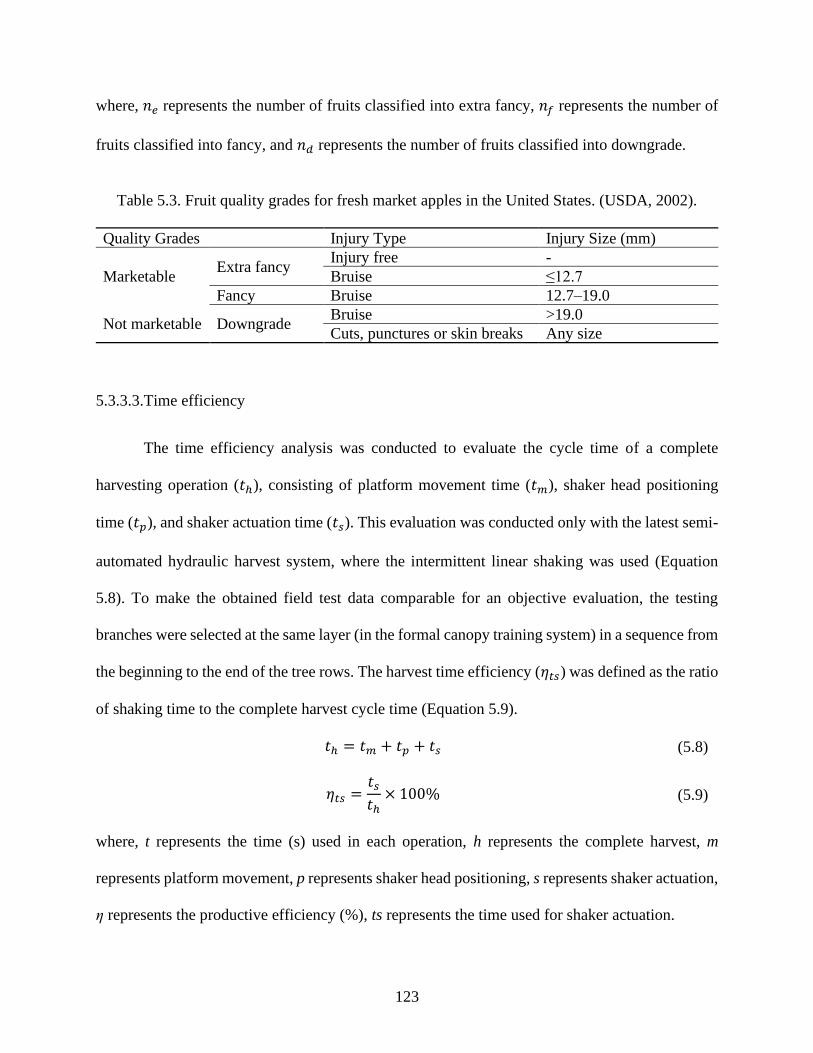
123
where, 𝑛𝑒 represents the number of fruits classified into extra fancy, 𝑛𝑓 represents the number of
fruits classified into fancy, and 𝑛𝑑 represents the number of fruits classified into downgrade.
Table 5.3. Fruit quality grades for fresh market apples in the United States. (USDA, 2002).
Quality Grades Injury Type Injury Size (mm)
Marketable Extra fancy
Injury free -
Bruise ≤12.7
Fancy Bruise 12.7–19.0
Not marketable Downgrade Bruise >19.0
Cuts, punctures or skin breaks Any size
5.3.3.3.Time efficiency
The time efficiency analysis was conducted to evaluate the cycle time of a complete
harvesting operation (𝑡ℎ), consisting of platform movement time (𝑡𝑚), shaker head positioning
time (𝑡𝑝), and shaker actuation time (𝑡𝑠). This evaluation was conducted only with the latest semi-
automated hydraulic harvest system, where the intermittent linear shaking was used (Equation
5.8). To make the obtained field test data comparable for an objective evaluation, the testing
branches were selected at the same layer (in the formal canopy training system) in a sequence from
the beginning to the end of the tree rows. The harvest time efficiency (𝜂𝑡𝑠) was defined as the ratio
of shaking time to the complete harvest cycle time (Equation 5.9).
𝑡ℎ = 𝑡𝑚 + 𝑡𝑝 + 𝑡𝑠 (5.8)
𝜂𝑡𝑠 =𝑡𝑠𝑡ℎ× 100% (5.9)
where, t represents the time (s) used in each operation, h represents the complete harvest, m
represents platform movement, p represents shaker head positioning, s represents shaker actuation,
ƞ represents the productive efficiency (%), ts represents the time used for shaker actuation.
124
5.4. Results and Discussion
5.4.1. Effect of apple cultivar
Davidson et al. (2016) have pointed out that apple cultivar could affect the efficiency of
harvesting based on their studies. To study such effects, this research assesses the performance of
different shaking methods on different cultivars, including ‘Pacific Rose’, ‘Pink Lady’, and
‘Scifresh’ (in vertical architecture), ‘Envy’, ‘Fuji’, and ‘Gala’ (in V-architecture). Obtained results
did reveal some noticeable differences in fruit removal efficiency from those six evaluated
cultivars: the highest removal efficiencies were found from ‘Scifresh’ and ‘Pink Lady’ cultivars
(85.0% ±10.7% and 84.9% ±14.0%, respectively) and the lowest was found from ‘Gala’ cultivar
(62.9% ±25.3%, as shown in Figure 5.9). A statistical analysis showed that the difference was
significant between ‘Scifresh’ or ‘Pink Lady’ and ‘Gala’. Further analyses based on the data
obtained from the multiple year field tests found that the cultivars of ‘Scifresh’ and ‘Pink Lady’
were more machine-friendly in harvesting as high percentage of fruits could be removed from the
tree under only a few seconds of shaking. The ‘Gala’, on the other hand, was found the most
difficult to be removed from the tree as the fruits often exhibited a swinging motion (as illustrated
in Figure 5.5) under shaking. The other tested cultivars, i.e., ‘Fuji’, ‘Envy’, and ‘Pacific Rose’,
presented a removability some degree in between the easier and difficult cultivars, ranged between
73.0% and 80.0% (±18.2–31.5%). This study confirmed that the fruit removal efficiency is cultivar
dependent, caused very likely by genetic differences on characteristics of abscission layer of fruits
(Whiting and Perry, 2017). Moreover, this study had also noticed a positive correlation between
branch fruit load and fruit removability as it was observed that the ‘Pink Lady’ and ‘Scifresh’
cultivars had a higher branch fruit load (12.3 fruits, per branch, as provided in Table 5.1) than that

125
of ‘Gala’ (5.7 fruit per branch), but with an exception of ‘Pacific Rose’ had the highest branch fruit
load but the second lowest removability. More studies on this relationship would be needed before
drawing a scientific conclusion.
Figure 5.9. Fruit removal efficiency (𝜂𝑟) and percentage of marketable fruit (extra fancy plus
fancy; 𝑝𝑒 + 𝑝𝑓) of six different apple cultivars under the same shaking method (continuous
linear reciprocating harvest); different alphabetical letters represent for significant differences.
Figure 5.9 also presents the difference in the percentage of marketable fruit among those
tested cultivars based on the multiple year experiments. As presented in Table 5.4, the highest
percentage of marketable fruits were harvested from ‘Pink Lady’ and ‘Scifresh’ cultivars, counting
for 91.9% and 88.2%, respectively, followed by ‘Pacific Rose’ and ‘Gala’ (86.0% and 81.4%).
‘Fuji’ and ‘Envy’ exhibited higher rates of damage with only 77.5% and 72.3% of marketable fruit
quality. As both ‘Fuji’ and ‘Envy’ have larger fruit (271.3 g and 229.2 g on average) comparing
to the other cultivars, it could be one of the attributors to this higher bruised/damaged rate.
Nevertheless, this result may indicate that different catching methods might be needed for different
cultivars for reducing fruit damage rate. More detailed results including standard deviations (s.d.)
can be found in Table 5.4.
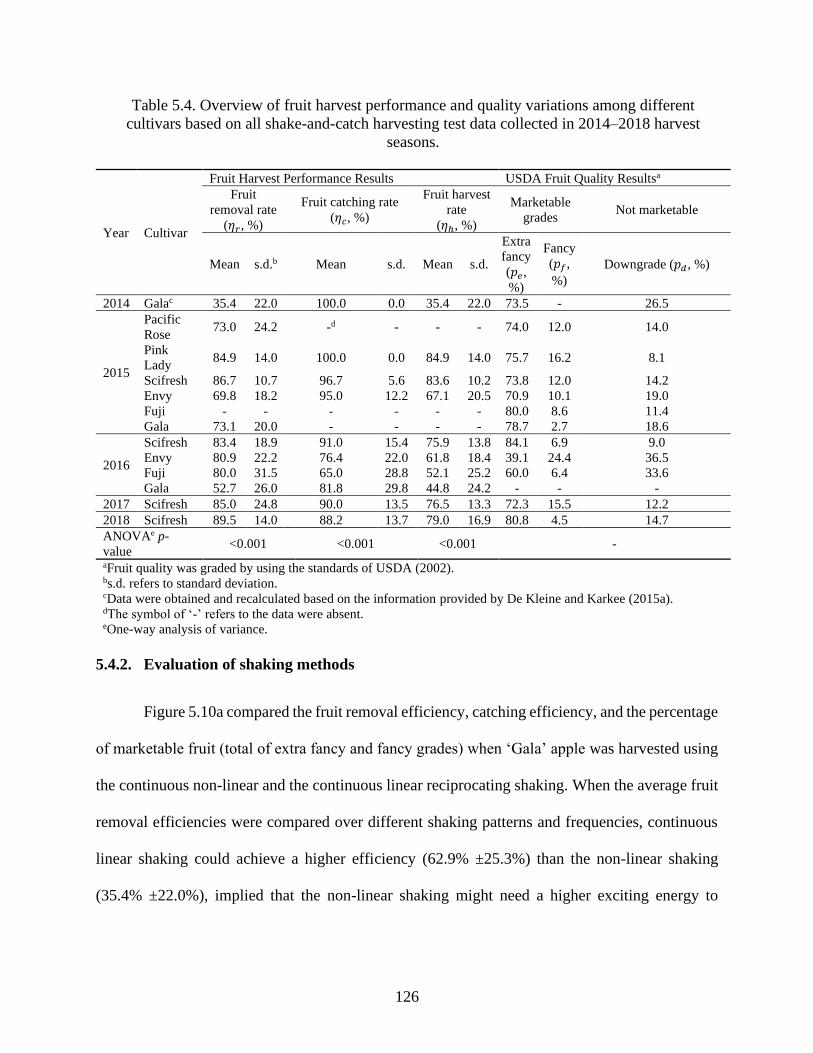
126
Table 5.4. Overview of fruit harvest performance and quality variations among different
cultivars based on all shake-and-catch harvesting test data collected in 2014–2018 harvest
seasons.
Year Cultivar
Fruit Harvest Performance Results USDA Fruit Quality Resultsa
Fruit
removal rate
(𝜂𝑟, %)
Fruit catching rate
(𝜂𝑐, %)
Fruit harvest
rate
(𝜂ℎ, %)
Marketable
grades Not marketable
Mean s.d.b Mean s.d. Mean s.d.
Extra
fancy
(𝑝𝑒,
%)
Fancy
(𝑝𝑓,
%)
Downgrade (𝑝𝑑, %)
2014 Galac 35.4 22.0 100.0 0.0 35.4 22.0 73.5 - 26.5
2015
Pacific
Rose 73.0 24.2 -d - - - 74.0 12.0 14.0
Pink
Lady 84.9 14.0 100.0 0.0 84.9 14.0 75.7 16.2 8.1
Scifresh 86.7 10.7 96.7 5.6 83.6 10.2 73.8 12.0 14.2
Envy 69.8 18.2 95.0 12.2 67.1 20.5 70.9 10.1 19.0
Fuji - - - - - - 80.0 8.6 11.4
Gala 73.1 20.0 - - - - 78.7 2.7 18.6
2016
Scifresh 83.4 18.9 91.0 15.4 75.9 13.8 84.1 6.9 9.0
Envy 80.9 22.2 76.4 22.0 61.8 18.4 39.1 24.4 36.5
Fuji 80.0 31.5 65.0 28.8 52.1 25.2 60.0 6.4 33.6
Gala 52.7 26.0 81.8 29.8 44.8 24.2 - - -
2017 Scifresh 85.0 24.8 90.0 13.5 76.5 13.3 72.3 15.5 12.2
2018 Scifresh 89.5 14.0 88.2 13.7 79.0 16.9 80.8 4.5 14.7
ANOVAe p-
value <0.001 <0.001 <0.001 -
aFruit quality was graded by using the standards of USDA (2002). bs.d. refers to standard deviation. cData were obtained and recalculated based on the information provided by De Kleine and Karkee (2015a). dThe symbol of ‘-’ refers to the data were absent. eOne-way analysis of variance.
5.4.2. Evaluation of shaking methods
Figure 5.10a compared the fruit removal efficiency, catching efficiency, and the percentage
of marketable fruit (total of extra fancy and fancy grades) when ‘Gala’ apple was harvested using
the continuous non-linear and the continuous linear reciprocating shaking. When the average fruit
removal efficiencies were compared over different shaking patterns and frequencies, continuous
linear shaking could achieve a higher efficiency (62.9% ±25.3%) than the non-linear shaking
(35.4% ±22.0%), implied that the non-linear shaking might need a higher exciting energy to
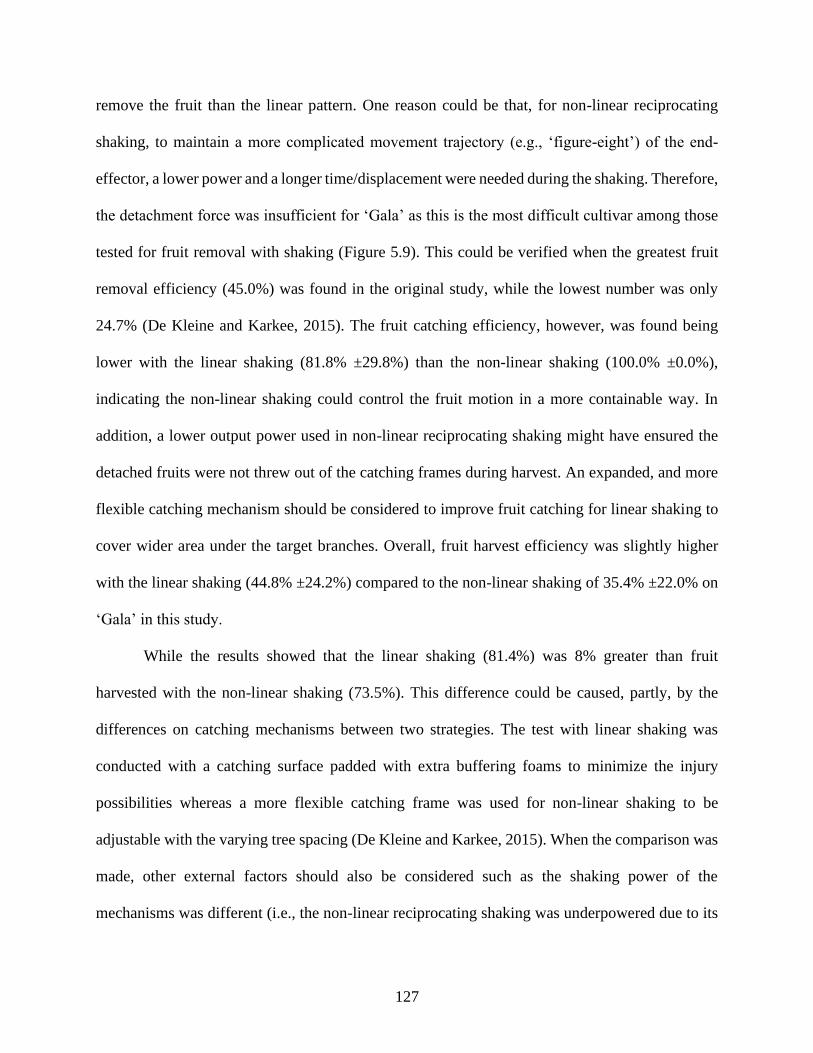
127
remove the fruit than the linear pattern. One reason could be that, for non-linear reciprocating
shaking, to maintain a more complicated movement trajectory (e.g., ‘figure-eight’) of the end-
effector, a lower power and a longer time/displacement were needed during the shaking. Therefore,
the detachment force was insufficient for ‘Gala’ as this is the most difficult cultivar among those
tested for fruit removal with shaking (Figure 5.9). This could be verified when the greatest fruit
removal efficiency (45.0%) was found in the original study, while the lowest number was only
24.7% (De Kleine and Karkee, 2015). The fruit catching efficiency, however, was found being
lower with the linear shaking (81.8% ±29.8%) than the non-linear shaking (100.0% ±0.0%),
indicating the non-linear shaking could control the fruit motion in a more containable way. In
addition, a lower output power used in non-linear reciprocating shaking might have ensured the
detached fruits were not threw out of the catching frames during harvest. An expanded, and more
flexible catching mechanism should be considered to improve fruit catching for linear shaking to
cover wider area under the target branches. Overall, fruit harvest efficiency was slightly higher
with the linear shaking (44.8% ±24.2%) compared to the non-linear shaking of 35.4% ±22.0% on
‘Gala’ in this study.
While the results showed that the linear shaking (81.4%) was 8% greater than fruit
harvested with the non-linear shaking (73.5%). This difference could be caused, partly, by the
differences on catching mechanisms between two strategies. The test with linear shaking was
conducted with a catching surface padded with extra buffering foams to minimize the injury
possibilities whereas a more flexible catching frame was used for non-linear shaking to be
adjustable with the varying tree spacing (De Kleine and Karkee, 2015). When the comparison was
made, other external factors should also be considered such as the shaking power of the
mechanisms was different (i.e., the non-linear reciprocating shaking was underpowered due to its
128
more complicated movement trajectories). The obtained results should be carefully referred
because the mechanisms and platforms were completely different between non-linear and linear
reciprocating strategies.
(a) (b)
Figure 5.10. The comparison of fruit removal efficiency (𝜂𝑟), catching efficiency (𝜂𝑐), and the
rate of marketable fruit (extra fancy plus fancy; 𝑝𝑒 + 𝑝𝑓) resulted from continuous non-linear
shaking and continuous linear shaking on ‘Gala’ cultivar (a), and from continuous linear
shaking and intermittent linear shaking on ‘Scifresh’ cultivar (b) (statistical analyses were
conducted between each two groups under the same performance measures; different
alphabetical letters represent for significant differences).
Other comparison between the continuous and intermittent linear shaking performance in
harvesting ‘Scifresh’ apple revealed that the intermittent shaking could reach a higher removal
efficiency than the continuous shaking (89.5% ±14.0% vs. 85.0% ±17.4%, about 5% higher as
shown in Figure 5.10b). This could be explained that the intermittent shaking would create sudden
interruptions in fruit motion inducing some tilting and/or rotating to the swinging motion which
could result in a larger separation force on the abscission layer of fruit (Diener et al., 1965; Whiting
and Perry, 2017). The fruit removal efficiency reached the maximum (i.e., no more fruit removed
with further increment of shaking duration) after a few seconds with the continuous shaking,
therefore, increasing the duration would not make any difference. However, intermittent shaking
129
was found to have a slightly lower fruit catching efficiency (88.2% ±13.7%) compared to
continuous shaking (92.6% ±13.1%) attributing to the sudden interruptions of fruit motion. Such
catching efficiency resulted in an almost the same overall harvest efficiency (79% ±12.4%–16.9%)
between the two shaking methods using current testing systems. Results obtained from both
experiments afore discussed could provide some essential information for future design of shake-
and-catch harvest systems for apples. Lastly, fruit quality grade was also compared where the
percentage of marketable fruit with intermittent linear shaking (85.3%) was found to be slightly
lower than that with continuous linear shaking (88.2%). Although the difference was small (~3%),
a longer actuating vibration does expose fruits to a higher chance of fruit-fruit and fruit-branch
collisions (Zhang et al., 2018b).
One of the limitations of this study is that it would be difficult to directly compare the
continuous non-linear and intermittent linear shaking methods because the data were collected
with different apple cultivars (‘Gala’ and ‘Scifresh’) and it was shown already that the harvest
results would be influenced by the cultivars (Figure 5.9 and Table 5.4). Finally, all the comparisons
should be carefully carried out due to different harvest machine configurations were used for the
three strategies.
5.4.3. Evaluation of harvesting systems
This study evaluated three integrated shake-and-catch harvesting systems, i.e., a hand-held
system, a hydraulic system, and a semi-automated hydraulic system, for comparing their overall
performances. As could be expected, the semi-automated system achieved the highest fruit
removal efficiency of 89.5% ±14.0%, followed by the hand-held system (86.7% ±10.7%) and the
hydraulic system (84.2% ±19.6%) while harvesting ‘Scifresh’ apple (Figure 5.11). The movement
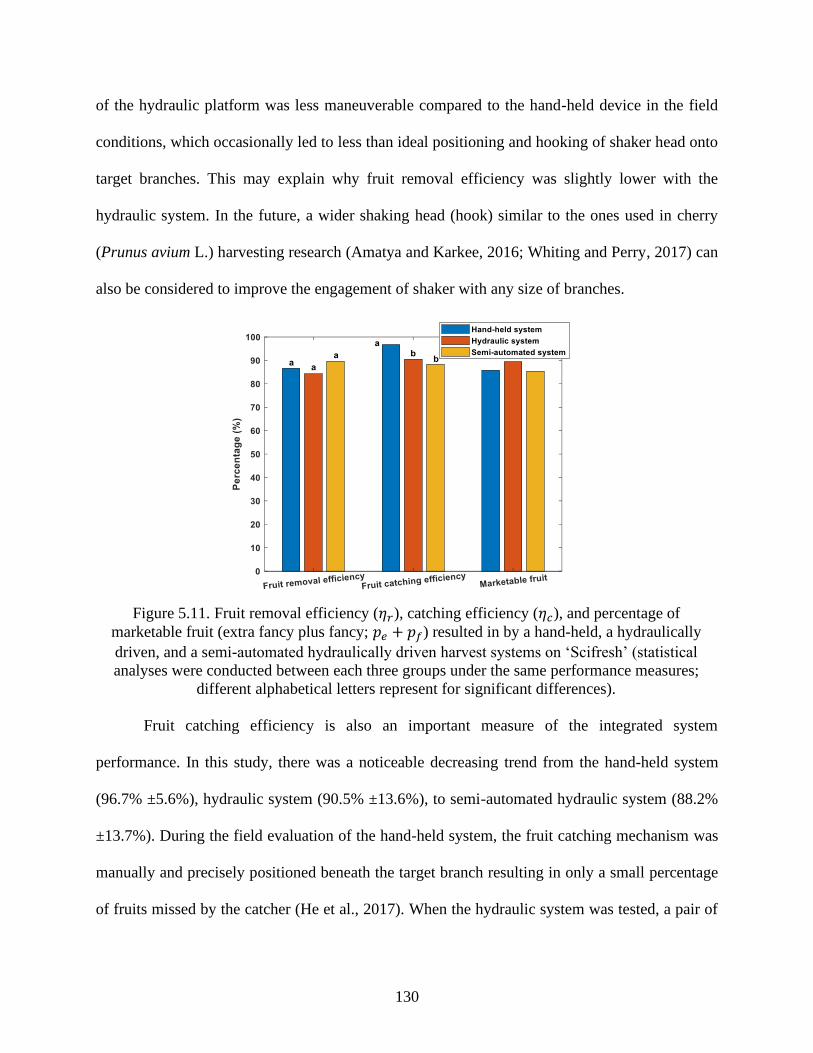
130
of the hydraulic platform was less maneuverable compared to the hand-held device in the field
conditions, which occasionally led to less than ideal positioning and hooking of shaker head onto
target branches. This may explain why fruit removal efficiency was slightly lower with the
hydraulic system. In the future, a wider shaking head (hook) similar to the ones used in cherry
(Prunus avium L.) harvesting research (Amatya and Karkee, 2016; Whiting and Perry, 2017) can
also be considered to improve the engagement of shaker with any size of branches.
Figure 5.11. Fruit removal efficiency (𝜂𝑟), catching efficiency (𝜂𝑐), and percentage of
marketable fruit (extra fancy plus fancy; 𝑝𝑒 + 𝑝𝑓) resulted in by a hand-held, a hydraulically
driven, and a semi-automated hydraulically driven harvest systems on ‘Scifresh’ (statistical
analyses were conducted between each three groups under the same performance measures;
different alphabetical letters represent for significant differences).
Fruit catching efficiency is also an important measure of the integrated system
performance. In this study, there was a noticeable decreasing trend from the hand-held system
(96.7% ±5.6%), hydraulic system (90.5% ±13.6%), to semi-automated hydraulic system (88.2%
±13.7%). During the field evaluation of the hand-held system, the fruit catching mechanism was
manually and precisely positioned beneath the target branch resulting in only a small percentage
of fruits missed by the catcher (He et al., 2017). When the hydraulic system was tested, a pair of
131
much larger and mirrored multilayer catching mechanisms were inserted into the canopy from both
sides to catch the fruits. It was found that some fruits were falling through the gap between two
mirrored catchers. To improve fruit catching efficiency by closing the gap, three groups of rubber
rods were added to allow the catchers penetrating tree trunk on the semi-automated system (Figure
5.8c). However, the issue was not fully addressed due to the high firmness of the rods used in the
openings. Moreover, fruit from trees close to trellis wire posts could not be harvested because the
tree spacing would be greatly narrowed down. All those factors contributed to the hand-held
system which could reach a higher the overall harvesting efficiency (83.6% ±10.2%) than the semi-
automated system (79.0% ±16.9%) and the hydraulic system (76.2% ±13.3%). The quality of
harvested fruits (extra fancy and fancy) were similar for all harvesting systems, ranged between
85.3%–89.4% (Figure 5.11). The lowest percentage of marketable fruit from the semi-automated
system (85.3%) could be caused by the high firmness rubber rods used in the catching surface
which could make fruit dropping on rods being bruised or punctured.
To summarize, in terms of fruit harvesting efficiency, the hand-held harvesting system
performed the best among the three systems compared, mostly due to its high fruit catching
efficiency. The semi-automated harvest system and the hydraulic harvest system were similar
overall. The hydraulic system was found to be the best in terms of fruit quality. Further
improvements of the catching mechanism for both hydraulic and semi-automated systems could
help having more fruits suitable for fresh market.
5.4.4. Time efficiency of semi-automated harvest system
As a potential future harvesting technique, the harvest productivity was also evaluated
based on the latest semi-automated harvest system in commercial orchards (on ‘Scifresh’ cultivar).
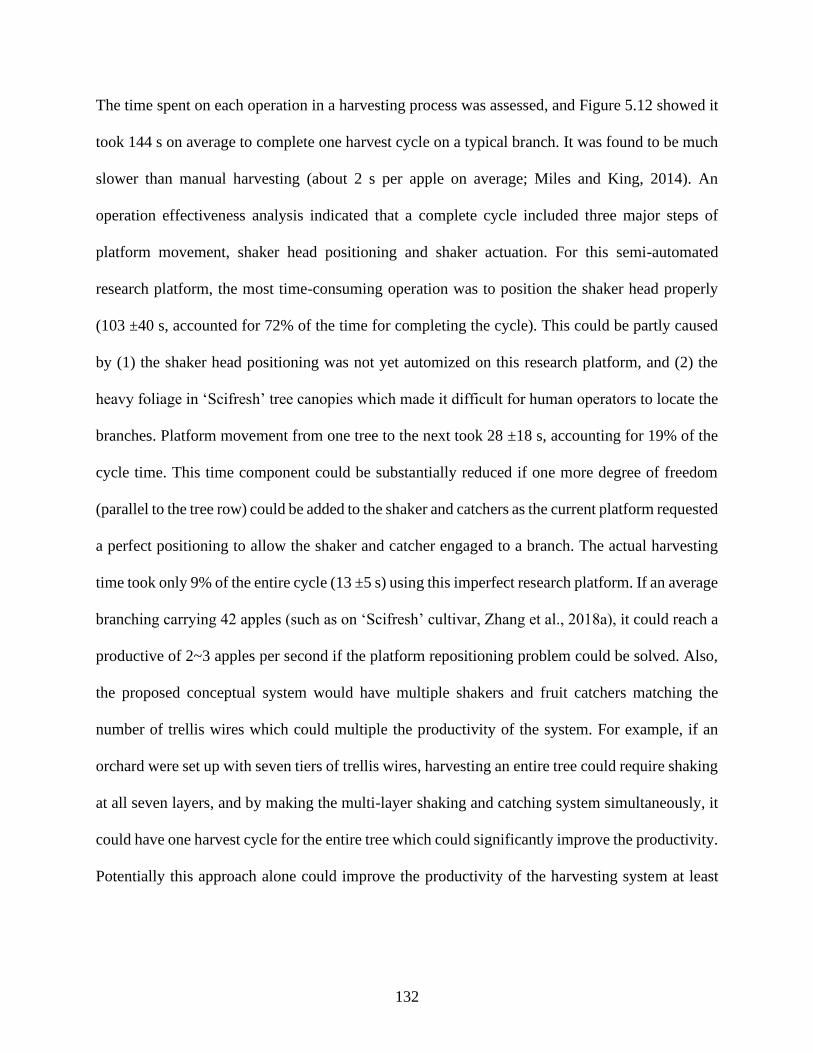
132
The time spent on each operation in a harvesting process was assessed, and Figure 5.12 showed it
took 144 s on average to complete one harvest cycle on a typical branch. It was found to be much
slower than manual harvesting (about 2 s per apple on average; Miles and King, 2014). An
operation effectiveness analysis indicated that a complete cycle included three major steps of
platform movement, shaker head positioning and shaker actuation. For this semi-automated
research platform, the most time-consuming operation was to position the shaker head properly
(103 ±40 s, accounted for 72% of the time for completing the cycle). This could be partly caused
by (1) the shaker head positioning was not yet automized on this research platform, and (2) the
heavy foliage in ‘Scifresh’ tree canopies which made it difficult for human operators to locate the
branches. Platform movement from one tree to the next took 28 ±18 s, accounting for 19% of the
cycle time. This time component could be substantially reduced if one more degree of freedom
(parallel to the tree row) could be added to the shaker and catchers as the current platform requested
a perfect positioning to allow the shaker and catcher engaged to a branch. The actual harvesting
time took only 9% of the entire cycle (13 ±5 s) using this imperfect research platform. If an average
branching carrying 42 apples (such as on ‘Scifresh’ cultivar, Zhang et al., 2018a), it could reach a
productive of 2~3 apples per second if the platform repositioning problem could be solved. Also,
the proposed conceptual system would have multiple shakers and fruit catchers matching the
number of trellis wires which could multiple the productivity of the system. For example, if an
orchard were set up with seven tiers of trellis wires, harvesting an entire tree could require shaking
at all seven layers, and by making the multi-layer shaking and catching system simultaneously, it
could have one harvest cycle for the entire tree which could significantly improve the productivity.
Potentially this approach alone could improve the productivity of the harvesting system at least
133
ten times even if the time needed for two ‘non-productive’ steps (i.e., platform movement and
shaker head positioning) remained the same.
Figure 5.12. Time spent on various activities during semi-automated, hydraulically driven
harvesting (mean ±standard deviation, s.d.) of ‘Scifresh’ apples in a commercial orchard.
Results obtained from this study have verified that technical progresses were made from
the hand-held device to the semi-automated platform for fresh market apple harvest. All evaluated
research systems, however, required having human operators to maneuver various assisting
operations (as those were not the study goals in those researches) in completing a harvest process.
The adoption of an automated system for assisting functions could reduce the time required for
operations like positioning the shaker head (Figure 5.12). Therefore, it is reasonable to expect that
the overall productivity could be potentially improved by fully automating the system (Amatya
and Karkee, 2016; Karkee et al., 2018). A preliminary study has been conducted to conceptualize
automatic branch detection for shake-and-catch harvest on formally trained apple trees which
could help to quickly detect the shaking point on a full foliaged branch typically in commercial
orchards.

134
5.5. Conclusions
In summary, this study was to evaluate harvesting efficiency of different shaking methods,
followed by overall effectiveness of different integrated systems shake-and-catch harvest, based
on experimental data obtained from a five-year field test conducted in PNW commercial apple
orchards. Data were collected from multi-year field evaluations on three shaking methods (i.e.,
continuous non-linear, continuous linear, and intermittent linear reciprocating) using either hand-
held, hydraulically driven, or semi-automated harvesters. Results obtained based on six popular
apple cultivars in the United States (i.e., ‘Pacific Rose’, ‘Pink Lady’, ‘Scifresh’, ‘Envy’, ‘Fuji’,
and ‘Gala’) supported the following major conclusions:
• There existed some noticeable differences in fruit removability from the trees among
different apple cultivars in shake-and-catch vibratory harvest. Among six tested cultivars,
‘Scifresh’ and ‘Pink Lady’ exhibited the highest fruit removal efficiencies (average of
85%) and the highest percentage of marketable fruits (average of 88%–92%), and ‘Gala’
apple was found having the lowest fruit removal efficiency (average of 63%) with a lower
(but not the lowest) percentage of marketable fruit (average of 81%). It indicated that there
could exist some apple cultivars more suitable for mechanical (especially shake-and-catch)
harvest attributing to their removability by shaking and their capability of withstanding
physical impacts.
• A simple and reciprocal linear shaking was found more effective in removing fruits from
trees than tested non-linear shaking in ‘Gala’ cultivar. Tests showed 63% fruits (on
average) could be shaken off from the tree while the branch was excited by a reciprocal
linear motion, whereas only 35% fruits (on average) when a more complicated non-linear

135
shaking was used. The results also revealed that the non-linear shaking could help to
contain more removed fruits in a limited area. However, this comparison was limited by
the fact that the machine configurations (e.g., shaking power) were completely different
between continuous linear and non-linear reciprocating shaking methods.
• An intermittent shaking could be more effective than continuous shaking in removing fruits
from the trees as the motion interruption commonly occur in intermittent shaking could
induce additional motion patterns, such as tilting and/or rotating, on top of the normal
swinging motion which in-turn could generate a larger separation force on the abscission
layer of fruits. Obtained results revealed that the intermittent shaking could improve fruit
removal efficiency by 5% on ‘Scifresh’ cultivar in comparing to continuous shaking (90%
vs. 85% on average).
• The semi-automated harvesting system could achieve a slightly higher fruit removal
efficiency of 90%, followed by the hand-held system (87%) and manually operated
hydraulic system (84%). The evaluation also served as a preliminary study verifying that
an automated system could improve the overall productivity of the system at it would be
capable of more efficiently completing the tasks of branch detecting and grabbing.
Therefore, the semi-automated system could be the best system to be selected for further
development and adoption in fresh market apple harvesting.

136
REFERENCES
Amatya, S., and Karkee, M. (2016). Integration of visible branch sections and cherry clusters for
detecting cherry tree branches in dense foliage canopies. Biosystems Engineering, 149,
72–81.
Berlage, A. G., and Langmo, R. D. (1974). Harvesting apples with straddle-frame trunk shaker.
Transactions of the ASAE, 17(2), 230–232, 234.
Brat, I. (2015). On U.S. farms, fewer hands for the harvest: Producers raise wages, enhance
benefits, but a worker shortage grows with tighter border. The Wall Street Journal (12
Aug. 2015). Retrieved from http://www.wsj.com/articles/on-u-s-farms-fewer-hands-for-
the-harvest-1439371802
Clark, M. (2017). Washington state’s agricultural labor shortage. Retrieved from
https://www.washingtonpolicy.org/library/doclib/Clark-Washington-state-s-agricultural-
labor-shortage-PB-6-23-17.pdf
Davidson, J., Silwal, A., Karkee, M., Mo, C., and Zhang, Q. (2016). Hand-picking dynamic
analysis for undersensed robotic apple harvesting. Transactions of the ASABE, 59(4),
745–758.
De Kleine, M. E., and Karkee, M. (2015). A semi-automated harvesting prototype for shaking
fruit tree limbs. Transactions of the ASABE, 58(6), 1461–1470.
De Kleine, M., Karkee, M., and Ye, Y. (2016). Harvesting machine for formally trained
orchards. U.S. Patent No. 9,468,146.
Diener, R. G., Mohsenin, N. N., and Jenks, B. L. (1965). Vibration characteristics of trellis-
trained apple trees with reference to fruit detachment. Transactions of the ASAE, 8(1),
20–24.

137
Diener, R. G., Elliott, K. C., Nesselroad, P. E., Adams, R. E., Blizzard, S. H., Ingle, M., and
Singha, S. (1982). The West Virginia University tree fruit harvester. Journal of
Agricultural Engineering Research, 27(3), 191–200.
Domigan, I. R., Diener, R. G., Elliott, K. C., Blizzard, S. H., Nesselroad, P. E., Singha, S., and
Ingle, M. (1988). A fresh fruit harvester for apples trained on horizontal trellises. Journal
of Agricultural Engineering Research, 41(4), 239–249.
Feucht-Obsttechnik. (2014). Erbstetten, Germany: Feucht Fruit Technology. Retrieved from
http://www.feucht-obsttechnik.de/
Fu, H., He, L., Ma, S., Karkee, M., Chen, D., Zhang, Q., and Wang, S. (2017). ‘Jazz’ apple
impact bruise responses to different cushioning materials. Transactions of the ASABE,
60(2), 327–336.
He, L., Fu, H., Karkee, M., and Zhang, Q. (2016). Effect of fruit location on apple detachment
with mechanical shaking. IFAC-PapersOnLine, 49(16), 293–298.
He, L., Zhang, X., Karkee, M., and Zhang, Q. (2018). Fruit accessibility for mechanical
harvesting of fresh market apples. ASABE Paper No. 1801007. St. Joseph, MI: ASABE.
He, L., Fu, H., Sun, D., Karkee, M., and Zhang, Q. (2017). Shake-and-catch harvesting for fresh
market apples in trellis-trained trees. Transactions of the ASABE, 60(2), 353–360.
He, L., Zhang, X., Ye, Y., Karkee, M., and Zhang, Q. (2019). Effect of shaking location and
duration on mechanical harvesting of fresh market apples. Applied Engineering in
Agriculture, 35(2), 175–183.
Hofmann, J., Snyder, K., and Keifer, M. (2006). A descriptive study of workers’ compensation
claims in Washington State orchards. Occupational Medicine, 56(4), 251–257.
138
Karkee, M., Silwal, A., and Davidson, J. R. (2018). Chapter 10: Mechanical harvest and in-field
handling of tree fruit crops. Q. Zhang (Ed.), Automation in Tree Fruit Production:
Principles and Practice (pp. 179–233). Wallingford, UK: CABI.
Miles, C. A., and King, J. (2014). Yield, labor, and fruit and juice quality characteristics of
machine and hand-harvested ‘Brown Snout’ specialty cider apple. HortTechnology,
24(5), 519–526.
Millier, W. F., Rehkugler, G. E., Pellerin, R. A., Throop, J. A., and Bradley, R. B. (1973). Tree
fruit harvester with insertable multilevel catching system. Transactions of the ASAE,
16(5), 844–850.
Monroe, G. E. (1982). An over-the-row continuous tree-crop harvester. Transactions of the
ASAE, 25(4), 888–892.
Peterson, D. L., and Bennedsen, B. S. (2005). Isolating damage from mechanical harvesting of
apples. Applied Engineering in Agriculture, 21(1), 31–34.
Peterson, D. L., and Wolford, S. D. (2003). Fresh market quality tree fruit harvester: Part II.
Apples. Applied Engineering in Agriculture, 19(5), 545–548.
Peterson, D. L., Miller, S. S., and Kornecki, T. S. (1985). Over-the-row harvester for apples.
Transactions of the ASAE, 28(5), 1393–1397.
Peterson, D. L., Bennedsen, B. S., Anger, W. C., and Wolford, S. D. (1999). A systems approach
to robotic bulk harvesting of apples. Transactions of the ASAE, 42(4), 871–876.
Tennes, B. R., Burton, C. L., and Levin, J. H. (1976). Concepts for mechanizing high-density
orchard fruit culture. Transactions of the ASAE, 19(1), 35–36, 40.
USDA. (2018). National agricultural statistics database. Washington, DC: USDA National
Agricultural Statistics Service. Retrieved from https://quickstats.nass.usda.gov

139
Whiting, M. D., and Perry, R. L. (2017). Chapter 18: Fruit harvest methods and technologies. J.
Quero-Garcia (Ed.), Cherries: Botany, Production and Uses (pp. 442–459). Wallingford,
UK: CABI.
Zhang, J. (2019). Multi class object detection using deep learning and estimation of shaking
locations for shake and catch apple harvesting system. PhD Dissertation. Beijing, China:
China Agricultural University, College of Engineering.
Zhang, J., He, L., Karkee, M., Zhang, Q., Zhang, X., and Gao, Z. (2017). Branch detection with
apple trees trained in fruiting wall architecture using stereo vision and regions-
convolutional neural network (R-CNN). ASABE Paper No. 1700427. St. Joseph, MI:
ASABE.
Zhang, J., He, L., Karkee, M., Zhang, Q., Zhang, X., and Gao, Z. (2018). Branch detection for
apple trees trained in fruiting wall architecture using depth features and Regions-
Convolutional Neural Network (R-CNN). Computers and Electronics in Agriculture,
155, 386–393.
Zhang, X., He, L., Majeed, Y., Karkee, M., Whiting, M. D., and Zhang, Q. (2017). A study of
the influence of pruning strategy effect on vibrational harvesting of apples. ASABE Paper
No. 1700812. St. Joseph, MI: ASABE.
Zhang, X., He, L., Majeed, Y., Karkee, M., Whiting, M. D., and Zhang, Q. (2018a). A precision
pruning strategy for improving efficiency of vibratory mechanical harvesting of apples.
Transactions of the ASABE, 61(5), 1565–1576.
Zhang, X., Fu, L., Majeed, Y., He, L., Karkee, M., Whiting, M. D., and Zhang, Q. (2018b). Field
evaluation of data-based pruning severity levels (PSL) on mechanical harvesting of
apples. IFAC-PapersOnLine, 51(17), 477–482.

140
Zhang, Z., Heinemann, P. H., Liu, J., Baugher, T. A., and Schupp, J. R. (2016). The development
of mechanical apple harvesting technology: A review. Transactions of the ASABE, 59(5),
1165–1180.
141
CHAPTER SIX
COMPUTER VISION BASED TREE TRUNK AND BRANCH IDENTIFICATION AND
SHAKING POINTS DETECTION IN DENSE-FOLIAGE CANOPY FOR
MECHANICAL HARVESTING OF APPLES
6.1. Abstract
Fresh market apple is one of the high-value and premium crops in the United States.
Washington State alone annually produced about two-thirds of national production in the past ten
years. However, the availability of seasonal semi-skilled labor has been reported to be increasingly
uncertain and the cost of the labor also has been rapidly increasing. Mechanical harvesting
solutions (e.g., shake-and-catch systems) have, therefore, become necessary for addressing the
challenge. As one of the major challenges in shake-and-catch harvest was to position the shaking
end-effector and the catching device at appropriate locations within tree canopies, a vision system
has been used for automatically and accurately identifying desired canopy locations.
Convolutional neural networks (CNNs)-based semantic segmentation was utilized to identify the
tree trunks and branches for supporting mass mechanical harvesting of apples. There were three
CNN architectures employed in this study including i) Deeplab v3+ ResNet-18, ii) VGG-16, and
iii) VGG-19. Four pixel-classes were pre-defined as ‘branches’, ‘trunks’, ‘apples’, and ‘leaves
(background)’ to segment the tree canopies with varying foliage density. Specifically, three density
levels, light, medium, and high densities, were considered, which represented the entire population
of canopy layouts of formal apple tree architectures. In total, a dataset of 674 ‘Fuji’ images were
collected, which were then divided into 70%, 15%, and 15% respectively for network training,
validating, and testing. Training results showed that ResNet-18 outperformed VGGs in identifying
142
tree branches and trunks based on all three evaluation measures (i.e., per-class accuracy (PcA),
intersection over union (IoU), and boundary-F1 score (BFScore)). PcA of 97%, IoU of 0.69, and
BFScore of 0.89 were achieved by ResNet-18 with full image resolution. In terms of the targeted
class of ‘branches’, IoU of up to 0.40, and BFScore of 0.82 were obtained by the same network,
indicating good overlaps between predictions and ground-truth data, and satisfactory preservations
of the object boundary information. The selected ResNet-18 was further evaluated for its
robustness with a set of test canopy images (111 in total): light density of ‘Pink Lady’, high density
of ‘Envy’ and ‘Scifresh’. Results showed that IoU of 0.41 and 0.62, and BF score of 0.71 and 0.86
were achieved respectively for ‘branches’ and ‘trunks’ on a per class basis. These results were
achieved with one of the highest density canopies of ‘Scifresh’. Finally, suitable shaking points
near branch bases were estimated. It was found that 72% of them were deemed “good” in
performance comparing to manual selections.
6.2. Introduction
Fresh market apple is one of the high-value agricultural commodities in the United States
and Washington State. About 300 thousand acres of apple (~5.2 billion kilograms) is harvested
(manually) each year nationally (USDA, 2019). However, the agricultural labor availability in the
entire Pacific Northwest region and around the has been increasingly uncertain, thus posing a huge
risk for sustainable apple industry. For example, there was up to one hundred million kilograms of
apple unharvested due to the labor shortage during 2007 and 2014 harvest seasons in Washington
State (USDA, 2019). In addition, about 21% of Washington farms lost up to $250,000 because of
the same reason in 2016 (Clark, 2017). Therefore, the apple growers in Washington State have a

143
growing desire to consider adopting labor-saving technologies including machines to harvest
apples (e.g., vibratory mechanical shake-and-catch harvester).
Numerous studies on apple harvesting have been conducted in the past. For instance, De
Kleine and Karkee (2015) tested a harvesting prototype for ‘Gala’ apple in a commercial orchard
using a dual motor actuator-based shaking end-effector, which resulted in an overall 35% of fruit
removal efficiency. Moreover, He et al. (2019) investigated a multi-layer vibratory shake-and-
catch harvester on ‘Scifresh’ apples. Overall, 85% of fruit removal efficiency was achieved using
this technique. Among all harvested apples, about 88% were reported marketable according to the
United States Department of Agriculture (USDA) fruit quality standards (USDA, 2002). Though
some of the latest studies on shake-and-catch harvesting show promising results in terms of fruit
detachment efficiency and fruit quality, these machines rely on manual operation, which leads to
inefficient and laborious maneuvering in the field. For example, it was found that the time spent
for positioning the shaking head (actuator) into the canopy was almost eight times more than the
time that was spent on actuating the shaker. Especially when the medium/high-vigor apple
rootstocks were favored by growers in formal tree architectures (e.g., vertical axis and V-axis),
which potentially result in developing high-density foliage canopies (Zhang et al., 2018).
Due to such canopy conditions, most of current shake-and-catch vibratory harvesting
prototypes required a couple of workers manually operating the machine to complete the harvest
task, which was laborious and could also induce some health risks for workers (e.g., inhale of dusts
when the machine was actuating vibration). Therefore, it is a crucial need to automate the
harvesting system. First step is to provide a capability for the harvester to automatically detecting
optimal shaking point(s) on the target branches using computer vision techniques This study
proposed a machine vision system including computer vision-based image acquisition and a

144
convolutional neural network (CNN)-based image processing technique for automated detection
of shaking locations.
Currently, the use of deep learning technologies for reinforcing decision-making processes
has been widely studied for agricultural operations. Many of the reported studies are focused
around image processing for agricultural applications due to its higher accuracy and robustness
compared to most of the conventional algorithms (Kamilaris and Prenafeta-Boldú, 2018). CNNs
are one of the most applied deep learning techniques due to their capabilities of processing high-
resolution image data and decreasing computational time made possible by its numerous
convolutional layers (i.e., network weight sharing).
There are particularly two types of applications of CNN-based learning in agriculture, i.e.,
image segmentation and object detection (Chen et al., 2018; He et al., 2017; Ren et al., 2015).
Many studies in agricultural fields have been conducted using object detection techniques. For
example, Sa et al. (2016) created a faster regions-based convolutional neural network (Faster R-
CNN) to detect sweet peppers with boundary F-1 score (BFScore; one of the most important
network evaluation measures) of up to 0.83. Bargoti and Underwood (2016) also used a Faster R-
CNN-based object detection framework to detect various types of fruit using color imaging
techniques. The study showed good results with BFScore of >0.9 for apples and mangoes. Both
studies (Bargoti and Underwood, 2016; Sa et al., 2016) tried to test the trained networks on various
objects such as apples, mangoes, almonds, oranges, and so on. Such detection systems are
comparatively more robust and could potentially be employed in detecting other similar objects
under different cropping and environmental conditions. In contrast, segmentation methods have
been more frequently used in analyzing remote sensing images such as satellite and unmanned
aerial vehicle (UAV)-based images (Kemker et al., 2017; Sa et al., 2017). For ground vehicle use,
145
Bargoti and Underwood (2017) presented a study on apple counting and yield estimation using
CNN-based segmentation and achieved a pixel-wise BFScore of 0.79. Another study was
conducted by Dias et al. (2018) using a fully convolutional network (FCN) to identify the
multispecies of fruit flowers.
When it comes to identifying tree trunks and branches for bulk mechanical harvesting, only
limited studies have been reported in the past. Zhang et al. (2017) adopted a R-CNN-based object
detection technique to detect the visible parts of apple tree branches in tree canopies trained to
formal architecture (Zhang et al., 2018). With the modification of a pre-trained AlexNet
(Krizhevsky et al., 2012), a deep learning architecture where the network has already been trained
with informative features from an image dataset such as the ImageNet (Deng et al., 2009)), branch
skeletons (trajectories) were generated for an automated localization with average recall of 92%
and accuracy of 86%. However, this work was conducted in the dormant season and needs to be
further improved for practical use during harvesting season. In addition, Majeed et al. (2020)
employed a pre-trained SegNet architecture to segment tree trunks and branches from the
background with a mean BFScore of 0.93 and 0.88 for trunks and branch, respectively. The study
was also conducted in a dormant season with young (one-year-old) apple trees.
The primary goal of this study is to precisely identify and locate the tree branches/trunks
and to estimate suitable shaking locations in dense-foliage canopies for automating mass
mechanical harvesting systems for apples. The following are the specific objectives pursued;
i) To automatically segment the tree trunks and branches using three different pre-trained
CNNs (Deeplab v3+ ResNet-18, and two SegNets: VGG-16 and VGG-19);
ii) To develop and implement a strategy for detecting shaking points on individual branches
for automated mass harvesting.

146
6.3. Materials and Methods
6.3.1. Experimental orchards
This study was conducted using formally trained apple trees in both V-axis (Figure 6.1a)
and vertical axis (Figure 6.1b) architectures. The experiments were conducted in a commercial,
fresh market apple orchard near Prosser, WA, during 2017–2018 harvesting seasons. Currently,
both architectures are widely used by growers in Pacific Northwest region of the United States due
to their uniform canopy light distribution, high fruit load, as well as good accessibility for human
and/or machine (Whiting, 2018). In these architectures, tree trunks were trained to trellis wires
with the elevation angle of 70° and 90° to the ground respectively for V-axis or vertically axis
systems. Tree branches were horizontally trained along the seven or eight trellis wires spaced about
0.5 m apart. In total, three different levels of foliage density (due to different vigor of rootstock)
were involved in the study: light-density foliage canopy (‘Pink Lady’), medium-density foliage
canopy (‘Fuji’), and high-density foliage canopy (‘Envy’ and ‘Scifresh’) (Table 6.1). The major
data collection was with ‘Fuji’, three other cultivars were involved to test the performance in the
situation outside of training process. Clearly, tree trunks and branches are much more visible in
light-density foliage canopy than medium- and high-density foliage canopies. Other characteristics
of the orchards such as tree and row spacing were also summarized in Table 6.1. In these
commercial orchards, crop and canopy structures are regularly maintained by semi-skilled labors
through training, pruning, and thinning.

147
(a) (b)
Figure 6.1. Example of formally trained apple orchards in V-axis (a) and vertical axis (b)
architectures (Prosser, WA).
Table 6.1. Characteristics of different orchards used in the study. Canopies with three different
levels of foliage density were used in the experiments: light-density foliage (‘Pink Lady’),
medium-density foliage (‘Fuji’), and high-density foliage (‘Envy’ and ‘Scifresh’).
Foliage
Density Cultivar Orchard Characteristics Canopy Layout Image#
Light Pink
Lady
Tree
architecture V-axis
15 Tree spacing
(m) 0.8
Row spacing
(m) 3.8
Medium Fuji
Tree
architecture V-axis
674 Tree spacing
(m) 0.9
Row spacing
(m) 3.7
High
Envy
Tree
architecture V-axis
58 Tree spacing
(m) 0.7
Row spacing
(m) 3.5
Scifresh
Tree
architecture Vertical axis
38 Tree spacing
(m) 1.5
Row spacing
(m) 2.7
148
6.3.2. Image acquisition
A Kinect imaging sensor (Kinect V2, Microsoft Inc., Redmond, WA) that consists of red-
green-blue (RGB), depth, and infrared channels (Figure 6.2a) was used in this study, which is both
relatively stable in outdoor environment and economically affordable. The RGB camera recorded
the reflectance in red, green, and blue spectrum that are helpful in object detection with color and
other associated features. The depth camera used the projected infrared laser light and
monochrome complementary metal-oxide-semiconductor sensor for recording 3-dimensional (3-
D) information (i.e., points cloud data) of the scene, which can then be used to exact location or
distance to objects. The maximum effective pixel resolution of Kinect for RGB sensor was
1,920×1,080 and for depth sensor was 512×424. A customized platform mounted on an electric
Toro Utility Vehicle (Workman®, Toro®, Bloomington, MN) was used for image acquisition task
in this study (Figure 6.3a). The camera was horizontally mounted on aluminum frames with screws
and was positioned orthogonal to the canopies in both V-axis (Figure 6.3b) and vertical axis
systems. The distance from the camera to the center of the target canopies was maintained around
1.1–1.2 m to optimize the visualization of the tree trunks and branches. The mobile platform was
stationary when the images were acquired. A total of 785 canopy images (including points cloud
data) were acquired under natural illumination conditions (Table 6.1). The steps followed in image
data collection are shown in Figure 6.2b.

149
Figure 6.2. A Kinect V2 imaging sensor (a); overall work pipeline for image acquisition (b)
and pre-processing (c); and applications of the convolutional neural networks (CNNs) in
processing the collected data (d).
(a) (b)
Figure 6.3. A customized image acquisition platform mounted on a Toro® Utility Vehicle in
field environment (a), and closeup of the imaging system set up in an inclination such that it
faces the V-axis canopies orthogonally (b).
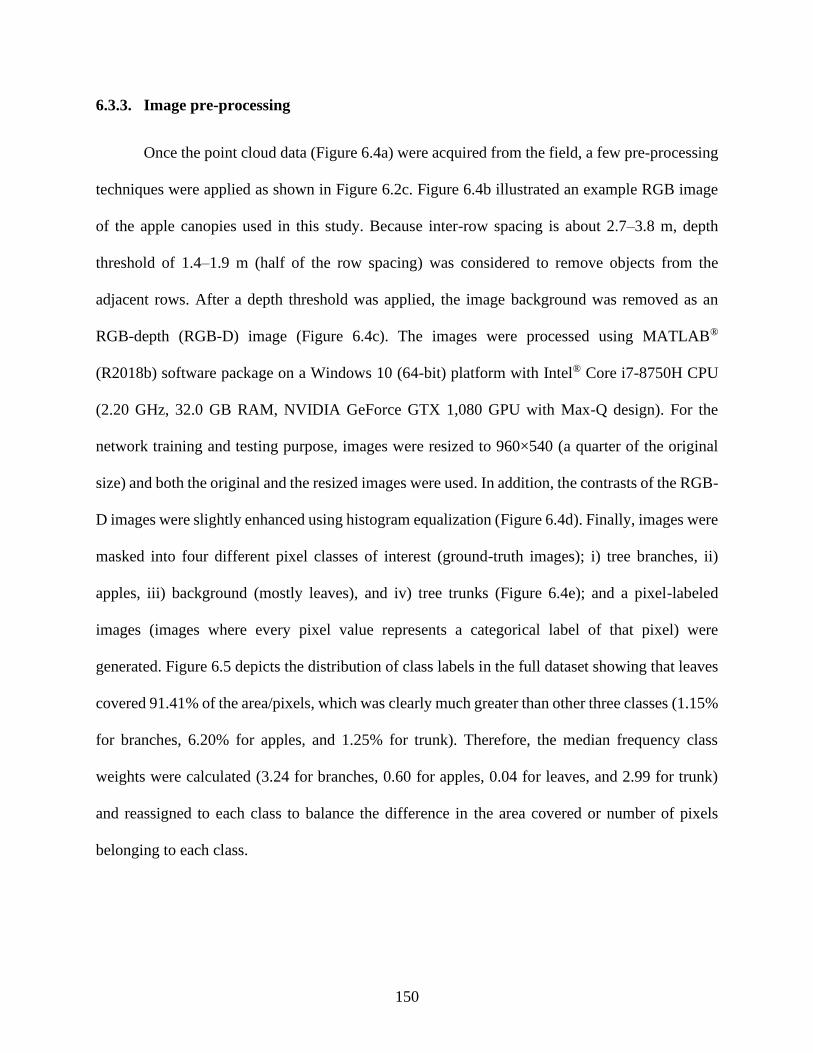
150
6.3.3. Image pre-processing
Once the point cloud data (Figure 6.4a) were acquired from the field, a few pre-processing
techniques were applied as shown in Figure 6.2c. Figure 6.4b illustrated an example RGB image
of the apple canopies used in this study. Because inter-row spacing is about 2.7–3.8 m, depth
threshold of 1.4–1.9 m (half of the row spacing) was considered to remove objects from the
adjacent rows. After a depth threshold was applied, the image background was removed as an
RGB-depth (RGB-D) image (Figure 6.4c). The images were processed using MATLAB®
(R2018b) software package on a Windows 10 (64-bit) platform with Intel® Core i7-8750H CPU
(2.20 GHz, 32.0 GB RAM, NVIDIA GeForce GTX 1,080 GPU with Max-Q design). For the
network training and testing purpose, images were resized to 960×540 (a quarter of the original
size) and both the original and the resized images were used. In addition, the contrasts of the RGB-
D images were slightly enhanced using histogram equalization (Figure 6.4d). Finally, images were
masked into four different pixel classes of interest (ground-truth images); i) tree branches, ii)
apples, iii) background (mostly leaves), and iv) tree trunks (Figure 6.4e); and a pixel-labeled
images (images where every pixel value represents a categorical label of that pixel) were
generated. Figure 6.5 depicts the distribution of class labels in the full dataset showing that leaves
covered 91.41% of the area/pixels, which was clearly much greater than other three classes (1.15%
for branches, 6.20% for apples, and 1.25% for trunk). Therefore, the median frequency class
weights were calculated (3.24 for branches, 0.60 for apples, 0.04 for leaves, and 2.99 for trunk)
and reassigned to each class to balance the difference in the area covered or number of pixels
belonging to each class.
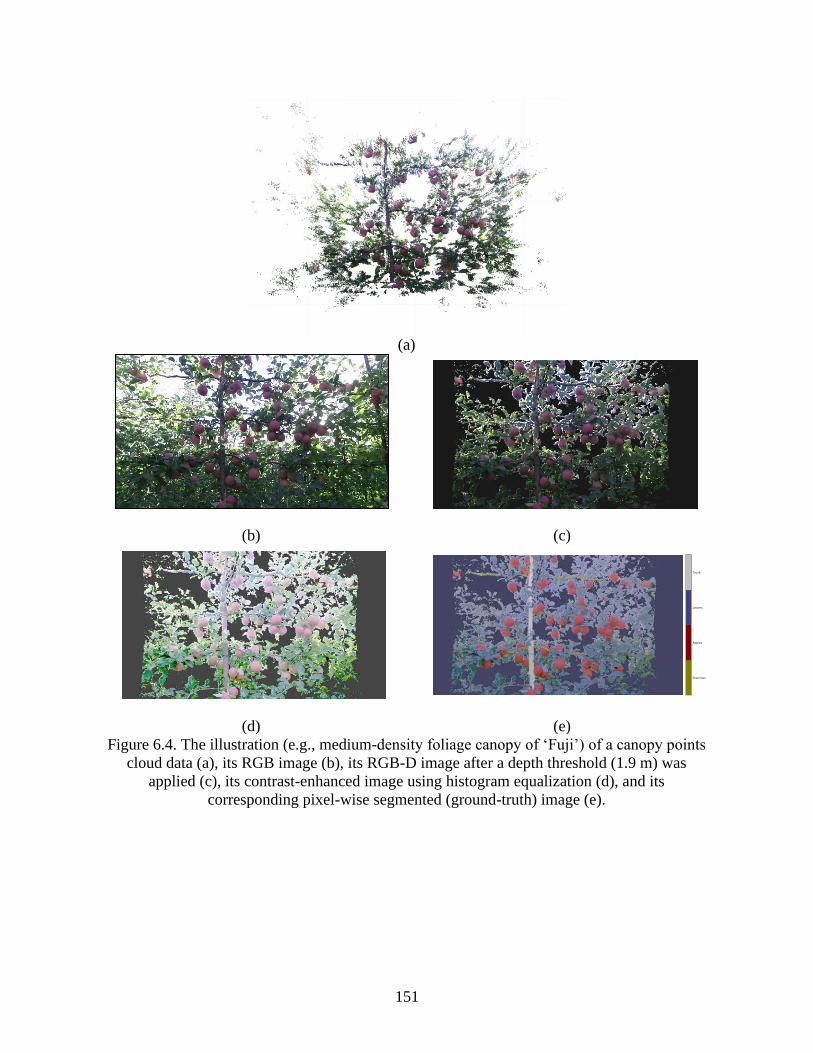
151
(a)
(b) (c)
(d) (e)
Figure 6.4. The illustration (e.g., medium-density foliage canopy of ‘Fuji’) of a canopy points
cloud data (a), its RGB image (b), its RGB-D image after a depth threshold (1.9 m) was
applied (c), its contrast-enhanced image using histogram equalization (d), and its
corresponding pixel-wise segmented (ground-truth) image (e).
152
Figure 6.5. Distribution of four class labels in the full dataset.
6.3.4. Semantic segmentation using deep learning
6.3.4.1.Convolutional neural network (CNNs) architecture and activation channels
In this study, pre-trained deep learning networks (transfer learning) were adopted to fine
tune to the apple canopy images using a semantic segmentation method, which could assign
specific labels/classes to individual pixels of an image (Figure 6.2d). Three efficient pre-trained
architectures (i.e., encoder-decoder architecture in this study) of convolutional neural networks
(CNNs) (i.e., directed acyclic graph (DAG) network: (i) Deeplab v3+ ResNet-18 (72-layer;
abbreviated as ResNet-18 in the following content) (Chen et al., 2017; Chen et al., 2018); SegNet:
(ii) VGG-16 (Visual Geometry Group-16) (41-layer) and (iii) VGG-19 (47-layer) (Simonyan and
Zisserman, 2014)) were modified, fine-tuned, and compared. ResNet was the winner of 2015
ImageNet Large Scale Visual Recognition Challenge (ILSVRC) and is one of the state-of-the-art
CNNs developed by He et al. (2016). It heavily uses the batch normalization layers (to accelerate
the network training) but lacks fully connected layers (layers that have full connections to all
activation channels in the previous layer) at the end of the architecture. VGGs, on the other hand,
won the first and the second places, respectively, in 2014 ILSVRC. These networks are very deep
153
but are time and memory consuming. All three networks require the image input size of 224-by-
224 pixels, which means the minimum image size should be at least equal to or larger than it. In
this study, ResNet-18 was trained with both original and resized images, while VGG-16 and VGG-
19 were trained with only resized images using the GPU-based platform described above. To better
understand the computational characteristics of the networks, Figure 6.6a visualizes the overall
architecture of the modified ResNet-18 (101-layer) and the activation channels of the
convolutional layers (Figure 6.6b–q) used in this work. The entire architecture can be divided into
16 processing blocks (i.e., B1–B16 as described below; the number near to each block refers to its
depth). The architectures of VGG-16 (91-layer) and VGG-19 SegNet (109-layer) are omitted
because they could be found in some other studies (e.g., Majeed et al., 2020). The specific units in
the modified Deeplab v3+ ResNet-18 (where ResNet-18 functioned as the encoder and Deeplab
v3 functioned as the decoder) architecture are as follows:
I. Block 1 (B1): First, pre-processed RGB-D images (1,080×1,920×3 or 540×960×3) (Figure
6.6b) were loaded into B1 to feed to the network.
II. Block 2–6 (B2–B6): The images were then processed in the original ResNet-18 blocks (the
cubes enclosed by the larger cube with dashed lines in Figure 6.6a, B2–B6), which contain
a series of convolutional layers, batch normalization layers, rectified linear unit (ReLU)
layers, and max pooling layers. Among all, convolutional layers are the core building
blocks of CNNs that the parameters of layers consist of a set of learnable filters (e.g., 64–
512 filters in B3–B6). These blocks automatically compute the output of neurons that are
locally connected to regions from the input (e.g., ‘conv1’ in B2). After each convolutional
layer, generally there is one batch normalization layer (e.g., ‘bn_conv1’ in B2) and/or one
ReLU layer (e.g., ‘conv1_relu’ in B2) connected to a convolutional layer. ReLU layer
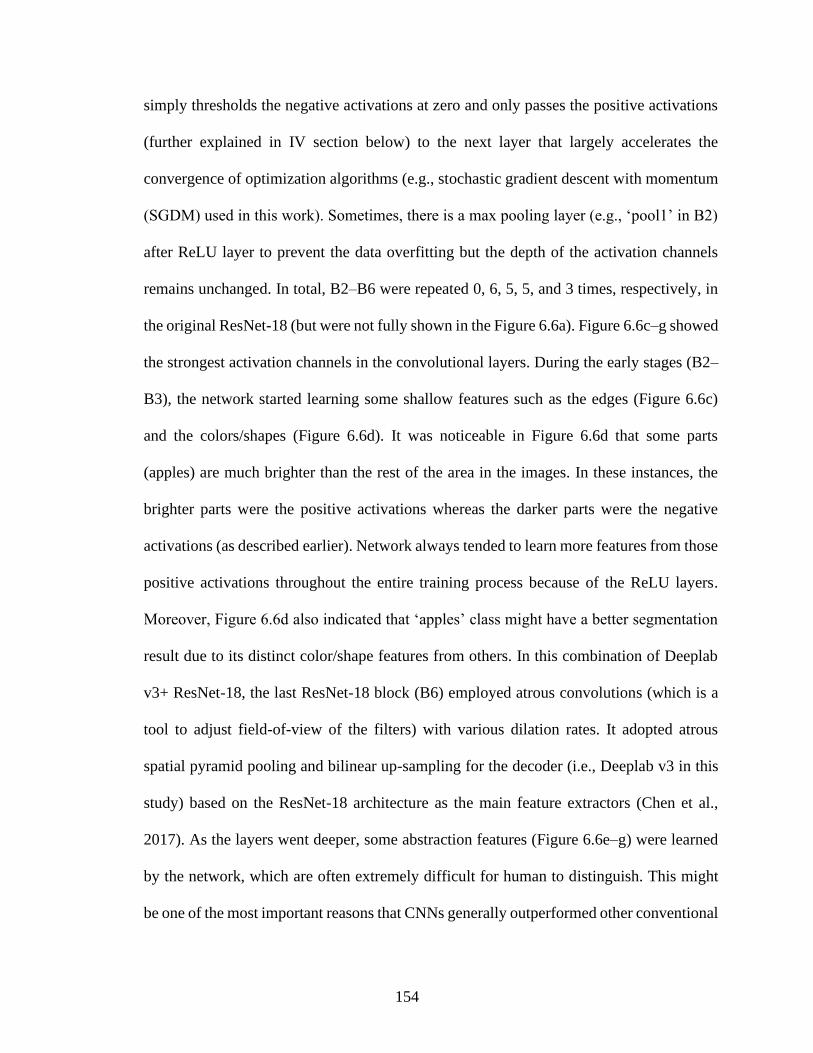
154
simply thresholds the negative activations at zero and only passes the positive activations
(further explained in IV section below) to the next layer that largely accelerates the
convergence of optimization algorithms (e.g., stochastic gradient descent with momentum
(SGDM) used in this work). Sometimes, there is a max pooling layer (e.g., ‘pool1’ in B2)
after ReLU layer to prevent the data overfitting but the depth of the activation channels
remains unchanged. In total, B2–B6 were repeated 0, 6, 5, 5, and 3 times, respectively, in
the original ResNet-18 (but were not fully shown in the Figure 6.6a). Figure 6.6c–g showed
the strongest activation channels in the convolutional layers. During the early stages (B2–
B3), the network started learning some shallow features such as the edges (Figure 6.6c)
and the colors/shapes (Figure 6.6d). It was noticeable in Figure 6.6d that some parts
(apples) are much brighter than the rest of the area in the images. In these instances, the
brighter parts were the positive activations whereas the darker parts were the negative
activations (as described earlier). Network always tended to learn more features from those
positive activations throughout the entire training process because of the ReLU layers.
Moreover, Figure 6.6d also indicated that ‘apples’ class might have a better segmentation
result due to its distinct color/shape features from others. In this combination of Deeplab
v3+ ResNet-18, the last ResNet-18 block (B6) employed atrous convolutions (which is a
tool to adjust field-of-view of the filters) with various dilation rates. It adopted atrous
spatial pyramid pooling and bilinear up-sampling for the decoder (i.e., Deeplab v3 in this
study) based on the ResNet-18 architecture as the main feature extractors (Chen et al.,
2017). As the layers went deeper, some abstraction features (Figure 6.6e–g) were learned
by the network, which are often extremely difficult for human to distinguish. This might
be one of the most important reasons that CNNs generally outperformed other conventional
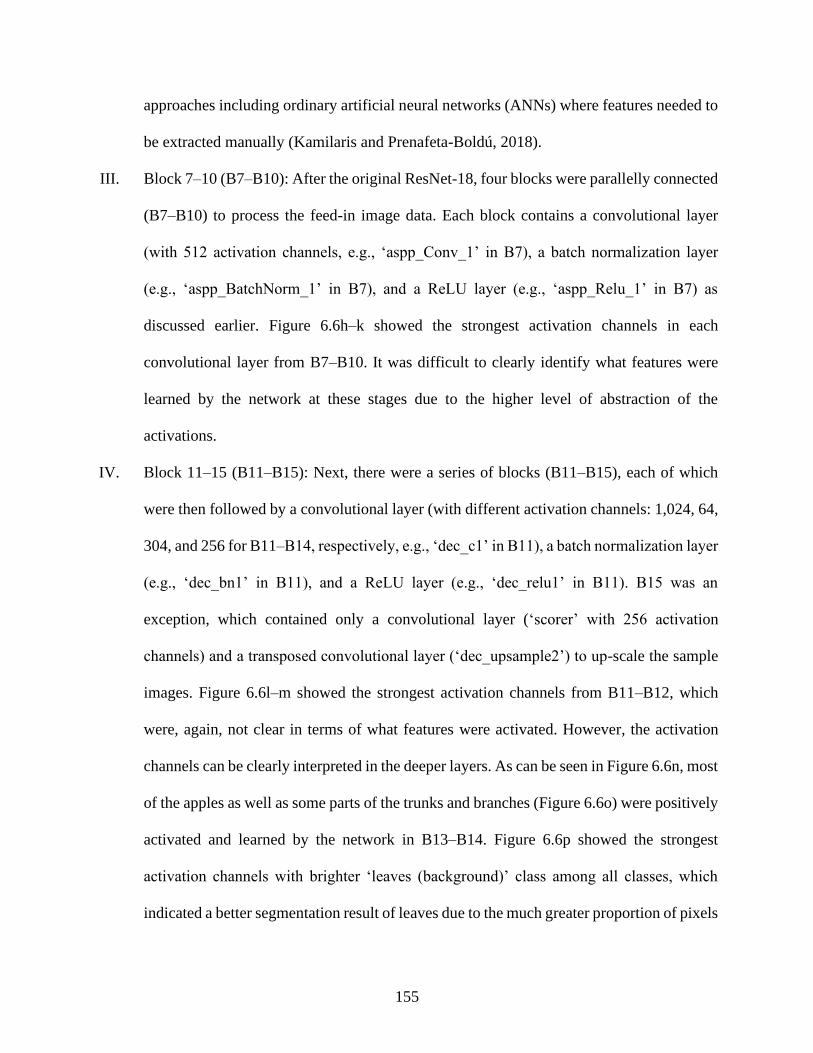
155
approaches including ordinary artificial neural networks (ANNs) where features needed to
be extracted manually (Kamilaris and Prenafeta-Boldú, 2018).
III. Block 7–10 (B7–B10): After the original ResNet-18, four blocks were parallelly connected
(B7–B10) to process the feed-in image data. Each block contains a convolutional layer
(with 512 activation channels, e.g., ‘aspp_Conv_1’ in B7), a batch normalization layer
(e.g., ‘aspp_BatchNorm_1’ in B7), and a ReLU layer (e.g., ‘aspp_Relu_1’ in B7) as
discussed earlier. Figure 6.6h–k showed the strongest activation channels in each
convolutional layer from B7–B10. It was difficult to clearly identify what features were
learned by the network at these stages due to the higher level of abstraction of the
activations.
IV. Block 11–15 (B11–B15): Next, there were a series of blocks (B11–B15), each of which
were then followed by a convolutional layer (with different activation channels: 1,024, 64,
304, and 256 for B11–B14, respectively, e.g., ‘dec_c1’ in B11), a batch normalization layer
(e.g., ‘dec_bn1’ in B11), and a ReLU layer (e.g., ‘dec_relu1’ in B11). B15 was an
exception, which contained only a convolutional layer (‘scorer’ with 256 activation
channels) and a transposed convolutional layer (‘dec_upsample2’) to up-scale the sample
images. Figure 6.6l–m showed the strongest activation channels from B11–B12, which
were, again, not clear in terms of what features were activated. However, the activation
channels can be clearly interpreted in the deeper layers. As can be seen in Figure 6.6n, most
of the apples as well as some parts of the trunks and branches (Figure 6.6o) were positively
activated and learned by the network in B13–B14. Figure 6.6p showed the strongest
activation channels with brighter ‘leaves (background)’ class among all classes, which
indicated a better segmentation result of leaves due to the much greater proportion of pixels
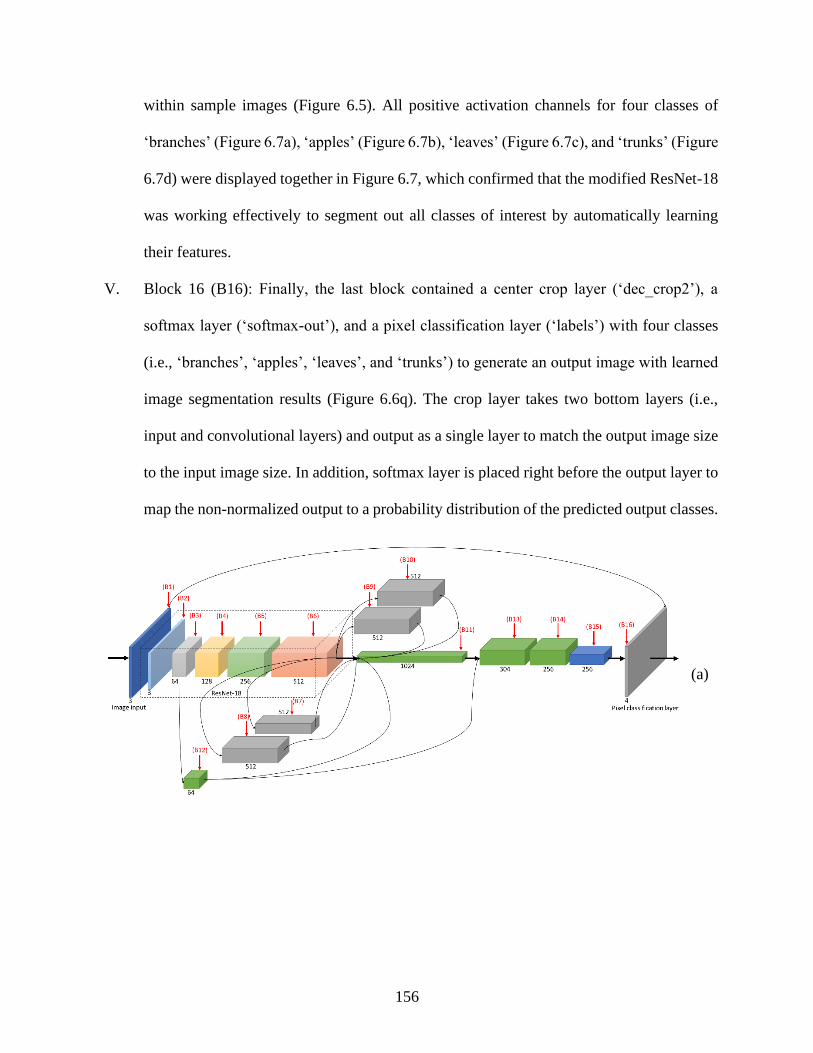
156
within sample images (Figure 6.5). All positive activation channels for four classes of
‘branches’ (Figure 6.7a), ‘apples’ (Figure 6.7b), ‘leaves’ (Figure 6.7c), and ‘trunks’ (Figure
6.7d) were displayed together in Figure 6.7, which confirmed that the modified ResNet-18
was working effectively to segment out all classes of interest by automatically learning
their features.
V. Block 16 (B16): Finally, the last block contained a center crop layer (‘dec_crop2’), a
softmax layer (‘softmax-out’), and a pixel classification layer (‘labels’) with four classes
(i.e., ‘branches’, ‘apples’, ‘leaves’, and ‘trunks’) to generate an output image with learned
image segmentation results (Figure 6.6q). The crop layer takes two bottom layers (i.e.,
input and convolutional layers) and output as a single layer to match the output image size
to the input image size. In addition, softmax layer is placed right before the output layer to
map the non-normalized output to a probability distribution of the predicted output classes.
(a)
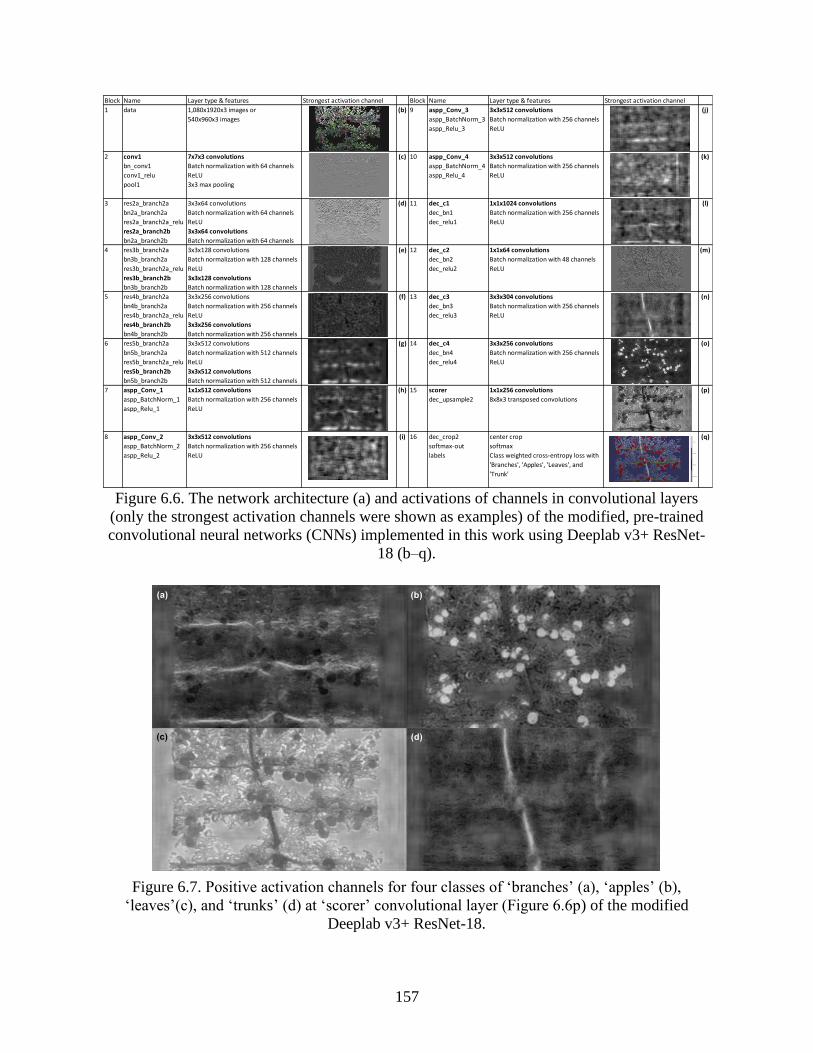
157
Figure 6.6. The network architecture (a) and activations of channels in convolutional layers
(only the strongest activation channels were shown as examples) of the modified, pre-trained
convolutional neural networks (CNNs) implemented in this work using Deeplab v3+ ResNet-
18 (b–q).
Figure 6.7. Positive activation channels for four classes of ‘branches’ (a), ‘apples’ (b),
‘leaves’(c), and ‘trunks’ (d) at ‘scorer’ convolutional layer (Figure 6.6p) of the modified
Deeplab v3+ ResNet-18.
Block Name Layer type & features Strongest activation channel Block Name Layer type & features Strongest activation channel
data 1,080x1920x3 images or aspp_Conv_3 3x3x512 convolutions
540x960x3 images aspp_BatchNorm_3 Batch normalization with 256 channels
aspp_Relu_3 ReLU
conv1 7x7x3 convolutions aspp_Conv_4 3x3x512 convolutions
bn_conv1 Batch normalization with 64 channels aspp_BatchNorm_4 Batch normalization with 256 channels
conv1_relu ReLU aspp_Relu_4 ReLU
pool1 3x3 max pooling
res2a_branch2a 3x3x64 convolutions dec_c1 1x1x1024 convolutions
bn2a_branch2a Batch normalization with 64 channels dec_bn1 Batch normalization with 256 channels
res2a_branch2a_relu ReLU dec_relu1 ReLU
res2a_branch2b 3x3x64 convolutions
bn2a_branch2b Batch normalization with 64 channels
res3b_branch2a 3x3x128 convolutions dec_c2 1x1x64 convolutions
bn3b_branch2a Batch normalization with 128 channels dec_bn2 Batch normalization with 48 channels
res3b_branch2a_relu ReLU dec_relu2 ReLU
res3b_branch2b 3x3x128 convolutions
bn3b_branch2b Batch normalization with 128 channels
res4b_branch2a 3x3x256 convolutions dec_c3 3x3x304 convolutions
bn4b_branch2a Batch normalization with 256 channels dec_bn3 Batch normalization with 256 channels
res4b_branch2a_relu ReLU dec_relu3 ReLU
res4b_branch2b 3x3x256 convolutions
bn4b_branch2b Batch normalization with 256 channels
res5b_branch2a 3x3x512 convolutions dec_c4 3x3x256 convolutions
bn5b_branch2a Batch normalization with 512 channels dec_bn4 Batch normalization with 256 channels
res5b_branch2a_relu ReLU dec_relu4 ReLU
res5b_branch2b 3x3x512 convolutions
bn5b_branch2b Batch normalization with 512 channels
aspp_Conv_1 1x1x512 convolutions scorer 1x1x256 convolutions
aspp_BatchNorm_1 Batch normalization with 256 channels dec_upsample2 8x8x3 transposed convolutions
aspp_Relu_1 ReLU
aspp_Conv_2 3x3x512 convolutions dec_crop2 center crop
aspp_BatchNorm_2 Batch normalization with 256 channels softmax-out softmax
aspp_Relu_2 ReLU labels Class weighted cross-entropy loss with
'Branches', 'Apples', 'Leaves', and
'Trunk'
2
3
4
8
5
6
7
1
16
14
15
11
12
13
9(b) (j)
(k)
(l)
(m)
10
(n)
(o)
(p)
(q)
(c)
(d)
(e)
(f)
(g)
(h)
(i)
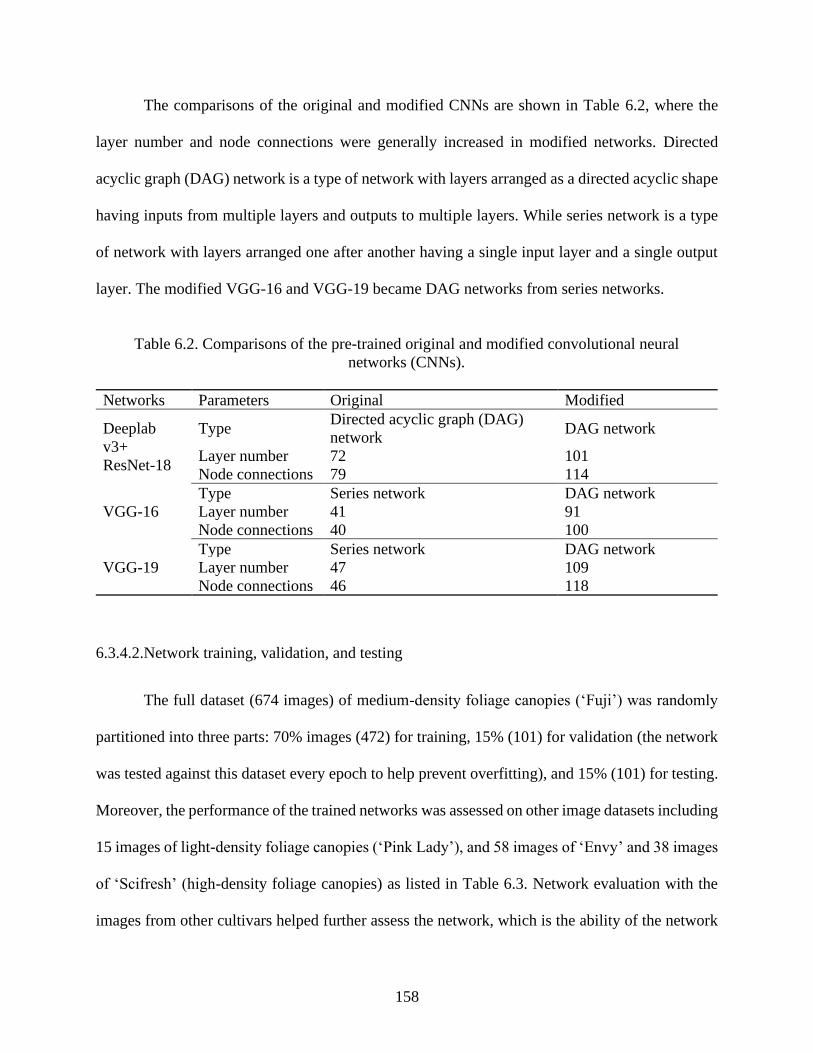
158
The comparisons of the original and modified CNNs are shown in Table 6.2, where the
layer number and node connections were generally increased in modified networks. Directed
acyclic graph (DAG) network is a type of network with layers arranged as a directed acyclic shape
having inputs from multiple layers and outputs to multiple layers. While series network is a type
of network with layers arranged one after another having a single input layer and a single output
layer. The modified VGG-16 and VGG-19 became DAG networks from series networks.
Table 6.2. Comparisons of the pre-trained original and modified convolutional neural
networks (CNNs).
Networks Parameters Original Modified
Deeplab
v3+
ResNet-18
Type Directed acyclic graph (DAG)
network DAG network
Layer number 72 101
Node connections 79 114
VGG-16
Type Series network DAG network
Layer number 41 91
Node connections 40 100
VGG-19
Type Series network DAG network
Layer number 47 109
Node connections 46 118
6.3.4.2.Network training, validation, and testing
The full dataset (674 images) of medium-density foliage canopies (‘Fuji’) was randomly
partitioned into three parts: 70% images (472) for training, 15% (101) for validation (the network
was tested against this dataset every epoch to help prevent overfitting), and 15% (101) for testing.
Moreover, the performance of the trained networks was assessed on other image datasets including
15 images of light-density foliage canopies (‘Pink Lady’), and 58 images of ‘Envy’ and 38 images
of ‘Scifresh’ (high-density foliage canopies) as listed in Table 6.3. Network evaluation with the
images from other cultivars helped further assess the network, which is the ability of the network

159
that extends its ‘learned patterns’ to analyze the kind of images that were not used during the
training process. The employed networks were fine-tuned individually and repeatedly using
stochastic gradient descent with momentum (SGDM) (Equation 6.1) as the optimization
(backpropagation learning) algorithm (Murphy, 2012) for all three networks. The training process
was completed when the validation accuracy converges. Some critical parameters defining the
network training process are listed in Table 6.4. One of the parameters is ‘initial learning rate’,
which determines the speed at which the training process progresses. If the learning rate is too low,
the training would take longer time, but if the learning rate is too high, the training may diverge
out of the optimal solution (LeCun et al., 2015). In this work, the learning rate was configured to
drop by a ‘drop factor’ after each interval of 10 epochs. ‘L2 regularization’ was another parameter,
which refers to weight decay that helps reduce the chances of network overfitting (Equations 6.2–
6.3). ‘Mini-batch size’ is the subset of image data that was used at each iteration, and ‘gradient
threshold’ was also used to stabilize the training process when a higher learning rate was employed.
Table 6.3. Image dataset for network training, validation, and testing.
Image Dataset Training
Dataset
Validation
Dataset
Testing
Dataset Total
Light Pink Lady - - 15 15
Medium Fuji 472 (70%) 101 (15%) 101 (15%) 674
High Envy - - 58 58
Scifresh - - 38 38
Total 472 101 212 785
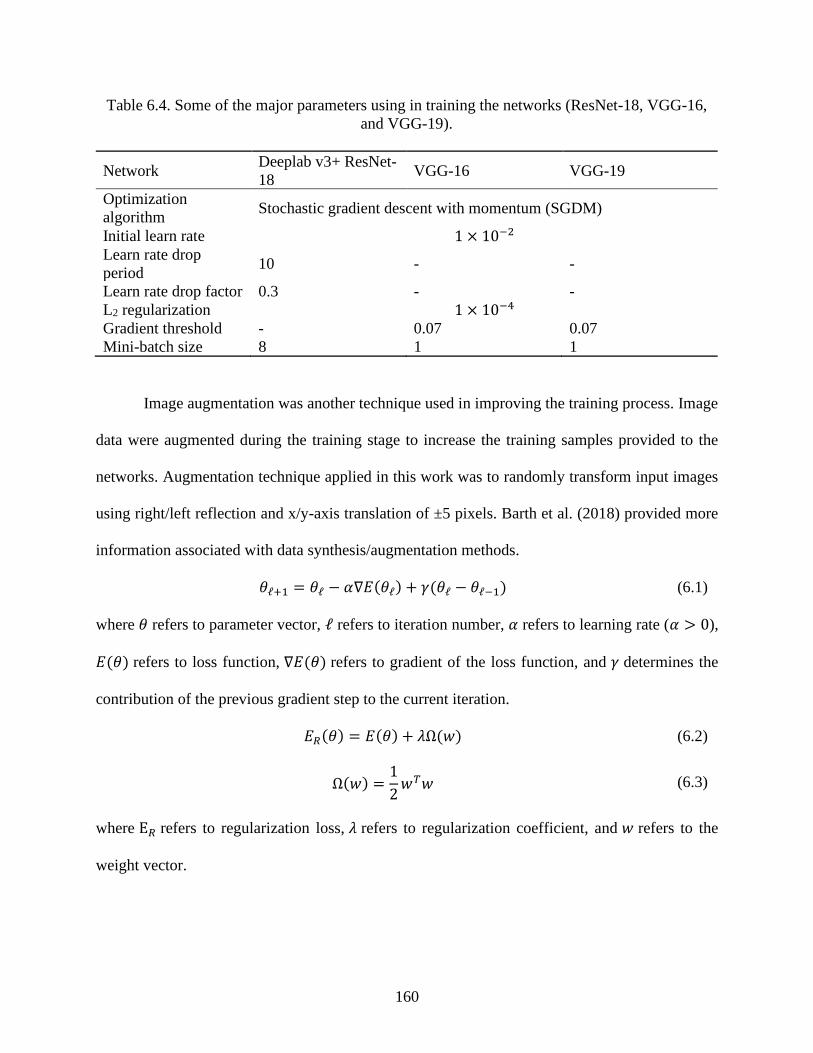
160
Table 6.4. Some of the major parameters using in training the networks (ResNet-18, VGG-16,
and VGG-19).
Network Deeplab v3+ ResNet-
18 VGG-16 VGG-19
Optimization
algorithm Stochastic gradient descent with momentum (SGDM)
Initial learn rate 1 × 10⁻²
Learn rate drop
period 10 - -
Learn rate drop factor 0.3 - -
L2 regularization 1 × 10⁻⁴
Gradient threshold - 0.07 0.07
Mini-batch size 8 1 1
Image augmentation was another technique used in improving the training process. Image
data were augmented during the training stage to increase the training samples provided to the
networks. Augmentation technique applied in this work was to randomly transform input images
using right/left reflection and x/y-axis translation of ±5 pixels. Barth et al. (2018) provided more
information associated with data synthesis/augmentation methods.
𝜃ℓ+1 = 𝜃ℓ − 𝛼∇𝐸(𝜃ℓ) + 𝛾(𝜃ℓ − 𝜃ℓ−1) (6.1)
where 𝜃 refers to parameter vector, ℓ refers to iteration number, 𝛼 refers to learning rate (𝛼 > 0),
𝐸(𝜃) refers to loss function, ∇𝐸(𝜃) refers to gradient of the loss function, and 𝛾 determines the
contribution of the previous gradient step to the current iteration.
𝐸𝑅(𝜃) = 𝐸(𝜃) + 𝜆Ω(𝑤) (6.2)
Ω(𝑤) =1
2𝑤𝑇𝑤 (6.3)
where E𝑅 refers to regularization loss, 𝜆 refers to regularization coefficient, and 𝑤 refers to the
weight vector.

161
6.3.4.3.Network evaluation
Once the network was completely trained and validated, the performance of the network
on the test dataset was evaluated using region-based measures (normalized confusion matrix (C),
per-class accuracy (PcA), per-image/mean intersection over union (IoU) or Jaccard index) and the
contour-based measure (per-image/mean boundary-F1 score (BFScore), Csurka et al., 2013). The
confusion matrix is a table that shows the quality of a classification task over a dataset. In semantic
segmentation study like this, the diagonal elements of the confusion matrix refer to the number of
pixels that were correctly classified into the true classes based on the ground-truth labels. On the
other hand, the off-diagonal elements refer to the number of pixels that were incorrectly classified
into the corresponding classes. Therefore, the higher the diagonal values, the better predictive
results obtained. The normalized confusion matrix provides a visual interpretation of the
percentages of those values over the true number of pixels in the given classes, which is more
revealing when the number of pixels in each class are imbalanced (e.g., in Figure 6.5, the number
of pixels of leaves (background) is much greater than that of trunk, branches, and apples). PcA
measures the proportion of correctly classified pixels for each class and provides the average value
over all classes based on the normalized confusion matrix. This measure gives a general
information on how accurate the prediction could be. However, it has significant drawbacks for
the dataset with a large background class, e.g., ‘leaves’ in this study, because the background class
could absorb false predictions with no influence on other object class accuracies (e.g., trunks,
branches, and apples). Hence, some more representative measures are necessary to further assess
the network performance.
In comparison to traditional measure of PcA, IoU have been recognized as one of the more
efficient measures for assessing segmentation performance and has been widely used in recent

162
years. IoU measures the intersection over the union between predicted classes and the ground-truth
labels (i.e., the area of overlap over the area of union) for each class and averages the results
(Equations 6.4–6.6) (Csurka et al., 2013). In this work, both per-image and mean IoU were
reported.
𝐼𝑜𝑈 =∑
𝑪𝒊𝒊𝑮𝒊 + 𝑷𝒊 − 𝑪𝒊𝒊
𝑁𝑖=1
𝑁
(6.4)
𝑮𝒊 = ∑ 𝑪𝒊𝒋𝑁
𝑗=1 (6.5)
𝑷𝒋 = ∑ 𝑪𝒊𝒋𝑖
(6.6)
where 𝑁 refers to the number of classes, C refers to the pixel-level confusion matrix as discussed
above, 𝑪𝒊𝒊 refers to the number of pixels with both ground-truth label and prediction label being
i,𝑪𝒊𝒋 refers to the number of pixels with ground-truth label i but whose prediction label is j, 𝑮𝒊
refers to the total number of pixels labelled with i, 𝑷𝒊 and 𝑷𝒋 refer to the total number of pixels
predicted as i and j, respectively. IoU was also weighted (weighted IoU) by the number of pixels
in respective classes (see Subsection 6.3.3).
Although IoU provides a comparatively more representative measure in assessing the
performance of the segmentation models, it also holds a limitation in terms of representing
segmentation (class) boundaries. The contour-based measure of mean BFScore is used widely in
representing class boundaries between the ground-truth and predicted classes in semantic
segmentation. Precision (𝑃𝑐) and recall (𝑅𝑐) are used in estimating BFScore (Equations 6.7–6.9)
(Csurka et al., 2013). In this work, both per-image and mean BFScore were reported.
𝐹1𝑐 =
2 ∙ 𝑃𝑐 ∙ 𝑅𝑐
𝑅𝑐 + 𝑃𝑐 (6.7)

163
𝑃𝑐 =𝑇𝑃
𝑇𝑃 + 𝐹𝑃 (6.8)
𝑅𝑐 =𝑇𝑃
𝑇𝑃 + 𝐹𝑁 (6.9)
where c refers to a class, TP refers to true positives, FP refers to false positives, and FN refers to
false negatives in the classification/segmentation results.
6.3.5. Estimating shaking locations
Once the target classes of ‘branches’ and ‘trunks’ were successfully segmented and
identified, suitable shaking locations were estimated on those branches based on effective selection
rules created in the past. He et al. (2019) tested two different shaking locations on the same tree
architecture and found that shaking at the branch bases (i.e., the location of tree branches right next
to the trunk) was more effective in removing fruits compared to shaking at the middle of the
branches. Therefore, shaking points were selected at the bases of individual branches of ‘Fuji’
apple canopies as an example using the estimation strategy illustrated in Figure 6.8. Such
procedures could also be extended to other apple cultivars described in this study. The major steps
included:
I. Obtain binary masks of ‘branches’ and ‘trunks’ (1,920×1,080 pixels) on ‘Fuji’ apple based
on the segmentation results generated by trained CNNs described above. To decrease the
noise of masks, a morphological operation was performed to remove the objects containing
fewer than 600 pixels for both classes. Rest of all pixel coordinates of object masks are
extracted for fitting polynomial curves for ‘branches’ (Equation 6.10) and ‘trunks’
(Equation 6.11), respectively. The performance of curve fitting was assessed using R2.

164
When all curves are mapped together, the intersections of curves (𝑥𝑖 , 𝑦𝑖) are calculated
using these two equations:
𝑓(𝑥) = 𝑝𝑛𝑥𝑛 + 𝑝𝑛−1𝑥
𝑛−1 +⋯+ 𝑝2𝑥2 + 𝑝1𝑥 + 𝑝0 (6.10)
𝑓(𝑦) = 𝑞𝑛𝑦𝑛 + 𝑞𝑛−1𝑦
𝑛−1 +⋯+ 𝑞2𝑦2 + 𝑞1𝑦 + 𝑞0 (6.11)
where x represents the pixel coordinates along x-axis in an image, y represents the pixel
coordinates along y-axis in an image, n represents the degree of a polynomial, p and q are
real numbers and represent the coefficients of the polynomial.
II. Calculate mean thicknesses of ‘trunks’ (𝑑𝑡´ , along x-axis) and ‘branches’ (𝑑�́�, along y-axis)
in terms of number of pixels based on the masks (Equations 6.12–6.13):
𝑑𝑡̀ =1
𝑦∑𝑑𝑥
𝑦
𝑖=1
(6.12)
𝑑�̀� =1
𝑥∑𝑑𝑦
𝑥
𝑖=1
(6.13)
where t refers to ‘trunks’, b refers to ‘branches’, 𝑑𝑡̀ is used for detecting the base shaking
points by estimating the nearest ‘branches’ locations to ‘trunks’ (𝑥𝑎, 𝑦𝑎 ) based on the
algorithm, 𝑑�̀� is used for calculating the error tolerance of the detected shaking points along
y-axis (𝑦𝑒𝑟𝑟𝑜𝑟; solved in Equation 6.14 below):
𝑦𝑒𝑟𝑟𝑜𝑟 = ±𝑑�̀�2
(6.14)
III. Selecting the shaking points (𝑥𝑚, 𝑦𝑚) manually and comparing with the points selected by
the algorithm, with an assumption of 𝑥𝑎 = 𝑥𝑚. The author of this study (with expertise and
experience in operating shake-and-catch apple harvester) subjectively selected the suitable
165
shaking points near branch bases using the segmented images (i.e., tree ‘trunks’ and
‘branches’). The selection criterion is simple: finding a point on each segmented ‘branches’
wherever is nearest to the segmented ‘trunks’ based on the observation of segmentation
results. The assumption proposed above is always valid because, in some cases, some parts
of ‘branches’ were occluded by other objects, such as ‘leaves’ and ‘apples’. While this
evaluation process did not intend to solve such problems. The position difference on y-axis
could thus be calculated (Equation 6.15) and compared with the error tolerance solving
Equation 6.14. Finally, the performance of algorithm-based shaking point selection is
reported as “good” or “poor” according to Equation 6.16. In total, 20 test images of ‘Fuji’
were randomly selected for evaluation purposes.
𝑦𝑑 = |𝑦𝑎 − 𝑦𝑚| (6.15)
{𝑦𝑑 ≤ 𝑦𝑒𝑟𝑟𝑜𝑟𝑦𝑑 > 𝑦𝑒𝑟𝑟𝑜𝑟
(6.16)
where m refers to manual-based, d represents the difference between algorithm-based and
manual-based selections along y-axis. One shaking point was detected for each branch.
Therefore, six shaking points were included in an image in this study. The number of pixels
was used as measurement unit during the evaluation process.

166
Figure 6.8. Flow chart of the shaking points detection technique using the segmented classes
of ‘branches’ and ‘trunks’.
6.4. Results and Discussion
6.4.1. Training and validation on ‘Fuji’ dataset
In general, the dataset of medium foliage density apple cultivar of ‘Fuji’ was used to train
and validate the three CNNs. Among the networks tested, a relatively higher validation (per-class)
accuracy of ~95% was achieved by ResNet-18 with a lower loss value of 0.11 using 540×960
image size (Table 6.5). Comparatively, both VGG-16 and VGG-19 were found to achieve slightly
lower validation accuracies (93%–94%) and greater loss values (0.13–0.14) with the same set of
image size. In terms of computational time, only about half and one-third of the time was consumed

167
by ResNet-18 (6,912 s) for training and validation compared to other two networks on a single
GPU. This was mainly due to its DAG network architecture as described in Subsection 6.3.4.1 as
well as it lacked the fully connected layers (Chen et al., 2018), which potentially slow down the
processing speed of the networks because of every input is connected to every output by specific
weights. In addition, two different input image sizes (1,080×1,920 vs. 540×960) were used and the
performance was compared using ResNet-18 (Table 6.5). Clearly, the results revealed that a higher
accuracy could be achieved using higher resolution images (96% of validation accuracy and 0.08
loss value). However, it also took about eight times longer to finish the entire process.
Table 6.5. Training and validation results of ResNet-18, VGG-16, and VGG-19.
Results Deeplab v3+ ResNet-18 VGG-16 VGG-19
Image size (pixel) 1,080×1,920 540×960 540×960 540×960
Validation accuracya
(%) 96.00 94.74 93.39 94.11
Validation loss 0.08 0.11 0.14 0.13
Elapsed time (s) 57,050.67 6,912.00 12,347.93 17,589.99 aAccuracy refers to overall per-class accuracy (PcA).
6.4.2. Testing on ‘Fuji’ dataset
The trained networks were then tested on 15% of unseen image dataset on ‘Fuji’ cultivar.
Figure 6.9 visualized the results of a test image, which was successfully segmented into the four
target classes: i.e., ‘branches’ in yellow, ‘apples’ in red, ‘leaves (background)’ in blue, and ‘trunks’
in white (Figure 6.9a–d; left). It was observed that, as expected, ResNet-18 with original image
size performed the best in terms of segmenting the images as well as preserving the boundary
information of objects (Figure 6.9a). To compare the segmentation details, zoomed-in views were
presented in Figure 6.9e, which showed that ResNet-18 performed better than VGG-16 and VGG-
19 regarding the smoothness of the boundary information, especially with ‘trunks’ and ‘branches’
boundaries on resized images. Meanwhile, these two classes were deemed highly important to

168
achieve the overall research goal of mechanical apple harvesting – where tree trunks or branches
need to be accurately identified and located. Test results were then compared against the ground-
truth data (Figure 6.9a–d; right), where the misclassified pixel-regions (false positives) were
highlighted in both magenta and green colors. The results showed that most misclassified regions
were found with VGGs (with reduced size pixel resolution), particularly the regions closer to the
tree branches, whereas ResNet-18 performed the best when images with original pixel resolution
were used. With ResNet-18, most of the image pixels were accurately classified into the
corresponding classes (Figure 6.10) leading to ~99% of ‘trunks’ pixels correctly predicted as
‘trunks’ (true class), followed by ‘apples’ class (98%). True prediction for branches was slightly
lower than that for trunks and apples, which might be because of lower percentage of pixels
belonging to ‘branches’ class (1.15%) compared to ‘trunks’ (1.25%) and ‘apples’ (6.20%) in the
images (Figure 6.5). In addition, highly distinct color feature (red) and shape feature (round) could
be found with ‘apples’ class. Two of the most common misclassifications were found between
‘branches’ and ‘leaves’, mutually, due to the similarities of class features, such as color and texture.
(a)
(b)

169
(c)
(d)
(e)
Figure 6.9. Examples of segmentation results with test images (left) using Deeplab v3+
ResNet-18 with original image size (a) and with resized images (b), VGG-16 (c), VGG-19 (d),
along with comparison of test result and ground-truth (magenta and green regions highlighted
the areas where the segmented image varies from the ground-truth image; right), and local
boundary information of segmentation results (e) (left to right correspond sequentially to cases
from Figure 6.9a–d).

170
Figure 6.10. Normalized confusion matrix (%) comprising the true class (vertical axis) and the
predicted class (horizontal axis) formed using the segmentation results generated by modified
Deeplab v3+ ResNet-18. The results used were generated using images with original pixel
resolution.
As discussed in the methods section, IoU and BFScore were used, in addition to per class
accuracy, to improve the insights into the network performance. These two measures were also
estimated with the test dataset (15% of total images (101 images) collected in a ‘Fuji’ orchard with
medium foliage density). Mean IoU and BFScore per image obtained with the three CNNs on
images with two different pixel resolution were presented in Figure 6.11. Clearly, ResNet-18,
again, achieved the best results on both using full resolution images. For all images, mean IoU per-
image was found to be 0.62 or higher (Figure 6.11a) and the mean BFScore per-image was found
to be 0.80 or higher (Figure 6.11b).
In contrast, all three CNNs achieved relatively lower IoU and BFScore with resized (lower
resolution) images. For example, ResNet-18 achieved IoU of 0.62 or more for only about 76% of
the test images (77 images out of 101), which was true for all the images when higher pixel
resolution was used (Figure 6.11c, e, g). The results also showed that ResNet-18 performed
substantially better (with both original and reduced resolution images) than VGGs in terms of
reproducing the overlapped areas between prediction and ground-truth data, where VGG-16 had
the worst performance. In terms of BFScore, about 88% (89 images) were found to have 0.80 or
higher mean BFScore with ResNet-18, which was slightly better than the same achieved with
VGGs. The results indicated that ResNet-18 was better in preserving the boundary information of
objects (visualized in Figure 6.9e) with either image size, followed by VGG-19.

171
(a) (b)
(c) (d)
(e) (f)
(g) (h)
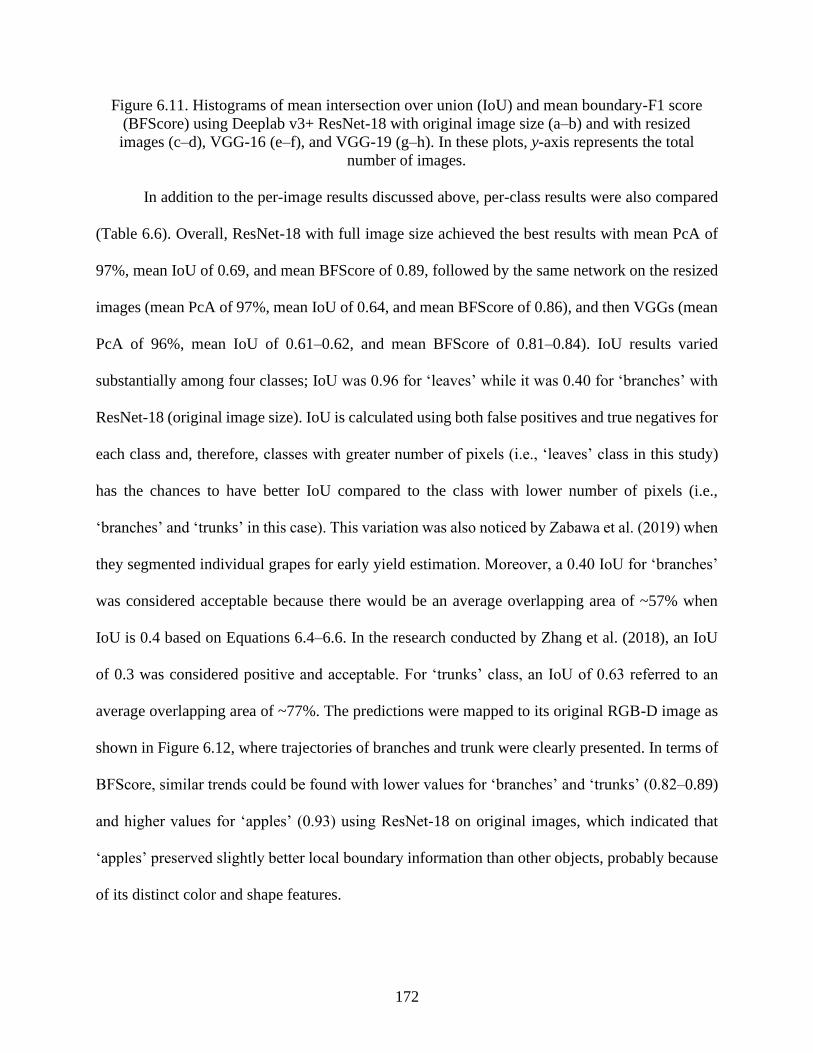
172
Figure 6.11. Histograms of mean intersection over union (IoU) and mean boundary-F1 score
(BFScore) using Deeplab v3+ ResNet-18 with original image size (a–b) and with resized
images (c–d), VGG-16 (e–f), and VGG-19 (g–h). In these plots, y-axis represents the total
number of images.
In addition to the per-image results discussed above, per-class results were also compared
(Table 6.6). Overall, ResNet-18 with full image size achieved the best results with mean PcA of
97%, mean IoU of 0.69, and mean BFScore of 0.89, followed by the same network on the resized
images (mean PcA of 97%, mean IoU of 0.64, and mean BFScore of 0.86), and then VGGs (mean
PcA of 96%, mean IoU of 0.61–0.62, and mean BFScore of 0.81–0.84). IoU results varied
substantially among four classes; IoU was 0.96 for ‘leaves’ while it was 0.40 for ‘branches’ with
ResNet-18 (original image size). IoU is calculated using both false positives and true negatives for
each class and, therefore, classes with greater number of pixels (i.e., ‘leaves’ class in this study)
has the chances to have better IoU compared to the class with lower number of pixels (i.e.,
‘branches’ and ‘trunks’ in this case). This variation was also noticed by Zabawa et al. (2019) when
they segmented individual grapes for early yield estimation. Moreover, a 0.40 IoU for ‘branches’
was considered acceptable because there would be an average overlapping area of ~57% when
IoU is 0.4 based on Equations 6.4–6.6. In the research conducted by Zhang et al. (2018), an IoU
of 0.3 was considered positive and acceptable. For ‘trunks’ class, an IoU of 0.63 referred to an
average overlapping area of ~77%. The predictions were mapped to its original RGB-D image as
shown in Figure 6.12, where trajectories of branches and trunk were clearly presented. In terms of
BFScore, similar trends could be found with lower values for ‘branches’ and ‘trunks’ (0.82–0.89)
and higher values for ‘apples’ (0.93) using ResNet-18 on original images, which indicated that
‘apples’ preserved slightly better local boundary information than other objects, probably because
of its distinct color and shape features.

173
Table 6.6. Network evaluations in terms of per-class accuracy (PcA), intersection over union
(IoU), and boundary F1-score (BFScore).
Evaluatio
n Measure PcA (%) IoU BFScore
Network Deeplab v3+
ResNet-18
VGG
-16
VGG
-19
Deeplab v3+
ResNet-18
VGG
-16
VGG
-19
Deeplab v3+
ResNet-18
VGG
-16
VGG
-19
Image
sizea Full Redu
ced
Redu
ced
Redu
ced Full
Redu
ced
Redu
ced
Redu
ced Full
Redu
ced
Redu
ced
Redu
ced
Branches 96.60 95.54 94.55 94.62 0.40 0.30 0.27 0.30 0.82 0.75 0.69 0.74
Apples 98.46 97.59 97.68 97.46 0.78 0.76 0.70 0.71 0.93 0.93 0.89 0.91
Leaves 95.74 94.45 93.06 93.72 0.96 0.94 0.93 0.94 0.92 0.90 0.87 0.89
Trunk 98.60 98.47 97.16 97.96 0.63 0.58 0.54 0.54 0.89 0.87 0.81 0.83
Mean 97.35 96.51 95.61 95.94 0.69 0.64 0.61 0.62 0.89 0.86 0.81 0.84
Weighted - - - - 0.94 0.92 0.90 0.91 - - - -
Computati
onal
speedb per
image (s)
1.29
±0.10
0.35
±0.05
0.44
±0.04
0.47
±0.03 - - - - - - - -
aFull and reduced image sizes referred to 1,080×1,920 and 540×960 pixels, respectively. bComputational speed was calculated based on randomly tested 10 images (mean ±standard deviation) for each
network.
Figure 6.12. Example of segmented trunk (in red) and branches (in yellow) mapped onto its
RGB-D image.
When the best performing model (ResNet-18 with original image resolution) and the worst
performing model (VGG-16 with reduced image resolution) were compared on ‘Fuji’ canopy
images (medium density foliage), it was found that the segmentation results of ‘branches’ and
‘trunks’ were remarkably different. However, the segmentation results for ‘apples’ and ‘leaves’
were found to be only marginally different. For example, IoUs of ‘branches’ and ‘trunks’ increased
from 0.27 to 0.40 (by 48%) and from 0.54 to 0.63 (by 17%), while IoUs of ‘apples’ and ‘leaves’
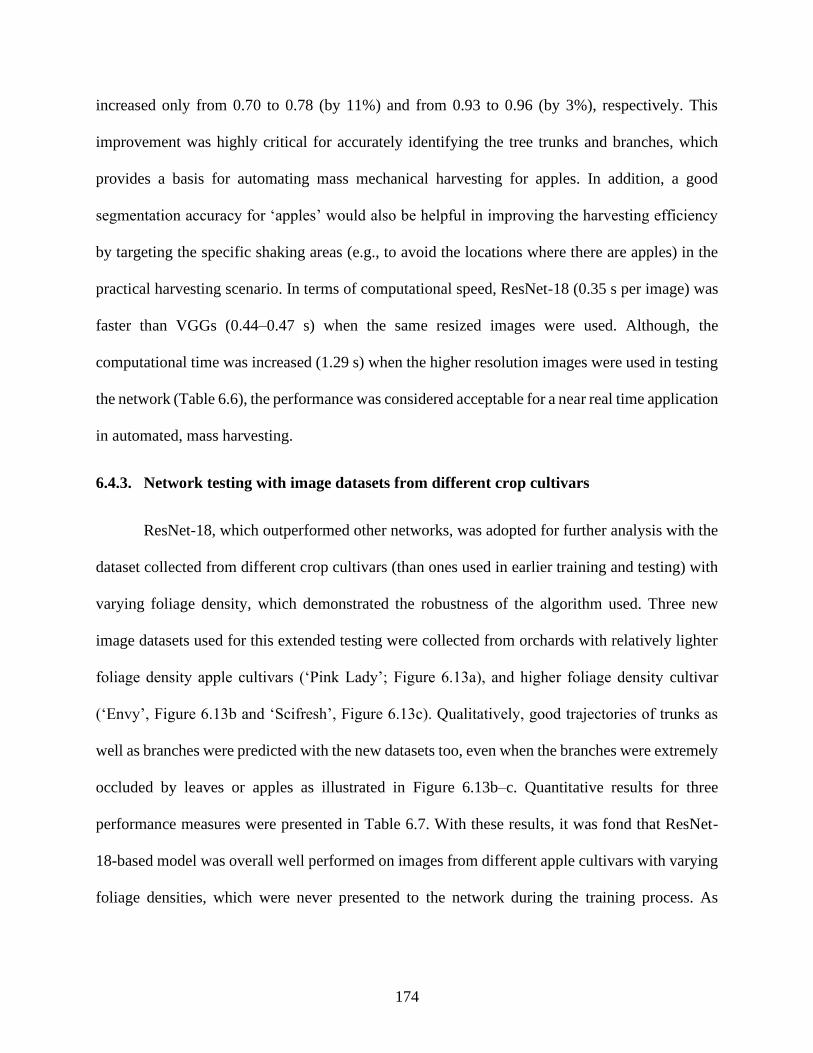
174
increased only from 0.70 to 0.78 (by 11%) and from 0.93 to 0.96 (by 3%), respectively. This
improvement was highly critical for accurately identifying the tree trunks and branches, which
provides a basis for automating mass mechanical harvesting for apples. In addition, a good
segmentation accuracy for ‘apples’ would also be helpful in improving the harvesting efficiency
by targeting the specific shaking areas (e.g., to avoid the locations where there are apples) in the
practical harvesting scenario. In terms of computational speed, ResNet-18 (0.35 s per image) was
faster than VGGs (0.44–0.47 s) when the same resized images were used. Although, the
computational time was increased (1.29 s) when the higher resolution images were used in testing
the network (Table 6.6), the performance was considered acceptable for a near real time application
in automated, mass harvesting.
6.4.3. Network testing with image datasets from different crop cultivars
ResNet-18, which outperformed other networks, was adopted for further analysis with the
dataset collected from different crop cultivars (than ones used in earlier training and testing) with
varying foliage density, which demonstrated the robustness of the algorithm used. Three new
image datasets used for this extended testing were collected from orchards with relatively lighter
foliage density apple cultivars (‘Pink Lady’; Figure 6.13a), and higher foliage density cultivar
(‘Envy’, Figure 6.13b and ‘Scifresh’, Figure 6.13c). Qualitatively, good trajectories of trunks as
well as branches were predicted with the new datasets too, even when the branches were extremely
occluded by leaves or apples as illustrated in Figure 6.13b–c. Quantitative results for three
performance measures were presented in Table 6.7. With these results, it was fond that ResNet-
18-based model was overall well performed on images from different apple cultivars with varying
foliage densities, which were never presented to the network during the training process. As
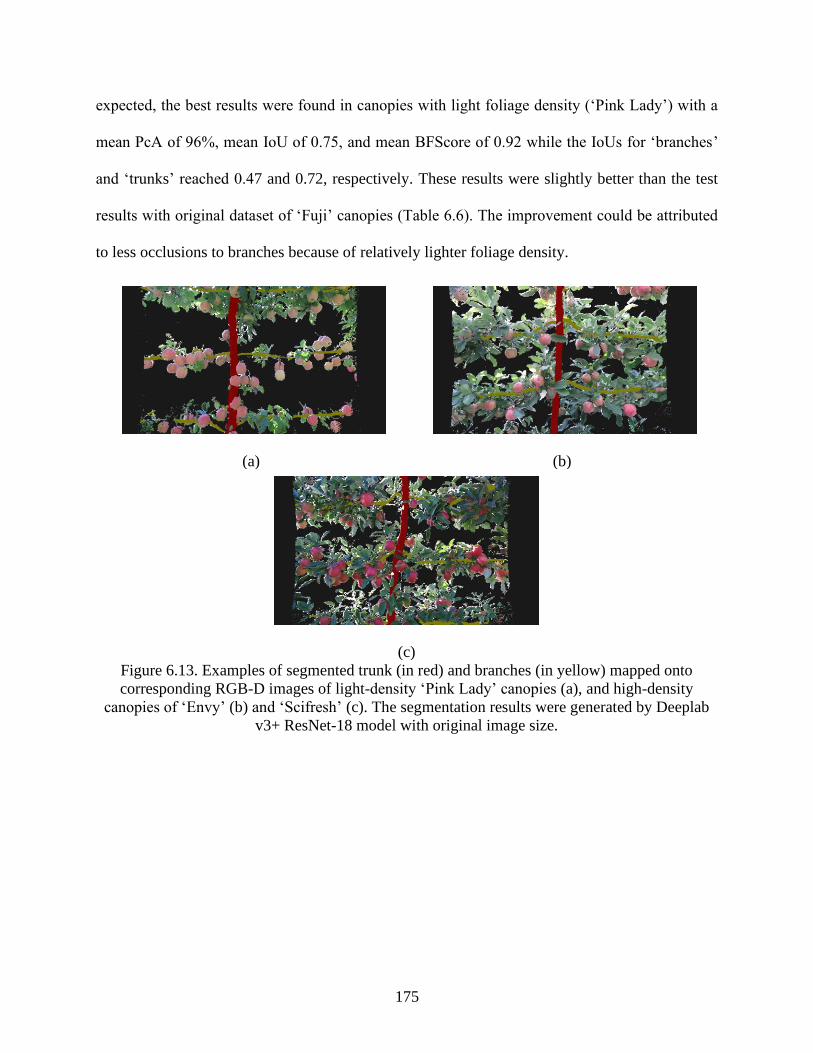
175
expected, the best results were found in canopies with light foliage density (‘Pink Lady’) with a
mean PcA of 96%, mean IoU of 0.75, and mean BFScore of 0.92 while the IoUs for ‘branches’
and ‘trunks’ reached 0.47 and 0.72, respectively. These results were slightly better than the test
results with original dataset of ‘Fuji’ canopies (Table 6.6). The improvement could be attributed
to less occlusions to branches because of relatively lighter foliage density.
(a) (b)
(c)
Figure 6.13. Examples of segmented trunk (in red) and branches (in yellow) mapped onto
corresponding RGB-D images of light-density ‘Pink Lady’ canopies (a), and high-density
canopies of ‘Envy’ (b) and ‘Scifresh’ (c). The segmentation results were generated by Deeplab
v3+ ResNet-18 model with original image size.
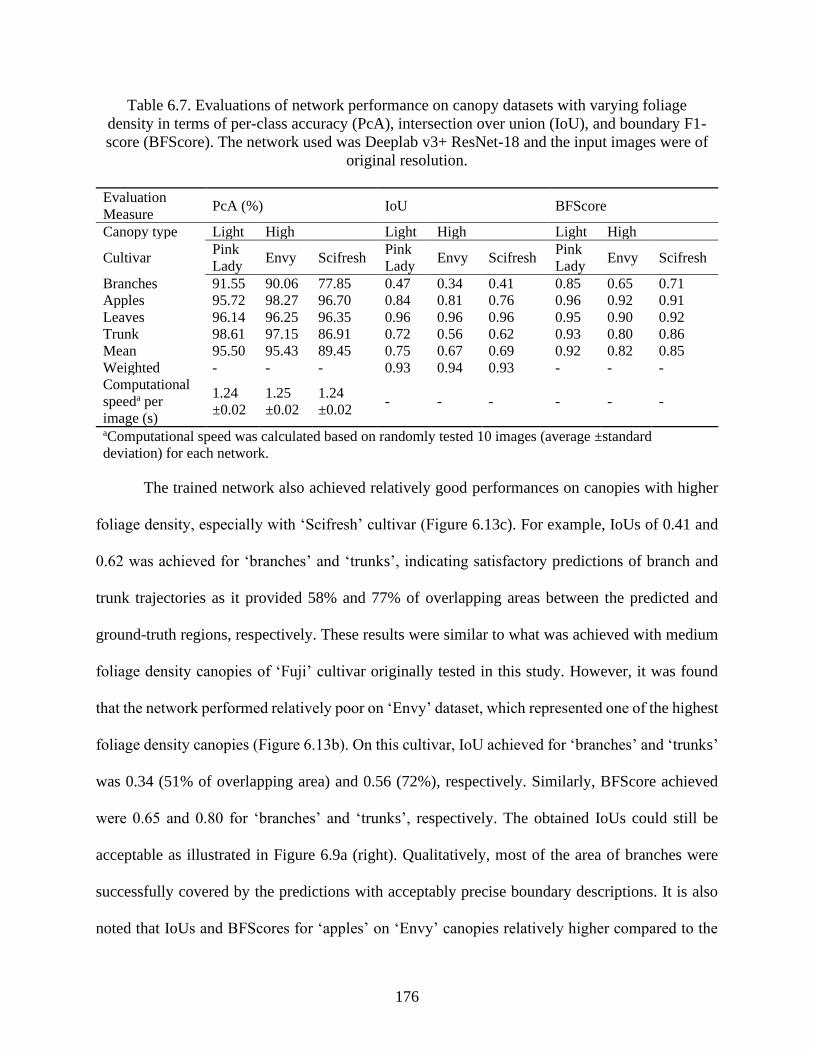
176
Table 6.7. Evaluations of network performance on canopy datasets with varying foliage
density in terms of per-class accuracy (PcA), intersection over union (IoU), and boundary F1-
score (BFScore). The network used was Deeplab v3+ ResNet-18 and the input images were of
original resolution.
Evaluation
Measure PcA (%) IoU BFScore
Canopy type Light High Light High Light High
Cultivar Pink
Lady Envy Scifresh
Pink
Lady Envy Scifresh
Pink
Lady Envy Scifresh
Branches 91.55 90.06 77.85 0.47 0.34 0.41 0.85 0.65 0.71
Apples 95.72 98.27 96.70 0.84 0.81 0.76 0.96 0.92 0.91
Leaves 96.14 96.25 96.35 0.96 0.96 0.96 0.95 0.90 0.92
Trunk 98.61 97.15 86.91 0.72 0.56 0.62 0.93 0.80 0.86
Mean 95.50 95.43 89.45 0.75 0.67 0.69 0.92 0.82 0.85
Weighted - - - 0.93 0.94 0.93 - - -
Computational
speeda per
image (s)
1.24
±0.02
1.25
±0.02
1.24
±0.02 - - - - - -
aComputational speed was calculated based on randomly tested 10 images (average ±standard
deviation) for each network.
The trained network also achieved relatively good performances on canopies with higher
foliage density, especially with ‘Scifresh’ cultivar (Figure 6.13c). For example, IoUs of 0.41 and
0.62 was achieved for ‘branches’ and ‘trunks’, indicating satisfactory predictions of branch and
trunk trajectories as it provided 58% and 77% of overlapping areas between the predicted and
ground-truth regions, respectively. These results were similar to what was achieved with medium
foliage density canopies of ‘Fuji’ cultivar originally tested in this study. However, it was found
that the network performed relatively poor on ‘Envy’ dataset, which represented one of the highest
foliage density canopies (Figure 6.13b). On this cultivar, IoU achieved for ‘branches’ and ‘trunks’
was 0.34 (51% of overlapping area) and 0.56 (72%), respectively. Similarly, BFScore achieved
were 0.65 and 0.80 for ‘branches’ and ‘trunks’, respectively. The obtained IoUs could still be
acceptable as illustrated in Figure 6.9a (right). Qualitatively, most of the area of branches were
successfully covered by the predictions with acceptably precise boundary descriptions. It is also
noted that IoUs and BFScores for ‘apples’ on ‘Envy’ canopies relatively higher compared to the
177
same with ‘Scifresh’. This result was potentially caused by more similar fruit color and size
between ‘Envy’ and ‘Fuji’ compared to the same between ‘Scifresh’ and ‘Fuji’. Regarding the
computational speed, overall about 1.24–1.25 s per image was taken by the network to process one
image, which was similar for images collected for all kinds of canopies (Figure 6.13b–c; Figure
6.12; Table 6.7).
Although it was important to test the implementation of the trained networks on datasets
never previously seen by the network for demonstrating the robustness of the model, only about
20% of the published studies have been reported with the adoption of network test measures (i.e.,
test outside of the current dataset) like this based on Kamilaris and Prenafeta-Boldú (2018).
Overall, it was found that the modified, fine-tuned ResNet-18 could generally be used as a robust,
and generic model to segment out canopy images from varying cropping system and environmental
conditions including crop canopies with light to medium/high densities. All three foliage density
levels primarily represented the overall canopy conditions of formally trained tree architectures in
Pacific Northwest region of the United States, where ‘Scifresh’ was considered as one of the
highest foliage density canopies in the region. Therefore, the annotated image dataset in this study
could be further utilized to either train other potential CNNs or reproduce the results with the same
networks discussed above for any other branches, trunk, or apples identification tasks in
agricultural field (WSU Research Exchange URI: http://hdl.handle.net/2376/17529).
6.4.4. Estimation of shaking locations
An algorithm was developed to detect the shaking locations near branch bases as illustrated
in Figure 6.8. Since the polynomial curves are often adopted to represent irregular curves (Zhang
et al., 2018), therefore, they are considered to fit the tree ‘trunks’ and ‘branches’, the first step was
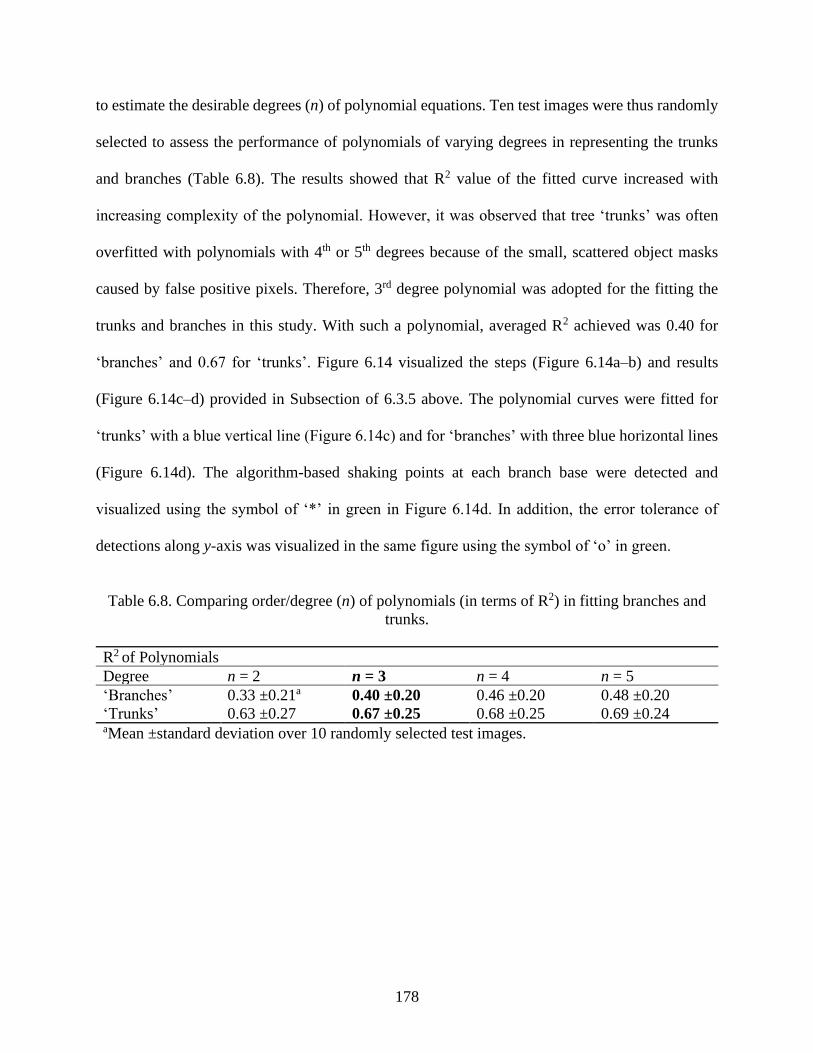
178
to estimate the desirable degrees (n) of polynomial equations. Ten test images were thus randomly
selected to assess the performance of polynomials of varying degrees in representing the trunks
and branches (Table 6.8). The results showed that R2 value of the fitted curve increased with
increasing complexity of the polynomial. However, it was observed that tree ‘trunks’ was often
overfitted with polynomials with 4th or 5th degrees because of the small, scattered object masks
caused by false positive pixels. Therefore, 3rd degree polynomial was adopted for the fitting the
trunks and branches in this study. With such a polynomial, averaged R2 achieved was 0.40 for
‘branches’ and 0.67 for ‘trunks’. Figure 6.14 visualized the steps (Figure 6.14a–b) and results
(Figure 6.14c–d) provided in Subsection of 6.3.5 above. The polynomial curves were fitted for
‘trunks’ with a blue vertical line (Figure 6.14c) and for ‘branches’ with three blue horizontal lines
(Figure 6.14d). The algorithm-based shaking points at each branch base were detected and
visualized using the symbol of ‘*’ in green in Figure 6.14d. In addition, the error tolerance of
detections along y-axis was visualized in the same figure using the symbol of ‘o’ in green.
Table 6.8. Comparing order/degree (n) of polynomials (in terms of R2) in fitting branches and
trunks.
R2 of Polynomials
Degree n = 2 n = 3 n = 4 n = 5
‘Branches’ 0.33 ±0.21a 0.40 ±0.20 0.46 ±0.20 0.48 ±0.20
‘Trunks’ 0.63 ±0.27 0.67 ±0.25 0.68 ±0.25 0.69 ±0.24 aMean ±standard deviation over 10 randomly selected test images.
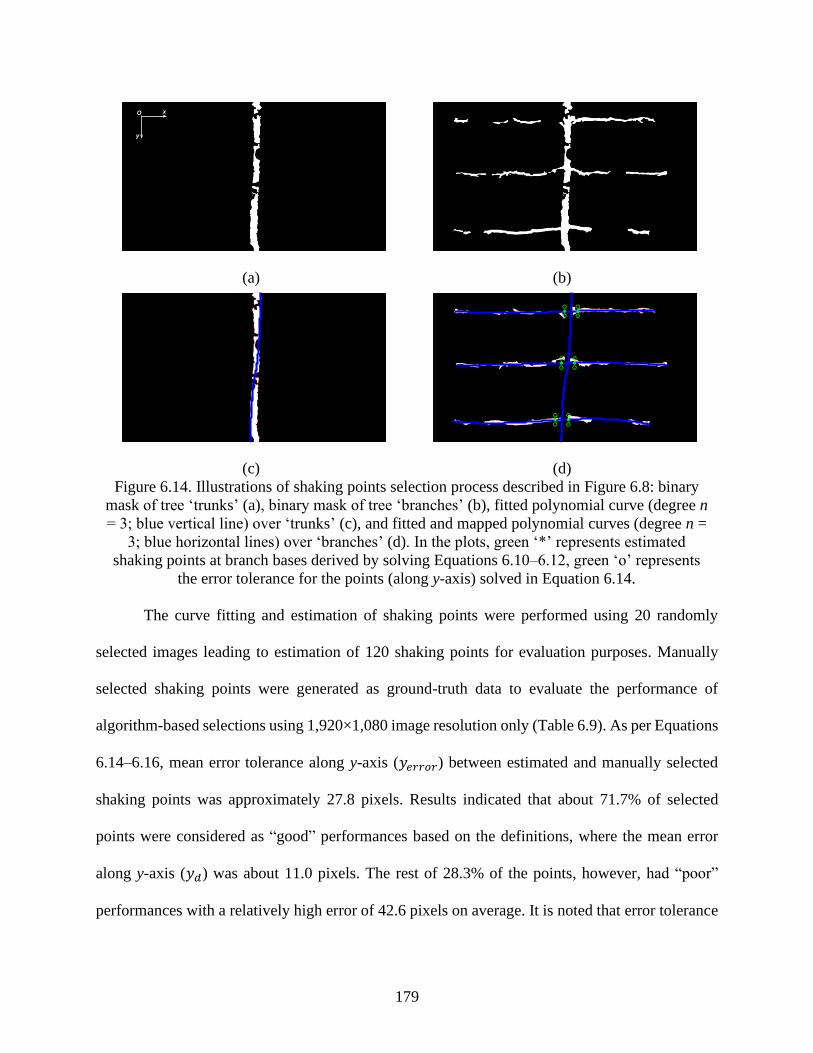
179
(a) (b)
(c) (d)
Figure 6.14. Illustrations of shaking points selection process described in Figure 6.8: binary
mask of tree ‘trunks’ (a), binary mask of tree ‘branches’ (b), fitted polynomial curve (degree n
= 3; blue vertical line) over ‘trunks’ (c), and fitted and mapped polynomial curves (degree n =
3; blue horizontal lines) over ‘branches’ (d). In the plots, green ‘*’ represents estimated
shaking points at branch bases derived by solving Equations 6.10–6.12, green ‘o’ represents
the error tolerance for the points (along y-axis) solved in Equation 6.14.
The curve fitting and estimation of shaking points were performed using 20 randomly
selected images leading to estimation of 120 shaking points for evaluation purposes. Manually
selected shaking points were generated as ground-truth data to evaluate the performance of
algorithm-based selections using 1,920×1,080 image resolution only (Table 6.9). As per Equations
6.14–6.16, mean error tolerance along y-axis (𝑦𝑒𝑟𝑟𝑜𝑟) between estimated and manually selected
shaking points was approximately 27.8 pixels. Results indicated that about 71.7% of selected
points were considered as “good” performances based on the definitions, where the mean error
along y-axis (𝑦𝑑) was about 11.0 pixels. The rest of 28.3% of the points, however, had “poor”
performances with a relatively high error of 42.6 pixels on average. It is noted that error tolerance

180
could be increased for automated shake-and-catch harvesting by adopting wider grip in the shaking
end-effector, thus potentially avoiding or minimizing the impact of “poor” performance in shaking
point estimation. Lastly, the overall computational time was calculated for the entire process of
tree branches/trunks identification, curve fitting and shaking points selection (Table 6.10). It was
found that the curve fitting and shaking point selection (~1.3 s) took about the same time as CNNs-
based segmentation (~1.4 s) on average, therefore, approximately 2.7 s was needed in total per
image. Based on this results, it will take approximately 0.5 s per shaking point for image
processing, curve fitting and shaking point selection, which should be practically applicable for
near real time application in automated shake-and-catch harvesting as each shaking actuation cycle
would take at least 2 to 5 seconds (He et al., 2019).
Table 6.9. Evaluation of shaking point estimation algorithm against manually selected shaking
points.
‘Trunks’
Thicknessa (𝑑𝑡̀ )
‘Branches’
Thicknessa (𝑑�̀�)
Error Tolerancea
(𝑦𝑒𝑟𝑟𝑜𝑟)
Errora (𝑦𝑑)
Good Poor
111.31 ±33.19b 55.52 ±6.14 27.76 ±3.07 10.96 ±7.34 42.63 ±12.91
Overall percentage (%) 71.67 28.33 aAll units are in pixels (image resolution = 1,920×1,080). bMean ±standard deviation over 20 randomly selected test images where six shaking points
were evaluated per image.
Table 6.10. Computational time needed for the overall process of tree branches/trunks
identification and shaking points selection.
Computational Speed (s) Semantic Segmentation Curve Fitting Total
Per image 1.42 ±0.08a 1.31 ±0.21 2.73 ±0.25
Per shaking pointb 0.24 ±0.01 0.22 ±0.04 0.45 ±0.04 aMean ±standard deviation over 20 randomly selected test images. bSix shaking points were evaluated per image.

181
6.5. Conclusions
In this work, a complete pipeline work was first provided to identify tree branches and
trunks in canopies with varying foliage densities (trained to formal tree architectures) for
automated mass harvesting of apples. Machine vision system under natural field environment and
CNNs-based deep learning techniques (semantic segmentation) were employed. Four different
pixel classes were defined as ‘branches’, ‘trunks’, ‘apples’, and ‘leaves (background)’. A total of
674 images were acquired from a commercial ‘Fuji’ orchard with medium foliage density canopies.
These images (in full pixel resolution of 1,080×1,920 and reduced pixel resolution of 540×960)
were used to train, validate, and test three different CNNs, that were modified and pre-trained for
this work: Deeplab v3+ ResNet-18, VGG-16, and VGG-19. Moreover, to test the capability of the
trained network (ResNet-18 as it performed the best among three), new set of images were
collected in tree canopies with varying foliage densities (light to heavy foliage density offered by
‘Pink Lady’, ‘Envy’, and ‘Scifresh’ cultivars). The performance of these networks in image
segmentation was assessed and compared using the three common measures of PcA, IoU, and
BFScore on all test datasets. Finally, curve fitting technique was used to model tree
trunks/branches and estimate shaking points on those branches for automated shake-and-catch
harvesting. The estimated shaking points were compared against manually selected points on the
same images. Specific conclusions from this work are presented below:
• ResNet-18 using full image resolution performed the best among three CNNs tested in this
study with a mean PcA of 97%, mean IoU of 0.69, and mean BFScore of 0.89 per image
basis on images collected in the field environment in a ‘Fuji’ apple orchard. In terms of the
results per class basis, the network performance was acceptable (with a goal to achieve
182
automated shake-and-catch harvesting) in segmenting ‘branches’ and ‘trunks’ out (i.e., the
target object classes). For example, the IoUs for ‘branches’ and ‘trunks’ were 0.40 and
0.63, individually, which were 0.78 and 0.96 for ‘apples’ and ‘leaves’. The results were
considered satisfactory because they referred to a 57% and 77% overlap between predicted
and ground-truth segments for branches and trunks, which meant that the actual trajectories
of branches and trunks were well described. In addition, BFScores of 0.82 and 0.89 was
achieved for ‘branches’ and ‘trunks’, which also indicated good preservations of their local
boundary information.
• When the trained ResNet-18 was tested on images from different crop cultivars and canopy
types, it achieved the best results with ‘Pink Lady’ canopies of light foliage density, as
expected, with a mean PcA of 96%, mean IoU of 0.75, and mean BFScore of 0.92 per
image basis. In addition, the network performed satisfactorily with images from high
foliage density canopies, especially with ‘Scifresh’. For example, the IoUs for ‘branches’
and ‘trunks’ were 0.41 and 0.62, respectively, while the BFScores were 0.71 and 0.86 per
class basis in this case, which were similar to the test results from the original dataset (i.e.,
‘Fuji’ canopy images) with medium foliage density discussed above. The results showed a
good robustness of the trained network in automatically identifying the tree branches and
trunks for mass mechanical apple harvesting.
• For modeling the branches and trunks, 3rd degree polynomial equations were considered,
which achieved an R2 of 0.40 and 0.67 respectively for branches and trunks. The
polynomial model was then used in detecting shaking points in 20 randomly selected
images of ‘Fuji’ canopies (120 shaking points in 20 images). The estimated shaking
locations were compared with manual selections, which showed that about 72% of

183
selections were considered as “good” with the mean errors of 11 pixels along y-axis. Only
approximately 28% of selected shaking points were deemed “poor” due to the larger error
of ~43 pixels on average between algorithm-based and manual selections.
184
REFERENCES
Bargoti, S. and Underwood, J. (2016). Deep fruit detection in orchards. arXiv preprint arXiv:
1610.03677.
Bargoti, S. and Underwood, J. P. (2017). Image segmentation for fruit detection and yield
estimation in apple orchards. Journal of Field Robotics, 34(6), 1039–1060.
Barth, R., IJsselmuiden, J., Hemming, J., and Van Henten, E. J. (2018). Data synthesis methods
for semantic segmentation in agriculture: A capsicum annuum dataset. Computers and
Electronics in Agriculture, 144, 284–296.
Chen, L. C., Papandreou, G., Schroff, F., and Adam, H. (2017). Rethinking atrous convolution
for semantic image segmentation. arXiv preprint arXiv:1706.05587.
Chen, L. C., Zhu, Y., Papandreou, G., Schroff, F., and Adam, H. (2018). Encoder-decoder with
atrous separable convolution for semantic image segmentation. Ferrari V, Hebert M,
Sminchisescu C, Weiss Y, editors. Computer Vision – ECCV 2018 (pp. 833–851). Cham:
Springer International Publishing.
Clark, M. (2017). Washington state’s agricultural labor shortage. Retrieved from:
https://www.washingtonpolicy.org/library/doclib/Clark-Washington-state-s-agricultural-
labor-shortage-PB-6-23-17.pdf
Csurka, G., Larlus, D., Perronnin, F., and Meylan, F. (2013). What is a good evaluation measure
for semantic segmentation? Proceedings of the 24th British Machine Vision Conference
(27).
Deng, J., Dong, W., Socher, R., Li, L. J., Li, K., and Fei-Fei, L. (2009). Imagenet: A large-scale
hierarchical image database. IEEE Conference on Computer Vision and Pattern
Recognition, 248–255.

185
De Kleine, M. E., and Karkee, M. (2015a). A semi-automated harvesting prototype for shaking
fruit tree limbs. Transactions of the ASABE, 58(6), 1461–1470.
Dias, P. A., Tabb, A., and Medeiros, H. (2018). Multispecies fruit flower detection using a
refined semantic segmentation network. IEEE Robotics and Automation Letters, 3(4),
3003–3010.
Ferentinos, K. P. (2018). Deep learning models for plant disease detection and diagnosis.
Computers and Electronics in Agriculture, 145, 311–318.
Grinblat, G. L., Uzal, L. C., Larese, M. G., and Granitto, P. M. (2016). Deep learning for plant
identification using vein morphological patterns. Computers and Electronics in
Agriculture, 127, 418–424.
He, K., Gkioxari, G., Dollár, P., and Girshick, R. (2017). Mask r-cnn. Proceedings of the IEEE
International Conference on Computer Vision, 2961–2969.
He, K., Zhang, X., Ren, S., and Sun, J. (2016). Identity mappings in deep residual networks.
European Conference on Computer Vision (pp. 630–645). Springer, Cham.
He, L., Zhang, X., Ye, Y., Karkee, M., and Zhang, Q. (2019). Effect of shaking location and
duration on mechanical harvesting of fresh market apples. Applied Engineering in
Agriculture, 35(2), 175–183.
Kamilaris, A., and Prenafeta-Boldú, F. X. (2018). Deep learning in agriculture: A survey.
Computers and Electronics in Agriculture, 147, 70–90.
Kemker, R., Salvaggio, C., and Kanan, C. (2017). High-resolution multispectral dataset for
semantic segmentation. arXiv preprint arXiv:1703.01918.
186
Krizhevsky, A., Sutskever, I., and Hinton, G. E. (2012). Imagenet classification with deep
convolutional neural networks. Advances in Neural Information Processing Systems,
1097–1105.
LeCun, Y., Bengio, Y., and Hinton, G. (2015). Deep learning. Nature, 521(7553), 436–444.
Majeed, Y., Zhang, J., Zhang, X., Fu, L., Karkee, M., Whiting, M. D., and Zhang, Q. (2020).
Deep learning based segmentation for automated training of apple trees on trellis wires.
Computers and Electronics in Agriculture, 170, 105277.
Murphy, K. P. (2012). Machine learning: A probabilistic perspective. MIT Press.
PASCAL VOC. (2012). http://host.robots.ox.ac.uk/pascal/VOC/
Ren, S., He, K., Girshick, R., and Sun, J. (2015). Faster r-cnn: Towards real-time object
detection with region proposal networks. Advances in Neural Information Processing
Systems, 91–99.
Sa, I., Chen, Z., Popović, M., Khanna, R., Liebisch, F., Nieto, J., and Siegwart, R. (2017).
Weednet: Dense semantic weed classification using multispectral images and mav for
smart farming. IEEE Robotics and Automation Letters, 3(1), 588–595.
Sa, I., Ge, Z., Dayoub, F., Upcroft, B., Perez, T., and McCool, C. (2016). Deepfruits: A fruit
detection system using deep neural networks. Sensors, 16(8), 1222.
Simonyan, K., and Zisserman, A. (2014). Very deep convolutional networks for large-scale
image recognition. arXiv preprint arXiv:1409.1556.
USDA. (2002). S51.300: United States standards for grades of apples. Washington, DC: USDA
Agricultural Marketing Service. https://www.ams.usda.gov/grades-
standards/applegrades-standards
187
USDA. (2019). National agricultural statistics database. Washington, DC: USDA National
Agricultural Statistics Service. Retrieved from https://quickstats.nass.usda.gov
Whiting, M. D. (2018). Chapter 6: Precision orchard systems. Zhang Q. (Ed.), Automation in
Tree Fruit Production: Principles and Practice (pp. 93–111). Wallingford, UK: CABI.
Zabawa, L., Kicherer, A., Klingbeil, L., Milioto, A., Topfer, R., Kuhlmann, H., and Roscher, R.
(2019). Detection of Single Grapevine Berries in Images Using Fully Convolutional
Neural Networks. Proceedings of the IEEE Conference on Computer Vision and Pattern
Recognition Workshops.
Zhang, J., He, L., Karkee, M., Zhang, Q., Zhang, X., and Gao, Z. (2018). Branch detection for
apple trees trained in fruiting wall architecture using depth features and regions-
convolutional neural network (R-CNN). Computers and Electronics in Agriculture, 155,
386–393.
Zhang, Q., Karkee, M., and Tabb, A. (2019). The use of agricultural robots in orchard
management. arXiv preprint arXiv:1907.13114.
Zhang, X., He, L., Majeed, Y., Karkee, M., Whiting, M. D., and Zhang, Q. (2018). A precision
pruning strategy for improving efficiency of vibratory mechanical harvesting of apples.
Transactions of the ASABE, 61(5), 1565–1576.
188
CHAPTER SEVEN
GENERAL CONCLUSIONS AND RECOMMENDATIONS
7.1. General Conclusions
This research aimed at creating a benchmarked knowledgebase for optimizing the overall
efficiency of a vibratory shake-and-catch harvesting system for the mass harvest of fresh market
apples from trellis-trained trees, either in a vertical architecture or V-architecture. It included (1)
the investigation of the responses of different tree canopies to mechanical harvesting actuation
systems for finding optimal tree canopy parameters suitable for effective mechanical harvest, and
(2) the investigation of shake-and-catch mechanisms for finding optimal designs and system
parameters adequate for effectively harvesting fresh market apple from trellis-trained trees. In
other words, this research was focused on gaining a basic understanding on canopy-machine
interactions for supporting (1) the creation of machine-operation-friendly precision canopy
management strategies and (2) the optimization and automation of shake-and-catch harvest
systems design to achieve a highest possible overall harvest efficiency. The field experiments and
analysis results obtained from this study could support making the following conclusions:
I. Several canopy parameters can noticeably affect fruit removal efficiency in shake-and-
catch harvesting, and such parameters can be different for different apple cultivars. More
specifically, for both ‘Scifresh’ and ‘Envy’ cultivars, fruit branch load and density were
the most relevant canopy parameters from the fruit category influencing the performance
of a mechanical harvesting system. Moreover, branch basal and end diameters were found
to be highly relevant as branch parameters, while shoot length and basal diameter were

189
deemed highly relevant from the shoot category that could affect the performance of a
shake-and-catch mechanical harvesting system.
II. The pruning strategy had significant influences on the fruit removal efficiency of
mechanical harvesting on apples in field trials (with ‘Scifresh’ cultivar in the vertical
architecture). The shoot length and S-index (the ratio of shoot diameter to length) were
found to be capable of providing adequate pruning measures for creating machine-friendly
fruiting-wall tree architectures. The results showed that (1) if only the shoot length is
considered, the maximum shoot length should be less than 15 cm, and (2) if both the shoot
length and diameter are considered, a minimum S-index of 0.03 should be maintained.
Results obtained in this study proved that a fruit removal efficiency of 85% or greater can
be achieved if the pruned shoots satisfy either of these two rules in vibratory shake-and-
catch harvesting; while a minimum of 91% marketable fruit quality could be achieved for
fresh market apples.
III. The semi-automated hydraulic harvesting system achieved a slightly higher fruit removal
efficiency of 90% (engaged with the intermittent linear shaking method), followed by the
hand-held system (87%) and manually operated hydraulic system (84%) (both engaged
with the continuous linear shaking method) on ‘Scifresh’ apples. In addition, there existed
some remarkable differences in fruit removability from the trees among different apple
cultivars in shake-and-catch vibratory harvest. Among six tested cultivars, ‘Scifresh’ and
‘Pink Lady’ exhibited the highest fruit removal efficiencies (average of 85%) and the
highest percentage of marketable fruits (average of 88%–92%), while the ‘Gala’ cultivar
was found to have the lowest fruit removal efficiency (average of 63%) with a lower (but
not the lowest) percentage of marketable fruit (average of 81%).
190
IV. A machine vision system was successfully developed to identify the tree branches/trunks
and to locate suitable shaking points under various canopy foliage conditions for mass
mechanical apple harvesting, with up to a per-class accuracy (PcA) of 97%, intersection
over union (IoU) of 0.69, and boundary-F1 score (BFScore) of 0.89 on average (using
Deeplab v3+ ResNet-18 with full image size). More importantly, the trained Deeplab v3+
ResNet-18 was also found to be robust in segmenting images from crop cultivars and
canopy architectures different than what was used in the training process. With this
network, IoUs of 0.69 and 0.67 and BFScores of 0.85 and 0.82 on average were achieved
with high-density foliage ‘Scifresh’ and ‘Envy’ apples, respectively. The results indicated
the great potential for the generic application of this model in segmenting orchard images.
Polynomial curves were fitted to branches and trunks for locating the shaking points at
branch bases with about 72% of them being deemed good compared to manual selections.
7.2. Recommendations for Future Work
Based on the main conclusions drawn from this dissertation research, the following aspects
are recommended for future work:
I. The obtained results of the study only suggested which canopy parameters were more
relevant to the fruit removal using a mass mechanical harvesting system (i.e., influencing
more whether a fruit could be mechanically removed or not under the same machine
configurations). However, a local/global sensitivity analysis is still needed in the future to
study how a change in input (e.g., canopy parameters) would be translated into a change in
output (e.g., fruit removal in mechanical harvest).
191
II. Several numerical guidelines of canopy pruning on vertically trellised apple trees were
developed and demonstrated in the field conditions. Therefore, these guidelines also serve
as a proof-of-concept for the future development of a selective robotic/automated pruning
machine in creating scientific pruning algorithms.
III. Three different shaking strategies (i.e., continuous non-linear, continuous linear, and
intermittent linear reciprocating) were analyzed and compared. However, it was difficult
to directly compare the continuous non-linear and intermittent linear shaking strategies
because the data were collected with different apple cultivars (‘Gala’ and ‘Scifresh’), and
it was shown already that the harvest results would be influenced by the cultivars. Future
work should conduct further comparisons between these two strategies on the same apple
cultivar.
IV. CNNs-based deep learning was employed to segment out the target tree branches and
trunks by feeding the complete original images into the networks. The computational speed
was thus about 1.24–1.29 s per image using the full size of resolution (1,080×1,920 pixels).
This number was only approximately 0.35–0.47 s per image when the reduced size was
used (540×960 pixels). Therefore, to further increase the identification accuracy of the
networks, some higher resolution images might be used, but this could also reduce the
computational speed at the same time. To address the issue, small image patches (i.e., a
small portion of the full image that could reconstruct the original image using a certain
method) should be considered to feed the networks to increase the identification accuracy
without sacrificing the computational speed.
V. Lastly, the obtained results based on different objectives could be further integrated to
develop the algorithms and models to scientifically locate the best fitted shaking points or
192
locations for a mass mechanical apple harvesting system. For example, it was already found
that fruit density and branch basal diameter were more relevant to the harvesting efficiency;
therefore, once the tree branches were successfully identified by implementing a machine
vision system, the locations of the branches with higher fruit density per unit length and/or
larger branch diameter should be further located using such an algorithm for automated
approaching and grabbing for the actuation.
Related Documents