68 Ojo T. K., Amoako-Sakyi R. and Agyeman W. STUDENTS’ SATISFACTION OF CAMPUS SHUTTLING BUS SERVICES: A QUALBUS APPROACH MANAGEMENT RESEARCH AND PRACTICE VOL. 7 ISSUE 1 (2015) PP: 68-79 Management Research and Practice Volume 7 Issue 1 / March 2015 ISSN 2067- 2462 mrp.ase.ro STUDENTS’ SATISFACTION OF CAMPUS SHUTTLING BUS SERVICES: A QUALBUS APPROACH 1 Thomas Kolawole OJO, 1 Regina AMOAKO-SAKYI and 2 William AGYEMAN 1 Department of Geography and Regional Planning University of Cape Coast, Cape coast, Ghana [email protected] 2 Building and Road Research Institute Kumasi Abstract The general aim of this research was to ascertain the relationship between service quality and customer satisfaction. This was ascertained with the use of QUALBUS dimensions and how each influences student‟s satisfaction. The purpose and reasons for using campus shuttle were also elucidated. The research methodology was a cross sectional survey at the two designated bus stops for the University of Cape Coast‟s bus shuttling service at Old site (South campus) and Science (North campus) of 300 questionnaires through simple randomly sampling. The reliability of the study was tested by cronbach‟s alfa. Frequency, percentage, correlation and regression were used for the data analysis. The results of the study indicate that 55% of the respondents were male; 70.2% were aged between 20-24years; 67.3% used the shuttle every other day; 50.5% used the campus shuttle because of the lower transport fares; 83.7% used the campus shuttle for educational reasons. Furthermore the results revealed that only reliability variable has a significant relationship with student satisfaction because it has a p-value smaller than α = 0.05. Attempts to improve on service quality to influence student satisfaction should be directed at assurance, tangibility, empathy and receptivity variables. The study could have looked all passengers‟ satisfaction coupled with an in-depth interview of the transport officers. Keywords: Service quality, students‟ satisfaction, Campus shuttle bus, QUALBUS. 1. INTRODUCTION An efficient transportation system has a significant impact on the quality of life, opportunity for recreation, education, social and businesses. Passengers have varying competing means of transportation. The most used means of transportation apart from walking is by public transport which includes taxi, minibus and paratransit in developing countries. The majority of public transportation in developed countries is usually funded by the state where both capital and operating costs are subsidized.

Welcome message from author
This document is posted to help you gain knowledge. Please leave a comment to let me know what you think about it! Share it to your friends and learn new things together.
Transcript
68
Ojo T. K., Amoako-Sakyi R. and Agyeman W.
STUDENTS’ SATISFACTION OF CAMPUS SHUTTLING BUS SERVICES: A QUALBUS APPROACH
MANAGEMENT RESEARCH AND PRACTICE VOL. 7 ISSUE 1 (2015) PP: 68-79
Mana
gement
Rese
arc
h a
nd P
ract
ice
Volum
e 7
Iss
ue 1
/ M
arc
h 2
015
Theor
etica
l and
Empirica
l Rese
arc
hes
in U
rban
Mana
gement
ISSN
2067- 2462
mrp.ase.ro
ISSN
2067- 2462
STUDENTS’ SATISFACTION OF CAMPUS SHUTTLING BUS SERVICES: A QUALBUS
APPROACH
1Thomas Kolawole OJO, 1Regina AMOAKO-SAKYI and 2William AGYEMAN 1Department of Geography and Regional Planning
University of Cape Coast, Cape coast, Ghana [email protected]
2Building and Road Research Institute Kumasi
Abstract The general aim of this research was to ascertain the relationship between service quality and customer satisfaction. This was ascertained with the use of QUALBUS dimensions and how each influences student‟s satisfaction. The purpose and reasons for using campus shuttle were also elucidated. The research methodology was a cross sectional survey at the two designated bus stops for the University of Cape Coast‟s bus shuttling service at Old site (South campus) and Science (North campus) of 300 questionnaires through simple randomly sampling. The reliability of the study was tested by cronbach‟s alfa. Frequency, percentage, correlation and regression were used for the data analysis. The results of the study indicate that 55% of the respondents were male; 70.2% were aged between 20-24years; 67.3% used the shuttle every other day; 50.5% used the campus shuttle because of the lower transport fares; 83.7% used the campus shuttle for educational reasons. Furthermore the results revealed that only reliability variable has a significant relationship with student satisfaction because it has a p-value smaller than α = 0.05. Attempts to improve on service quality to influence student satisfaction should be directed at assurance, tangibility, empathy and receptivity variables. The study could have looked all passengers‟ satisfaction coupled with an in-depth interview of the transport officers. Keywords: Service quality, students‟ satisfaction, Campus shuttle bus, QUALBUS.
1. INTRODUCTION
An efficient transportation system has a significant impact on the quality of life, opportunity for
recreation, education, social and businesses. Passengers have varying competing means of
transportation. The most used means of transportation apart from walking is by public transport which
includes taxi, minibus and paratransit in developing countries. The majority of public transportation in
developed countries is usually funded by the state where both capital and operating costs are
subsidized.
Ojo T. K., Amoako-Sakyi R. and Agyeman W.
STUDENTS’ SATISFACTION OF CAMPUS SHUTTLING BUS SERVICES: A QUALBUS APPROACH
MANAGEMENT RESEARCH AND PRACTICE VOL. 7 ISSUE 1 (2015) PP: 68-79
69
Mana
gement
Rese
arc
h a
nd P
ract
ice
Volum
e 7
Iss
ue 1
/ M
arc
h 2
015
Theor
etica
l and
Empirica
l Rese
arc
hes
in U
rban
Mana
gement
mrp.ase.ro
ISSN
2067- 2462
ISSN
2067- 2462
Public transports in developing countries are partly funded by the states and there are a number of
privately owned operators resulting in greater diversity in service provision (Agyeman, 2013). Its
services are not scheduled, planned as it is in the developed countries.
Most government funded public transport services are bedeviled with a lot of challenges such as poor
management, financial constraint and apathy towards state owned enterprises (see Abane, 2009; Baah-
Mintah & Adams, 2012). For instance, in Ghana, most of the buses allocated to the MMT and ISTC are
not operational. This does not only affect the profitability of such a venture.
The passengers are the most hit as they are left with no option than to make use of privately owned
operators with high transport fares. Universities are not left out in the provision of transport services on
campus to students and other passengers in order to cushion the efforts of the government and private
operators. Many universities are now taking the lead to identify and develop strategies that help to
sustain the quality of campus life (Toor & Havlick, 2004) in terms of students commuting.
While universities have the ability to implement policy that effects how students arrive and depart from
campus, the university cannot overlook the growth management image it conveys to the public. By
integrating alternative forms of transportation, the university can influence the current travel patterns of
students and their future travel practices.
As universities continue to experience growth in student population, automobile usage will continue to
rise. As a result, this rise has direct effects on vehicle congestion, parking shortages, and increased
pollution (Juarez, 2011).
For a campus shuttle service to attract new riders and shift students from vehicles, services must meet
their needs. This is accomplished through increased frequency and direct routes serving the campus
(Bond & Steiner, 2006) and to increase students‟ access as well as engage students in local community
activities (Brown et al., 2001). More so, as campus shuttle service is less expensive compared to the
privately owned operators, students are expected to patronized it more than the relatively expensive
ones. It is not surprising to see students queuing at the two terminals where the campus shuttle takes
off. During this period, taxis drivers leave their conventional stations to pick students that might be in
haste to their destinations.
Furthermore, these two bus terminals lack seat-outs and shelter for passengers. As students leave for
lectures on weekdays, there are long queues in the morning from 8.00am-9.00 at Old site and dwindles
as the day wears on. Similar queues build up at the new site around 15.00-16.00pm as most students
might be returning to their hostels or halls of residence.
70
Ojo T. K., Amoako-Sakyi R. and Agyeman W.
STUDENTS’ SATISFACTION OF CAMPUS SHUTTLING BUS SERVICES: A QUALBUS APPROACH
MANAGEMENT RESEARCH AND PRACTICE VOL. 7 ISSUE 1 (2015) PP: 68-79
Mana
gement
Rese
arc
h a
nd P
ract
ice
Volum
e 7
Iss
ue 1
/ M
arc
h 2
015
Theor
etica
l and
Empirica
l Rese
arc
hes
in U
rban
Mana
gement
ISSN
2067- 2462
mrp.ase.ro
ISSN
2067- 2462
Studies such as Aidoo et al (2011); Baah-Mintah & Adams (2012); Agyeman (2013); Poku- Boansi and
Adarkwa (2013) and Kwabena et al (2013) have been conducted to assess quality of public transport
service on selected routes and cities in Ghana. But none of these addresses campus shuttle service in
Ghana. Some of these studies used modified SERVQUAL model and other ad hoc methods to assess
quality of service.
None used the QUALBUS approached specifically designed to measure quality of bus service. It is
against this background that the study seeks to ascertain students‟ satisfaction of campus bus shuttling
services provided by the management of University of Cape Coast. Furthermore, the specific objectives
are to elucidate the purpose and reason for using campus shuttle; to analyze the dimensions of
QUALBUS scale influencing student‟s perception of service quality and analyze the relationship
between QUALBUS dimensions and students‟ satisfaction of campus shuttle service.
The hypotheses for this study are as follow:
H1: There is a significant relationship between reliability and student satisfaction.
H2: There is a significant relationship between assurance and student satisfaction.
H3: There is a significant relationship between tangibility and student satisfaction.
H4: There is a significant relationship between empathy and student satisfaction.
H5: There is a significant relationship between receptivity and student satisfaction.
2. CONCEPTUAL AND THEORETICAL PERSPECTIVES
Service as a series of processes lead to an outcome meant to solve customer problems. The customer
problems may be partly solved in the course of delivering the service or while the service is perceived.
In order for this to take place there should be a medium for the service to be delivered and perceived.
To Bosch (2009) these are organizations which meet the needs of society and are designated as “public
services”.
Shuttle bus service as “public service” uses small buses or vans for public mobility (Rohani et al., 2013).
It is used for shorter trips. Rohani, et al (2013) posit that various cities in different countries such as
Hong Kong, Buenos Aires, Calcutta (India), Manila (Filipina), Istanbul (Turkey) and Cairo use a mini bus
operation service as city shuttle services.
Ojo T. K., Amoako-Sakyi R. and Agyeman W.
STUDENTS’ SATISFACTION OF CAMPUS SHUTTLING BUS SERVICES: A QUALBUS APPROACH
MANAGEMENT RESEARCH AND PRACTICE VOL. 7 ISSUE 1 (2015) PP: 68-79
71
Mana
gement
Rese
arc
h a
nd P
ract
ice
Volum
e 7
Iss
ue 1
/ M
arc
h 2
015
Theor
etica
l and
Empirica
l Rese
arc
hes
in U
rban
Mana
gement
mrp.ase.ro
ISSN
2067- 2462
ISSN
2067- 2462
Campus shuttle service as a program is necessitated by a couple of important factors. One of such is
off-campus housing based on student density (Juarez, 2011). Another reason is the location of halls of
residence or hostels and lecture rooms as the case is for the University of Cape Coast.
The University of Pittsburgh transit program in USA allows students to move away from housing located
near the university and into outlying areas that have better housing opportunities and lower rent (Brown
et al., 2001).
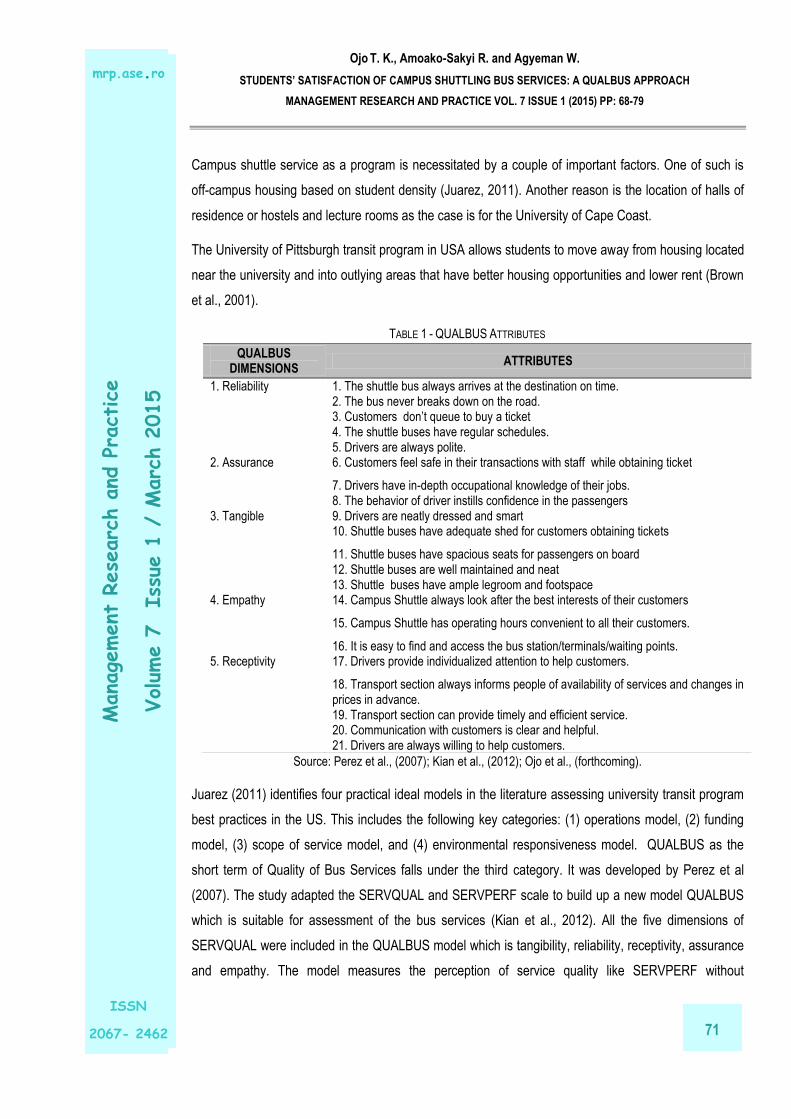
TABLE 1 - QUALBUS ATTRIBUTES
Source: Perez et al., (2007); Kian et al., (2012); Ojo et al., (forthcoming).
Juarez (2011) identifies four practical ideal models in the literature assessing university transit program
best practices in the US. This includes the following key categories: (1) operations model, (2) funding
model, (3) scope of service model, and (4) environmental responsiveness model. QUALBUS as the
short term of Quality of Bus Services falls under the third category. It was developed by Perez et al
(2007). The study adapted the SERVQUAL and SERVPERF scale to build up a new model QUALBUS
which is suitable for assessment of the bus services (Kian et al., 2012). All the five dimensions of
SERVQUAL were included in the QUALBUS model which is tangibility, reliability, receptivity, assurance
and empathy. The model measures the perception of service quality like SERVPERF without
QUALBUS DIMENSIONS
ATTRIBUTES
1. Reliability 1. The shuttle bus always arrives at the destination on time. 2. The bus never breaks down on the road. 3. Customers don‟t queue to buy a ticket 4. The shuttle buses have regular schedules. 5. Drivers are always polite. 2. Assurance 6. Customers feel safe in their transactions with staff while obtaining ticket
7. Drivers have in-depth occupational knowledge of their jobs. 8. The behavior of driver instills confidence in the passengers 3. Tangible 9. Drivers are neatly dressed and smart 10. Shuttle buses have adequate shed for customers obtaining tickets
11. Shuttle buses have spacious seats for passengers on board 12. Shuttle buses are well maintained and neat 13. Shuttle buses have ample legroom and footspace 4. Empathy 14. Campus Shuttle always look after the best interests of their customers
15. Campus Shuttle has operating hours convenient to all their customers.
16. It is easy to find and access the bus station/terminals/waiting points. 5. Receptivity 17. Drivers provide individualized attention to help customers.
18. Transport section always informs people of availability of services and changes in prices in advance.
19. Transport section can provide timely and efficient service. 20. Communication with customers is clear and helpful. 21. Drivers are always willing to help customers.
72
Ojo T. K., Amoako-Sakyi R. and Agyeman W.
STUDENTS’ SATISFACTION OF CAMPUS SHUTTLING BUS SERVICES: A QUALBUS APPROACH
MANAGEMENT RESEARCH AND PRACTICE VOL. 7 ISSUE 1 (2015) PP: 68-79
Mana
gement
Rese
arc
h a
nd P
ract
ice
Volum
e 7
Iss
ue 1
/ M
arc
h 2
015
Theor
etica
l and
Empirica
l Rese
arc
hes
in U
rban
Mana
gement
ISSN
2067- 2462
mrp.ase.ro
ISSN
2067- 2462
considering the expectation components of SERQUAL. In essence, the QUALBUS does not take into
consideration the gap score between expectations and perceptions of service quality as espoused in
SERVQUAL.
Customer satisfaction should be the ultimate goal of all firms because it is known to be one of the most
important and serious issues towards success in today‟s competitive business environment, both
theoretical and empirical research link it to a company‟s market shares, performance or organizational
profitability and customer retention (Ooi, et al., 2011). There is a close relationship between service
quality and customer satisfaction.
Researchers in general acknowledge that customer satisfaction is based on the level of service quality
delivery (Khurshid et al., 2012; Islam et al., 2012) while Asubonteng et al (1996) on the other hand
supports the notion that satisfaction leads to quality.
3. STUDY AREA AND RESEARCH METHODOLOGY
University of Cape Coast is one of the foremost public universities in Ghana set up to churn out
educationists in the country. It is located in the erstwhile capital of Ghana, Cape Coast, Central Region.
The university is divided into two connected by a road from south to north. More than 30% of the
population of students stays in halls of residence located in the north and south campuses.
The university has programmes for undergraduate and post graduate in agriculture, arts, humanities,
physical and social sciences. In this descriptive research, cross sectional survey was utilized by the
administration of copies of pre-tested questionnaires students who patronized the campus shuttling
bus service. The questionnaire was gathered through simple random sampling.
The researchers located at the bus stations accosted passengers while waiting for the bus. Each
individual was chosen randomly and entirely by chance according to the tenet of simple random sample
technique.
The administration of the questionnaires was carried out early November from 8am-6pm when lectures
were at its peak in all departments. This is because there would be high commuting by students within
the university environment necessitating the use of the Campus shuttle service.
Ojo T. K., Amoako-Sakyi R. and Agyeman W.
STUDENTS’ SATISFACTION OF CAMPUS SHUTTLING BUS SERVICES: A QUALBUS APPROACH
MANAGEMENT RESEARCH AND PRACTICE VOL. 7 ISSUE 1 (2015) PP: 68-79
73
Mana
gement
Rese
arc
h a
nd P
ract
ice
Volum
e 7
Iss
ue 1
/ M
arc
h 2
015
Theor
etica
l and
Empirica
l Rese
arc
hes
in U
rban
Mana
gement
mrp.ase.ro
ISSN
2067- 2462
ISSN
2067- 2462
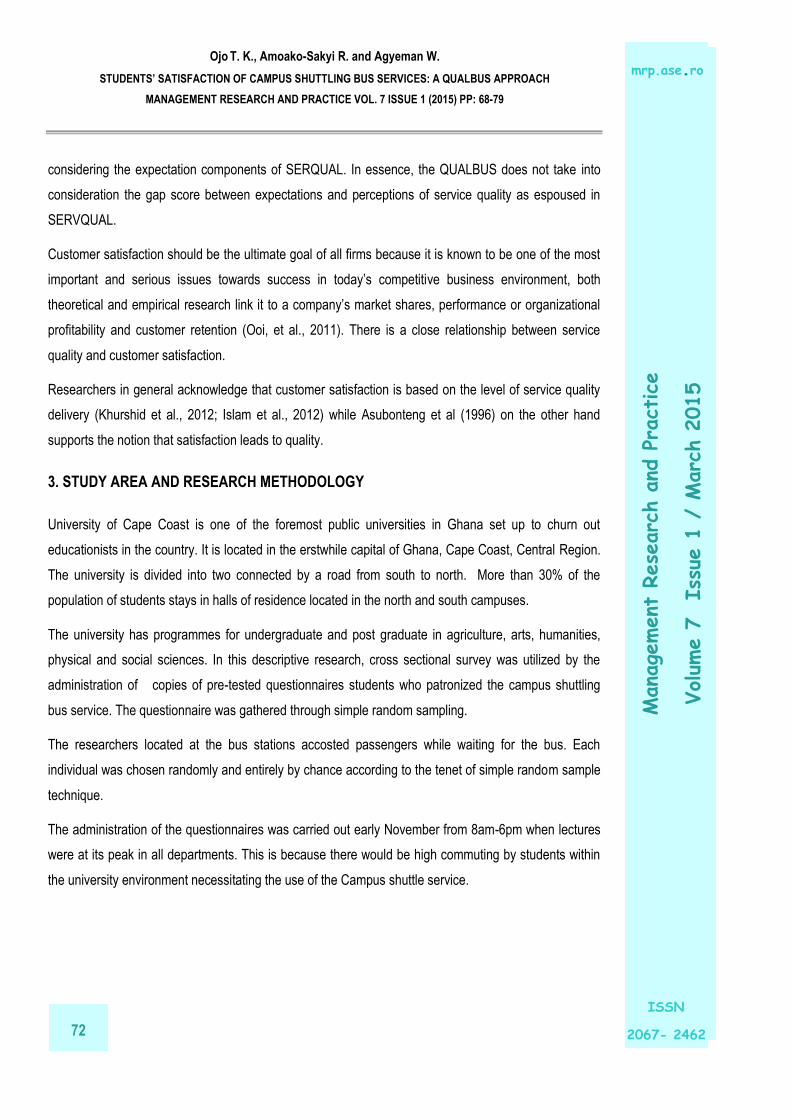
Source: Adapted from Perez et al., (2007); Kian, et al., (2012); Ojo et al., (forthcoming)
4. RESULTS AND DISCUSSIONS
It is revealed in Table 2 that majority of the respondents are male representing 55% and 45% are
female. The highest percentage of the respondents representing 70.2% is aged between 20-24 years,
21.1% are aged between 15-19 years, 6.2% are between 24-29years and the rest are above 30 years.
The highest percentage of respondents representing 67.3% use the campus shuttle every other day,
21.6% use it about twice a week, 16.7% are occasional users and 5.6% use it once a day or more than
once a day. The highest percentage of respondents representing
74
Ojo T. K., Amoako-Sakyi R. and Agyeman W.
STUDENTS’ SATISFACTION OF CAMPUS SHUTTLING BUS SERVICES: A QUALBUS APPROACH
MANAGEMENT RESEARCH AND PRACTICE VOL. 7 ISSUE 1 (2015) PP: 68-79
Mana
gement
Rese
arc
h a
nd P
ract
ice
Volum
e 7
Iss
ue 1
/ M
arc
h 2
015
Theor
etica
l and
Empirica
l Rese
arc
hes
in U
rban
Mana
gement
ISSN
2067- 2462
mrp.ase.ro
ISSN
2067- 2462
50.5% use the campus shuttle because of the lower transport fares, 15.3% use it because of
safety/security, 11% use it because of the location of stations/locations, 8.1% use it for scheduling,
7.9% because of comfortability of the seat and the ample legroom of the buses, 5.7% use it because of
speed and 1.4% use it because of disability friendliness. The highest percentage of respondents
representing 83.7% use the campus shuttle for educational reasons, 7.9% use it for recreational, 6.4%
for religious activities and 2.4% use it for reasons apart from these three.
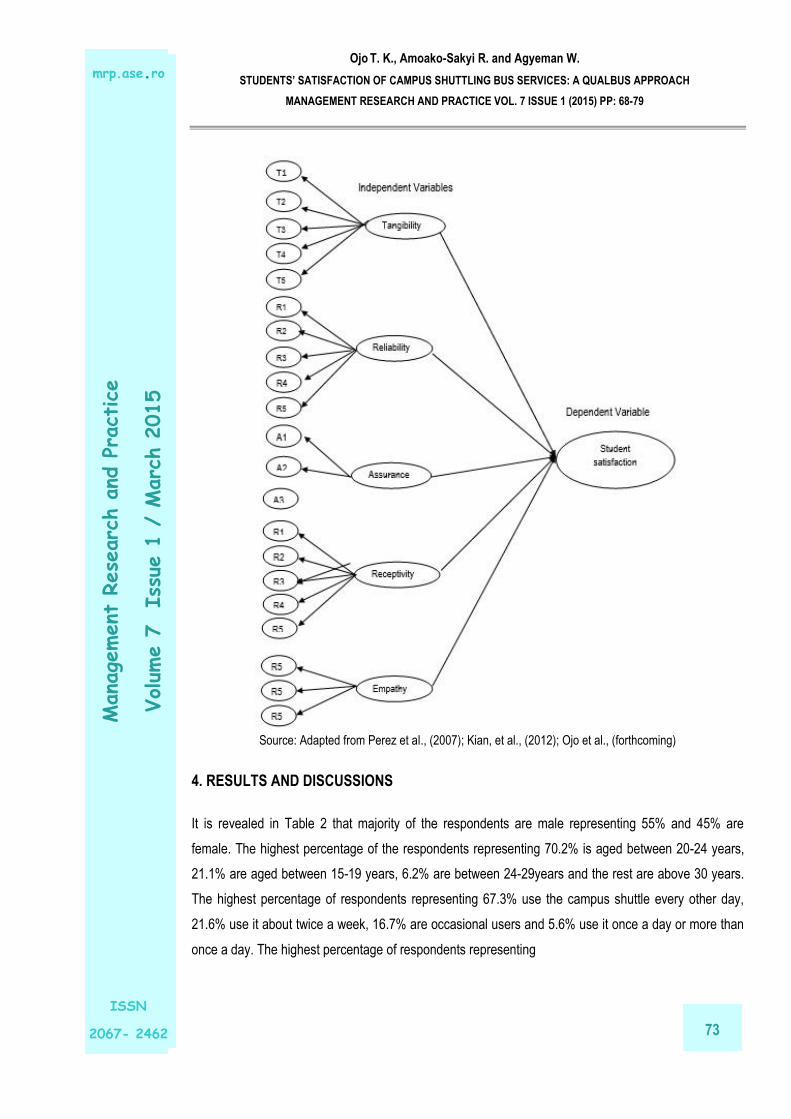
TABLE 2 - BACKGROUND CHARACTERISTICS AND TRAVEL BEHAVIOR
Background characteristics Frequency Percentage Sex Male 159 55 Female 130 45 Age 15-19 61 21.1 20-24 203 70.2 25-29 18 6.2 Above 30 7 2.4 Frequency of patronage More than once a day 9 5.6 Once a day 9 5.6 Once every other day 109 67.3 About twice a week 35 21.6 Once a week - - Occasional user 27 16.7 Frequency of use* Disability friendly 6 1.4 Comfort/(seating and legroom) 33
7.9
Location of terminal/stations 46 11 Scheduling 34 8.1 Lower Transport Fares 211 50.5 Safety/security 64 15.3 Speed 24 5.7 Purpose of use* Educational 287 83.7 Recreational 27 7.9 Religious 22 6.4 Others 7 2.4
* multiple response
TABLE 3 - MEAN ANALYSIS RANKING
Dependent variable Mean Standard deviation
Customer satisfaction 2.05 0.81
Independent variables
Reliability 2.01 0.53 Assurance 2.25 0.61 Tangibility 2.39 0.61 Empathy 2.34 0.62 Receptivity 2.32 0.63
Source: fieldwork, 2013.
Ojo T. K., Amoako-Sakyi R. and Agyeman W.
STUDENTS’ SATISFACTION OF CAMPUS SHUTTLING BUS SERVICES: A QUALBUS APPROACH
MANAGEMENT RESEARCH AND PRACTICE VOL. 7 ISSUE 1 (2015) PP: 68-79
75
Mana
gement
Rese
arc
h a
nd P
ract
ice
Volum
e 7
Iss
ue 1
/ M
arc
h 2
015
Theor
etica
l and
Empirica
l Rese
arc
hes
in U
rban
Mana
gement
mrp.ase.ro
ISSN
2067- 2462
ISSN
2067- 2462
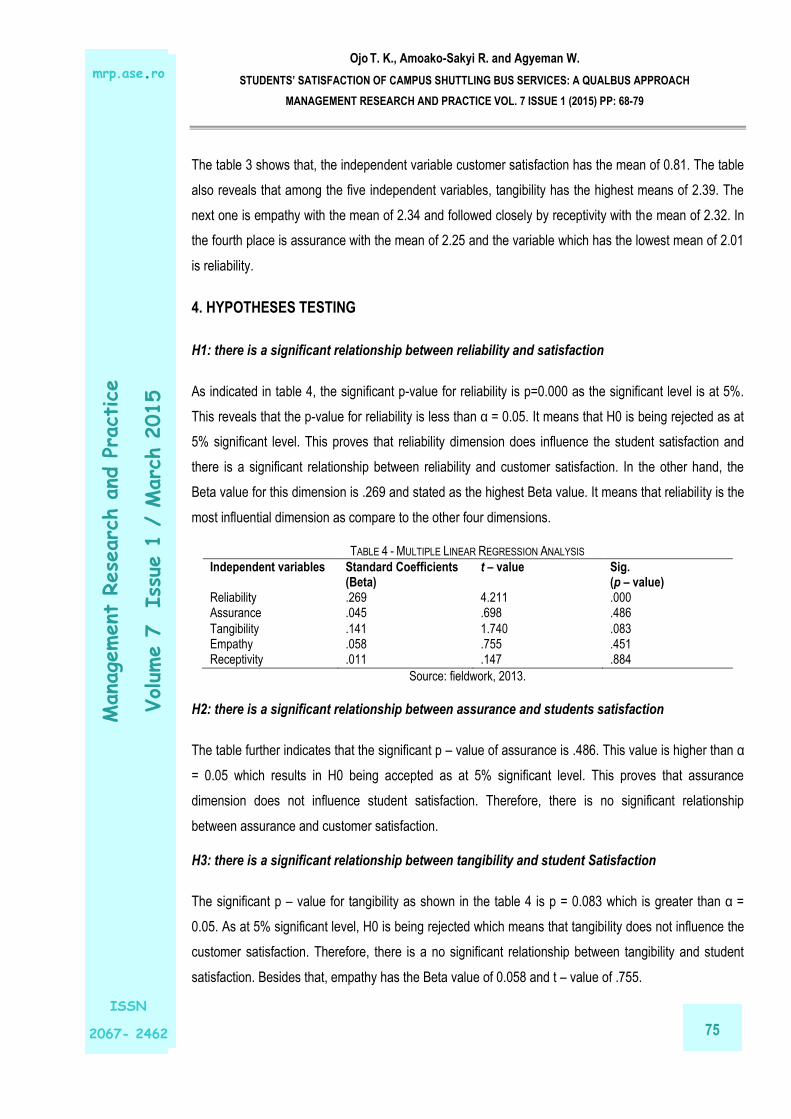
The table 3 shows that, the independent variable customer satisfaction has the mean of 0.81. The table
also reveals that among the five independent variables, tangibility has the highest means of 2.39. The
next one is empathy with the mean of 2.34 and followed closely by receptivity with the mean of 2.32. In
the fourth place is assurance with the mean of 2.25 and the variable which has the lowest mean of 2.01
is reliability.
4. HYPOTHESES TESTING
H1: there is a significant relationship between reliability and satisfaction
As indicated in table 4, the significant p-value for reliability is p=0.000 as the significant level is at 5%.
This reveals that the p-value for reliability is less than α = 0.05. It means that H0 is being rejected as at
5% significant level. This proves that reliability dimension does influence the student satisfaction and
there is a significant relationship between reliability and customer satisfaction. In the other hand, the
Beta value for this dimension is .269 and stated as the highest Beta value. It means that reliability is the
most influential dimension as compare to the other four dimensions.
TABLE 4 - MULTIPLE LINEAR REGRESSION ANALYSIS
Independent variables Standard Coefficients (Beta)
t – value Sig. (p – value)
Reliability .269 4.211 .000 Assurance .045 .698 .486
Tangibility .141 1.740 .083 Empathy .058 .755 .451 Receptivity .011 .147 .884
Source: fieldwork, 2013.
H2: there is a significant relationship between assurance and students satisfaction
The table further indicates that the significant p – value of assurance is .486. This value is higher than α
= 0.05 which results in H0 being accepted as at 5% significant level. This proves that assurance
dimension does not influence student satisfaction. Therefore, there is no significant relationship
between assurance and customer satisfaction.
H3: there is a significant relationship between tangibility and student Satisfaction
The significant p – value for tangibility as shown in the table 4 is p = 0.083 which is greater than α =
0.05. As at 5% significant level, H0 is being rejected which means that tangibility does not influence the
customer satisfaction. Therefore, there is a no significant relationship between tangibility and student
satisfaction. Besides that, empathy has the Beta value of 0.058 and t – value of .755.
76
Ojo T. K., Amoako-Sakyi R. and Agyeman W.
STUDENTS’ SATISFACTION OF CAMPUS SHUTTLING BUS SERVICES: A QUALBUS APPROACH
MANAGEMENT RESEARCH AND PRACTICE VOL. 7 ISSUE 1 (2015) PP: 68-79
Mana
gement
Rese
arc
h a
nd P
ract
ice
Volum
e 7
Iss
ue 1
/ M
arc
h 2
015
Theor
etica
l and
Empirica
l Rese
arc
hes
in U
rban
Mana
gement
ISSN
2067- 2462
mrp.ase.ro
ISSN
2067- 2462
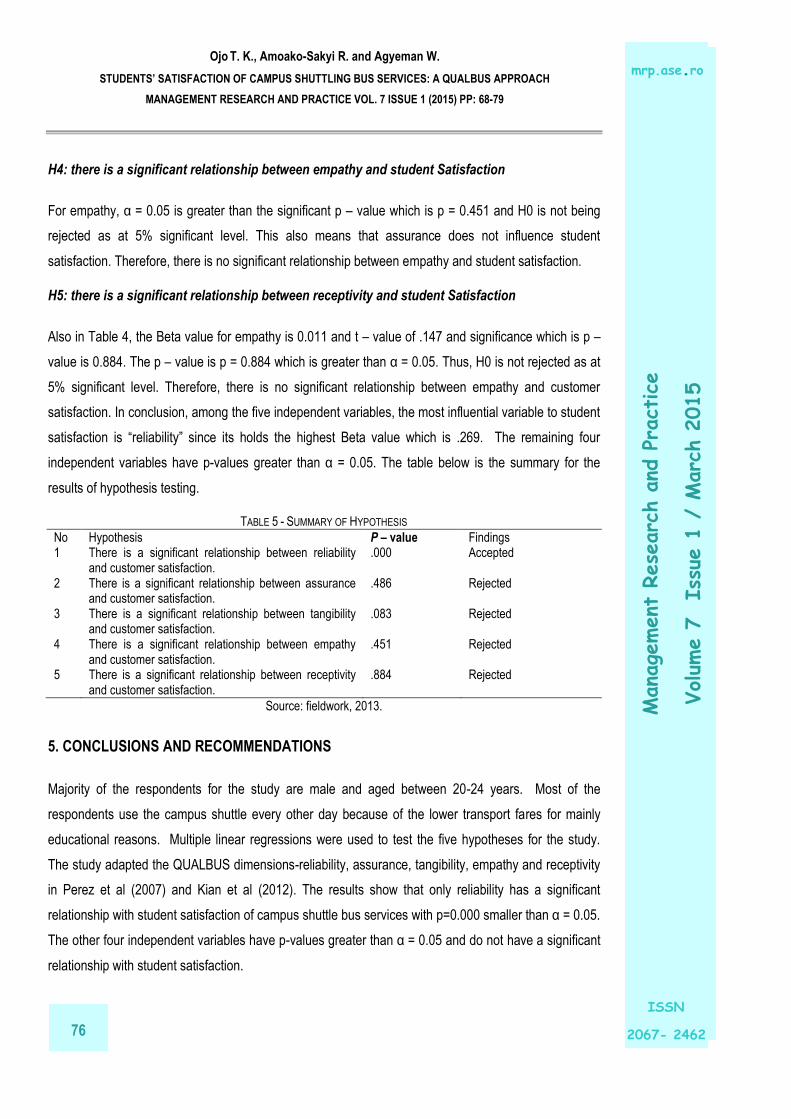
H4: there is a significant relationship between empathy and student Satisfaction
For empathy, α = 0.05 is greater than the significant p – value which is p = 0.451 and H0 is not being
rejected as at 5% significant level. This also means that assurance does not influence student
satisfaction. Therefore, there is no significant relationship between empathy and student satisfaction.
H5: there is a significant relationship between receptivity and student Satisfaction
Also in Table 4, the Beta value for empathy is 0.011 and t – value of .147 and significance which is p –
value is 0.884. The p – value is p = 0.884 which is greater than α = 0.05. Thus, H0 is not rejected as at
5% significant level. Therefore, there is no significant relationship between empathy and customer
satisfaction. In conclusion, among the five independent variables, the most influential variable to student
satisfaction is “reliability” since its holds the highest Beta value which is .269. The remaining four
independent variables have p-values greater than α = 0.05. The table below is the summary for the
results of hypothesis testing.
TABLE 5 - SUMMARY OF HYPOTHESIS
No Hypothesis P – value Findings 1 There is a significant relationship between reliability
and customer satisfaction. .000 Accepted
2 There is a significant relationship between assurance and customer satisfaction.
.486 Rejected
3 There is a significant relationship between tangibility and customer satisfaction.
.083 Rejected
4 There is a significant relationship between empathy and customer satisfaction.
.451 Rejected
5 There is a significant relationship between receptivity and customer satisfaction.
.884 Rejected
Source: fieldwork, 2013.
5. CONCLUSIONS AND RECOMMENDATIONS
Majority of the respondents for the study are male and aged between 20-24 years. Most of the
respondents use the campus shuttle every other day because of the lower transport fares for mainly
educational reasons. Multiple linear regressions were used to test the five hypotheses for the study.
The study adapted the QUALBUS dimensions-reliability, assurance, tangibility, empathy and receptivity
in Perez et al (2007) and Kian et al (2012). The results show that only reliability has a significant
relationship with student satisfaction of campus shuttle bus services with p=0.000 smaller than α = 0.05.
The other four independent variables have p-values greater than α = 0.05 and do not have a significant
relationship with student satisfaction.
Ojo T. K., Amoako-Sakyi R. and Agyeman W.
STUDENTS’ SATISFACTION OF CAMPUS SHUTTLING BUS SERVICES: A QUALBUS APPROACH
MANAGEMENT RESEARCH AND PRACTICE VOL. 7 ISSUE 1 (2015) PP: 68-79
77
Mana
gement
Rese
arc
h a
nd P
ract
ice
Volum
e 7
Iss
ue 1
/ M
arc
h 2
015
Theor
etica
l and
Empirica
l Rese
arc
hes
in U
rban
Mana
gement
mrp.ase.ro
ISSN
2067- 2462
ISSN
2067- 2462
The original QUALBUS in Perez et al‟s (2007) study was used to ascertain the relationship between
QUALBUS and behavioural purchase intensions. Kian et al (2012) on the other hand espoused it by
focusing on the relationship of QUALBUS with customer satisfaction. This study lent on the study of
Kian et al (2012) conducted in Malaysia on public transport focusing more specifically on domestic bus
as a mode of transport. Similarly, this study applied the QUALBUS model comprising of five dimensions
with 21 attributes in relation to student satisfaction of Campus Shuttle Bus service provided by the
management of University of Cape Coast. Hence, The QUALBUS framework was built.
The students indicated that campus shuttle bus service is of poor quality. The results portray that the
students are not satisfied with the services. On this note, the transport section should look at the
attributes of assurance, tangibility, empathy and receptivity to improve perception of service quality. This
will help them to maintain the number of customers and woo new ones. Satisfied students will make
positive recommendations to other students. The dual campuses and the location of halls/hostels of
residence and lecture halls make commuting essential as the best alternative to campus shuttle is taxi.
These taxis can carry only 4 passengers which will increase the volume of traffic within the campus and
cause a decline in the revenue generation capacity of the agency running the campus shuttle bus.
For future study, researchers may focus on the differences in the expectation and perception of service
quality and its relationship with customer satisfaction by maintaining the dimensions of five dimensions
in this study. Future studies may also focus on customer satisfaction in more details. More so, this
study focused on campus shuttle bus service in the University of Cape Coast, researchers may replicate
this model in other universities in Ghana offering campus shuttle services to their students. A wider
application of the QUALBUS may be used to assess the relationship between perception of service
quality and customer satisfaction of state funded and private operators of intra or intercity bus services
in Ghana.
REFERENCES
Abane, A. M. (2009). The metro mass transportation scheme in Ghana: Issues, challenges and the way forward. Oguaa Journal of Social Sciences, 4(4), 35-58.
Aidoo E. N., Agyemang W., Monkah J. E. & Afukaar F. K. (2013). Passenger‟s satisfaction with public bus transport services in Ghana: A case study of Kumasi–Accra route. Theoretical and Empirical Researches in Urban Management, 8(2), 33-44.
Agyeman, W. (2013). Measurement of service quality of “Trotro” as public transportation in Ghana: A case study of the city of Kumasi. Abstracts of the 32nd Southern African Transport Conference (SATC 2013), 8-11 July 2013, Pretoria, South Africa, 283-291.
78
Ojo T. K., Amoako-Sakyi R. and Agyeman W.
STUDENTS’ SATISFACTION OF CAMPUS SHUTTLING BUS SERVICES: A QUALBUS APPROACH
MANAGEMENT RESEARCH AND PRACTICE VOL. 7 ISSUE 1 (2015) PP: 68-79
Mana
gement
Rese
arc
h a
nd P
ract
ice
Volum
e 7
Iss
ue 1
/ M
arc
h 2
015
Theor
etica
l and
Empirica
l Rese
arc
hes
in U
rban
Mana
gement
ISSN
2067- 2462
mrp.ase.ro
ISSN
2067- 2462
Asubonteng, P., McCleary, K. J., & Swan, J. E. (1996). SERVQUAL Revisited: A critical review of service quality. The Journal of Services Marketing, 10(6), 62-81.
Baah-Mintah, R. & Adams, M.S. (2012). Appraisal of Public-Private Partnership in Public Transport Service Delivery: A Case of Metro Mass Transit (MMT) Limited, Ghana. International Journal of Research in Social Sciences, 2(4), 427-440.
Bond, A. & Steiner, R. L. (2006). Sustainable campus transportation through transit partnership and transportation demand management: A case study from the University of Florida. Berkeley Planning Journal, 19,125-42.
Bosch, C. (2009). An evaluation of the quality of customer service delivery offered by the East London Public transport commuter rail Service provider (operated by METRORAIL). A dissertation submitted in partial fulfilment of the requirements for the degree of Master of Business Administration Of Rhodes Investec Business School Rhodes University.
Boyd, B., Chow, M., Johnson, R. & Smith, A. (2003). Analysis of effects of fare-free transit program on student commuting mode shares. BruinGo at University of California at Los Angeles. Transportation Research Record, 1835, 101-110.
Brown, J., Hess, D.B. & Shoup, D. (2003).Fare-free public transit at universities: An evaluation. Journal of Planning Education and Research, 23, 69- 82.
Brown, J., Hess, D.B. & Shoup, D. (2001). Unlimited access. Transportation, 28, 233-67.
Govender, J.P. & Pan, Q (2011). Enhancement of service quality in the intercity bus transport industry. Alternate Special Edition, 4, 181-202
Juarez, B. (2011). Best Practices for University Bus Transit Programs: Identifying Strategies for Success. Applied Research Projects, Texas State University-San Marcos. Paper 352.
Islam, Md. A, Khadem, M. K. &Alauddin, Md. (2011). An empirical assessment of the relationship between service quality and customer Satisfaction in fashion house. Proceedings of the 2011 International Conference on Industrial Engineering and Operations Management Kuala Lumpur, Malaysia, January 22 – 24, 2011.
Khurshid, R., Naeem, H., Ejaz, S., Muhtar, F. & Batool, T. (2012). Service quality and customer satisfaction in public transport sector of Pakistan: An Empirical Study. International Journal of Economics and Management Sciences, 1(9), 24-30.
Kian, T. P., Latiff, K. B. & Lian Fong, S. W. (2012). The impact of „QUALBUS‟ towards customer satisfaction in public transportation. 2nd International Conference on Management Proceeding.
Kwabena, S. A. Brew, Y. & Addae-Boateng, S. (2013). Level of passengers‟ satisfaction of Metro Mass Transit Ltd.‟s service delivery in Koforidua, Eastern Region, Ghana. Research on Humanities and Social Sciences, 3(13), 52-65.
Ojo, T.K, Nutsugbodo, R. Y., Abane, A. M. & Amenumey, E. K. (forthcoming). Passenger‟s perspective of quality of intercity bus transport service on Cape Coast -Accra route,Ghana: A SERVQUAL Approach.
Ooi , K., Abdul Rahman, T., Lin , B. T. B.I. & Yee-Loong , C. A. (2011). Are TQM practices supporting customer satisfaction and service quality?. Journal of Services Marketing, 410-419.
Ojo T. K., Amoako-Sakyi R. and Agyeman W.
STUDENTS’ SATISFACTION OF CAMPUS SHUTTLING BUS SERVICES: A QUALBUS APPROACH
MANAGEMENT RESEARCH AND PRACTICE VOL. 7 ISSUE 1 (2015) PP: 68-79
79
Mana
gement
Rese
arc
h a
nd P
ract
ice
Volum
e 7
Iss
ue 1
/ M
arc
h 2
015
Theor
etica
l and
Empirica
l Rese
arc
hes
in U
rban
Mana
gement
mrp.ase.ro
ISSN
2067- 2462
ISSN
2067- 2462
Perez, M. S., Abad, J. C. G., Carrillo, G. M. M., & Fernandez, R. S. (2007). Effects of service quality dimensions on behavioural purchase intentions: A study in public-sector transport. Managing Service Quality, 17(2), 134-151.
Poku-Boansi, M. & Adarkwa, K. K. (2011). An analysis of the supply of urban public transport service in Kumasi, Ghana. Journal of Sustainable Development in Africa, 13(2), 28-40.
Rohani, M. Md., Wijeyesekera, D. C., & Karima, A. T. A. (2013). Bus operation, quality service and the role of bus provider and driver. Proceedia Engineering, 53, 167– 178.
Toor, W. & Havlick, S. W. (2004). Transportation and sustainable campus communities:issues,examples, Solutions. Washington, D.C.: Island Press.
Related Documents