1 Manuscript accepted for publication in Teachers College Record, 107(4), 529-562 Student Segregation and Achievement Tracking in Year-Round Schools ROSS E. MITCHELL Gallaudet University DOUGLAS E. MITCHELL University of California, Riverside Twenty-five percent of California’s elementary schoolchildren attend schools operating on nontraditional, staggered, overlapping attendance calendars collectively referred to as multitrack year-round education (MT-YRE). This case study reveals substantial differences in the characteristics of students and teachers across the four attendance tracks of eight MT-YRE schools in one large California school district. Analyses of Stanford Achievement Test data, controlling for student and teacher characteristics, reveal strong association of achievement with student demographic, programmatic, and teacher segregation within these MT-YRE schools. These findings suggest that MT-YRE readily (re)segregates students within schools and thereby inhibits access to equal educational opportunity relative to traditional and nontraditional single-track school calendars. Year-round (modified-calendar) schools are an important, but largely unstudied, component of the American public school system. 1 More than 4 percent of the nation’s 47 million public schoolchildren attend a year-round school. 2 Over 60 percent of the nation’s year-round-school students are enrolled in the California public school system alone. One million schoolchildren (2 percent of the national total and more than 15 percent of the California total) attend a California public school operating on a modified-calendar system known as multitrack year-round education (MT-YRE). 3 To gauge the scale of MT-YRE in California (the most prevalent form of year-round schooling in that state), less than one-third of the remaining 49 states have total public school enrollments as large as that in California’s MT-YRE schools. The prevalence of MT-YRE in California is not the only reason to emphasize its study, though any system of education that affects one million schoolchildren is worthy of attention in its own right. What is more important about California’s MT-YRE schools is that they are a striking example of how a state and its local school districts may administratively respond to population growth under fiscal constraint, a response seen or actively contemplated in other states as well (e.g., Florida, Nevada, North Carolina, and Utah); 4 and this response has potentially important, but generally unintended, educational consequences. In particular, MT- YRE is a system that differentiates school attendance groups with the potential for creating both social and academic segregation comparable to other curriculum-tracking practices that have received a great deal of scholarly attention in recent years. 5 Also, enrollment and staffing patterns within MT-YRE schools may be subject to the dynamics of family choice, choice in a context that has no transportation costs and relatively low information and transaction costs.

Welcome message from author
This document is posted to help you gain knowledge. Please leave a comment to let me know what you think about it! Share it to your friends and learn new things together.
Transcript
1
Manuscript accepted for publication in Teachers College Record, 107(4), 529-562
Student Segregation and Achievement Tracking in Year-Round Schools
ROSS E. MITCHELL
Gallaudet University
DOUGLAS E. MITCHELL
University of California, Riverside
Twenty-five percent of California’s elementary schoolchildren attend schools operating on
nontraditional, staggered, overlapping attendance calendars collectively referred to as
multitrack year-round education (MT-YRE). This case study reveals substantial differences in the
characteristics of students and teachers across the four attendance tracks of eight MT-YRE
schools in one large California school district. Analyses of Stanford Achievement Test data,
controlling for student and teacher characteristics, reveal strong association of achievement
with student demographic, programmatic, and teacher segregation within these MT-YRE
schools. These findings suggest that MT-YRE readily (re)segregates students within schools and
thereby inhibits access to equal educational opportunity relative to traditional and
nontraditional single-track school calendars.
Year-round (modified-calendar) schools are an important, but largely unstudied, component of
the American public school system.1 More than 4 percent of the nation’s 47 million public
schoolchildren attend a year-round school.2 Over 60 percent of the nation’s year-round-school
students are enrolled in the California public school system alone. One million schoolchildren (2
percent of the national total and more than 15 percent of the California total) attend a California
public school operating on a modified-calendar system known as multitrack year-round
education (MT-YRE).3 To gauge the scale of MT-YRE in California (the most prevalent form of
year-round schooling in that state), less than one-third of the remaining 49 states have total
public school enrollments as large as that in California’s MT-YRE schools.
The prevalence of MT-YRE in California is not the only reason to emphasize its study,
though any system of education that affects one million schoolchildren is worthy of attention in
its own right. What is more important about California’s MT-YRE schools is that they are a
striking example of how a state and its local school districts may administratively respond to
population growth under fiscal constraint, a response seen or actively contemplated in other
states as well (e.g., Florida, Nevada, North Carolina, and Utah);4 and this response has
potentially important, but generally unintended, educational consequences. In particular, MT-
YRE is a system that differentiates school attendance groups with the potential for creating both
social and academic segregation comparable to other curriculum-tracking practices that have
received a great deal of scholarly attention in recent years.5 Also, enrollment and staffing
patterns within MT-YRE schools may be subject to the dynamics of family choice, choice in a
context that has no transportation costs and relatively low information and transaction costs.
Segregation and Tracking in Year-Round Schools
2
MT-YRE AS ADMINISTRATIVE RESPONSE
Fiscal and political constraints on school construction in California have encouraged the
widespread adoption of MT-YRE calendars because such attendance scheduling allows schools
to serve more children with the same physical building space.6 This is accomplished by creating
multiple, staggered attendance calendars (“tracks” with differing vacation schedules) such that at
any given time, some fraction of the students (and their teachers) are not is session.7 The
prevalence of MT-YRE in California has essentially two causes: student population growth
exceeding school capacity and state policy encouraging MT-YRE implementation.
First, California has experienced an unabated influx of poorer, often immigrant families
into older urban and suburban neighborhoods since the 1980s, which has increased the
population densities of those neighborhoods.8 This increased population density has been a major
factor in why MT-YRE has been used to accommodate overcrowding and, since 1996, to find
classrooms to implement the California class size reduction initiative.9 These conditions also
help to explain why California’s MT-YRE schools are more frequently low-performing schools
compared to those operating on traditional or other single-track calendars.10
Second, throughout the 1990s, California’s Year-Round School Grant Program provided
an incentive for districts to continue or newly adopt MT-YRE operation in order to qualify for
state building funds for new school construction regardless of community demographics.11
From
San Diego in the south to the Sacramento Valley in the north and in roughly half of the coastal
and inland counties in between, over 1,000 schools in more than 100 urban, suburban, and rural
districts operate on some form of MT-YRE calendar. And of greatest significance to the present
study, at the end of the last decade, about one in every four of the state’s elementary school
students was attending an MT-YRE school.12
HOW MT-YRE SCHOOLS ARE ORGANIZED
The most common multitrack calendar is a rotating, four-track system with roughly one-fourth of
the student body not in attendance at any given time. The most prevalent rotation cycle is the
“60/20” model, where students are “on track” for three months (60 days) and “off track” for one
month (20 days).13
Thus, one-fourth of the students and their families are on vacation in any
given month. The typical process for making track assignments involves setting a sign-up date
for parents (often in the spring months of May or June) when new students and their families
express their track preferences.
In addition to calendar preference, student assignment is likely to be influenced by
several rules and practices governing track enrollment. Returning children are nearly always
guaranteed the right to remain on their current track if they wish. Families with siblings on a
specific track are typically given preferential access to placement on that track. And special-
circumstance appeals are sometimes allowed (e.g., to facilitate parental visitation for children
with divorced parents). Quite often schools also designate specific tracks for special programs
(such as athletic teams, band or other music programs, and bilingual education programs) in
order to avoid duplicating costs or to accommodate community preferences. In order to
participate in these programs, students are typically assigned to specific tracks.14
Once assigned
to an attendance track, students typically have little or no exposure to children in other tracks
during the instructional portion of their day. As discussed more fully below, the sign-up system
contributes to strikingly differentiated enrollment patterns.15
Segregation and Tracking in Year-Round Schools
3
ASSIGNMENT MECHANISMS
The MT-YRE calendar adds a layer of complexity to the assignment of students and staff. Three
mechanisms for distribution among attendance tracks have been identified in the research
literature: attendance boundary division, program differentiation, and preferential choice. First,
attendance boundary division subdivides the school’s neighborhood catchment area, effectively
creating multiple schools within the school. This appears to occur relatively infrequently; only
one case was found in the literature.16
Second, program differentiation concentrates specific types of students, personnel, and
resources on particular attendance tracks. There is no adequate empirical work on exactly how
programs are assigned to tracks. There are, however, anecdotes about this in the literature.17
As
noted in our findings, there is some confirming evidence from this study.
Third, preferential choice separates students in accordance with family preferences for
particular attendance tracks and allows teachers to seek their preferred work schedules. These
opportunities for choice are structured by district policies. Family and staff choice is unique to
MT-YRE schools. There are no choice opportunities in traditional-calendar schools,18
but
schools operating on an MT-YRE calendar are subject to the dynamics of parental choice
through sign-up queues employed to allocate children to preferred schedules. Parents exercise
their choices within the “neighborhood” school, a circumstance with information gathering and
transportation costs much lower than those typically associated with interschool or interdistrict
choice options.19
Additionally, the teacher labor market sometimes provides opportunities for
staff to seek assignment to preferred tracks. As shown below, significant consequences follow
these choice dynamics, which, in combination with program differentiation, yields significant
student and staff segregation.
POTENTIAL CONSEQUENCES
Two points are critical for understanding the potential social and educational consequences of
differentially distributing students and teachers among multiple attendance tracks. First, by
creating typically four distinct “schools within a school,” the MT-YRE calendar offers a
particularly powerful mechanism for separating and, as Shields and Oberg assert, potentially
“ghettoizing” groups within a school site.20
Even though students are enrolled at the same school
site, the staggered attendance pattern changes their schoolmates every month. As a consequence,
they come to see members of their attendance track as their primary classmates. Regardless of
the student assignment mechanism, classroom groups generally are separated by attendance track
for all instructional activities. Not only do students stay within a particular track for the entire
school year, they typically remain in the same track from one year to the next. Moreover, MT-
YRE is more commonly an elementary than secondary school phenomenon, and thus cohort
separation begins with the first day of kindergarten.
The second point to emphasize is that separating student track groups creates
opportunities for the development of significant biases in the distribution of educational
resources and opportunities. The MT-YRE calendar separates teachers, as well as students, into
groups by attendance track. As a consequence, teachers are not equally available to all students,
other teachers, or even their site administrators. When students go “off track,” so do their
teachers. Frequently as a result of resource limitations, teachers who work with special
Segregation and Tracking in Year-Round Schools
4
populations (English-language learners and special education students) or who are curriculum
specialists (e.g., music, physical education, and reading) are available only on specific
attendance tracks. This leads in turn to redistributing the students according to the available
instructional resources. This realignment or redistribution may be the intended consequence of
explicit policies or merely the unintended consequence of an effort to use resources efficiently.
Regardless, significant track-to-track differences in the distribution of educational resources and
opportunities are produced.
These issues of group separation and resource allocation are two major themes in the
well-established literature on curriculum tracking. That research helps to inform the data analysis
presented in this study by emphasizing a third theme—academic-achievement differences—
which is seen as dependent upon group and resource segregation. The curriculum-tracking
research literature draws attention to the fact that tracked programs do more to create resource
and opportunity differences for students than effectively respond to preexisting student
performance differences.21
Moreover, inaccurately placed students tend to stay in their initial
track placements.22
For example, the lower tracks, where poor and minority students are found in
higher concentration, all too often receive the least adequate teaching resources and display
stagnated student achievement growth.23
This research concludes that track assignments do more
to determine student outcomes than to respond to individual differences.24
Further, since
academic-performance advantages tend to be aligned with social-class differences among
children, schools’ curriculum-tracking policies abet the reproduction of social and cultural
advantages for certain groups.25
Three issues from curriculum-tracking research are attended to
in this study of MT-YRE attendance tracking: (a) the biased distribution of teaching talent, (b)
the sorting of students by demographic and programmatic characteristics, and (c) the differential
outcomes of schooling.26
As our study finds, MT-YRE schools are characterized by sharp
differentiation on each of these three dimensions.
PRIOR RESEARCH ON TRACK-TO-TRACK DIFFERENCES IN MT-YRE SCHOOLS
Prior research on the character and impact of MT-YRE school policies is quite limited. The
literature that does exist supports three conclusions:27
1. Attendance tracks that most resemble the traditional calendar are the most
popular.
2. Student demographics differ markedly from track to track.
3. The track-to-track student achievement gap can be quite large.
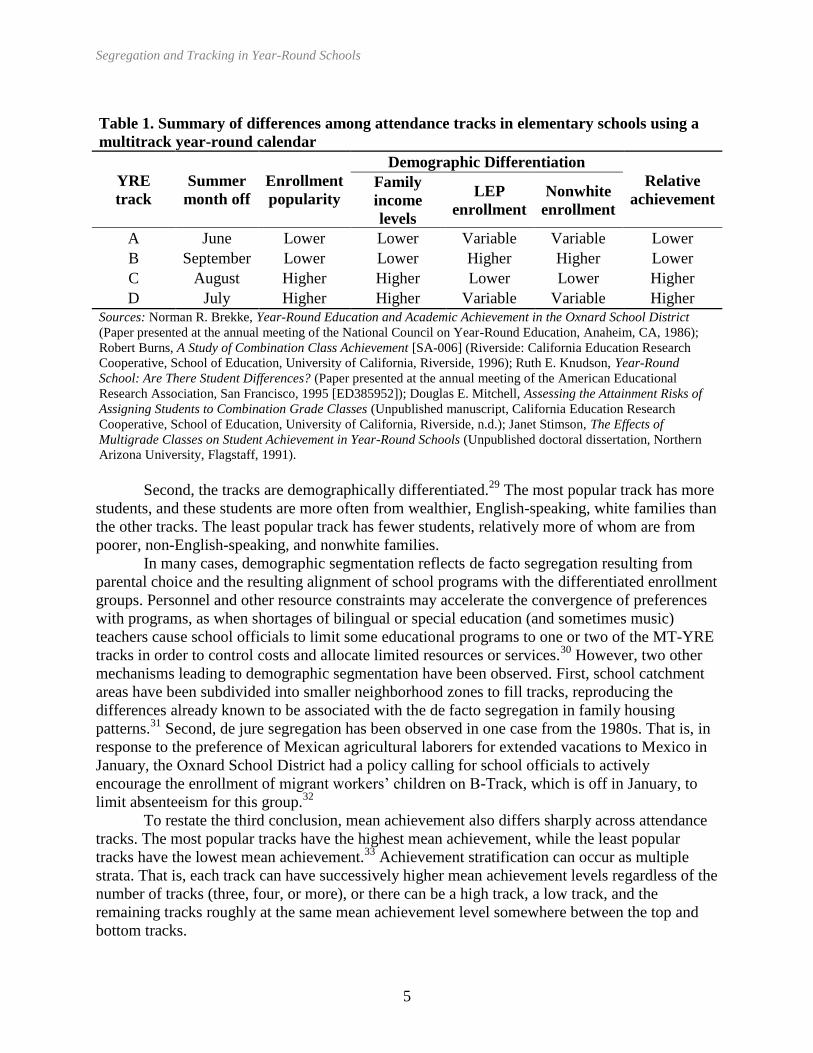
As shown in Table 1, the tracks differ not only in the months during which students are on
vacation, but also in family preference, student poverty levels, limited English-language
proficiency and nonwhite enrollment, and overall achievement levels. The rows in the table
identify the four different tracks of typical MT-YRE calendars. The columns identify intertrack
differences. As to the first point, tracks most like the traditional calendar (e.g., those with
summer vacation months in July or August) are the most popular and are always the first to fully
enroll. Late enrollees are generally assigned to the less popular tracks with more open slots.28
Segregation and Tracking in Year-Round Schools
5
Table 1. Summary of differences among attendance tracks in elementary schools using a
multitrack year-round calendar
YRE
track
Summer
month off
Enrollment
popularity
Demographic Differentiation
Relative
achievement Family
income
levels
LEP
enrollment
Nonwhite
enrollment
A June Lower Lower Variable Variable Lower
B September Lower Lower Higher Higher Lower
C August Higher Higher Lower Lower Higher
D July Higher Higher Variable Variable Higher Sources: Norman R. Brekke, Year-Round Education and Academic Achievement in the Oxnard School District
(Paper presented at the annual meeting of the National Council on Year-Round Education, Anaheim, CA, 1986);
Robert Burns, A Study of Combination Class Achievement [SA-006] (Riverside: California Education Research
Cooperative, School of Education, University of California, Riverside, 1996); Ruth E. Knudson, Year-Round
School: Are There Student Differences? (Paper presented at the annual meeting of the American Educational
Research Association, San Francisco, 1995 [ED385952]); Douglas E. Mitchell, Assessing the Attainment Risks of
Assigning Students to Combination Grade Classes (Unpublished manuscript, California Education Research
Cooperative, School of Education, University of California, Riverside, n.d.); Janet Stimson, The Effects of
Multigrade Classes on Student Achievement in Year-Round Schools (Unpublished doctoral dissertation, Northern
Arizona University, Flagstaff, 1991).
Second, the tracks are demographically differentiated.29
The most popular track has more
students, and these students are more often from wealthier, English-speaking, white families than
the other tracks. The least popular track has fewer students, relatively more of whom are from
poorer, non-English-speaking, and nonwhite families.
In many cases, demographic segmentation reflects de facto segregation resulting from
parental choice and the resulting alignment of school programs with the differentiated enrollment
groups. Personnel and other resource constraints may accelerate the convergence of preferences
with programs, as when shortages of bilingual or special education (and sometimes music)
teachers cause school officials to limit some educational programs to one or two of the MT-YRE
tracks in order to control costs and allocate limited resources or services.30
However, two other
mechanisms leading to demographic segmentation have been observed. First, school catchment
areas have been subdivided into smaller neighborhood zones to fill tracks, reproducing the
differences already known to be associated with the de facto segregation in family housing
patterns.31
Second, de jure segregation has been observed in one case from the 1980s. That is, in
response to the preference of Mexican agricultural laborers for extended vacations to Mexico in
January, the Oxnard School District had a policy calling for school officials to actively
encourage the enrollment of migrant workers’ children on B-Track, which is off in January, to
limit absenteeism for this group.32
To restate the third conclusion, mean achievement also differs sharply across attendance
tracks. The most popular tracks have the highest mean achievement, while the least popular
tracks have the lowest mean achievement.33
Achievement stratification can occur as multiple
strata. That is, each track can have successively higher mean achievement levels regardless of the
number of tracks (three, four, or more), or there can be a high track, a low track, and the
remaining tracks roughly at the same mean achievement level somewhere between the top and
bottom tracks.
Segregation and Tracking in Year-Round Schools
6
While the three conclusions are consistent across the case studies, we note that none of
these studies extensively explored the track segregation patterns for systematic covariation
among demographic and achievement variables. In particular, there were no attempts to
simultaneously consider all or even some of the factors identified in Table 1 when accounting for
track-to-track achievement differences. Further, neither the contributions of unequally distributed
teaching talent nor the dynamics of choice were identified in previous studies. In what follows,
we report on teacher, as well as student, segmentation across MT-YRE tracks, in a context where
track assignment preferences are a contributing factor, and more extensively investigate the
relationship between student achievement and segregation within MT-YRE schools.
A STUDY OF MT-YRE SCHOOLS IN ONE LARGE CALIFORNIA DISTRICT
Our data allow us to examine MT-YRE academic and social segregation as it has developed in
one large California school district. Extensive and detailed demographic and achievement data
on 12,174 traditional- and MT-YRE-calendar elementary school students in grades 2 through 6,
including professional background information about their teachers, were compiled for statistical
analysis (see Appendix A for details). At the time the data were collected (after the close of the
1997–98 school year), eight (30 percent) of the district’s elementary schools operated on an MT-
YRE calendar, enrolling roughly 37 percent of the district’s elementary students.34
This was, in
part, to comply with the requirements of the Year-Round School Grant Program.35
In a personal
communication, one district superintendent noted that the fiscal incentives offered by this state
grant program were compelling.36
By adopting MT-YRE, the district received higher priority for
state school building funds (and MT-YRE grant funding), which made MT-YRE a more
attractive option for responding to enrollment growth than double sessions, leasing or purchasing
relocatable classrooms, or seeking a school construction initiative on the local ballot.
The number of elementary students assigned to MT-YRE schools in this district rose
sharply in 1996, from 28 to 37 percent, to accommodate first-year implementation of
California’s class size reduction (CSR) initiative: Two additional elementary schools adopted
MT-YRE calendars. The average total school enrollment across all elementary schools in the
district in 1997–98 was 735; across MT-YRE schools, average enrollment was 913.37
A
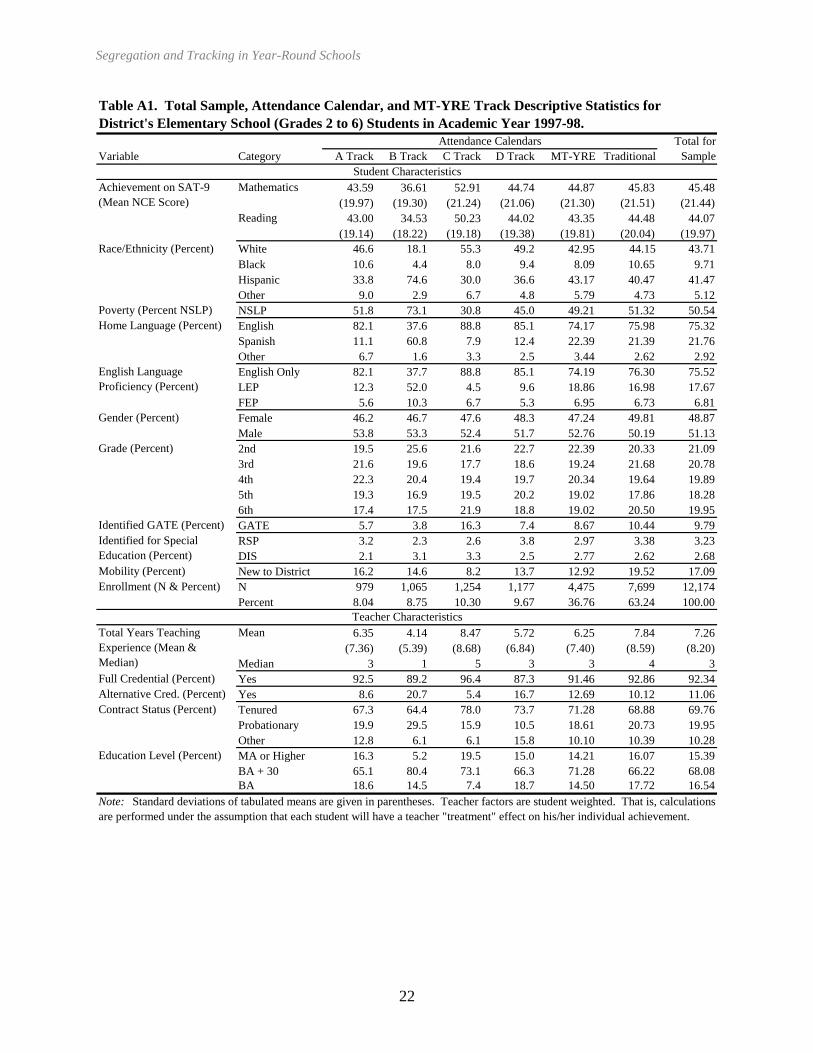
descriptive statistical profile of the district’s 12,000+ elementary school students (grades 2–6),
including track-to-track differences for the 4,000+ students in MT-YRE schools, is presented in
Appendix Table A1. Information from that table is described in the following sections.
THE STUDENTS
The elementary school student population is ethnically diverse. There is a plurality of white
students (43.7 percent), followed closely by Hispanics (41.5 percent). A much smaller proportion
of the enrollment is black (9.7 percent), with the remaining 5.1 percent, largely but not
exclusively Asian, classified as “other.” The poverty (National School Lunch Program [NSLP]
or free/reduced price lunch qualification) rate is 50.5 percent. English is the predominant home
language (75.3 percent), followed by Spanish (21.8 percent), with the remainder classified as
“other.” The proportion of the students classified as limited English proficient (LEP) is 17.7
percent. Another 6.8 percent are classified as fluent English proficient (FEP), with the remainder
being English only. There are a bit more Hispanic and other, LEP, and Spanish- and other-home-
Segregation and Tracking in Year-Round Schools
7
language students in MT-YRE than in traditional-calendar schools, but somewhat fewer poor
students.
Gender and grade are fairly evenly distributed. The second- and third-grade samples are
slightly larger than those in the higher grades. There are two types of special education
identifiers: gifted and talented (GATE) and special education. The GATE-identified proportion
of the sample is 9.8 percent. The special-education-identified students are divided into two
subgroups: resource specialist program (RSP) for low-achieving students (3.2 percent of the
sample) and designated instructional services (DIS) students with other handicapping conditions
(2.7 percent). About one student in six (17.1 percent) was new to the district in 1997–98. The
proportion of boys is higher in MT-YRE schools, compared to traditional-calendar schools, but
mobility and the proportion of GATE students is lower.
The average achievement levels in mathematics and reading on the spring 1998 statewide
administration of the Stanford Achievement Test, Ninth Edition, were recorded in the normal-
curve-equivalent (NCE) metric.38
The NCE scale permits the simultaneous comparison of
students across grade levels on a common metric, namely, performance relative to a nationally
representative sample of students taking the same tests. Additionally, the NCE scale corresponds
to national percentile rank scores at 1, 50, and 99, which helps to give some intuitive sense of
how well a student or group of students is performing on a given test level.39
For example, the
district-wide average achievement levels for mathematics and reading (45.48 NCE points and
44.07 NCE points, respectively) for this California school district’s elementary school students
are a little below the normed national mean of 50. Mean achievement in mathematics and
reading is about 1 NCE point lower in MT-YRE schools than in traditional-calendar schools.
THEIR TEACHERS
Nearly 20 percent of the students in the district have teachers on probationary contracts, while 67
percent have tenured teachers, with the remainder having the typically underqualified “Other”
contracts. About one-sixth of the students have a teacher who holds a bachelor’s degree, while
about four of six have a teacher with a bachelor’s degree plus 30 hours, and the remaining one in
six has a teacher who holds a master’s or higher degree. More than 90 percent of the students
have fully credentialed teachers, but slightly more than 11 percent have teachers who hold some
type of “alternative credential.” Across all students, teachers average 7.3 years of teaching
experience. Because of the presence in this district of a substantial number of very highly
experienced teachers, this mean experience value is misleading, however. A better estimate of
average teaching experience would be the median experience level, which is 3 years of
experience. Teachers in MT-YRE schools, on average, have less experience, are less likely to
have full credentials, are more likely to have alternative credentials, and are less likely to have
postbaccalaureate degrees, though more likely to have tenure, than those in traditional-calendar
schools. With this overview of the district’s elementary schools in mind, we turn to the
examination of our central research questions.
Segregation and Tracking in Year-Round Schools
8
INVESTIGATING ACADEMIC AND SOCIAL SEGREGATION IN MT-YRE SCHOOLS
Our data analysis documents seven key findings related to intertrack differences in the MT-YRE
schools. Rather than separate a description of what was learned from explanations of how the
data were analyzed, we describe the basis for each finding along with presentation of the finding
itself (see Appendix B for additional details regarding the statistical methods employed).
INTERTRACK ACHIEVEMENT GAPS ARE LARGE
Based on the differences between track-level means for mathematics and reading achievement,
MT-YRE attendance tracks are academically segregated to such an extent that children in the
lowest-achieving track (B) are academically about 1.5 years behind their peers in the highest-
achieving track (C).40
C-Track’s mean reading score is 50.78, fully 15.70 points above that for
B-Track. C-Track also outperforms A- and D-Tracks by 7.23 and 6.21 NCEs, respectively.41
The
mathematics story is similar. The A- and D-Track difference of 1.02 NCE points is not
significant, but both tracks are significantly above B-Track. C-Track has the very highest math
achievement at 52.91 NCEs, 16.30 points above B-Track, 10.68 above A-Track, and 8.17 above
D-Track.
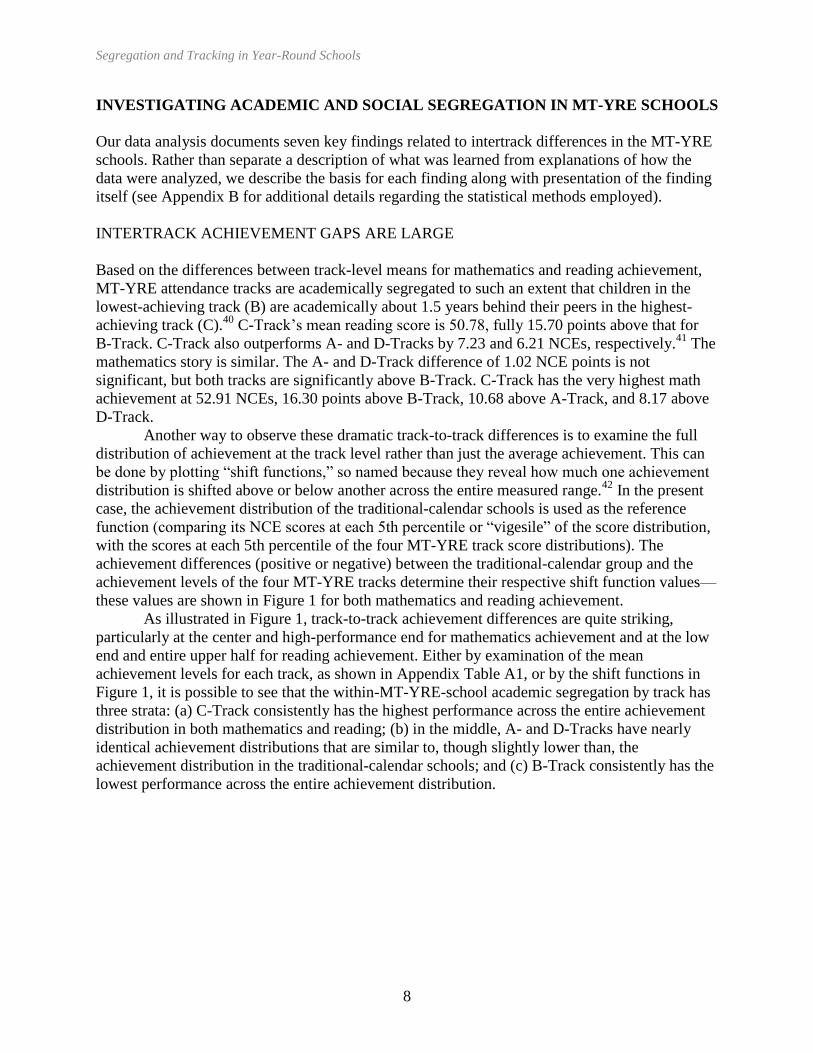
Another way to observe these dramatic track-to-track differences is to examine the full
distribution of achievement at the track level rather than just the average achievement. This can
be done by plotting “shift functions,” so named because they reveal how much one achievement
distribution is shifted above or below another across the entire measured range.42
In the present
case, the achievement distribution of the traditional-calendar schools is used as the reference
function (comparing its NCE scores at each 5th percentile or “vigesile” of the score distribution,
with the scores at each 5th percentile of the four MT-YRE track score distributions). The
achievement differences (positive or negative) between the traditional-calendar group and the
achievement levels of the four MT-YRE tracks determine their respective shift function values—
these values are shown in Figure 1 for both mathematics and reading achievement.
As illustrated in Figure 1, track-to-track achievement differences are quite striking,
particularly at the center and high-performance end for mathematics achievement and at the low
end and entire upper half for reading achievement. Either by examination of the mean
achievement levels for each track, as shown in Appendix Table A1, or by the shift functions in
Figure 1, it is possible to see that the within-MT-YRE-school academic segregation by track has
three strata: (a) C-Track consistently has the highest performance across the entire achievement
distribution in both mathematics and reading; (b) in the middle, A- and D-Tracks have nearly
identical achievement distributions that are similar to, though slightly lower than, the
achievement distribution in the traditional-calendar schools; and (c) B-Track consistently has the
lowest performance across the entire achievement distribution.
Segregation and Tracking in Year-Round Schools
9
Figure 1. MT-YRE and Traditional Attendance Calendar Student Achievement Differences
Shown as Shift Functions Plotted at Each 5th Percentile of the Traditional-Calendar (T)
Score Distribution
Mathematics Achievement
-15
-10
-5
0
5
10
15
10 15 20 25 30 35 40 45 50 55 60 65 70 75 80 85
At Each 5th Percentile of the Traditional Calendar NCE Score Distribution
MT
-YR
E T
rack
Dif
fere
nce
Sco
res
A
B
C
D
T
Reading Achievement
-15
-10
-5
0
5
10
15
10 15 20 25 30 35 40 45 50 55 60 65 70 75 80 85
At Each 5th Percentile of the Traditional Calendar NCE Score Distribution
MT
-YR
E T
rack
Dif
fere
nce
Sco
res
A
B
C
D
T
Segregation and Tracking in Year-Round Schools
10
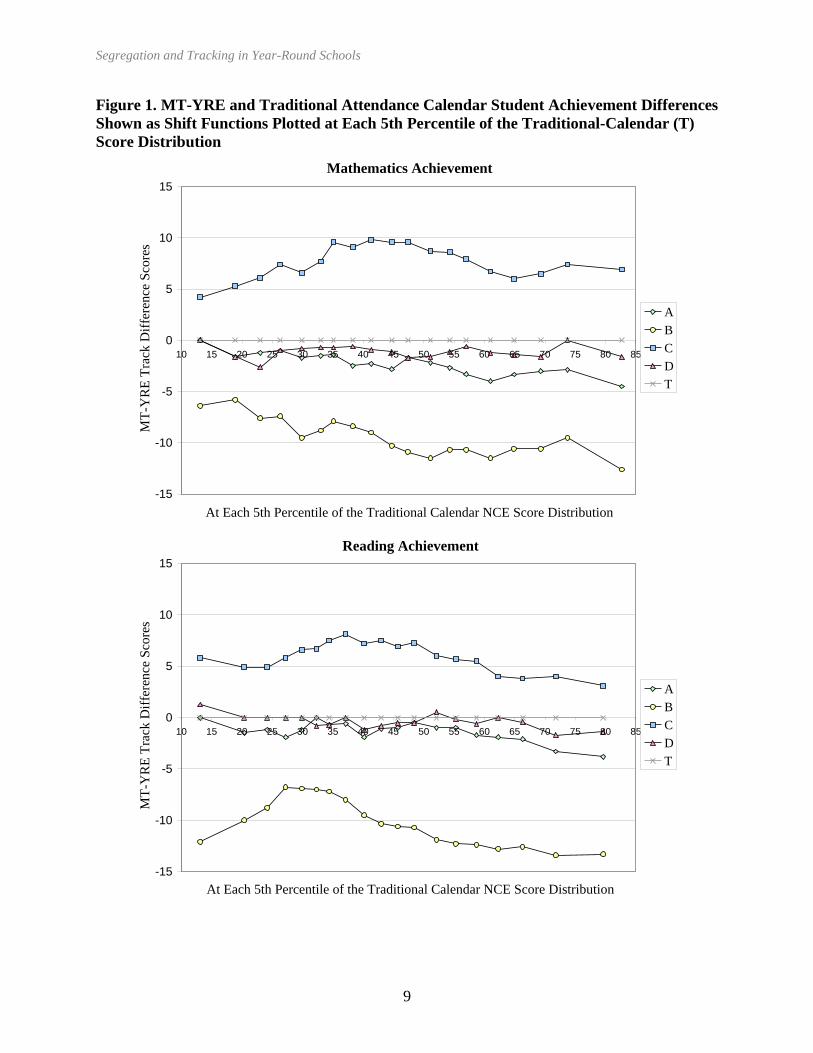
INTERTRACK STUDENT DEMOGRAPHIC SEGREGATION IS ALSO SUBSTANTIAL
In addition to substantial academic segregation, the MT-YRE tracking system exhibits very
substantial demographic segregation. Children in the lowest-achieving (B) track are almost 2.5
times as likely to be poor as those in the highest track (C). They are more than 5.5 times as likely
to be from a non-English-speaking home and almost twice as likely to be members of a nonwhite
ethnic group (see Table 2). In addition to the three student differences just noted, there is a large
gap in the proportion of students identified for GATE between the B- and C-Tracks, as well as a
notable difference in the student mobility rate. Program differentiation is almost certainly an
important contributor to this segregation.
Table 2. Intertrack student demographic comparisons (percentage composition)
MT-YRE attendance calendar
Statistic A-Track B-Track C-Track D-Track
Race/ethnicity
Percentage nonwhite 53.4 81.9 44.7 50.8
Standard error 1.6 1.2 1.4 1.5
Different from track B, C All 3 A, B, D B, C
Poverty (NSLP)
Percentage NSLP 51.8 73.1 30.8 45.0
Standard error 1.6 1.4 1.3 1.5
Different from track B, C, D All 3 All 3 A, B, C
Home language
Percentage non-English 17.9 62.4 11.2 14.9
Standard error 1.2 1.5 0.9 1.0
Different from track B, C All 3 A, B, D B, C
Identified GATE
Percentage GATE 5.7 3.8 16.3 7.4
Standard error 0.7 0.6 1.0 0.8
Different from track C C, D All 3 B, C
Mobility (New to district in 1997–98)
Percent new to district 16.2 14.6 8.2 13.7
Standard error 1.2 1.1 0.8 1.0
Different from track C C All 3 C
Enrollment
Number of students 979 1,065 1,254 1,177
Percentage 21.88 23.80 28.02 26.30 Note: For statistically significant differences in multiple pairwise comparisons of percentages
(Bonferroni adjusted), p < .05 is in roman type and p < .01 is in boldface type.
Though some of the demographic stratification (i.e., white vs. nonwhite and English vs.
non-English) singularly distinguishes B-Track from all of the other tracks by about the same
amount, more typically the differences reproduce the three strata found in the achievement
segregation described above. B-Track is lowest, C-Track is highest, and A- and D-Tracks have
Segregation and Tracking in Year-Round Schools
11
similar intermediate values. C-Track is most sharply distinguished from all other tracks when it
comes to GATE student enrollment and year-to-year student mobility. On these two variables A-
Track is significantly more “disadvantaged” than D-Track . In the case of student mobility, A-
Track has a rate even higher than B-Track. We should also note that home-language differences
involve more than an English vs. non-English linguistic separation. The proportion of students
from homes where “other” languages (predominantly Asian languages) are spoken is highest for
A-Track, which also has the highest proportion of students with “other” ethnicity (see Appendix
Table A1). Clearly, the demographic segmentation across MT-YRE attendance tracks observed
here is more complex than the initially obvious polar separation of B- and C-Tracks with A- and
D-Tracks occupying indistinguishable middle positions. Nevertheless, the demographic
segregation found among the four MT-YRE tracks is remarkably similar to the academic
segmentation discussed above. As documented in “Achievement Differences Are Closely Linked
to Demographic Segregation,” these demographic differences arising from student enrollment
account for a very substantial part of the intertrack achievement differences.
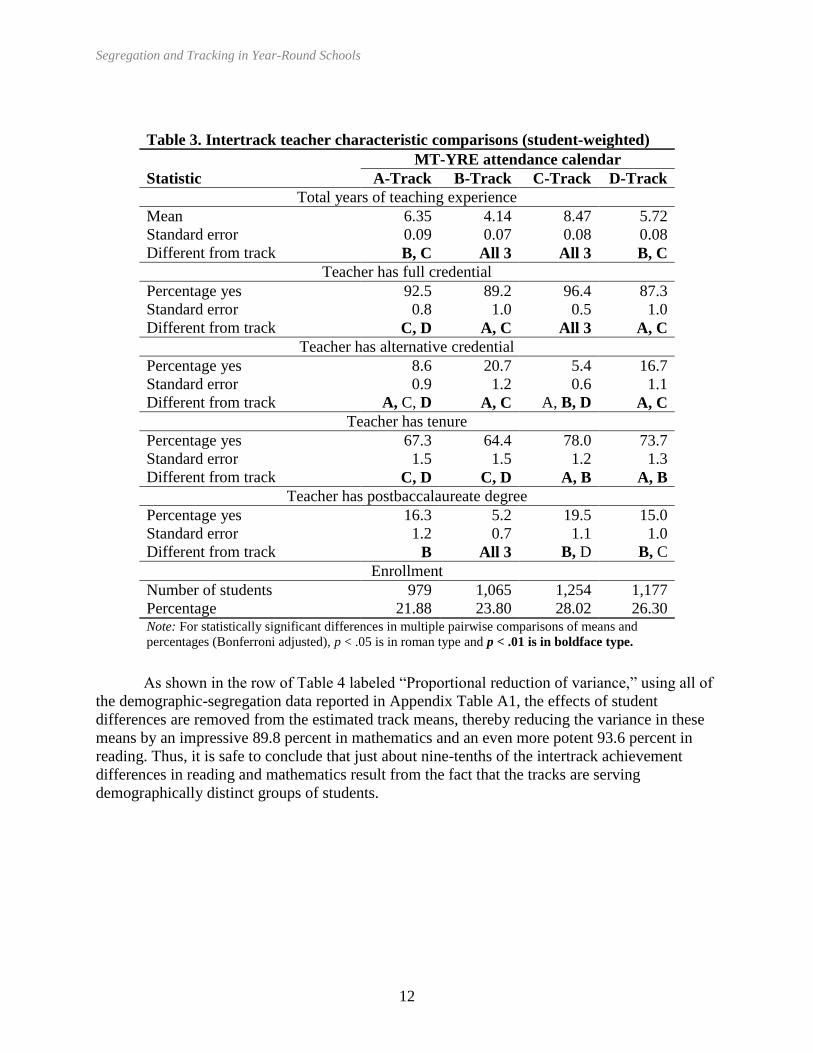
TRACKS EXHIBIT A CORRELATED SEGREGATION AMONG TEACHERS
Intertrack segregation is not limited to student achievement and demographics. In MT-YRE
schools, students are sharply differentiated in their access to experienced and credentialed
teachers. On average, students in the track with the lowest-achieving students (B-Track) have
teachers with four fewer years of teaching experience and are almost four times more likely to
have teachers with alternative credentials than the far more fully resourced C-Track students (see
Table 3). The C-Track also has the highest percentage of students whose teachers have tenure, a
full credential, and postbaccalaureate degrees, with the B-Track lowest on these measures of
teacher qualification as well (actually, D-Track has a slightly lower percentage of students with
teachers holding a full credential). As with demographic segregation, A- and D-Tracks have
some similarities (median teacher experience and teacher education level) and some differences
(teacher credential and contract status), such that the middle two tracks are distinguishable, and
not always in the middle relative to the B- and C-Tracks.
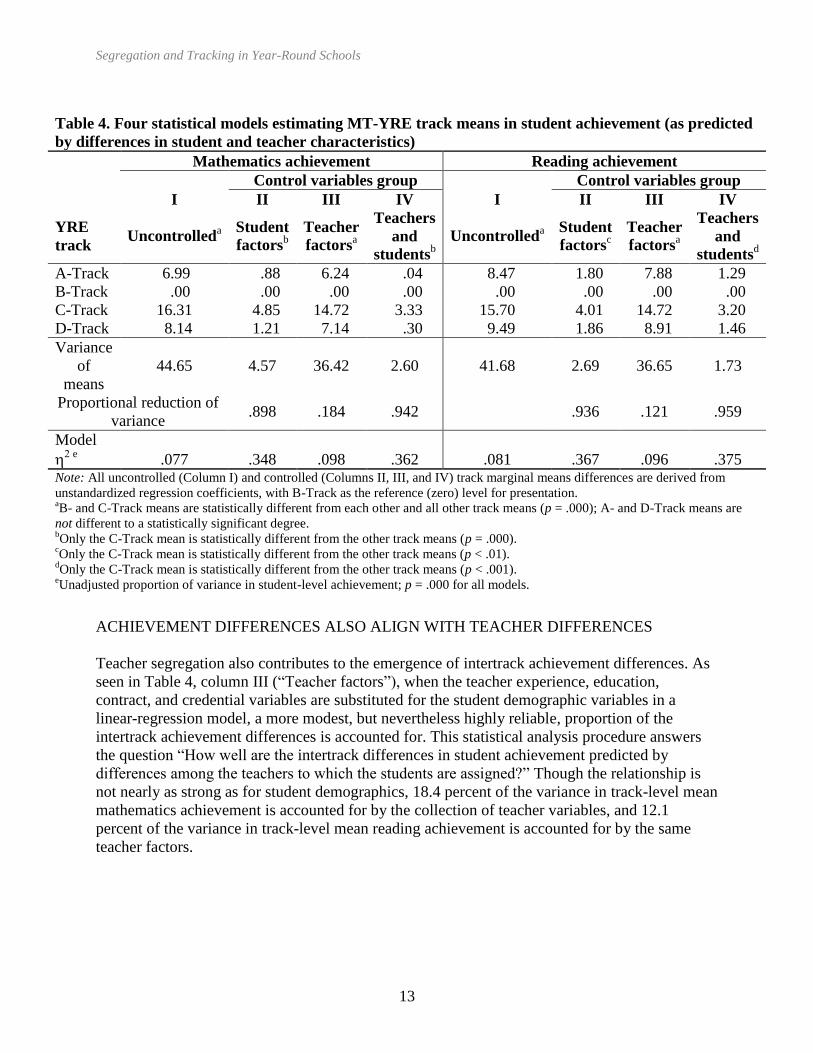
ACHIEVEMENT DIFFERENCES ARE CLOSELY LINKED TO DEMOGRAPHIC
SEGREGATION
Student demographic segregation accounts for a very substantial amount of the intertrack
achievement differences observed in this school district. That is, when a linear regression is used
to predict mean student achievement by track using the demographic characteristics of each
student, much of the variation across MT-YRE attendance tracks is accounted for. Column I in
Table 4 (“Uncontrolled”) reports the MT-YRE track means as they are found in the school
testing data. Column II (“Student factors”) shows how well intertrack differences in student
achievement are explained by demographic differences among the student groups enrolled in
each track.
Segregation and Tracking in Year-Round Schools
12
Table 3. Intertrack teacher characteristic comparisons (student-weighted)
MT-YRE attendance calendar
Statistic A-Track B-Track C-Track D-Track
Total years of teaching experience
Mean 6.35 4.14 8.47 5.72
Standard error 0.09 0.07 0.08 0.08
Different from track B, C All 3 All 3 B, C
Teacher has full credential
Percentage yes 92.5 89.2 96.4 87.3
Standard error 0.8 1.0 0.5 1.0
Different from track C, D A, C All 3 A, C
Teacher has alternative credential
Percentage yes 8.6 20.7 5.4 16.7
Standard error 0.9 1.2 0.6 1.1
Different from track A, C, D A, C A, B, D A, C
Teacher has tenure
Percentage yes 67.3 64.4 78.0 73.7
Standard error 1.5 1.5 1.2 1.3
Different from track C, D C, D A, B A, B
Teacher has postbaccalaureate degree
Percentage yes 16.3 5.2 19.5 15.0
Standard error 1.2 0.7 1.1 1.0
Different from track B All 3 B, D B, C
Enrollment
Number of students 979 1,065 1,254 1,177
Percentage 21.88 23.80 28.02 26.30 Note: For statistically significant differences in multiple pairwise comparisons of means and
percentages (Bonferroni adjusted), p < .05 is in roman type and p < .01 is in boldface type.
As shown in the row of Table 4 labeled “Proportional reduction of variance,” using all of
the demographic-segregation data reported in Appendix Table A1, the effects of student
differences are removed from the estimated track means, thereby reducing the variance in these
means by an impressive 89.8 percent in mathematics and an even more potent 93.6 percent in
reading. Thus, it is safe to conclude that just about nine-tenths of the intertrack achievement
differences in reading and mathematics result from the fact that the tracks are serving
demographically distinct groups of students.
Segregation and Tracking in Year-Round Schools
13
Table 4. Four statistical models estimating MT-YRE track means in student achievement (as predicted
by differences in student and teacher characteristics)
Mathematics achievement Reading achievement
Control variables group Control variables group
I II III IV I II III IV
YRE
track Uncontrolled
a
Student
factorsb
Teacher
factorsa
Teachers
and
studentsb
Uncontrolleda
Student
factorsc
Teacher
factorsa
Teachers
and
studentsd
A-Track 6.99 .88 6.24 .04 8.47 1.80 7.88 1.29
B-Track .00 .00 .00 .00 .00 .00 .00 .00
C-Track 16.31 4.85 14.72 3.33 15.70 4.01 14.72 3.20
D-Track 8.14 1.21 7.14 .30 9.49 1.86 8.91 1.46
Variance
of
means
44.65 4.57 36.42 2.60 41.68 2.69 36.65 1.73
Proportional reduction of
variance .898 .184 .942 .936 .121 .959
Model
e
.077 .348 .098 .362 .081 .367 .096 .375 Note: All uncontrolled (Column I) and controlled (Columns II, III, and IV) track marginal means differences are derived from
unstandardized regression coefficients, with B-Track as the reference (zero) level for presentation. aB- and C-Track means are statistically different from each other and all other track means (p = .000); A- and D-Track means are
not different to a statistically significant degree. bOnly the C-Track mean is statistically different from the other track means (p = .000).
cOnly the C-Track mean is statistically different from the other track means (p < .01).
dOnly the C-Track mean is statistically different from the other track means (p < .001).
eUnadjusted proportion of variance in student-level achievement; p = .000 for all models.
ACHIEVEMENT DIFFERENCES ALSO ALIGN WITH TEACHER DIFFERENCES
Teacher segregation also contributes to the emergence of intertrack achievement differences. As
seen in Table 4, column III (“Teacher factors”), when the teacher experience, education,
contract, and credential variables are substituted for the student demographic variables in a
linear-regression model, a more modest, but nevertheless highly reliable, proportion of the
intertrack achievement differences is accounted for. This statistical analysis procedure answers
the question “How well are the intertrack differences in student achievement predicted by
differences among the teachers to which the students are assigned?” Though the relationship is
not nearly as strong as for student demographics, 18.4 percent of the variance in track-level mean
mathematics achievement is accounted for by the collection of teacher variables, and 12.1
percent of the variance in track-level mean reading achievement is accounted for by the same
teacher factors.
Segregation and Tracking in Year-Round Schools
14
IN COMBINATION, TEACHER AND STUDENT SEGREGATION ACCOUNT FOR ABOUT
95 PERCENT OF ALL ACHIEVEMENT DIFFERENCES
To answer the question “How well are the intertrack differences in student achievement
explained by a combination of student and teacher differences?” a fourth regression model
includes all variables for both groups. The results of this regression model are shown in column
IV of Table 4, labeled “Teachers and students.” Taken together, the stratification of both students
and teachers accounts for 94.2 percent of the intertrack achievement differences in mathematics
and 95.9 percent of the intertrack differences in reading achievement.
Another way to see the dramatic impact of student and teacher stratification on intertrack
achievement differences is to look at the magnitude of the difference between the highest-
achieving track (C-Track) and the lowest-achieving track (B-Track). Without consideration of
the potential impact of student and teacher segregation, C-Track has a mean mathematics
achievement score that is 16.31 NCE points greater than that of B-Track (this is the equivalent of
about 1.5 years of normal achievement growth). When both student and teacher factors are
included in the linear-regression model, however, the remaining difference between these two
tracks is only 3.33 NCE points (the equivalent of only about three months of ordinary
achievement growth). For reading, the C-Track mean begins at 15.70 NCE points above the B-
Track mean. This difference is reduced to 3.20 NCE points after differences among students and
teachers assigned to the four different MT-YRE attendance tracks are accounted for.
ACHIEVEMENT DIFFERENCES BECOME LARGER WITH EXTENDED EXPOSURE TO
MT-YRE
Our last finding is the result of exploring how the patterns of student, teacher, and achievement
segregation might have been reinforced by MT-YRE school attendance tracking. To conduct this
exploration, we turn to one additional variable: the number of years each student has been
enrolled in an MT-YRE school. Though its interpretation is fairly subtle, the hypothesis to be
tested is straightforward. Put simply, by testing whether students with longer MT-YRE exposure
have achievement test scores that contribute more than those of their less exposed peers to
intertrack segregation (after controlling for student and teacher demographics, of course), it is
possible to determine whether the intertrack segregation is a dynamic and cumulative process,
rather than a one-time effect created by initial student and teacher track assignments. Though it
would have been more convincing to use multiyear learning trajectory data and track-to-track
migration patterns for this analysis, we have data from a single year and thus can make only a
post hoc inference regarding the dynamics of MT-YRE participation effects.43
The test of interest is performed by conducting a Track by Exposure analysis of
covariance (using the student and teacher demographic variables as covariates). If students with
longer exposure to MT-YRE play a dominant role in creating intertrack achievement differences,
their contributions will show up as a significant Track by Exposure interaction effect, indicating
that continued exposure changes the nature of intertrack differences. Once we find this
significant interaction effect, examination of the mean scores for each Track by Exposure group
will reveal that continued exposure reinforces rather than ameliorates track differences.
Before looking at the statistical output, we should note that any differences found in this
way could be the result of either or both of two quite different causes: (a) track-to-track
enrollment mobility might exacerbate student body segmentation by having higher-achieving
Segregation and Tracking in Year-Round Schools
15
students congregate in the high-achieving track (and low-achieving students move to congregate
in the low-achieving track) or (b) educational programs on the different tracks might be
differentially effective, raising (or lowering) the relative achievement of students with continued
exposure. If track by exposure differences are the result of mobility, family choices would be
responsible for segregating students; if they are the result of educational-program differences,
then unequal opportunities to learn are producing segregated achievement groups. Without
longitudinal achievement data we cannot distinguish these two explanations. The results reported
here establish only that existing track-to-track differences in student achievement are linked to
student longevity in MT-YRE schools for a particular track. That is, this statistical test for a
significant interaction between years in an MT-YRE school and the attendance track on which
the student is presently enrolled establishes that achievement differences across MT-YRE tracks
are compounded over time.
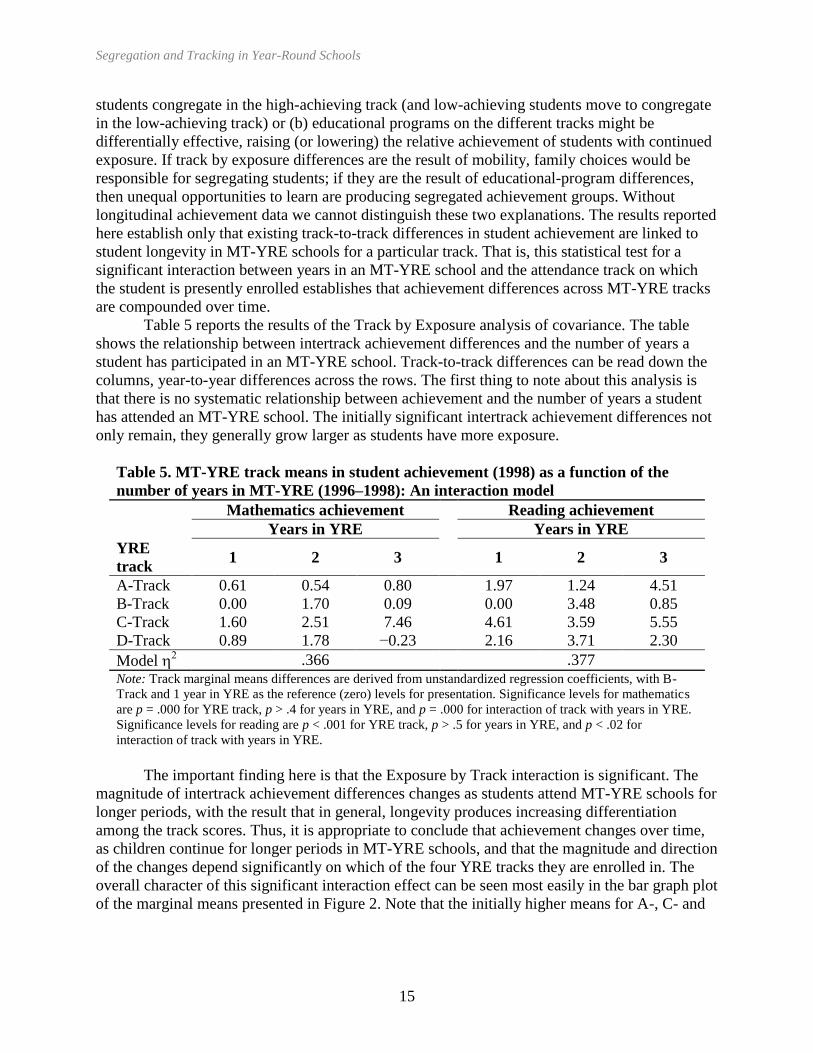
Table 5 reports the results of the Track by Exposure analysis of covariance. The table
shows the relationship between intertrack achievement differences and the number of years a
student has participated in an MT-YRE school. Track-to-track differences can be read down the
columns, year-to-year differences across the rows. The first thing to note about this analysis is
that there is no systematic relationship between achievement and the number of years a student
has attended an MT-YRE school. The initially significant intertrack achievement differences not
only remain, they generally grow larger as students have more exposure.
Table 5. MT-YRE track means in student achievement (1998) as a function of the
number of years in MT-YRE (1996–1998): An interaction model
Mathematics achievement Reading achievement
Years in YRE Years in YRE
YRE
track 1 2 3 1 2 3
A-Track 0.61 0.54 0.80 1.97 1.24 4.51
B-Track 0.00 1.70 0.09 0.00 3.48 0.85
C-Track 1.60 2.51 7.46 4.61 3.59 5.55
D-Track 0.89 1.78 −0.23 2.16 3.71 2.30
Model .366 .377
Note: Track marginal means differences are derived from unstandardized regression coefficients, with B-
Track and 1 year in YRE as the reference (zero) levels for presentation. Significance levels for mathematics
are p = .000 for YRE track, p > .4 for years in YRE, and p = .000 for interaction of track with years in YRE.
Significance levels for reading are p < .001 for YRE track, p > .5 for years in YRE, and p < .02 for
interaction of track with years in YRE.
The important finding here is that the Exposure by Track interaction is significant. The
magnitude of intertrack achievement differences changes as students attend MT-YRE schools for
longer periods, with the result that in general, longevity produces increasing differentiation
among the track scores. Thus, it is appropriate to conclude that achievement changes over time,
as children continue for longer periods in MT-YRE schools, and that the magnitude and direction
of the changes depend significantly on which of the four YRE tracks they are enrolled in. The
overall character of this significant interaction effect can be seen most easily in the bar graph plot
of the marginal means presented in Figure 2. Note that the initially higher means for A-, C- and
Segregation and Tracking in Year-Round Schools
16
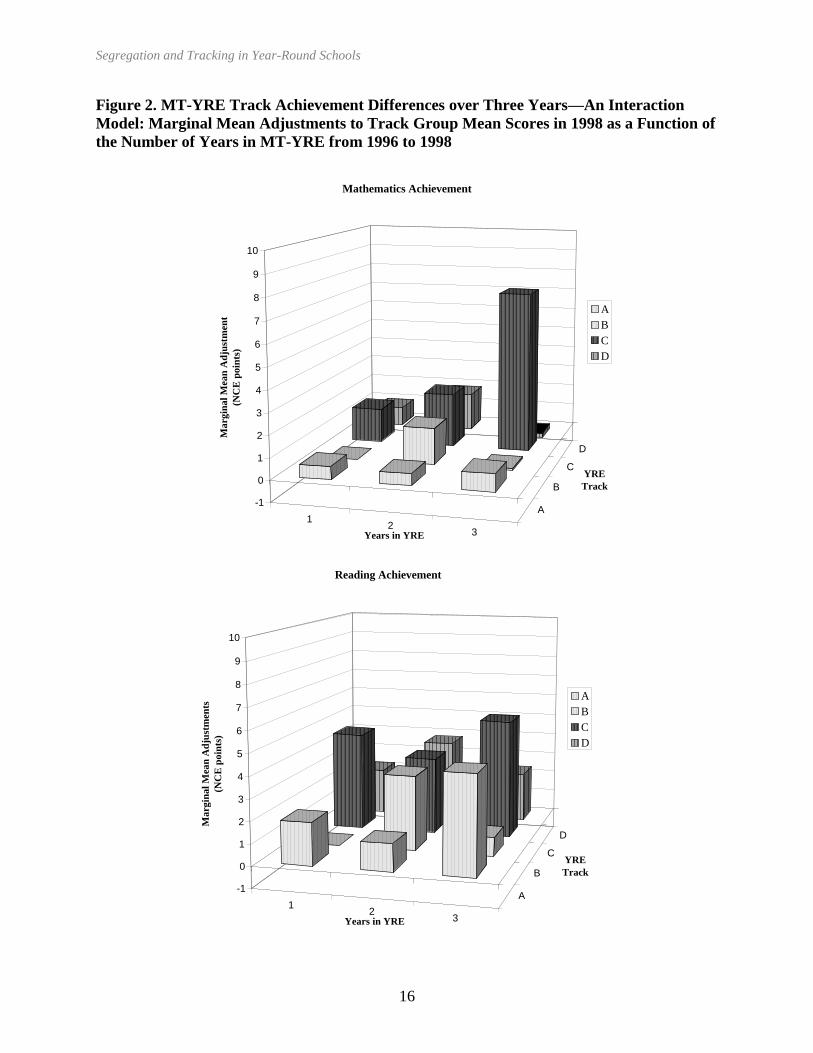
Figure 2. MT-YRE Track Achievement Differences over Three Years—An Interaction
Model: Marginal Mean Adjustments to Track Group Mean Scores in 1998 as a Function of
the Number of Years in MT-YRE from 1996 to 1998
12
3
A
B
C
D
-1
0
1
2
3
4
5
6
7
8
9
10
Ma
rgin
al
Mea
n A
dju
stm
ent
(NC
E p
oin
ts)
Years in YRE
YRE
Track
Mathematics Achievement
A
B
C
D
12
3
A
B
C
D
-1
0
1
2
3
4
5
6
7
8
9
10
Ma
rgin
al
Mea
n A
dju
stm
ents
(NC
E p
oin
ts)
Years in YRE
YRE
Track
Reading Achievement
A
B
C
D
Segregation and Tracking in Year-Round Schools
17
D-Track students can be seen along the left side of the graph. Among students in their second
MT-YRE year, A-Track drops below B-Track in both mathematics and reading, though the other
tracks continue to outperform the B-Track students. By the third year, B-Track has again become
the lowest-performing group, while C-Track greatly extends its margin of superiority in
mathematics.
Two key points are underscored by these bar graphs. First, the C-Track has a noteworthy
advantage. First-year C-Track students are somewhat ahead of their peers, while students with
three years of MT-YRE experience on the C-Track have a substantially larger lead over their
peers in other tracks in both mathematics and reading achievement. Additionally, across all four
tracks, the longer students are in enrolled in MT-YRE schools, the greater the divergence among
their current MT-YRE track means. Thus, we can safely conclude that the dynamics of MT-YRE
tracking are such that initial differences created largely by teacher allocation and student
demographic segmentation become exacerbated as children remain in these settings.
It is not clear whether these profound intertrack differences should be attributed to
instructional-program differences or to migration of students and teachers in ways that
concentrate resources and opportunities in the C-Track. While this issue needs to be studied with
better data than we now have, we suspect that initial track differences become exacerbated
primarily by the dynamics of student and teacher intertrack mobility.44
Nonetheless, since
extended exposure to the MT-YRE tracking system is associated with greater intertrack
achievement and demographic differences, it must be the case that either (a) families and
teachers recognize track-to-track differences and work to relocate themselves in ways that
increasingly segregate track membership or (b) the unbalanced resources available to the
different tracks significantly affect children’s learning opportunities. As the curriculum-tracking
literature has amply demonstrated, the kind of demographic and academic segregation found in
these multitrack schools is almost certain to have a cumulative and continuing negative effect on
the long-term educational success of some of the schools’ most vulnerable students.
SUMMARY OF THE FINDINGS
Multitrack YRE is associated with substantial social and academic segregation of both students
and teachers.45
First, we note that taken as a whole, MT-YRE schools differ from traditional-
calendar schools. MT-YRE schools have somewhat lower achievement, a bit more challenging
student populations, and slightly less adequate teaching resources than traditional-calendar
schools.46
These differences, though not profound, were observed to be statistically significant in
the present case.
Second, and more importantly, there is a very substantial segregation of students and
teachers among the four attendance tracks within MT-YRE schools—differences not well studied
in previous research. Data reviewed here show that MT-YRE school attendance tracks differ
sharply in student composition and academic achievement. Segmentation in this year-round
school population is initially substantial and, over the three years, appears to expand intertrack
achievement differences. The C-Track, with its vacation schedule most like that of the traditional
calendar and most popular with parents and students who actively choose tracks, is the highest-
achieving track and solidifies its advantage for students with extended enrollment. Over time, the
D-Track, with academic performance in the midrange among the attendance tracks, loses some
of its initial advantage. The B-Track, which is least like the traditional school in both population
and attendance schedule (and typically houses bilingual-education programs) starts out behind
Segregation and Tracking in Year-Round Schools
18
and gets further behind as student enrollment continues. Ninety-five percent of the intertrack
differences in 1997–98 are accounted for by demographic and programmatic segregation of
students in combination with unequal access to highly qualified teachers.47
HOW DOES SUCH ACADEMIC DISPARITY ARISE?
Data from this study demonstrate that MT-YRE calendar tracking tends to take on the very
features of curriculum tracking that have been the focus of so much recent analysis and criticism.
When students attend classrooms tracked by calendar, they wind up in groups also characterized
by segmented demographics and program services, with lower-performing students more likely
to be in classrooms with less fully qualified or less experienced teachers. Children are not
typically assigned to tracks in response to their performance, but through the exercise of
preferences (or constraints thereon), leading to differentiated learning opportunities as a
consequence of MT-YRE track selection.
The demographic segmentation of student and teacher groups appears to be sufficiently
powerful that we do not need to look to differences in instructional practice in order to account
for intertrack achievement differences. Track groups are as differentiated by social status as by
school services.48
This is not to say that instructional practices may not differ radically across
tracks, but that student and teacher segregation accounts for track-to-track differences in
achievement about as well as any other explanation that might be offered. An active and
powerful sorting system is operating within the MT-YRE schools of this California district.
One important consequence to highlight is this: In cases like the one studied here, where
districts have desegregation policies (or are under court order to desegregate), we are likely to
see significant social resegregation at the site level. To use Bourdieu’s language, the most
“culturally privileged” groups appear to be finding their way into tracks “capable of reinforcing
their advantage.” In all likelihood, they do so by pyramiding their collective “social capital” to
join preferred tracks and facilitate the accumulation of educational advantage.49
Additional research is needed, however. It is not clear whether intertrack achievement
differences should be viewed as entirely the consequence of the sociopolitical process of student
and teacher assignment or as involving significant educational factors as well. It is possible that
initial assignment differences create inequalities in educational effectiveness that “snowball” into
substantial achievement differences.50
It is equally likely, however, that initial differences are
compounded by parent and teacher awareness of track differentials that lead them to exercise
their choice options in ways that further exacerbate the initial segmentation. While the data
available for this study cannot distinguish between these possibilities, data monitoring intertrack
movement among students and teachers would show whether the large achievement differences
found here are created by student migration rather than instructional effectiveness differences.
We plan just such a study in the near future.
DIFFERENT BY DESIGN
In sum, our study is consistent with earlier case studies finding that the modest differences in
educational opportunity initially created by the establishment of multitrack year-round calendars
work to produce very substantial differences in the distribution of students, teachers, and
programs among the different attendance tracks. Selection of tracks by families and teachers and
the accompanying alignment of programs and services in response to these choices account for
Segregation and Tracking in Year-Round Schools
19
nearly all of the large academic-achievement disparities observed among the four MT-YRE
attendance tracks. Beginning with the earliest elementary school years, enrollment in particular
attendance tracks becomes the gateway for access to high-achieving classmates, experienced and
qualified teachers, and enriched curricular opportunities. Before children in kindergarten have a
chance to blossom, before the schools provide the opportunity for children to learn to read, write,
or calculate, they are segregated and tracked within their neighborhood MT-YRE schools.
Enrollment opportunities are distinct administrative designs that structure both choice
opportunities and resource allocations—and the consequences are substantial.
Family and staff choice play the dominant role in this process. These choices, when
exercised in the MT-YRE environment, appear to have roughly the same effect that they have in
the housing market: segregating advantaged and disadvantaged groups and creating a system that
separates strong, high-performance schools (or attendance tracks) from weak and low-
performing ones. If one primary purpose for establishing a free, mass, compulsory public
education system—supported by the taxing authority of the state to provide resources and the
police power of the state to compel participation—is the creation of more equitable life chances
for all children,51
MT-YRE programs like those found in our sample have to be viewed as a
threat to that goal. In recent years, education policy has been expanding choice on the grounds
that it will induce competition for excellence among the public schools; we see nothing in the
data reviewed here to support this proposition. Instead we see the competitive process being used
to differentiate and concentrate educational quality without raising overall achievement in any
measurable way.
Segregation and Tracking in Year-Round Schools
20
Appendix A
Detailed Description of Data
Student achievement data for this study are drawn from California’s state-mandated achievement
test administered in the spring of 1998 to students in grades 2 through 6 (Stanford Achievement
Test, Ninth Edition, Form T). The reading comprehension and mathematics total battery NCE
scores are used throughout this analysis.52
For each student, the data set also includes gender,
ethnicity, home language, grade, NSLP participation, English-language proficiency,
identification for special education or gifted education services, and interdistrict mobility
between annual test administrations. These variables are well known to be associated with
differences in student academic achievement.53
The NSLP variable serves as a poverty
indicator.54
The interdistrict-mobility variable identifies new or transient students. Student
English-language proficiency is coded as limited English proficient, fluent English proficient, or
English only. Special education services are coded as “not identified” for special education
services, “identified for the resource specialist program (RSP)”, or “identified for designated
instruction services (DIS).”55
For the purpose of analysis, and reflecting the student population in
the district, home language is coded as English, Spanish, or “Other.” Similarly, student ethnicity
is coded as white, Hispanic, black, or “Other.”
The students’ school and classroom assignment data make it possible to identify
attendance track and teacher. The four MT-YRE tracks are labeled “A” through “D.” The year-
round schools cycle on a fiscal calendar (July through June). The tracks are off in reverse
alphabetical order when the school year begins in July. D-Track has the first summer vacation
month in July, C-Track in August, B-Track in September, and A-Track in October (A-Track’s
third vacation month comes in June each year). Thus, C-Track is closest to the traditional
schedule, and B-Track is least like the traditional schedule, with many families perceiving D-
Track, which has the traditional summer vacation month of July, as more like the traditional
schedule than A-Track.
Student and teacher track assignments in MT-YRE schools were obtained for three
consecutive schools years: 1995–96 through 1997–98. Unfortunately, fully comparable student
achievement data across all three years were not available. As such, the MT-YRE attendance
trajectories of students could be determined, but not their achievement trajectories in both
mathematics and reading. However, for the purpose of comparing the relative achievement
ranking of each MT-YRE attendance track, mean mathematics and reading achievement levels
were calculated (statistics not reported here).
Teacher data from the California Basic Education Data System (CBEDS) Professional
Assignment Information File (PAIF) were linked to the student-level data file through the school,
grade, and teacher name fields reported in both files. The variables taken from the CBEDS PAIF
are (a) total years of teaching experience, (b) number of years of teaching experience within the
district, (c) education level, (d) credential status, and (e) contract status. Education level is coded
here as a bachelor’s degree (BA), bachelor’s degree with 30 or more semester hours of advanced
postsecondary education (+30), or at least a master’s degree (MA or Higher). Two dichotomous
credential status variables are used: the teacher has a full credential or not, and the teacher holds
an alternative credential or not.56
In addition, the teachers’ contractual status in the district is
coded in three categories: “Tenured” (beginning with the third full contract year using a
Preliminary or Clear credential), “Probationary” (two years or less experience or when using a
Segregation and Tracking in Year-Round Schools
21
temporary credential while eligible for regular contract status), and “Other” (a very small group
with typically little or no experience and not qualified for a probationary or tenured contract).
About 10 percent of the sample is excluded as a result of unavailability of either data
from the student records or CBEDS teacher data. After eliminating cases with missing data, the
total sample size dropped to 12,174 students. Teaching experience in the district is highly
correlated with total years of teaching experience. Thus, the years-of-teaching-in-the-district
variable was redundant and dropped from further analyses.57
As previously noted, a track-by-
track breakdown, along with totals for the MT-YRE schools, traditional-calendar schools, and
the sample as a whole, for all of the variables in this study are shown in Appendix Table A1.58
Segregation and Tracking in Year-Round Schools
22
43.59 36.61 52.91 44.74 44.87 45.83 45.48
(19.97) (19.30) (21.24) (21.06) (21.30) (21.51) (21.44)
43.00 34.53 50.23 44.02 43.35 44.48 44.07
(19.14) (18.22) (19.18) (19.38) (19.81) (20.04) (19.97)
Race/Ethnicity (Percent) White 46.6 18.1 55.3 49.2 42.95 44.15 43.71
Black 10.6 4.4 8.0 9.4 8.09 10.65 9.71
Hispanic 33.8 74.6 30.0 36.6 43.17 40.47 41.47
Other 9.0 2.9 6.7 4.8 5.79 4.73 5.12
Poverty (Percent NSLP) NSLP 51.8 73.1 30.8 45.0 49.21 51.32 50.54
English 82.1 37.6 88.8 85.1 74.17 75.98 75.32
Spanish 11.1 60.8 7.9 12.4 22.39 21.39 21.76
Other 6.7 1.6 3.3 2.5 3.44 2.62 2.92
English Only 82.1 37.7 88.8 85.1 74.19 76.30 75.52
LEP 12.3 52.0 4.5 9.6 18.86 16.98 17.67
FEP 5.6 10.3 6.7 5.3 6.95 6.73 6.81
Gender (Percent) Female 46.2 46.7 47.6 48.3 47.24 49.81 48.87
Male 53.8 53.3 52.4 51.7 52.76 50.19 51.13
Grade (Percent) 2nd 19.5 25.6 21.6 22.7 22.39 20.33 21.09
3rd 21.6 19.6 17.7 18.6 19.24 21.68 20.78
4th 22.3 20.4 19.4 19.7 20.34 19.64 19.89
5th 19.3 16.9 19.5 20.2 19.02 17.86 18.28
6th 17.4 17.5 21.9 18.8 19.02 20.50 19.95
Identified GATE (Percent) GATE 5.7 3.8 16.3 7.4 8.67 10.44 9.79
RSP 3.2 2.3 2.6 3.8 2.97 3.38 3.23
DIS 2.1 3.1 3.3 2.5 2.77 2.62 2.68
Mobility (Percent) New to District 16.2 14.6 8.2 13.7 12.92 19.52 17.09
N 979 1,065 1,254 1,177 4,475 7,699 12,174
Percent 8.04 8.75 10.30 9.67 36.76 63.24 100.00
6.35 4.14 8.47 5.72 6.25 7.84 7.26
(7.36) (5.39) (8.68) (6.84) (7.40) (8.59) (8.20)
Median 3 1 5 3 3 4 3
Full Credential (Percent) Yes 92.5 89.2 96.4 87.3 91.46 92.86 92.34
Alternative Cred. (Percent) Yes 8.6 20.7 5.4 16.7 12.69 10.12 11.06
Tenured 67.3 64.4 78.0 73.7 71.28 68.88 69.76
Probationary 19.9 29.5 15.9 10.5 18.61 20.73 19.95
Other 12.8 6.1 6.1 15.8 10.10 10.39 10.28
MA or Higher 16.3 5.2 19.5 15.0 14.21 16.07 15.39
BA + 30 65.1 80.4 73.1 66.3 71.28 66.22 68.08
BA 18.6 14.5 7.4 18.7 14.50 17.72 16.54
A Track
Achievement on SAT-9
(Mean NCE Score)
Mathematics
Table A1. Total Sample, Attendance Calendar, and MT-YRE Track Descriptive Statistics for
District's Elementary School (Grades 2 to 6) Students in Academic Year 1997-98.
Attendance Calendars Total for
SampleD Track MT-YRE TraditionalB Track C TrackVariable Category
Note: Standard deviations of tabulated means are given in parentheses. Teacher factors are student weighted. That is, calculations
are performed under the assumption that each student will have a teacher "treatment" effect on his/her individual achievement.
English Language
Proficiency (Percent)
Mean
Identified for Special
Education (Percent)
Contract Status (Percent)
Education Level (Percent)
Student Characteristics
Teacher Characteristics
Total Years Teaching
Experience (Mean &
Median)
Home Language (Percent)
Reading
Enrollment (N & Percent)
Segregation and Tracking in Year-Round Schools
23
Appendix B
Detailed Discussion of Statistical Methods
The test used for whether or not any particular factor significantly accounts for the variance ()
in student mathematics or reading achievement is the analysis of variance (ANOVA) F-test.
Multiple pairwise comparisons of MT-YRE attendance track group means (or proportions for
categorical variables, e.g., race/ethnicity, home language, special education services, teacher
education level) are tested using Bonferroni-adjusted significance levels.
As shown in Wilcox (see note 42), shift functions are calculated by first establishing the
score distribution for a reference group (here, all students attending traditional-calendar schools).
The score at each decile (the value at each tenth percentile of the achievement distribution) of the
reference distribution is then subtracted from the score at each decile of the “treatment” groups
(here, the four groups are the students attending each of the four MT-YRE attendance tracks),
leaving the residuals differences for each MT-YRE track to be plotted relative to the reference
group (the values at the endpoints of the distributions, i.e., 0 and 100 percent, are not included in
the plots); the reference group decile scores are also subtracted from the reference group deciles,
thus setting the values for the reference group to zero across the full range of the distribution.
However, rather than using deciles to construct our shift functions, we use vigesiles (the value at
each fifth percentile of the achievement distribution, i.e., at the 5th, 10th, 15th, …, 95th
percentiles). By doing so, we obtain greater continuity and resolution, which is justified since our
large sample sizes for each track permit reliable estimates for each 5th
percentile.
Multivariate estimates of marginal mean differences among the MT-YRE tracks are
computed using linear-regression coefficients. The mean achievement for students assigned to
each of the four tracks is estimated using the unstandardized regression coefficients estimated for
dummy-coded variables for tracks A, B, and C, with D as the reference group. However, because
B-Track has the lowest mean achievement level, which makes it the best reference group for
discussion purposes, the value of its regression coefficient is subtracted from the value of each of
the other three (A, C, and D). This procedure sets the value of the B-Track coefficient at zero and
causes the D-Track coefficient to have a nonzero value.
Statistical controls are used to adjust achievement scores for differences in student
demographics, program assignments, and teacher qualifications across tracks. Models are run
separately for total mathematics and for reading comprehension achievement subtest NCE
scores. Prior to controlling for the effects of both student and teacher characteristics, analyses are
undertaken to determine how well track mean achievement can be predicted by student
characteristics and by teacher qualifications separately.
To ascertain whether MT-YRE tracking has a dynamic and continuing impact on family
choices and student assignments, we test for a significant interaction between MT-YRE track
assignment and the number of years a child attended MT-YRE classes. In other words, in
addition to all of the student and teacher variables included above, a variable for the number of
years a child attended MT-YRE classes and the interaction terms between this variable and the
track to which the student was assigned are included in the linear-regression models previously
specified.
Segregation and Tracking in Year-Round Schools
24
This work was supported by the California Educational Research Cooperative, Graduate School
of Education, University of California, Riverside. The authors would like to acknowledge Robert
Hanneman, Steven Brint, Jon Lorence, Jane Hannaway, Barbara Schneider, Amy Stuart Wells,
and the Teachers College Record editor, as well as anonymous reviewers, for constructive
comments on previous drafts. Full responsibility for the content rests solely with the authors. An
earlier version of this article, submitted under the title “Organizational Segregation of Student
Achievement within Elementary Schools: The Influence of Multi-track Year-Round Schools,”
was presented at the 94th Annual Meeting of the American Sociological Association.
1 For detailed reviews of year-round schooling in general, see Harris Cooper, Jeffrey C. Valentine, Kelly Charlton,
and April Melson, “The Effects of Modified School Calendars on Student Achievement and on School and
Community Attitudes,” Review of Research in Education, 73 (2003): 1–52; Carolyn M. Shields and Linda J.
LaRocque, Literature Review on Year-Round Schooling (with Annotated Bibliography) (Report prepared for the
British Columbia Ministry of Education, Vancouver, British Columbia, Canada, 1996 [ED399661]); Jane L.
Zykowski, Douglas E. Mitchell, David Hough, and Sandra E. Gavin, A Review of Year-Round Education Research
(Riverside: California Education Research Cooperative, School of Education, University of California, Riverside,
1991). For a simpler and less detached review, see Carolyn M. Shields and Steven Lynn Oberg, Year-Round
Schooling: Promises & Pitfalls (Lanham, MD: Scarecrow Press, 2000). For a history of school calendar change
since the inception of mass public schooling in the nineteenth century, see Kenneth M. Gold, School’s In: The
History of Summer Education in American Public Schools (New York: Peter Lang, 2002).
2 See National Association for Year-Round Education, YRE Statistics: Growth of Public Year-Round Education in
the United States over a 15-Year Period (San Diego, CA: Author, 2002; retrieved June 13, 2002, from
http://www.nayre.org/statistics.html); Thomas D. Snyder (Proj. Dir.) and Charlene M. Hoffman (Prod. Mgr.), Digest
of Education Statistics, 2001 [NCES 2002-130] (Washington, DC: U.S. Department of Education, National Center
for Education Statistics, 2002); also Ross E. Mitchell, Segregation in California’s K–12 Public Schools: Biases in
Implementation, Assignment, and Achievement with the Multi-track Year-Round Calendar (Expert report prepared
for plaintiffs’ counsel, Eliezer Williams, et al. v. State of California, et al., Case No. 312236, Superior Court of the
State of California, County of San Francisco, San Francisco, CA, October 10, 2002; retrieved from
http://www.mofo.com/decentschools/expert_reports/mitchell_report.pdf).
3 Also see California Department of Education, California Year-Round Education Directory 2000–2001
(Sacramento: California Department of Education, School Facilities Planning Division, 2001; retrieved December
20, 2001, from http://www.cde.ca.gov/facilities/yearround/direct00.htm).
4 Billee A. Bussard, The Politics and Marketing of Year-Round School (Paper presented at the annual meeting of the
Florida Political Science Association, Gainesville, FL, March 21, 2003); Bethany Prohm and Nancy Baenen, Are
WCPSS Multi-track Elementary Schools Effective? [E&R Report No. 96E.03] (Raleigh, NC: Wake County Public
School System, Department of Evaluation and Research, January 1996 [ED395983]); Shields and LaRocque,
Literature Review on Year-Round Schooling.
5 See, for example, R. Scott Baker, “The Paradoxes of Desegregation: Race, Class, and Education, 1935–1975,”
American Journal of Education, 109 (2001): 320–343; Tom Loveless, The Tracking Wars: State Reform Meets
School Policy (Washington, DC: Brookings Institution Press, 1999); Samuel R. Lucas, Tracking Inequality:
Stratification and Mobility in American High Schools (New York: Teachers College Press, 1999); Jeannie Oakes,
“Two Cities’ Tracking and Within School Segregation,” Teachers College Record, 96 (1995): 681–690; Jeannie
Oakes, Amy Stuart Wells, Makeba Jones, and Amanda Datnow, “Detracking: The Social Construction of Ability,
Cultural Politics, and Resistance to Reform,” Teachers College Record, 98 (1997): 482–510; Amy Stuart Wells and
Irene Serna, “The Politics of Culture: Understanding Local Political Resistance to Detracking in Racially Mixed
Schools,” Harvard Education Review, 66 (1996): 93–118; Susan Yonezawa, Amy Stuart Wells, and Irene Serna,
“Choosing Tracks: ‘Freedom of Choice’ in Detracking Schools,” American Educational Research Journal, 39
(2002): 37–67; for a comprehensive review chapter, see Jeannie Oakes, Adam Gamoran, and Reba N. Page,
Segregation and Tracking in Year-Round Schools
25
“Curriculum Differentiation: Opportunities, Outcomes, and Meanings,” in P. W. Jackson, ed., Handbook of
Research on Curriculum (New York: Macmillan, 1992), pp. 570-608.
6 Robert Corley, The Condition of California School Facilities and Policies Related to Those Conditions (Expert
report prepared for plaintiffs’ counsel, Eliezer Williams, et al. v. State of California, et al., Case No. 312236,
Superior Court of the State of California, County of San Francisco, San Francisco, CA, October 10, 2002; retrieved
from http://www.mofo.com/decentschools/expert_reports/corley_report.pdf); Thomas G. Duffy, Educational
Facilities Issues in California: Williams v. State of California (Expert report prepared for defendants’ counsel,
Eliezer Williams, et al. v. State of California, et al., Case No. 312236, Superior Court of the State of California,
County of San Francisco, San Francisco, CA, April 18, 2003; retrieved from
http://www.mofo.com/decentschools/expert_reports/duffy_report.pdf); Legislative Analyst’s Office, Year-Round
School Incentive Programs: An Evaluation (Sacramento, CA: Author, April 1990).
7 Multitrack schools are quite different in design (and in their effects) from the much smaller group of single-track
year-round education (ST-YRE) schools that also reorganize the school attendance and vacation calendar. In ST-
YRE schools, students are all on the same schedule, typically attending classes three out of every four months of the
calendar year. In California, one-third of schools using a year-round calendar are ST-YRE schools. Since, by design,
these ST-YRE schools have lower enrollments, only one-quarter of the students attending year-round calendar
schools are enrolled in ST-YRE schools. (See notes 2 and 3 for data references.) Simply put, single-track year-round
schools merely redistribute the traditional “summer vacation” period into shorter break periods spread across the
year. This does not increase school enrollment capacity.
8 Joan L. Herman, “Novel Approaches to Relieve Overcrowding: The Effects of Concept 6 Year-Round Schools,”
Urban Education, 26 (1991): 195–213; Judi McClellan, “K–12 Enrollment Projections,” California Demographics
(Sacramento, CA: California Department of Finance, Demographic Research Unit, Winter 1997): 10; D. B. Smith,
“Finding Room for California’s Children,” Thrust for Educational Leadership, 21 (1992): 8–11. Also, as noted by
Shields and Oberg in Year-Round Schooling and Zykowski et al. in A Review of Year-Round Education Research,
some California school districts sought temporary relief from overcrowding through MT-YRE in the late 1970s
because state requirements for school construction created a long, drawn-out process from initial application for to
final occupation of a new building.
9 Steve Hymon, “A Lesson in Classroom Size Reduction,” School Planning and Management, 36 (1997): 18–23;
David C. Illig, Early Implementation of the Class Size Reduction Initiative [CRB-97-008] (Sacramento: California
Research Bureau, California State Library, April 1997); Joan McRobbie, Jeremy D. Finn, and Patrick Harman,
“Class Size Reduction: Lessons Learned from Experience,” WestEd Policy Brief, Number 23 (August 1998).
10
See, for example, Mitchell, Segregation in California’s K–12 Public Schools; Claire Quinlan, Cathy George, and
Terry Emmett, Year-Round Education: Year-Round Opportunities—A Study of Year-Round Education in California
(Sacramento: California State Department of Education, 1987 [ED285272]); Jeffrey A. White and Steven M.
Cantrell, Comparison of Student Outcomes in Multi-track Year-Round and Single-Track Traditional School
Calendars (Los Angeles: Los Angeles Unified School District, Program Evaluation and Research Branch, Policy
Analysis Unit, March 21, 2001).
11
A key requirement for receiving state financial assistance is that “a number of pupils, equal to or greater than 30
percent of the school district's total enrollment in kindergarten and grades 1 to 6, inclusive, are on the multitrack
year-round program” (California Education Code §42263.5.b.2); also see Duffy, Educational Facilities Issues in
California; Legislative Analyst’s Office, Year-Round School Incentive Programs.
12
California Department of Education, California Year-Round Education Directory 1997–98 (Sacramento:
California Department of Education, School Facilities Planning Division, 1998). However, relaxation of the voter
approval rate for local school bond initiatives from the two-thirds level established by the infamous Proposition 13
California ballot measure of 1978 down to 55 percent with the passage of Proposition 39 on California’s November
2000 ballot has made it possible for some districts to gain voter approval and thereby completely abandon the MT-
YRE schedule. Nonetheless, it remains to be seen exactly how many students and schools will continue on or be
added to the MT-YRE list.
Segregation and Tracking in Year-Round Schools
26
13
California Department of Education, California Year-Round Education Directory 2000–2001.
14
Robert B. Burns and Dewayne A. Mason, “Organizational Constraints on the Formation of Elementary School
Classes,” American Journal of Education, 103 (1995): 185–212; Marjorie F. Orellana and Barrie Thorne, “Year-
Round Schools and the Politics of Time,” Anthropology & Education Quarterly, 29 (1998): 446–472.
15
Also see Shields and Oberg, Year-Round Schooling.
16
Orellana and Thorne, “Year-Round Schools and the Politics of Time.”
17
Burns and Mason, “Organizational Constraints on the Formation of Elementary School Classes”; Shields and
Oberg, Year-Round Schooling.
18
Single-track-year-round-calendar schools, like traditional-calendar schools, have a common start date and single-
track attendance schedule for all students. In ST-YRE schools, there are no opportunities either for parental choice
or for student body segmentation among attendance tracks.
19
For a recent review of issues associated with school choice policies, see Jennifer Hochschild and Nathan
Scovronick, The American Dream and the Public Schools (New York: Oxford University Press, 2003).
20
See Shields and Oberg, Year-Round Schooling, esp. 67, 146–149, 165. However, if we were to adopt the
definition of “ghettoization” offered by Douglas S. Massey and Nancy A. Denton in American Apartheid:
Segregation and the Making of the Underclass (Cambridge, MA: Harvard University Press, 1993), 18–19, then a
certain set of circumstances would be required to allow only members of one identifiable group to be enrolled on a
particular attendance track without any noteworthy representation of another group on the same attendance track.
Namely, there would have to be enough students from one particular group enrolled so that the total enrollment of
an attendance track could be filled without other groups’ being represented to any significant extent. Circumstances
that would permit “ghettoization” do exist and have been noted in the literature, but profound isolation of any
particular group on one or more attendance tracks is not observed across all school sites in the current study.
21
For example, Maureen T. Hallinan, “Tracking: From Theory to Practice,” Sociology of Education, 67 (1994): 79–
84.
22
Hallinan, “Tracking”; Oakes, Gamoran, and Page, “Curriculum Differentiation.”
23
See review by Oakes, Gamoran, and Page in “Curriculum Differentiation.”
24
Also see Hobson v. Hansen, 1967, 1971, cited in Mark G. Yudof, David L. Kirp, Tyll van Geel, and Betsy Levin,
Kirp & Yudof’s Educational Policy and the Law: Cases and Materials, 2nd ed. (Berkeley, CA: McCutchan, 1982).
25
Pierre Bourdieu, “Cultural Reproduction and Social Reproduction,” in R. Brown, ed., Knowledge, Education, and
Cultural Change: Papers in the Sociology of Education (London: Tavistock for British Sociological Association,
1973), 71–112; Elizabeth G. Cohen, “Expectation States and Interracial Interaction in School Settings,” Annual
Review of Sociology, 8 (1982): 209–235.
26
See Oakes, Gamoran, and Page, “Curriculum Differentiation.”
27
Norman R. Brekke, Year-Round Education and Academic Achievement in the Oxnard School District (Paper
presented at the annual meeting of the National Council on Year-Round Education, Anaheim, CA, 1986); Robert
Burns, A Study of Combination Class Achievement [SA-006] (Riverside: California Education Research
Cooperative, School of Education, University of California, Riverside, 1996); Burns and Mason, “Organizational
Constraints on the Formation of Elementary School Classes”; Ruth E. Knudson, Year-Round School: Are There
Student Differences? (Paper presented at the annual meeting of the American Educational Research Association, San
Francisco, 1995 [ED385952]); Douglas E. Mitchell, Assessing the Attainment Risks of Assigning Students to
Segregation and Tracking in Year-Round Schools
27
Combination Grade Classes (Unpublished manuscript, California Education Research Cooperative, School of
Education, University of California, Riverside, n.d.); Orellana and Thorne, “Year-Round Schools and the Politics of
Time”; Janet Stimson, The Effects of Multigrade Classes on Student Achievement in Year-Round Schools
(Unpublished doctoral dissertation, Northern Arizona University, Flagstaff, AZ, 1991).
28
Burns, A Study of Combination Class Achievement; Knudson, Year-Round School; and Stimson, The Effects of
Multigrade Classes on Student Achievement in Year-Round Schools.
29
Brekke, Year-Round Education and Academic Achievement in the Oxnard School District; Burns, A Study of
Combination Class Achievement; Stimson, The Effects of Multigrade Classes on Student Achievement in Year-
Round Schools.
30
Burns and Mason, “Organizational Constraints on the Formation of Elementary School Classes.”
31
See Sandra E. Black, “Do Better Schools Matter? Parental Valuation of Elementary Education,” Quarterly
Journal of Economics, 114 (1999): 577–599; Orellana and Thorne, “Year-Round Schools and the Politics of Time”;
Joseph G. Weeres and Bruce Cooper, “Public Choice Perspectives on Urban Schools,” in James G. Cibulka, Rodney
J. Reed, and Kenneth K. Wong, eds., The Politics of Urban Education in the United States: The 1991 Yearbook of
the Politics of Education Association (Washington, DC: Falmer Press, 1992), 57–69.
32
Brekke, Year-Round Education and Academic Achievement in the Oxnard School District.
33
Burns, A Study of Combination Class Achievement; Knudson, Year-Round School; Mitchell, Assessing the
Attainment Risks of Assigning Students to Combination Grade Classes.
34
A highly detailed description of the district’s schools is not provided here in order to preserve the district’s
anonymity.
35
See note 11 for details.
36
The identity of the superintendent is kept confidential in order to protect the identity of the district.
37
These statistics were calculated from data in the CBEDS School Information File (SIF) for years 1995–96 through
1997–98. All of the district’s middle and high schools, as well as the remaining elementary schools, operated on a
traditional school calendar.
38
The Stanford Achievement Test, Ninth Edition, Form T, referred to as the California STAR, was the state-
mandated achievement test for all schools beginning with the 1997–98 school year. When referring to mathematics
and reading achievement on the STAR, we mean the total mathematics battery score and the reading comprehension
score, respectively. This choice was made because the prior years’ testing data available (1996 and 1997) did not
include the full reading battery or any of the language battery. Thus, any references to prior years’ scores are
consistent with current ones.
39
The NCE score is the normal-curve-equivalent score with a national sample mean adjusted to 50 points (not
exactly the median, but very close) and a standard deviation of 21.06 points for all grades. Achievement scores
reported on the NCE scale serve as interval-level, normally distributed outcome variables, which meet all
assumptions of the statistical methods employed in this study. For extreme scores, floor and ceiling effects may
occur, since the minimum score is 1 point and the maximum score is 99 points, corresponding to the 1st and 99th
percentile rankings, respectively. This and other test score scales are briefly discussed in Robert L. Linn,
“Assessments and Accountability,” Educational Researcher, 29 (2000): 4–16. In the sample reported here, there are
few extreme scores, and efforts to account for such truncated observations do not change the results.
40
Though it depends a little on the exact level of the test taken, one grade equivalent of achievement is about one-
half of a standard deviation, and the largest differences in achievement are about 16 NCE points, which is more than
three-quarters of a standard deviation.
Segregation and Tracking in Year-Round Schools
28
41
All MT-YRE attendance calendar pairwise comparisons of track means have p = .000, except that between A- and
D-Tracks, where p > .05 for both reading (F3, 4471 = 128.71) and mathematics (F3, 4471 = 122.52) achievement.
42
Rand R. Wilcox, Introduction to Robust Estimation and Hypothesis Testing (San Diego, CA: Academic Press,
1997).
43
As noted in Appendix A, prior years’ data were from a qualitatively different standardized achievement test.
Particularly for mathematics, using previous test results in combination with scores on the Stanford Achievement
Test in the estimation of learning trajectories would be inappropriate.
44
This is most strongly suggested by examination of one of the two schools that changed from traditional to MT-
YRE to accommodate class size reduction. This high-performing school (high enough to influence the year 2 bars in
Figure 2) had relatively evenly distributed achievement across tracks in its first MT-YRE year, but by the second
MT-YRE year, the differentiated achievement pattern had been established there as well.
45
A third type of opportunity segregation, the classroom teacher to which a student is assigned, would be expected
to operate relatively independently of any particular attendance calendar—remembering that there are significant
differences in teacher placements across tracks. That is, in addition to parental influence in choice of residence and
attendance track, a family may attempt to influence determination of the particular classroom and teacher to which
its child is assigned.
46
See, for example, Mitchell, Segregation in California’s K–12 Public Schools; Quinlan, George, and Emmett,
Year-Round Education; White and Cantrell, Comparison of Student Outcomes in Multi-track Year-Round and
Single-Track Traditional School Calendars.
47
A two-level hierarchical linear model (students within classrooms, using MT-YRE track as a dummy-coded
classroom-level covariate) confirms that classroom differences in teacher experience and proportions of students
identified as LEP, GATE, and in poverty (NSLP-eligible) account for the intertrack achievement differences. That
is, program, teacher, and socioeconomic-class differences create and reinforce track differences.
48
Orellana and Thorne, “Year-Round Schools and the Politics of Time.”
49
Bourdieu, “Cultural Reproduction and Social Reproduction,” 85.
50
Brian Rowan and Andrew W. Miracle, Jr., “Systems of Ability Grouping and the Stratification of Achievement in
Elementary Schools,” Sociology of Education, 56 (1983): 133–144.
51
Hochschild and Scovronick, The American Dream and the Public Schools.
52
Also see note 42.
53
See, for example, Doris R. Entwisle, Karl L. Alexander, and Linda Steffel Olson, Children, Schools, and
Inequality (Boulder, CO: Westview Press, 1997); Douglas E. Mitchell, Tom Destino, and Rita Karam, Evaluation of
English Language Development Programs in the Santa Ana Unified School District: A Report on Data System
Reliability and Statistical Modeling of Program Impacts [SA-008] (Riverside: University of California, Riverside,
School of Education, California Educational Research Cooperative, 1997); Ross E. Mitchell, “Class Size Reduction
Policy: Evaluating the Impact on Student Achievement in California,” Dissertation Abstracts International, 62(07):
2305A (September 2001 [UMI No. 3021397]); Alvin S. Rosenthal, Keith Baker, and Alan Ginsburg, “The Effect of
Language Background on Achievement Level and Learning among Elementary School Students,” Sociology of
Education, 56 (1983): 157–169; Russell W. Rumberger, Katherine A. Larson, Robert K. Ream, and Gregory A.
Palardy, The Educational Consequences of Mobility for California Students and Schools [Research Series 99-2]
(Berkeley, CA: Policy Analysis for California Education, 1999).
Segregation and Tracking in Year-Round Schools
29
54
As reported in John F. Witte, “The Milwaukee Voucher Experiment,” Educational Evaluation and Policy
Analysis, 20 (1998): 229–252, eligibility for free lunch comes at or below 1.35 times the poverty level; eligibility for
reduced price lunch is at or below 1.85 times the poverty level.
55
Students with handicapping conditions severe enough to be assigned to a special day class (SDC) typically take
out-of-level tests and thus are eliminated from the study sample.
56
It would be possible to have both a full and an alternative credential if, for example, the holder of a secondary-
level credential is teaching at the elementary level on a waiver. It would also be possible if an elementary teacher
has an emergency credential to fill a bilingual or ESL teaching position requiring additional authorizations.
57
The Pearson product-moment correlation coefficient is close to one (r = .95) for this pair of teacher experience
variables. This and all other analyses were performed using software developed by SPSS, Inc., SPSS for Windows,
Version 9.0 (Chicago: Author, 1999).
58
Additional technical details and statistical breakdowns were reported in Ross E. Mitchell and Douglas E. Mitchell,
Student Segregation and Achievement Tracking in Year-Round Schools [Originally submitted as Organizational
Segregation of Student Achievement in Elementary Schools: The Influence of Multi-track Year-Round Schools]
(Paper presented at the annual meeting of the American Sociological Association, Chicago, IL 1999 [ED462756]).
ROSS E. MITCHELL is a research scientist in the Gallaudet Research Institute at Gallaudet
University. His research interests include education policy analysis and evaluation, sociology of
education, demography, and deafness. His recent publications include “The Political Economy of
Education Policy: The Case of Class Size Reduction” and “Demographic and Achievement
Characteristics of Deaf and Hard of Hearing Students.”
DOUGLAS E. MITCHELL is Professor of Education in the Graduate School of Education,
University of California, Riverside. His research interests include education policy formation and
implementation, organization and control of school systems, labor relations and teacher
incentives, citizen influence, and school politics. His forthcoming book is titled The New
Foundations of Educational Administration, Policy and Politics: Science and Sensationalism
(Erlbaum).
Related Documents