electronic reprint Acta Crystallographica Section D Biological Crystallography ISSN 0907-4449 Structure of human uropepsin at 2.45 ˚ A resolution Fernanda Canduri, L ´ ivia G. V. L. Teodoro, Valmir Fadel, Carla C. B. Lorenzi, Valde- mar Hial, Roseli A. S. Gomes, Jo ˜ ao Ruggiero Neto and Walter F. de Azevedo Jr Copyright © International Union of Crystallography Author(s) of this paper may load this reprint on their own web site provided that this cover page is retained. Republication of this article or its storage in electronic databases or the like is not permitted without prior permission in writing from the IUCr. Acta Cryst. (2001). D57, 1560–1570 Canduri et al. Uropepsin

Welcome message from author
This document is posted to help you gain knowledge. Please leave a comment to let me know what you think about it! Share it to your friends and learn new things together.
Transcript
electronic reprint
Acta Crystallographica Section D
BiologicalCrystallography
ISSN 0907-4449
Structure of human uropepsin at 2.45 A resolution
Fernanda Canduri, Livia G. V. L. Teodoro, Valmir Fadel, Carla C. B. Lorenzi, Valde-mar Hial, Roseli A. S. Gomes, Joao Ruggiero Neto and Walter F. de Azevedo Jr
Copyright © International Union of Crystallography
Author(s) of this paper may load this reprint on their own web site provided that this cover page is retained. Republication of this article or itsstorage in electronic databases or the like is not permitted without prior permission in writing from the IUCr.
Acta Cryst. (2001). D57, 1560–1570 Canduri et al. � Uropepsin
research papers
1560 Canduri et al. � Uropepsin Acta Cryst. (2001). D57, 1560±1570
Acta Crystallographica Section D
BiologicalCrystallography
ISSN 0907-4449
Structure of human uropepsin at 2.45 AÊ resolution
Fernanda Canduri,a LõÂvia G. V. L.
Teodoro,b Valmir Fadel,a
Carla C. B. Lorenzi,a Valdemar
Hial,b Roseli A. S. Gomes,b
JoaÄo Ruggiero Netoa and
Walter F. de Azevedo Jra,c*
aDepartamento de FõÂsica, IBILCE, UNESP, SaÄo
Jose do Rio Preto, SP 15054-000, Brazil,bDepartamento de CieÃncias BioloÂgicas, FMTM,
Uberaba, MG 38015-050, Brazil, and cCenter
for Applied Toxinology, Instituto Butantan,
Av. Vital Brasil, 1500 SaÄo Paulo, SP 05503-900,
Brazil
Correspondence e-mail:
# 2001 International Union of Crystallography
Printed in Denmark ± all rights reserved
The molecular structure of human uropepsin, an aspartic
proteinase from the urine produced in the form of pepsinogen
A in the gastric mucosa, has been determined by molecular
replacement using human pepsin as the search model. Crystals
belong to space group P212121, with unit-cell parameters
a = 50.99, b = 75.56, c = 89.90 AÊ . Crystallographic re®nement
led to an R factor of 0.161 at 2.45 AÊ resolution. The positions
of 2437 non-H protein atoms in 326 residues have been
determined and the model contains 143 water molecules. The
structure is bilobal, consisting of two predominantly �-sheet
lobes which, as observed in other aspartic proteinases, are
related by a pseudo-twofold axis. A model of the uropepsin±
pepstatin complex has been constructed based on the
high-resolution crystal structure of pepsin complexed with
pepstatin.
Received 10 September 2000
Accepted 23 August 2001
PDB Reference: uropepsin,
1flh.
1. Introduction
Aspartic proteinases (E.C. 3.4.23) form a class of proteolytic
enzymes that share the same catalytic apparatus. Members of
the aspartic proteinase family can be found in different
organisms ranging from humans to plants and retroviruses.
The best known sources are in the mammalian stomach, yeast
and fungi, with porcine pepsin as the archetype, having been
the ®rst enzyme in this family to be sequenced and crystallized
(Szecsi, 1992).
Aspartic proteinases are classi®ed as the fourth major class
of proteolytic enzymes, distinct from the serine-, cysteine- and
metalloproteinases (Hara et al., 1993). The functions of these
enzymes are manifold, from non-speci®c digestion of proteins
to highly specialized processing of proteinaceous substrates.
The substrate-binding sites of aspartic proteinases, being
extended, are capable of interacting with up to seven amino-
acid residues of a substrate (Filippova et al., 1996). The
aspartic proteinases are characterized by the presence of two
aspartic acid residues at the active site. They tend to cleave
between hydrophobic amino acids, but secondary interactions
are important in the de®nition of their speci®city (Powers et
al., 1977). Extensive homology between sequences has been
observed among the enzymes belonging to this family.
The catalytic apparatus in all the aspartic proteinases is
virtually the same and the differences among these enzymes
arise mainly from the differences in speci®city resulting from
the structural evolution of the sites for substrate side-chain
binding. The hypothesis that the aspartic proteinases share the
same catalytic apparatus is also supported by the fact that they
are universally inhibited by pepstatin, a transition-state
analogue inhibitor (Marciniszyn et al., 1976).
electronic reprint
The gastric proteinases consist of single polypeptidic chains
with three intramolecular disul®de bridges. In the sequences
of these enzymes there is a predominance of side-chain
carboxyl groups and the presence of a relatively large number
of residues of prolines and aromatic amino acids (Plebani,
1993). All the gastric proteinases have a high content of
dicarboxylic and �-hydroxy amino acids, but rather low
contents of basic amino acids (Foltmann, 1981).
Pepsin is produced by the human gastric mucosa in seven
different zymogen isoforms (Foltmann, 1981). These have
been subdivided into two types: pepsinogen A (PGA1-5) and
pepsinogen C (PGC6 and 7), both consisting of molecular
variants (isozymogens) that differ in net ionic charge (Samloff
& Taggart, 1987). Pepsinogens are not secreted merely into
the gastric lumen but also into the systemic circulation (Ten
Kate et al., 1988).
Pepsinogens A and C are translocated from the peptic cells
into the circulation and are present in serum (Samloff &
Townes, 1970). However, only pepsinogen A can be found in
urine by electrophoresis (Samloff & Townes, 1970), indicating
a different renal handling of pepsinogen A and pepsinogen C
(Ten Kate et al., 1988). Studies comparing the proteolytic
activity of serum and urine have shown that the amount of
pepsinogens in the urine correlate with the levels in serum.
The concentration of pepsinogens in the urine, however,
exceeds serum levels by about 10±100 times (Hirschowitz et
al., 1957), which indicates a high clearance rate from the blood
(Ten Kate et al., 1988). The values of molecular weights of
these proteins are around 40 000 Da for the zymogens and
about 35 000 Da for the active enzymes.
The zymogens have a relatively higher amount of basic
amino acids and, where the sequence is known, these extra
basic amino acids are located in the amino-terminal segment
of the peptide chain. There is evidence suggesting that this is a
general structural feature of zymogens for the gastric
proteinases (Foltmann, 1981). At neutral pH, the zymogens
are stabilized in an inactive conformation by means of
electrostatic interactions between basic amino-acid residues in
the N-terminal propart of the peptide chain and the negative
charges of the dicarboxylic acids in the enzyme moiety of the
enzyme. By lowering the pH the carboxyl groups become
protonated and the zymogen molecules undergo a confor-
mational change leading to enzymatic activity without
cleavage of a peptide bond. At pH 2, this conformational
change, in which the active site is uncovered, occurs as a ®rst-
order reaction and the change is at least partly reversed by
raising the pH (Foltmann, 1981). The reaction proceeds by
autocatalytic limited proteolysis, which ®nally removes 42±47
amino-acid residues from the N-terminal end of the zymogens
(Foltmann, 1988).
Various enzymes are known to be secreted into human
urine as normal components (Kuser et al., 1999). Changes in
the activities of urinary enzymes are observed when our body
conditions are physiologically abnormal (Rabb, 1972). The
urinary enzymes have not been studied in detail and should be
characterized for their origin organs and tissues, and their
properties (Minamiura et al., 1984).
PGA and PGC are of medical interest as tumour markers.
Low serum PGA levels are found in patients with atrophic
gastritis (Samloff et al., 1982) or gastric cancer (Stemmerman
et al., 1985). Recent mass screening also revealed that serum
PGA levels and the PGA/PGC ratio are potentially useful
parameters for the diagnosis of gastric cancer (Hattori et al.,
1995).
The properties of uropepsin obtained by activation of
uropepsinogen were considered to be similar to those of
human gastric pepsin. There is evidence that some amounts of
the proenzyme produced in stomach tissue come into the
bloodstream and ®nally into the urine, passing through the
membranes of certain renal cells without undergoing any
serious modi®cations (Minamiura et al., 1984).
Tang (1976) incubated uropepsinogen with pepstatin at pH
6.8 and it was not converted to uropepsin even on subsequent
incubation at pH 2.0 or upon addition of active pepsin. Also,
no intermediate peptides were observed. These results suggest
that the conversion of uropepsinogen to uropepsin takes place
by autoactivation upon secretion into the urine and not by a
bimolecular mechanism (Tang, 1976). On the other hand, it
was made clear that the peptide segments liberated by
activation of uropepsinogen have an important role in the
stabilization of uropepsin, especially in the thermal and pH
stabilities, as has been reported by Pearlmann (1963).
Human pepsin consists of up to four isoforms of pepsinogen
A with differing enzymatic properties (Tarasova et al., 1994).
Uropepsin is one of these, which has the substitution
Leu!Val at the position 291.
There are residues contributing to the speci®city pockets in
the different enzymes. Signi®cant differences in the types of
interactions are observed in the S4, S3, S2, S1, S01, S0
2 and S03
pockets which may be responsible for the differences in
speci®cities. The speci®cities of proteinases are often char-
acterized by the amino-acid residues adjacent to the peptide
bond which is hydrolysed, but substrate binding and speci®city
may involve amino-acid residues which are located in posi-
tions two to four residues away from the peptide bond that is
cleaved. In an aspartic proteinase with an extended binding
site, the binding subsites (S) and the corresponding positions
of amino-acid residues (P) are designated as shown below
(Foltmann, 1981).
cleavage
#Peptide P4ÿP3ÿP2ÿP1ÿP0
1ÿP02ÿP0
3ÿP04
Enzyme S4ÿS3ÿS2ÿS1ÿS01ÿS0
2ÿS03ÿS0
4:
The substitution of Leu291 by Val291 is likely to affect the
speci®city at S03 and perhaps also at S0
1 (Fujinaga et al., 1995).
This article describes the structure of human uropepsin and
its model with the pepstatin inhibitor. The investigation was
made in order to gain further insight into the chemistry and
functions of this protein.
Acta Cryst. (2001). D57, 1560±1570 Canduri et al. � Uropepsin 1561
research papers
electronic reprint
research papers
1562 Canduri et al. � Uropepsin Acta Cryst. (2001). D57, 1560±1570
2. Materials and methods
2.1. Purification of uropepsin
Human uropepsin has been extracted from the urine of
healthy young individuals without renal disease. The urine was
stored in bottles containing 6.0 M HCl solution. 5 l of this
urine was ®ltered and dialyzed against destilled water. The
solution was concentrated to a ®nal volume of 50 ml and
lyophilized. Uropepsin was puri®ed using the same procedure
as described for human pepsin (Gomes et al., 1996). Brie¯y,
uropepsin puri®cation was performed by a three-step proce-
dure: DEAE bio gel (Biorad) chromatography, Mono Q 5/5
HR column (Pharmacia) chromatography (FPLC) and gel
®ltration (FPLC) on a Superdex 10/75 column (Pharmacia).
2.2. Catalytic activity
Kinetic parameters were measured by the hydrolysis of a
synthetic ¯uorogenic peptide containing at the extremities the
chromophore O-aminobenzoyl (Abz) and its quenching
partner N-(2,4-dinitrophenyl) ethylenediamine (Eddnp),
which are separated by eight amino-acid residues including
two consecutive phenylalanine residues (Filippova et al.,
1996). Cleavage of the peptide between these hydrophobic
residues results in the separation of two fragments and the
consequent dequenching of the Abz, which leads to an
increase in the ¯uorescence signal. Catalytic activity from
pepsin 3A shows the value for Km is 1.53 � 0.11 mM and kcat
is 5.92 � 0.21 sÿ1. For uropepsin, the value for Km is
1.76 � 0.09 mM and kcat is 6.01 � 0.11 sÿ1, using Abz-Lys-Pro-
Ile-Glu-Phe-Phe-Arg-Leu-Eddnp as synthetic substrate in
0.2 M acetate buffer pH 5.0. The concentration of the
substrate varied in the range 0.117ÿ5.66 mM. kcat values were
calculated after titration of the active site with pepstatin.
2.3. Crystallization
Crystals of uropepsin were obtained in several different
crystallization conditions using the hanging-drop vapour-
diffusion and sparse-matrix methods (Jancarik & Kim, 1991).
The best crystals were obtained after one week from drops in
which 3 ml of enzyme solution was mixed with an equal volume
of 0.1 M HEPES buffer pH 7.0 containing 2% polyethylene
glycol 400 and 2.0 M ammonium sulfate. Crystals were
mounted in capillary tubes of borosilicate glass for X-ray data
collection (Canduri et al., 1998).
2.4. Data collection
X-ray diffraction data were ®rstly collected from a single
urinary aspartic proteinase crystal at room temperature using
an R-AXIS IV imaging-plate system and graphite-
monochromated Cu K� X-rays radiation generated by a
Rigaku RU-300 rotating-anode generator operated at 50 kV
and 100 mA at a crystal-to-detector distance of 150 mm. 40
frames were collected using an oscillation range of 2.5�. The
exposure time per frame was 20 min. The X-ray diffraction
data were processed to 2.8 AÊ resolution and scaled using the
program PROCESS (Higashi, 1990). A second X-ray diffrac-
tion data set was collected at a wavelength of 1.38 AÊ using the
Brazilian National Synchrotron Laboratory (Station PCr,
Laborato rio Nacional de Luz SõÂncrotron, LNLS, Campinas,
Brazil; Polikarpov, Oliva et al., 1998; Polikarpov, Oliva et al.,
1998) and a 34.5 cm MAR imaging-plate detector (MAR
Research) with an exposure time of 3 min per image at a
crystal-to-detector distance of 175 mm. Using an oscillation
range of 1.5�, 65 images were collected and the raw X-ray
diffraction data were processed to 2.45 AÊ resolution using the
program DENZO (Gewirth, 1995) and scaled with the
program SCALEPACK (Gewirth, 1995). Autoindexing
procedures combined with analysis of the X-ray diffraction
pattern and averaging of equivalent intensities were used in
characterization of the Laue symmetry (Canduri et al., 1998).
The crystal belongs to the orthorhombic space group
P212121 and the volume of the unit cell is 346 � 103 AÊ 3,
compatible with one monomer in the asymmetric unit with a
VM value of 2.17 AÊ 3 Daÿ1. Assuming a value of 0.74 cm3 gÿ1
for the protein partial speci®c volume, the calculated solvent
content in the crystal is 43.3% and the calculated crystal
density is 1.21 g cmÿ3. The X-ray diffraction data statistics are
summarized in Table 1.
2.5. Crystal structure
The crystal structure of human uropepsin was determined
by standard molecular-replacement methods with the
programs AMoRe (Navaza, 1994) and X-PLOR (BruÈ nger,
Table 1Data-collection statistics for both data sets.
X-ray source R-AXIS IV LNLS
Unit-cell parametersa (AÊ ) 51.08 50.99b (AÊ ) 75.91 75.56c (AÊ ) 89.99 89.90
No. of measurements with I > 2�(I) 17686 24189No. of independent re¯ections 10232 13134Rsym² (%) 10.4 7.7Highest resolution shell (AÊ ) 3.5±2.8 2.51±2.45Completeness in the highest resolution shell (%) 79.3 99.1Rsym² in the highest resolution shell (%) 18.5 30.3
² Rsym = 100P jI�h� ÿ hI�h�ij/I�h�, where I(h) is the observed intensity and hI(h)i is the
mean intensity of re¯ection h over all measurements of I(h).
Table 2Re®nement statistics for human uropepsin.
Resolution (AÊ ) 12.0±2.45R factor² (%) 16.1Rfree³ (%) 25.1B values§ (AÊ 2)
Main chain 15.0Side chains 14.1Waters 29.5
Observed r.m.s. deviations from ideal geometryBond lengths (AÊ ) 0.009Bond angles (�) 1.61Dihedrals (�) 27.04
No. of water molecules 143
² R = 100jFobs ÿ Rcalc |/P
Fobs, the sums being taken over all re¯ections with F/�(F) > 2cutoff. ³ Rfree = R for 10% of the data which were not included during crystallographicre®nement. § Average B values for all non-H atoms.
electronic reprint
1992), using as search model the structure of human pepsin
(Fujinaga et al., 1995). Structure re®nement was performed
using X-PLOR (BruÈ nger, 1992). The atomic positions
obtained from molecular replacement were used to initiate the
crystallographic re®nement with an overall B factor of 20 AÊ 2.
Several attempts at cocrystallizing uropepsin with pepstatin
did not produce crystals of high quality. A model of the
uropepsin±pepstatin complex has been constructed. The
model was based on the high-resolution crystal structure of
pepsin complexed with pepstatin. The protein modelling was
performed by superposition of the three domains of the pepsin
part of the pepsin±pepstatin complex (PDB code 1pso; Fuji-
naga et al., 1995) onto the uropepsin structure using the
program ProFit V. 1.8 (Martin, 1992±1998). The coordinates
of the pepstatin were obtained using HIC-Up (http://
xray.bmc.uu.se/hicup/). The pepstatin model was moved as a
rigid body to approximately the same relative orien-
tation as the pepstatin in the binary complex (1pso)
without any modi®cation of the side-chain positions
of the pepstatin. The coordinates of the complex were
minimized using the program X-PLOR (BruÈ nger,
1992) through 200 cycles of positional re®nement with
the weight of the X-ray term of energy function set to
zero. During the 200 cycles of positional re®ne-
ment the energy decreases from 12 � 106 to
13 250 kJ molÿ1. This model was used for compar-
isons with the binary complex pepsin±pepstatin.
Root-mean-square deviation (r.m.s.d.) differences
from ideal geometries for bond lengths, angles and
dihedrals were calculated with X-PLOR 3.1 (BruÈ nger,
1992) and are presented in Table 2. The overall
stereochemical quality of the ®nal model for
uropepsin was assessed with PROCHECK
(Laskowski et al., 1993). Atomic models were super-
posed using the program LSQKAB from CCP4
(Collaborative Computational Project, Number 4,
1994).
3. Results and discussion
3.1. Molecular replacement and refinement
Peak analysis of the self-rotation function did not
reveal the presence of any signi®cant local symmetry
axis, suggesting that a single subunit is contained in
the asymmetric unit. This was in agreement with the
estimated values of the crystal solvent content and VM
value (Matthews, 1968).
The results of molecular replacement using ten
different search models are listed in Table 3. The
correlation coef®cients after translation function
computation range from 14.4 to 67.8% and the R
Acta Cryst. (2001). D57, 1560±1570 Canduri et al. � Uropepsin 1563
research papers
Table 3Eulerian angles and fractional coordinates after translation-functioncomputation.
Protein�(�)
�(�)
(�) x y z
CC(%)
R²(%)
1eag 33.83 65.23 76.65 0.2231 0.1861 0.2065 14.4 54.11lya 156.00 46.61 121.10 0.3169 0.4727 0.0587 39.4 46.71zap 122.98 39.94 38.05 0.2905 0.2007 0.3434 14.4 55.21bbs 152.67 50.03 121.40 0.3250 0.4819 0.0588 26.5 50.81mpp 21.80 90.00 4.34 0.2000 0.1747 0.0514 16.2 53.52ren 30.54 40.01 235.18 0.3283 0.0154 0.4332 33.1 48.44apr 149.04 44.86 125.18 0.3176 0.4861 0.0618 22.1 52.51psn 24.44 46.13 59.44 0.3224 0.0247 0.4385 67.8 35.03app 146.53 46.99 307.78 0.3058 0.4739 0.0524 20.2 53.21cms 152.27 45.15 122.87 0.3209 0.4742 0.0610 39.3 48.9
² Rfactor = 100P jFobs ÿ Fcalc/
PFobs, the sums being taken over all re¯ections with
F/�(F) > 2 cutoff.
Table 4Fractional coordinates after translation-function computation for otherpossible space groups.
Space group Tx Ty Tz CC (%) R² (%)
P21212 0.0748 0.1244 0.1889 38.0 46.4P2221 0.0702 0.0254 0.3940 38.5 46.5P222 0.0080 0.0045 0.0104 26.4 51.1
² Rfactor = 100P jFobs ÿ Fcalcj/
PFobs, the sums being taken over all re¯ections with
F/�(F) > 2 cutoff.
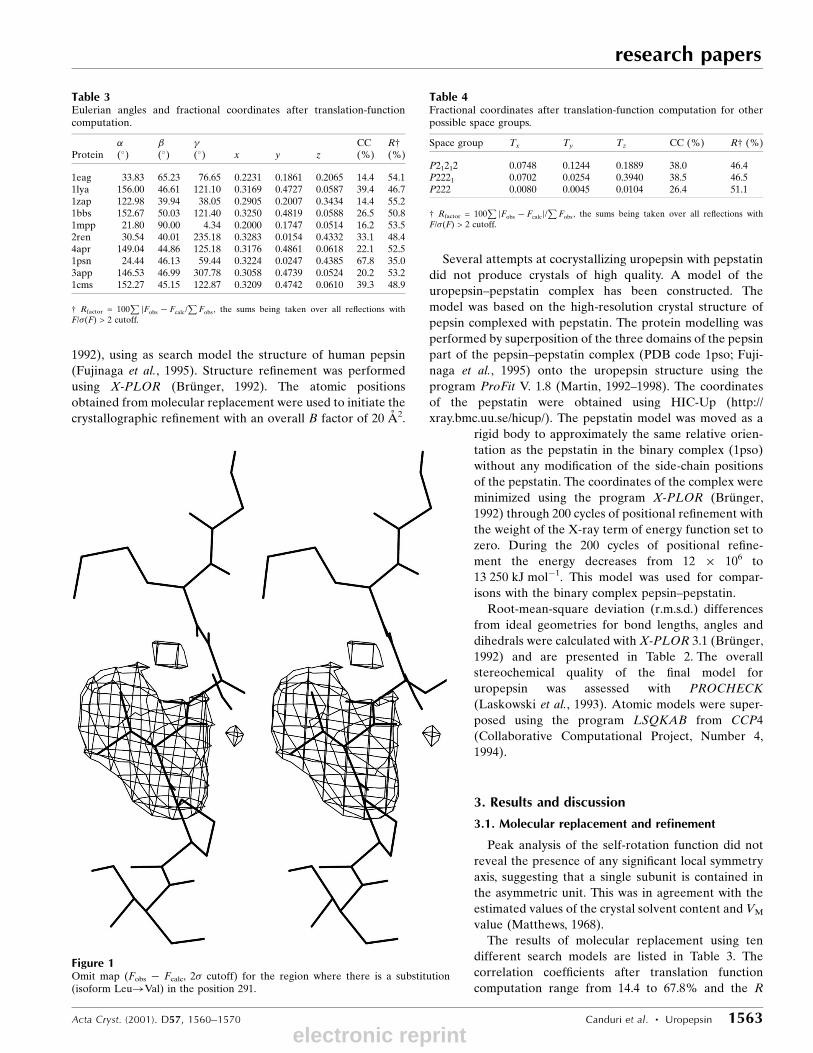
Figure 1Omit map (Fobs ÿ Fcalc, 2� cutoff) for the region where there is a substitution(isoform Leu!Val) in the position 291.
electronic reprint
research papers
1564 Canduri et al. � Uropepsin Acta Cryst. (2001). D57, 1560±1570
factors range from 35.0 to 54.1%. The highest peak calculated
for the translation function using AMoRe (Navaza, 1994) was
42.8% above the next highest peak. The search model which
presented the best correlation coef®cient and R factor was
pepsin 3A from Homo sapiens (PDB code 1psn). This search
model was also submitted to molecular replacement using the
program X-PLOR and the solution obtained after the trans-
lation search was � = 23.6, � = 47.0, = 59.8�, x = 0.314,
y = 0.029, z = 0.443, R = 34.6%, close to that obtained by
AMoRe (Navaza, 1994).
Translation functions for space groups P222, P2221 and
P21212 have been computed using the coordinates of pepsin
3A as the search model and the results are listed in
Table 4. The correlation coef®cients after translation-function
computation for the three space groups range from 26.4 to
38.0% and the R factors range from 46.4 to 51.1%, which
strongly indicates that the correct space group is P212121.
Uropepsin has only one amino-acid difference compared
with the human gastric pepsin sequence used in the molecular
replacement. A close examination of the electron-density
maps identi®ed the isoform in the present study to be isoform
Leu291!Val291. A omit map for this region is shown in Fig. 1.
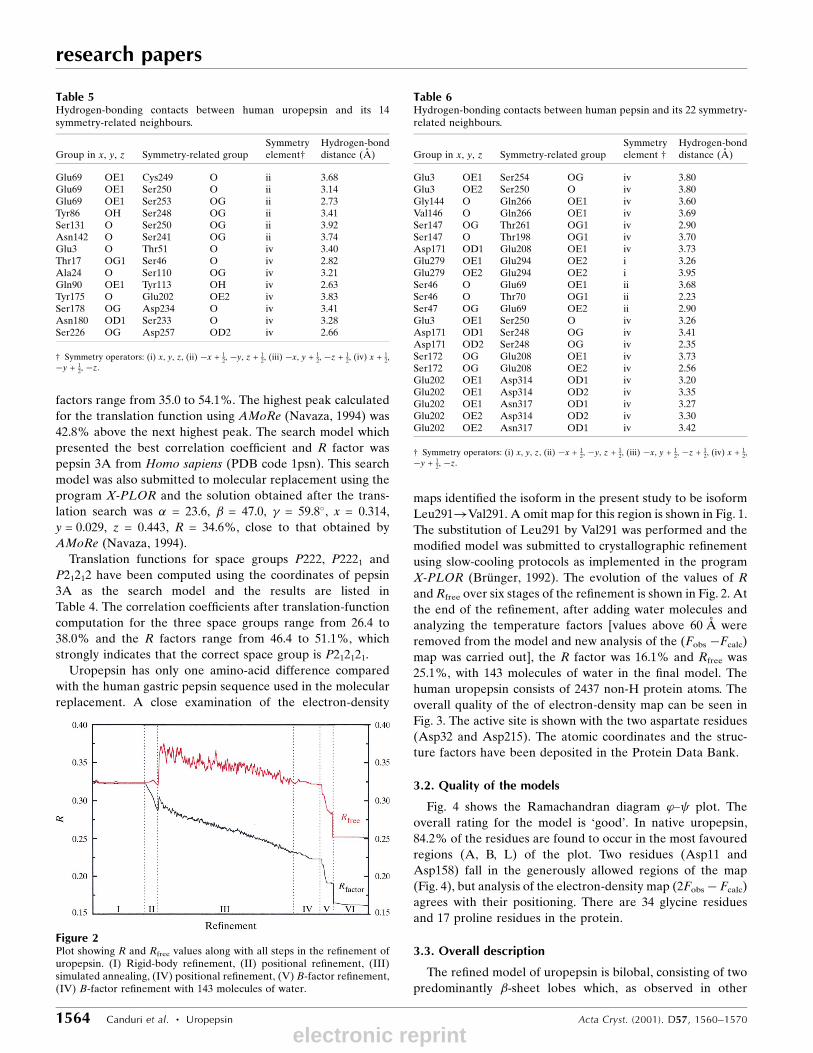
The substitution of Leu291 by Val291 was performed and the
modi®ed model was submitted to crystallographic re®nement
using slow-cooling protocols as implemented in the program
X-PLOR (BruÈ nger, 1992). The evolution of the values of R
and Rfree over six stages of the re®nement is shown in Fig. 2. At
the end of the re®nement, after adding water molecules and
analyzing the temperature factors [values above 60 AÊ were
removed from the model and new analysis of the (Fobs ÿFcalc)
map was carried out], the R factor was 16.1% and Rfree was
25.1%, with 143 molecules of water in the ®nal model. The
human uropepsin consists of 2437 non-H protein atoms. The
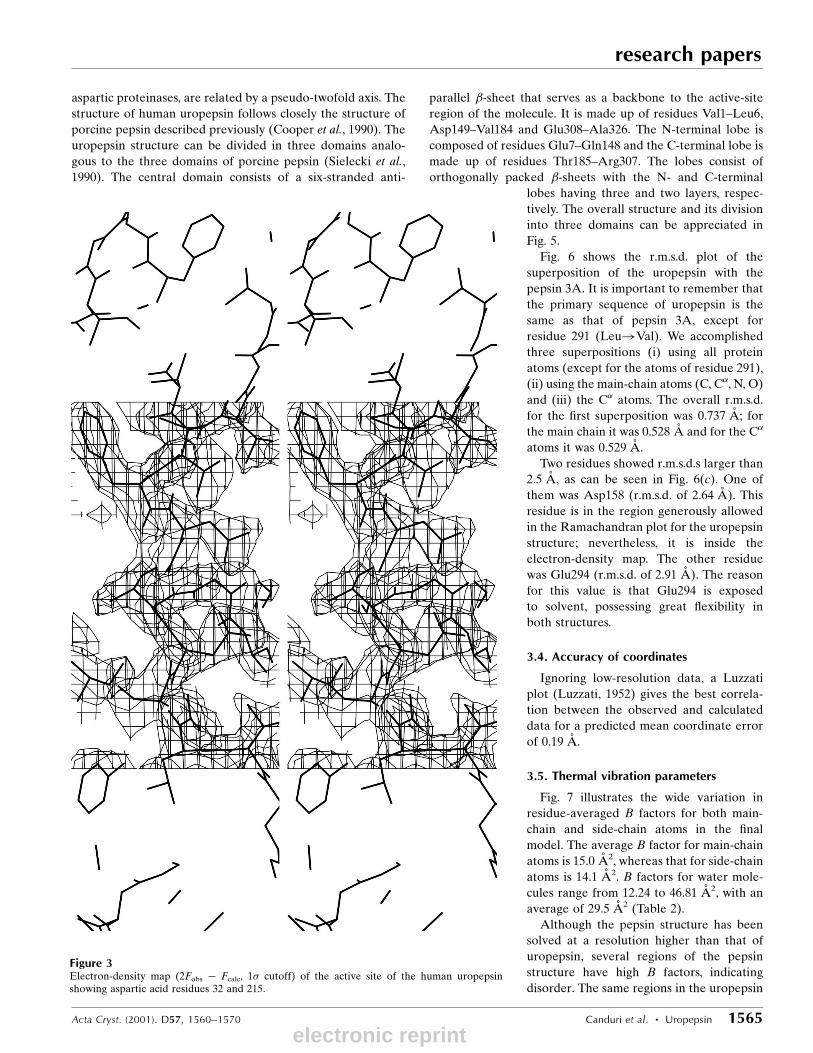
overall quality of the of electron-density map can be seen in
Fig. 3. The active site is shown with the two aspartate residues
(Asp32 and Asp215). The atomic coordinates and the struc-
ture factors have been deposited in the Protein Data Bank.
3.2. Quality of the models
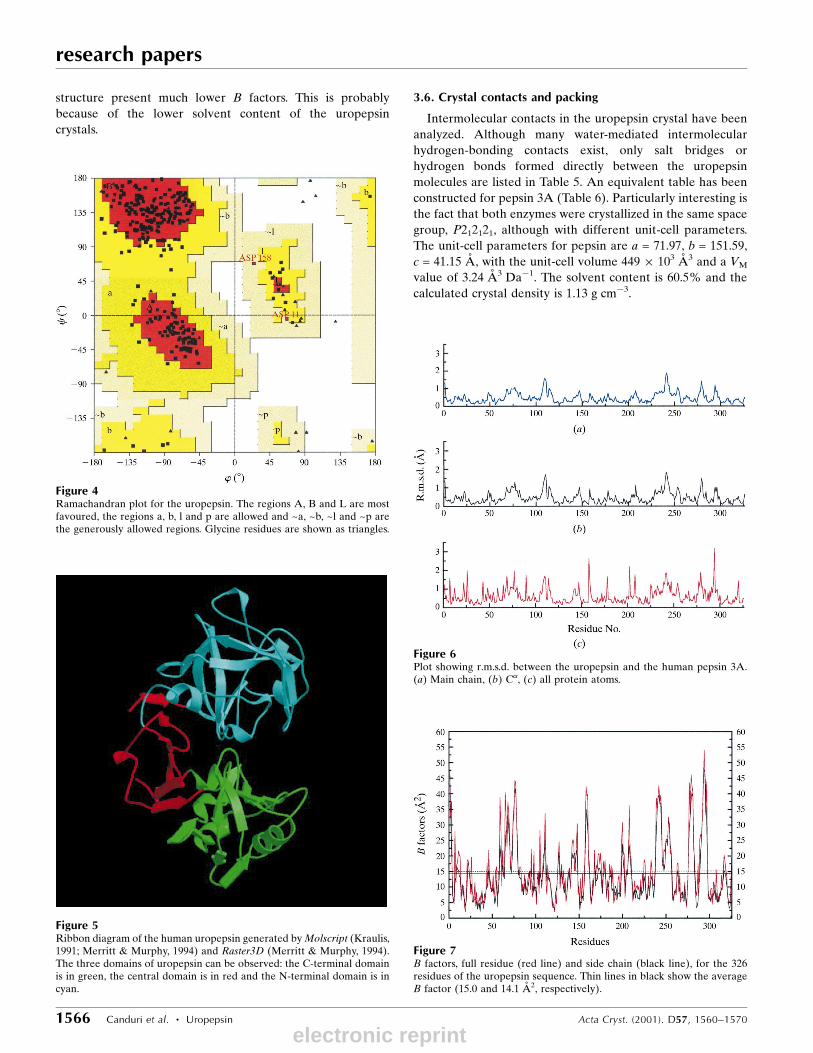
Fig. 4 shows the Ramachandran diagram '± plot. The
overall rating for the model is `good'. In native uropepsin,
84.2% of the residues are found to occur in the most favoured
regions (A, B, L) of the plot. Two residues (Asp11 and
Asp158) fall in the generously allowed regions of the map
(Fig. 4), but analysis of the electron-density map (2Fobs ÿ Fcalc)
agrees with their positioning. There are 34 glycine residues
and 17 proline residues in the protein.
3.3. Overall description
The re®ned model of uropepsin is bilobal, consisting of two
predominantly �-sheet lobes which, as observed in other
Figure 2Plot showing R and Rfree values along with all steps in the re®nement ofuropepsin. (I) Rigid-body re®nement, (II) positional re®nement, (III)simulated annealing, (IV) positional re®nement, (V) B-factor re®nement,(IV) B-factor re®nement with 143 molecules of water.
Table 5Hydrogen-bonding contacts between human uropepsin and its 14symmetry-related neighbours.
Group in x, y, z Symmetry-related groupSymmetryelement²
Hydrogen-bonddistance (AÊ )
Glu69 OE1 Cys249 O ii 3.68Glu69 OE1 Ser250 O ii 3.14Glu69 OE1 Ser253 OG ii 2.73Tyr86 OH Ser248 OG ii 3.41Ser131 O Ser250 OG ii 3.92Asn142 O Ser241 OG ii 3.74Glu3 O Thr51 O iv 3.40Thr17 OG1 Ser46 O iv 2.82Ala24 O Ser110 OG iv 3.21Gln90 OE1 Tyr113 OH iv 2.63Tyr175 O Glu202 OE2 iv 3.83Ser178 OG Asp234 O iv 3.41Asn180 OD1 Ser233 O iv 3.28Ser226 OG Asp257 OD2 iv 2.66
² Symmetry operators: (i) x, y, z, (ii) ÿx + 12, ÿy, z + 1
2, (iii) ÿx, y + 12, ÿz + 1
2, (iv) x + 12,ÿy + 1
2, ÿz.
Table 6Hydrogen-bonding contacts between human pepsin and its 22 symmetry-related neighbours.
Group in x, y, z Symmetry-related groupSymmetryelement ²
Hydrogen-bonddistance (AÊ )
Glu3 OE1 Ser254 OG iv 3.80Glu3 OE2 Ser250 O iv 3.80Gly144 O Gln266 OE1 iv 3.60Val146 O Gln266 OE1 iv 3.69Ser147 OG Thr261 OG1 iv 2.90Ser147 O Thr198 OG1 iv 3.70Asp171 OD1 Glu208 OE1 iv 3.73Glu279 OE1 Glu294 OE2 i 3.26Glu279 OE2 Glu294 OE2 i 3.95Ser46 O Glu69 OE1 ii 3.68Ser46 O Thr70 OG1 ii 2.23Ser47 OG Glu69 OE2 ii 2.90Glu3 OE1 Ser250 O iv 3.26Asp171 OD1 Ser248 OG iv 3.41Asp171 OD2 Ser248 OG iv 2.35Ser172 OG Glu208 OE1 iv 3.73Ser172 OG Glu208 OE2 iv 2.56Glu202 OE1 Asp314 OD1 iv 3.20Glu202 OE1 Asp314 OD2 iv 3.35Glu202 OE1 Asn317 OD1 iv 3.27Glu202 OE2 Asp314 OD2 iv 3.30Glu202 OE2 Asn317 OD1 iv 3.42
² Symmetry operators: (i) x, y, z, (ii) ÿx + 12, ÿy, z + 1
2, (iii) ÿx, y + 12, ÿz + 1
2, (iv) x + 12,ÿy + 1
2, ÿz.
electronic reprint
aspartic proteinases, are related by a pseudo-twofold axis. The
structure of human uropepsin follows closely the structure of
porcine pepsin described previously (Cooper et al., 1990). The
uropepsin structure can be divided in three domains analo-
gous to the three domains of porcine pepsin (Sielecki et al.,
1990). The central domain consists of a six-stranded anti-
parallel �-sheet that serves as a backbone to the active-site
region of the molecule. It is made up of residues Val1±Leu6,
Asp149±Val184 and Glu308±Ala326. The N-terminal lobe is
composed of residues Glu7±Gln148 and the C-terminal lobe is
made up of residues Thr185±Arg307. The lobes consist of
orthogonally packed �-sheets with the N- and C-terminal
lobes having three and two layers, respec-
tively. The overall structure and its division
into three domains can be appreciated in
Fig. 5.
Fig. 6 shows the r.m.s.d. plot of the
superposition of the uropepsin with the
pepsin 3A. It is important to remember that
the primary sequence of uropepsin is the
same as that of pepsin 3A, except for
residue 291 (Leu!Val). We accomplished
three superpositions (i) using all protein
atoms (except for the atoms of residue 291),
(ii) using the main-chain atoms (C, C�, N, O)
and (iii) the C� atoms. The overall r.m.s.d.
for the ®rst superposition was 0.737 AÊ ; for
the main chain it was 0.528 AÊ and for the C�
atoms it was 0.529 AÊ .
Two residues showed r.m.s.d.s larger than
2.5 AÊ , as can be seen in Fig. 6(c). One of
them was Asp158 (r.m.s.d. of 2.64 AÊ ). This
residue is in the region generously allowed
in the Ramachandran plot for the uropepsin
structure; nevertheless, it is inside the
electron-density map. The other residue
was Glu294 (r.m.s.d. of 2.91 AÊ ). The reason
for this value is that Glu294 is exposed
to solvent, possessing great ¯exibility in
both structures.
3.4. Accuracy of coordinates
Ignoring low-resolution data, a Luzzati
plot (Luzzati, 1952) gives the best correla-
tion between the observed and calculated
data for a predicted mean coordinate error
of 0.19 AÊ .
3.5. Thermal vibration parameters
Fig. 7 illustrates the wide variation in
residue-averaged B factors for both main-
chain and side-chain atoms in the ®nal
model. The average B factor for main-chain
atoms is 15.0 AÊ 2, whereas that for side-chain
atoms is 14.1 AÊ 2. B factors for water mole-
cules range from 12.24 to 46.81 AÊ 2, with an
average of 29.5 AÊ 2 (Table 2).
Although the pepsin structure has been
solved at a resolution higher than that of
uropepsin, several regions of the pepsin
structure have high B factors, indicating
disorder. The same regions in the uropepsin
Acta Cryst. (2001). D57, 1560±1570 Canduri et al. � Uropepsin 1565
research papers
Figure 3Electron-density map (2Fobs ÿ Fcalc, 1� cutoff) of the active site of the human uropepsinshowing aspartic acid residues 32 and 215.
electronic reprint
research papers
1566 Canduri et al. � Uropepsin Acta Cryst. (2001). D57, 1560±1570
structure present much lower B factors. This is probably
because of the lower solvent content of the uropepsin
crystals.
3.6. Crystal contacts and packing
Intermolecular contacts in the uropepsin crystal have been
analyzed. Although many water-mediated intermolecular
hydrogen-bonding contacts exist, only salt bridges or
hydrogen bonds formed directly between the uropepsin
molecules are listed in Table 5. An equivalent table has been
constructed for pepsin 3A (Table 6). Particularly interesting is
the fact that both enzymes were crystallized in the same space
group, P212121, although with different unit-cell parameters.
The unit-cell parameters for pepsin are a = 71.97, b = 151.59,
c = 41.15 AÊ , with the unit-cell volume 449 � 103 AÊ 3 and a VM
value of 3.24 AÊ 3 Daÿ1. The solvent content is 60.5% and the
calculated crystal density is 1.13 g cmÿ3.
Figure 6Plot showing r.m.s.d. between the uropepsin and the human pepsin 3A.(a) Main chain, (b) C�, (c) all protein atoms.
Figure 7B factors, full residue (red line) and side chain (black line), for the 326residues of the uropepsin sequence. Thin lines in black show the averageB factor (15.0 and 14.1 AÊ 2, respectively).
Figure 5Ribbon diagram of the human uropepsin generated by Molscript (Kraulis,1991; Merritt & Murphy, 1994) and Raster3D (Merritt & Murphy, 1994).The three domains of uropepsin can be observed: the C-terminal domainis in green, the central domain is in red and the N-terminal domain is incyan.
Figure 4Ramachandran plot for the uropepsin. The regions A, B and L are mostfavoured, the regions a, b, l and p are allowed and ~a, ~b, ~l and ~p arethe generously allowed regions. Glycine residues are shown as triangles.
electronic reprint
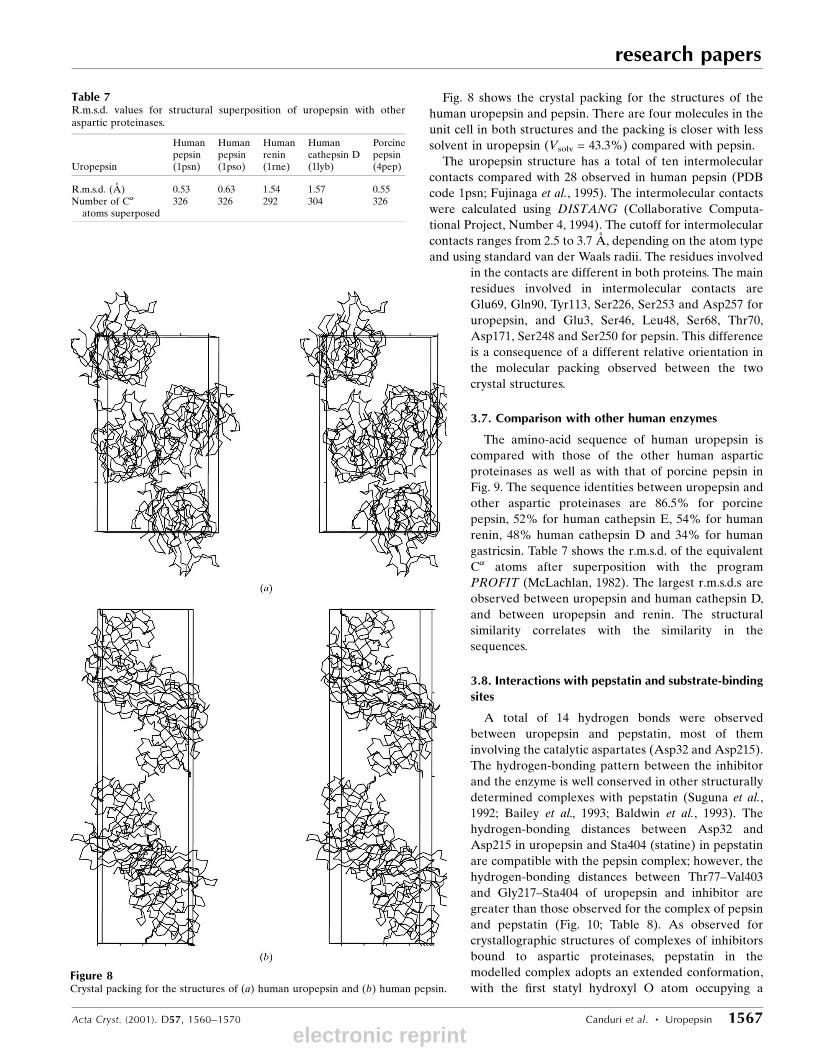
Fig. 8 shows the crystal packing for the structures of the
human uropepsin and pepsin. There are four molecules in the
unit cell in both structures and the packing is closer with less
solvent in uropepsin (Vsolv = 43.3%) compared with pepsin.
The uropepsin structure has a total of ten intermolecular
contacts compared with 28 observed in human pepsin (PDB
code 1psn; Fujinaga et al., 1995). The intermolecular contacts
were calculated using DISTANG (Collaborative Computa-
tional Project, Number 4, 1994). The cutoff for intermolecular
contacts ranges from 2.5 to 3.7 AÊ , depending on the atom type
and using standard van der Waals radii. The residues involved
in the contacts are different in both proteins. The main
residues involved in intermolecular contacts are
Glu69, Gln90, Tyr113, Ser226, Ser253 and Asp257 for
uropepsin, and Glu3, Ser46, Leu48, Ser68, Thr70,
Asp171, Ser248 and Ser250 for pepsin. This difference
is a consequence of a different relative orientation in
the molecular packing observed between the two
crystal structures.
3.7. Comparison with other human enzymes
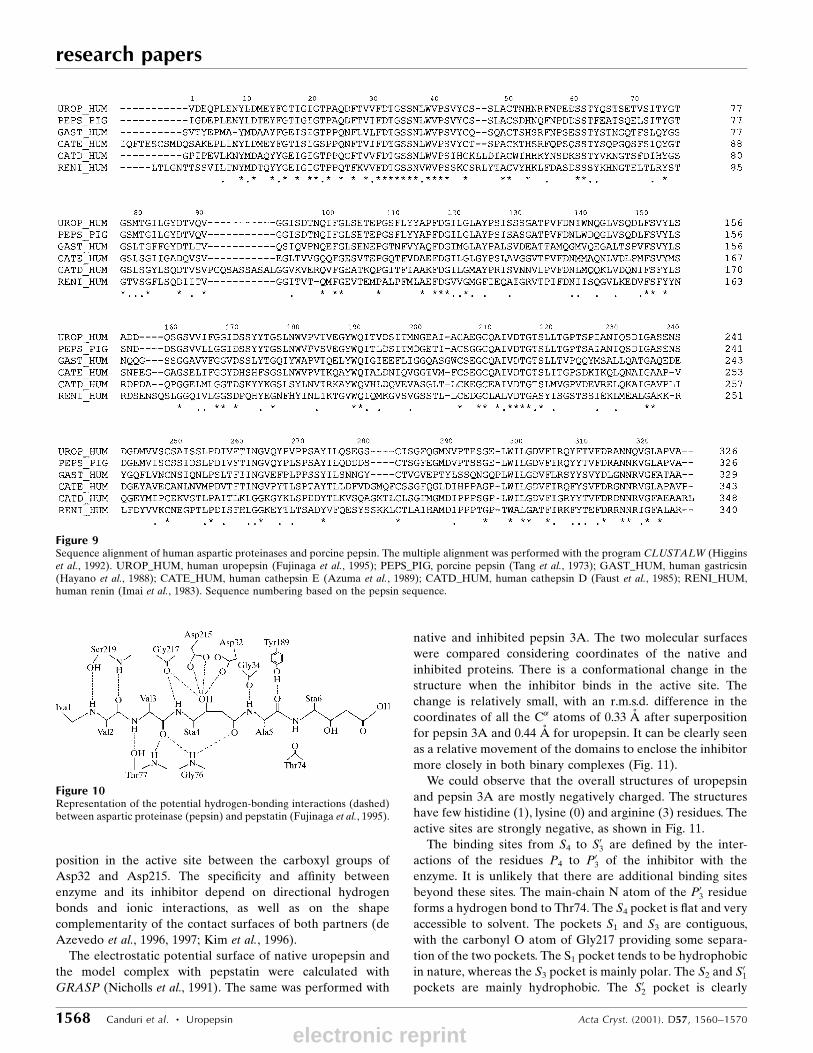
The amino-acid sequence of human uropepsin is
compared with those of the other human aspartic
proteinases as well as with that of porcine pepsin in
Fig. 9. The sequence identities between uropepsin and
other aspartic proteinases are 86.5% for porcine
pepsin, 52% for human cathepsin E, 54% for human
renin, 48% human cathepsin D and 34% for human
gastricsin. Table 7 shows the r.m.s.d. of the equivalent
C� atoms after superposition with the program
PROFIT (McLachlan, 1982). The largest r.m.s.d.s are
observed between uropepsin and human cathepsin D,
and between uropepsin and renin. The structural
similarity correlates with the similarity in the
sequences.
3.8. Interactions with pepstatin and substrate-bindingsites
A total of 14 hydrogen bonds were observed
between uropepsin and pepstatin, most of them
involving the catalytic aspartates (Asp32 and Asp215).
The hydrogen-bonding pattern between the inhibitor
and the enzyme is well conserved in other structurally
determined complexes with pepstatin (Suguna et al.,
1992; Bailey et al., 1993; Baldwin et al., 1993). The
hydrogen-bonding distances between Asp32 and
Asp215 in uropepsin and Sta404 (statine) in pepstatin
are compatible with the pepsin complex; however, the
hydrogen-bonding distances between Thr77±Val403
and Gly217±Sta404 of uropepsin and inhibitor are
greater than those observed for the complex of pepsin
and pepstatin (Fig. 10; Table 8). As observed for
crystallographic structures of complexes of inhibitors
bound to aspartic proteinases, pepstatin in the
modelled complex adopts an extended conformation,
with the ®rst statyl hydroxyl O atom occupying a
Acta Cryst. (2001). D57, 1560±1570 Canduri et al. � Uropepsin 1567
research papers
Table 7R.m.s.d. values for structural superposition of uropepsin with otheraspartic proteinases.
Uropepsin
Humanpepsin(1psn)
Humanpepsin(1pso)
Humanrenin(1rne)
Humancathepsin D(1lyb)
Porcinepepsin(4pep)
R.m.s.d. (AÊ ) 0.53 0.63 1.54 1.57 0.55Number of C�
atoms superposed326 326 292 304 326
Figure 8Crystal packing for the structures of (a) human uropepsin and (b) human pepsin.
electronic reprint
research papers
1568 Canduri et al. � Uropepsin Acta Cryst. (2001). D57, 1560±1570
position in the active site between the carboxyl groups of
Asp32 and Asp215. The speci®city and af®nity between
enzyme and its inhibitor depend on directional hydrogen
bonds and ionic interactions, as well as on the shape
complementarity of the contact surfaces of both partners (de
Azevedo et al., 1996, 1997; Kim et al., 1996).
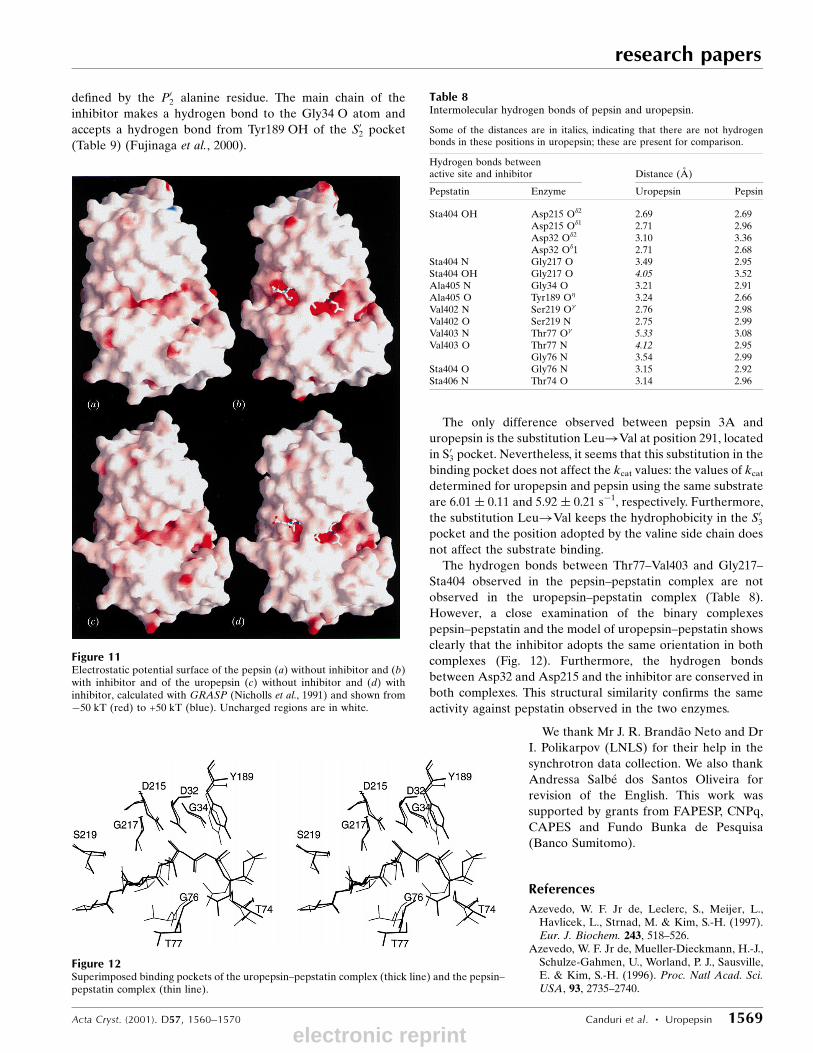
The electrostatic potential surface of native uropepsin and
the model complex with pepstatin were calculated with
GRASP (Nicholls et al., 1991). The same was performed with
native and inhibited pepsin 3A. The two molecular surfaces
were compared considering coordinates of the native and
inhibited proteins. There is a conformational change in the
structure when the inhibitor binds in the active site. The
change is relatively small, with an r.m.s.d. difference in the
coordinates of all the C� atoms of 0.33 AÊ after superposition
for pepsin 3A and 0.44 AÊ for uropepsin. It can be clearly seen
as a relative movement of the domains to enclose the inhibitor
more closely in both binary complexes (Fig. 11).
We could observe that the overall structures of uropepsin
and pepsin 3A are mostly negatively charged. The structures
have few histidine (1), lysine (0) and arginine (3) residues. The
active sites are strongly negative, as shown in Fig. 11.
The binding sites from S4 to S03 are de®ned by the inter-
actions of the residues P4 to P03 of the inhibitor with the
enzyme. It is unlikely that there are additional binding sites
beyond these sites. The main-chain N atom of the P03 residue
forms a hydrogen bond to Thr74. The S4 pocket is ¯at and very
accessible to solvent. The pockets S1 and S3 are contiguous,
with the carbonyl O atom of Gly217 providing some separa-
tion of the two pockets. The S1 pocket tends to be hydrophobic
in nature, whereas the S3 pocket is mainly polar. The S2 and S01
pockets are mainly hydrophobic. The S02 pocket is clearly
Figure 9Sequence alignment of human aspartic proteinases and porcine pepsin. The multiple alignment was performed with the program CLUSTALW (Higginset al., 1992). UROP_HUM, human uropepsin (Fujinaga et al., 1995); PEPS_PIG, porcine pepsin (Tang et al., 1973); GAST_HUM, human gastricsin(Hayano et al., 1988); CATE_HUM, human cathepsin E (Azuma et al., 1989); CATD_HUM, human cathepsin D (Faust et al., 1985); RENI_HUM,human renin (Imai et al., 1983). Sequence numbering based on the pepsin sequence.
Figure 10Representation of the potential hydrogen-bonding interactions (dashed)between aspartic proteinase (pepsin) and pepstatin (Fujinaga et al., 1995).
electronic reprint
de®ned by the P02 alanine residue. The main chain of the
inhibitor makes a hydrogen bond to the Gly34 O atom and
accepts a hydrogen bond from Tyr189 OH of the S02 pocket
(Table 9) (Fujinaga et al., 2000).
The only difference observed between pepsin 3A and
uropepsin is the substitution Leu!Val at position 291, located
in S03 pocket. Nevertheless, it seems that this substitution in the
binding pocket does not affect the kcat values: the values of kcat
determined for uropepsin and pepsin using the same substrate
are 6.01 � 0.11 and 5.92 � 0.21 sÿ1, respectively. Furthermore,
the substitution Leu!Val keeps the hydrophobicity in the S03
pocket and the position adopted by the valine side chain does
not affect the substrate binding.
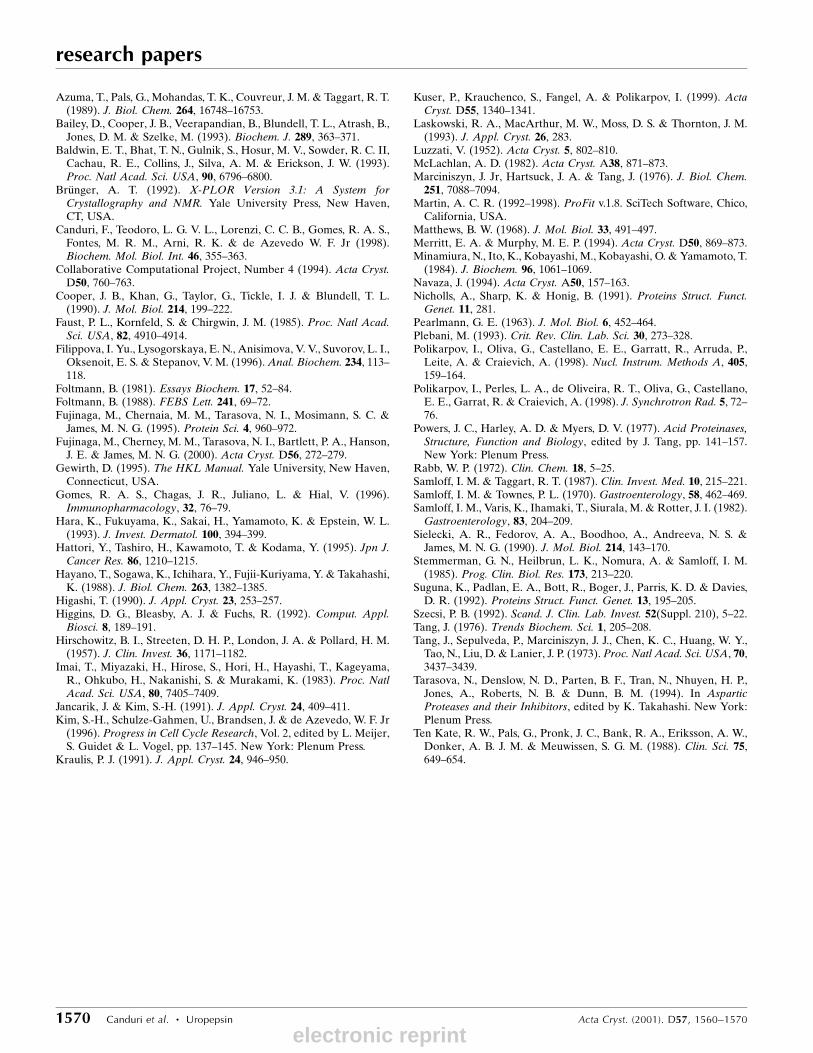
The hydrogen bonds between Thr77±Val403 and Gly217±
Sta404 observed in the pepsin±pepstatin complex are not
observed in the uropepsin±pepstatin complex (Table 8).
However, a close examination of the binary complexes
pepsin±pepstatin and the model of uropepsin±pepstatin shows
clearly that the inhibitor adopts the same orientation in both
complexes (Fig. 12). Furthermore, the hydrogen bonds
between Asp32 and Asp215 and the inhibitor are conserved in
both complexes. This structural similarity con®rms the same
activity against pepstatin observed in the two enzymes.
We thank Mr J. R. BrandaÄo Neto and Dr
I. Polikarpov (LNLS) for their help in the
synchrotron data collection. We also thank
Andressa Salbe dos Santos Oliveira for
revision of the English. This work was
supported by grants from FAPESP, CNPq,
CAPES and Fundo Bunka de Pesquisa
(Banco Sumitomo).
References
Azevedo, W. F. Jr de, Leclerc, S., Meijer, L.,Havlicek, L., Strnad, M. & Kim, S.-H. (1997).Eur. J. Biochem. 243, 518±526.
Azevedo, W. F. Jr de, Mueller-Dieckmann, H.-J.,Schulze-Gahmen, U., Worland, P. J., Sausville,E. & Kim, S.-H. (1996). Proc. Natl Acad. Sci.USA, 93, 2735±2740.
Acta Cryst. (2001). D57, 1560±1570 Canduri et al. � Uropepsin 1569
research papers
Figure 11Electrostatic potential surface of the pepsin (a) without inhibitor and (b)with inhibitor and of the uropepsin (c) without inhibitor and (d) withinhibitor, calculated with GRASP (Nicholls et al., 1991) and shown fromÿ50 kT (red) to +50 kT (blue). Uncharged regions are in white.
Figure 12Superimposed binding pockets of the uropepsin±pepstatin complex (thick line) and the pepsin±pepstatin complex (thin line).
Table 8Intermolecular hydrogen bonds of pepsin and uropepsin.
Some of the distances are in italics, indicating that there are not hydrogenbonds in these positions in uropepsin; these are present for comparison.
Hydrogen bonds betweenactive site and inhibitor Distance (AÊ )
Pepstatin Enzyme Uropepsin Pepsin
Sta404 OH Asp215 O�2 2.69 2.69Asp215 O�1 2.71 2.96Asp32 O�2 3.10 3.36Asp32 O�1 2.71 2.68
Sta404 N Gly217 O 3.49 2.95Sta404 OH Gly217 O 4.05 3.52Ala405 N Gly34 O 3.21 2.91Ala405 O Tyr189 O� 3.24 2.66Val402 N Ser219 O 2.76 2.98Val402 O Ser219 N 2.75 2.99Val403 N Thr77 O 5.33 3.08Val403 O Thr77 N 4.12 2.95
Gly76 N 3.54 2.99Sta404 O Gly76 N 3.15 2.92Sta406 N Thr74 O 3.14 2.96
electronic reprint
research papers
1570 Canduri et al. � Uropepsin Acta Cryst. (2001). D57, 1560±1570
Azuma, T., Pals, G., Mohandas, T. K., Couvreur, J. M. & Taggart, R. T.(1989). J. Biol. Chem. 264, 16748±16753.
Bailey, D., Cooper, J. B., Veerapandian, B., Blundell, T. L., Atrash, B.,Jones, D. M. & Szelke, M. (1993). Biochem. J. 289, 363±371.
Baldwin, E. T., Bhat, T. N., Gulnik, S., Hosur, M. V., Sowder, R. C. II,Cachau, R. E., Collins, J., Silva, A. M. & Erickson, J. W. (1993).Proc. Natl Acad. Sci. USA, 90, 6796±6800.
BruÈ nger, A. T. (1992). X-PLOR Version 3.1: A System forCrystallography and NMR. Yale University Press, New Haven,CT, USA.
Canduri, F., Teodoro, L. G. V. L., Lorenzi, C. C. B., Gomes, R. A. S.,Fontes, M. R. M., Arni, R. K. & de Azevedo W. F. Jr (1998).Biochem. Mol. Biol. Int. 46, 355±363.
Collaborative Computational Project, Number 4 (1994). Acta Cryst.D50, 760±763.
Cooper, J. B., Khan, G., Taylor, G., Tickle, I. J. & Blundell, T. L.(1990). J. Mol. Biol. 214, 199±222.
Faust, P. L., Kornfeld, S. & Chirgwin, J. M. (1985). Proc. Natl Acad.Sci. USA, 82, 4910±4914.
Filippova, I. Yu., Lysogorskaya, E. N., Anisimova, V. V., Suvorov, L. I.,Oksenoit, E. S. & Stepanov, V. M. (1996). Anal. Biochem. 234, 113±118.
Foltmann, B. (1981). Essays Biochem. 17, 52±84.Foltmann, B. (1988). FEBS Lett. 241, 69±72.Fujinaga, M., Chernaia, M. M., Tarasova, N. I., Mosimann, S. C. &
James, M. N. G. (1995). Protein Sci. 4, 960±972.Fujinaga, M., Cherney, M. M., Tarasova, N. I., Bartlett, P. A., Hanson,
J. E. & James, M. N. G. (2000). Acta Cryst. D56, 272±279.Gewirth, D. (1995). The HKL Manual. Yale University, New Haven,
Connecticut, USA.Gomes, R. A. S., Chagas, J. R., Juliano, L. & Hial, V. (1996).
Immunopharmacology, 32, 76±79.Hara, K., Fukuyama, K., Sakai, H., Yamamoto, K. & Epstein, W. L.
(1993). J. Invest. Dermatol. 100, 394±399.Hattori, Y., Tashiro, H., Kawamoto, T. & Kodama, Y. (1995). Jpn J.
Cancer Res. 86, 1210±1215.Hayano, T., Sogawa, K., Ichihara, Y., Fujii-Kuriyama, Y. & Takahashi,
K. (1988). J. Biol. Chem. 263, 1382±1385.Higashi, T. (1990). J. Appl. Cryst. 23, 253±257.Higgins, D. G., Bleasby, A. J. & Fuchs, R. (1992). Comput. Appl.
Biosci. 8, 189±191.Hirschowitz, B. I., Streeten, D. H. P., London, J. A. & Pollard, H. M.
(1957). J. Clin. Invest. 36, 1171±1182.Imai, T., Miyazaki, H., Hirose, S., Hori, H., Hayashi, T., Kageyama,
R., Ohkubo, H., Nakanishi, S. & Murakami, K. (1983). Proc. NatlAcad. Sci. USA, 80, 7405±7409.
Jancarik, J. & Kim, S.-H. (1991). J. Appl. Cryst. 24, 409±411.Kim, S.-H., Schulze-Gahmen, U., Brandsen, J. & de Azevedo, W. F. Jr
(1996). Progress in Cell Cycle Research, Vol. 2, edited by L. Meijer,S. Guidet & L. Vogel, pp. 137±145. New York: Plenum Press.
Kraulis, P. J. (1991). J. Appl. Cryst. 24, 946±950.
Kuser, P., Krauchenco, S., Fangel, A. & Polikarpov, I. (1999). ActaCryst. D55, 1340±1341.
Laskowski, R. A., MacArthur, M. W., Moss, D. S. & Thornton, J. M.(1993). J. Appl. Cryst. 26, 283.
Luzzati, V. (1952). Acta Cryst. 5, 802±810.McLachlan, A. D. (1982). Acta Cryst. A38, 871±873.Marciniszyn, J. Jr, Hartsuck, J. A. & Tang, J. (1976). J. Biol. Chem.251, 7088±7094.
Martin, A. C. R. (1992±1998). ProFit v.1.8. SciTech Software, Chico,California, USA.
Matthews, B. W. (1968). J. Mol. Biol. 33, 491±497.Merritt, E. A. & Murphy, M. E. P. (1994). Acta Cryst. D50, 869±873.Minamiura, N., Ito, K., Kobayashi, M., Kobayashi, O. & Yamamoto, T.
(1984). J. Biochem. 96, 1061±1069.Navaza, J. (1994). Acta Cryst. A50, 157±163.Nicholls, A., Sharp, K. & Honig, B. (1991). Proteins Struct. Funct.
Genet. 11, 281.Pearlmann, G. E. (1963). J. Mol. Biol. 6, 452±464.Plebani, M. (1993). Crit. Rev. Clin. Lab. Sci. 30, 273±328.Polikarpov, I., Oliva, G., Castellano, E. E., Garratt, R., Arruda, P.,
Leite, A. & Craievich, A. (1998). Nucl. Instrum. Methods A, 405,159±164.
Polikarpov, I., Perles, L. A., de Oliveira, R. T., Oliva, G., Castellano,E. E., Garrat, R. & Craievich, A. (1998). J. Synchrotron Rad. 5, 72±76.
Powers, J. C., Harley, A. D. & Myers, D. V. (1977). Acid Proteinases,Structure, Function and Biology, edited by J. Tang, pp. 141±157.New York: Plenum Press.
Rabb, W. P. (1972). Clin. Chem. 18, 5±25.Samloff, I. M. & Taggart, R. T. (1987). Clin. Invest. Med. 10, 215±221.Samloff, I. M. & Townes, P. L. (1970). Gastroenterology, 58, 462±469.Samloff, I. M., Varis, K., Ihamaki, T., Siurala, M. & Rotter, J. I. (1982).
Gastroenterology, 83, 204±209.Sielecki, A. R., Fedorov, A. A., Boodhoo, A., Andreeva, N. S. &
James, M. N. G. (1990). J. Mol. Biol. 214, 143±170.Stemmerman, G. N., Heilbrun, L. K., Nomura, A. & Samloff, I. M.
(1985). Prog. Clin. Biol. Res. 173, 213±220.Suguna, K., Padlan, E. A., Bott, R., Boger, J., Parris, K. D. & Davies,
D. R. (1992). Proteins Struct. Funct. Genet. 13, 195±205.Szecsi, P. B. (1992). Scand. J. Clin. Lab. Invest. 52(Suppl. 210), 5±22.Tang, J. (1976). Trends Biochem. Sci. 1, 205±208.Tang, J., Sepulveda, P., Marciniszyn, J. J., Chen, K. C., Huang, W. Y.,
Tao, N., Liu, D. & Lanier, J. P. (1973). Proc. Natl Acad. Sci. USA, 70,3437±3439.
Tarasova, N., Denslow, N. D., Parten, B. F., Tran, N., Nhuyen, H. P.,Jones, A., Roberts, N. B. & Dunn, B. M. (1994). In AsparticProteases and their Inhibitors, edited by K. Takahashi. New York:Plenum Press.
Ten Kate, R. W., Pals, G., Pronk, J. C., Bank, R. A., Eriksson, A. W.,Donker, A. B. J. M. & Meuwissen, S. G. M. (1988). Clin. Sci. 75,649±654.
electronic reprint
Related Documents

![Download [2.45 MB]](https://static.cupdf.com/doc/110x72/587f44871a28ab8a5f8c3deb/download-245-mb.jpg)


![Lecture 17. Jahn-Teller distortion and coordination number four Long axial Cu-O bonds = 2.45 Å four short in-plane Cu-O bonds = 2.00 Å [Cu(H 2 O) 6 ]](https://static.cupdf.com/doc/110x72/56649d0b5503460f949df5b9/lecture-17-jahn-teller-distortion-and-coordination-number-four-long-axial.jpg)
