East Tennessee State University East Tennessee State University Digital Commons @ East Tennessee Digital Commons @ East Tennessee State University State University Electronic Theses and Dissertations Student Works 12-2019 Structure Elucidation of a Pyrrolobenzodiazepine Alkaloid and a Structure Elucidation of a Pyrrolobenzodiazepine Alkaloid and a Biologically Active Polyketide Produced by Rhodococcus sp. Biologically Active Polyketide Produced by Rhodococcus sp. MTM3W5.2 via Two-Dimensional NMR Spectroscopy MTM3W5.2 via Two-Dimensional NMR Spectroscopy Garrett Johnson East Tennessee State University Follow this and additional works at: https://dc.etsu.edu/etd Part of the Analytical Chemistry Commons, Medicinal-Pharmaceutical Chemistry Commons, Natural Products Chemistry and Pharmacognosy Commons, and the Organic Chemistry Commons Recommended Citation Recommended Citation Johnson, Garrett, "Structure Elucidation of a Pyrrolobenzodiazepine Alkaloid and a Biologically Active Polyketide Produced by Rhodococcus sp. MTM3W5.2 via Two-Dimensional NMR Spectroscopy" (2019). Electronic Theses and Dissertations. Paper 3681. https://dc.etsu.edu/etd/3681 This Thesis - unrestricted is brought to you for free and open access by the Student Works at Digital Commons @ East Tennessee State University. It has been accepted for inclusion in Electronic Theses and Dissertations by an authorized administrator of Digital Commons @ East Tennessee State University. For more information, please contact [email protected].

Welcome message from author
This document is posted to help you gain knowledge. Please leave a comment to let me know what you think about it! Share it to your friends and learn new things together.
Transcript

East Tennessee State University East Tennessee State University
Digital Commons @ East Tennessee Digital Commons @ East Tennessee
State University State University
Electronic Theses and Dissertations Student Works
12-2019
Structure Elucidation of a Pyrrolobenzodiazepine Alkaloid and a Structure Elucidation of a Pyrrolobenzodiazepine Alkaloid and a
Biologically Active Polyketide Produced by Rhodococcus sp. Biologically Active Polyketide Produced by Rhodococcus sp.
MTM3W5.2 via Two-Dimensional NMR Spectroscopy MTM3W5.2 via Two-Dimensional NMR Spectroscopy
Garrett Johnson East Tennessee State University
Follow this and additional works at: https://dc.etsu.edu/etd
Part of the Analytical Chemistry Commons, Medicinal-Pharmaceutical Chemistry Commons, Natural
Products Chemistry and Pharmacognosy Commons, and the Organic Chemistry Commons
Recommended Citation Recommended Citation Johnson, Garrett, "Structure Elucidation of a Pyrrolobenzodiazepine Alkaloid and a Biologically Active Polyketide Produced by Rhodococcus sp. MTM3W5.2 via Two-Dimensional NMR Spectroscopy" (2019). Electronic Theses and Dissertations. Paper 3681. https://dc.etsu.edu/etd/3681
This Thesis - unrestricted is brought to you for free and open access by the Student Works at Digital Commons @ East Tennessee State University. It has been accepted for inclusion in Electronic Theses and Dissertations by an authorized administrator of Digital Commons @ East Tennessee State University. For more information, please contact [email protected].

Structure Elucidation of a Pyrrolobenzodiazepine Alkaloid and a Biologically Active Polyketide
Produced by Rhodococcus sp. MTM3W5.2 via Two-Dimensional NMR Spectroscopy
_____________________
A thesis
presented to
the faculty of the Department of Chemistry
East Tennessee State University
In partial fulfillment
of the requirements for the degree
Master of Science in Chemistry
_____________________
by
Garrett Adam Johnson
December 2019
_____________________
Dr. Abbas G. Shilabin, Chair
Dr. Bert C. Lampson
Dr. Ismail Kady
Keywords: Nuclear Resonance Spectroscopy, Natural product, Rhodococcus, polyketide

1
ABSTRACT
Structure Elucidation of a Pyrrolobenzodiazepine Alkaloid and a Biologically Active Polyketide
Produced by Rhodococcus sp. MTM3W5.2 via Two-Dimensional NMR Spectroscopy
by
Garrett Adam Johnson
As the battle against ever-increasing drug resistence bacteria rages on, novel and sometimes
more complex natural products can be used to combat this. In this study, two-dimensional NMR
techniques were utilized to collect a complete spectral data set for two natural products. The first
structure, a synthesized Pyrrolobenzodiazepine alkaloid natural product was confirmed through
these methods. The second, a strain of Rhodococcus, MTM3W5.2, produces a novel
antibacterial molecule in broth cultures and the active compound was fractionated using a
Sephedex LH-20 column. Chromatographic purification yielded a pure sample at 58.90 minutes,
RT.58. HRMS data deduced an exact mass of 911.5490 Da, equivalent to a molecular formula of
C52H78O13. Several major spin systems were constructed from the 2D-NMR spectra. However,
due to limited sample quantity in compound with a large molecular weight and product
instability, the long range HMBC signals needed to connect these fragments have not yet been
obtained.
2
ACKNOWLEDGEMENTS
I would like to extend my gratitude to entire Department of Chemistry as well as the
Department of Public Health for providing this profound opportunitiy to me.
Specifically, I would like to express my appreciation to mt primary investigator, Dr.
Abbas Shilabin, for generously accepting me into his research group under unprecedented
circumstances given my full-time work situation.
Also, thanks to my commitee Dr. Bert Lampson and Dr. Ismal Kady for working in
tandem with Dr. Shilabin on this project.
Many thanks to the faculty at the David H. Murdock research facility for their
collaboration and use of NMR instrumentation which was vital for the success of this project.
Thanks to Eastman Chemical Company for their flexibility of schedule as well as their
open access to the NMR facility for use during this project.
Special thanks to Dr. Laura Adduci, currently of Dupont Chemical and formerly of
Eastman Chemical Company for her NMR expertise as well as her guidance and assistance
throughout the many phases of this project.

3
TABLE OF CONTENTS
Page
ABSTRACT ..........................................................................................................................1
ACKNOWLEDGEMENTS ...................................................................................................2
TABLE OF CONTENTS .......................................................................................................3
LIST OF TABLES .................................................................................................................6
LIST OF FIGURES ...............................................................................................................7
LIST OF ABBREVIATIONS ................................................................................................ 8
Chapter
1. INTRODUCTION .....................................................................................................9
Chemical Shift .....................................................................................................10
Sample Preparation ..............................................................................................12
Distortionless Enhancement by Polarization Transfer Spectroscopy ..................13
Homonuclear Correlation Spectroscopy ..............................................................14
Heteronuclear Single-Quantum Coherence .........................................................17
Heteronuclear Multiple Bond Correlation ...........................................................20
Systematic Techniques for Complete Elucidation ...............................................22
2. EXPERIMENTAL METHODS AND MATERIALS ...............................................27
NMR Solvents ......................................................................................................27
NMR Spectroscopic Experiments ........................................................................27
DM-002 ................................................................................................................28
RT.58 ...................................................................................................................28
3. RESULTS AND DISCUSSION ................................................................................30

4
DM-002 ................................................................................................................30
RT.58 ...................................................................................................................33
4. CONCLUSIONS AND FUTURE WORK ................................................................44
Conclusions ....................................................................................................44
Future Work ...................................................................................................46
REFERENCES ......................................................................................................................47
APPENDICES .......................................................................................................................52
Appendix A: 1H spectra of DM-002 ..........................................................................52
Appendix B: 13C Spectra of DM-002 .........................................................................53
Appendix C: DEPT-135 of DM-002..........................................................................54
Appendix D1: COSY of DM-002 ..............................................................................55
Appendix D2: COSY of DM-002…………………………………………………..56
Appendix E: HSQC of DM-002 ................................................................................57
Appendix F: HMBC of DM-002……………………………………………………58
Appendix G1: 1H Spectrum of RT.58 ………………………………………………59
Appendix G2; 1H Spectrum of RT.58……………………………………………….60
Appendix G3: 1H Spectrum of RT.58……………………………………………….61
Appendix H: 13C Spectrum of RT.58………………………………………………..62
Appendix I: DEPT-135 of RT.58……………………………………………………63
Appendix J: COSY of RT.58 .....................................................................................64
Appendix K: HSQC of RT.58 ....................................................................................65
Appendix L: HMBC of RT.58 ...................................................................................66
Appendix M: 1H Spectrun of RT.58 Shigemi ............................................................67

5
Appendix N: 13C Spectrum of RT.58 Shigemi ..........................................................68
Appendix O: COSY of RT.58 Shigemi .....................................................................69
Appendix P: HSQC of RT.58 Shigemi ......................................................................70
Appendix Q: HMBC of RT.58 Shigemi ....................................................................71
VITA ........................................................................................................................72
6
LIST OF TABLES
Table Page
1. NMR Data for menthol (CDCl3) ................................................................................25
2. Recommended acquisition and processing parameters for 2D-NMR
Experiments ...............................................................................................................26
3. NMR parameters for sample DM-002 .......................................................................28
4. NMR parameters for sample RT.58 ..........................................................................29
5. NMR parameters for sample RT.58 prepared in Shigemi Tube set ...........................29
6. NMR Spectroscopic Data for DM-002 Sample (500MHz, CDCl3) ..........................30
7. NMR Spectroscopic Data for the sample RT.58 (600 MHz, Methanol-d4)...............34

7
LIST OF FIGURES
Figure Page
1. Magnetic Moment under an applied magnetic field ..................................................10
2. Shielding effect of localized electons ........................................................................11
3. 1H NMR of menthol ...................................................................................................12
4. Typical NMR tube with spinner ................................................................................13
5. Pulse sequence for a DEPT-135 ................................................................................14
6. Andrographolide structure (left) and 13C, DEPT-45, 90, and 135 spectra ................15
7. Pulse Sequence for a two-dimensional COSY-90 experiment ..................................16
8. Example topology of 1H,1H-COSY spectrum ............................................................18
9. Pulse sequence for 1H,13C-HSQC ..............................................................................19
10. HSQC of Sucrose .......................................................................................................20
11. Pulse sequence for HMBC .........................................................................................21
12. Recently published complete structures elucidated via NMR-spectrometric
Techniques .................................................................................................................23
13. Structural Fragments deduced from each DM-002 spin system ................................33
14. Confirmed structure of sample DM-002 ....................................................................33
15. HSQC of RT.58 showing each proton-carbon pair as well as the
hybridization of each..................................................................................................36
16. Possible partial spin systems for RT.58 .....................................................................41
17. Typical Shigemi tube apparatus .................................................................................42
8
LIST OF ABBREVIATIONS
1D One Dimensional
2D Two Dimensional
NMR Nuclear Magnetic Resonance
DEPT Distortionless Enhancement by Polarization Transfer Spectroscopy
COSY Correlations Spectroscopy
HSQC Heteronuclear Single-Quantum Coherence Spectroscopy
HMBC Heteronuclear Multiple-Bond Correlation Spectroscopy
ppm Parts per million
HR-MS High-Resolution Mass Spectroscopy
PBD Pyrrolobenzodiazepine
MeOD Deuterated Methanol
CDCl3 Deuterated Chloroform
Da Dalton
mL Milliliter
g gram
μL Microliter
MHz Megahertz
RT Retention Time

9
CHAPTER 1
INTRODUCTION
Natural product discovery and elucidation is a growing field in the effort to develop novel
antibiotics in order to combat the ever-increasing problem of drug resistent bacteria. This is just
one of the many end use products that utilize the biological activity that natural products obtain.
Dating back to the discovery of penicillin over 75 years ago, more than 23,000 natural product
species have been identified and characterized in the fields such as pharmaceuticals, herbicides,
insectacides1. As interest in this field has grown throughout the late 20th and early 21st centuries,
so has the applied techniques to aid in this advancement.
The first 30 years of natural product discovery followed a very systematic architype : (1)
phenotypic screening, (2) compound isolation and structural characterization, (3) mode of action
studies in some cases, (4) preclinical development, and if successful, (5) clinical development
and commercialization. One technique in particular that has shown great effect in the second step
of structural characterization is the development and implementation of Nuclear Magnetic
Resonance techniques. These advanced NMR techniques have helped in not only eliminating the
dereplication of known compounds quicker but also gave way to the complete structural
elucidation of larger, more complex natural product species2.
The scope of this research thesis will focus on the theory of various NMR techniques and
how those can be utilized in order to validate the exact structural makeup of three differing
natural product species. The first species being a Pyrrolobenzodiazepine (PBD) alkaloid
analogue, being researched as a novel β-lactam antibiotic to combat the ever-increasing β-
lactamase-mediated resistance.3 These PBD analogues have also been reported to serve as
anticancer therapeutics due to uniques guanine binding charateristics.4 The second species is

10
most likely that of a polyketide derivative, Rhodococcus, MTM3W5.2, as previously reported by
the research group.5
Chemical Shift
The basis to the theory behind NMR spectroscopy is built on the principles of nuclear
spin, more importantly the nuclear spin in the presence of a magnetic field. This was first
discovered in the 1950’s when 1H and 31P nuclei were observed to absorb energy when placed
into a magnetic field frequency that was specific to the nucleus itself. Once absorbed, nuclei
would then resonate, with different atoms within the same molecule resonating at different
frequencies. These differences in resonances are what are used to determine the chemical
structure of a molecule.6
The spin of an electron can be denoted as the spin quantum number (ms), this electron has
both angular momentum and orbital angular momentum as it spins around a given axis. This
momentum is a vector, therefore possessing both magnitude (1/2) and direction (+ or -).7 Atomic
nuclei that possess even numbers of protons and neutrons have zero spin with all other atoms
said to have a non-zero spin. A given atom with non-zero spin has a magnetic moment, which
can be illustrated as bar magnets in figure 1. Undisturbed, the magnet has an equal probability of
any random orientation. When an external magnetic field, Bo, is applied, the magnet is forced to
align with or against the magnetic field.8

11
Figure 1. Magnetic Moment under an applied magnetic field8
The presence of electrons determines how great the effect of the external magnetic field
will have on a given nucleus of a molecule. As the charged electrons orbit the nucleus a magnetic
field is created and acts upon the nucleus, creating slight changes in energy levels. This
phenomenon is known as shielding.8 Inequivalent nuclei experience different magnetic fields
dues to the local electronic environment, this change in energy requires a different frequency to
excite the spin flip which allows for differentiation in the NMR spectrum. In figure 2, the effect
of localized electrons is illustrated to describe how their magnetic field can shield the nucleus
from the externally applied magnetic field.
Figure 2: Shielding effect of localized electons8
Chemically inequivalent environments can be interpreted through the use of Fourier
Transforming the NMR signal. This results in a spectrum with an arrangement of peaks that
corresponds to a unique chemical environment. Figure 3 is an example of a typical 1H NMR
spectra for the natural product menthol, displaying numbered peaks at varying chemical shifts,

12
each unique to their electronic environment within the molecule.
Figure 3: 1H NMR of menthol9
The integration of area underneath each numbered peak in Figure 3 is directly
proportional to the number of each given nuclei, in this case protons, within that specific
environment.8
Sample Preparation
A high-quality NMR tube should always be used, poor quality tubes will result in poor
spectra, this explains why typical NMR tubes are so expensive. A standard NMR tube is
typically a cylindrical glass 5mm diameter. Smaller, more specialized NMR tubes are available
in order to increase sensitivity however can be very expensive.9
Depending on the sample, 1-5 mg is commonly standard for an organic molecule with 1H
NMR, while 5-50mg is reasonable for 13C NMR. Preparing an NMR tube with too little sample
will hamper the signal therefore possibly giving an incomplete spectrum, while a sample with
too much will cause an increase in viscosity of the sample solution leading to broad peaks.10

13
Commonly, a solvent height of 5cm is used for NMR experiments. The cylindrical tubes are
inserted into a spinner which will be spun around inside of the instrument by air. A typical
spinner is shown in Figure 4.
Figure 4: Typical NMR tube with spinner11
The vertical position of the tube in Figure 4 will be set by the depth gauge, indicated by the tube
resting on the bottom of the gauge.
Distortionless Enhancement by Polarization Transfer Spectroscopy
An alternative to traditional decoupled 13C-NMR experiments is a Distortionless
Enhancement by Polarization Transfer (DEPT) experiment. DEPT experiments differ from the
classic 13C in that it is a spectral editing sequence which can be used to produce different signals
based off of the type of carbon nuclei present in the molecule. Specifically, DEPT-135, uses a
135-degree decoupler pulse which in turn yields a spectrum that positively phases methyl (CH3)
and methine (CH) carbons while negatively phasing methylene (CH2) carbons. Quaternary
carbons (C) give no signal in a DEPT-135 experiment because the large one-bond heteronuclear

14
J-coupling is used for polarization transfer.12 This allows for complete determination of all
carbon multiplicities within a molecule.
Comparison between the standard decoupled 13C spectrum and the DEPT-135 spectrum
allows easy identification of quaternary carbons by looking for absent peaks in the DEPT when
compared to the original 13C spectrum.
Figure 5 : Pulse sequence for a DEPT-13513
The DEPT sequence depicted in figure 6 begins with a 900 H pulse after which, under the
influence of proton-carbon coupling, proton magnetization evolves. A period of 1/2J elapses,
resulting in the two proton satellite vectors being anti-phase. A new 900 C pulse is applied in
which both transverse proton and carbon magnetization evolve coherently, this is termed as
multiple quantum coherence. Unlike the typical transverse magnetization that is observed in
single quantum coherence NMR, multiple quantum coherence cannot be directly observed
because it induces no signal in the detection coil. Thus, this signal produced must be transferred
back into single quantum coherence for it to be of any use.14
Changing the proton decoupler pulse angle changes what multiplicity signals are detected
and how they are phased. Using a 900 decoupler pulse produces a carbon spectrum containing
only carbons with a single attached proton, methine (CH). Switching to a 450 decoupler pulse
will produce a carbon spectrum containing only carbons with protons directly attached, all of

15
which are positively phased. Quaternary carbons are not observed. Example spectra of each
decoupled pulse angle is depicted below in figure 6 for the terpene andrographolide.
Figure 6: Andrographolide structure (left) and 13C, DEPT-45, 90, and 135 spectra15
Homonuclear Correlation Spectroscopy
Apart from the introduction of Fourier Transfer NMR, the application of
multidimensional spectra contributed the greatest leap in NMR spectroscopy, both of which have
been acknowledge by a Nobel Prize.16 Correlated Spectroscopy, COSY, is a useful two-
dimensional method for determining which protons are coupling with each other in a given
molecule. The pulse sequence for this two-dimensional experiment can be seen below in figure
7.
16
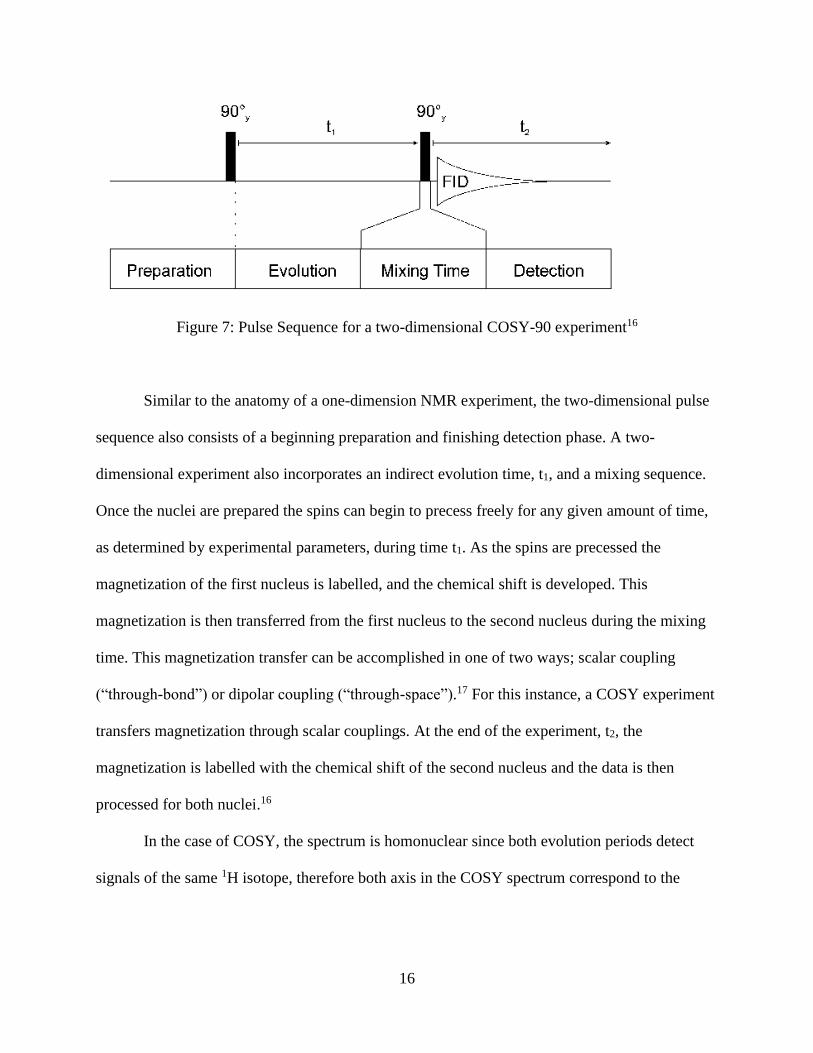
Figure 7: Pulse Sequence for a two-dimensional COSY-90 experiment16
Similar to the anatomy of a one-dimension NMR experiment, the two-dimensional pulse
sequence also consists of a beginning preparation and finishing detection phase. A two-
dimensional experiment also incorporates an indirect evolution time, t1, and a mixing sequence.
Once the nuclei are prepared the spins can begin to precess freely for any given amount of time,
as determined by experimental parameters, during time t1. As the spins are precessed the
magnetization of the first nucleus is labelled, and the chemical shift is developed. This
magnetization is then transferred from the first nucleus to the second nucleus during the mixing
time. This magnetization transfer can be accomplished in one of two ways; scalar coupling
(“through-bond”) or dipolar coupling (“through-space”).17 For this instance, a COSY experiment
transfers magnetization through scalar couplings. At the end of the experiment, t2, the
magnetization is labelled with the chemical shift of the second nucleus and the data is then
processed for both nuclei.16
In the case of COSY, the spectrum is homonuclear since both evolution periods detect
signals of the same 1H isotope, therefore both axis in the COSY spectrum correspond to the

17
proton NMR spectrum. An example topology is depicting for a typical homonuclear 1H,1H-
COSY spectrum below in figure 8.
Figure 8: Example topology of 1H,1H-COSY spectrum16
A typical COSY spectrum contains two types of signals, diagonal and cross peaks.
Diagonal signals can be seen in figure 8 as red peaks along the bold line running from bottom
right to top left of the spectrum. This diagonal of peaks can be viewed as a plane of symmetry,
dividing the spectrum into equivalent halves.
The diagonal peaks in figure 8 result from magnetization that was not changed during the
mixing phases of the experiment. This is contributed from equal frequencies in both dimensions,
indicating that the magnetization remained on the same nucleus throughout both evolution times,
t1 and t2, respectively.17
All peak signals located off of the diagonal are referred to as cross peaks. These signals
originate from nuclei that exchanged different magnetizations during the mixing phase. This is
due to a difference in the frequency between the first and second nucleus in both dimensions,
indicating a detectable interaction between the two nuclei. These interactions are transferred
magnetizations through scalar coupling between nuclei two to three bonds apart.17 Protons within
18
a molecule that lie more than three bonds apart do no give cross peak signals in the spectrum due
to the fact the 4J coupling constants are essentially a value of 0.17
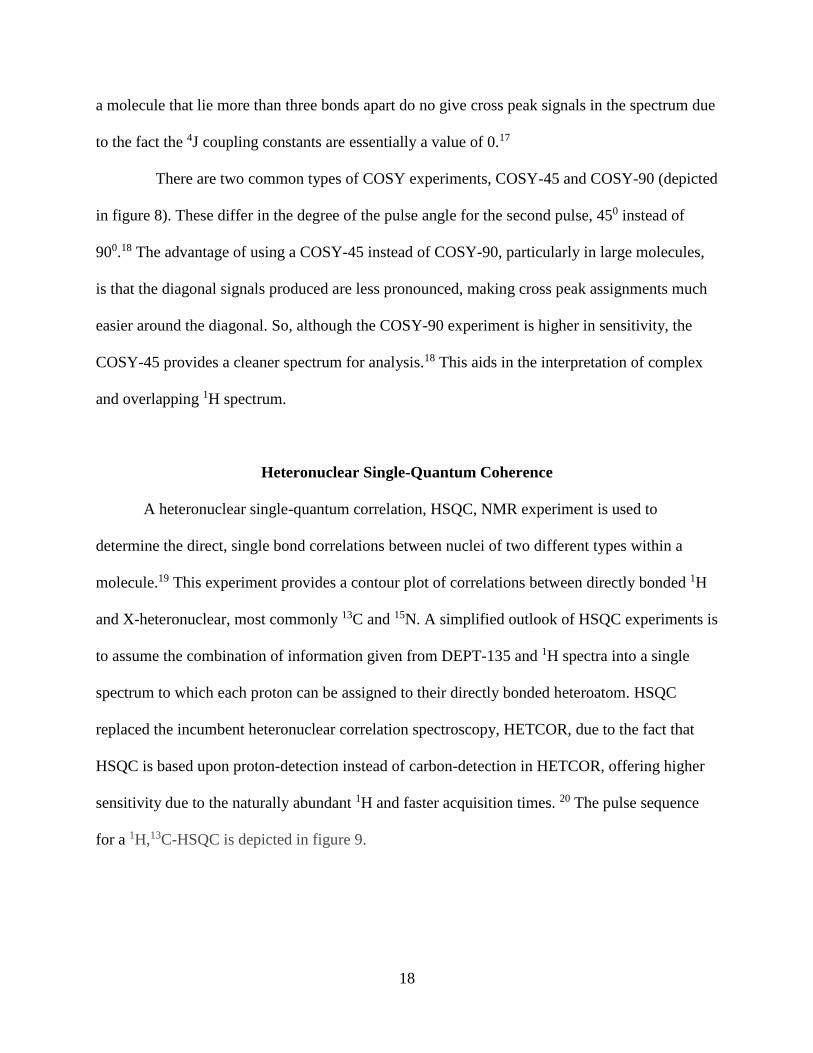
There are two common types of COSY experiments, COSY-45 and COSY-90 (depicted
in figure 8). These differ in the degree of the pulse angle for the second pulse, 450 instead of
900.18 The advantage of using a COSY-45 instead of COSY-90, particularly in large molecules,
is that the diagonal signals produced are less pronounced, making cross peak assignments much
easier around the diagonal. So, although the COSY-90 experiment is higher in sensitivity, the
COSY-45 provides a cleaner spectrum for analysis.18 This aids in the interpretation of complex
and overlapping 1H spectrum.
Heteronuclear Single-Quantum Coherence
A heteronuclear single-quantum correlation, HSQC, NMR experiment is used to
determine the direct, single bond correlations between nuclei of two different types within a
molecule.19 This experiment provides a contour plot of correlations between directly bonded 1H
and X-heteronuclear, most commonly 13C and 15N. A simplified outlook of HSQC experiments is
to assume the combination of information given from DEPT-135 and 1H spectra into a single
spectrum to which each proton can be assigned to their directly bonded heteroatom. HSQC
replaced the incumbent heteronuclear correlation spectroscopy, HETCOR, due to the fact that
HSQC is based upon proton-detection instead of carbon-detection in HETCOR, offering higher
sensitivity due to the naturally abundant 1H and faster acquisition times. 20 The pulse sequence
for a 1H,13C-HSQC is depicted in figure 9.

19
Figure 9: Pulse sequence for 1H,13C-HSQC20
Similar to the previously described COSY sequence, this two-dimensional heteronuclear
pulse sequence involves the same three major parts; Preparation, Evolution, and Mixing. This
particular pulse sequence utilizes the INEPT sequence during the beginning phase, as evident by
the 900-1800-900 sequence for 1H and 1800-900 for the 13C.20 This portion completes the
preparation phase. The evolution takes place during the 13C spins, during which an 1800 pulse is
applied only to the 1H nucleus. The magnetization is then evolved and data are transferred back
to 1H nucleus where it is detected. This is how the more sensitive proton nucleus is used for
detection, there in encompassing the advantage over the aforementioned HETCOR experiment.21
An additional spin echo can also be utilized to decouple the signal.20 This simplifies the
spectrum by collapsing multiplets down to a single peak, similar to the traditional decoupled 13C
experiment. This is achieved by running sequential experiments, purposefully reversing the
phase of one specific pulse, this changes the sign of the undesired peaks therefore when the two
spectrum are subtracted only the desired decoupled peaks are remaining in the spectrum.22
In the HSQC spectrum, the contour plot provides information through the use of three
independent axes. On two of them, the F1and F2, the one-dimensional spectra of each
heteronucleus is plotted. In the HSQC example of the sugar moiety sucrose, displayed in figure
20
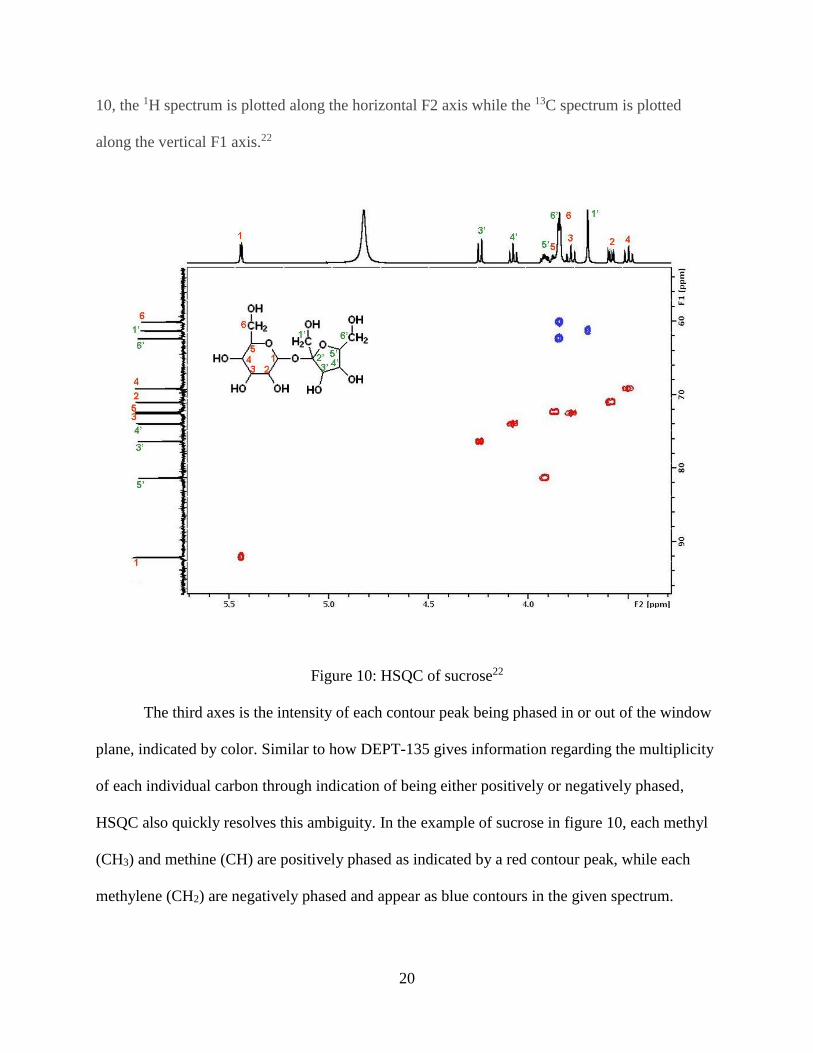
10, the 1H spectrum is plotted along the horizontal F2 axis while the 13C spectrum is plotted
along the vertical F1 axis.22
Figure 10: HSQC of sucrose22
The third axes is the intensity of each contour peak being phased in or out of the window
plane, indicated by color. Similar to how DEPT-135 gives information regarding the multiplicity
of each individual carbon through indication of being either positively or negatively phased,
HSQC also quickly resolves this ambiguity. In the example of sucrose in figure 10, each methyl
(CH3) and methine (CH) are positively phased as indicated by a red contour peak, while each
methylene (CH2) are negatively phased and appear as blue contours in the given spectrum.

21
Heteronuclear Multiple-Bond Correlation
Heteronuclear multiple-bond correlation, specifically 1H,13C- HMBC, experiments give
rise to the long-range correlations between protons and carbons that are most often two to three
bonds away, although it is possible in some instances to observe correlations four or even five
bonds away.23 HMBC are particularly important in determining the connectivity of individual
spin systems generated through COSY and HSQC experiments. Although, HMBC spectrum
often tend to be the most challenging step in the complete elucidation process. The lack of cross-
peak intensity is notoriously unambiguous, leading to two and three bond cross peaks displaying
very weak signal, or sometimes not at all. Inherently, when a cross peak displays adequate
signal, there is no simple method for distinguishing between two, three, and four bond
correlations.
Figure 11: HMBC pulse sequence24
The common pulse sequence for a typical HMBC experiment can be seen above in figure
11. The first 900 pulse is used to eliminate the one-bond 1JCH correlations so that the direct
connectivity cross peaks, essentially the same as recorded in HSQC spectra, are not recorded in
the spectra, thus only allowing the long range 1H–13C connectivity to be observed. The second

22
900 pulse creates zero and double-quantum coherences, which are then interchanged during the
1800 1H pulse. The final 900 pulse serves to modulate the 1H signals resulting from 1H–13C
multiple-quantum coherence by 13C chemical shifts and homonuclear proton couplings.25
Standard HMBC experiments are usually optimized for long range coupling constants of
intermediate size, due to this both strong and weak 1H,13C- HMBC long range couplings may
result in weak cross peaks in routine HMBC. This can be addressed by acquiring two separate
HMBC spectra utilizing two individual mixing delays, for example 60 and 120 ms. However,
when using longer mixing delays it should be noted that the acquisitions time should also be
increased to at least twice the duration of the mixing delay. This can lead to parameter sets that
are considerably above the default HMBC analysis parameters in common place. 24
Compared to standard HSQC and HMQC, a decrease in spectra intensity is often
observed for the HMBC spectra. This is primarily attributed to the relatively long mixing delay
(40-120 ms) in the HMBC pulse sequence, figure 11.24 1H line shape of the HMBC spectra can
generally be used as a predictor of adequate S/N. A narrow 1H line width correlate with good
S/N in the HMBC spectra.
In general, is not necessary to acquire a one-dimensional 13C spectra if a well resolved
HSQC and HMBC spectra are available for organic small molecules. However, if the species of
interest possesses quaternary carbons that do not give any cross peaks in the HMBC spectra,
meaning there are no protons within two to four bonds of some carbons, a typical 13C spectra will
need to be obtained to unambiguously distinguish between individual quaternary carbons.26
Unlike HSQC experiments, spectral resolution of routine HMBC in the 13C-chemical
shift dimension is limited. Cross peaks in the HMBC are broadened in the 13C-dimension by the
1H,1H-coupling constants of the proton whose long-range 1H, 13C-coupling is observed. Due to
23
this, cross peaks belonging to carbons of very similar chemical shifts cannot be completely
elucidated. It is possible to remove the interfering 1H,1H-coupling by using a band-selective,
constant-time variant of the standard HMBC, which can produce spectra with extremely high
resolution in the 13C-dimension, as previously reported.27
Systematic Techniques for Complete Elucidation
The abilities of today’s spectrophotometric instruments allow for the routine analysis of
most classes of organic molecules. This is true for both complex natural products as well as
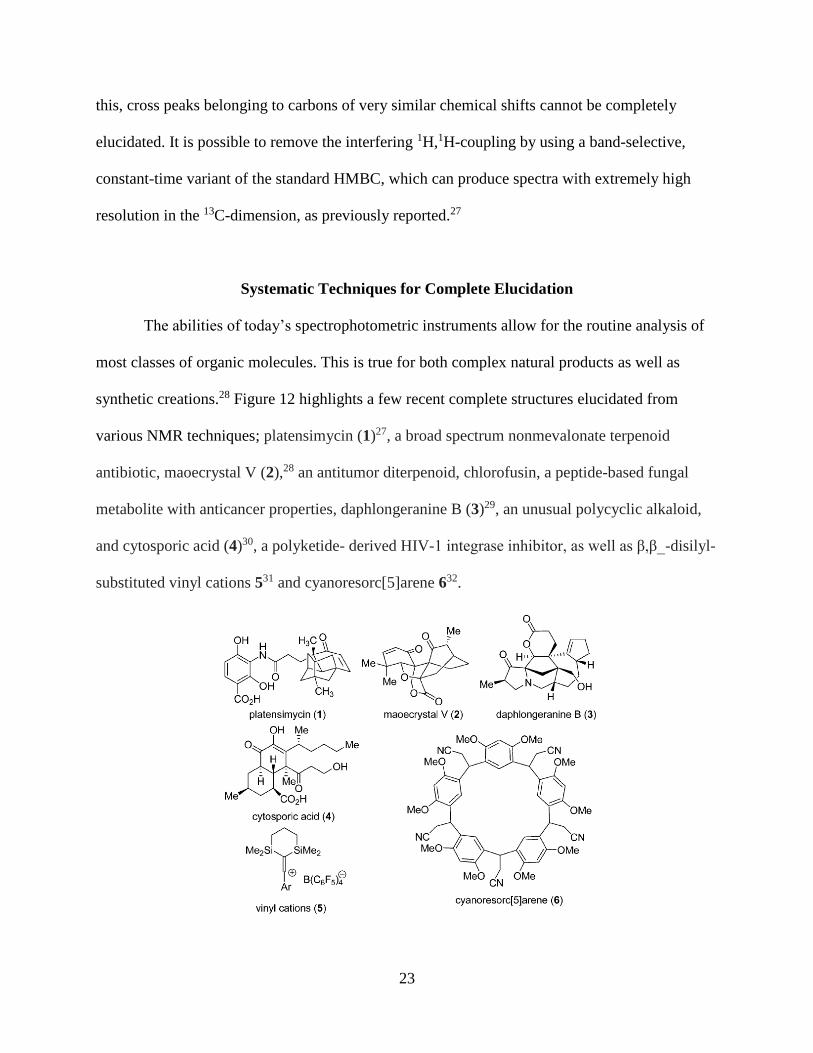
synthetic creations.28 Figure 12 highlights a few recent complete structures elucidated from
various NMR techniques; platensimycin (1)27, a broad spectrum nonmevalonate terpenoid
antibiotic, maoecrystal V (2),28 an antitumor diterpenoid, chlorofusin, a peptide-based fungal
metabolite with anticancer properties, daphlongeranine B (3)29, an unusual polycyclic alkaloid,
and cytosporic acid (4)30, a polyketide- derived HIV-1 integrase inhibitor, as well as β,β_-disilyl-
substituted vinyl cations 531 and cyanoresorc[5]arene 632.
24
Figure 12: Recently published complete structures elucidated via NMR-spectrometric
techniques9
For most simple, lower molecular weight organic compounds, the basic 1D 1H and
13C NMR, COSY and if needed NOESY (Nuclear Overhauser Spectroscopy) will suffice for the
elucidation of complete structure.33 It is when these basic spectra exhibit overlapping peaks or
higher-order multiplet patterns which tend to complicate spectral interpretation that additional 2-
dimensional experiments need to be performed. A systematic approach can be utilized to
determine the degree of analysis that must be performed in order to deduce a complete structure
in the most time efficient manner.9
Initial screening of a 1D 1H and 13C-NMR spectrum should reveal most of the spectral
features as well as the complexity of the target species.33 It is also worth noting that unknown
overlapping peaks may be present and that experimenting with different solvents is a useful
procedure to determine the best solvent based on; solubilizing effect, chemical shift, peak
shape.21 In addition, it is also prudent to obtain a molecular formula either through elemental
analysis or better yet using the exact mass based off of high-resolution mass spectroscopy, HR-
MS, this should be used to verify the number of protons integrated in the 1D 1H-NMR spectrum
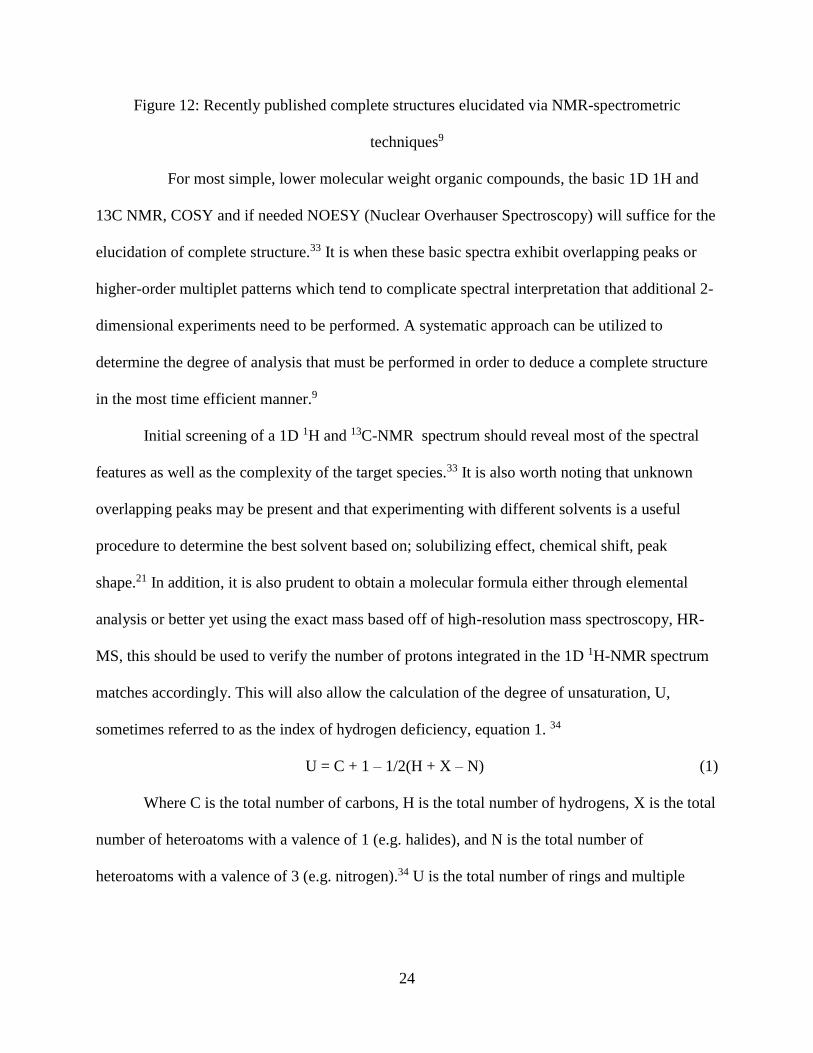
matches accordingly. This will also allow the calculation of the degree of unsaturation, U,
sometimes referred to as the index of hydrogen deficiency, equation 1. 34
U = C + 1 – 1/2(H + X – N) (1)
Where C is the total number of carbons, H is the total number of hydrogens, X is the total
number of heteroatoms with a valence of 1 (e.g. halides), and N is the total number of
heteroatoms with a valence of 3 (e.g. nitrogen).34 U is the total number of rings and multiple
25
bonds present in the molecule. Additional preliminary information can be obtained from IR or
UV/Vis spectroscopy if a specific functional group(s) is believed to be present in the species.
Next, it is most useful to identify each individual proton through HSQC experiment,
specifically if there is overlap in the 1D 1H NMR spectra.35 This will allow for the numbering of
each proton, most commonly ascending whole integers from left to right of the spectrum. In
addition, the phasing of each cross peak will give evidence to the number of protons directly
bound to a specific carbon.35 This should eliminate the need for edited 1D 13C NMR experiments
such as DEPT, which can take up excessive instrument time.36 However, if the species contains
a large number of quaternary carbons it may be of use to compare the standard 1D 13C NMR
with a DEPT experiment to more easily identify each quaternary carbon rather than comparing to
the HSQC.
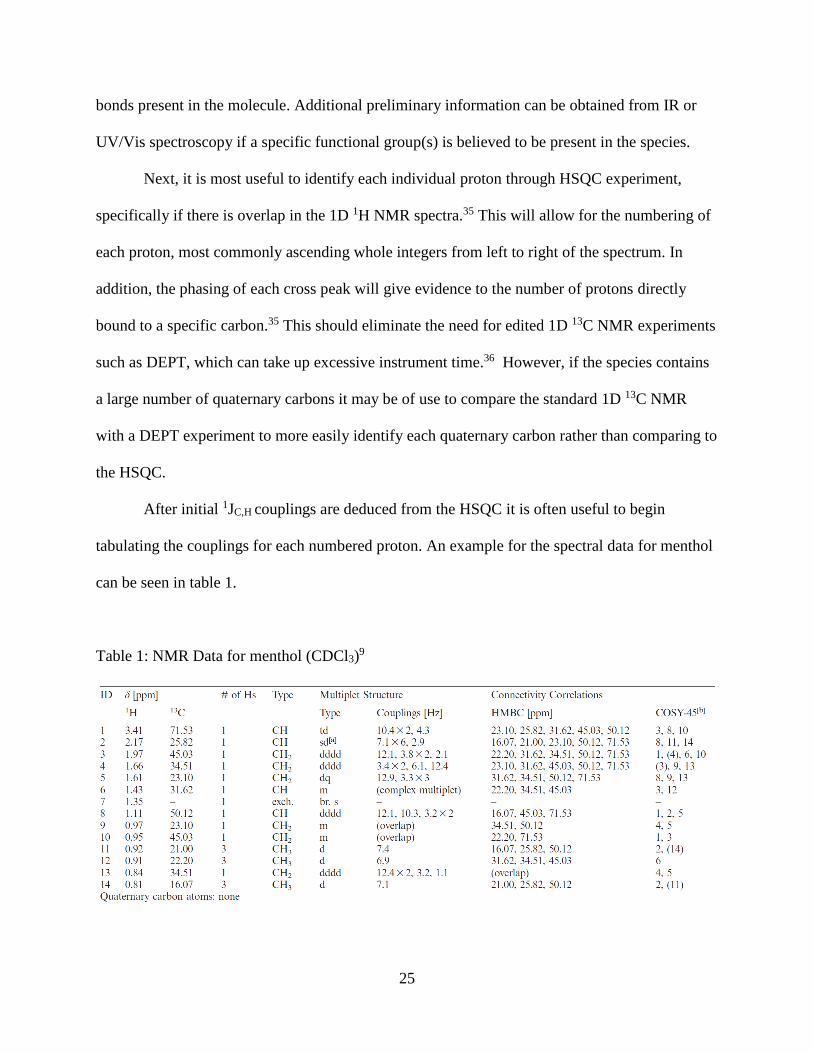
After initial 1JC,H couplings are deduced from the HSQC it is often useful to begin
tabulating the couplings for each numbered proton. An example for the spectral data for menthol
can be seen in table 1.
Table 1: NMR Data for menthol (CDCl3)9

26
In table 1, each unambiguous proton is numbered in column ID through use of HSQC
spectrum. Each corresponding proton and carbon chemical are obtained from standard 1D 1H
and 13C NMR (or HSQC if necessary) and reported in ppm. The chemical shift of quaternary
carbons can be obtained from either the 13C NMR, DEPT, or HMBC correlations. The number of
hydrogens for each is determined from the integration of 1D 13H NMR spectra and phase of each
HSQC crosspeak.37 The correlation data for other experiments can then be stored in additional
columns. It is commonplace, to avoid bias, to record a full data set (HSQC, COSY, HMBC)
before beginning spectral interpretation.9
Once several fragments are deduced from the HSQC and COSY spectrum, combination
with HMBC data can begin to build the skeletal connectivity of the species.38 This technique is
particularly useful when transmitting through heteroatoms and quaternary carbon atoms. A
tabulated list of recommended acquisition and processing parameters for each experiment can be
viewed in table 2.
Table 2: Recommended acquisition and processing parameters for 2D-NMR experiments9

27
CHAPTER 2
EXPERIMENTAL METHODS AND MATERIALS
NMR Solvents
Deuterated chloroform, CDCl3-d (99.8% isotopic purity) +0.05% V/V TMS, was
obtained from Cambridge Isotopes Laboratories and used as is without further purification for
sample DM-002. Deuterated methyl-d3 alcohol, MeOH-d3 (99.96% isotopic purity) 0.75mL
ampoule was received from Aldrich Chemical Supply and was used as is without further
purification for sample RT.58.
NMR Spectroscopy Experiments
1H-NMR, 13C-NMR, DEPT-135, and 2D-NMR experiments including Heteronuclear Single-
quantum Correlation Spectroscopy (HSQC), Heteronuclear Multiple Bond Coherence (HMBC),
Correlation Spectroscopy (COSY) spectrum were carried out for each sample on the specific
instrument indicated below. The samples were prepared in a 5mm NMR probe unless otherwise
noted. Chemical shift values were measured in parts per million (δ, ppm). The splitting patterns
of proton signals were also designated as follows: singlet (s), doublet (d), a doublet of doublets
(dd), a doublet of the doublet of doublets (ddd), triplet (t), the quartet (q), and the multiplet (m).
DM-002
Sample was prepared and experiments performed at Eastman Chemical Company, Kingsport,
TN on a Bruker Ultraspin 500 MHz Spectrophotometer (1H 600 MHz; 13C 125 MHz).
28
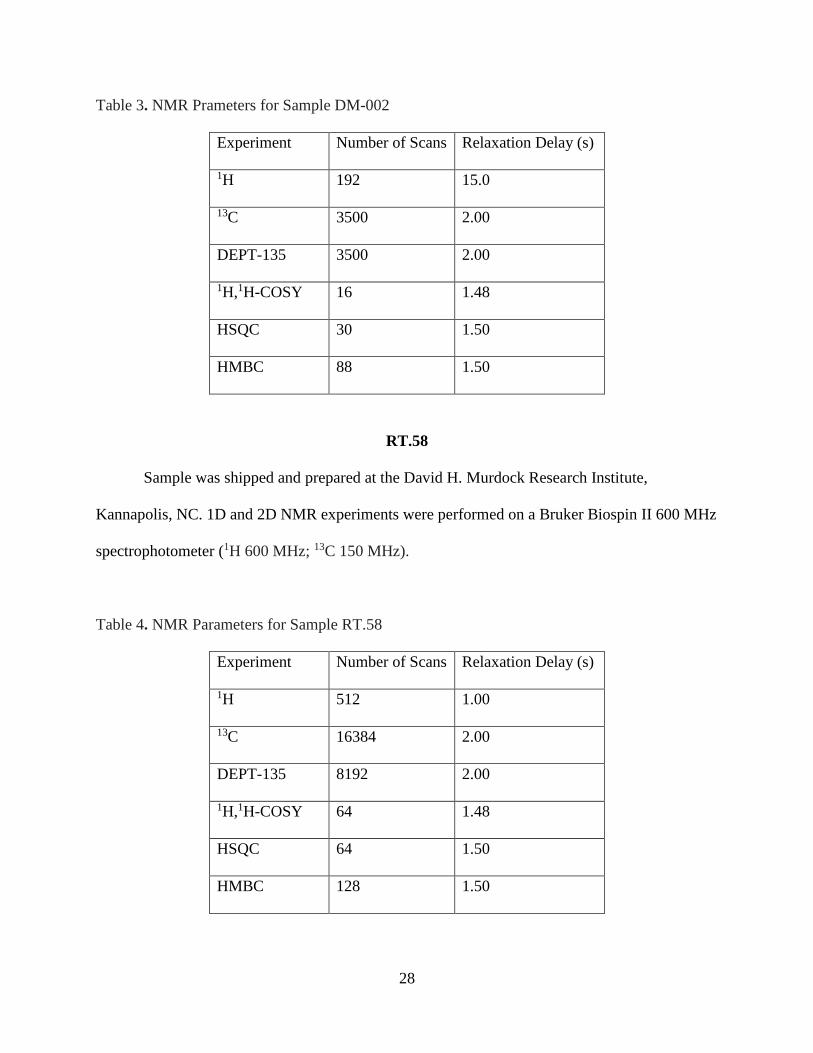
Table 3. NMR Prameters for Sample DM-002
Experiment Number of Scans Relaxation Delay (s)
1H 192 15.0
13C 3500 2.00
DEPT-135 3500 2.00
1H,1H-COSY 16 1.48
HSQC 30 1.50
HMBC 88 1.50
RT.58
Sample was shipped and prepared at the David H. Murdock Research Institute,
Kannapolis, NC. 1D and 2D NMR experiments were performed on a Bruker Biospin II 600 MHz
spectrophotometer (1H 600 MHz; 13C 150 MHz).
Table 4. NMR Parameters for Sample RT.58
Experiment Number of Scans Relaxation Delay (s)
1H 512 1.00
13C 16384 2.00
DEPT-135 8192 2.00
1H,1H-COSY 64 1.48
HSQC 64 1.50
HMBC 128 1.50
29
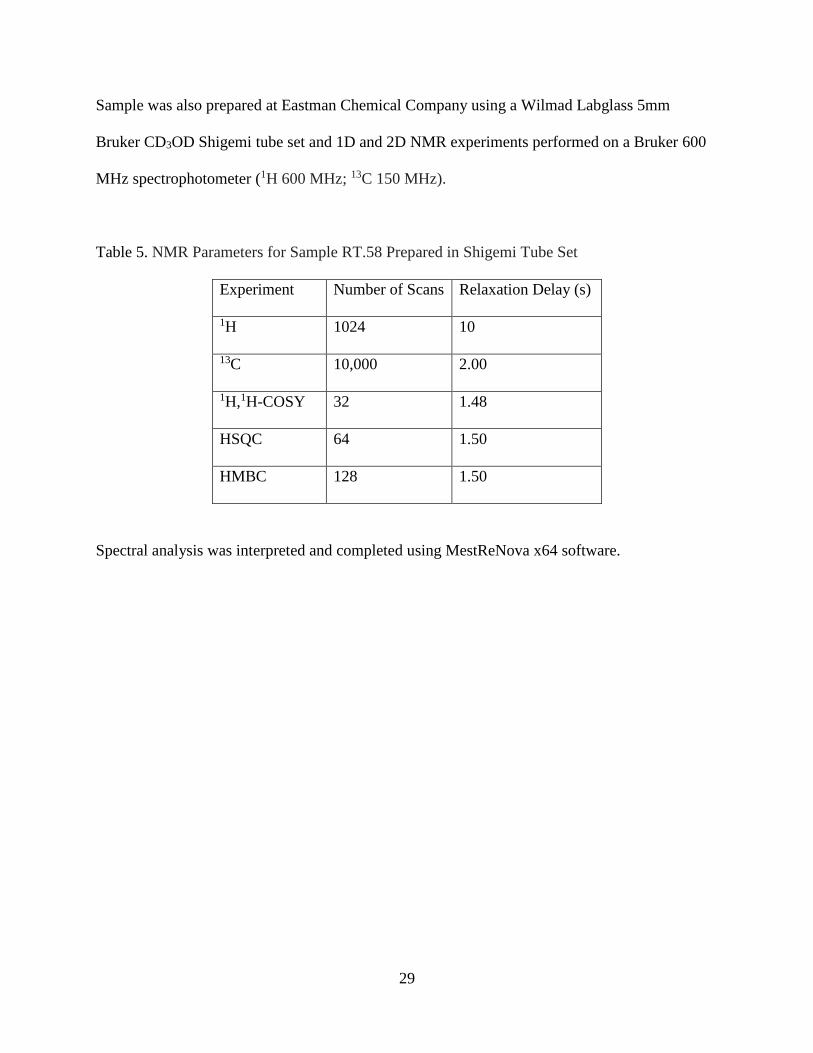
Sample was also prepared at Eastman Chemical Company using a Wilmad Labglass 5mm
Bruker CD3OD Shigemi tube set and 1D and 2D NMR experiments performed on a Bruker 600
MHz spectrophotometer (1H 600 MHz; 13C 150 MHz).
Table 5. NMR Parameters for Sample RT.58 Prepared in Shigemi Tube Set
Experiment Number of Scans Relaxation Delay (s)
1H 1024 10
13C 10,000 2.00
1H,1H-COSY 32 1.48
HSQC 64 1.50
HMBC 128 1.50
Spectral analysis was interpreted and completed using MestReNova x64 software.

30
CHAPTER 3
RESULTS AND DISCUSSION
DM-002
As previously reported, the exact mass of sample DM-002 equated to 318.1481 amu. This
converts to an exact chemical formula of C19H18N4O. Using the following formula:
Degree of unsaturation (U) = C+1-[1/2(H+X-N)]
The degree of unsaturation was determined to be 13. Analysis of the 1H proton spectra
(Appendix A) integration confirmed the presence of 18 unique protons, thus agreeing with the
calculated molecular formula. The peaks in the range of 7.0 ppm and 8.2 ppm indicate the
presence of 9 aromatic protons.
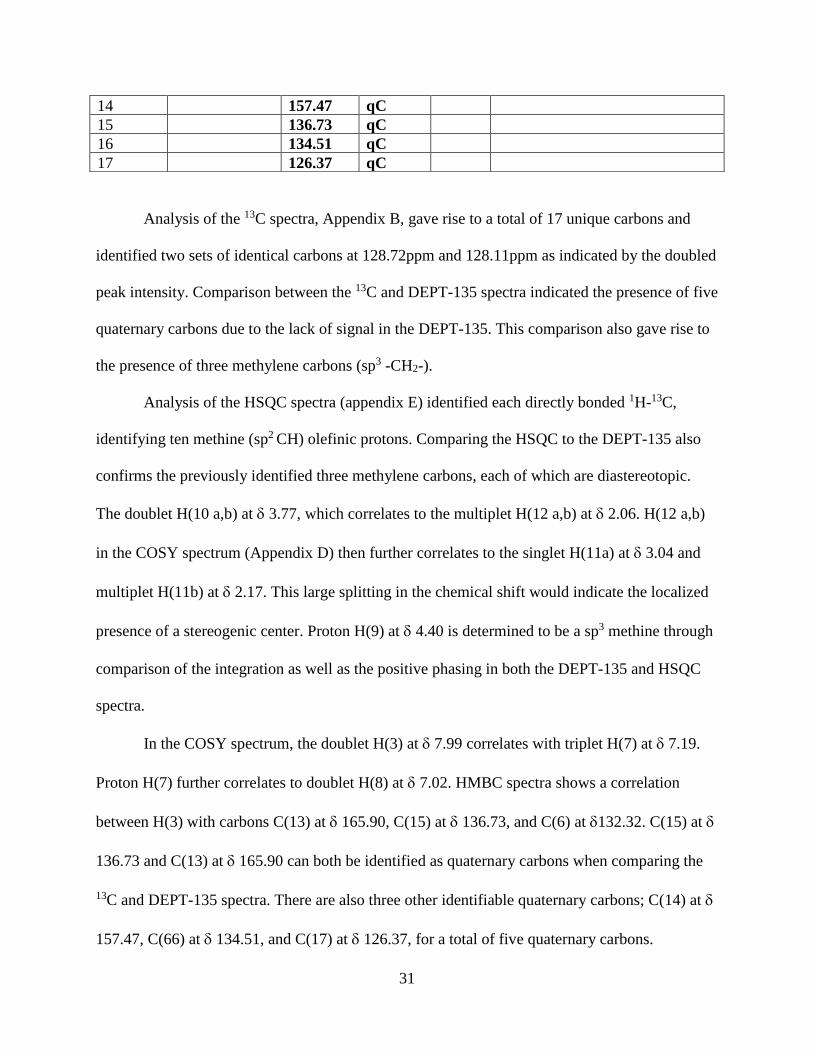
Table 6. NMR Spectroscopic Data for DM-002 Sample (500MHz, CDCl3)
ID # H, mult (J in
Hz) C carbon COSY HMBC
1 8.56 126.36 (17), 55.42(9)
2 8.51,s 157.69 CH═C 134.51(16), 128.11(4)
3 7.99 131.39 CH─C 7 165.90(13), 136.73(15),
132.32(6)
4 7.82 128.11 CH─C 5 157.70(2), 130.72(5)
5a, 5b, 5c 7.44, s 130.72,
128,72
CH═C 4 128.11(4)
6 7.44, t 132.32 CH═C 8 136.73(15), 131.39(3)
7 7.19, 123.71 CH═C 3, 6 126.37(17), 120.69(8)
8 7.02 120.69 CH═C 6 126.37 (17), 123.71(7)
9 4.40, td 55.42 CH─C* 11 157.47(14), 47.29(10), 26.06(11),
23.45(12)
10a, 10b 3.77 47.29 CH2─C 12 55.42(9), 26.06(11), 47.29(10)
23.45(12)
11a, 11b 3.04, s, 2.17, m 26.06 CH2─C 9, 12 157.47(14), 55.42(9), 47.29(10),
23.45(12)
12a, 12b 2.06, m 23.45 CH2─C 10, 11 157.47(14), 55.42(9), 47.29(10),
26.06(11)
13 165.90 qC
31
Analysis of the 13C spectra, Appendix B, gave rise to a total of 17 unique carbons and
identified two sets of identical carbons at 128.72ppm and 128.11ppm as indicated by the doubled
peak intensity. Comparison between the 13C and DEPT-135 spectra indicated the presence of five
quaternary carbons due to the lack of signal in the DEPT-135. This comparison also gave rise to
the presence of three methylene carbons (sp3 -CH2-).
Analysis of the HSQC spectra (appendix E) identified each directly bonded 1H-13C,
identifying ten methine (sp2 CH) olefinic protons. Comparing the HSQC to the DEPT-135 also
confirms the previously identified three methylene carbons, each of which are diastereotopic.
The doublet H(10 a,b) at 3.77, which correlates to the multiplet H(12 a,b) at 2.06. H(12 a,b)
in the COSY spectrum (Appendix D) then further correlates to the singlet H(11a) at 3.04 and
multiplet H(11b) at 2.17. This large splitting in the chemical shift would indicate the localized
presence of a stereogenic center. Proton H(9) at 4.40 is determined to be a sp3 methine through
comparison of the integration as well as the positive phasing in both the DEPT-135 and HSQC
spectra.
In the COSY spectrum, the doublet H(3) at 7.99 correlates with triplet H(7) at 7.19.
Proton H(7) further correlates to doublet H(8) at 7.02. HMBC spectra shows a correlation
between H(3) with carbons C(13) at 165.90, C(15) at 136.73, and C(6) at 132.32. C(15) at
136.73 and C(13) at 165.90 can both be identified as quaternary carbons when comparing the
13C and DEPT-135 spectra. There are also three other identifiable quaternary carbons; C(14) at
157.47, C(66) at 134.51, and C(17) at 126.37, for a total of five quaternary carbons.
14 157.47 qC
15 136.73 qC
16 134.51 qC
17 126.37 qC

32
The overlapping of peaks of H(5) and H(6) at 7.45 in the 1H were distinguished using
the HSQC spectrum which identified three unique direct C-H linkages. Identical aromatic
protons H(5a,b) at 7.45 are directly linked to C(5a) at 130.72, while aromatic proton H(5c) is
bonded to C(9b) at 128.72. Proton H(6), also aromatic at 7.45, is directly bonded to C(6) at
132.32.
Proton H(7) correlates in the COSY to aromatic proton H(3) and (8) and further
correlates in the HMBC to carbon C(17) at 126.37 and C(8) at 120.69. Proton H(8) also
displays a COSY correlation with H(7) and further correlations in the HMBC to carbonyl carbon
C(13) at 165.90 and quaternary carbon C(15) at 136.73.
Protons H(10)-H(12) are all methylene protons, H(10) shows COSY correlation with
H(12) and further correlates to carbons C(9) at 55.42, C(11) at 26.06 and C(12) at 23.45 in
the HMBC. Proton (11a,b) are diasterotopic and correlate in the COSY to H(9) and H(12) and
further correlate to carbons C(14) at 157.47, C(9) at 55.42, C(10) at 47.29, and C(12) at
23.45 in the HMBC. The final methylene H(12) correlates to protons H(10) and H(11) in the
COSY and further correlates to carbons C(14) at 157.47, C(9) at 55.42, C(10) at 47.29 and
C(11) at 26.06 in the HMBC. Carbons 13-17 are all quaternary carbons.

33
(1) (2) (3)
Figure 13: Structural Fragments deduced from each DM-002 spin system
Each fragment deduced from the 1H,1H-COSY spectra can be seen in figure 13 as bold
blue connections. The spin systems created from HMBC spectra can be seen as each uniquely
colored set of arrows.
When the individual spin systems are pieced together, it can be concluded that the
hypothesized structure of DM-002 is supported by the spectral data collected from the 1D and
2D NMR analysis. The structure of DM-002 can be seen below in figure 14.
Figure 14: Confirmed structure of sample DM-002

34
RT.58
Once the pure Rhodococcus sp. MTM3W5.2 RT.58 was obtained, a systematic
approach was taken to determine the molecular structure. Beginning with the HRMS, an exact
mass of a molecular formula of C52H78O13 was determined, from this formula a degree of
unsaturation is calculated to be 14. The spectrometric data is consolidated below in table 7.
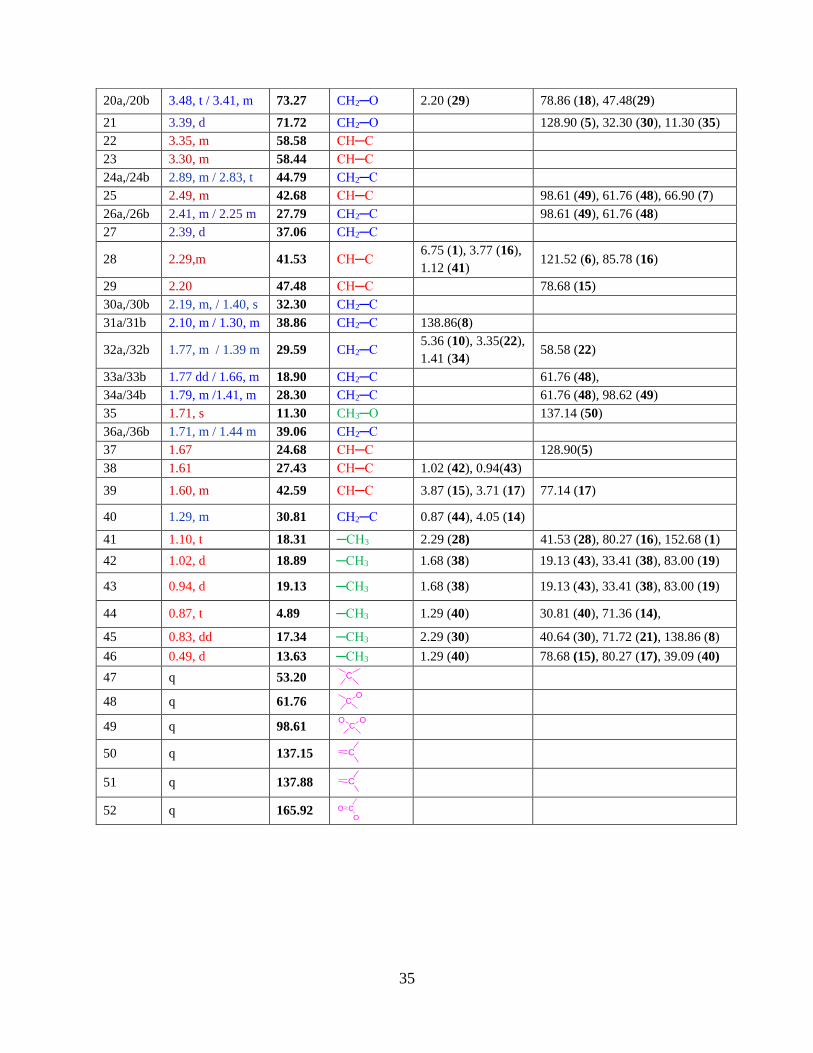
Table 7. NMR Spectroscopic Data for Sample RT.58 (600 MHz, Methanol-d4
Proton # H, mult (J in
Hz) C Carbon COSY (H↔H) HMBC(H→C)
1 6.74, dd 153.66 -
unsaturated
5.86 (6), 2.49 (25) 167.10 (52), 121.52 (6), 80.16,
18.31 (41) 37.06 (27)
2 6.34, dd 128.67 CH═C 5.98 (5), 5.36 (10) 137.14 (50), 128.90 (5), 29.59
(32)
3 6.06, t 133.35 CH═C 5.42 (8) 132.23 (4), 40.60 (30)
4 6.03, d 131,17 CH═C 5.39 (9)
5 6.00, d 128.90 CH═C 6.35 (2) 39.06 (37), 71.72 (21), 134.61
(10)
6 5.86, d 121.52 CH═C 6.72 (1) 167.10 (52) 37.06 (27), 18.31 (41)
7 5.57, dd 66.90 CH═C 1.77 (34) 165.93 (52), 61.76 (48), 43.78
(25)
8 5.47, dd 138.86 CH═C 6.05 (3), 2.29 (30) 132.38 (3), 131.17 (4)
9 5.39, dd 134.30 CH═C 6.051 (4) 131.17 (4)
10 5.35, td 134.61 CH═C 6.35 (2), 2.20 (32) 128. 36 (5), 70.48 (22), 46.19 (32)
11 5.24, dd 128.34 CH═C 2.29(28) 78.68 (15)
12 4.09, t 73.87 CH─O
13 4.08, dd 78.16 CH─O
14 4.05, d 71.36 CH─O 1.29 (40)
15 3.82, d 78.68 CH─O 137.88 (51), 128.34 (11), 80.28
(17)
16 3.79, d 85.78 CH─O 2.39 (27) 71.36 (14), 4.89 (44)
17 3.69, t 80.28 CH─O
18 3.58, t 78.86 CH─O 3.38 (20a)
19 3.55, m 83.00 CH─O 18.89 (42), 19.13 (43),
C
O
35
20a,/20b 3.48, t / 3.41, m 73.27 CH2─O 2.20 (29) 78.86 (18), 47.48(29)
21 3.39, d 71.72 CH2─O 128.90 (5), 32.30 (30), 11.30 (35)
22 3.35, m 58.58 CH─C
23 3.30, m 58.44 CH─C
24a,/24b 2.89, m / 2.83, t 44.79 CH2─C
25 2.49, m 42.68 CH─C 98.61 (49), 61.76 (48), 66.90 (7)
26a,/26b 2.41, m / 2.25 m 27.79 CH2─C 98.61 (49), 61.76 (48)
27 2.39, d 37.06 CH2─C
28 2.29,m 41.53 CH─C 6.75 (1), 3.77 (16),
1.12 (41) 121.52 (6), 85.78 (16)
29 2.20 47.48 CH─C 78.68 (15)
30a,/30b 2.19, m, / 1.40, s 32.30 CH2─C
31a/31b 2.10, m / 1.30, m 38.86 CH2─C 138.86(8)
32a,/32b 1.77, m / 1.39 m 29.59 CH2─C 5.36 (10), 3.35(22),
1.41 (34) 58.58 (22)
33a/33b 1.77 dd / 1.66, m 18.90 CH2─C 61.76 (48),
34a/34b 1.79, m /1.41, m 28.30 CH2─C 61.76 (48), 98.62 (49)
35 1.71, s 11.30 CH3─O 137.14 (50)
36a,/36b 1.71, m / 1.44 m 39.06 CH2─C
37 1.67 24.68 CH─C 128.90(5)
38 1.61 27.43 CH─C 1.02 (42), 0.94(43)
39 1.60, m 42.59 CH─C 3.87 (15), 3.71 (17) 77.14 (17)
40 1.29, m 30.81 CH2─C 0.87 (44), 4.05 (14)
41 1.10, t 18.31 ─CH3 2.29 (28) 41.53 (28), 80.27 (16), 152.68 (1)
42 1.02, d 18.89 ─CH3 1.68 (38) 19.13 (43), 33.41 (38), 83.00 (19)
43 0.94, d 19.13 ─CH3 1.68 (38) 19.13 (43), 33.41 (38), 83.00 (19)
44 0.87, t 4.89 ─CH3 1.29 (40) 30.81 (40), 71.36 (14),
45 0.83, dd 17.34 ─CH3 2.29 (30) 40.64 (30), 71.72 (21), 138.86 (8)
46 0.49, d 13.63 ─CH3 1.29 (40) 78.68 (15), 80.27 (17), 39.09 (40)
47 q 53.20
48 q 61.76
49 q 98.61
50 q 137.15
51 q 137.88
52 q 165.92
C
CO
COO
C
C
O C
O
36
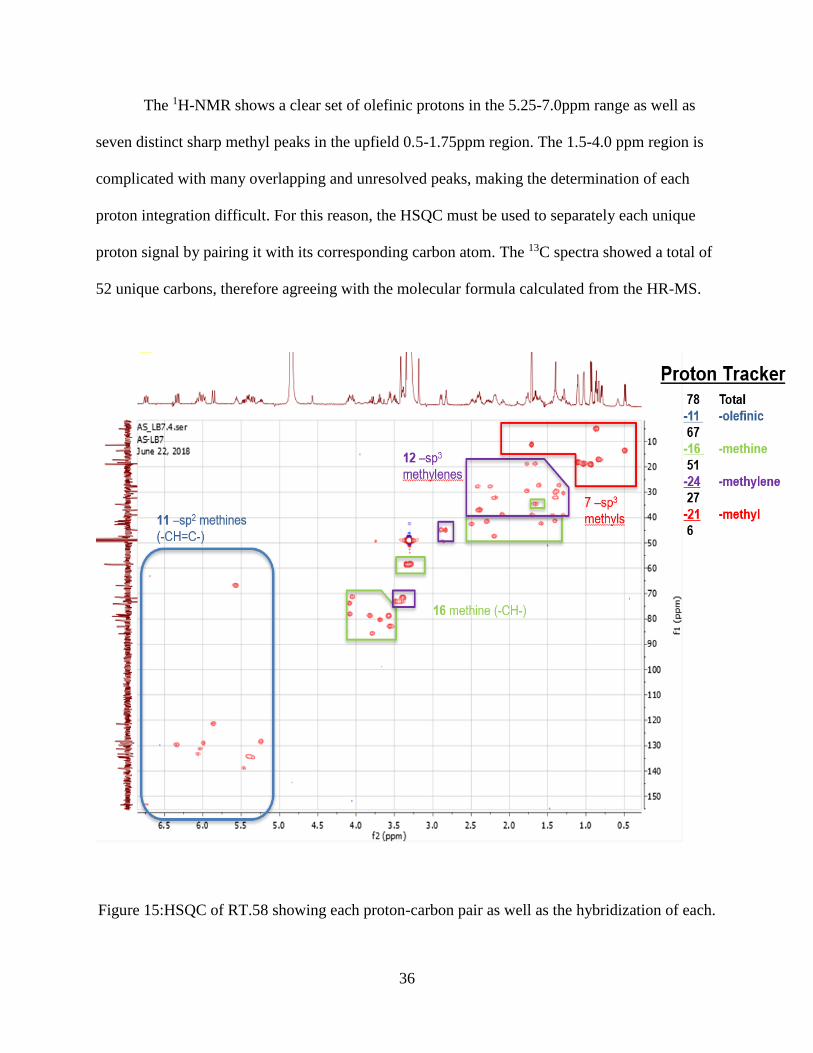
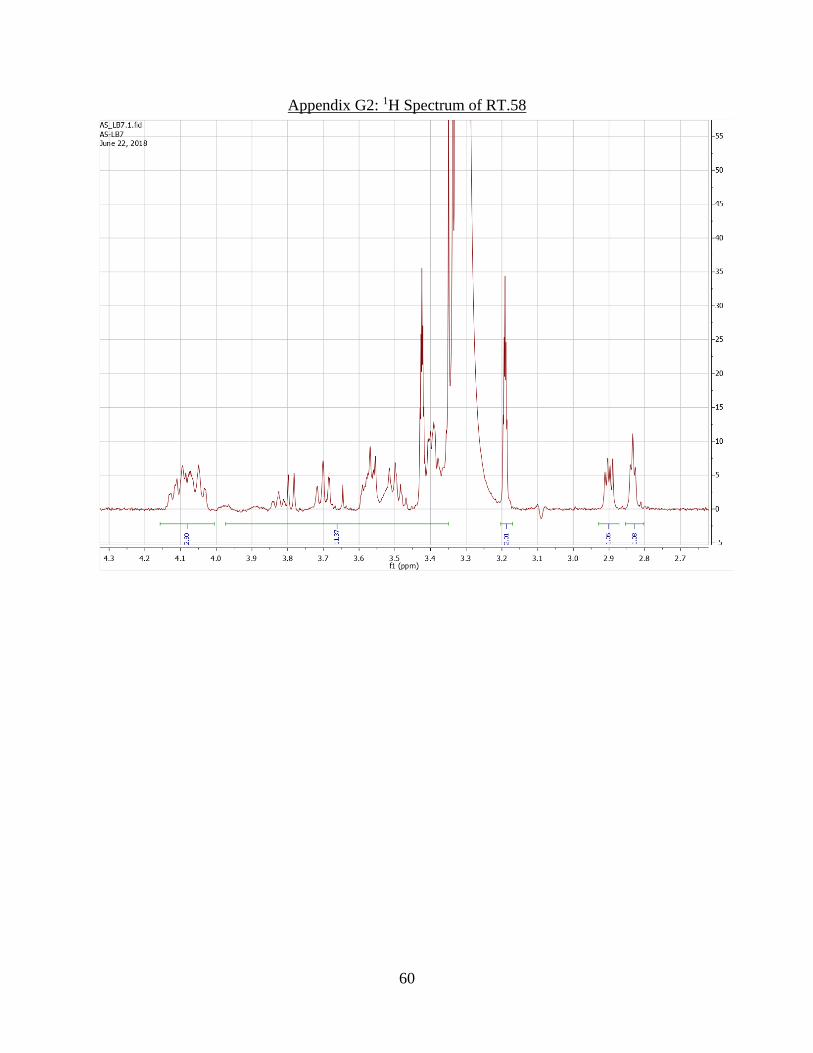
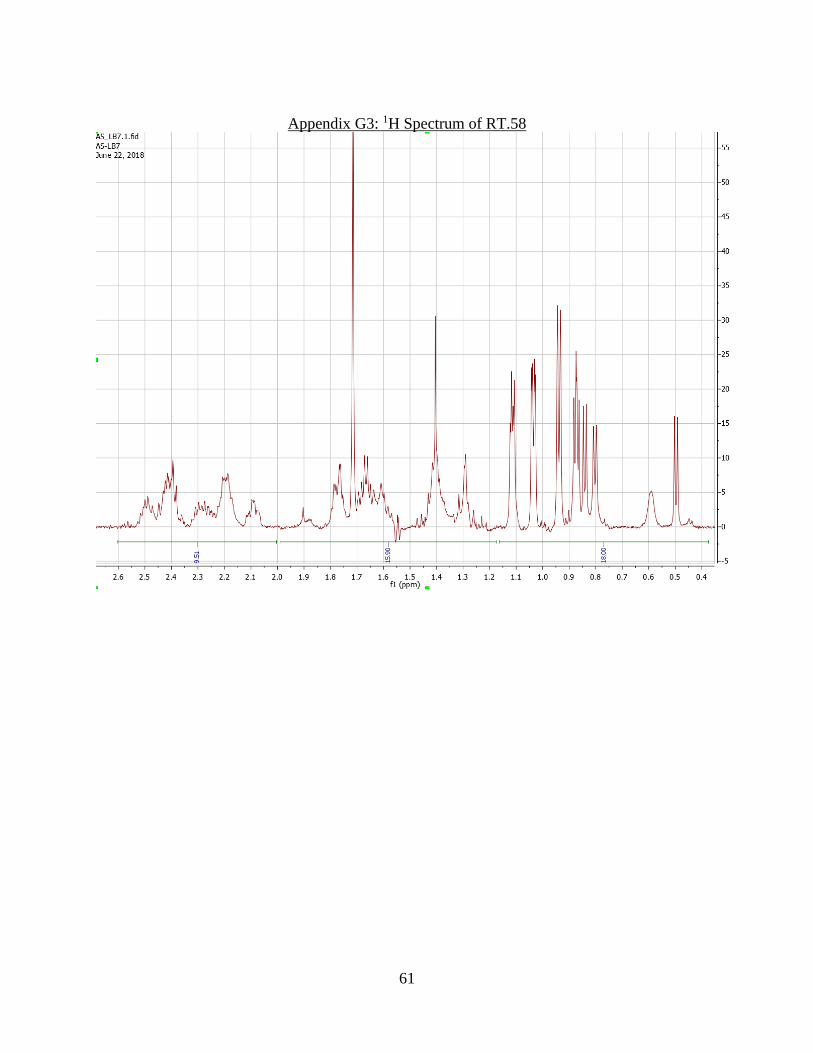
The 1H-NMR shows a clear set of olefinic protons in the 5.25-7.0ppm range as well as
seven distinct sharp methyl peaks in the upfield 0.5-1.75ppm region. The 1.5-4.0 ppm region is
complicated with many overlapping and unresolved peaks, making the determination of each
proton integration difficult. For this reason, the HSQC must be used to separately each unique
proton signal by pairing it with its corresponding carbon atom. The 13C spectra showed a total of
52 unique carbons, therefore agreeing with the molecular formula calculated from the HR-MS.
Figure 15:HSQC of RT.58 showing each proton-carbon pair as well as the hybridization of each.

37
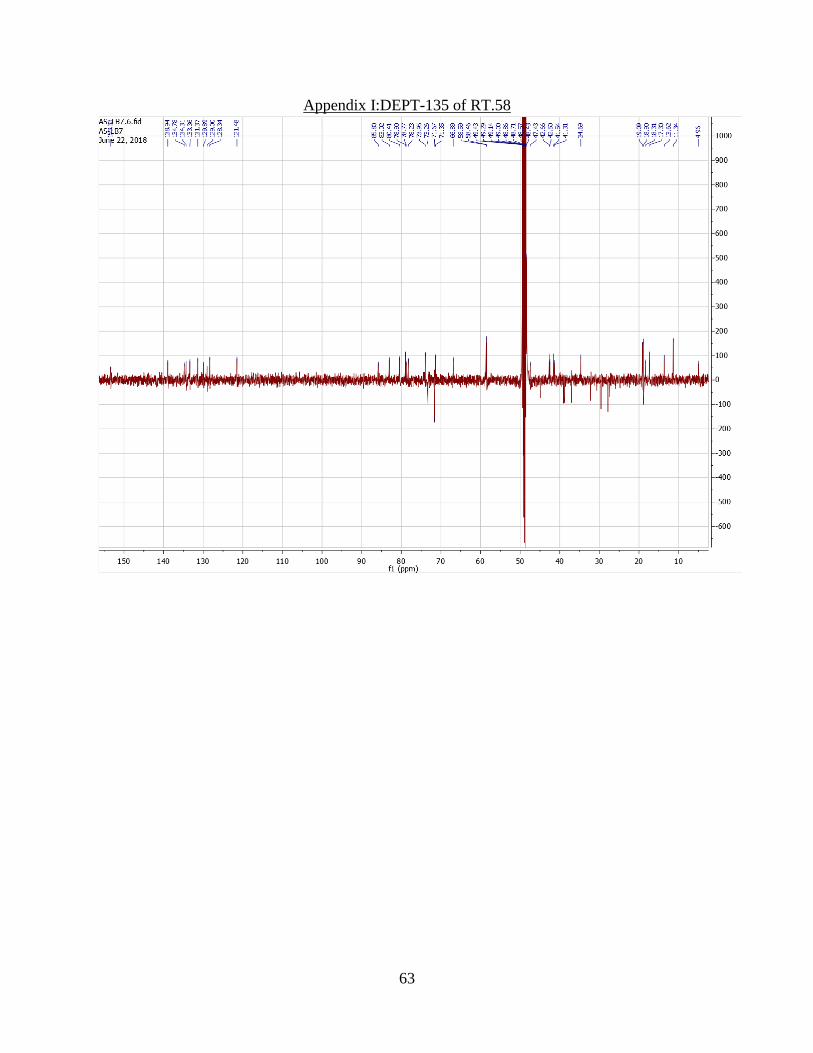
These observations are confirmed by the HSQC spectra. The HSQC identifies 16 unique
methine groups in the 1.25-4.20ppm region. The HSQC also gives rise to the presence of 12 sp3
methylenes in the 1.25-3.50ppm region, this is confirmed by the negative phasing of the DEPT-
135 y-axis.
A total of 72 protons can be observed in the 1H and HSQC spectra. The hybridization of
each proton-carbon pairing can be seen color coded in figure 15. This accounts for 11 sp2
methines, 16 sp3 methines, 24 sp3 methylene protons, and 21 sp3 methyl protons. The remaining
6 protons to be assumed as hydroxy protons within the structure, due to the exchangeability of
the hydroxyl proton in the MeOD solvent.
Strong correlation between the 1H, 1H-COSY and HMBC also suggest that proton H(1)
at 6.74 to be in the β-position of an α,β-unsaturated carbonyl, most likely in the form of an
ester as a lactone ring, commonly associated with polyketide species.39 Assuming a total of 13
oxygen atoms from the calculated chemical formula, removing the 6 hydroxyl oxygens as well as
the 2 oxygens contributing to the lactone ring ester from the total count leaves 5 remaining
oxygens to be accounted for, which can be assumed to be in the form of ether linkages.
The doublet of doublets H(1) 6.74 has a COSY correlation with proton H(6) 5.86 and
with proton H(25) at 2.49. H(1) further correlates with carbons C(52) at 167.10, C(6) at
121.52, C(41) at 18.31 and C(28) at 41.53. Due to these correlations in the HMBC of H(1) to
C(52) at 167.10 and that C(52) is a quaternary carbon with a chemical shift typical of a
carbonyl ester, it is believed that C(1) is the carbonyl carbon of the lactone ring.
The doublet of doublets of proton H(2) at 6.34 has COSY correlations with protons
(H5) and H(10) at 5.98 and 5.36, respectively. H(2) also correlates with quaternary carbon
C(50) at 137.15, C(5) at 128.90, and C(32) at 29.59 in the HMBC. The doublet proton H(5)

38
also correlates with carbons C(37) at 24.68, C(21) at 71.72 and C(10) at 134.61 in the
HMBC. H(10) further correlates with proton H(32) at 2.20 in the COSY. H(32) at 2.20 then
further correlates with protons H(22) at 3.35 and H(34b) at 1.41 in the COSY as well as with
carbon C(22) at 58.58 in the HMBC. Proton H(34b) further correlates in the HMBC with
quaternary carbons C(48) at 61.76 and C(49) at 98.62.
Triplet proton H(3) has a COSY correlation with proton H(8) at 138.86. H(8) at
138.86 then further COSY correlates with proton H(30) at 2.29. Proton H(3) also shows a
correlation with carbons C(4) at 132.23 and C(30) at 32.30 in the HMBC.
The doublet proton H(4) shows a COSY correlation with H(9) at 5.39, this correlation
is confirmed by the cross peak of H(9) with H(4) in the COSY as well as with the HMBC cross
peak of H(9) with carbon C(4) at 131.17. No further correlations are detected for proton H(4) or
H(9) in the COSY or HMBC.
The doublet of doublets H(7) at 5.57 shows a COSY correlation with proton H(34) at
1.77. H(7) then further correlates with quaternary carbon C(52) at 165.92, C(27) at 37.06 and
C(41) at 18.31.
Proton H(11) at 5.24 correlates in the COSY with H(28) at 2.29. H(11) then shows
further correlation with carbon C(15) at 78.68.
Protons H(12) at 4.09, H(13) at 4.08, and H(17) at 3.69 do not show any correlations
in the COSY or HMBC spectrums. Proton H(14) at 4.05 shows a COSY correlation with
proton H(40) at 1.29. H(40) then shows further COSY correlation with proton H(44) at 0.87.
This correlation is also reflected in the HMBC of proton H(44) with carbons C(40) at 30.81 and
C(14) at 71.36.
39
Proton H(15) at 3.82 shows no correlations in the COSY but does show HMBC
correlations with quaternary carbon C(51) at 137.88, C(11) at 128.34 and C(17) at 80.28.
Proton H(16) at 3.79 displays a COSY correlation with proton H(28) at 2.29. H(16)
then further correlates with carbons C(14) at 71.36, and methyl carbon C(44) at 4.89.
Proton H(18) at 3.58 shows a COSY correlation with diastereotopic proton H(20a) at
3.48.
Proton H(19) does not show any COSY correlations but does show HMBC correlations
with carbons C(42) at 18.89 and C(43) at 19.13.
Proton H(20) shows COSY cross peak with proton H(29) at 2.20 and further correlates
with carbons C(18) at 78.86 and C(29) at 47.48. Proton H(29) shows further HMBC
correlations with C(15) at 78.68 in the HMBC.
Proton H(21) at 3.39 does not show any COSY correlations but does display HMBC
correlations with carbons C(5) at 128.90, C(30) at 32.30 and C(35) at 11.30.
Protons H(22) at 3.35, H(23) at 2.30, H(24) at 2.89 and H(27) at 2.39 do not show
any correlations within the COSY or HMBC spectrums.
Protons H(25) at 2.49 and H(26a,b) at 2.41 and 2.25 do not show any COSY
correlations however both show HMBC correlations with quaternary carbons C(49) at 98.61 and
C(48) at 61.76, in addition to H(25) also showing HMBC correlation to carbon C(7) at 66.90.
Proton H(28) at 2.29, in addition to the COSY correlations to H(1) at 6.75 and H(16)
at 3.77 also shows COSY correlation to proton H(41). H(28) also displays HMBC correlations
to carbons C(6) at 121.52 and C(16) at 85.78.

40
Protons H(30a,b) at 2.19 and 1.40, respectively, H(36ab) at 1.71 and 1.44 do not
show any COSY or HMBC correlations
Protons H(33a,b) at 1.77 and 1.66 along with H(34a,b) at 1.79 and 1.41 do not show
any COSY correlations but do both show HMBC correlations with carbon C(48) at 61.76,
along with H(34ab) also showing HMBC cross peak with carbon C(49) at 98.61.
Proton H(38) at 1.61 shows COSY correlations to two sets of methyl protons, H(42) at
1.02 and H(43) at 0.94.
Protons H(41)-H(46) are all sp3 methyls, with H(41) showing COSY correlation to H(28)
at 2.29 and HMBC correlations to carbons C(28) at 41.53, C(16) at 80.27, and C(1) at
153.66. H(42) and H(43) show identical COSY and HMBC correlations with both COSY to
proton H(38) at 2.29 and HMBC to carbons C(38) at 33.41, C(43) at 19.13 and C(19) at
83.00. H(44) shows a COSY cross peak with proton H(40) at 1.29 and HMBC cross peaks with
carbons C(40) at 30.81 and C(14) at 71.36. H(45) displays a COSY with H(30) at 2.19 and
HMBC cross peaks with C(30) at 40.64, C(21) at 71.72 and C(8) at C(8) at 138.86. H(46)
displays a COSY cross peak with H(40) at 1.29 and HMBC cross peak with C(15) at 78.68,
C(17) at 80.28, and C(40) at 30.81.
The combination of each spin fragment into a spin system begins to piece together the
molecular structure of RT.58. A few possible structural fragments are displayed below in figure
16. Each color represents a spin system developed from each COSY correlation and each arrow
represents a long-range HMBC correlation.

41
Figure 16:Possible partial spin systems for RT.58
Although the HMBC gives insight into neighboring identities of each unique proton, it is
not sufficient to give complete evidence of a full structure. This is due to the very low sample
concentration of the NMR sample itself in MeOD, this concentration is limited due to the low
amount of purified RT.58 sample available. This limited sample quantity in combination with the
instability of large molecular weight natural products make elucidation of a complete structure
for RT.58 extremely difficult. It is theorized that the stability of larger molecular weight natural
products is extremely volatile in comparison to lower molecular weight natural products,
especially when taking into consideration the many trials of the purification process that must
take place to provide an adequately clean natural product species.40

42
Attempts were made to improve signal strength by increase the number of scans of the
HMBC analysis however, due in context to the inherently low sensitivity of the HMBC
experiment itself, no improvement were observed in the quality of long-range signals needed to
fully elucidate RT.58.
Another technique is to use a different NMR tube that is highly specific to both low
sample concentrations and solvent effects. A Shigemi tube was obtained and the sample was
reanalyzed on a 600 MHz spectrophotometer. The workings of a Shigemi tube can be seen below
in figure 17.
Figure 17 :Typical Shigemi tube apparatus
Shigemi tubes are specific for the type of instrument (e.g. Bruker, Varian) as well as for
the solvent that the sample will be dissolved in. The typical NMR tube requires approximately
0.5-0.75 mL total volume to assure proper sample height when inserted into the instrument.41

43
A shigemi tube provides a bottom length of the specific solvent in a pure layer on the bottom of
an outer tube, the sample is then dissolved and transferred into the tube. An inner tube,
sometimes referred to as a plunger, that has a top layer of pure solvent is then inserted into the
outer tube, forming a complete air tight seal with the middle layer of dissolved sample.42 This
provides a more concentrated sample at the proper coil height when placed into the instrument.
Unfortunately, when RT.58 was reanalyzed using a Shigemi tube, no improvements were
observed in the signal strength of the long range HMBC signals. This could be due in part to the
loss of sample during transitions between tubes as well as the instability effect of the natural
product itself.
CHAPTER 4
CONCLUSIONS AND FUTURE WORK
Conclusions
44
The identity of the synthesized natural product DM-002, a Pyrrolobenzodiazepine (PBD)
alkaloid was confirmed to be the desired structure through the use of 1D and 2D NMR
techniques. The integration of 1H NMR spectrum exactly matched the predicted number of
protons as calculated by the molecular formula, provided by HR-MS. Each proton was uniquely
identified using HSQC and each hybridization of carbon determined. The use of HMBC long
range correlations made possible the connections of each spin fragment by providing correlations
to quaternary carbon and heteroatoms. The complete structure of DM-002 is confirmed to be that
of which is depicted in figure 13.
In the case of RT.58, many partial spin systems were developed and confirmed through
the use of 2D NMR analysis. The main evidence of which being an alpha-beta unsaturated ester,
most likely of which in the form of a macro-lactone, common for various polyketide synthase
derivatives. It was determined that there were no aromatic protons or carbons in the structure.
Due to the complicated and overlapping of the 1H the use of HSQC was needed to uniquely
identify each proton, which successfully identified 72 unique protons. The combination of 13C
and HSQC data confirmed the presence of 52 carbon atoms, confirming the molecular formula
predicted from HR-MS to be correct. From this, it could be deduced that the remaining 6 protons
must come from a hydroxy (-OH) functional group on the basis that these are exchangeable in
the MeOD solvent and that no amine (-NHx) functional groups were identified in the mass
spectroscopy.
Through analysis of the HSQC the hybridization of each carbon atom was determined
and identified with the species containing; seven sp3 methyl groups (-CH3), eleven sp2 methines
(-CH=C-), sixteen sp3 methines (-CH-C-), and twelve sp3 methylenes (-CH2-C) eight of which
are diastereotopic.
45
The HMBC provided information needed for the connectivity of spin fragments through
the correlation of quaternary or heteroatoms, however, the long-range correlations that are
needed to connect every fragment were not obtained for two reasons: i.) limited purified sample
quantity led to an inadequate sample concentration in the NMR sample. ii.) the high molecular
weight of 911.5490 [M+H] + of the natural product leads to an unstable product thus affecting
the spectral signals and intensity overtime.
The use of a specialized Shigemi NMR tube in hopes to improve sample concentration
proved to be ineffective in providing higher signal strength in the HMBC spectrum. Increased
scans and longer analysis times also proved to be ineffective in providing an increase in the long-
range signals needed for complete elucidation.
Future Work
More work is needed in order to provide an adequate sample for complete structural
elucidation:
i.) Continued efforts around the extraction, isolation, and purification processes could
provide more purified RT.58 sample which in turn could increase sample
concentration of a future complete spectral analysis.
ii.) Complete 1D and 2D spectral analysis at an external facility at higher resolution (e.g. 700
or 800 MHz NMR spectrophotometer instrument) could yield higher resolution and
signal strength in the poorly sensitive HMBC experiment to provide longer range
couplings needed for elucidation.

46
iii.) Studies around the stability of the purified RT.58 could lead to advances in the storage
and handling of the final product in order to prolong the desired species to be used for
spectral analysis.
iv.) Studies focusing on the growth and isolation of RT.58 crystals could lead to the ability to
analyze via X-ray crystallography in order to provide an absolute configuration of the
species. If this effort is successful, a retrosynthetic pathway could then be analyzed
and proposed as a novel route to obtaining purified RT.58 sample. This could in turn
lead to an alternative means other than isolation and purification of a meniscal amount
of naturally available material.

47
REFERENCES
1. Bérdy, J. Thoughts and facts about antibiotics: where we are now and where we are
heading. J Antibiot. 2012. 65,385–395
2. Nicolaou, K. C., Snyder, Scott. Chasing Molecules That Were Never There: Misassigned
Natural Products and the Role of Chemical Synthesis in Modern Structure Elucidation.
Angewandte Chemie. 2005. 44, 1012-1044.
3. Annor-Gyamfi, J. K.; Jarrett, J. M.; Osazee, J. O.; Bialonska, D.; Whitted, C.; Palau, V.
E.; Shilabin, A. G. Synthesis and Biological Activity of Fused Tetracyclic Pyrrolo[2,1-C]
[1,4]Benzodiazepines. Heliyon. 2018, 4, 1-19.
4. Cipolla, L. Araújo, A.C. Airoldi, C. Bini, D. Pyrrolo[2,1-c][1,4]benzodiazepine as a
scaffold for the design and synthesis of anti-tumour drugs. Anticancer Agents Med Chem.
2009, 1, 1-31.
5. Ward, L. Amber. Identification of Genes Required to Synthesize an Antibiotic-like
Compound from the Soil Bacterium Rhodococcus sp. MTM3W5.2. M.S thesis, 2015.
6. Lambert, Joseph B and Eugene P Mazzola. Nuclear Magnetic Resonance Spectroscopy:
An Introduction to Princliples, Applications, and Experimental Methods: Upper Saddle
River: Pearson Education. 2004, 6-32.
7. Housecroft, Catherine E., and Alan G. Sharpe. Inorganic Chemistry. 3rd ed. Harlow:
Pearson Education, 2008, 15, 432-464.
8. Atta-ur-Rahman. Nuclear Magnetic Resonance. New York: Springer-Verlag, 1986, 4,
144-148.
9. Kwan, E.; Huang, S.G. Structural Elucidation with NMR Spectroscopy: Practical
Strategies for Organic Chemists. Eur. J. Org. Chem. 2008, 2671–2688.

48
10. Keeler, J. Understanding NMR Spectroscopy (2nd Ed.) Wiley, 2010, 4-5.
11. Data Acquisition and Processing:
https://ekwan.github.io/pdfs/nmr/lecture%205.pdf (accessed 11/17/2019)
12. Jacobsen, N. E. NMR Spectroscopy Explained: Simplified Theory, Applications and
Examples for Organic Chemistry and Structural Biology. John Wiley & Sons, Inc. 2007,
360-374.
13. Breitmaier, E. Structure Elucidation by NMR in Organic Chemistry: A Practical Guide.
3rd Revision edition. New York: John Wiley & Sons, Inc. 2002, 215-222.
14. DEPT:
http://science.widener.edu/svb/nmr/isobutanol/experiments.html (accessed 8/26/2019)
15. Claridge, T. High-Resolution NMR Techniques in Organic Chemistry (Third Edition).
Elsevier Science. 2016, 171-202.
16. Two Dimensional NMR Spectroscopy:
http://www.cryst.bbk.ac.uk/PPS2/projects/schirra/html/2dnmr.htm (accessed 8/27/2019)
17. J. B. Lambert, E. P. Mazzola. Nuclear Magnetic Resonance Spectroscopy: An
Introduction to Principles, Applications, and Experimental Methods, Inc. Pearson
Education Upper Saddle River, New Jersey, 2004, 68-72.
18. Nakanishi, Koji, ed.. One-dimensional and two-dimensional NMR Spectra by Modern
Pulse Techniques. Mill Valley, California: University Science Books. 1990, 138-140.
19. Keeler, James. .Understanding NMR Spectroscopy (2nd ed.). Wiley. 2010. 209-215.
20. Riegel, S. D.; Leskowitz, G. M. Benchtop NMR spectrometers in academic teaching.
TrAC, 2016, 83, 27-38.

49
21. W. E. Hull. Two Dimensional NMR Spectroscopy: Applications for Chemists and
Biochemists. 2nd ed. VCH, New York, 1994, 302.
22. Columbia University-HSQC
http://www.columbia.edu/cu/chemistry/groups/nmr/hsqc.html (accessed 8/27/209)
23. Edison, Arthur; Schroeder, Frank C.; NMR – Small Molecules and Analysis of Complex
Mixtures. Comprehensive Natural Products II. Acc. Chem. Res. 2010, 2, 169-196.
24. Reynolds, W.F.; Natural Product Structure Elucidation by NMR Spectroscopy.
Pharmacognosy. 2017, 29, 567-596.
25. Atta-ur-Rahman, Muhammad Iqbal Choudhar. Importany 2D-NMR Experiments:
Solving Problems with NMR Spectroscopy. 1996, 213-343.
26. D. Neuhaus; M. P. Williamson, The Nuclear Overhauser Effect in Structural and
Conformational Analysis, 2nd ed. Wiley:New York, 2000, 35-45.
27. T. D. Claridge; I. Perez-Victoria, Org. Biomol. Chem. 2003, 1, 3632–3634.
28. Singh, S. B. Jayasuriya, H.. Ondeyka, J. G Herath, K. B. Zhang, C. Zink, D. L.. Tsou, N.
N R. Ball, G. Basilio, A.O. Geneneral Structural Elucidation with NMR Spectroscopy. J.
Am. Chem. Soc. 2006, 128, 11916–11920.
29. Li, S.H. Wang, J. Niu, X.M. Y.H. Shen, H.J. Zhang, H.D. Sun, M.L. Li, Q.E Tian, Y. Lu,
P. Cao, Q.T. Spectroscopic Properties of Inorganic and Organometallic Compounds
Zheng, Org. Lett. 2004, 6, 4327–4330.
30. C.-S. Li, Y.-T. Di, H.-P. He, S. Gao, Y.-H. Wang, Y. Lu, J.-L. Zhong, X.-J. Hao, Org.
Lett. 2007, 9, 2509–2512.
31. Jayasuriya, H. Guan, Z. Polishook, J. D. Dombrowski, A. W. Felock, P. J. Hazuda, D. J.
Singh, S. B. J. Nat. Prod. 2003, 66, 551–553.

50
32. D’Acquarica, I. Nevola, L. Monache, G. D. Gács-Baitz, E. Massera, C. Ugozzoli, F.G.
Zappia, B. Botta, Eur. J. Org. Chem. 2006, 3652–3660.
33. Lambert, J. B. Mazzola E. P. Nuclear Magnetic Resonance Spectroscopy: An
Introduction to Principles, Applications, and Experimental Methods, Inc. Pearson
Education Upper Saddle River, New Jersey, 2004, 363-364.
34. M. Badertscher, K. Bischofberger, M. E. Munk, E. Pretsch, A novel formalism to
characterize the degree of unsaturation of organic molecules. J. Chem. Inf. Comput. Sci.
2001, 41, 889–893.
35. Claridge T. D. W. High-Resolution NMR Techniques in Organic Chemistry.
Tetrahedron. 1999, 19, 117–118.
36. Bendall, M. R. Dodrell, D. M. Pegg, D. T. Polarization transfer pulse sequences for two-
dimensional NMR by heisenberg vector analysis. J. Am. Chem. Soc. 1981, 103, 4603–
4605.
37. Stott, K. Keeler, J. Van, Q. N. Shaka, A. J. One-Dimensional NOE Experiments Using
Pulsed Field Gradients. J. Magn. Reson. 1997, 125, 302–304.
38. Bax, A. Summers, M. F. 1H and 13C Assignments from Sensitivity-Enhanced Detection
of Heteronuclear Multiple-Bond Connectivity by 2D Multiple Quantum NMR. J. Am.
Chem. Soc. 1986, 108, 2093–2094.
39. Shen, Ben. Polyketide biosynthesis beyond the type I, II and III polyketide synthase
paradigms. Chemical Biology. 2003, 7, 285–295.
40. Staunton, J. Weissman, K. J. Polyketide biosynthesis: a millennium review. Nat Prod
Rep. 2001, 18, 380-416.
41. Iowa State Univeristy-NMR sample preparation

51
https://www.cif.iastate.edu/nmr/nmr-tutorials/sample-preparation (accessed 9/1/2019)
42. University of Buffalo-NMR sample preparation
http://www.nmr2.buffalo.edu/nesg.wiki/NMR_Sample_Preparation (accessed 9/1/2019)

52
APPENDICES
Appendix A: 1H spectra of DM-002

53
Appendix B: 13C Spectra of DM-002

54
Appendix C: DEPT-135 of DM-002

55
Appendix D1: COSY of DM-002

56
Appendix D2: COSY of DM-002

57
Appendix E: HSQC of DM-002

58
Appendix F: HMBC of DM-002

59
Appendix G1: 1H Spectrum of RT.58
60
Appendix G2: 1H Spectrum of RT.58
61
Appendix G3: 1H Spectrum of RT.58

62
Appendix H:13C Spectrum of RT.58
63
Appendix I:DEPT-135 of RT.58

64
Appendix J:COSY of RT.58

65
Appendix K: HSQC of RT.58

66
Appendix L: HMBC of RT.58

67
Appendix M: 1H Spectrum of RT.58 Shigemi
68
Appendix N: 13C Spectrum of RT.58 Shigemi

69
Appendix O: COSY of RT.58 Shigemi

70
Appendix P: HSQC of RT.58 Shigemi

71
Appendix Q: HMBC of RT.58 Shigemi

72
VITA
GARRETT ADAM JOHNSON
Education:
Professional Experience
Presentations
M.S. Chemistry, East Tennessee State University,
Johnson City, Tennessee, 2019
B.S. Chemistry, Concord University
Athens, West Virginia, 2014
Laboratory Technician, Corporate Innovation
Eastman Chemical Company, Kinsport, TN, 2014-Present
Research Assistant, Department of Chemistry
Concord University, Athens, WV, 2012-2014
Garrett Johnson, Pushpa R. Manikindi, Bert C. Lampson
Abbas G. Shilabin “Partial Structure Assignment of a
Polyketide Isolated from Rhodococcus Bacterium using
2D-NMR Techniques” 2019 PSNA Annual Conference,
ETSU, Johnson City, TN, July 21, 2019
Garrett Johnson, Mohrah Alenazi, Patrick David South, Bert C.
Lampson, Abbas G. Shilabin “Structure Elucidation of a
Polyketide Isolated from Rhodococcus MTM3W5.2 via 2-
D NMR and High-resolution Mass Spectroscopy” South
East Regional Meeting of the American Chemical Society,
Charlotte, NC, November 15, 2017
Related Documents