Structural phase analysis, band gap tuning and fluorescence properties of Co doped TiO 2 nanoparticles Alamgir a,b , Wasi Khan b,⇑ , Shabbir Ahmad a , M. Mehedi Hassan b , A.H. Naqvi b a Department of Physics, Aligarh Muslim University, Aligarh 202002, India b Centre of Excellence in Materials Science (Nanomaterials), Department of Applied Physics, Z.H. College of Engineering & Technology, Aligarh Muslim University, Aligarh 202002, India article info Article history: Received 6 July 2014 Received in revised form 20 October 2014 Accepted 23 October 2014 Available online 15 November 2014 Keywords: Co doped TiO 2 nanoparticles XRD & Raman spectroscopy TEM Band gap Fluorescence properties abstract This paper reports on structural and optical properties of Co (0, 3, 5 & 7 mol%) doped TiO 2 (titania) nano- particles (NPs) synthesized by employing acid modified sol–gel method. The crystalline phase of the pure and doped NPs was observed with X-ray diffraction (XRD) followed by Raman scattering technique. Field emission scanning electron microscope and transmission electron microscopy give the morphological details. Fourier transform infrared spectra indicate the bonding interactions of Co ions with the titania lattice framework. Optical studies were attained with UV–visible absorption and fluorescence emission spectroscopy. XRD analysis reveals that all prepared samples have pure anatase phase with tetragonal symmetry devoid of any other secondary phase. The average crystallite size of all samples was calculated using Scherrer’s formula and was found to vary from 8 to 10 nm with doping concentration of Co. The Raman spectroscopy further confirmed the formation of TiO 2 in anatase structure in both pure and Co doped TiO 2 NPs. The most intense Raman active E g peak of TiO 2 NPs shifted to higher energy on doping. Both UV–visible and fluorescence spectra show a blue shift in their absorption and band edge emission subsequently on increasing with Co percentage in titania host matrix, wherever there is an indication of quantum confinement effect with widening of band gap on decreasing in NPs size. There is also a possi- bility of strong Coulomb interaction effect on the optical processes involving the Co ions. However, the intensities of different emission spectra are not the same but decrease profoundly for doping samples due to concentration quenching effect. Ó 2014 Elsevier B.V. All rights reserved. 1. Introduction Scientific investigations on nanoparticles, nanocrystals, nano- layer thin films, quantum dots and quantum well, atomic and molecular clusters have grown dramatically over the past decade. A general approach in these fields is to study the optical properties of a given substance as a function of structure, size and dimension- ality. When the characteristic size of the particles is comparable or smaller than its bulk Bohr exciton diameter, their optical proper- ties become strongly dependent on size due to the quantum con- finement of electrons and holes [1–5]. Recently, scholarly efforts seem to develop metal oxide semiconductor nanoparticles, which attracts a great deal of attention in terms of their potential applica- tions in solar energy conversion and energy storage devices. Among these semiconductors, titanium dioxide is a wide band gap semiconductor and is believed to be one of the most promising known material for its high refractive index leading to a high hiding power, whiteness, resistance to photo corrosion, high dielectric constant, useful photo catalytic properties, chemical sta- bility, low cost and non-toxicity [6–11]. These properties make this material a candidate for a large number of prime applications in many fields of chemical engineering and materials engineering including traditional catalysis or photo-catalysis, dye-sensitized solar cells, lithium insertion-based devices, integrated circuits, gas sensors, sunscreens, and in the paint industry [12]. More recently, Co doped TiO 2 generates a wide interest as diluted mag- netic semiconductor (DMS) because of its ferromagnetic behaviour above room temperature for low Co doping concentration and it exhibits the Curie temperature, T C 650 K [13–15]. This feature makes it a promising candidate for fabricating various magneto- optical and spintronic devices. The optical response as well as the room temperature ferromag- netism in Co doped anatase titania are affected by defect states and oxygen vacancies in the crystal lattice [16,17]. The analysis of luminescence spectrum is a cheap and effective way to study the electronic structure, optical and photochemical properties of semiconductor materials, through which the information such as http://dx.doi.org/10.1016/j.optmat.2014.10.054 0925-3467/Ó 2014 Elsevier B.V. All rights reserved. ⇑ Corresponding author. Tel./fax: +91 571 2700042. E-mail address: [email protected] (W. Khan). Optical Materials 38 (2014) 278–285 Contents lists available at ScienceDirect Optical Materials journal homepage: www.elsevier.com/locate/optmat

Welcome message from author
This document is posted to help you gain knowledge. Please leave a comment to let me know what you think about it! Share it to your friends and learn new things together.
Transcript
Optical Materials 38 (2014) 278–285
Contents lists available at ScienceDirect
Optical Materials
journal homepage: www.elsevier .com/locate /optmat
Structural phase analysis, band gap tuning and fluorescence propertiesof Co doped TiO2 nanoparticles
http://dx.doi.org/10.1016/j.optmat.2014.10.0540925-3467/� 2014 Elsevier B.V. All rights reserved.
⇑ Corresponding author. Tel./fax: +91 571 2700042.E-mail address: [email protected] (W. Khan).
Alamgir a,b, Wasi Khan b,⇑, Shabbir Ahmad a, M. Mehedi Hassan b, A.H. Naqvi b
a Department of Physics, Aligarh Muslim University, Aligarh 202002, Indiab Centre of Excellence in Materials Science (Nanomaterials), Department of Applied Physics, Z.H. College of Engineering & Technology, Aligarh Muslim University, Aligarh 202002, India
a r t i c l e i n f o a b s t r a c t
Article history:Received 6 July 2014Received in revised form 20 October 2014Accepted 23 October 2014Available online 15 November 2014
Keywords:Co doped TiO2 nanoparticlesXRD & Raman spectroscopyTEMBand gapFluorescence properties
This paper reports on structural and optical properties of Co (0, 3, 5 & 7 mol%) doped TiO2 (titania) nano-particles (NPs) synthesized by employing acid modified sol–gel method. The crystalline phase of the pureand doped NPs was observed with X-ray diffraction (XRD) followed by Raman scattering technique. Fieldemission scanning electron microscope and transmission electron microscopy give the morphologicaldetails. Fourier transform infrared spectra indicate the bonding interactions of Co ions with the titanialattice framework. Optical studies were attained with UV–visible absorption and fluorescence emissionspectroscopy. XRD analysis reveals that all prepared samples have pure anatase phase with tetragonalsymmetry devoid of any other secondary phase. The average crystallite size of all samples was calculatedusing Scherrer’s formula and was found to vary from 8 to 10 nm with doping concentration of Co. TheRaman spectroscopy further confirmed the formation of TiO2 in anatase structure in both pure and Codoped TiO2 NPs. The most intense Raman active Eg peak of TiO2 NPs shifted to higher energy on doping.Both UV–visible and fluorescence spectra show a blue shift in their absorption and band edge emissionsubsequently on increasing with Co percentage in titania host matrix, wherever there is an indication ofquantum confinement effect with widening of band gap on decreasing in NPs size. There is also a possi-bility of strong Coulomb interaction effect on the optical processes involving the Co ions. However, theintensities of different emission spectra are not the same but decrease profoundly for doping samplesdue to concentration quenching effect.
� 2014 Elsevier B.V. All rights reserved.
1. Introduction
Scientific investigations on nanoparticles, nanocrystals, nano-layer thin films, quantum dots and quantum well, atomic andmolecular clusters have grown dramatically over the past decade.A general approach in these fields is to study the optical propertiesof a given substance as a function of structure, size and dimension-ality. When the characteristic size of the particles is comparable orsmaller than its bulk Bohr exciton diameter, their optical proper-ties become strongly dependent on size due to the quantum con-finement of electrons and holes [1–5]. Recently, scholarly effortsseem to develop metal oxide semiconductor nanoparticles, whichattracts a great deal of attention in terms of their potential applica-tions in solar energy conversion and energy storage devices.Among these semiconductors, titanium dioxide is a wide bandgap semiconductor and is believed to be one of the most promisingknown material for its high refractive index leading to a high
hiding power, whiteness, resistance to photo corrosion, highdielectric constant, useful photo catalytic properties, chemical sta-bility, low cost and non-toxicity [6–11]. These properties make thismaterial a candidate for a large number of prime applications inmany fields of chemical engineering and materials engineeringincluding traditional catalysis or photo-catalysis, dye-sensitizedsolar cells, lithium insertion-based devices, integrated circuits,gas sensors, sunscreens, and in the paint industry [12]. Morerecently, Co doped TiO2 generates a wide interest as diluted mag-netic semiconductor (DMS) because of its ferromagnetic behaviourabove room temperature for low Co doping concentration and itexhibits the Curie temperature, TC � 650 K [13–15]. This featuremakes it a promising candidate for fabricating various magneto-optical and spintronic devices.
The optical response as well as the room temperature ferromag-netism in Co doped anatase titania are affected by defect states andoxygen vacancies in the crystal lattice [16,17]. The analysis ofluminescence spectrum is a cheap and effective way to study theelectronic structure, optical and photochemical properties ofsemiconductor materials, through which the information such as
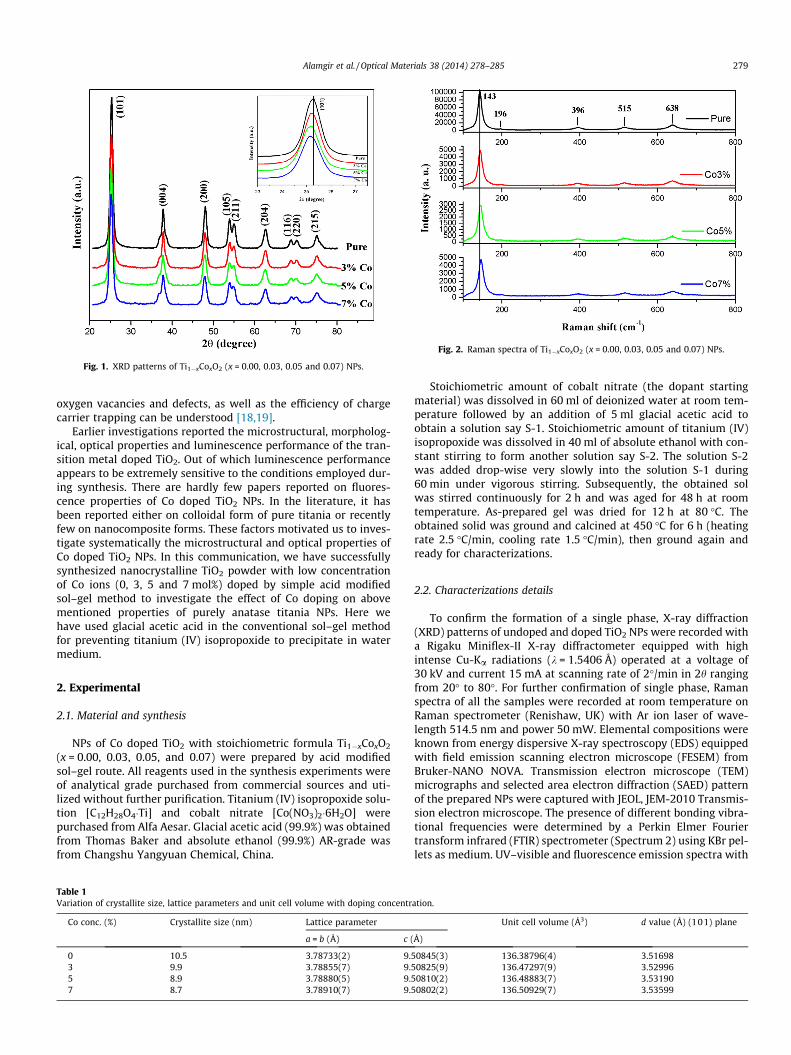
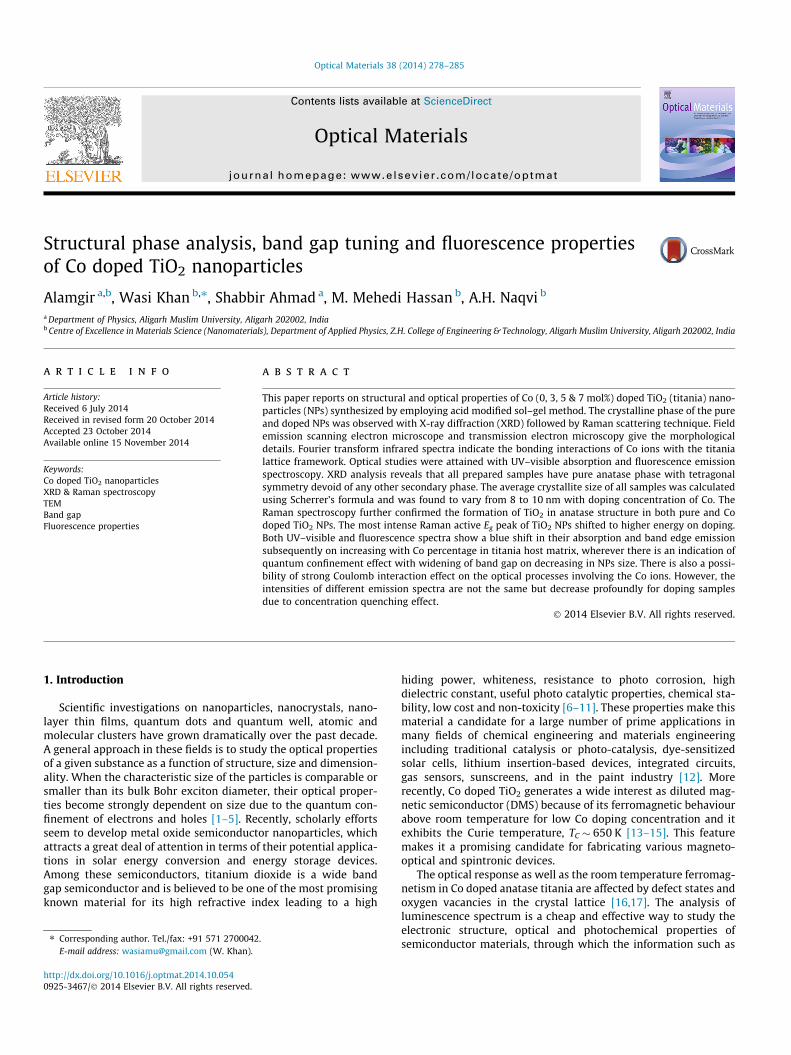
Fig. 1. XRD patterns of Ti1�xCoxO2 (x = 0.00, 0.03, 0.05 and 0.07) NPs.
Fig. 2. Raman spectra of Ti1�xCoxO2 (x = 0.00, 0.03, 0.05 and 0.07) NPs.
Alamgir et al. / Optical Materials 38 (2014) 278–285 279
oxygen vacancies and defects, as well as the efficiency of chargecarrier trapping can be understood [18,19].
Earlier investigations reported the microstructural, morpholog-ical, optical properties and luminescence performance of the tran-sition metal doped TiO2. Out of which luminescence performanceappears to be extremely sensitive to the conditions employed dur-ing synthesis. There are hardly few papers reported on fluores-cence properties of Co doped TiO2 NPs. In the literature, it hasbeen reported either on colloidal form of pure titania or recentlyfew on nanocomposite forms. These factors motivated us to inves-tigate systematically the microstructural and optical properties ofCo doped TiO2 NPs. In this communication, we have successfullysynthesized nanocrystalline TiO2 powder with low concentrationof Co ions (0, 3, 5 and 7 mol%) doped by simple acid modifiedsol–gel method to investigate the effect of Co doping on abovementioned properties of purely anatase titania NPs. Here wehave used glacial acetic acid in the conventional sol–gel methodfor preventing titanium (IV) isopropoxide to precipitate in watermedium.
2. Experimental
2.1. Material and synthesis
NPs of Co doped TiO2 with stoichiometric formula Ti1�xCoxO2
(x = 0.00, 0.03, 0.05, and 0.07) were prepared by acid modifiedsol–gel route. All reagents used in the synthesis experiments wereof analytical grade purchased from commercial sources and uti-lized without further purification. Titanium (IV) isopropoxide solu-tion [C12H28O4�Ti] and cobalt nitrate [Co(NO3)2�6H2O] werepurchased from Alfa Aesar. Glacial acetic acid (99.9%) was obtainedfrom Thomas Baker and absolute ethanol (99.9%) AR-grade wasfrom Changshu Yangyuan Chemical, China.
Table 1Variation of crystallite size, lattice parameters and unit cell volume with doping concentr
Co conc. (%) Crystallite size (nm) Lattice parameter
a = b (Å) c (
0 10.5 3.78733(2) 9.53 9.9 3.78855(7) 9.55 8.9 3.78880(5) 9.57 8.7 3.78910(7) 9.5
Stoichiometric amount of cobalt nitrate (the dopant startingmaterial) was dissolved in 60 ml of deionized water at room tem-perature followed by an addition of 5 ml glacial acetic acid toobtain a solution say S-1. Stoichiometric amount of titanium (IV)isopropoxide was dissolved in 40 ml of absolute ethanol with con-stant stirring to form another solution say S-2. The solution S-2was added drop-wise very slowly into the solution S-1 during60 min under vigorous stirring. Subsequently, the obtained solwas stirred continuously for 2 h and was aged for 48 h at roomtemperature. As-prepared gel was dried for 12 h at 80 �C. Theobtained solid was ground and calcined at 450 �C for 6 h (heatingrate 2.5 �C/min, cooling rate 1.5 �C/min), then ground again andready for characterizations.
2.2. Characterizations details
To confirm the formation of a single phase, X-ray diffraction(XRD) patterns of undoped and doped TiO2 NPs were recorded witha Rigaku Miniflex-II X-ray diffractometer equipped with highintense Cu-Ka radiations (k = 1.5406 Å) operated at a voltage of30 kV and current 15 mA at scanning rate of 2�/min in 2h rangingfrom 20� to 80�. For further confirmation of single phase, Ramanspectra of all the samples were recorded at room temperature onRaman spectrometer (Renishaw, UK) with Ar ion laser of wave-length 514.5 nm and power 50 mW. Elemental compositions wereknown from energy dispersive X-ray spectroscopy (EDS) equippedwith field emission scanning electron microscope (FESEM) fromBruker-NANO NOVA. Transmission electron microscope (TEM)micrographs and selected area electron diffraction (SAED) patternof the prepared NPs were captured with JEOL, JEM-2010 Transmis-sion electron microscope. The presence of different bonding vibra-tional frequencies were determined by a Perkin Elmer Fouriertransform infrared (FTIR) spectrometer (Spectrum 2) using KBr pel-lets as medium. UV–visible and fluorescence emission spectra with
ation.
Unit cell volume (Å3) d value (Å) (101) plane
Å)
0845(3) 136.38796(4) 3.516980825(9) 136.47297(9) 3.529960810(2) 136.48883(7) 3.531900802(2) 136.50929(7) 3.53599
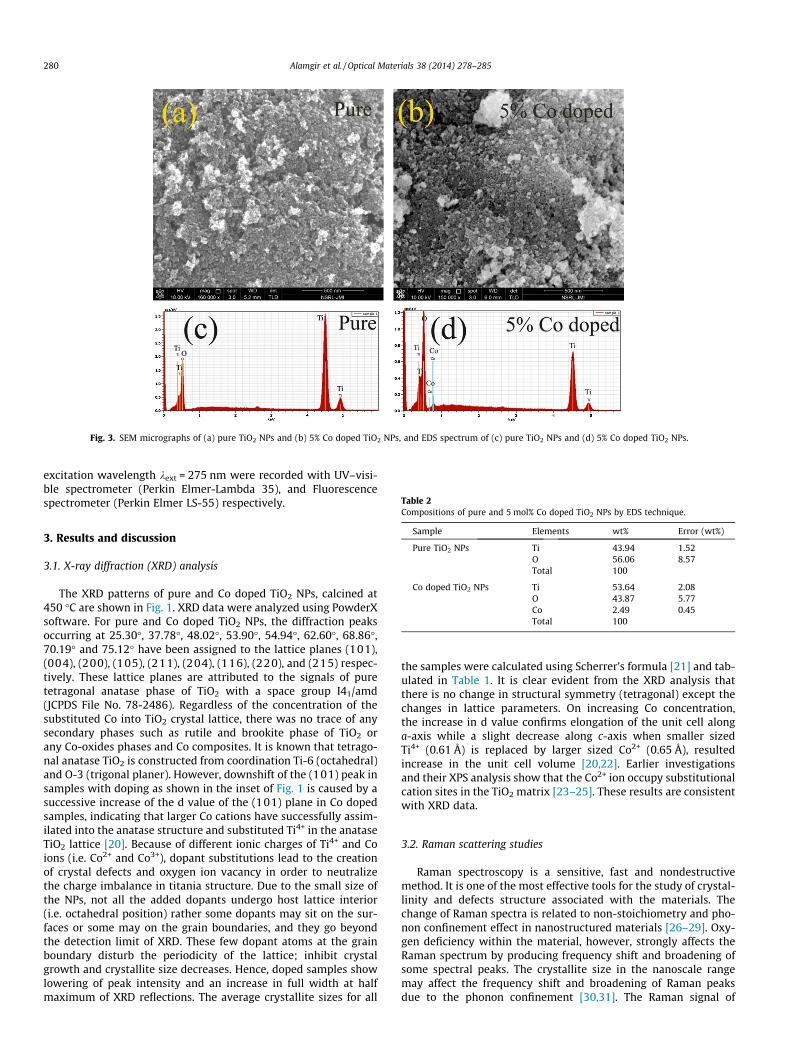
Fig. 3. SEM micrographs of (a) pure TiO2 NPs and (b) 5% Co doped TiO2 NPs, and EDS spectrum of (c) pure TiO2 NPs and (d) 5% Co doped TiO2 NPs.
Table 2
280 Alamgir et al. / Optical Materials 38 (2014) 278–285
excitation wavelength kext = 275 nm were recorded with UV–visi-ble spectrometer (Perkin Elmer-Lambda 35), and Fluorescencespectrometer (Perkin Elmer LS-55) respectively.
Compositions of pure and 5 mol% Co doped TiO2 NPs by EDS technique.
Sample Elements wt% Error (wt%)
Pure TiO2 NPs Ti 43.94 1.52O 56.06 8.57Total 100
Co doped TiO2 NPs Ti 53.64 2.08O 43.87 5.77Co 2.49 0.45Total 100
3. Results and discussion
3.1. X-ray diffraction (XRD) analysis
The XRD patterns of pure and Co doped TiO2 NPs, calcined at450 �C are shown in Fig. 1. XRD data were analyzed using PowderXsoftware. For pure and Co doped TiO2 NPs, the diffraction peaksoccurring at 25.30�, 37.78�, 48.02�, 53.90�, 54.94�, 62.60�, 68.86�,70.19� and 75.12� have been assigned to the lattice planes (101),(004), (200), (105), (211), (204), (116), (220), and (215) respec-tively. These lattice planes are attributed to the signals of puretetragonal anatase phase of TiO2 with a space group I41/amd(JCPDS File No. 78-2486). Regardless of the concentration of thesubstituted Co into TiO2 crystal lattice, there was no trace of anysecondary phases such as rutile and brookite phase of TiO2 orany Co-oxides phases and Co composites. It is known that tetrago-nal anatase TiO2 is constructed from coordination Ti-6 (octahedral)and O-3 (trigonal planer). However, downshift of the (101) peak insamples with doping as shown in the inset of Fig. 1 is caused by asuccessive increase of the d value of the (101) plane in Co dopedsamples, indicating that larger Co cations have successfully assim-ilated into the anatase structure and substituted Ti4+ in the anataseTiO2 lattice [20]. Because of different ionic charges of Ti4+ and Coions (i.e. Co2+ and Co3+), dopant substitutions lead to the creationof crystal defects and oxygen ion vacancy in order to neutralizethe charge imbalance in titania structure. Due to the small size ofthe NPs, not all the added dopants undergo host lattice interior(i.e. octahedral position) rather some dopants may sit on the sur-faces or some may on the grain boundaries, and they go beyondthe detection limit of XRD. These few dopant atoms at the grainboundary disturb the periodicity of the lattice; inhibit crystalgrowth and crystallite size decreases. Hence, doped samples showlowering of peak intensity and an increase in full width at halfmaximum of XRD reflections. The average crystallite sizes for all
the samples were calculated using Scherrer’s formula [21] and tab-ulated in Table 1. It is clear evident from the XRD analysis thatthere is no change in structural symmetry (tetragonal) except thechanges in lattice parameters. On increasing Co concentration,the increase in d value confirms elongation of the unit cell alonga-axis while a slight decrease along c-axis when smaller sizedTi4+ (0.61 Å) is replaced by larger sized Co2+ (0.65 Å), resultedincrease in the unit cell volume [20,22]. Earlier investigationsand their XPS analysis show that the Co2+ ion occupy substitutionalcation sites in the TiO2 matrix [23–25]. These results are consistentwith XRD data.
3.2. Raman scattering studies
Raman spectroscopy is a sensitive, fast and nondestructivemethod. It is one of the most effective tools for the study of crystal-linity and defects structure associated with the materials. Thechange of Raman spectra is related to non-stoichiometry and pho-non confinement effect in nanostructured materials [26–29]. Oxy-gen deficiency within the material, however, strongly affects theRaman spectrum by producing frequency shift and broadening ofsome spectral peaks. The crystallite size in the nanoscale rangemay affect the frequency shift and broadening of Raman peaksdue to the phonon confinement [30,31]. The Raman signal of
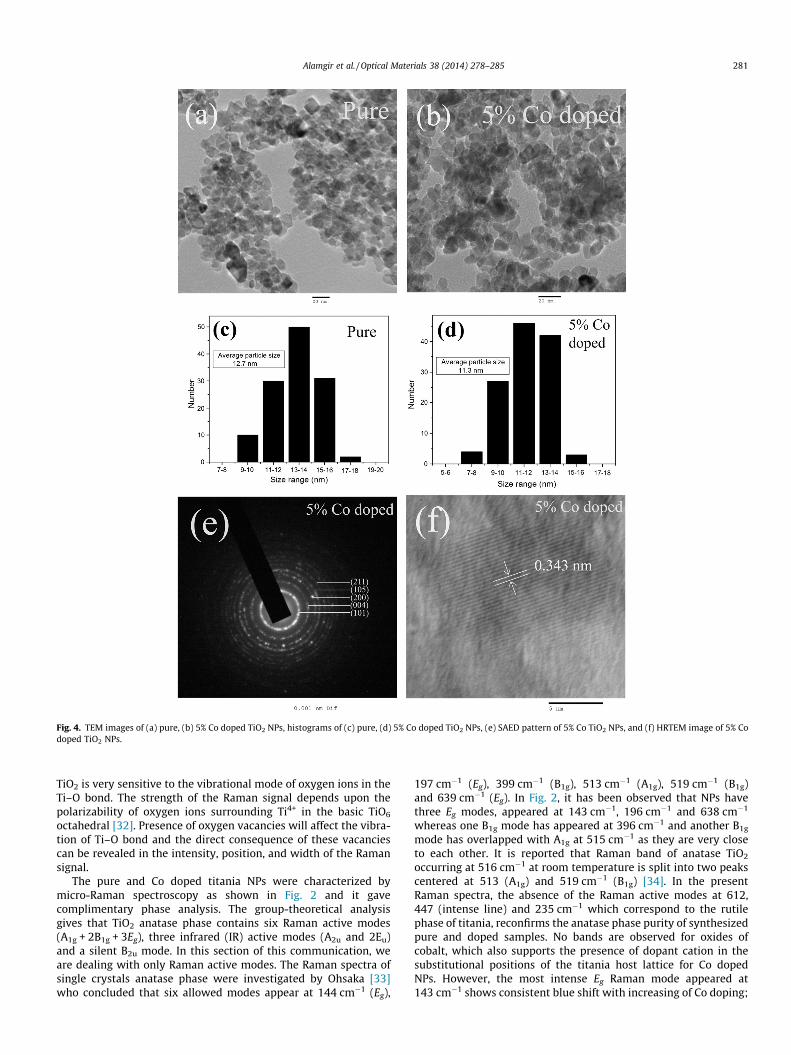
Fig. 4. TEM images of (a) pure, (b) 5% Co doped TiO2 NPs, histograms of (c) pure, (d) 5% Co doped TiO2 NPs, (e) SAED pattern of 5% Co TiO2 NPs, and (f) HRTEM image of 5% Codoped TiO2 NPs.
Alamgir et al. / Optical Materials 38 (2014) 278–285 281
TiO2 is very sensitive to the vibrational mode of oxygen ions in theTi–O bond. The strength of the Raman signal depends upon thepolarizability of oxygen ions surrounding Ti4+ in the basic TiO6
octahedral [32]. Presence of oxygen vacancies will affect the vibra-tion of Ti–O bond and the direct consequence of these vacanciescan be revealed in the intensity, position, and width of the Ramansignal.
The pure and Co doped titania NPs were characterized bymicro-Raman spectroscopy as shown in Fig. 2 and it gavecomplimentary phase analysis. The group-theoretical analysisgives that TiO2 anatase phase contains six Raman active modes(A1g + 2B1g + 3Eg), three infrared (IR) active modes (A2u and 2Eu)and a silent B2u mode. In this section of this communication, weare dealing with only Raman active modes. The Raman spectra ofsingle crystals anatase phase were investigated by Ohsaka [33]who concluded that six allowed modes appear at 144 cm�1 (Eg),
197 cm�1 (Eg), 399 cm�1 (B1g), 513 cm�1 (A1g), 519 cm�1 (B1g)and 639 cm�1 (Eg). In Fig. 2, it has been observed that NPs havethree Eg modes, appeared at 143 cm�1, 196 cm�1 and 638 cm�1
whereas one B1g mode has appeared at 396 cm�1 and another B1g
mode has overlapped with A1g at 515 cm�1 as they are very closeto each other. It is reported that Raman band of anatase TiO2
occurring at 516 cm�1 at room temperature is split into two peakscentered at 513 (A1g) and 519 cm�1 (B1g) [34]. In the presentRaman spectra, the absence of the Raman active modes at 612,447 (intense line) and 235 cm�1 which correspond to the rutilephase of titania, reconfirms the anatase phase purity of synthesizedpure and doped samples. No bands are observed for oxides ofcobalt, which also supports the presence of dopant cation in thesubstitutional positions of the titania host lattice for Co dopedNPs. However, the most intense Eg Raman mode appeared at143 cm�1 shows consistent blue shift with increasing of Co doping;
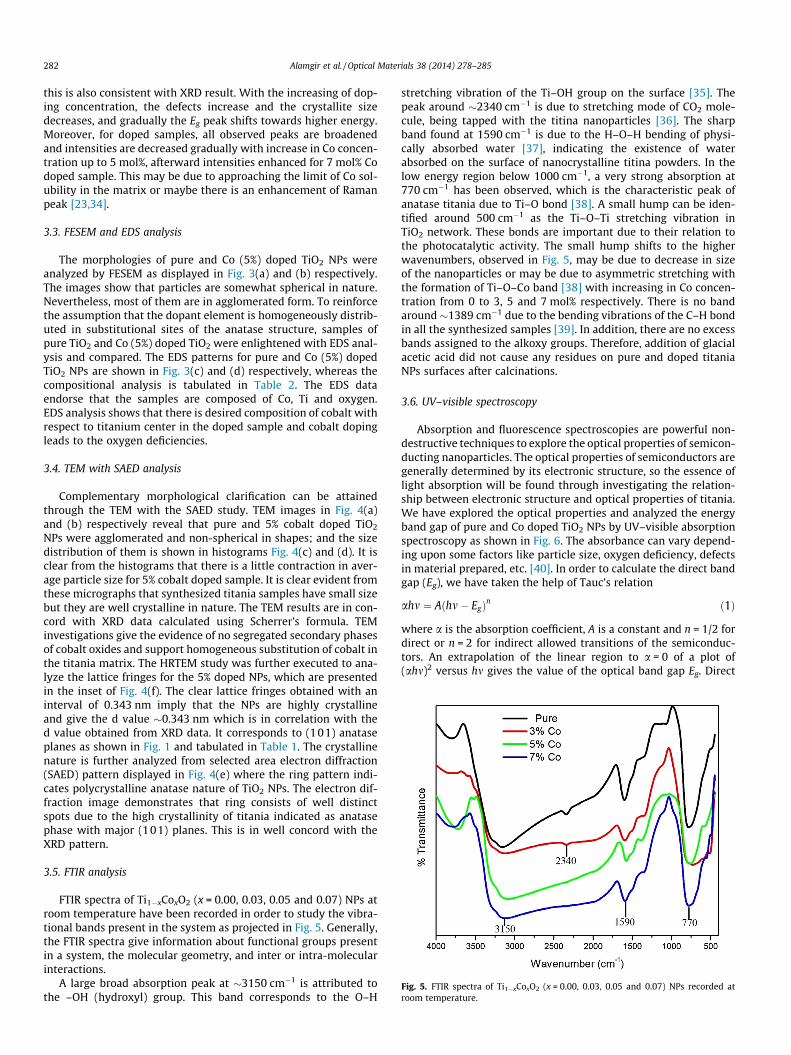
Fig. 5. FTIR spectra of Ti1�xCoxO2 (x = 0.00, 0.03, 0.05 and 0.07) NPs recorded atroom temperature.
282 Alamgir et al. / Optical Materials 38 (2014) 278–285
this is also consistent with XRD result. With the increasing of dop-ing concentration, the defects increase and the crystallite sizedecreases, and gradually the Eg peak shifts towards higher energy.Moreover, for doped samples, all observed peaks are broadenedand intensities are decreased gradually with increase in Co concen-tration up to 5 mol%, afterward intensities enhanced for 7 mol% Codoped sample. This may be due to approaching the limit of Co sol-ubility in the matrix or maybe there is an enhancement of Ramanpeak [23,34].
3.3. FESEM and EDS analysis
The morphologies of pure and Co (5%) doped TiO2 NPs wereanalyzed by FESEM as displayed in Fig. 3(a) and (b) respectively.The images show that particles are somewhat spherical in nature.Nevertheless, most of them are in agglomerated form. To reinforcethe assumption that the dopant element is homogeneously distrib-uted in substitutional sites of the anatase structure, samples ofpure TiO2 and Co (5%) doped TiO2 were enlightened with EDS anal-ysis and compared. The EDS patterns for pure and Co (5%) dopedTiO2 NPs are shown in Fig. 3(c) and (d) respectively, whereas thecompositional analysis is tabulated in Table 2. The EDS dataendorse that the samples are composed of Co, Ti and oxygen.EDS analysis shows that there is desired composition of cobalt withrespect to titanium center in the doped sample and cobalt dopingleads to the oxygen deficiencies.
3.4. TEM with SAED analysis
Complementary morphological clarification can be attainedthrough the TEM with the SAED study. TEM images in Fig. 4(a)and (b) respectively reveal that pure and 5% cobalt doped TiO2
NPs were agglomerated and non-spherical in shapes; and the sizedistribution of them is shown in histograms Fig. 4(c) and (d). It isclear from the histograms that there is a little contraction in aver-age particle size for 5% cobalt doped sample. It is clear evident fromthese micrographs that synthesized titania samples have small sizebut they are well crystalline in nature. The TEM results are in con-cord with XRD data calculated using Scherrer’s formula. TEMinvestigations give the evidence of no segregated secondary phasesof cobalt oxides and support homogeneous substitution of cobalt inthe titania matrix. The HRTEM study was further executed to ana-lyze the lattice fringes for the 5% doped NPs, which are presentedin the inset of Fig. 4(f). The clear lattice fringes obtained with aninterval of 0.343 nm imply that the NPs are highly crystallineand give the d value �0.343 nm which is in correlation with thed value obtained from XRD data. It corresponds to (101) anataseplanes as shown in Fig. 1 and tabulated in Table 1. The crystallinenature is further analyzed from selected area electron diffraction(SAED) pattern displayed in Fig. 4(e) where the ring pattern indi-cates polycrystalline anatase nature of TiO2 NPs. The electron dif-fraction image demonstrates that ring consists of well distinctspots due to the high crystallinity of titania indicated as anatasephase with major (101) planes. This is in well concord with theXRD pattern.
3.5. FTIR analysis
FTIR spectra of Ti1�xCoxO2 (x = 0.00, 0.03, 0.05 and 0.07) NPs atroom temperature have been recorded in order to study the vibra-tional bands present in the system as projected in Fig. 5. Generally,the FTIR spectra give information about functional groups presentin a system, the molecular geometry, and inter or intra-molecularinteractions.
A large broad absorption peak at �3150 cm�1 is attributed tothe –OH (hydroxyl) group. This band corresponds to the O–H
stretching vibration of the Ti–OH group on the surface [35]. Thepeak around �2340 cm�1 is due to stretching mode of CO2 mole-cule, being tapped with the titina nanoparticles [36]. The sharpband found at 1590 cm�1 is due to the H–O–H bending of physi-cally absorbed water [37], indicating the existence of waterabsorbed on the surface of nanocrystalline titina powders. In thelow energy region below 1000 cm�1, a very strong absorption at770 cm�1 has been observed, which is the characteristic peak ofanatase titania due to Ti–O bond [38]. A small hump can be iden-tified around 500 cm�1 as the Ti–O–Ti stretching vibration inTiO2 network. These bonds are important due to their relation tothe photocatalytic activity. The small hump shifts to the higherwavenumbers, observed in Fig. 5, may be due to decrease in sizeof the nanoparticles or may be due to asymmetric stretching withthe formation of Ti–O–Co band [38] with increasing in Co concen-tration from 0 to 3, 5 and 7 mol% respectively. There is no bandaround �1389 cm�1 due to the bending vibrations of the C–H bondin all the synthesized samples [39]. In addition, there are no excessbands assigned to the alkoxy groups. Therefore, addition of glacialacetic acid did not cause any residues on pure and doped titaniaNPs surfaces after calcinations.
3.6. UV–visible spectroscopy
Absorption and fluorescence spectroscopies are powerful non-destructive techniques to explore the optical properties of semicon-ducting nanoparticles. The optical properties of semiconductors aregenerally determined by its electronic structure, so the essence oflight absorption will be found through investigating the relation-ship between electronic structure and optical properties of titania.We have explored the optical properties and analyzed the energyband gap of pure and Co doped TiO2 NPs by UV–visible absorptionspectroscopy as shown in Fig. 6. The absorbance can vary depend-ing upon some factors like particle size, oxygen deficiency, defectsin material prepared, etc. [40]. In order to calculate the direct bandgap (Eg), we have taken the help of Tauc’s relation
ahm ¼ Aðhm� EgÞn ð1Þ
where a is the absorption coefficient, A is a constant and n = 1/2 fordirect or n = 2 for indirect allowed transitions of the semiconduc-tors. An extrapolation of the linear region to a = 0 of a plot of(ahm)2 versus hm gives the value of the optical band gap Eg. Direct
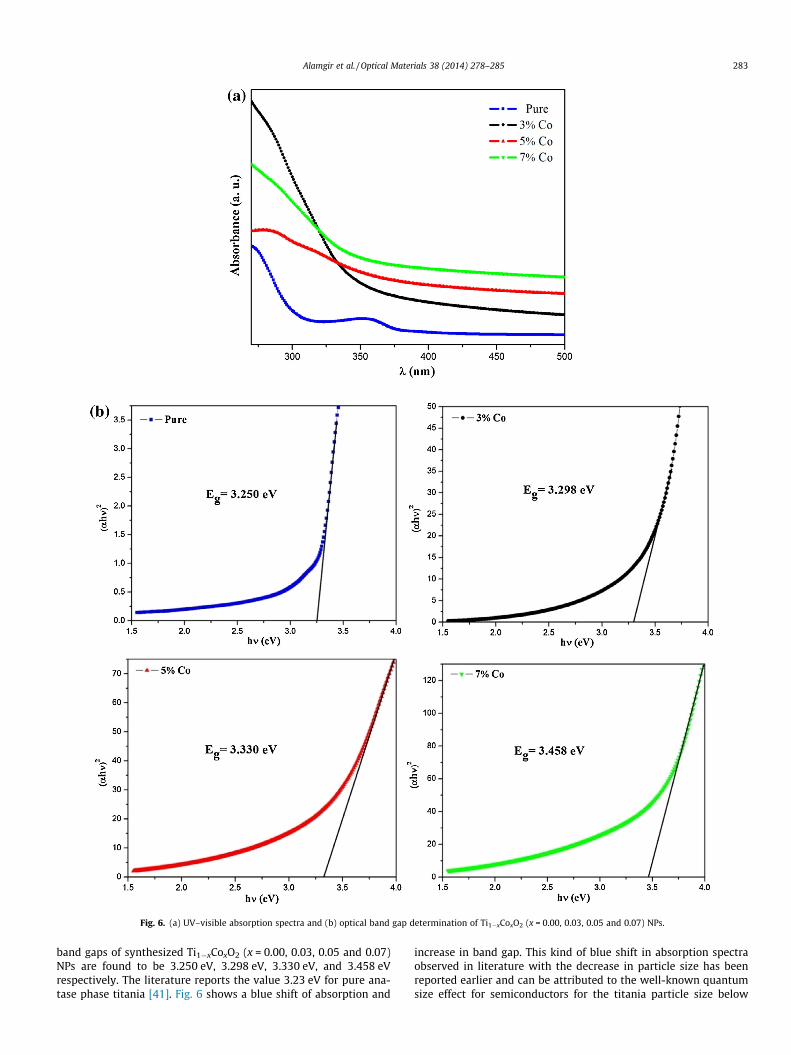
Fig. 6. (a) UV–visible absorption spectra and (b) optical band gap determination of Ti1�xCoxO2 (x = 0.00, 0.03, 0.05 and 0.07) NPs.
Alamgir et al. / Optical Materials 38 (2014) 278–285 283
band gaps of synthesized Ti1�xCoxO2 (x = 0.00, 0.03, 0.05 and 0.07)NPs are found to be 3.250 eV, 3.298 eV, 3.330 eV, and 3.458 eVrespectively. The literature reports the value 3.23 eV for pure ana-tase phase titania [41]. Fig. 6 shows a blue shift of absorption and
increase in band gap. This kind of blue shift in absorption spectraobserved in literature with the decrease in particle size has beenreported earlier and can be attributed to the well-known quantumsize effect for semiconductors for the titania particle size below
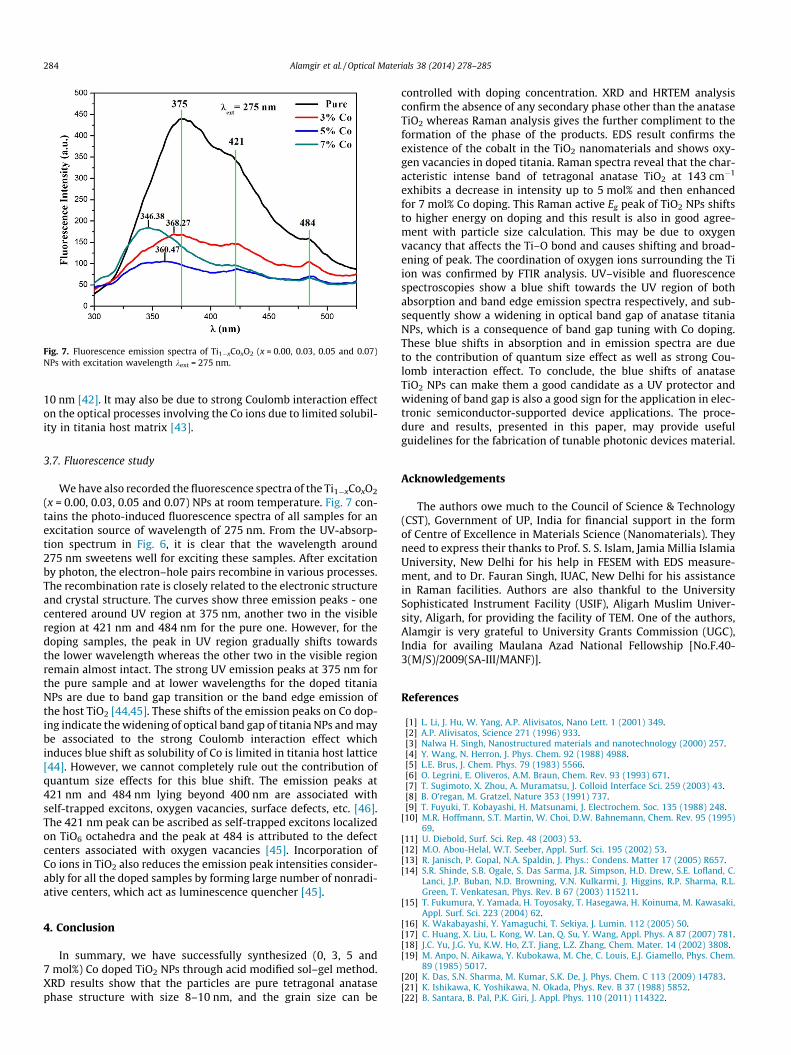
Fig. 7. Fluorescence emission spectra of Ti1�xCoxO2 (x = 0.00, 0.03, 0.05 and 0.07)NPs with excitation wavelength kext = 275 nm.
284 Alamgir et al. / Optical Materials 38 (2014) 278–285
10 nm [42]. It may also be due to strong Coulomb interaction effecton the optical processes involving the Co ions due to limited solubil-ity in titania host matrix [43].
3.7. Fluorescence study
We have also recorded the fluorescence spectra of the Ti1�xCoxO2
(x = 0.00, 0.03, 0.05 and 0.07) NPs at room temperature. Fig. 7 con-tains the photo-induced fluorescence spectra of all samples for anexcitation source of wavelength of 275 nm. From the UV-absorp-tion spectrum in Fig. 6, it is clear that the wavelength around275 nm sweetens well for exciting these samples. After excitationby photon, the electron–hole pairs recombine in various processes.The recombination rate is closely related to the electronic structureand crystal structure. The curves show three emission peaks - onecentered around UV region at 375 nm, another two in the visibleregion at 421 nm and 484 nm for the pure one. However, for thedoping samples, the peak in UV region gradually shifts towardsthe lower wavelength whereas the other two in the visible regionremain almost intact. The strong UV emission peaks at 375 nm forthe pure sample and at lower wavelengths for the doped titaniaNPs are due to band gap transition or the band edge emission ofthe host TiO2 [44,45]. These shifts of the emission peaks on Co dop-ing indicate the widening of optical band gap of titania NPs and maybe associated to the strong Coulomb interaction effect whichinduces blue shift as solubility of Co is limited in titania host lattice[44]. However, we cannot completely rule out the contribution ofquantum size effects for this blue shift. The emission peaks at421 nm and 484 nm lying beyond 400 nm are associated withself-trapped excitons, oxygen vacancies, surface defects, etc. [46].The 421 nm peak can be ascribed as self-trapped excitons localizedon TiO6 octahedra and the peak at 484 is attributed to the defectcenters associated with oxygen vacancies [45]. Incorporation ofCo ions in TiO2 also reduces the emission peak intensities consider-ably for all the doped samples by forming large number of nonradi-ative centers, which act as luminescence quencher [45].
4. Conclusion
In summary, we have successfully synthesized (0, 3, 5 and7 mol%) Co doped TiO2 NPs through acid modified sol–gel method.XRD results show that the particles are pure tetragonal anatasephase structure with size 8–10 nm, and the grain size can be
controlled with doping concentration. XRD and HRTEM analysisconfirm the absence of any secondary phase other than the anataseTiO2 whereas Raman analysis gives the further compliment to theformation of the phase of the products. EDS result confirms theexistence of the cobalt in the TiO2 nanomaterials and shows oxy-gen vacancies in doped titania. Raman spectra reveal that the char-acteristic intense band of tetragonal anatase TiO2 at 143 cm�1
exhibits a decrease in intensity up to 5 mol% and then enhancedfor 7 mol% Co doping. This Raman active Eg peak of TiO2 NPs shiftsto higher energy on doping and this result is also in good agree-ment with particle size calculation. This may be due to oxygenvacancy that affects the Ti–O bond and causes shifting and broad-ening of peak. The coordination of oxygen ions surrounding the Tiion was confirmed by FTIR analysis. UV–visible and fluorescencespectroscopies show a blue shift towards the UV region of bothabsorption and band edge emission spectra respectively, and sub-sequently show a widening in optical band gap of anatase titaniaNPs, which is a consequence of band gap tuning with Co doping.These blue shifts in absorption and in emission spectra are dueto the contribution of quantum size effect as well as strong Cou-lomb interaction effect. To conclude, the blue shifts of anataseTiO2 NPs can make them a good candidate as a UV protector andwidening of band gap is also a good sign for the application in elec-tronic semiconductor-supported device applications. The proce-dure and results, presented in this paper, may provide usefulguidelines for the fabrication of tunable photonic devices material.
Acknowledgements
The authors owe much to the Council of Science & Technology(CST), Government of UP, India for financial support in the formof Centre of Excellence in Materials Science (Nanomaterials). Theyneed to express their thanks to Prof. S. S. Islam, Jamia Millia IslamiaUniversity, New Delhi for his help in FESEM with EDS measure-ment, and to Dr. Fauran Singh, IUAC, New Delhi for his assistancein Raman facilities. Authors are also thankful to the UniversitySophisticated Instrument Facility (USIF), Aligarh Muslim Univer-sity, Aligarh, for providing the facility of TEM. One of the authors,Alamgir is very grateful to University Grants Commission (UGC),India for availing Maulana Azad National Fellowship [No.F.40-3(M/S)/2009(SA-III/MANF)].
References
[1] L. Li, J. Hu, W. Yang, A.P. Alivisatos, Nano Lett. 1 (2001) 349.[2] A.P. Alivisatos, Science 271 (1996) 933.[3] Nalwa H. Singh, Nanostructured materials and nanotechnology (2000) 257.[4] Y. Wang, N. Herron, J. Phys. Chem. 92 (1988) 4988.[5] L.E. Brus, J. Chem. Phys. 79 (1983) 5566.[6] O. Legrini, E. Oliveros, A.M. Braun, Chem. Rev. 93 (1993) 671.[7] T. Sugimoto, X. Zhou, A. Muramatsu, J. Colloid Interface Sci. 259 (2003) 43.[8] B. O’regan, M. Gratzel, Nature 353 (1991) 737.[9] T. Fuyuki, T. Kobayashi, H. Matsunami, J. Electrochem. Soc. 135 (1988) 248.
[10] M.R. Hoffmann, S.T. Martin, W. Choi, D.W. Bahnemann, Chem. Rev. 95 (1995)69.
[11] U. Diebold, Surf. Sci. Rep. 48 (2003) 53.[12] M.O. Abou-Helal, W.T. Seeber, Appl. Surf. Sci. 195 (2002) 53.[13] R. Janisch, P. Gopal, N.A. Spaldin, J. Phys.: Condens. Matter 17 (2005) R657.[14] S.R. Shinde, S.B. Ogale, S. Das Sarma, J.R. Simpson, H.D. Drew, S.E. Lofland, C.
Lanci, J.P. Buban, N.D. Browning, V.N. Kulkarmi, J. Higgins, R.P. Sharma, R.L.Green, T. Venkatesan, Phys. Rev. B 67 (2003) 115211.
[15] T. Fukumura, Y. Yamada, H. Toyosaky, T. Hasegawa, H. Koinuma, M. Kawasaki,Appl. Surf. Sci. 223 (2004) 62.
[16] K. Wakabayashi, Y. Yamaguchi, T. Sekiya, J. Lumin. 112 (2005) 50.[17] C. Huang, X. Liu, L. Kong, W. Lan, Q. Su, Y. Wang, Appl. Phys. A 87 (2007) 781.[18] J.C. Yu, J.G. Yu, K.W. Ho, Z.T. Jiang, L.Z. Zhang, Chem. Mater. 14 (2002) 3808.[19] M. Anpo, N. Aikawa, Y. Kubokawa, M. Che, C. Louis, E.J. Giamello, Phys. Chem.
89 (1985) 5017.[20] K. Das, S.N. Sharma, M. Kumar, S.K. De, J. Phys. Chem. C 113 (2009) 14783.[21] K. Ishikawa, K. Yoshikawa, N. Okada, Phys. Rev. B 37 (1988) 5852.[22] B. Santara, B. Pal, P.K. Giri, J. Appl. Phys. 110 (2011) 114322.
Alamgir et al. / Optical Materials 38 (2014) 278–285 285
[23] L. Yang, X. Qin, M. Gong, X. Jiang, M. Yang, X. Li, G. Li, Spectrochim. Acta Part A:Mol. Biomol. Spectros. 123 (2014) 224.
[24] V.R. Singh, K. Ishigami, V.K. Verma, G. Shibata, Y. Yamazaki, T. Kataoka, A.Fujimori, F.-H. Chang, D.-J. Huang, H.-J. Lin, C.T. Chen, Y. Yamada, T. Fukumura,M. Kawasaki, J. Appl. Phys. 100 (2012) 242404.
[25] B. Choudhury, A. Choudhury, A.K.M.M. Islam, P. Alagarsamy, M. Mukherjee, J.Magn. Magn. Mater. 323 (2011) 440.
[26] J.C. Parker, R.W. Seigel, Appl. Phys. Lett. 57 (1990) 943.[27] D. Bersani, P.P. Lottici, X.Z. Ding, Appl. Phys. Lett. 72 (1998) 73.[28] W.H. Ma, Z. Lu, M.S. Zhang, Appl. Phys. A 66 (1998) 621.[29] W.F. Zhang, Y.L. He, M.S. Zhang, Z. Yin, Q. Chen, J. Phys. D: Appl. Phys. 33 (2000) 912.[30] H.C. Choi, Y.M. Jung, S.B. Kim, Vib. Spectrosc. 37 (2005) 33.[31] L.H. Liang, C.M. Shen, X.P. Chen, W.M. Liu, H.J. Gao, J. Phys.: Condens. Matter 16
(2004) 267.[32] B. Choudhury, A. Choudhury, J. Appl. Phys. 114 (2013) 203906.[33] T. Ohsaka, F. Izumi, Y. Fujiki, J. Raman Spectrosc. 7 (1978) 321.[34] S. Sharma, S. Chaudhary, S.C. Kashyap, S.K. Sharma, J. Appl. Phys. 109 (2011)
083905.
[35] H.Y. Chuang, D.H. Chen, Nanotechnology 20 (2009) 105704.[36] E.V. Lavrov, J. Weber, F. Borrnert, C.G. Vande Walle, R. Helbig, Phys. Rev. B 66
(2002) 165205.[37] G. Li, L. Li, J.B. Goates, B.F. Woodfield, J. Am. Chem. Soc. 127 (2005) 8659.[38] P. Goswami, J.N. Ganguli, Dalton Trans. 42 (2013) 14480.[39] J.A. Wang, R. Limas-Ballesteros, T. Lopez, A. Moreno, R. Gomez, O. Novaro, X.
Bokhimi, J. Phys. Chem. B 105 (2001) 9692.[40] Timonah N. Soitah, Yang Chunhui, Sun Liang, Sci. Adv. Mater. 2 (2010) 534.[41] M. Litter, Appl. Catal. B: Environ. 23 (1999) 89.[42] K.M. Reddy, S.V. Manorama, A.R. Reddy, Mater. Chem. Phys. 78 (2002)
239.[43] J.R. Simpson, H.D. Drew, S.R. Shinde, R.J. Choudhary, S.B. Ogale, T. Venkatesan,
Phys. Rev. B 69 (2004) 193205.[44] J. Xu, S. Shi, L. Li, X. Zhang, Y. Wang, X. Chen, J. Wang, L. Lv, F. Zhang, W. Zhong,
J. Appl. Phys. 107 (2010) 053910.[45] B. Choudhury, A. Choudhury, J. Luminescence 132 (2012) 178.[46] Y. Lei, L. Zhang, G. Meng, G. Li, X. Zhang, C. Liang, W. Chen, S. Wang, Appl. Phys.
Lett. 78 (2001) 1125.
Related Documents


