Applied Catalysis B: Environmental 125 (2012) 465–472 Contents lists available at SciVerse ScienceDirect Applied Catalysis B: Environmental jo ur n al homepage: www.elsevier.com/locate/apcatb Photoelectrochemical degradation of azo dye over pulsed laser deposited nitrogen-doped TiO 2 thin film Yen-Ping Peng b , Emre Yassitepe c , Yun-Ta Yeh a , Inci Ruzybayev d , S. Ismat Shah c,d , C.P. Huang a,∗ a Department of Civil and Environmental Engineering, University of Delaware, Newark, DE 19716, USA b College of Environmental Science and Engineering, South China University, 510006 PR China c Department of Material Science Engineering, University of Delaware, Newark, DE 19716, USA d Department of Physics and Astronomy, University of Delaware, Newark, DE 19716, USA a r t i c l e i n f o Article history: Received 23 January 2012 Received in revised form 5 June 2012 Accepted 12 June 2012 Available online 20 June 2012 Keywords: Photoelectrochemical Pulsed laser deposition N-doped TiO2 Thin film Synergetic effect a b s t r a c t We investigated the synergetic effect of electrochemical and photocatalytic oxidation in photoelectro- chemical (PEC) process for the degradation of hazardous organic compounds exemplified by methyl orange, an azo dye. Nitrogen doped TiO 2 thin film (NTTF) synthesized by the pulsed laser deposition (PLD) method, was used as the working anode. The crystalline, optical properties, surface morphology, and structure of the NTTF were characterized by XRD, UV–vis absorbance edges, SEM, and XPS. Results showed that the NTTF was dominated by anatase phase after sintered at 600 ◦ C with significant visible light response at 595 nm. XPS analyses indicated nitrogen doping was mainly responsible for reducing the band gap as evidence of 3% N doping into the structure via the linkage of Ti O N and N Ti O bond. SEM images illustrated the nitrogen-doped TiO 2 nanoparticles being attached firmly and spread evenly over the ITO glass surface, which is beneficial for PEC applications. The degradation efficiency of MO by pho- toelectrochemical, photocatalytic, electrochemical and photolysis methods were compared in terms of pseudo-first-order reaction rate. PEC was the most efficient in degrading MO at a bias potential of 2.0 V (vs. SCE) under light at a wavelength of 325 nm, which was consistent with results of IPCE (%) measurements. The synergetic effect was quantified at current/bias potential of 0.07 mA/0.3 V and 0.6 mA/2.0 V, respec- tively. Results demonstrated that the bias potential could separate photogenerated holes and electrons effectively and enhance the electrochemical-oxidation of MO. The mechanistic aspects of MO degradation by the PEC process were discussed. © 2012 Published by Elsevier B.V. 1. Introduction Semiconductors have been intensively investigated for applica- tions in water splitting, solar cell, and pollutant degradation [1–3]. Among the various semiconductors, titanium dioxide (TiO 2 ) has received the most attention due to its attractive photocatalytic activity, chemical stability, nontoxicity, and low cost [2,3]. How- ever, TiO 2 has a relatively large band gap, between 3.2 and 3.4 eV, which impedes its applications. In other word, TiO 2 is excitable only by UV light, which occupies less than 5% of the solar spec- trum. Furthermore, in the absence of electron and hole scavengers, after photoexcitation the stored energy is dissipated due to rapid electron–hole recombination, within a few nanoseconds, to yield a neutral state through emission of photons in a volumetric or sur- face level [2,4]. This electron–hole recombination process not only ∗ Corresponding author. Tel.: +1 302 831 8428; fax: +1 302 831 3640. E-mail address: [email protected] (C.P. Huang). suppresses the quantum efficiency but also decreases the oxidation capability of semiconductors. A great deal of efforts have been made to modify the band gap of TiO 2 by size control [5–7], manipulating the oxygen vacancy [8,9], and doping impurities [10]. Asahi et al. [11] were among the first investigators to demonstrate that, among nonmetal dopants such as C, N, F, P and S, the substitution doping of N was the most effective because its p states contribute to the band gap narrow- ing by mixing with the O 2p state. Results showed that films and powders of TiO 2−x N x have improved the optical absorption over that of titanium dioxide under visible light (wavelength < 500 nm). Therefore, considerable efforts have been made to dope TiO 2 pow- ders, nanotubes, and thin films with N [12–20]. Among these various types of N-doped TiO 2 materials, thin film shows supe- rior utility and feasibility due to its convenience for reuse and recycling. Several TiO 2 thin film deposition techniques including sol–gel [21], electrophoretic deposition [22], metalorganic chem- ical vapor deposition (MOCVD) [23], and pulsed laser deposition (PLD) [12,16–20,24,25] have been conducted. PLD is a high-energy process which provides a well adherent thin film with good 0926-3373/$ – see front matter © 2012 Published by Elsevier B.V. http://dx.doi.org/10.1016/j.apcatb.2012.06.004

Welcome message from author
This document is posted to help you gain knowledge. Please leave a comment to let me know what you think about it! Share it to your friends and learn new things together.
Transcript
Pn
Ya
b
c
d
a
ARRAA
KPPNTS
1
tAraewotaenf
0h
Applied Catalysis B: Environmental 125 (2012) 465– 472
Contents lists available at SciVerse ScienceDirect
Applied Catalysis B: Environmental
jo ur n al homepage: www.elsev ier .com/ locate /apcatb
hotoelectrochemical degradation of azo dye over pulsed laser depositeditrogen-doped TiO2 thin film
en-Ping Pengb, Emre Yassitepec, Yun-Ta Yeha, Inci Ruzybayevd, S. Ismat Shahc,d, C.P. Huanga,∗
Department of Civil and Environmental Engineering, University of Delaware, Newark, DE 19716, USACollege of Environmental Science and Engineering, South China University, 510006 PR ChinaDepartment of Material Science Engineering, University of Delaware, Newark, DE 19716, USADepartment of Physics and Astronomy, University of Delaware, Newark, DE 19716, USA
r t i c l e i n f o
rticle history:eceived 23 January 2012eceived in revised form 5 June 2012ccepted 12 June 2012vailable online 20 June 2012
eywords:hotoelectrochemicalulsed laser deposition-doped TiO2
hin filmynergetic effect
a b s t r a c t
We investigated the synergetic effect of electrochemical and photocatalytic oxidation in photoelectro-chemical (PEC) process for the degradation of hazardous organic compounds exemplified by methylorange, an azo dye. Nitrogen doped TiO2 thin film (NTTF) synthesized by the pulsed laser deposition(PLD) method, was used as the working anode. The crystalline, optical properties, surface morphology,and structure of the NTTF were characterized by XRD, UV–vis absorbance edges, SEM, and XPS. Resultsshowed that the NTTF was dominated by anatase phase after sintered at 600 ◦C with significant visiblelight response at 595 nm. XPS analyses indicated nitrogen doping was mainly responsible for reducing theband gap as evidence of 3% N doping into the structure via the linkage of Ti O N and N Ti O bond. SEMimages illustrated the nitrogen-doped TiO2 nanoparticles being attached firmly and spread evenly overthe ITO glass surface, which is beneficial for PEC applications. The degradation efficiency of MO by pho-toelectrochemical, photocatalytic, electrochemical and photolysis methods were compared in terms of
pseudo-first-order reaction rate. PEC was the most efficient in degrading MO at a bias potential of 2.0 V (vs.SCE) under light at a wavelength of 325 nm, which was consistent with results of IPCE (%) measurements.The synergetic effect was quantified at current/bias potential of 0.07 mA/0.3 V and 0.6 mA/2.0 V, respec-tively. Results demonstrated that the bias potential could separate photogenerated holes and electronseffectively and enhance the electrochemical-oxidation of MO. The mechanistic aspects of MO degradationby the PEC process were discussed.. Introduction
Semiconductors have been intensively investigated for applica-ions in water splitting, solar cell, and pollutant degradation [1–3].mong the various semiconductors, titanium dioxide (TiO2) haseceived the most attention due to its attractive photocatalyticctivity, chemical stability, nontoxicity, and low cost [2,3]. How-ver, TiO2 has a relatively large band gap, between 3.2 and 3.4 eV,hich impedes its applications. In other word, TiO2 is excitable
nly by UV light, which occupies less than 5% of the solar spec-rum. Furthermore, in the absence of electron and hole scavengers,fter photoexcitation the stored energy is dissipated due to rapidlectron–hole recombination, within a few nanoseconds, to yield a
eutral state through emission of photons in a volumetric or sur-ace level [2,4]. This electron–hole recombination process not only
∗ Corresponding author. Tel.: +1 302 831 8428; fax: +1 302 831 3640.E-mail address: [email protected] (C.P. Huang).
926-3373/$ – see front matter © 2012 Published by Elsevier B.V.ttp://dx.doi.org/10.1016/j.apcatb.2012.06.004
© 2012 Published by Elsevier B.V.
suppresses the quantum efficiency but also decreases the oxidationcapability of semiconductors.
A great deal of efforts have been made to modify the band gapof TiO2 by size control [5–7], manipulating the oxygen vacancy[8,9], and doping impurities [10]. Asahi et al. [11] were among thefirst investigators to demonstrate that, among nonmetal dopantssuch as C, N, F, P and S, the substitution doping of N was the mosteffective because its p states contribute to the band gap narrow-ing by mixing with the O 2p state. Results showed that films andpowders of TiO2−xNx have improved the optical absorption overthat of titanium dioxide under visible light (wavelength < 500 nm).Therefore, considerable efforts have been made to dope TiO2 pow-ders, nanotubes, and thin films with N [12–20]. Among thesevarious types of N-doped TiO2 materials, thin film shows supe-rior utility and feasibility due to its convenience for reuse andrecycling. Several TiO2 thin film deposition techniques including
sol–gel [21], electrophoretic deposition [22], metalorganic chem-ical vapor deposition (MOCVD) [23], and pulsed laser deposition(PLD) [12,16–20,24,25] have been conducted. PLD is a high-energyprocess which provides a well adherent thin film with good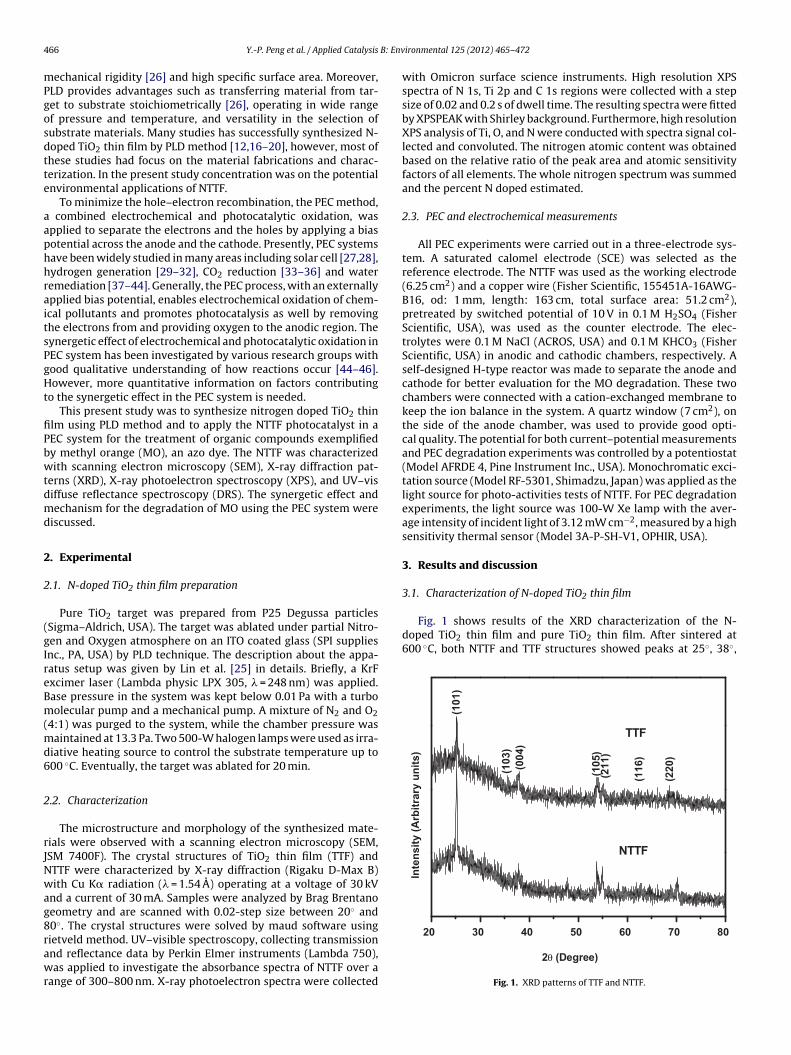
4 B: Env
mPgosdtte
aaphhraitsPgHt
fiPbwtdmd
2
2
(gIreBm(md6
2
rJNwag8rawr
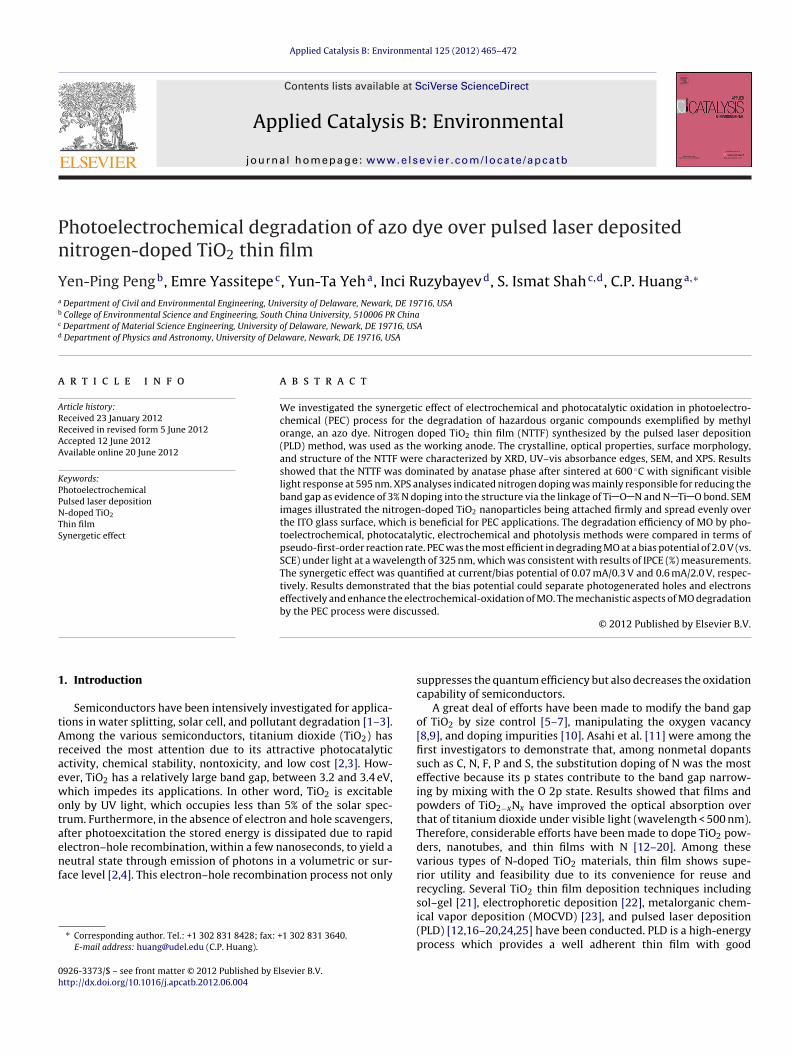
Fig. 1 shows results of the XRD characterization of the N-doped TiO2 thin film and pure TiO2 thin film. After sintered at600 ◦C, both NTTF and TTF structures showed peaks at 25◦, 38◦,
TTF
(11
6)
(211)
(105)
(00
4)
Inte
nsit
y (
Arb
itra
ry u
nit
s)
(10
1)
(10
3)
(22
0)
NTT F
66 Y.-P. Peng et al. / Applied Catalysis
echanical rigidity [26] and high specific surface area. Moreover,LD provides advantages such as transferring material from tar-et to substrate stoichiometrically [26], operating in wide rangef pressure and temperature, and versatility in the selection ofubstrate materials. Many studies has successfully synthesized N-oped TiO2 thin film by PLD method [12,16–20], however, most ofhese studies had focus on the material fabrications and charac-erization. In the present study concentration was on the potentialnvironmental applications of NTTF.
To minimize the hole–electron recombination, the PEC method, combined electrochemical and photocatalytic oxidation, waspplied to separate the electrons and the holes by applying a biasotential across the anode and the cathode. Presently, PEC systemsave been widely studied in many areas including solar cell [27,28],ydrogen generation [29–32], CO2 reduction [33–36] and wateremediation [37–44]. Generally, the PEC process, with an externallypplied bias potential, enables electrochemical oxidation of chem-cal pollutants and promotes photocatalysis as well by removinghe electrons from and providing oxygen to the anodic region. Theynergetic effect of electrochemical and photocatalytic oxidation inEC system has been investigated by various research groups withood qualitative understanding of how reactions occur [44–46].owever, more quantitative information on factors contributing
o the synergetic effect in the PEC system is needed.This present study was to synthesize nitrogen doped TiO2 thin
lm using PLD method and to apply the NTTF photocatalyst in aEC system for the treatment of organic compounds exemplifiedy methyl orange (MO), an azo dye. The NTTF was characterizedith scanning electron microscopy (SEM), X-ray diffraction pat-
erns (XRD), X-ray photoelectron spectroscopy (XPS), and UV–visiffuse reflectance spectroscopy (DRS). The synergetic effect andechanism for the degradation of MO using the PEC system were
iscussed.
. Experimental
.1. N-doped TiO2 thin film preparation
Pure TiO2 target was prepared from P25 Degussa particlesSigma–Aldrich, USA). The target was ablated under partial Nitro-en and Oxygen atmosphere on an ITO coated glass (SPI suppliesnc., PA, USA) by PLD technique. The description about the appa-atus setup was given by Lin et al. [25] in details. Briefly, a KrFxcimer laser (Lambda physic LPX 305, � = 248 nm) was applied.ase pressure in the system was kept below 0.01 Pa with a turboolecular pump and a mechanical pump. A mixture of N2 and O2
4:1) was purged to the system, while the chamber pressure wasaintained at 13.3 Pa. Two 500-W halogen lamps were used as irra-
iative heating source to control the substrate temperature up to00 ◦C. Eventually, the target was ablated for 20 min.
.2. Characterization
The microstructure and morphology of the synthesized mate-ials were observed with a scanning electron microscopy (SEM,SM 7400F). The crystal structures of TiO2 thin film (TTF) andTTF were characterized by X-ray diffraction (Rigaku D-Max B)ith Cu K� radiation (� = 1.54 A) operating at a voltage of 30 kV
nd a current of 30 mA. Samples were analyzed by Brag Brentanoeometry and are scanned with 0.02-step size between 20◦ and0◦. The crystal structures were solved by maud software using
ietveld method. UV–visible spectroscopy, collecting transmissionnd reflectance data by Perkin Elmer instruments (Lambda 750),as applied to investigate the absorbance spectra of NTTF over aange of 300–800 nm. X-ray photoelectron spectra were collected
ironmental 125 (2012) 465– 472
with Omicron surface science instruments. High resolution XPSspectra of N 1s, Ti 2p and C 1s regions were collected with a stepsize of 0.02 and 0.2 s of dwell time. The resulting spectra were fittedby XPSPEAK with Shirley background. Furthermore, high resolutionXPS analysis of Ti, O, and N were conducted with spectra signal col-lected and convoluted. The nitrogen atomic content was obtainedbased on the relative ratio of the peak area and atomic sensitivityfactors of all elements. The whole nitrogen spectrum was summedand the percent N doped estimated.
2.3. PEC and electrochemical measurements
All PEC experiments were carried out in a three-electrode sys-tem. A saturated calomel electrode (SCE) was selected as thereference electrode. The NTTF was used as the working electrode(6.25 cm2) and a copper wire (Fisher Scientific, 155451A-16AWG-B16, od: 1 mm, length: 163 cm, total surface area: 51.2 cm2),pretreated by switched potential of 10 V in 0.1 M H2SO4 (FisherScientific, USA), was used as the counter electrode. The elec-trolytes were 0.1 M NaCl (ACROS, USA) and 0.1 M KHCO3 (FisherScientific, USA) in anodic and cathodic chambers, respectively. Aself-designed H-type reactor was made to separate the anode andcathode for better evaluation for the MO degradation. These twochambers were connected with a cation-exchanged membrane tokeep the ion balance in the system. A quartz window (7 cm2), onthe side of the anode chamber, was used to provide good opti-cal quality. The potential for both current–potential measurementsand PEC degradation experiments was controlled by a potentiostat(Model AFRDE 4, Pine Instrument Inc., USA). Monochromatic exci-tation source (Model RF-5301, Shimadzu, Japan) was applied as thelight source for photo-activities tests of NTTF. For PEC degradationexperiments, the light source was 100-W Xe lamp with the aver-age intensity of incident light of 3.12 mW cm−2, measured by a highsensitivity thermal sensor (Model 3A-P-SH-V1, OPHIR, USA).
3. Results and discussion
3.1. Characterization of N-doped TiO2 thin film
80706050403020
2θ (Deg ree)
Fig. 1. XRD patterns of TTF and NTTF.
Y.-P. Peng et al. / Applied Catalysis B: Env
1.5 2.0 2.5 3.0 3.5 4.00
200
400
600
800
1000
1200(α
*hυ)0
.5 (
eV
/cm
)0.5
Photon Energy (eV)
NTTF
TTF
400 500 600 700 8000
200
400
600
800
NTTF
( α*h
v)0
.5 (
eV
/cm
)0.5
Waveleng th (nm)
TTF
Fa
5mottisam
t
˛
wic
˛
TneFoi2dawicomtt
sf5tnt
ig. 2. Characterization of band gap for TTF and NTTF. Inset plot shows the UV–visbsorbance of TTF and NTTF.
4◦ and 63◦ corresponding to anatase phase. This crystal structureatched with JCPDS-784486. No rutile peak appeared in either
f the two samples based on XRD results due to insufficient sin-ered temperature. Generally, rutile is more densely packed andhermodynamically stable than anatase [47], whereas the latters considered the more photoactive form of TiO2. The lattice con-tants were a = 3.7993 ± 0.0009 and c = 9.4983 ± 0.004 for NTTF and
= 3.7806 ± 0.002 and c = 9.4893 ± 0.009 for TTF; the above valuesatched closely with those structures identified.The absorption coefficient of the thin films was calculated with
he following formula [48];
(h�) = −1d
ln
(T
(1 − R)2
)(1)
here is the absorption coefficient, d is the thickness of the film, Ts transmission at a particular wavelength, and R is the reflectanceharacteristics of the film, i.e.,
(h�) ∝ (h� − Eg)n
h�(2)
he optical band gap was calculated by plotting (˛h�)n vs. h�, where is 0.5 for indirect and 1 for direct band gap materials. The dopingffect can be seen from the results of band gap characterization.rom Fig. 2, both TTF and NTTF showed the characteristic band gapf 3.2 eV, which corresponds to anatase phase in titanium diox-de nanomaterial. Furthermore, NTTF showed a secondary slope at.0 eV, which was attributed to the additional states due to nitrogenoping [15,49–51]. As demonstrated in the inset plot in Fig. 2, thebsorbance shoulders for NTTF exhibited high absorbance in longeravelength at 595 nm, which indicated that NTTF could be excited
n visible light region. The significant absorbance for visible lightan be attributed to the O Ti N linkage, leading to the narrowingf energy band gap [11,51]. This phenomenon illustrated the for-ation of an intra-band gap located above the valence band, due to
he interstitial introduction of nitride into the oxide lattice and/oro substitution of oxide centers by nitride centers [52].
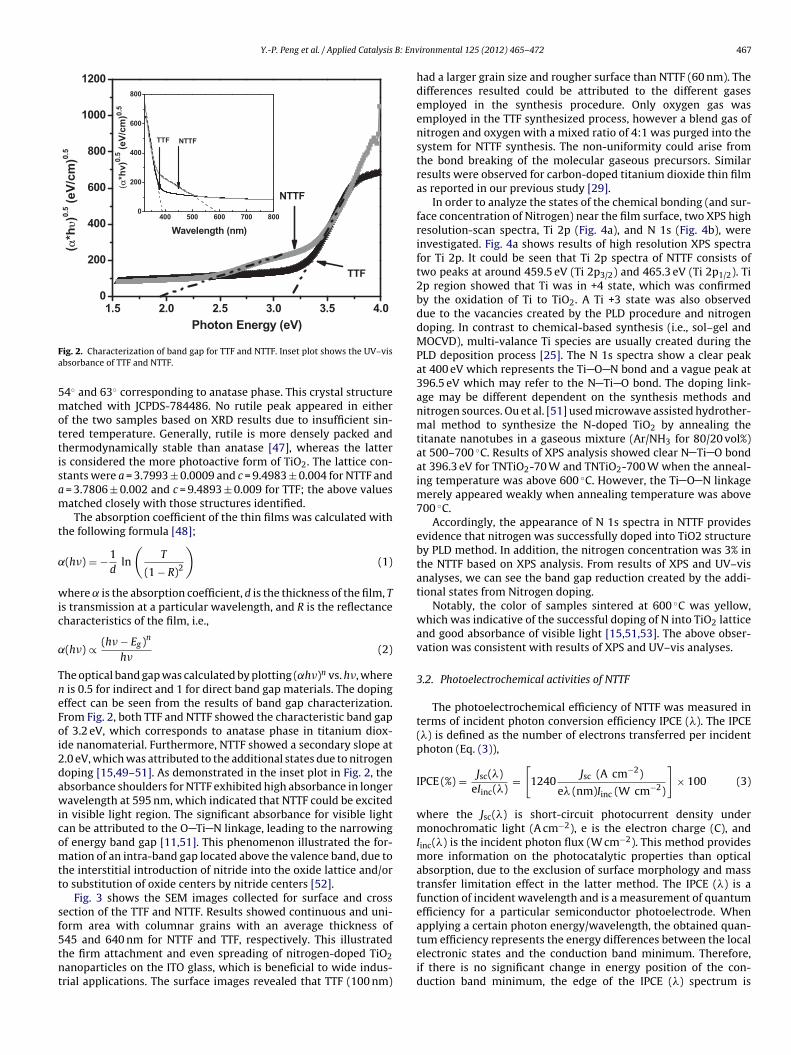
Fig. 3 shows the SEM images collected for surface and crossection of the TTF and NTTF. Results showed continuous and uni-orm area with columnar grains with an average thickness of
45 and 640 nm for NTTF and TTF, respectively. This illustratedhe firm attachment and even spreading of nitrogen-doped TiO2anoparticles on the ITO glass, which is beneficial to wide indus-rial applications. The surface images revealed that TTF (100 nm)ironmental 125 (2012) 465– 472 467
had a larger grain size and rougher surface than NTTF (60 nm). Thedifferences resulted could be attributed to the different gasesemployed in the synthesis procedure. Only oxygen gas wasemployed in the TTF synthesized process, however a blend gas ofnitrogen and oxygen with a mixed ratio of 4:1 was purged into thesystem for NTTF synthesis. The non-uniformity could arise fromthe bond breaking of the molecular gaseous precursors. Similarresults were observed for carbon-doped titanium dioxide thin filmas reported in our previous study [29].
In order to analyze the states of the chemical bonding (and sur-face concentration of Nitrogen) near the film surface, two XPS highresolution-scan spectra, Ti 2p (Fig. 4a), and N 1s (Fig. 4b), wereinvestigated. Fig. 4a shows results of high resolution XPS spectrafor Ti 2p. It could be seen that Ti 2p spectra of NTTF consists oftwo peaks at around 459.5 eV (Ti 2p3/2) and 465.3 eV (Ti 2p1/2). Ti2p region showed that Ti was in +4 state, which was confirmedby the oxidation of Ti to TiO2. A Ti +3 state was also observeddue to the vacancies created by the PLD procedure and nitrogendoping. In contrast to chemical-based synthesis (i.e., sol–gel andMOCVD), multi-valance Ti species are usually created during thePLD deposition process [25]. The N 1s spectra show a clear peakat 400 eV which represents the Ti O N bond and a vague peak at396.5 eV which may refer to the N Ti O bond. The doping link-age may be different dependent on the synthesis methods andnitrogen sources. Ou et al. [51] used microwave assisted hydrother-mal method to synthesize the N-doped TiO2 by annealing thetitanate nanotubes in a gaseous mixture (Ar/NH3 for 80/20 vol%)at 500–700 ◦C. Results of XPS analysis showed clear N Ti O bondat 396.3 eV for TNTiO2-70 W and TNTiO2-700 W when the anneal-ing temperature was above 600 ◦C. However, the Ti O N linkagemerely appeared weakly when annealing temperature was above700 ◦C.
Accordingly, the appearance of N 1s spectra in NTTF providesevidence that nitrogen was successfully doped into TiO2 structureby PLD method. In addition, the nitrogen concentration was 3% inthe NTTF based on XPS analysis. From results of XPS and UV–visanalyses, we can see the band gap reduction created by the addi-tional states from Nitrogen doping.
Notably, the color of samples sintered at 600 ◦C was yellow,which was indicative of the successful doping of N into TiO2 latticeand good absorbance of visible light [15,51,53]. The above obser-vation was consistent with results of XPS and UV–vis analyses.
3.2. Photoelectrochemical activities of NTTF
The photoelectrochemical efficiency of NTTF was measured interms of incident photon conversion efficiency IPCE (�). The IPCE(�) is defined as the number of electrons transferred per incidentphoton (Eq. (3)),
IPCE (%) = Jsc(�)eIinc(�)
=[
1240Jsc (A cm−2)
e� (nm)Iinc (W cm−2)
]× 100 (3)
where the Jsc(�) is short-circuit photocurrent density undermonochromatic light (A cm−2), e is the electron charge (C), andIinc(�) is the incident photon flux (W cm−2). This method providesmore information on the photocatalytic properties than opticalabsorption, due to the exclusion of surface morphology and masstransfer limitation effect in the latter method. The IPCE (�) is afunction of incident wavelength and is a measurement of quantumefficiency for a particular semiconductor photoelectrode. Whenapplying a certain photon energy/wavelength, the obtained quan-
tum efficiency represents the energy differences between the localelectronic states and the conduction band minimum. Therefore,if there is no significant change in energy position of the con-duction band minimum, the edge of the IPCE (�) spectrum is
468 Y.-P. Peng et al. / Applied Catalysis B: Environmental 125 (2012) 465– 472
NTTF
qbtp
awoTi3rrNtpf
TI
Fig. 3. SEM images of the surface of (a) TTF, (b)
ualitatively proportional to the density of states for the valanceand maximum. In other words, the onset of the IPCE (�) spec-rum is similar to the wavelength of threshold bandgap (�bg) of aarticular semiconductor.
The IPCE (�) of NTTF were investigated at 0.3, 0.5, 0.7, 1.0, 1.5nd 2.0 V, and under irradiation wavelength from 300 to 425 nmith every 25 nm interval. As shown in Fig. 5, the IPCE (�) value
f NTTF increased with the increase in external potential applied.he highest photo-response was obtained at 325 nm, i.e., the max-mum IPCE (�) value of 26.77% was observed at the irradiation of25 nm and a bias potential of 2.0 V (Table 1). Although the UV–visesults provide evidence that NTTF can be excited in visible lightegion, the IPCE results showed a better photo-electro response of
TTF at shorter irradiation wavelength. This might be that irradia-ion in shorter wavelength always has higher photo-energy. Higherhoto-energy accompanies greater photon kinetic energy, whichacilitates movement of photons. The IPCE for pure TiO2 film was
able 1PCE(%) and photocurrent at various bias potential.
Vbias (vs. SCE, V) 0.3 0.5 0.7 1.0 1.5 2.0
Dark current (mA) 0.023 0.160 0.292 0.413 0.517 0.607Photocurrent (mA) 0.072 0.198 0.223 0.337 0.582 0.595Total current (mA) 0.095 0.358 0.515 0.75 1.099 1.202Light intensity (mW cm−2) 7.6 7.6 7.6 7.6 7.6 7.6IPCE (%) 2.93 8.06 9.08 13.72 23.70 26.77
; cross-section images for (c) TTF and (d) NTTF.
also calculated under the same conditions of irradiation and biaspotential of 0.75 V as reported in our previous study [23]. It isnoted that even though the band gap was expanded from 325 to595 nm upon N doping, wavelength at 325 nm still yields the max-imum photocatalytic degradation due to higher energy availablefor electron excitation. Generally, higher light energy accompaniesmore absorbed photons which can excite the photocatalyst to sep-arate the electrons and holes, resulting in higher photoactivity. Incontrast, NTTF expressed a photocurrent of 1.142 mA at 425 nm,whereas, the pure TiO2 thin film photocurrent almost disappearedat 400 nm [29]. This illustrated that NTTF has better visible lightresponse than pure TiO2 thin film. Notably, the IPCE (�) spectrumexhibited trends similar to UV–vis diffuse reflectance absorption;both showed two adsorption edges as evidence of that the IPCE(�) function considers the effect of surface morphology and masstransfer limitation on the determination of band gap.
3.3. Degradation of MO over N-doped TiO2 thin film
Four MO removal processes, namely, PEC, photocatalytic (PC),electrochemical [6] and direct photolysis (P) processes wereconducted to evaluate the degradation efficiency. The PEC, PC
and photolysis experiments were examined at the illuminationusing 100-W Xe lamp at 3.12 mW cm−2. The applied voltagein PEC and EC process was 2.0 V (vs. SCE), at which, both CV[54] and IPCE results yielded the best response with respect to
Y.-P. Peng et al. / Applied Catalysis B: Environmental 125 (2012) 465– 472 469
456458460462464466468470
5000
10000
15000
20000
25000
30000
35000
40000
Inte
ns
ity
(C
ou
nts
/se
c)
Binding Energy (eV)
Ti 2p Region
405400395390
3250
3300
3350
3400
3450
3500
3550
Ti-N-O bond
Inte
nsit
y (
Co
un
ts/s
ec)
ng E
Ti-O-N bond(b)
(a)
for (a)
piaAdoappdastT1ttda
Bindi
Fig. 4. High resolution XPS spectra
hotocurrent-bias potential. In the range of bias potential studied,.e., 0.3–2 V, the maximum photocurrent occurred at 2.0 V whichppeared to agree with the results of cyclic voltammetric scans.s shown in Fig. 6, PEC process was the most efficient way toegrade MO among four methods studied. The complete removalf 1 mg/L of MO was observed after 40 min, whereas only 14.9, 36.3nd 5.1% of the MO removal was achieved by the PC, EC and Process within the same irradiation time, respectively. It was com-rehensible that PEC method provided the most powerful way toegrade MO due to the combination of electrochemical oxidationnd photocatalysis. Zhao et al. [44] successfully demonstrated theynergetic effect of combining electrochemical-oxidation and pho-olysis by using porous ZnWO4 photoanode to oxidize dye, Rh-B.he results showed that when the bias potential was greater than.3 V, indirect electrochemical-oxidation of Rh-B occurred with
he largest synergetic effect. Similar results were also shown inhis study. As the bias potential was applied, the photocatalyticegradation of MO was enhanced by promoting the separationnd isolation of photogenerated electrons and holes. Hole–electronnergy (eV)
Ti 2p, and (b) N1 s region of NTTF.
separation enhanced not only the electrochemical oxidation butalso the photocatalytic oxidation. For purpose of comparison, theMO degradation was 19.5 and 47.0% and the rate constant was6.83 × 10−5 and 1.52 × 10⁻⁴ s−1 for PC and EC, respectively. Theapplied voltage in EC method is a key factor regarding the degra-dation efficiency. For example, Zhao et al. [46] applied �-Bi2MoO6film electrode to examine the oxidation efficiency of Azo dye viaphotocatalysis degradation (irradiated by 150-W Xe lamp) andelectrochemical-oxidation (under bias potential of 3.0 V vs. SCE).Results showed that EC had better efficiency than PC. Hou et al.[55] studied the oxidation of Acid Orange � using nano-TiO2 parti-cles coated onto activated carbon fibers (TiO2/ACF) and comparedthe results of photoelectrochemical (PEC) and photocatalytic (PC)treatments. Results showed that PC (irradiated by 15-W UV254lamp) and PEC (under bias potential of 0.5 V vs. SCE) removed
77.8 and 90.0% AO� in 180 min, respectively. Above results illus-trated that, as the applied bias potential was below the redoxpotential of the target compound, increase in bias potential couldincrease the photocatalytic ability by promoting the separation and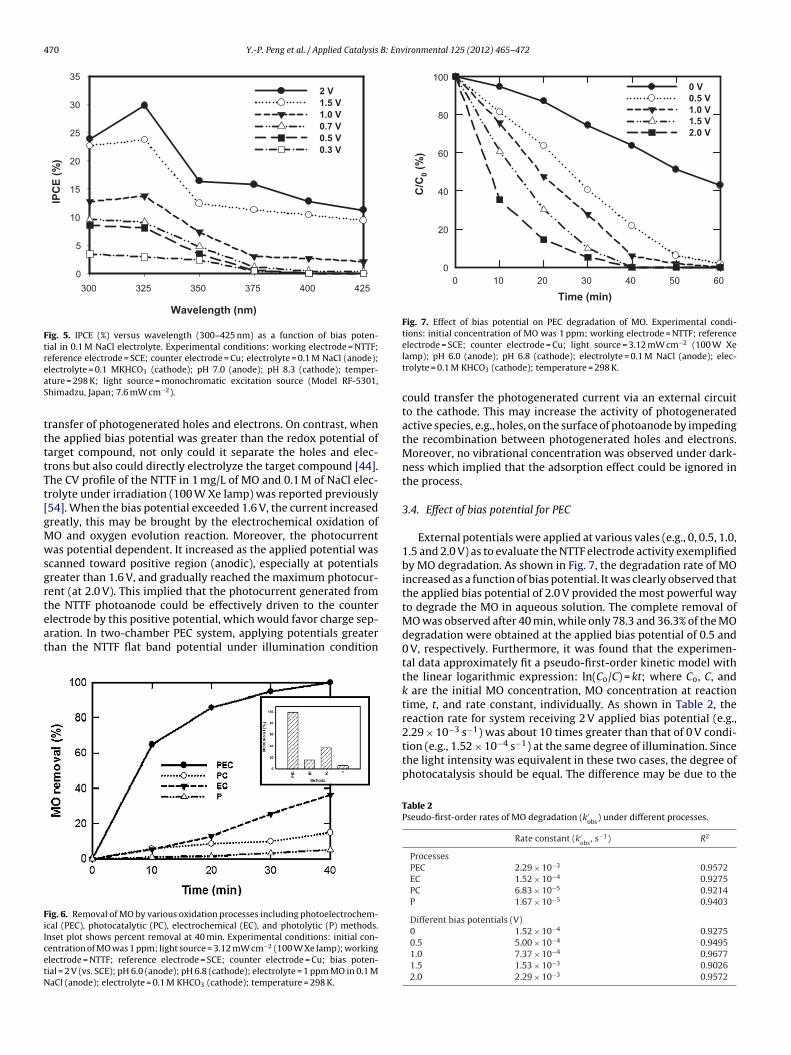
470 Y.-P. Peng et al. / Applied Catalysis B: Environmental 125 (2012) 465– 472
Waveleng th (nm )
425400375350325300
IPC
E (
%)
0
5
10
15
20
25
30
35
2 V
1.5 V
1.0 V
0.7 V
0.5 V
0.3 V
Fig. 5. IPCE (%) versus wavelength (300–425 nm) as a function of bias poten-tial in 0.1 M NaCl electrolyte. Experimental conditions: working electrode = NTTF;reference electrode = SCE; counter electrode = Cu; electrolyte = 0.1 M NaCl (anode);eaS
ttttTt[gMwsgrteat
FiIcetN
Time (min)
6050403020100
C/C
0 (
%)
0
20
40
60
80
100
0 V
0.5 V
1.0 V
1.5 V
2.0 V
Fig. 7. Effect of bias potential on PEC degradation of MO. Experimental condi-tions: initial concentration of MO was 1 ppm; working electrode = NTTF; reference
lectrolyte = 0.1 MKHCO3 (cathode); pH 7.0 (anode); pH 8.3 (cathode); temper-ture = 298 K; light source = monochromatic excitation source (Model RF-5301,himadzu, Japan; 7.6 mW cm−2).
ransfer of photogenerated holes and electrons. On contrast, whenhe applied bias potential was greater than the redox potential ofarget compound, not only could it separate the holes and elec-rons but also could directly electrolyze the target compound [44].he CV profile of the NTTF in 1 mg/L of MO and 0.1 M of NaCl elec-rolyte under irradiation (100 W Xe lamp) was reported previously54]. When the bias potential exceeded 1.6 V, the current increasedreatly, this may be brought by the electrochemical oxidation ofO and oxygen evolution reaction. Moreover, the photocurrentas potential dependent. It increased as the applied potential was
canned toward positive region (anodic), especially at potentialsreater than 1.6 V, and gradually reached the maximum photocur-ent (at 2.0 V). This implied that the photocurrent generated from
he NTTF photoanode could be effectively driven to the counterlectrode by this positive potential, which would favor charge sep-ration. In two-chamber PEC system, applying potentials greaterhan the NTTF flat band potential under illumination conditionig. 6. Removal of MO by various oxidation processes including photoelectrochem-cal (PEC), photocatalytic (PC), electrochemical (EC), and photolytic (P) methods.nset plot shows percent removal at 40 min. Experimental conditions: initial con-entration of MO was 1 ppm; light source = 3.12 mW cm−2 (100 W Xe lamp); workinglectrode = NTTF; reference electrode = SCE; counter electrode = Cu; bias poten-ial = 2 V (vs. SCE); pH 6.0 (anode); pH 6.8 (cathode); electrolyte = 1 ppm MO in 0.1 MaCl (anode); electrolyte = 0.1 M KHCO3 (cathode); temperature = 298 K.
electrode = SCE; counter electrode = Cu; light source = 3.12 mW cm−2 (100 W Xelamp); pH 6.0 (anode); pH 6.8 (cathode); electrolyte = 0.1 M NaCl (anode); elec-trolyte = 0.1 M KHCO3 (cathode); temperature = 298 K.
could transfer the photogenerated current via an external circuitto the cathode. This may increase the activity of photogeneratedactive species, e.g., holes, on the surface of photoanode by impedingthe recombination between photogenerated holes and electrons.Moreover, no vibrational concentration was observed under dark-ness which implied that the adsorption effect could be ignored inthe process.
3.4. Effect of bias potential for PEC
External potentials were applied at various vales (e.g., 0, 0.5, 1.0,1.5 and 2.0 V) as to evaluate the NTTF electrode activity exemplifiedby MO degradation. As shown in Fig. 7, the degradation rate of MOincreased as a function of bias potential. It was clearly observed thatthe applied bias potential of 2.0 V provided the most powerful wayto degrade the MO in aqueous solution. The complete removal ofMO was observed after 40 min, while only 78.3 and 36.3% of the MOdegradation were obtained at the applied bias potential of 0.5 and0 V, respectively. Furthermore, it was found that the experimen-tal data approximately fit a pseudo-first-order kinetic model withthe linear logarithmic expression: ln(Co/C) = kt; where Co, C, andk are the initial MO concentration, MO concentration at reactiontime, t, and rate constant, individually. As shown in Table 2, thereaction rate for system receiving 2 V applied bias potential (e.g.,
2.29 × 10⁻³ s−1) was about 10 times greater than that of 0 V condi-tion (e.g., 1.52 × 10⁻⁴ s−1) at the same degree of illumination. Sincethe light intensity was equivalent in these two cases, the degree ofphotocatalysis should be equal. The difference may be due to theTable 2Pseudo-first-order rates of MO degradation (k′
obs) under different processes.
Rate constant (k′obs
, s−1) R2
ProcessesPEC 2.29 × 10⁻³ 0.9572EC 1.52 × 10⁻⁴ 0.9275PC 6.83 × 10⁻⁵ 0.9214P 1.67 × 10⁻⁵ 0.9403
Different bias potentials (V)0 1.52 × 10⁻⁴ 0.92750.5 5.00 × 10⁻⁴ 0.94951.0 7.37 × 10⁻⁴ 0.96771.5 1.53 × 10⁻³ 0.90262.0 2.29 × 10⁻³ 0.9572
Y.-P. Peng et al. / Applied Catalysis B: Environmental 125 (2012) 465– 472 471
egrad
fpaeg(asT
e
wb(swveb0ateiptarcZlptap
3
itdgMhd
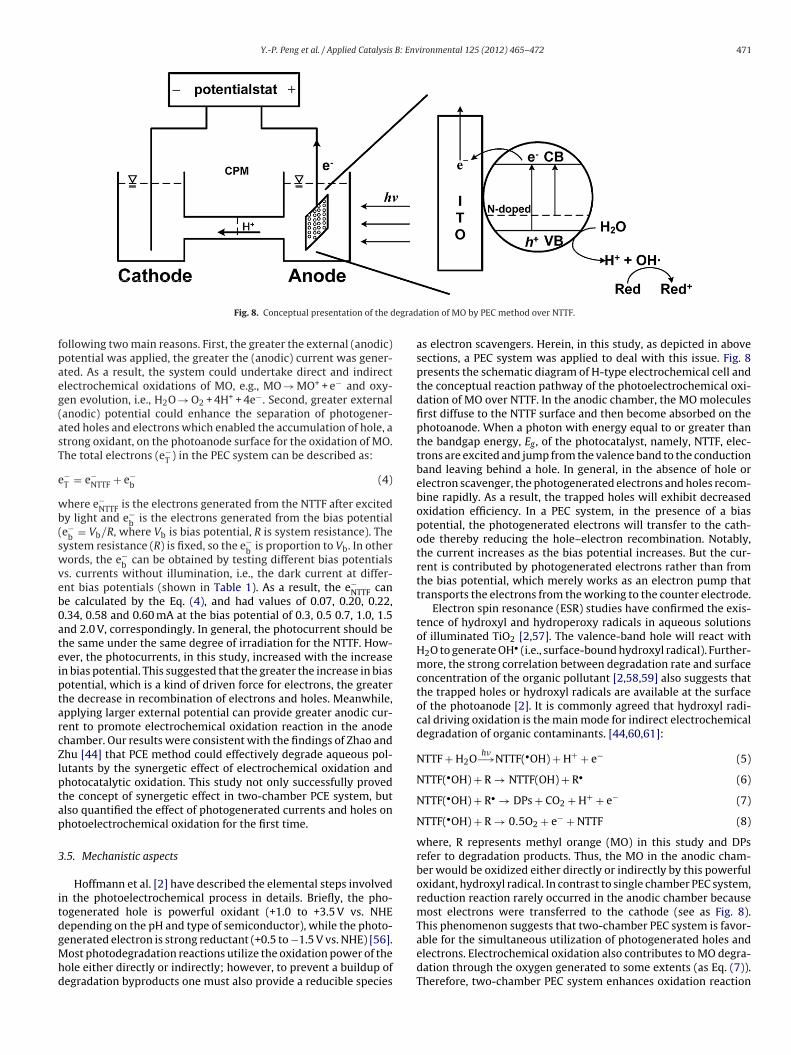
Fig. 8. Conceptual presentation of the d
ollowing two main reasons. First, the greater the external (anodic)otential was applied, the greater the (anodic) current was gener-ted. As a result, the system could undertake direct and indirectlectrochemical oxidations of MO, e.g., MO → MO+ + e− and oxy-en evolution, i.e., H2O → O2 + 4H+ + 4e−. Second, greater externalanodic) potential could enhance the separation of photogener-ted holes and electrons which enabled the accumulation of hole, atrong oxidant, on the photoanode surface for the oxidation of MO.he total electrons (e−
T ) in the PEC system can be described as:
−T = e−
NTTF + e−b (4)
here e−NTTF is the electrons generated from the NTTF after excited
y light and e−b is the electrons generated from the bias potential
e−b = Vb/R, where Vb is bias potential, R is system resistance). The
ystem resistance (R) is fixed, so the e−b is proportion to Vb. In other
ords, the e−b can be obtained by testing different bias potentials
s. currents without illumination, i.e., the dark current at differ-nt bias potentials (shown in Table 1). As a result, the e−
NTTF cane calculated by the Eq. (4), and had values of 0.07, 0.20, 0.22,.34, 0.58 and 0.60 mA at the bias potential of 0.3, 0.5 0.7, 1.0, 1.5nd 2.0 V, correspondingly. In general, the photocurrent should behe same under the same degree of irradiation for the NTTF. How-ver, the photocurrents, in this study, increased with the increasen bias potential. This suggested that the greater the increase in biasotential, which is a kind of driven force for electrons, the greaterhe decrease in recombination of electrons and holes. Meanwhile,pplying larger external potential can provide greater anodic cur-ent to promote electrochemical oxidation reaction in the anodehamber. Our results were consistent with the findings of Zhao andhu [44] that PCE method could effectively degrade aqueous pol-utants by the synergetic effect of electrochemical oxidation andhotocatalytic oxidation. This study not only successfully provedhe concept of synergetic effect in two-chamber PCE system, butlso quantified the effect of photogenerated currents and holes onhotoelectrochemical oxidation for the first time.
.5. Mechanistic aspects
Hoffmann et al. [2] have described the elemental steps involvedn the photoelectrochemical process in details. Briefly, the pho-ogenerated hole is powerful oxidant (+1.0 to +3.5 V vs. NHEepending on the pH and type of semiconductor), while the photo-
enerated electron is strong reductant (+0.5 to −1.5 V vs. NHE) [56].ost photodegradation reactions utilize the oxidation power of theole either directly or indirectly; however, to prevent a buildup ofegradation byproducts one must also provide a reducible species
ation of MO by PEC method over NTTF.
as electron scavengers. Herein, in this study, as depicted in abovesections, a PEC system was applied to deal with this issue. Fig. 8presents the schematic diagram of H-type electrochemical cell andthe conceptual reaction pathway of the photoelectrochemical oxi-dation of MO over NTTF. In the anodic chamber, the MO moleculesfirst diffuse to the NTTF surface and then become absorbed on thephotoanode. When a photon with energy equal to or greater thanthe bandgap energy, Eg, of the photocatalyst, namely, NTTF, elec-trons are excited and jump from the valence band to the conductionband leaving behind a hole. In general, in the absence of hole orelectron scavenger, the photogenerated electrons and holes recom-bine rapidly. As a result, the trapped holes will exhibit decreasedoxidation efficiency. In a PEC system, in the presence of a biaspotential, the photogenerated electrons will transfer to the cath-ode thereby reducing the hole–electron recombination. Notably,the current increases as the bias potential increases. But the cur-rent is contributed by photogenerated electrons rather than fromthe bias potential, which merely works as an electron pump thattransports the electrons from the working to the counter electrode.
Electron spin resonance (ESR) studies have confirmed the exis-tence of hydroxyl and hydroperoxy radicals in aqueous solutionsof illuminated TiO2 [2,57]. The valence-band hole will react withH2O to generate OH• (i.e., surface-bound hydroxyl radical). Further-more, the strong correlation between degradation rate and surfaceconcentration of the organic pollutant [2,58,59] also suggests thatthe trapped holes or hydroxyl radicals are available at the surfaceof the photoanode [2]. It is commonly agreed that hydroxyl radi-cal driving oxidation is the main mode for indirect electrochemicaldegradation of organic contaminants. [44,60,61]:
NTTF + H2Oh�−→NTTF(•OH) + H+ + e− (5)
NTTF(•OH) + R → NTTF(OH) + R• (6)
NTTF(•OH) + R• → DPs + CO2 + H+ + e− (7)
NTTF(•OH) + R → 0.5O2 + e− + NTTF (8)
where, R represents methyl orange (MO) in this study and DPsrefer to degradation products. Thus, the MO in the anodic cham-ber would be oxidized either directly or indirectly by this powerfuloxidant, hydroxyl radical. In contrast to single chamber PEC system,reduction reaction rarely occurred in the anodic chamber becausemost electrons were transferred to the cathode (see as Fig. 8).This phenomenon suggests that two-chamber PEC system is favor-
able for the simultaneous utilization of photogenerated holes andelectrons. Electrochemical oxidation also contributes to MO degra-dation through the oxygen generated to some extents (as Eq. (7)).Therefore, two-chamber PEC system enhances oxidation reaction
4 B: Env
vt
4
tasaalstttcwNtdwtadcattgaar
A
TJle
R
[[[
[
[
[
[
[[[
[
[[
[
[
[
[
[
[
[
[[
[
[[[
[
[
[
[
[
[
[
[
[[
[
[
[[
[
[
[
[
[
[
[
[[[
72 Y.-P. Peng et al. / Applied Catalysis
ia the combination of electrochemical and photocatalytic reac-ions.
. Conclusion
A nitrogen doped TiO2 thin film (NTTF) was synthesized usinghe pulsed laser deposition method. The prepared NTFF was char-cterized using XRD, UV–vis absorbance edges, SEM, and XPS. Afterintered at 600 ◦C, the NTTF was dominated by anatase phase,ccording to the XRD results matched with JCPDS-784486. Anmount of 3 at% of N was doped into the NTTF structure by theinkage of Ti O N and N Ti O bond, leading to the absorbancehoulders exhibited at wavelength of 595 nm, which indicatedhat NTTF could be excited in visible light region. In addition,he nitrogen-doped TiO2 nanoparticles spread uniformly overhe ITO glass surface which is favorable for photoelectrochemi-al applications. Incident photon conversion efficiency (IPCE (�))as applied to evaluate the photoelectrochemical efficiency ofTTF. The highest photo-response was obtained at 325 nm, i.e.,
he maximum IPCE (�) value of 26.77% was observed at the irra-iation of 325 nm and a bias potential of 2.0 V. This materialas then used as a photoanode in the photoelectrochemical sys-
em. Among photoelectrochemical, photocatalytic, electrochemicalnd photolysis methods, PEC showed the most efficient way inegrading methyl orange. The synergetic effect between electro-hemical and photocatalytic method was quantified as 0.07 mAt 0.3 V bias potential and 0.6 mA at 2.0 V bias potential, respec-ively. In the present PEC system, most electrons were transferredo the cathode, which can minimize the recombination of photo-enerated electrons and holes thereby increase the photoefficiencynd enables the simultaneous utilization of photogenerated holesnd electrons for performing separate oxidation and reductioneactions.
cknowledgments
The senior author wishes to thank National Science Council inaiwan for the grant of Fellowship (NSC982917I564109). Professor.H. Choi of Kongju National University in Korea provided excel-ent comments on the CV plots. Po-Yen Wang assisted us with PECxperiments.
eferences
[1] A. Hagfeldt, M. Gratzel, Chemical Reviews 95 (1995) 49–68.[2] M.R. Hoffmann, S.T. Martin, W.Y. Choi, D.W. Bahnemann, Chemical Reviews 95
(1995) 69–96.[3] A.L. Linsebigler, G.Q. Lu, J.T. Yates, Chemical Reviews 95 (1995) 735–758.[4] G. Rothenberger, J. Moser, M. Gratzel, N. Serpone, D.K. Sharma, Journal of the
American Chemical Society 107 (1985) 8054–8059.[5] J.C. Tristao, F. Magalhaes, P. Corio, M.T.C. Sansiviero, Journal of Photochemistry
and Photobiology A: Chemistry 181 (2006) 152–157.[6] A. Kongkanand, K. Tvrdy, K. Takechi, M. Kuno, P.V. Kamat, Journal of the Amer-
ican Chemical Society 130 (2008) 4007–4015.[7] H. Lin, C.P. Huang, W. Li, C. Ni, S.I. Shah, Y.-H. Tseng, Applied Catalysis B: Envi-
ronmental 68 (2006) 1–11.[8] K.M. Parida, N. Sahu, A.K. Tripathi, V.S. Kamble, Environmental Science and
Technology 44 (2010) 4155–4160.[9] Y. Bai, Y. Cao, J. Zhang, M. Wang, R. Li, P. Wang, S.M. Zakeeruddin, M. Gratzel,
Nature Materials 7 (2008) 626–630.10] X. Chen, S.S. Mao, Chemical Reviews 107 (2007) 2891–2959.11] R. Asahi, T. Morikawa, T. Ohwaki, K. Aoki, Y. Taga, Science 293 (2001) 269–271.12] B. Farkas, J. Budai, I. Kabalci, P. Heszler, Z. Geretovszky, Applied Surface Science
254 (2008) 3484–3488.13] T. Lindgren, J.M. Mwabora, E. Avendano, J. Jonsson, A. Hoel, C.G.
Granqvist, S.E. Lindquist, Journal of Physical Chemistry B 107 (2003)
5709–5716.14] S.H. Lee, E. Yamasue, K.N. Ishihara, H. Okumura, Applied Catalysis B: Environ-mental 93 (2010) 217–226.
15] Y.P. Peng, S.L. Lo, F.H. Ou, S.W. Lai, Journal of Hazardous Materials 183 (2010)754–758.
[
[
ironmental 125 (2012) 465– 472
16] Y. Suda, H. Kawasaki, T. Ueda, T. Ohshima, Thin Solid Films 453–454 (2004)162–166.
17] Y. Suda, H. Kawasaki, T. Ueda, T. Ohshima, Thin Solid Films 475 (2005) 337–341.18] L. Zhao, Q. Jiang, J. Lian, Applied Surface Science 254 (2008) 4620–4625.19] N. Sato, M. Matsuda, M. Yoshinaga, T. Nakamura, S. Sato, A. Muramatsu, Topics
in Catalysis 52 (2009) 1592–1597.20] G. Socol, Y. Gnatyuk, N. Stefan, N. Smirnova, V. Djokic, C. Sutan, V. Mali-
novschi, A. Stanculescu, O. Korduban, I.N. Mihailescu, Thin Solid Films 518(2010) 4648–4653.
21] N. Ozer, H. Demiryont, J.H. Simmons, Applied Optics 30 (1991) 3661–3666.22] J.A. Byrne, B.R. Eggins, S. Linquette-Mailley, P.S.M. Dunlop, Analyst 123 (1998)
2007–2012.23] N. Rausch, E.P. Burte, Journal of the Electrochemical Society 140 (1993)
145–149.24] T. Nakamura, T. Ichitsubo, E. Matsubara, A. Muramatsu, N. Sato, H. Takahashi,
Acta Materialia 53 (2005) 323–329.25] H. Lin, A.K. Rumaiz, M. Schulz, D. Wang, R. Rock, C.P. Huang, S.I. Shah, Materials
Science and Engineering: B 151 (2008) 133–139.26] E. Gyorgy, G. Socol, E. Axente, I.N. Mihailescu, C. Ducu, S. Ciuca, Applied Surface
Science 247 (2005) 429–433.27] V.C. Nogueira, C. Longo, A.F. Nogueira, M.A. Soto-Oviedo, M.A. De Paoli, Journal
of Photochemistry and Photobiology A: Chemistry 181 (2006) 226–232.28] S. Nakade, T. Kanzaki, S. Kambe, Y.J. Wada, S. Yanagida, Langmuir 21 (2005)
11414–11417.29] B. Zhou, M. Schulz, H.Y. Lin, S.I. Shah, J.H. Qu, C.P. Huang, Applied Catalysis B:
Environmental 92 (2009) 41–49.30] O. Khaselev, J.A. Turner, Science 280 (1998) 425–427.31] Y. Sun, C.J. Murphy, K.R. Reyes-Gil, E.A. Reyes-Garcia, J.P. Lilly, D. Raftery, Inter-
national Journal of Hydrogen Energy 33 (2008) 5967–5974.32] A. Wolcott, W.A. Smith, T.R. Kuykendall, Y.P. Zhao, J.Z. Zhang, Advanced Func-
tional Materials 19 (2009) 1849–1856.33] M. Halmann, Nature 275 (1978) 115–116.34] T. Inoue, A. Fujishima, S. Konishi, K. Honda, Nature 277 (1979) 637–638.35] E.B. Cole, P.S. Lakkaraju, D.M. Rampulla, A.J. Morris, E. Abelev, A.B. Bocarsly,
Journal of the American Chemical Society 132 (2010) 11539–11551.36] T. Arai, S. Sato, K. Uemura, T. Morikawa, T. Kajino, T. Motohiro, Chemical Com-
munications 46 (2010) 6944–6946.37] V. Subramanian, E. Wolf, P.V. Kamat, Journal of Physical Chemistry B 105 (2001)
11439–11446.38] D.C. Schmelling, K.A. Gray, P.V. Kamat, Environmental Science and Technology
30 (1996) 2547–2555.39] D.L. Jiang, S.Q. Zhang, H.J. Zhao, Environmental Science and Technology 41
(2007) 303–308.40] S. Somasundaram, C.R. Chenthamarakshan, N.R. de Tacconi, Y. Ming, K. Rajesh-
war, Chemistry of Materials 16 (2004) 3846–3852.41] S.H. Xiao, J.H. Qu, X. Zhao, H.J. Liu, D.J. Wan, Water Research 43 (2009)
1432–1440.42] X.F. Cheng, W.H. Leng, D.P. Liu, Y.M. Xu, J.Q. Zhang, C.N. Cao, Journal of Physical
Chemistry C 112 (2008) 8725–8734.43] Z.H. Zhang, Y. Yuan, G.Y. Shi, Y.J. Fang, L.H. Liang, H.C. Ding, L.T. Jin, Environ-
mental Science and Technology 41 (2007) 6259–6263.44] X. Zhao, Y.F. Zhu, Environmental Science and Technology 40 (2006) 3367–3372.45] R.T. Pelegrini, R.S. Freire, N. Duran, R. Bertazzoli, Environmental Science and
Technology 35 (2001) 2849–2853.46] X. Zhao, J.H. Qu, H.J. Liu, C. Hu, Environmental Science and Technology 41 (2007)
6802–6807.47] M. Gopal, W.J.M. Chan, L.C. DeJonghe, Journal of Materials Science 32 (1997)
6001–6008.48] J.I. Pankove, Optical Process in Semiconductors, Dover Publications, NJ, 1971.49] G.S. Shao, F.Y. Wang, T.Z. Ren, Y.P. Liu, Z.Y. Yuan, Applied Catalysis B: Environ-
mental 92 (2009) 61–67.50] M. Bellardita, M. Addamo, A. Di Paola, L. Palmisano, A.M. Venezia, Physical
Chemistry Chemical Physics 11 (2009) 4084–4093.51] H.-H. Ou, S.-L. Lo, C.-H. Liao, The Journal of Physical Chemistry C 115 (2011)
4000–4007.52] S. Livraghi, M.R. Chierotti, E. Giamello, G. Magnacca, M.C. Paganini, G.
Cappelletti, C.L. Bianchi, The Journal of Physical Chemistry C 112 (2008)17244–17252.
53] H. Irie, Y. Watanabe, K. Hashimoto, Journal of Physical Chemistry B 107 (2003)5483–5486.
54] Y.P. Peng, Y.T. Yeh, S.I. Shah, C.P. Huang, Applied Catalysis B: Environmental123-124 (2012) 414–423.
55] Y.I. Hou, J.H. Qu, X. Zhao, P.J. Lei, D.J. Wan, C.P. Huang, Science of the TotalEnvironment 407 (2009) 2431–2439.
56] M. Gratzel, Heterogeneous Photochemical Electron Transfer, CRC Press, BocaRaton, FL, 1989.
57] C.D. Jaeger, A.J. Bard, The Journal of Physical Chemistry 83 (1979) 3146–3152.58] S. Tunesi, M. Anderson, The Journal of Physical Chemistry 95 (1991) 3399–3405.59] C. Kormann, D.W. Bahnemann, M.R. Hoffmann, Environmental Science and
Technology 25 (1991) 494–500.60] M. Zhou, Q. Dai, L. Lei, C.a. Ma, D. Wang, Environmental Science and Technology
39 (2004) 363–370.61] J.M. Kesselman, N.S. Lewis, M.R. Hoffmann, Environmental Science and Tech-
nology 31 (1997) 2298–2302.
Related Documents