STRUCTURAL OPTIMISATION USING THE PRINCIPLE OF VIRTUAL WORK Richard Shaun Walls A dissertation submitted to the Faculty of Engineering and the Built Environment, University of the Witwatersrand, in fulfilment of the requirements for the degree Masters of Science in Engineering. Johannesburg, 2010.

Welcome message from author
This document is posted to help you gain knowledge. Please leave a comment to let me know what you think about it! Share it to your friends and learn new things together.
Transcript
STRUCTURAL OPTIMISATION USING THE PRINCIPLEOF VIRTUAL WORK
Richard Shaun Walls
A dissertation submitted to the Faculty of Engineering and the BuiltEnvironment, University of the Witwatersrand, in fulfilment of therequirements for the degree Masters of Science in Engineering.
Johannesburg, 2010.
I
DECLARATION
I declare that this dissertation is my own unaided work. It is being submitted to
the Degree of Master of Science to the University of the Witwatersrand,
Johannesburg. It has not been submitted before for any degree or examination to
any other University.
……………………………………………………………………………………
Richard Shaun Walls
……… day of ………………… year …………….
II
ABSTRACT
This dissertation presents a new method for the automated optimisation of
structures. The method has been developed to: (1) select sections to satisfy
strength and deflection requirements using minimum material, and (2) efficiently
group members.
The member selection method is based on the principle of virtual work, and is
called the Virtual Work Optimisation (VWO) method. It addresses multiple
deflection and load case constraints simultaneously. The method determines
which sections provide the highest deflection and strength resistance per unit
mass. When compared to several other methods in the literature, and designs from
industry, the VWO method produced savings of up to 15.1%.
A parametric investigation of ungrouped, multi-storey frames is conducted using
the VWO method to determine optimal mass and stiffness distributions. Unusual
mass patterns have been found. Diagonal paths of increased stiffness are formed
in the frames, which suggests truss behaviour.
A grouping algorithm is presented which determines how efficiently to create a
specified number of groups in a structure. The VWO method has been
incorporated into the automated algorithm to optimise the grouped structures.
Members are grouped according to their mass per unit length. In the algorithm an
exhaustive search of all feasible grouping permutations is carried out, and the
lightest structure selected. Results produced are up to 5.9% lighter than those
obtained using ad hoc grouping configurations found in the literature and based
on experience.
III
ACKNOWLEDGEMENTS
I would like to thank:
My supervisor, Prof. Alex Elvin, for the support and assistance received
while completing this degree.
My parents for the guidance and support throughout the course of doing all
my studies.
The SA Institute of Steel Construction (SAISC), especially Mr. Spencer
Erling and Dr. Hennie de Clercq, for guidance received while conducting
this research and developing ideas.
Daniel Cromberge, for the assistance in 2008 during the initial stages of
this research.
BSM Baker, my bursary company, for allowing me to spend this year
doing my masters degree.
My Lord and Saviour Jesus Christ, for giving me the ability and
opportunity to do this MSc.
IV
CONTENTS Page
DECLARATION IABSTRACT IIACKNOWLEDGEMENTS IIITABLE OF CONTENTS IVLIST OF FIGURES VIILIST OF TABLES XLIST OF EQUATIONS XILIST OF SYMBOLS XIIPREFACE – NOTE ON THE PUBLICATION OF PAPERS XIII
1 INTRODUCTION 1
1.1 Introduction to automated structural design 1
1.2 The need for better optimisation methods 1
1.3 An overview of optimisation literature 2
1.4 Definitions of terms used 4
1.5 Limitations of the research 4
1.6 Dissertation organisation 4
1.7 References 5
2 OPTIMISING STRUCTURES WITH SINGLE DISPLACEMENT
CRITERIA 8
2.1 Introduction 8
2.2 The principle of virtual work 9
2.3 The Virtual Work Optimisation Method 11
2.3.1 Satisfying strength requirements 12
2.3.2 Meeting Deflection Criteria and Optimising the Structure 13
2.3.3 The Optimisation Curve 14
2.3.4 A Note on Increment Size 15
2.3.5 A Note on Member Groups 16
2.4 Case Studies 16
2.4.1 Ten Member Benchmark Truss 17
2.4.2 Truss Frame 20
2.4.3 Multi-Storey Building 24
V
2.5 Effect of Initial Member Sections 27
2.6 Effect of Deflection Increment Size 28
2.7 Conclusion 29
2.8 References 30
3 OPTIMISING STRUCTURES SUBJECT TO MULTIPLE
DEFLECTION CONSTRAINTS AND LOAD CASES 32
3.1 Introduction 32
3.2 The Virtual Work Optimisation (VWO) Method 33
3.2.1 Step 0 – Setting optimisation parameters 34
3.2.2 Step 1 – Satisfying strength requirements 34
3.2.3 Step 2 – Reducing deflections 35
3.2.4 Step 3 – Adjusting member sections 37
3.3 Other measures of efficiency 40
3.4 Advantages of the VWO method 41
3.5 Limitations to the VWO method 42
3.6 Case studies 42
3.6.1 60 Storey Building 43
3.6.2 Industrial warehouse with gantry cranes 46
3.6.3 Stepped Cantilever 48
3.7 Conclusion 50
3.8 References 51
CHAPTER 4: MASS AND STIFFNESS DISTRIBUTIONS IN OPTIMISED
UNRGOUPED FRAMES 52
4.1 Introduction 52
4.2 The optimisation method 53
4.3 A comparison between grouped and ungrouped structures 53
4.4 Parametric investigation of optimised ungrouped structures 56
4.5 Distributions of stiffness and mass 58
4.6 Discussion 62
4.7 Conclusion 66
4.8 References 67
VI
5 AN ALGORITHM FOR GROUPING MEMBERS IN A STRUCTURE
68
5.1 Introduction 68
5.2 Limitations of grouping methods found in the literature 69
5.3 Grouping members according to mass per unit length 70
5.4 Single and multi step grouping 71
5.5 The Single Step Grouping Algorithm 71
5.5.1 Step 0 – Setting grouping parameters 71
5.5.2 Step 1 – Obtaining the initial, ungrouped solution 71
5.5.3 Step 2 – Investigating grouping configurations 72
5.5.4 Step 3 – Selecting a new grouping configuration 74
5.5.5 Step 4 – Ensuring design constraints are satisfied 74
5.6 Using multiple section types – a further constraint 75
5.7 Illustrative Example 76
5.8 Optimization considerations 78
5.9 Reducing computational costs 79
5.10 Advantages of the algorithm 80
5.11 Limitations of the method 81
5.12 Case Studies 81
5.12.1 Stepped cantilever 81
5.12.2 15 Storey 5 bay frame 83
5.12.3 Truss 86
5.12.4 Warehouse 88
5.13 Conclusion 90
5.14 References 91
CHAPTER 6: CONCLUSIONS 93
6.1 Development of the Virtual Work Optimisation Method 93
6.2 The VWO method for multi-deflection criteria structures 94
6.3 Applications of the VWO method – Mass distributions in ungrouped
frames 94
6.4 Optimisation of member groupings 94
VII
6.5 Limitations of the research 95
6.6 Future research 95
LIST OF FIGURES Page
2.1 Idealised optimisation curve 15
2.2 Ten member truss used as a benchmark for optimisation methods 17
2.3 Optimisation curve for the benchmark ten member truss 18
2.4 Benchmark ten member truss solution 20
2.5 Truss frame case study 21
2.6 Optimisation curves for the second case study of the truss frame. 22
2.7 Deflection contributions in the truss frame 23
2.8 The VWO method solution of the truss frame 24
2.9 Multi storey frame building to be optimised by the VWO method 25
2.10 Optimisation curves for the 24 storey frame structure 26
2.11 24 storey frame solution showing the deflection contribution of members
to the overall horizontal deflection of the top storey 27
2.12 Optimisation curves for assumed different start point 28
2.13 Optimisation curves for different deflection increments 29
3.1 Portal frame case study 34
3.2 Deflection contributions in the portal frame 36
3.3 60-storey, 7-bay framework example 43
3.4 Optimisation graph for the 60-storey framework 45
3.5 Deflection contributions of the 60-storey framework 46
3.6 Warehouse with gantry cranes designed by professional engineers 47
3.7 Final mass distribution in the warehouse 48
3.8 Deflection contribution of members in the warehouse 48
3.9 Stepped Cantilever geometry and specifications 49
4.1 60-storey 7-bay structure case study of Chan (1992) 54
4.2 Total mass of each floor for the 60 storey structure. 55
4.3 Total stiffness of each floor for the 60 storey structure. 55
VIII
4.4 Mass distribution in the grouped 60-storey structure 56
4.5 Mass distribution in the ungrouped 60-storey structure. 56
4.6 Layout of structures to be optimised 57
4.7 Plot of the mass of each storey for the 5-storey 1-bay, and 10-storey 2-bay
frames 59
4.8 Plot of the stiffness of each storey for the 5-storey 1-bay, and 10-storey 2-
bay frames 59
4.9 Plot of the mass of each storey for the 20-storey 2-bay, 30-storey 4-bay
and 30-storey 6-bay frames 59
4.10 Plot of the stiffness of each storey for the 20-storey 2-bay, 30-storey 4-bay
and 30-storey 6-bay frames 59
4.11 Mass distribution for case study 1 - 5-storey 1-bay frame 60
4.12 Mass distribution for case study 2 - 10-storey 2-bay frame 60
4.13 Mass distribution for case study 3 - 20-storey 3-bay frame 61
4.14 Mass distribution for case study 4 - 30-storey 4-bay frame 61
4.15 Mass distribution for case study 5 - 30-storey 6-bay frame 62
4.16 Comparison of storey masses for the 5-storey, 1-bay and 10-storey, 2-bay
frames with fixed and pinned bases 63
4.17 Comparison of storey stiffnesses for the 5-storey, 1-bay and 10-storey, 2-
bay frames with fixed and pinned bases 63
4.18 Comparison of storey masses for the 20-storey, 3-bay and 10-storey, 4-bay
frames with fixed and pinned bases 63
4.19 Comparison of storey stiffnesses for the 20-storey, 3-bay and 10-storey, 4-
bay frames with fixed and pinned bases 63
4.20 Truss behaviour of the case studies 65
5.1 Two-storey frame to be grouped 77
5.2 Mass distribution in the two-storey ungrouped frame 77
5.3 Comparison of the number of initial sections to the number of
configurations to be investigated for fixed values of i and n. 80
5.4 Stepped cantilever beam case study 81
IX
5.5 Comparison of grouped masses for the cantilever with 5 and 100 initial
sections 83
5.6 20 storey 5 bay frame case study 85
5.7 Optimized 15 storey structure with groups across 3 floors 86
5.8 Optimized 15 storey frame with groups computed by the developed
algorithm 86
5.9 Truss – geometry and loading 86
5.10 Ad hoc # 1 – mass distribution 87
5.11 Ad hoc # 2 – mass distribution 87
5.12 Algorithm grouping 87
5.13 Warehouse with dead, live, crane and wind loads 88
5.14 Warehouse with final grouping specified by the engineers 89
5.15 Warehouse with final grouping computed by the algorithm 90
6.1 Flow diagram of the development and application of the VWO method in
this dissertation 93
X
LIST OF TABLES Page
2.1 The VWO method compared to the results of the EDM and CSA 19
2.2 Comparison of the solutions for the truss frame case study. 22
2.3 Comparison of the VWO method to the published results for the multi-
storey frame building. 25
3.1 Calculations for changing the section of the portal frame's rafters at
iteration 1 39
3.2 Summary of the optimisation of the portal frame 40
3.3 Comparison of results for the 60-storey building 44
3.4 Summary of the warehouse optimization 47
3.5 Optimisation results for the Stepped Cantilever 50
4.1 Summary of case studies investigated and the optimisation results 58
5.1 Possible number of grouping configurations 73
5.2 The possible permutations for creating 3 groups from 7 members. 74
5.3 Mass and lengths of members for the ungrouped, optimized structure
shown in Figure 4.1 76
5.4 Possible grouping configurations for the 2 storey frame and their mass
estimates 78
5.5 Final masses for various grouping configurations of the cantilever 82
5.6 Final masses and section lengths for the cantilever 83
5.7 Results for the 15 storey frame 85
5.8 Results for the optimized the truss 88
5.9 Results for the warehouse 89
XI
LIST OF EQUATIONS Page
2.1 The principle of virtual work 9
2.2 Total deflection of a point with deflection contributions 10
2.3 Total deflection of a point 10
2.4 Deflection contribution of a member 11
2.5 Axial and deflection contributions 11
2.6 Factoring deflection contributions 13
2.7 Efficiency of a change for a single section deflection point 13
3.1 Total deflection of a critical point 35
3.2 Total deflection of a point with deflection contributions 35
3.3 Factoring deflection contributions 36
3.4 Deflection reduction resulting from a section change 36
3.5 Total change in mass for a section change 37
3.6 Efficiency for a section change for multiple deflection points 37
3.7 Number of changes to be tested 38
3.8 Single deflection point efficiency equation 41
3.9 Unweighted efficiency equation 41
5.1 Number of permutations to be tested by the grouping algorithm 72
5.2 Total predicted mass of a grouped structure 74
5.3 Selecting the minimum mass structure 74
5.4 Total number of permutations to be investigated 75
5.5 Total mass of a grouped structure with multiple section types 75
XII
LIST OF SYMBOLS
A Cross-sectional area
E Young’s modulus
Efficiency The efficiency of a section change
f Axial force in a member due a unit load
F Axial force in a member due to an applied system of loads
F Virtual point force
G Shear modulus
i Number of initial sections in a structure
I Second moment of area
J Polar second moment of area
L Length
m Moment in a member due a unit load
m Mass per unit length of a member
M Moment in a member due to an applied system of loads
M Total mass of a grouped structure
n Number of groups to be created by the grouping algorithm
N Number of grouping permutations
NC Number of section changes that must be tested
q Shear force in a member due a unit load
Q Shear force in a member due to an applied system of loads
t Torsion a member due a unit load
T Torsion in a member due to an applied system of loads
V Volume
X Radius of search space to be investigated by the grouping algorithm
δ Deflection contribution of a member
Δ Deflection of a critical point
ΔDecrease Deflection decrease due to a section change
ΔTarget Target deflection of a critical point
ΔM Total mass change due to a section change
XIII
PREFACE – Note on the publication of journal articles
The following chapters from this dissertation have been submitted as papers to
journals:
Chapter 2
Title: “Optimising Structures Using the Principle of Virtual Work”
Status: Published in the South Africa Institute of Civil Engineers (SAICE)
Journal, October 2009 edition. (Vol. 51, No. 2, Pg 11-19, Paper 707).
Authors: Elvin, A.A., Walls, R.S. and Cromberge D.M.
Chapter 3
Title: “Optimizing Structures Subject to Multiple Deflection Constraints and
Load Cases using the Principle of Virtual Work”
Status: Under review: Journal of Structural Engineering, ASCE.
Authors: Walls, R.S. and Elvin A.A.
Title: Automated Structural Design and Optimisation
Status: Accepted to be published in The Structural Engineer – Journal of the
Institute of Structural Engineers (IStructE, UK).
Authors: Walls, R.S. and Elvin A.A.
Chapter 4
Title: “Mass and stiffness distributions in optimized ungrouped frames”
Status: Under review: International Journal of Steel Structures
Authors: Walls, R.S. and Elvin A.A.
Chapter 5
Title: “An Algorithm for Grouping Members in a Structure”
Status: Under review: Engineering Structures.
Authors: Walls, R.S. and Elvin A.A.
XIV
The following papers have been provisionally accepted to the Fourth International
Structural Engineering, Mechanics and Computation Conference in 2010:
Title: The Virtual Work Optimisation Method Applied to Structures
Title: Grouping Members in a Structure
The following non-refereed paper is based on the research presented in this
dissertation:
Title: Automating Structural Design – Getting Computers to Design
Status: Published in the Southern African Institute of Steel Construction Journal.
Vol. 33, No. 3, May 2009.
Authors: Walls, R.S. and Elvin A.A.
1/96
CHAPTER 1: INTRODUCTION
This dissertation presents a new method for the automated design and optimisation of
structures. The method is based on the principle of virtual work. Structural masses
are minimised by efficiently selecting sections for members, and grouping members
together.
1.1 Introduction to automated structural design
The design process in structural engineering is time-consuming, iterative and
significantly affects the total cost of the project. Even though great advances have
been made in automating the design process an effective and a general structural
optimisation method is not available yet.
The design of a structure is primarily governed by strength and flexibility
requirements, and a design must satisfy budget constraints. Automating the selection
of sections to satisfy strength requirements is a straightforward task, and numerous
software packages have this capability. However, satisfying flexibility, or deflection,
constraints is much more complex, and is often not done at all or done poorly. For
every change in a statically indeterminate structure a redistribution of force occurs
which cannot be accurately predicted without reanalysing the structure. This makes it
impossible to determine member sizes in a single step, and iterative methods are
required. Structures with more than a few members have prohibitively large search
spaces, so exhaustive searches cannot be carried out. However, even if members are
correctly sized solutions obtained may not be optimal because of the member
groupings defined by the user. If light and heavy members are grouped together then
the lighter members will be assigned a larger than necessary section. This makes
structures uneconomical. Thus, efficient methods for grouping members are also
required.
1.2 The need for better optimisation methods
As construction materials increase in cost it is becoming more important that
designers minimise material wastage in their designs. This necessitates the use of
2/96
optimisation methods. Also, engineers often have limited time in which to design.
Hence, only one structure is usually designed, rather than exploring a variety of
structural configurations, to find which is best.
Structural engineers are generally unwilling to use optimisation methods which are
computationally expensive, difficult to implement, can only be applied to certain
structures or cannot be easily understood. The aforementioned problems must be
overcome before optimisation methods can become viable.
Grouping is essential for reducing fabrication and erection costs. It must be
considered in design. However, efficiently grouping a structure is a complex task and
no automated methods are currently available.
1.3 An overview of optimisation literature
Numerous guidelines have been published relating to the optimisation of structures.
Books by Wood (1960), Dowling et al. (1988) and the SA Institute of Steel
Construction (2001) demonstrate how structures can be optimised by engineers
through the use of good designs and careful member selections. Such methods are
effective but must be manually implemented, and are generally more applicable
when defining structural geometries and groups. Engineers require experience to
implement these intuitive techniques. In larger, more complex structures such
methods cannot easily be applied. Optimisation methods which can be automated are
not addressed in this literature.
Books by Gallagher and Zienkiewicz (1973) or Haftka and Gürdal (1992) describe
various computer optimisation methods that can be applied to structural design.
However, all the methods presented are computationally expensive, which
significantly limits their application. Some of the methods presented would take
years, or even centuries, to optimise large structures.
Review papers on structural optimisation have been published by Arora and Huang
(1994), Thanedar and Vanderplaats (1995) and Maalawi and Badr (2009), amongst
others. These authors acknowledge that most methods are suitable only for specific
types of structures, and a generic structural optimisation method is not yet available.
3/96
In technical and review papers methods are often compared against each other to
determine which methods are superior. However, results presented are dependent on
factors such as the design parameters chosen, algorithm used, the nature of the
structures optimised, the number of sections considered, and the computational
power available.
Recently researchers have developed optimisation methods based on genetic
algorithms (Erbatur, 2009), harmony search algorithms (Saka, 2009), particle swarm
optimisation (Li et al., 2009), ant colony optimisation (Camp et al., 2005), or tabu
search (Kargahi et al., 2006). There is little agreement regarding which method is the
most efficient and how these methods can be used in practice. It is possible that the
aforementioned methods could be applied to the problem of optimising member
groupings. However, this has not been reported in the literature.
The principle of virtual work has been used to determine which members should be
selected to limit deflections by Park and Park (1997). However, the method
developed only takes structural deflection requirements into account, and does not
consider strength constraints. Optimality Criterion (OC) methods also use the
principle of virtual work. However, OC methods select sections from a continuous
spectrum, and a relationship between sectional parameters in databases, such as area
and second moment of area, must be assumed (Chan, 1992; Pezeshk, 1998). Methods
published by Makris and Provatidis (2002) and Makris et al. (2006) use strain energy
criteria to optimise structures. Member selection is performed based on determining
either cross-sectional areas for trusses or second moment of areas for frames, not
both simultaneously. Most structures cannot be considered by such methods because
bending, torsion and axial forces cannot be separated. Patnaik et al. (1997) proposed
a methodology of satisfying stress constraints and then reducing deflections, but once
again considered only trusses.
Few methods for automating the grouping of members can be found in the literature.
Researchers have developed methods which group members according to the
magnitude of internal forces (Krishnamoorthy et al., 2002; Toğan and Doloğlu, 2006,
2008), slenderness ratios (Toğan and Doloğlu, 2008), member lengths (Biedermann
and Grierson, 1995), or sectional areas (Shea et al., 1997; Isaacs et al., 2008).
4/96
However, these methods suffer from one or more of the following limitations: only
axial or bending forces are considered, one grouping configuration is tested, only one
load case is considered and users must define empirical parameters which affect
groupings.
1.4 Definitions of terms used
Is this dissertation an optimal structure is defined as one which satisfies all strength
and deflection criteria using minimum material. A group is all the members in a
structure which are constrained to have the same section. An ungrouped structure is
one in which every member can have a different section. A target deflection is the
maximum allowable amount a critical point is allowed to deflect, and is usually
specified by codes. A critical point is the node in a structure that is being
investigated at which deflections have to be limited, and is usually a point of
maximum deflection.
1.5 Limitations of the research
This dissertation does not address the problem of optimising the geometric topology
of a structure. The geometry significantly affects the efficiency of a structure. Refer
to papers by authors such as Bendsøe et al. (1994), Kwak (1994), Fourie and
Groenwold (2002) or Lee and Geem (2004) for more information.
Only steel structures have been considered. However, the methods developed would
be suitable for other materials as well. Structures in which more than one material is
used simultaneously have not been investigated, and this is a topic for further
research.
In this dissertation it is assumed that a structure of minimum mass will be the most
economical. This is an oversimplification and not always true. The problem of
minimising total structural costs, including fabrication and erection, has not been
considered, and is topic for further research.
5/96
1.6 Dissertation organisation
This dissertation develops and implements a method for automating the selection of
structural sections, and grouping members. Chapter 2 presents the initial
development of the method to address structures subject to a single deflection
criterion and load case. The theory underlying the method is discussed. The
methodology is modified and expanded in Chapter 3 such that structures with
multiple deflection constraints and load cases can be addressed. Results obtained in
Chapters 2 and 3 are compared to those in the literature and to practising engineers’
designs. A parametric study of ungrouped, multi-storey frames is conducted in
Chapter 4. It is observed that ungrouped, optimised frames tend towards specific, but
unexpected, distributions of mass. In Chapter 5 an automated member grouping
algorithm is presented. The algorithm utilises the member selection techniques
developed in Chapter 3 to obtain optimised, ungrouped structures which can be
grouped. Chapter 6 presents overall conclusions regarding the research, and
discusses topics requiring future research. Results produced by the methods
developed are compared to those found in the literature or from available civil
engineering design practice to verify the solutions calculated and to show the
effectiveness of methods.
1.7 References
Arora, J S and Huang, M W. (1994) Review Papers - Methods for optimisation of
nonlinear problems with discrete variables: a review. Struct. Optim., 8, 69-85.
Bendsøe, M P, Ben-Tal, A, and Zowe, J. (1994) Review Paper – Optimisation
methods for geometry and topology design. Struct. Optimisation, 7, 141-159.
Biedermann, J.D., and Grierson, D.E. (1995) “A Generic Model for Building
Design”. Engineering with Computers, 11, 173-184.
Camp, C V, Bichon, B J and Stovall, S P. (2005) Design of Steel Frames Using Ant
Colony Optimisation. J. Struct. Div, ASCE, 131(3), 369-379
Chan, C M. (1992) An optimality criteria algorithm for tall steel building design
using commercial standard sections. Structural Optimisation, 5, 26-29.
Dowling, P J, Knowles, P, and Owens, G W. (1988) Structural Steel Design. The
Steel Construction Institute, UK.
6/96
Erbatur, F, Hasançebi, O, Tütüncü, I and Kiliç, H. (2009) Optimal design of planar
frames with genetic algorithms. Computers and Structures, 75, 209-224.
Fourie, P C, and Groewold, A A. (2002) The particle swarm optimisation algorithm
in size and shape optimisation. Struct, Multidisc. Optim., 23, 259–267.
Gallagher, R H. (1973) Fully Stressed Design in Optimum Structural Design: Theory
and Applications. Editors Gallagher, R.H., and Zienkiewicz, O.C., Bristol, John
Wiley & Sons.
Gallagher, R H, and Zienkiewicz, O C. (1973) Optimum Structural Design: Theory
and Applications. Bristol, John Wiley & Sons.
Groenwold, A A, Stander, N and Snyman, J A. (1996) A pseudo-discrete rounding
method for structural optimisation. Structural Optimisation, 11, 218-227.
Haftka, R T, and Gürdal, Z. (1992) Elements of Structural Optimisation. 3rd revised
and expanded ed. London, Kluwer Academic Publishers.
Isaacs, A, Ray, T, and Smith, W (2008) An efficient hybrid algorithm for
optimisation of discrete structures. SEAL 2008, LNCS 5361, 625–634.
Kargahi, M, Anderson, J C, and Dessouky, M M (2006) Structural Weight
Optimisation of Frames Using Tabu Search. I: Optimisation Procedure. Journal
of Structural Engineering, ASCE, 132(12), 1858-1868.
Krishnamoorthy C.S., Venkatesh P.P., Sudarshan R. (2002) “Object-oriented
framework for genetic algorithms with application to space truss optimisation”. J
Comput. Civil Eng, ASCE, 16, 66–75.
Kwak, B M. (1994) A review on shape optimal design and sensitivity analysis.
Structural Eng. / Earthquake Eng. Vol. 10, No. 4, 159s-174s.
Lee, K S, and Geem, Z W. (2004) A new structural optimisation method based on the
harmony search algorithm. Computers and Structures, 82, 781–798.
Li, L J, Huang, Z B and Liu, F. (2009) A heuristic particle swarm optimisation
method for truss structures with discrete variables. Computers and Structures,
87(7-8), 435-443.
Maalawi, Y M and Badr, M A. (2009) Design Optimisation of Mechanical Elements
and Structures: A Review with Applications. Journal of Applied Sciences
Research, 5(2), 221-231.
7/96
Makris, P A, and Provatidis, C G. (2002) Weight minimisation of displacement-
constrained truss structures using a strain energy criterion. Comput. Methods
Appl. Mech. Engrg., 191, 2159–2177.
Makris, P A, Provatidis, C G, and Rellakis, D A. (2006) Discrete variable
optimisation of frames using a strain energy criterion. Struct Multidisc Optim, 31,
410–417.
Park, H S, and Park, C L. (1997) Drift control of high-rise buildings with unit load
method. The Structural Design of Tall Buildings, 6, 23-25.
Patnaik, S, Gendy, A, Berke, L, and Hopkins, D. (1997) Modified Fully Utilized
Design (MFUD) Method for Stress and Displacement Constraints. NASA
Technical Memorandum 4743, August.
Pezeshk, S. (1998) Design of framed structures: An integrated non-linear analysis
and optimal minimum weight design. International Journal for Numerical
Methods in Engineering, 41, 459-471.
Saka, M.P. (2009) Optimum design of steel sway frames to BS5950 using harmony
search algorithm. Journal of Constructional Steel Research, 65, 36-43.
Shea, K., Cagan, J., and Fenves, S.J. (1997) “A Shape Annealing Approach to
Optimal Truss Design With Dynamic Grouping of Members.” Journal of
Mechanical Design, ASME, September, 119, 388-394.
Southern African Institute of Steel Construction (SAISC). (2001) Introduction to the
economics of steel structures. Compiled and published by SAISC, Johannesburg.
Thanedar, P.B. and Vanderplaats, G.N. (1995) Survey of discrete structural
optimisation for structural design. J. Struct. Eng., ASCE. 120(2), 301-306.
Toğan, V, and Doloğlu, A. (2006) “Optimisation of 3D trusses with adaptive
approach in genetic algorithms”. Engineering Structures, 28, 1019-1027.
Toğan, V, and Doloğlu, A. (2008) “An improved genetic algorithm with initial
population strategy and self-adaptive member groupings.” Computers and
Structures.86, 1204-1218.
Wood, R H. (1960) An economical design of rigid steel frames for multi-storey
buildings. National building studies, Department of Scientific and Industrial
Research. Research Paper No. 10.
8/96
CHAPTER 2: OPTIMISING STRUCTURES WITH SINGLE
DISPLACEMENT CRITERIA
2.1 Introduction
In general, the design of structures requires that each member and the structure as a
whole meet two sets of requirements, namely strength and flexibility (or deflections)
criteria. If the structure is designed to building codes then the strength requirement
should be automatically met. On the other hand, it is not always clear how and where
to stiffen the structure to meet the deflection criterion. In most cases, reducing
deflection is based on the intuition and experience of the engineer. Often manual
iterative trial and error type of approaches are used to reach the target deflection
specified by the code.
This chapter presents a method for determining the stiffness of the identified
member(s) within a structure in order to meet a single target deflection in an optimal
way. Structures with single deflection criteria and load cases are addressed. This
methodology is expanded and enhanced in Chapter 3 to address structures with
multiple deflection criteria and load cases.
The problem addressed in this chapter can be stated as follows: to minimise the total
mass of the structure while meeting strength and deflection requirements. The
geometry of the structure, i.e. the position of the nodes and how they are connected,
as well as the loading, are given; it is required to find each member’s section in an
overall optimal way. In this dissertation an optimal structure is defined as the lightest
possible structure which satisfies all load resistance and deflection criteria. Since a
minimum is sought, the method in general will require iteration, and to be tractable
will have to be automated (with no human expertise required).
The optimisation of a structure with a given geometry has been extensively
researched. A few examples of optimisation methods are: the genetic algorithm
(Erbatur et al., 2009), tabu search (Kargahi et al., 2006), discrete effective
optimisation (Gutkowski et al., 2006) and ant colony optimisation (Camp et al.,
2005). None of these methods select the structural member’s sections based on
9/96
structural mechanics; rather, a search procedure is used. They require many
(hundreds, thousands and in some cases tens of thousands) iterations to produce a
solution. There is no guarantee that the solution is a global minimum. On the other
hand, performing a straight forward exhaustive search of all possible combinations of
member sections, to obtain the minimum mass, even of a simple structure, would
take too much time (measured in centuries) with current modern computers. Thus it
is well recognised that structural optimisation is a difficult problem.
To complicate matters, if the optimised structure has too many sections, it becomes
difficult to construct, and prone to errors. For this reason, and to simplify the design
process, in engineering practice, members are grouped together and assigned the
same section. As the number of member groups decrease, so the overall structure’s
mass increases. There should be a balance between the complexity of the design and
the economy due to mass savings. Grouping members imposes constraints on the
optimisation problem. Optimising the grouping of members is discussed in Chapter
5.
The principle of virtual work forms the basis of the optimisation algorithm. The
developed method is called the Virtual Work Optimisation (VWO) method. This
chapter is organised as follows. First the principle of virtual work is presented
together with the assumptions made. The VWO method, in particular, how the
strength requirements and deflection criteria are met, is described. The optimisation
curve produced by the iterations of the VWO method, together with notes on
increment size and member grouping constraints, are discussed. Next three case
studies are considered: (a) The standard ten member benchmark truss; (b) a truss
frame; and (c) a 24 storey frame. In all cases the VWO method is compared to
published optimisation solutions. The chapter is concluded by identifying areas
requiring future research, many of which are addressed in subsequent chapters.
2.2 The principle of virtual work
For any solid, the well-known principle of virtual work can be written as:
dVFV
(2.1)
10/96
where stands for “variation in”, and refers to the virtual load-displacement system.
F is the virtual point force, is the actual displacement where the virtual force is
applied, is the stress in the real solid, and is the virtual strain. Integration is
performed over the entire volume, V, of the solid.
In structural mechanics, where the solid in Equation 2.1 is comprised of structural
members, and for a unit virtual load, Equation 2.1 becomes:
LLL
dxGJ
Ttdx
GA
Qqdx
EI
MmL
EA
Ff(2.2)
The structure’s deflection is at the point of application, and in the direction of the
virtual unit load.
The small letters, f, q, m, and t refer to the virtual system’s internal axial, shear
forces, bending, and torsional moments, respectively. The capital letters, F, Q, M,
and T refer to the real system’s internal axial, shear forces, bending and torsional
moments. Integration is performed over the length, L, of each member. Summation
occurs over all members in the structure. The material and geometric section
properties can vary along the length of the members, and are: the Young’s modulus,
E, the Shear modulus, G, the cross sectional area, A, the 2nd moment of area, I, and
the polar 2nd moment of area, J.
Equation 2.2 can be viewed as a summation:
MembersNo
ii
.
1
(2.3)
where i is the deflection contribution of member i to the overall structural deflection
. The magnitude of the contribution is related to the amount of strain energy in the
member.
If only two dimensional plane frames or trusses are considered, and shear
deformation is neglected, then:
11/96
L
i dxEI
MmL
EA
Ff (2.4)
or,
Momenti
Axialii (2.5)
Please note that shear deformation is neglected because it is usually small compared
to other terms, especially in steel structures.
In this chapter, only Equations 2.3, 2.4 and 2.5 are utilised, with the associated
assumptions and limitations.
2.3 The Virtual Work Optimisation Method
The Virtual Work Optimisation (VWO) method finds the minimum mass structure
for a given structural member configuration, by selecting member sections that
satisfy strength and global deflection requirements. In structural design, the global
deflection is an input parameter, often specified as a fraction of the structure’s span
or height. Not only is the magnitude of the global deflection required, but also the
direction. The virtual unit point load is then placed at the point where the deflection
is to be met in the direction of interest.
Whenever the internal forces or the global deflection is required, the standard
stiffness matrix method is used. Most modern structural programs use this matrix
method. It must be noted that the VWO method can use any method that computes
the internal forces and deflections within the structure.
The VWO method is an iterative method. Although the iteration can start off
assuming any section for each member, a more logical approach is to design each
member to meet strength requirements.
2.3.1 Satisfying strength requirements
In the first iteration the members are chosen such that they satisfy strength
requirements. The strength requirements are specified in building codes; the South
12/96
African steel code, SANS 10162 (2005) is used in this chapter. The internal forces
within each member are checked against the code requirements.
The initial member selection for strength requires its own iteration for statically
indeterminate structures. This is due to the fact that as member sections are changed,
the internal forces within them change. The lightest section satisfying strength
requirements is chosen for each member. If members are grouped into a set, then the
section chosen for the set will be the lightest section satisfying strength requirement
of every member in that set. For a general structure, perfect convergence of the
strength iteration might not be achievable (i.e. achieving the lightest structure in
which each member satisfies the strength criterion). Rather, several member sections
can oscillate between possible solutions as the iteration continues. This occurs due to
the force redistribution as the member sections change. After a predefined number of
oscillations, and if a stable solution has not been achieved, the iteration is stopped
and the optimisation process started.
It must be pointed out that the ultimate loads are used in the strength calculations;
serviceability loads are used to check the deflection criteria. In some cases, the
deflection criterion is met as soon as the strength requirement is satisfied. This is
unusual for steel structures with long spans.
2.3.2 Meeting Deflection Criteria and Optimising the Structure
The first step in the optimisation iteration process (i.e. minimizing the structure’s
overall mass) is to determine the contribution of each member to the total deflection
of the chosen point. The member’s deflection contribution is calculated using
Equation 2.4 and the total deflection by Equation 2.3. The internal forces due to the
real and virtual load systems are calculated using any standard method or
commercial software.
It is now assumed that the geometric sectional properties (2nd moment of area, I, and
the cross section area, A) have a linear relationship with the member’s deflection
contribution. Thus considering member i, with current properties and deflection, and
13/96
utilizing new sectional properties called (new), the predicted deflection contribution
is:
Momentinew
i
iAxialinew
i
inewi
I
I
A
A (2.6)
For statically determinate structures this assumption is exact. For indeterminate
structures the accuracy of the prediction depends on the ratiosnewi
i
I
Iand
newi
i
A
Aand
how far they are from unity. See Section 2.3.4 “A Note on Increment Size” for a
brief discussion.
Two main questions arise:
1. Which member has to be changed?
2. By how much must the member be changed?
To answer these questions, Equation 2.7 is used to determine the efficiency of
changing the sectional properties of member i to any other section. Efficiency of the
change is defined as the change in deflection contribution of the member, versus the
increase in the member’s mass, i.e.
iinewi
newii
LmmEfficiency
(2.7)
where m is the mass per unit length of sections. Equations 2.7 gives a rational basis
to choose which member within a structure has to be changed and by how much. The
efficiency of each cross section available from a data base (e.g. the Southern African
Steel Construction Handbook (2005), or the “Red Book”), for each member in the
structure, can be computed. (Restrictions such as selecting member changes only
from one type of sections, e.g. selecting new sections only from angle irons, can be
enforced). The most efficient section change, or the highest value in Equation 2.7, is
now made. This completes the current iteration in the optimisation process.
14/96
The efficiency equation presented is suitable for a structure with a single deflection
criterion. To address multiple deflection criteria the method would need to deal with
one criterion at a time, or have the efficiency equation modified. This is explored in
Chapter 3.
Any section database can be considered by the VWO method. Further, the database
can be augmented with custom sections. As the data base increases so too does the
computational cost. In the VWO method, since only Equations 2.6 and 2.7 have to be
evaluated for new section sizes, the computational cost is linearly proportional to the
size of the data base. Contrast this to most other optimisation methods, in which the
computational cost increases exponentially (Gutkowski et al., 2006).
The iteration is continued until the deflection criterion, or target, is about to be met.
In the last iteration, the section with the lowest mass increase which reaches the
target deflection, and not necessarily the most efficient section, is chosen. This
prevents deflection being reduced below the target.
It must be pointed out that the deflection contribution of a member (Equation 2.4) to
the overall deflection can be negative. This occurs when the internal forces due to the
real and virtual loading system have opposite effects. In such a case, the member is
designed to satisfy the strength requirement only.
Within each iteration the strength of each member is checked since section changes
cause internal force redistribution. If required, the member size is adjusted to meet
the strength requirement. At the end of the iteration, each member satisfies strength
requirement and the overall structure is closer to meeting the deflection criterion.
2.3.3 The Optimisation Curve
The optimisation curve is updated at the end of each iteration by plotting the overall
deflection of the node of interest versus the structure’s mass. An idealised
optimisation curve is shown in Figure 2.1.
15/96
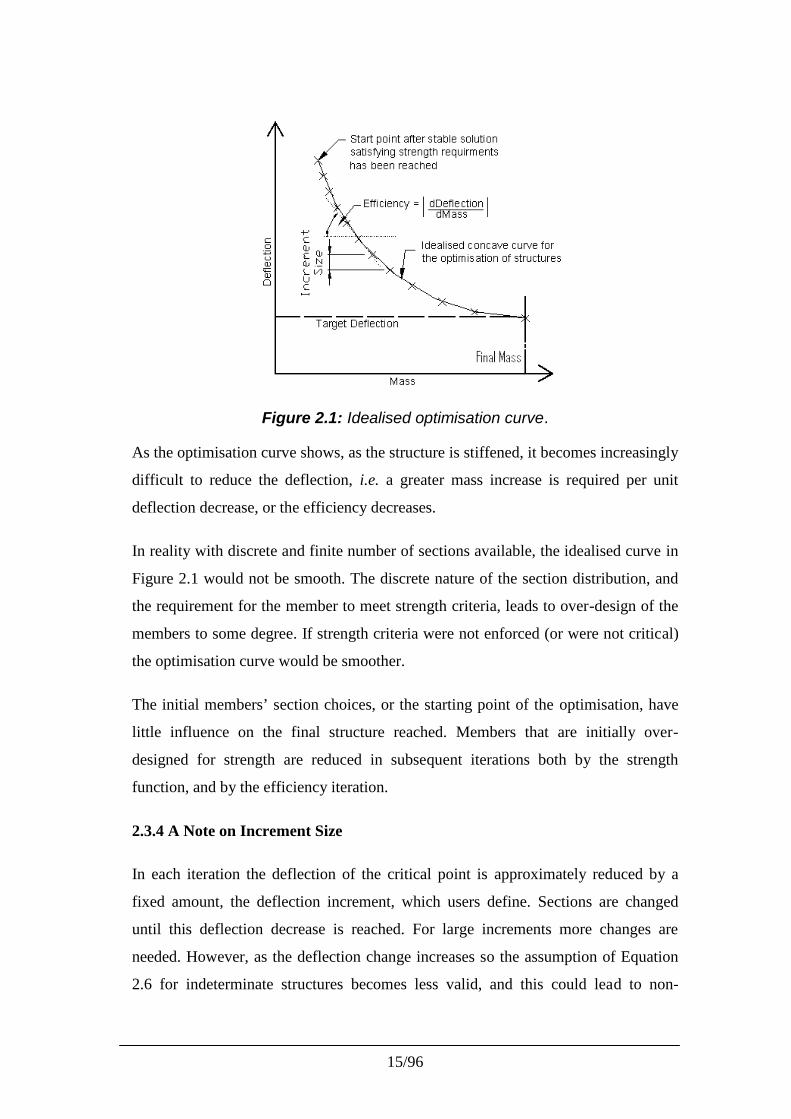
Figure 2.1: Idealised optimisation curve.
As the optimisation curve shows, as the structure is stiffened, it becomes increasingly
difficult to reduce the deflection, i.e. a greater mass increase is required per unit
deflection decrease, or the efficiency decreases.
In reality with discrete and finite number of sections available, the idealised curve in
Figure 2.1 would not be smooth. The discrete nature of the section distribution, and
the requirement for the member to meet strength criteria, leads to over-design of the
members to some degree. If strength criteria were not enforced (or were not critical)
the optimisation curve would be smoother.
The initial members’ section choices, or the starting point of the optimisation, have
little influence on the final structure reached. Members that are initially over-
designed for strength are reduced in subsequent iterations both by the strength
function, and by the efficiency iteration.
2.3.4 A Note on Increment Size
In each iteration the deflection of the critical point is approximately reduced by a
fixed amount, the deflection increment, which users define. Sections are changed
until this deflection decrease is reached. For large increments more changes are
needed. However, as the deflection change increases so the assumption of Equation
2.6 for indeterminate structures becomes less valid, and this could lead to non-
16/96
smooth and oscillatory optimisation curves. It has been found that increments of
1mm (per iteration) produce consistent optimisation curves. Please note that the
deflection contribution reduction can only be a target since the section properties
correspond to a finite data base and are discrete in nature. Throughout this chapter,
the target deflection increment is set to 1mm; for comparison purposes, larger target
increments of 10 and 20mm are also investigated.
2.3.5 A Note on Member Groups
One factor greatly affecting the optimised mass is how many different sections can
occur in a structure. In practice, the economy of the structure (i.e. having as many
sections as required) is weighed up against constructability and simplicity of the
design. The members with the same sectional properties in a structure are grouped
into sets. Structures with fewer groups will generally be heavier and many members
will be larger than needed. The forced grouping of members imposes constraints on
the optimisation process. This topic is discussed in depth in Chapter 5 and an
automated grouping algorithm using the VWO method is proposed.
The VWO method can be applied directly when the optimisation is constrained by
enforcing members to belong to groups. When groups are present, it is required that:
(a) the efficiency search (Equation 2.7) is performed for the whole group, and
(b) the biggest section calculated from the strength requirement of the group is
adopted for the entire group.
In the above, the members belonging to groups or sets are specified at the start of the
optimisation.
2.4 Case Studies
To demonstrate the VWO method, the optimisations of three different case studies
are considered: (a) A benchmark ten member truss; (b) A truss frame that has been
designed by a professional engineering company; and (c) A tall structure. Wherever
possible the results are compared to published or obtained solutions. The case studies
17/96
are solved assuming (a) no member grouping, (b) the same grouping as in the
compared to solution, and (c) efficient grouping of members.
2.4.1 Ten Member Benchmark Truss
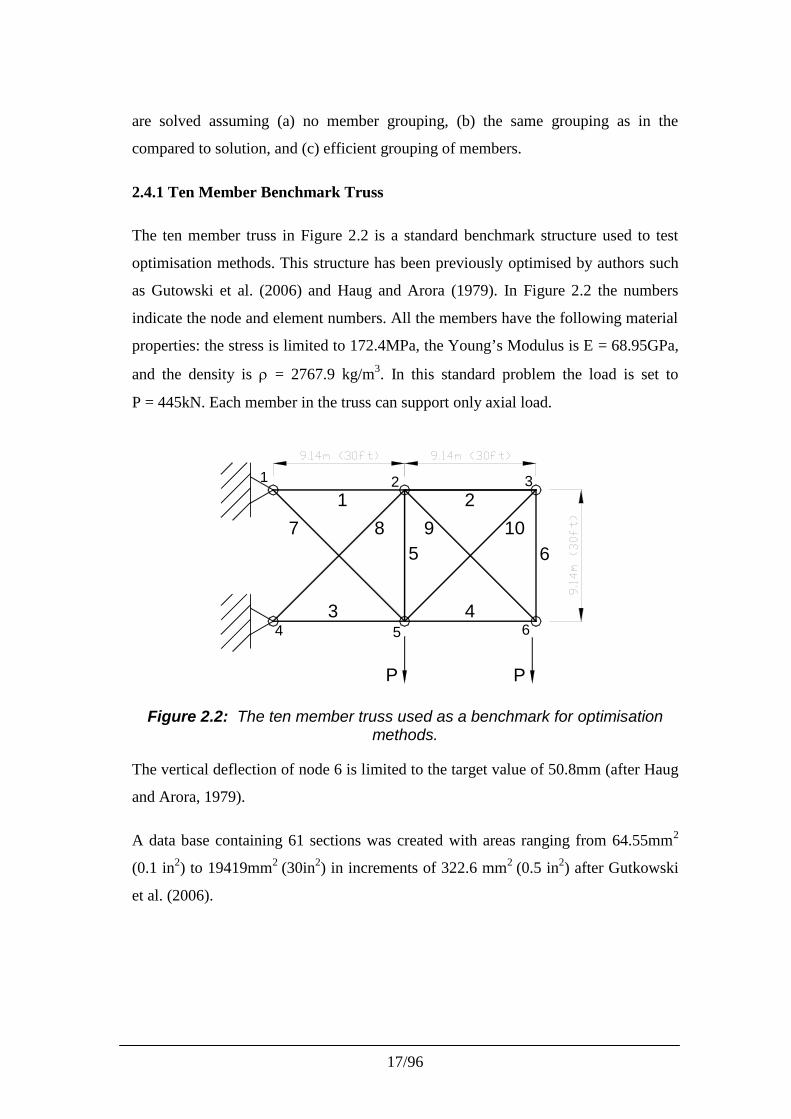
The ten member truss in Figure 2.2 is a standard benchmark structure used to test
optimisation methods. This structure has been previously optimised by authors such
as Gutowski et al. (2006) and Haug and Arora (1979). In Figure 2.2 the numbers
indicate the node and element numbers. All the members have the following material
properties: the stress is limited to 172.4MPa, the Young’s Modulus is E = 68.95GPa,
and the density is = 2767.9 kg/m3. In this standard problem the load is set to
P = 445kN. Each member in the truss can support only axial load.
1 2
3 4
5 67 8 9 10
P
1 2 3
4 5 6
P
Figure 2.2: The ten member truss used as a benchmark for optimisationmethods.
The vertical deflection of node 6 is limited to the target value of 50.8mm (after Haug
and Arora, 1979).
A data base containing 61 sections was created with areas ranging from 64.55mm2
(0.1 in2) to 19419mm2 (30in2) in increments of 322.6 mm2 (0.5 in2) after Gutkowski
et al. (2006).
18/96
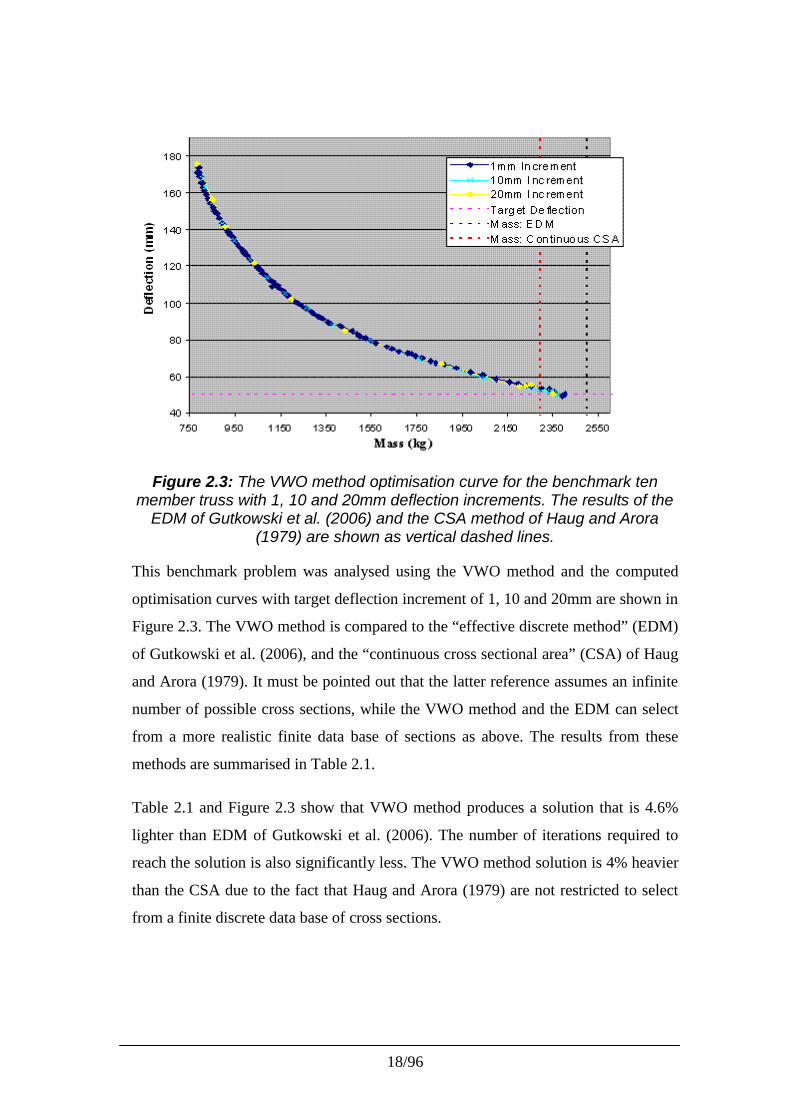
Figure 2.3: The VWO method optimisation curve for the benchmark tenmember truss with 1, 10 and 20mm deflection increments. The results of the
EDM of Gutkowski et al. (2006) and the CSA method of Haug and Arora(1979) are shown as vertical dashed lines.
This benchmark problem was analysed using the VWO method and the computed
optimisation curves with target deflection increment of 1, 10 and 20mm are shown in
Figure 2.3. The VWO method is compared to the “effective discrete method” (EDM)
of Gutkowski et al. (2006), and the “continuous cross sectional area” (CSA) of Haug
and Arora (1979). It must be pointed out that the latter reference assumes an infinite
number of possible cross sections, while the VWO method and the EDM can select
from a more realistic finite data base of sections as above. The results from these
methods are summarised in Table 2.1.
Table 2.1 and Figure 2.3 show that VWO method produces a solution that is 4.6%
lighter than EDM of Gutkowski et al. (2006). The number of iterations required to
reach the solution is also significantly less. The VWO method solution is 4% heavier
than the CSA due to the fact that Haug and Arora (1979) are not restricted to select
from a finite discrete data base of cross sections.
19/96
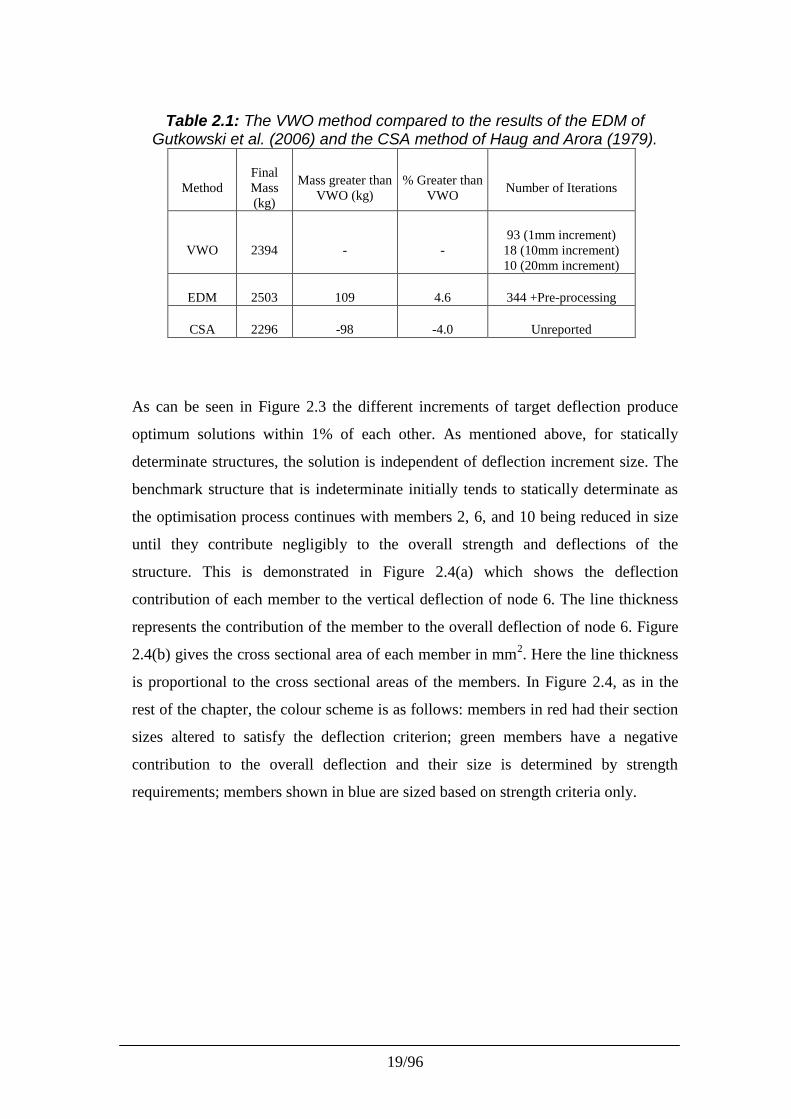
Table 2.1: The VWO method compared to the results of the EDM ofGutkowski et al. (2006) and the CSA method of Haug and Arora (1979).
MethodFinalMass(kg)
Mass greater thanVWO (kg)
% Greater thanVWO
Number of Iterations
VWO 2394 - -93 (1mm increment)
18 (10mm increment)10 (20mm increment)
EDM 2503 109 4.6 344 +Pre-processing
CSA 2296 -98 -4.0 Unreported
As can be seen in Figure 2.3 the different increments of target deflection produce
optimum solutions within 1% of each other. As mentioned above, for statically
determinate structures, the solution is independent of deflection increment size. The
benchmark structure that is indeterminate initially tends to statically determinate as
the optimisation process continues with members 2, 6, and 10 being reduced in size
until they contribute negligibly to the overall strength and deflections of the
structure. This is demonstrated in Figure 2.4(a) which shows the deflection
contribution of each member to the vertical deflection of node 6. The line thickness
represents the contribution of the member to the overall deflection of node 6. Figure
2.4(b) gives the cross sectional area of each member in mm2. Here the line thickness
is proportional to the cross sectional areas of the members. In Figure 2.4, as in the
rest of the chapter, the colour scheme is as follows: members in red had their section
sizes altered to satisfy the deflection criterion; green members have a negative
contribution to the overall deflection and their size is determined by strength
requirements; members shown in blue are sized based on strength criteria only.
20/96
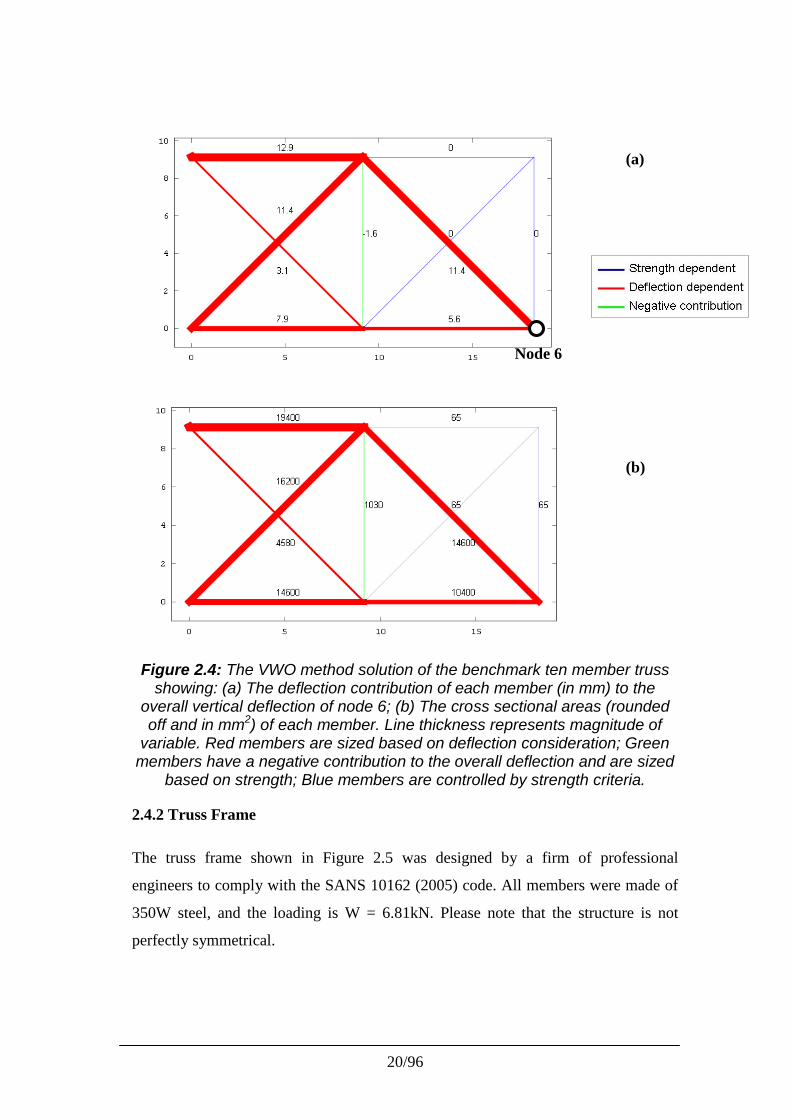
Figure 2.4: The VWO method solution of the benchmark ten member trussshowing: (a) The deflection contribution of each member (in mm) to the
overall vertical deflection of node 6; (b) The cross sectional areas (roundedoff and in mm2) of each member. Line thickness represents magnitude of
variable. Red members are sized based on deflection consideration; Greenmembers have a negative contribution to the overall deflection and are sized
based on strength; Blue members are controlled by strength criteria.
2.4.2 Truss Frame
The truss frame shown in Figure 2.5 was designed by a firm of professional
engineers to comply with the SANS 10162 (2005) code. All members were made of
350W steel, and the loading is W = 6.81kN. Please note that the structure is not
perfectly symmetrical.
(a)
(b)
Node 6
21/96
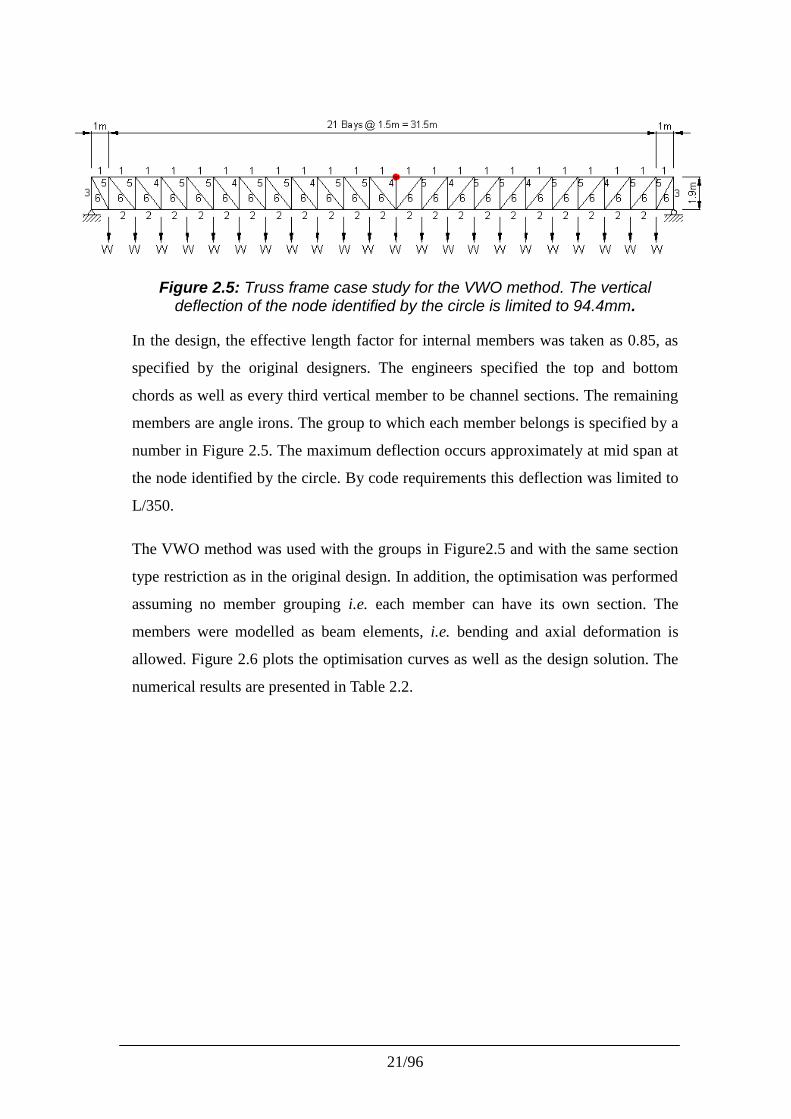
Figure 2.5: Truss frame case study for the VWO method. The verticaldeflection of the node identified by the circle is limited to 94.4mm.
In the design, the effective length factor for internal members was taken as 0.85, as
specified by the original designers. The engineers specified the top and bottom
chords as well as every third vertical member to be channel sections. The remaining
members are angle irons. The group to which each member belongs is specified by a
number in Figure 2.5. The maximum deflection occurs approximately at mid span at
the node identified by the circle. By code requirements this deflection was limited to
L/350.
The VWO method was used with the groups in Figure2.5 and with the same section
type restriction as in the original design. In addition, the optimisation was performed
assuming no member grouping i.e. each member can have its own section. The
members were modelled as beam elements, i.e. bending and axial deformation is
allowed. Figure 2.6 plots the optimisation curves as well as the design solution. The
numerical results are presented in Table 2.2.
22/96
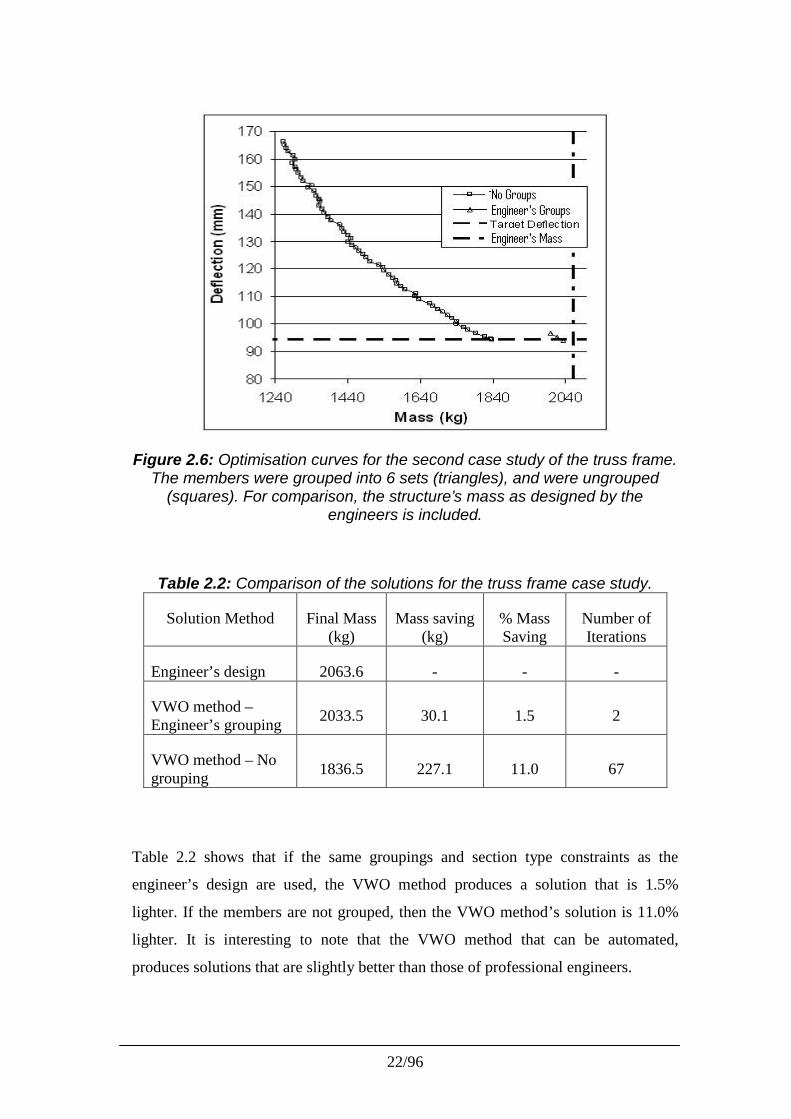
Figure 2.6: Optimisation curves for the second case study of the truss frame.The members were grouped into 6 sets (triangles), and were ungrouped
(squares). For comparison, the structure’s mass as designed by theengineers is included.
Table 2.2: Comparison of the solutions for the truss frame case study.
Solution Method Final Mass(kg)
Mass saving(kg)
% MassSaving
Number ofIterations
Engineer’s design 2063.6 - - -
VWO method –Engineer’s grouping 2033.5 30.1 1.5 2
VWO method – Nogrouping
1836.5 227.1 11.0 67
Table 2.2 shows that if the same groupings and section type constraints as the
engineer’s design are used, the VWO method produces a solution that is 1.5%
lighter. If the members are not grouped, then the VWO method’s solution is 11.0%
lighter. It is interesting to note that the VWO method that can be automated,
produces solutions that are slightly better than those of professional engineers.
23/96
Deflection increments of 1mm were used to produce the optimised solutions. Larger
increments of 10mm and 20mm yield answers within 0.5% of the 1mm increment
solution. This is due to the fact that although the structure is analysed as a frame, the
geometry and loading configuration ensures that it is in effect a statically determinate
truss.
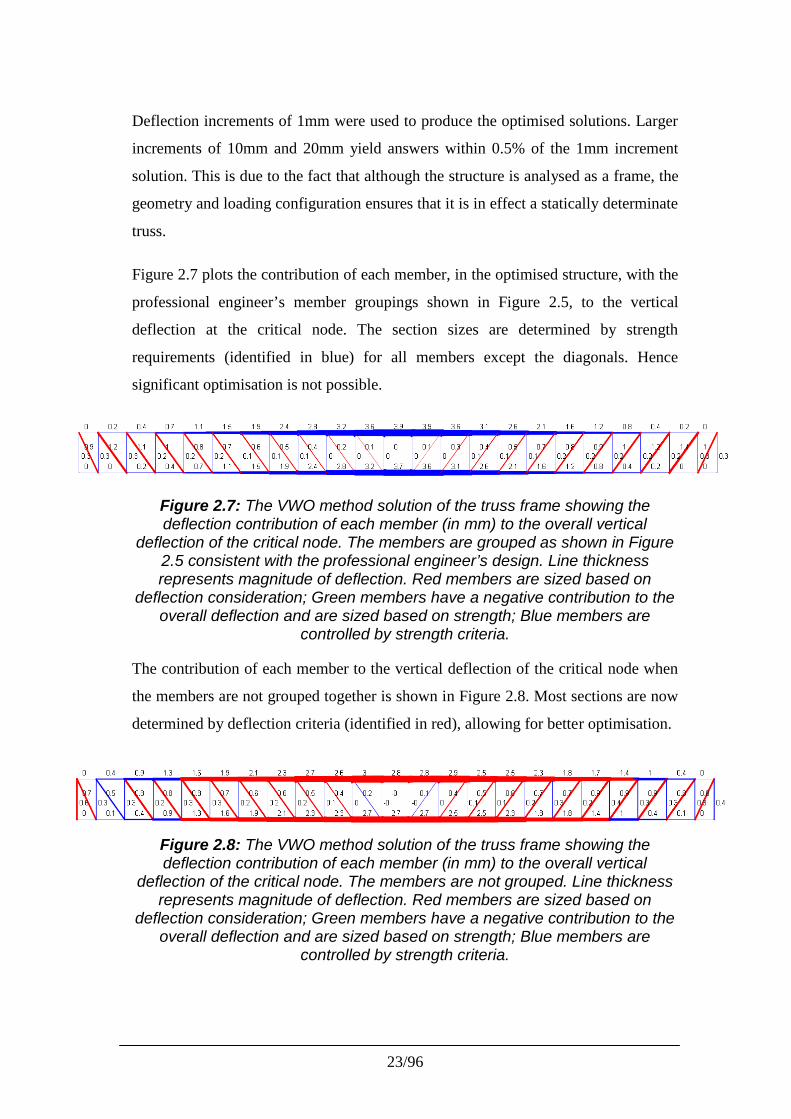
Figure 2.7 plots the contribution of each member, in the optimised structure, with the
professional engineer’s member groupings shown in Figure 2.5, to the vertical
deflection at the critical node. The section sizes are determined by strength
requirements (identified in blue) for all members except the diagonals. Hence
significant optimisation is not possible.
Figure 2.7: The VWO method solution of the truss frame showing thedeflection contribution of each member (in mm) to the overall vertical
deflection of the critical node. The members are grouped as shown in Figure2.5 consistent with the professional engineer’s design. Line thicknessrepresents magnitude of deflection. Red members are sized based on
deflection consideration; Green members have a negative contribution to theoverall deflection and are sized based on strength; Blue members are
controlled by strength criteria.
The contribution of each member to the vertical deflection of the critical node when
the members are not grouped together is shown in Figure 2.8. Most sections are now
determined by deflection criteria (identified in red), allowing for better optimisation.
Figure 2.8: The VWO method solution of the truss frame showing thedeflection contribution of each member (in mm) to the overall vertical
deflection of the critical node. The members are not grouped. Line thicknessrepresents magnitude of deflection. Red members are sized based on
deflection consideration; Green members have a negative contribution to theoverall deflection and are sized based on strength; Blue members are
controlled by strength criteria.
24/96
Comparing the solutions with and without (Figure 2.7 to 2.8) member grouping
suggests a more efficient grouping scheme. For example, adding just two more
groups to those in Figure 2.5 leads to an optimised structure that is 10.3% lighter.
This saving is close to the 14.0% when there are no groups at all! The two groups
that are introduced are: the inner and outer four bays of the top chord, and the inner
and outer six bays of the bottom chord. These observations form a theoretical basis
for the grouping algorithm in Chapter 5.
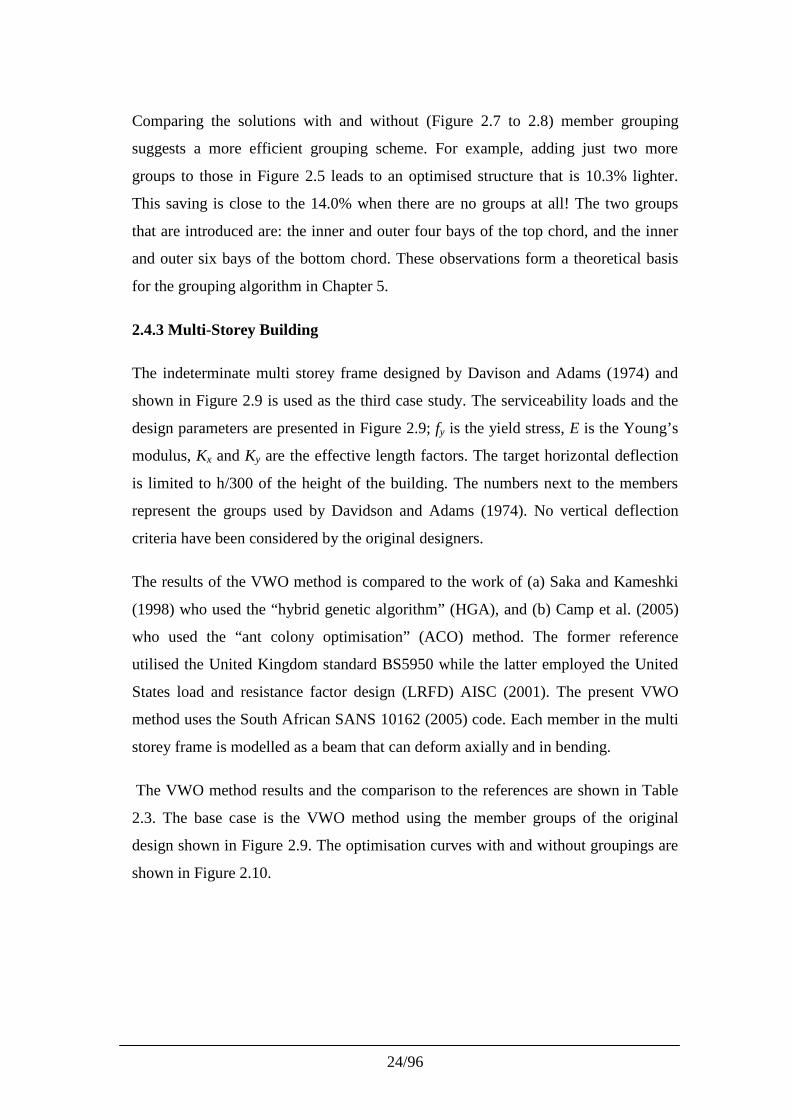
2.4.3 Multi-Storey Building
The indeterminate multi storey frame designed by Davison and Adams (1974) and
shown in Figure 2.9 is used as the third case study. The serviceability loads and the
design parameters are presented in Figure 2.9; fy is the yield stress, E is the Young’s
modulus, Kx and Ky are the effective length factors. The target horizontal deflection
is limited to h/300 of the height of the building. The numbers next to the members
represent the groups used by Davidson and Adams (1974). No vertical deflection
criteria have been considered by the original designers.
The results of the VWO method is compared to the work of (a) Saka and Kameshki
(1998) who used the “hybrid genetic algorithm” (HGA), and (b) Camp et al. (2005)
who used the “ant colony optimisation” (ACO) method. The former reference
utilised the United Kingdom standard BS5950 while the latter employed the United
States load and resistance factor design (LRFD) AISC (2001). The present VWO
method uses the South African SANS 10162 (2005) code. Each member in the multi
storey frame is modelled as a beam that can deform axially and in bending.
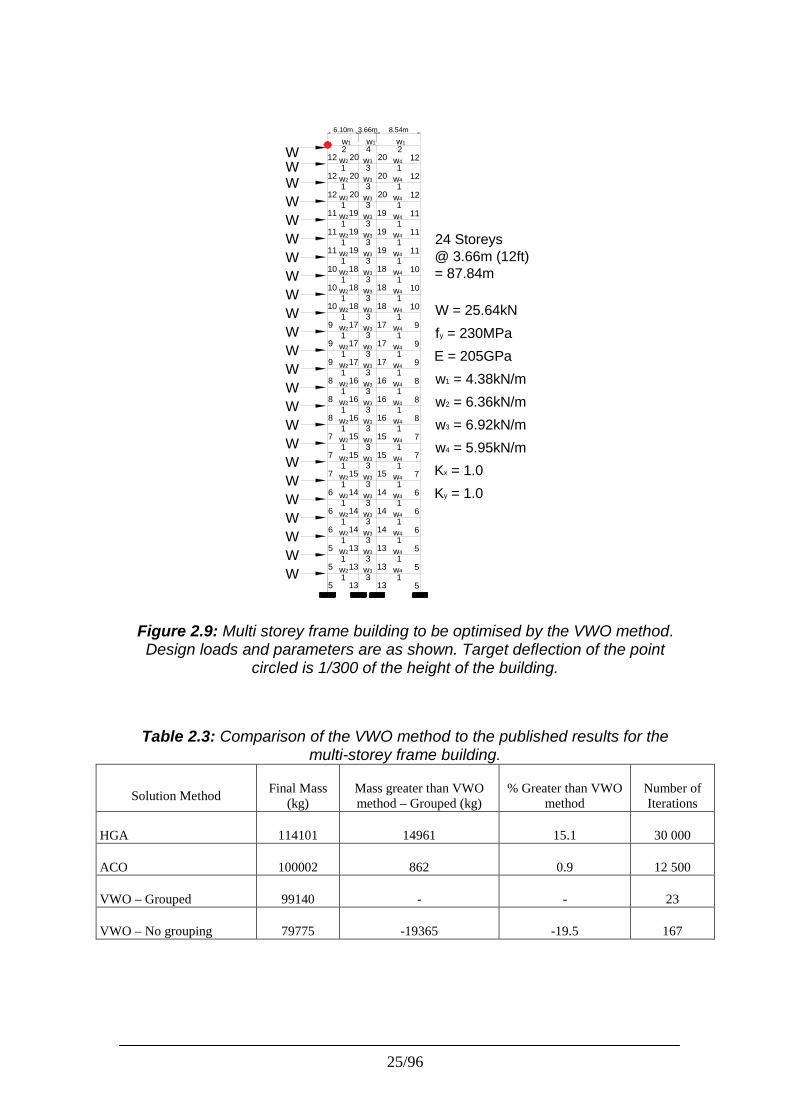
The VWO method results and the comparison to the references are shown in Table
2.3. The base case is the VWO method using the member groups of the original
design shown in Figure 2.9. The optimisation curves with and without groupings are
shown in Figure 2.10.
25/96
WWW
w2
w2
w2
w2
w2
w2
w2
w2
w2
w2
w2
w2
w2
w2
w2
w2
w2
w2
w2
w2
w2
w2
w2
w1 w1
w4w3
w3 w4
w3 w4
w3 w4
w3 w4
w3 w4
w3 w4
w3 w4
w3 w4
w3 w4
w3 w4
w4w3
w3 w4
w3 w4
w3 w4
w3 w4
w3 w4
w4w3
w3 w4
w3 w4
w3 w4
w3 w4
w3 w41 13
1 3 1
1 3
3
1
11
1 3
3
1
11
1 1
1
3
31
1 3
3
1
11
1 3
3
1
11
1 3
3
1
11
1 3
3
1
11
1 3
3
1
11
1 3
3
1
11
1 3
3
1
11
1 3
4
1
22
24 Storeys@ 3.66m (12ft)= 87.84m
5 513 13
5 13 13 5
135 13 5
146 14 6
146 14 6
146 14 6
157 15 7
168 16 8
179 17 9
1810 18 10
1911 19
2012 20
157 15 7
157 15 7
168 816
168 816
11
12
2012 20 12
1911 1119
1810 1018
179 17 9
179 917
10 18 18 10
11 19 19 11
122012 20
W = 25.64kNfy = 230MPaE = 205GPa
w2 = 6.36kN/mw3 = 6.92kN/mw4 = 5.95kN/m
w1 = 4.38kN/m
Kx = 1.0Ky = 1.0
w1
W
WW
W
WW
W
WW
W
WW
WWW
WWW
WWW
6.10m 3.66m 8.54m
Figure 2.9: Multi storey frame building to be optimised by the VWO method.Design loads and parameters are as shown. Target deflection of the point
circled is 1/300 of the height of the building.
Table 2.3: Comparison of the VWO method to the published results for themulti-storey frame building.
Solution MethodFinal Mass
(kg)Mass greater than VWOmethod – Grouped (kg)
% Greater than VWOmethod
Number ofIterations
HGA 114101 14961 15.1 30 000
ACO 100002 862 0.9 12 500
VWO – Grouped 99140 - - 23
VWO – No grouping 79775 -19365 -19.5 167
26/96
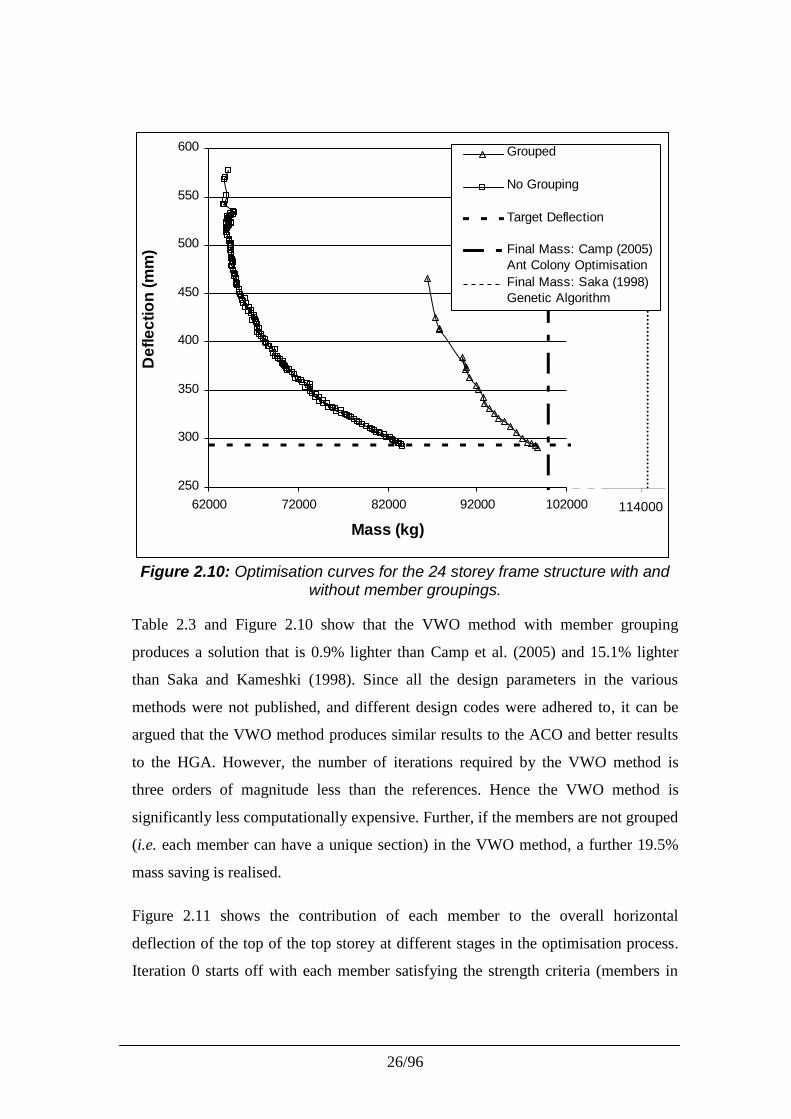
Figure 2.10: Optimisation curves for the 24 storey frame structure with andwithout member groupings.
Table 2.3 and Figure 2.10 show that the VWO method with member grouping
produces a solution that is 0.9% lighter than Camp et al. (2005) and 15.1% lighter
than Saka and Kameshki (1998). Since all the design parameters in the various
methods were not published, and different design codes were adhered to, it can be
argued that the VWO method produces similar results to the ACO and better results
to the HGA. However, the number of iterations required by the VWO method is
three orders of magnitude less than the references. Hence the VWO method is
significantly less computationally expensive. Further, if the members are not grouped
(i.e. each member can have a unique section) in the VWO method, a further 19.5%
mass saving is realised.
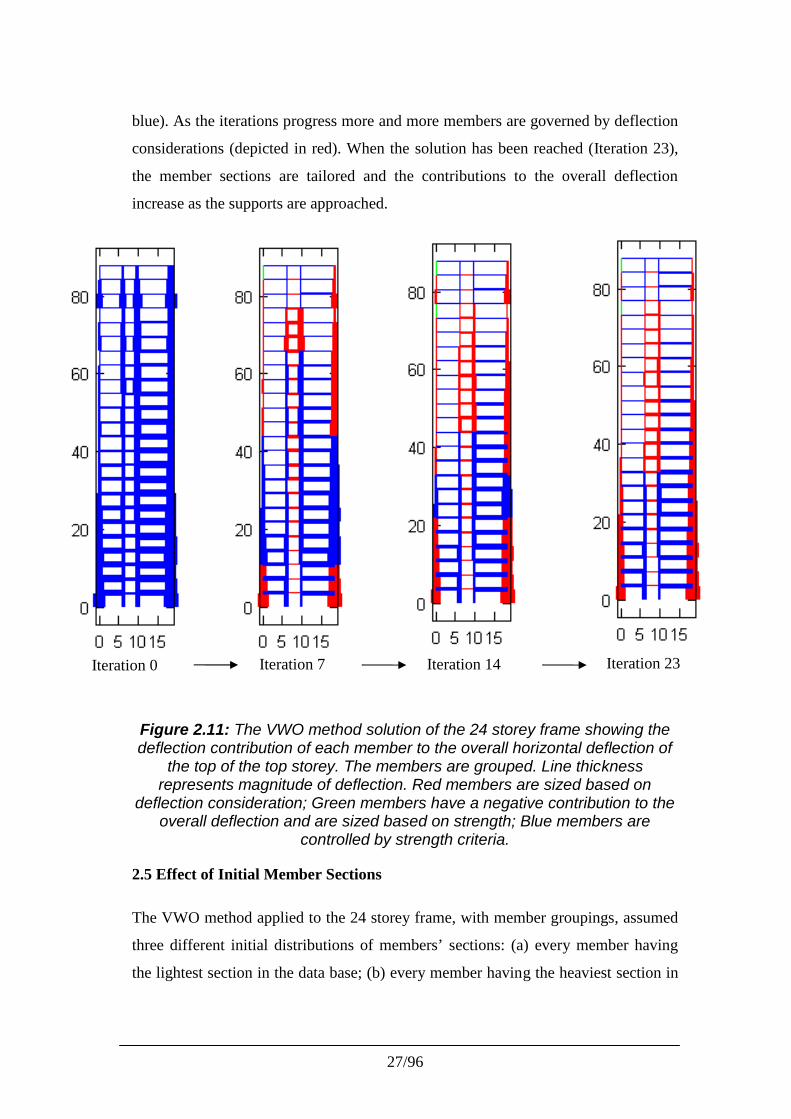
Figure 2.11 shows the contribution of each member to the overall horizontal
deflection of the top of the top storey at different stages in the optimisation process.
Iteration 0 starts off with each member satisfying the strength criteria (members in
250
300
350
400
450
500
550
600
62000 72000 82000 92000 102000
Mass (kg)
Def
lect
ion
(mm
)Grouped
No Grouping
Target Deflection
Final Mass: Camp (2005)Ant Colony OptimisationFinal Mass: Saka (1998)Genetic Algorithm
114000
27/96
blue). As the iterations progress more and more members are governed by deflection
considerations (depicted in red). When the solution has been reached (Iteration 23),
the member sections are tailored and the contributions to the overall deflection
increase as the supports are approached.
Figure 2.11: The VWO method solution of the 24 storey frame showing thedeflection contribution of each member to the overall horizontal deflection of
the top of the top storey. The members are grouped. Line thicknessrepresents magnitude of deflection. Red members are sized based on
deflection consideration; Green members have a negative contribution to theoverall deflection and are sized based on strength; Blue members are
controlled by strength criteria.
2.5 Effect of Initial Member Sections
The VWO method applied to the 24 storey frame, with member groupings, assumed
three different initial distributions of members’ sections: (a) every member having
the lightest section in the data base; (b) every member having the heaviest section in
Iteration 0 Iteration 7 Iteration 14 Iteration 23
28/96
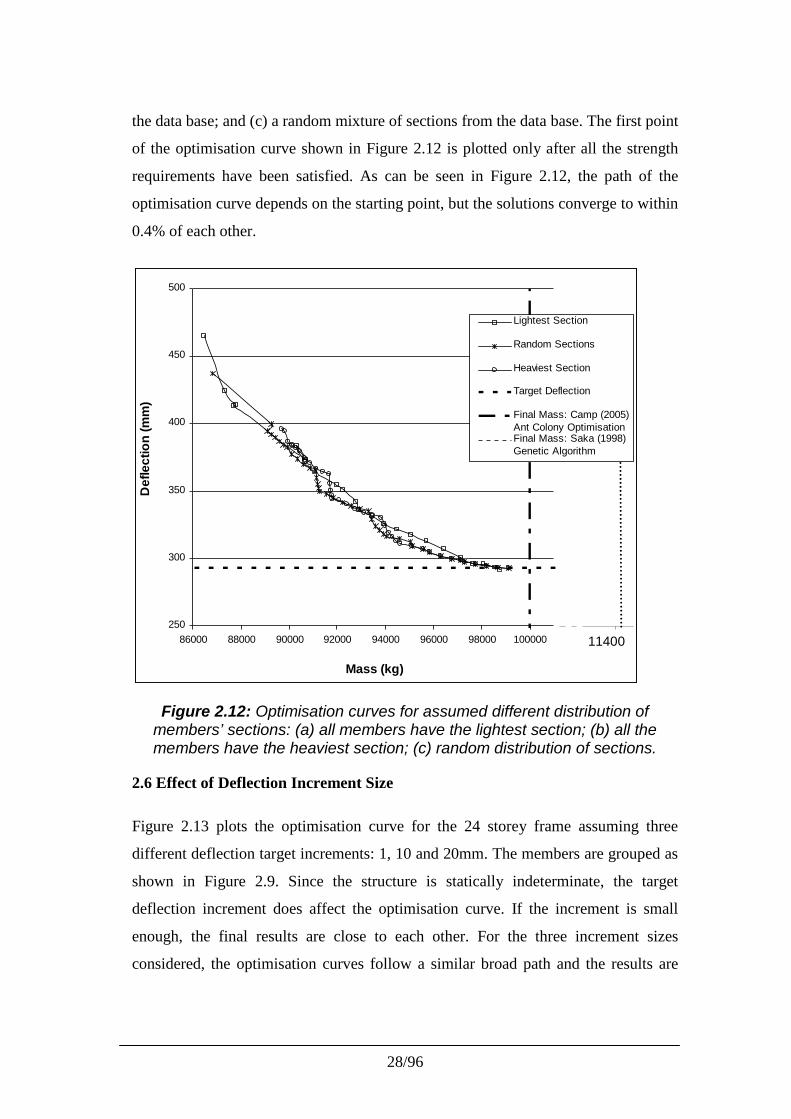
the data base; and (c) a random mixture of sections from the data base. The first point
of the optimisation curve shown in Figure 2.12 is plotted only after all the strength
requirements have been satisfied. As can be seen in Figure 2.12, the path of the
optimisation curve depends on the starting point, but the solutions converge to within
0.4% of each other.
Figure 2.12: Optimisation curves for assumed different distribution ofmembers’ sections: (a) all members have the lightest section; (b) all themembers have the heaviest section; (c) random distribution of sections.
2.6 Effect of Deflection Increment Size
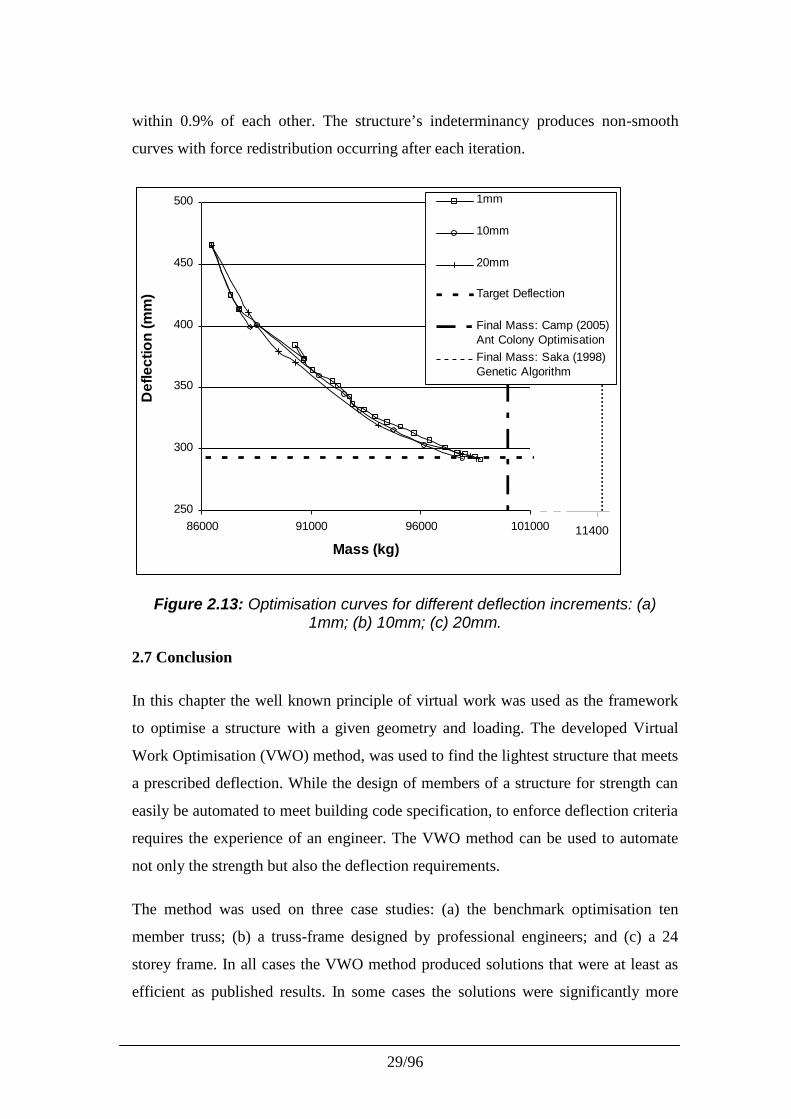
Figure 2.13 plots the optimisation curve for the 24 storey frame assuming three
different deflection target increments: 1, 10 and 20mm. The members are grouped as
shown in Figure 2.9. Since the structure is statically indeterminate, the target
deflection increment does affect the optimisation curve. If the increment is small
enough, the final results are close to each other. For the three increment sizes
considered, the optimisation curves follow a similar broad path and the results are
250
300
350
400
450
500
86000 88000 90000 92000 94000 96000 98000 100000
Mass (kg)
Def
lect
ion
(mm
)
Lightest Section
Random Sections
Heaviest Section
Target Deflection
Final Mass: Camp (2005)Ant Colony OptimisationFinal Mass: Saka (1998)Genetic Algorithm
114000
29/96
within 0.9% of each other. The structure’s indeterminancy produces non-smooth
curves with force redistribution occurring after each iteration.
Figure 2.13: Optimisation curves for different deflection increments: (a)1mm; (b) 10mm; (c) 20mm.
2.7 Conclusion
In this chapter the well known principle of virtual work was used as the framework
to optimise a structure with a given geometry and loading. The developed Virtual
Work Optimisation (VWO) method, was used to find the lightest structure that meets
a prescribed deflection. While the design of members of a structure for strength can
easily be automated to meet building code specification, to enforce deflection criteria
requires the experience of an engineer. The VWO method can be used to automate
not only the strength but also the deflection requirements.
The method was used on three case studies: (a) the benchmark optimisation ten
member truss; (b) a truss-frame designed by professional engineers; and (c) a 24
storey frame. In all cases the VWO method produced solutions that were at least as
efficient as published results. In some cases the solutions were significantly more
250
300
350
400
450
500
86000 91000 96000 101000
Mass (kg)
Def
lect
ion
(mm
)
1mm
10mm
20mm
Target Deflection
Final Mass: Camp (2005)Ant Colony OptimisationFinal Mass: Saka (1998)Genetic Algorithm
114000
30/96
economical. The computational effort (and hence time) of the method was less than
the methods reported in the literature, requiring orders of magnitude fewer iterations
to converge.
The optimisation can be constrained by grouping members into sets, and requiring
that all members in a given set have the same sectional properties. In practice
members are grouped together in order to simplify the design and the construction
process. Allowing for member groups was incorporated in the VWO method. As
expected, the constraint of grouping members together produced structures that were
heavier than when each member could have its own unique section.
Further research on the VWO method will focus on the following areas:
(a) Addressing multiple deflection criteria and load cases. This if the focus of
Chapter 3.
(b) How to select members belonging to a group. In the past this task relied on
the experience of the engineer. The problem here is to choose groups most
efficiently. This is addressed in Chapter 5.
(c) The uniqueness of the solution and the optimisation curve.
2.8 References
AISI (American Iron and Steel Institute) 2001. North American specifications for the
design of cold-formed steel structural members. Washington D.C.
BS5950. (1995) Structural Use of Steelwork in Building, British Standards
Institution.
Camp, C V, Bichon, B J and Stovall, S P. (2005) Design of Steel Frames Using Ant
Colony Optimisation. J. Struct. Div, ASCE, 131(3), 369-379
Davison, J H, and Adams, P F. (1974) Stability of braced and unbraced frames. J.
Struct. Div. ASCE, 100(2), 319-334.
Erbatur, F, Hasançebi, O, Tütüncü, I and Kiliç, H. (2009) Optimal design of planar
frames with genetic algorithms. Computers and Structures, 75, 209-224.
31/96
Gutkowski, W, Bauer J, and Zawidzka, J. (2000) An effective method for discrete
structural optimisation. Engineering Computations. Vol. 17. No. 4, pp. 417-426.
MCB University Press.
Haug, E J and Arora, J S. (1979) Applied Optimal Design, Wiley, New York, NY.
Kargahi, M, Anderson, J C, and Dessouky, M M (2006) Structural Weight
Optimisation of Frames Using Tabu Search. I: Optimisation Procedure. Journal
of Structural Engineering, ASCE, 132(12), 1858-1868.
Mahachi, J 2004. Design of Structural Steelwork to SANS 10162. CSIR Building and
Construction Technology. Pretoria
SAISC 2005. Southern African Steel Construction Handbook – Fifth Edition, “The
Red Book”. Southern African Institute of Steel Construction.
Saka, M.P. (2009) Optimum design of steel sway frames to BS5950 using harmony
search algorithm. Journal of Constructional Steel Research, 65, 36-43.
SANS 10162-1(2005), The Structural use of steel. Part 1: Limit-states design of hot-
rolled steelwork. South African National Standard.
32/96
CHAPTER 3: OPTIMISING STRUCTURES SUBJECT TO MULTIPLE
DEFLECTION CONSTRAINTS AND LOAD CASES
3.1 Introduction
In this chapter the Virtual Work Optimisation (VWO) method presented in Chapter 2
is expanded to address structures with multiple deflection constraints and load cases.
The principle of virtual work guides the optimisation process, in a similar manner to
that presented in Chapter 2. Discrete structural sections are selected to satisfy both
strength and deflection criteria. An optimal structure is defined as one which satisfies
all constraints using the minimum amount of material.
Many optimisation methods are capable of handling multiple deflection criteria, such
as genetic algorithms (e.g. Erbatur et al, 2009), optimality criterion methods (e.g.
Pezeshk, 1998) and tabu search (Kargahi et al., 2006). However, the difficulties
encountered in optimisation include high computational costs where thousands or
tens of thousands of iterations are needed. Methods using empirical optimisation
constants require calibration specific to each structure. A relationship is often
assumed between the sectional properties of members (e.g. Chan, 1992), which may
not exist in standard section databases. The number of iterations required to optimise
a structure can increase exponentially as the number of sections in a database
increases. Methods can be geometry or material specific. Despite the fact that only
discrete structural sections are available some methods choose sections from a
continuous spectrum.
This chapter is organized as follows. First, the VWO methodology is presented using
a simple portal frame as a case study. The theory underlying the method is discussed.
The advantages and limitations of the method are shown. Three further case studies
are presented to demonstrate the effectiveness of the method: (a) a 60 storey
building, (b) an industrial warehouse with gantry cranes, and (c) a stepped cantilever.
Results are compared to those found in the literature or produced by design
engineers.
33/96
3.2 The Virtual Work Optimisation (VWO) Method
In Chapter 2 the VWO method for optimising structures with single deflection
constraints was presented. Deformations were reduced by a fixed and prescribed
amount each iteration. Variable numbers of section changes were made per iteration.
The number of times a structure was reanalysed to satisfy initial strength constraints
was user-defined. Frame analyses were done both before reducing deflections and
before selecting sections to satisfy strength requirements.
In this chapter multiple deflection criteria and load cases are addressed. A fixed
number of section changes are made per iteration. The number of times the analysis
is performed to satisfy initial strength requirements is variable and dependent on the
structure. Frame analyses are done only before reducing deflections, which
substantially reduces computational requirements of the method in Chapter 2.
The new optimisation process can be summarized as follows: first, members are
chosen to satisfy strength requirements. Second, members most critical for reducing
deflections are identified and changed in an iterative manner until all deflection and
strength criteria are satisfied. Although the method is explained for 2D structures, its
application to 3D structures is identical.
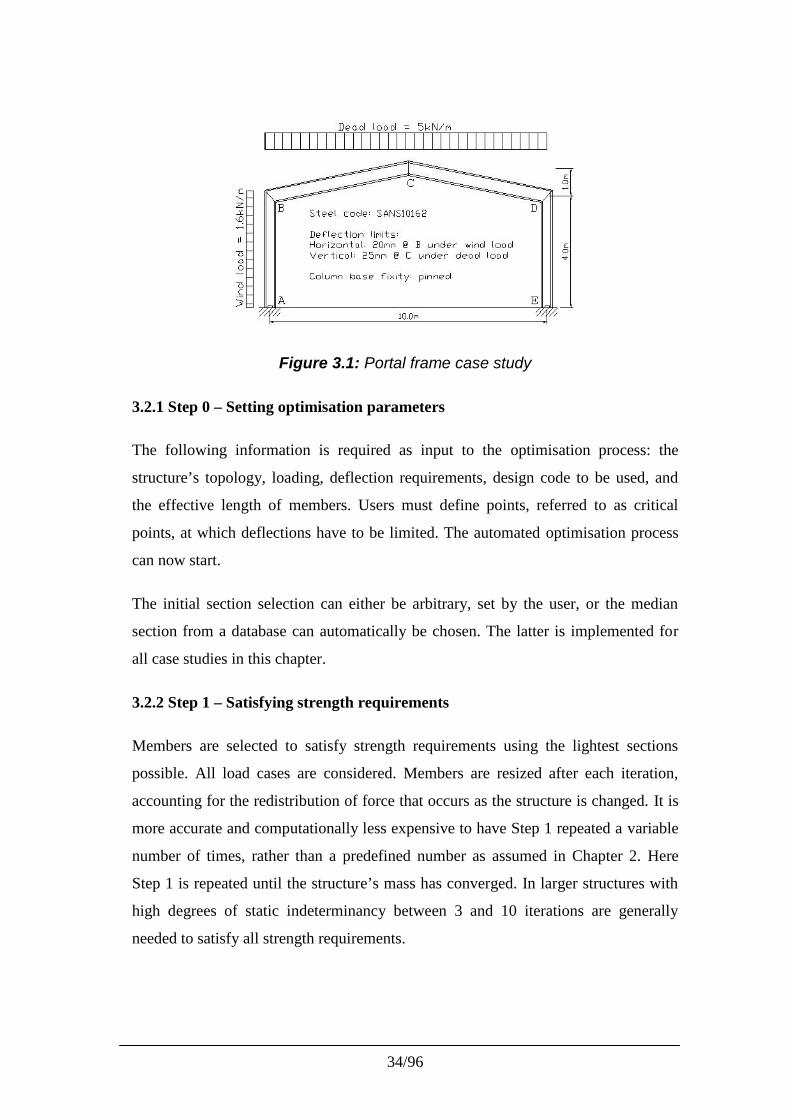
To explain how the method works a portal frame with only four members will be
optimised (Figure 3.1). This structure is subject to deflection constraints and strength
requirements. The maximum deflection of the roof apex is limited to span/400
(25mm) when dead load is applied. The maximum horizontal sway of the columns is
limited to height/200 (20mm) under wind load. Members are chosen to satisfy the
South African structural steel code SANS 10162 (2005) using grade 350W steel.
However, any design code and grade of steel can be used. I and H sections from
standard AISC databases will be used for the rafters and columns respectively. The
rafters and columns are grouped into two separate groups. All the members in each
group will be adjusted rather than individual members.
34/96
Figure 3.1: Portal frame case study
3.2.1 Step 0 – Setting optimisation parameters
The following information is required as input to the optimisation process: the
structure’s topology, loading, deflection requirements, design code to be used, and
the effective length of members. Users must define points, referred to as critical
points, at which deflections have to be limited. The automated optimisation process
can now start.
The initial section selection can either be arbitrary, set by the user, or the median
section from a database can automatically be chosen. The latter is implemented for
all case studies in this chapter.
3.2.2 Step 1 – Satisfying strength requirements
Members are selected to satisfy strength requirements using the lightest sections
possible. All load cases are considered. Members are resized after each iteration,
accounting for the redistribution of force that occurs as the structure is changed. It is
more accurate and computationally less expensive to have Step 1 repeated a variable
number of times, rather than a predefined number as assumed in Chapter 2. Here
Step 1 is repeated until the structure’s mass has converged. In larger structures with
high degrees of static indeterminancy between 3 and 10 iterations are generally
needed to satisfy all strength requirements.
35/96
Portal frame – choosing initial sections
For the portal frame only one strength iteration was needed. The sections selected for
the structure are W6x15 for the columns and W8x18 for the rafters.
3.2.3 Step 2 – Reducing deflections
Deflection constraints are now checked and if violated the deflection reduction
process starts. The principle of virtual work is applied to determine which members
should be changed.
The Principle of Virtual Work
This section briefly discusses the principle of virtual work. For a detailed explanation
refer to Chapter 2, Section 2.2.
When loading is applied, a structure will deflect and internal forces will be setup.
The amount that member i allows a point to deflect is defined as that member’s
deflection contribution, δi. The magnitude of the contribution is governed by the
member’s flexibility and internal forces. The total deflection at the critical point, Δ,
is calculated as the summation of all member deflection contributions:
MembersNo
ii
.
1
(3.1)
For two dimensional structures the deflection contribution of each member is:
Momenti
Axiali
L
i dxEI
MmL
EA
Ff (3.2)
The deflection contribution consists of axial and moment components. Shear is
neglected because it is assumed to be small. For the portal frame example Figure 3.2
shows the deflection contribution of each member for the two load cases. In this and
subsequent examples the thickness of the line is proportional to the deflection
contribution of the member. The numerical value of the deflection contributions are
shown. Note that each member’s strength requirements have been satisfied.
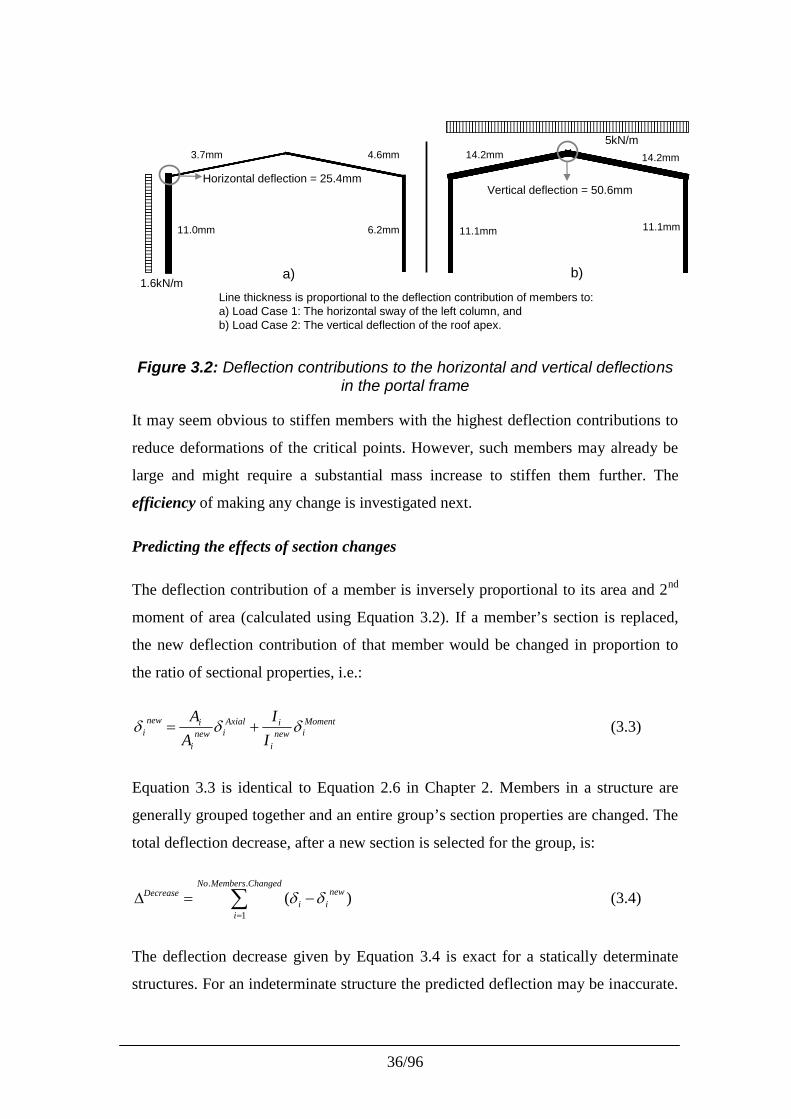
36/96
Horizontal deflection = 25.4mmVertical deflection = 50.6mm
1.6kN/m
5kN/m
11.0mm 6.2mm
3.7mm 4.6mm
11.1mm 11.1mm
14.2mm 14.2mm
Line thickness is proportional to the deflection contribution of members to:a) Load Case 1: The horizontal sway of the left column, andb) Load Case 2: The vertical deflection of the roof apex.
a) b)
Figure 3.2: Deflection contributions to the horizontal and vertical deflectionsin the portal frame
It may seem obvious to stiffen members with the highest deflection contributions to
reduce deformations of the critical points. However, such members may already be
large and might require a substantial mass increase to stiffen them further. The
efficiency of making any change is investigated next.
Predicting the effects of section changes
The deflection contribution of a member is inversely proportional to its area and 2nd
moment of area (calculated using Equation 3.2). If a member’s section is replaced,
the new deflection contribution of that member would be changed in proportion to
the ratio of sectional properties, i.e.:
Momentinew
i
iAxialinew
i
inewi
I
I
A
A (3.3)
Equation 3.3 is identical to Equation 2.6 in Chapter 2. Members in a structure are
generally grouped together and an entire group’s section properties are changed. The
total deflection decrease, after a new section is selected for the group, is:
ChangedMembersNo
i
newii
Decrease..
1
)( (3.4)
The deflection decrease given by Equation 3.4 is exact for a statically determinate
structures. For an indeterminate structure the predicted deflection may be inaccurate.
37/96
The degree of inaccuracy is determined by the magnitude of the section change
made, the size of the structure and the degree of static indeterminancy. Nonetheless,
this prediction provides an excellent guide regarding which members should have
their sections changed, and does not have to be precise.
The mass increase, ΔM, that occurs when a group of members is changed is given
by:
groupnew LmmM )( (3.5)
Where m denotes the mass per unit length of a section and Lgroup is the total length of
the group of members.
An efficient section change is one that causes a large deflection decrease at all
critical points per unit mass increase. Thus, it is necessary to determine the affect of
any change relative to all critical points and quantify this to determine the best
overall change.
Let the deflection decrease at a critical point j caused by a section change be
ΔjDecrease. Each critical point may have a different target deflection, Δj
Target, for any
load case and will require different stiffening of the structure. Since all deflection
constraints are equally important, a summed efficiency of change is proposed. Each
critical point’s deflection reduction is factored relative to its target deflection. The
efficiency of a section change for N critical points is defined as:
MEfficiency
N
jetT
j
Decreasej
1
arg
(3.6)
The efficiency of a section change can be viewed as the fraction of deflection
reduction that will occur per unit mass increase.
3.2.4 Step 3 – Adjusting member sections
Every group of members is replaced by all eligible sections in a database. An eligible
section has a larger cross-sectional area and/or second moment of area than the
38/96
current section. The overall process is fast because the structure is not analyzed for
each change. Instead, Equations 3.3 to 3.6 are used to predict the affect of adjusting
section properties by calculating efficiencies. There is a linear relationship between
the number of changes to be investigated, NC, and the number of eligible sections, Si,
for each group i. NC is determined by:
groupsofNo
iiSNC
..
1
(3.7)
Increasing the section database size or the number of groups does not result in an
exponential increase in computational costs, as it does for many other methods.
Large section databases and numbers of groups can be used.
After all eligible changes have been tested the one with the highest efficiency is
selected. Once a group has been adjusted to reduce deflections it is considered a
deflection dependent member. Such members are overdesigned in terms of strength.
Deflection dependent members will not have their section sizes decreased during
Step 1 in subsequent iterations. Equation 3.7 ensures that all critical point deflections
are reduced simultaneously, and it has been observed that they reach their target
deflections at approximately the same time. This prevents parts of the structure being
over-stiffened.
Reducing deflections in the portal frame
In the first deflection iteration for the portal frame example the affect of changing
columns and rafters to any H and I section is investigated. The most efficient change
found is to replace the W8x18 rafters with a W14x22 section. This causes deflections
to be reduced by approximately 2.1% (efficiency in percent) for each kilogram of
material added. Table 3.1 shows the calculations used to determine the efficiency of
this change. The predicted horizontal and vertical deflection reductions are 11.9mm
and 18.6mm. The structure’s mass increases by 64.3kg. Although axial strain energy
has been taken into account, it is small and is not shown in Table 3.1.
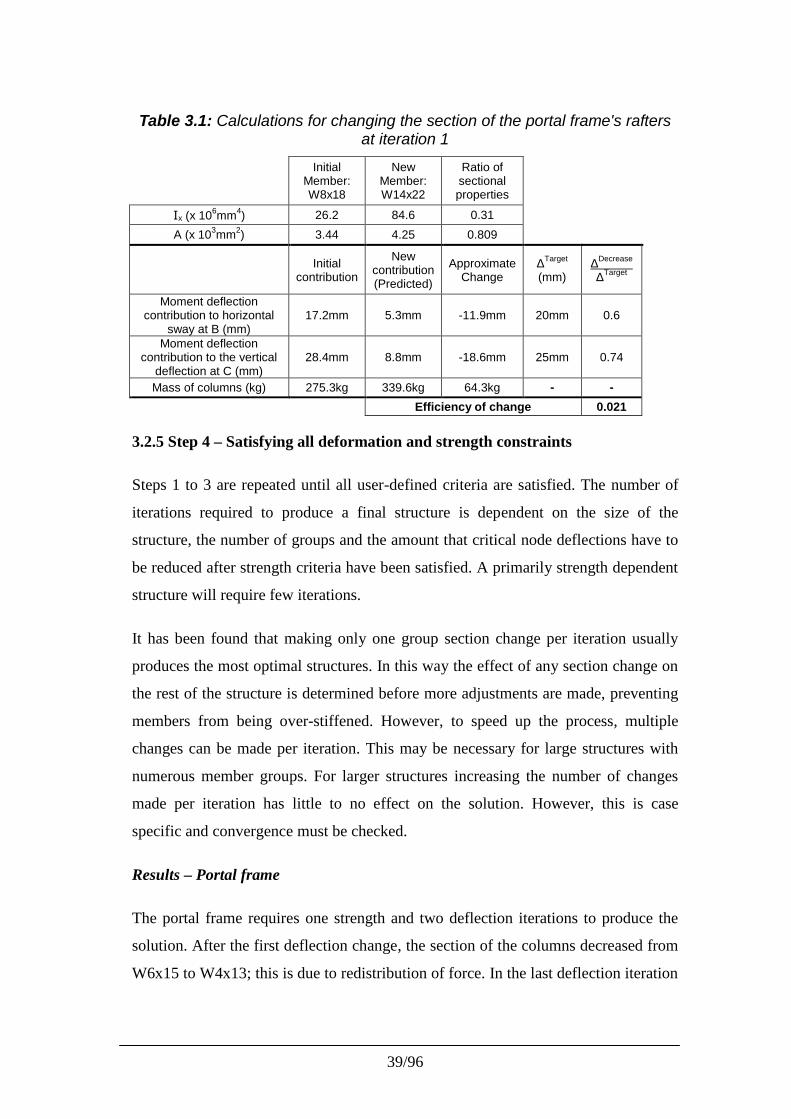
39/96
Table 3.1: Calculations for changing the section of the portal frame's raftersat iteration 1
InitialMember:W8x18
NewMember:W14x22
Ratio ofsectionalproperties
Ix (x 106mm4) 26.2 84.6 0.31A (x 103mm2) 3.44 4.25 0.809
Initialcontribution
Newcontribution(Predicted)
ApproximateChange
ΔTarget
(mm)ΔDecrease
ΔTarget
Moment deflectioncontribution to horizontal
sway at B (mm)17.2mm 5.3mm -11.9mm 20mm 0.6
Moment deflectioncontribution to the vertical
deflection at C (mm)28.4mm 8.8mm -18.6mm 25mm 0.74
Mass of columns (kg) 275.3kg 339.6kg 64.3kg - -Efficiency of change 0.021
3.2.5 Step 4 – Satisfying all deformation and strength constraints
Steps 1 to 3 are repeated until all user-defined criteria are satisfied. The number of
iterations required to produce a final structure is dependent on the size of the
structure, the number of groups and the amount that critical node deflections have to
be reduced after strength criteria have been satisfied. A primarily strength dependent
structure will require few iterations.
It has been found that making only one group section change per iteration usually
produces the most optimal structures. In this way the effect of any section change on
the rest of the structure is determined before more adjustments are made, preventing
members from being over-stiffened. However, to speed up the process, multiple
changes can be made per iteration. This may be necessary for large structures with
numerous member groups. For larger structures increasing the number of changes
made per iteration has little to no effect on the solution. However, this is case
specific and convergence must be checked.
Results – Portal frame
The portal frame requires one strength and two deflection iterations to produce the
solution. After the first deflection change, the section of the columns decreased from
W6x15 to W4x13; this is due to redistribution of force. In the last deflection iteration
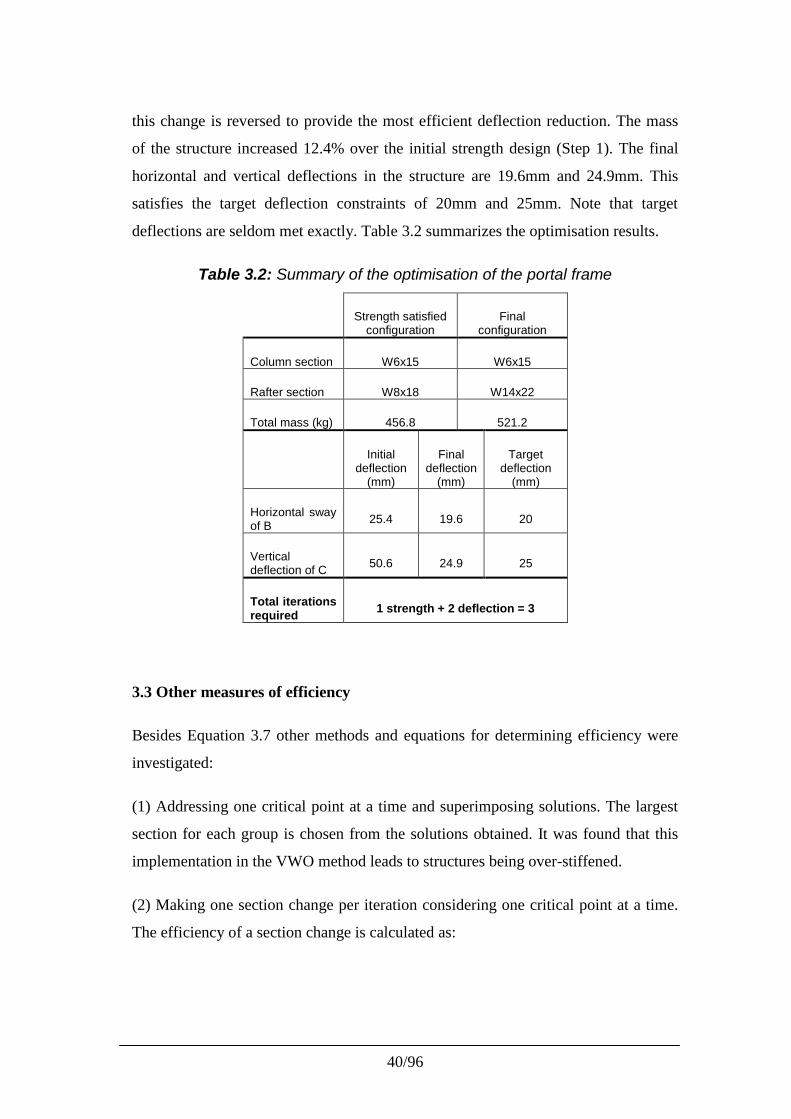
40/96
this change is reversed to provide the most efficient deflection reduction. The mass
of the structure increased 12.4% over the initial strength design (Step 1). The final
horizontal and vertical deflections in the structure are 19.6mm and 24.9mm. This
satisfies the target deflection constraints of 20mm and 25mm. Note that target
deflections are seldom met exactly. Table 3.2 summarizes the optimisation results.
Table 3.2: Summary of the optimisation of the portal frame
Strength satisfiedconfiguration
Finalconfiguration
Column section W6x15 W6x15
Rafter section W8x18 W14x22
Total mass (kg) 456.8 521.2
Initialdeflection
(mm)
Finaldeflection
(mm)
Targetdeflection
(mm)
Horizontal swayof B 25.4 19.6 20
Verticaldeflection of C 50.6 24.9 25
Total iterationsrequired 1 strength + 2 deflection = 3
3.3 Other measures of efficiency
Besides Equation 3.7 other methods and equations for determining efficiency were
investigated:
(1) Addressing one critical point at a time and superimposing solutions. The largest
section for each group is chosen from the solutions obtained. It was found that this
implementation in the VWO method leads to structures being over-stiffened.
(2) Making one section change per iteration considering one critical point at a time.
The efficiency of a section change is calculated as:
41/96
MEfficiency
Decreasej
(3.8)
Critical deflection points are considered in a given order, which influences the
solutions obtained. The method fails to find section changes which are efficient
relative to all critical deflection points.
(3) Determining efficiency by summing the deflection reductions:
M
Efficiency
N
j
Decreasej
1 (3.9)
In this situation the optimisation process becomes biased towards critical points with
large numeric deflection decreases, irrespective of the magnitude of target
deflections.
3.4 Advantages of the VWO method
The main advantages of the VWO method are listed below. The method satisfies
both strength and deflection requirements, which many methods do not. Any discrete
section databases can be utilised by the method and no relationship is assumed
between sectional properties. An increase in the size of a section database results in a
small increase in overall computational costs. Any number of deflection points and
load cases can be considered. No empirical optimisation constants must be set,
except for the number of section changes made per iteration. The method does not
require calibration. The initial choice of members does not have a great effect on the
solutions. The method is applicable to all structures, irrespective of geometry or the
material from which they are made.
The VWO method requires fewer iterations than many other optimisation methods.
A one-bay ten-storey structure with 9 member groups was optimised by Camp et al.
(2005) using Ant Colony Optimisation (ACO), by Pezeshk et al. (2000) using genetic
optimisation and by the VWO method. The ACO required 8,300 frame analyses, the
genetic optimisation 3000 and the present VWO method only 32 frame analyses. The
42/96
methodology presented in Chapter 2 requires almost double the number of frame
analyses.
3.5 Limitations to the VWO method
The VWO method has several limitations. As in all structural optimisation problems,
there is no certainty that the global minimum has been found. To determine if a
global minimum has been obtained an exhaustive search of all solutions needs to be
carried out. Groenwold et al. (1996) notes that this is essential for convex problems.
However, for average to large structures an exhaustive search produces a search area
far too large for modern computers to analyze.
It is possible that situations arise where members alternate between being strength
and deflection dependent as forces redistribute. Checks have to be included to
prevent infinite loops from occurring in such instances. This can be done by
artificially increasing the number of changes made in an iteration. Otherwise, if a
group is alternating between being strength and deflection dependent it can be
‘ignored’ for a few iterations, and only adjusted once a certain number of member
changes have been made.
It has been observed that in large multi-storey structures with no member grouping
irregular distributions of mass can be produced, as will be seen in Chapter 4. When
individual sections are stiffened it can alter load paths and cause regions of higher
and lower internal forces. The grouping of members prevents individual sections
from becoming over-stiffened and significantly changes load paths. This problem
was not encountered in the case studies presented below
3.6 Case studies
Three case studies are presented below. The structures optimised are a 60-storey 7-
bay frame, a warehouse designed by professional, structural engineers, and a stepped
cantilever.
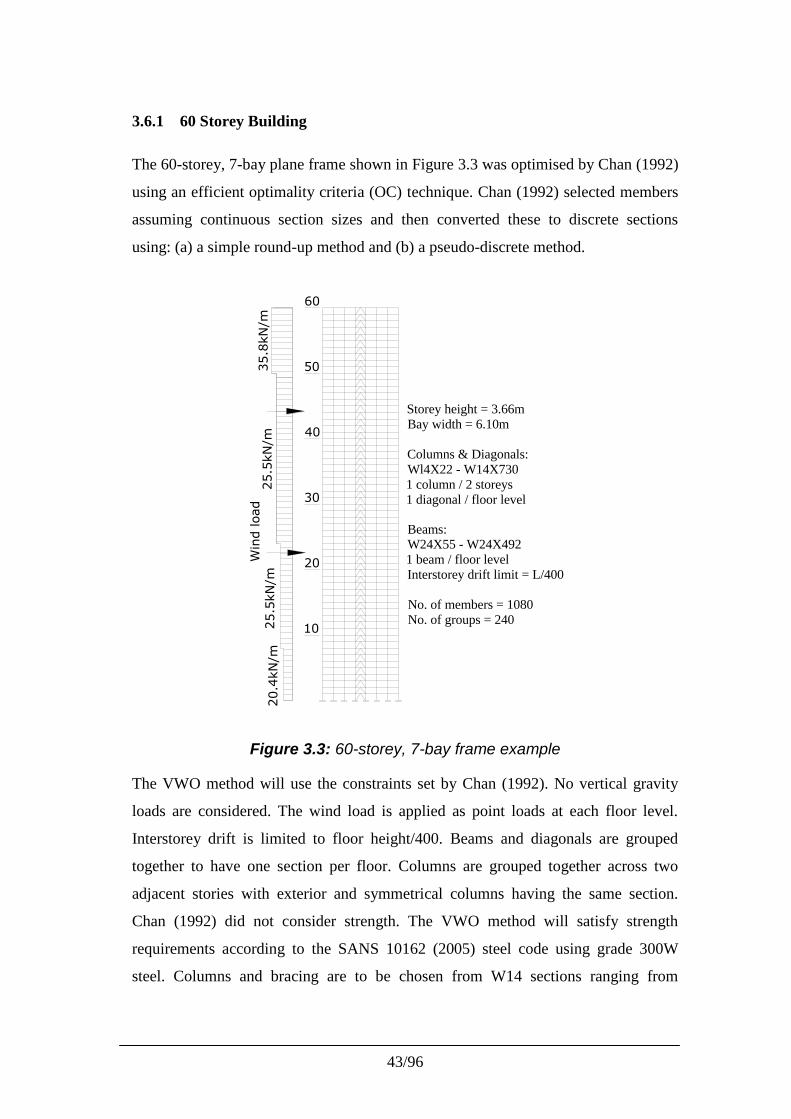
43/96
3.6.1 60 Storey Building
The 60-storey, 7-bay plane frame shown in Figure 3.3 was optimised by Chan (1992)
using an efficient optimality criteria (OC) technique. Chan (1992) selected members
assuming continuous section sizes and then converted these to discrete sections
using: (a) a simple round-up method and (b) a pseudo-discrete method.
10
20
30
40
50
60
20.4
kN/m
25.5
kN/m
25.5
kN/m
35.8
kN/m
Storey height = 3.66mBay width = 6.10m
Columns & Diagonals:Wl4X22 - W14X7301 column / 2 storeys1 diagonal / floor level
Beams:W24X55 - W24X4921 beam / floor levelInterstorey drift limit = L/400
No. of members = 1080No. of groups = 240
Win
d load
Figure 3.3: 60-storey, 7-bay frame example
The VWO method will use the constraints set by Chan (1992). No vertical gravity
loads are considered. The wind load is applied as point loads at each floor level.
Interstorey drift is limited to floor height/400. Beams and diagonals are grouped
together to have one section per floor. Columns are grouped together across two
adjacent stories with exterior and symmetrical columns having the same section.
Chan (1992) did not consider strength. The VWO method will satisfy strength
requirements according to the SANS 10162 (2005) steel code using grade 300W
steel. Columns and bracing are to be chosen from W14 sections ranging from
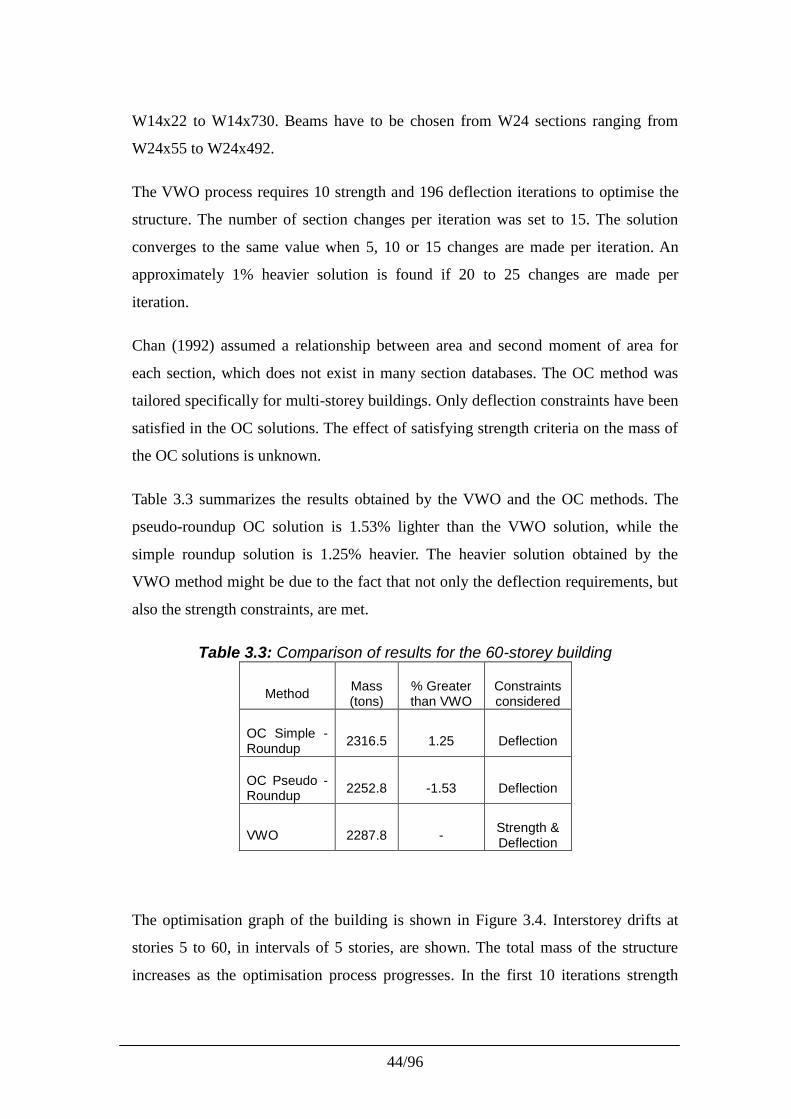
44/96
W14x22 to W14x730. Beams have to be chosen from W24 sections ranging from
W24x55 to W24x492.
The VWO process requires 10 strength and 196 deflection iterations to optimise the
structure. The number of section changes per iteration was set to 15. The solution
converges to the same value when 5, 10 or 15 changes are made per iteration. An
approximately 1% heavier solution is found if 20 to 25 changes are made per
iteration.
Chan (1992) assumed a relationship between area and second moment of area for
each section, which does not exist in many section databases. The OC method was
tailored specifically for multi-storey buildings. Only deflection constraints have been
satisfied in the OC solutions. The effect of satisfying strength criteria on the mass of
the OC solutions is unknown.
Table 3.3 summarizes the results obtained by the VWO and the OC methods. The
pseudo-roundup OC solution is 1.53% lighter than the VWO solution, while the
simple roundup solution is 1.25% heavier. The heavier solution obtained by the
VWO method might be due to the fact that not only the deflection requirements, but
also the strength constraints, are met.
Table 3.3: Comparison of results for the 60-storey building
Method Mass(tons)
% Greaterthan VWO
Constraintsconsidered
OC Simple -Roundup 2316.5 1.25 Deflection
OC Pseudo -Roundup 2252.8 -1.53 Deflection
VWO 2287.8 - Strength &Deflection
The optimisation graph of the building is shown in Figure 3.4. Interstorey drifts at
stories 5 to 60, in intervals of 5 stories, are shown. The total mass of the structure
increases as the optimisation process progresses. In the first 10 iterations strength
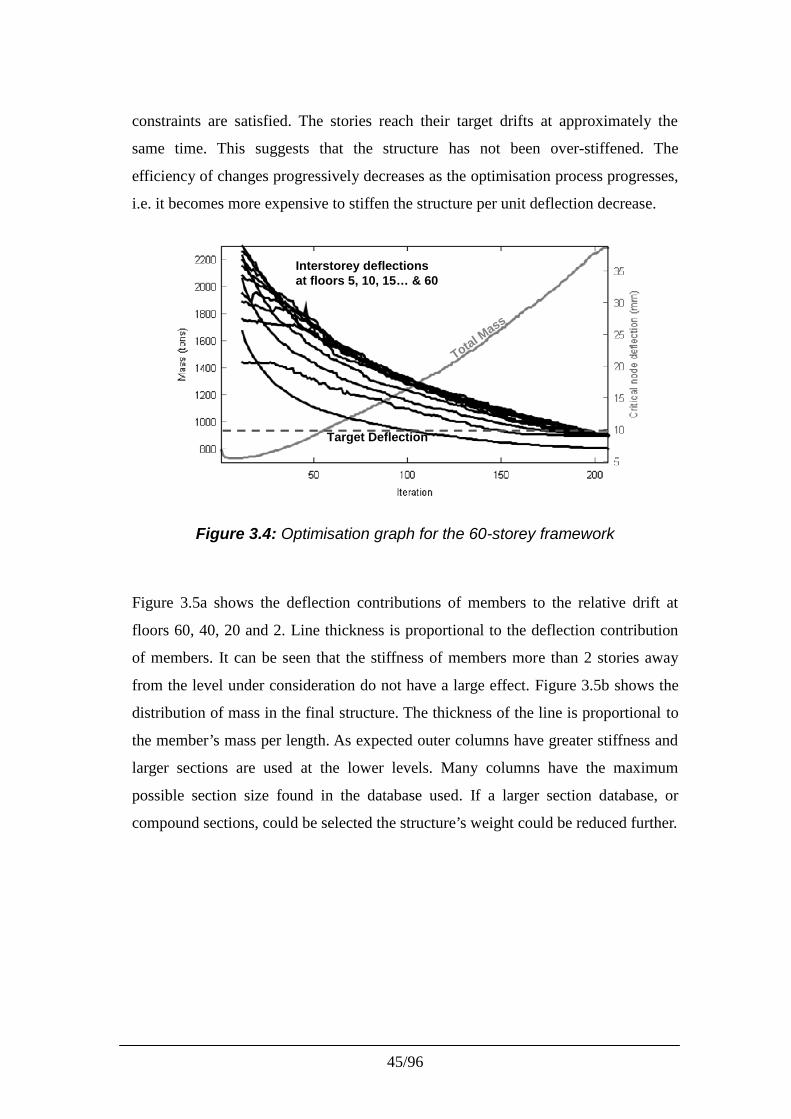
45/96
constraints are satisfied. The stories reach their target drifts at approximately the
same time. This suggests that the structure has not been over-stiffened. The
efficiency of changes progressively decreases as the optimisation process progresses,
i.e. it becomes more expensive to stiffen the structure per unit deflection decrease.
Total Mass
Interstorey deflectionsat floors 5, 10, 15… & 60
Target Deflection
Figure 3.4: Optimisation graph for the 60-storey framework
Figure 3.5a shows the deflection contributions of members to the relative drift at
floors 60, 40, 20 and 2. Line thickness is proportional to the deflection contribution
of members. It can be seen that the stiffness of members more than 2 stories away
from the level under consideration do not have a large effect. Figure 3.5b shows the
distribution of mass in the final structure. The thickness of the line is proportional to
the member’s mass per length. As expected outer columns have greater stiffness and
larger sections are used at the lower levels. Many columns have the maximum
possible section size found in the database used. If a larger section database, or
compound sections, could be selected the structure’s weight could be reduced further.
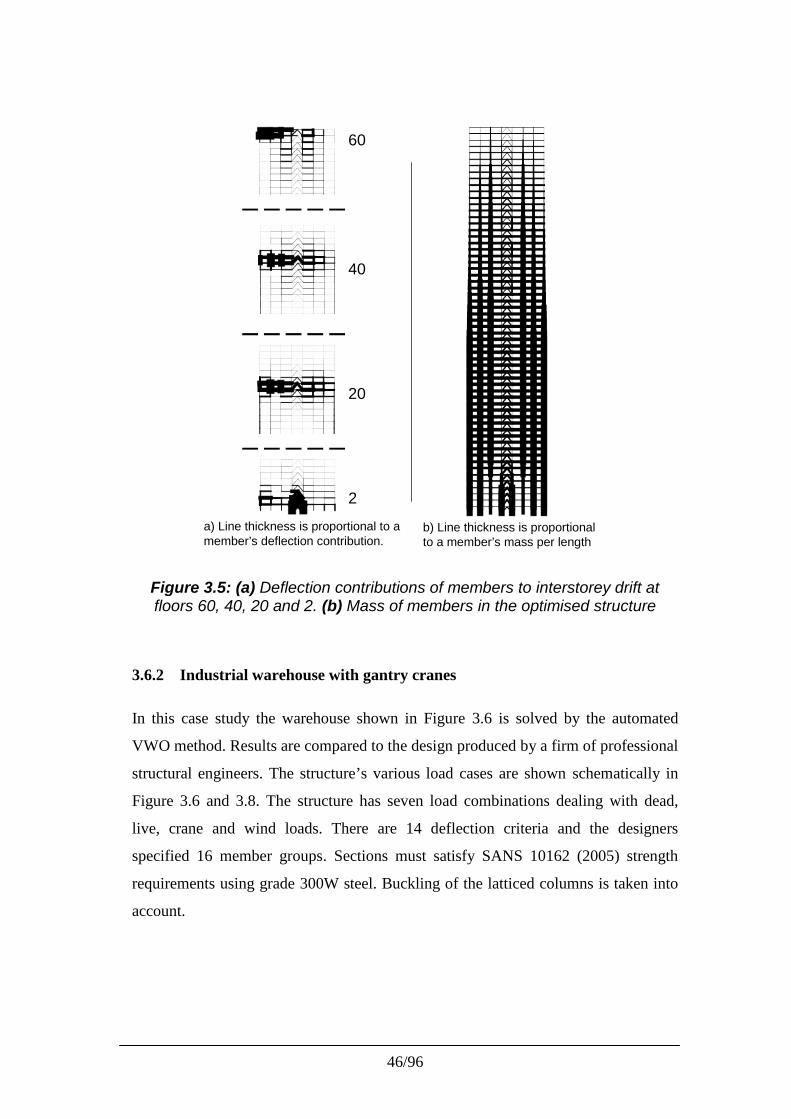
46/96
a) Line thickness is proportional to amember’s deflection contribution.
60
40
20
2
b) Line thickness is proportionalto a member’s mass per length
Figure 3.5: (a) Deflection contributions of members to interstorey drift atfloors 60, 40, 20 and 2. (b) Mass of members in the optimised structure
3.6.2 Industrial warehouse with gantry cranes
In this case study the warehouse shown in Figure 3.6 is solved by the automated
VWO method. Results are compared to the design produced by a firm of professional
structural engineers. The structure’s various load cases are shown schematically in
Figure 3.6 and 3.8. The structure has seven load combinations dealing with dead,
live, crane and wind loads. There are 14 deflection criteria and the designers
specified 16 member groups. Sections must satisfy SANS 10162 (2005) strength
requirements using grade 300W steel. Buckling of the latticed columns is taken into
account.
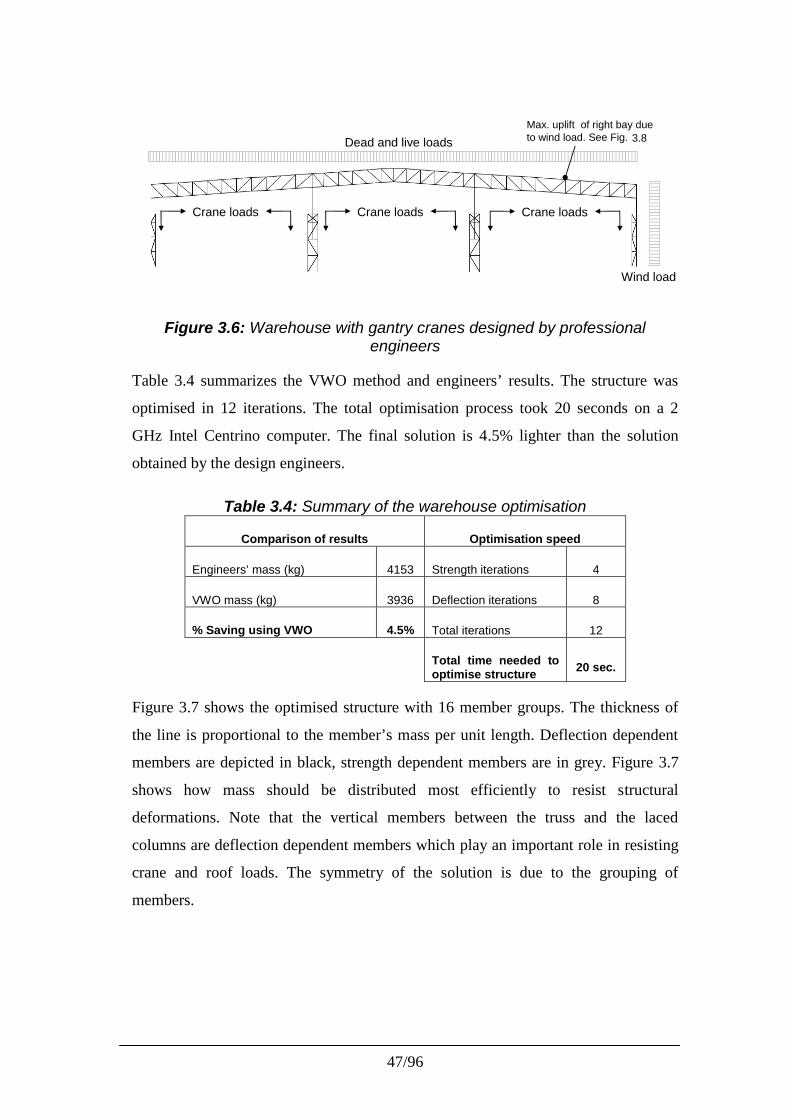
47/96
Dead and live loads
Crane loads
Max. uplift of right bay dueto wind load. See Fig. 8
Wind load
Crane loads Crane loads
Figure 3.6: Warehouse with gantry cranes designed by professionalengineers
Table 3.4 summarizes the VWO method and engineers’ results. The structure was
optimised in 12 iterations. The total optimisation process took 20 seconds on a 2
GHz Intel Centrino computer. The final solution is 4.5% lighter than the solution
obtained by the design engineers.
Table 3.4: Summary of the warehouse optimisation
Comparison of results Optimisation speed
Engineers’ mass (kg) 4153 Strength iterations 4
VWO mass (kg) 3936 Deflection iterations 8
% Saving using VWO 4.5% Total iterations 12
Total time needed tooptimise structure 20 sec.
Figure 3.7 shows the optimised structure with 16 member groups. The thickness of
the line is proportional to the member’s mass per unit length. Deflection dependent
members are depicted in black, strength dependent members are in grey. Figure 3.7
shows how mass should be distributed most efficiently to resist structural
deformations. Note that the vertical members between the truss and the laced
columns are deflection dependent members which play an important role in resisting
crane and roof loads. The symmetry of the solution is due to the grouping of
members.
3.8
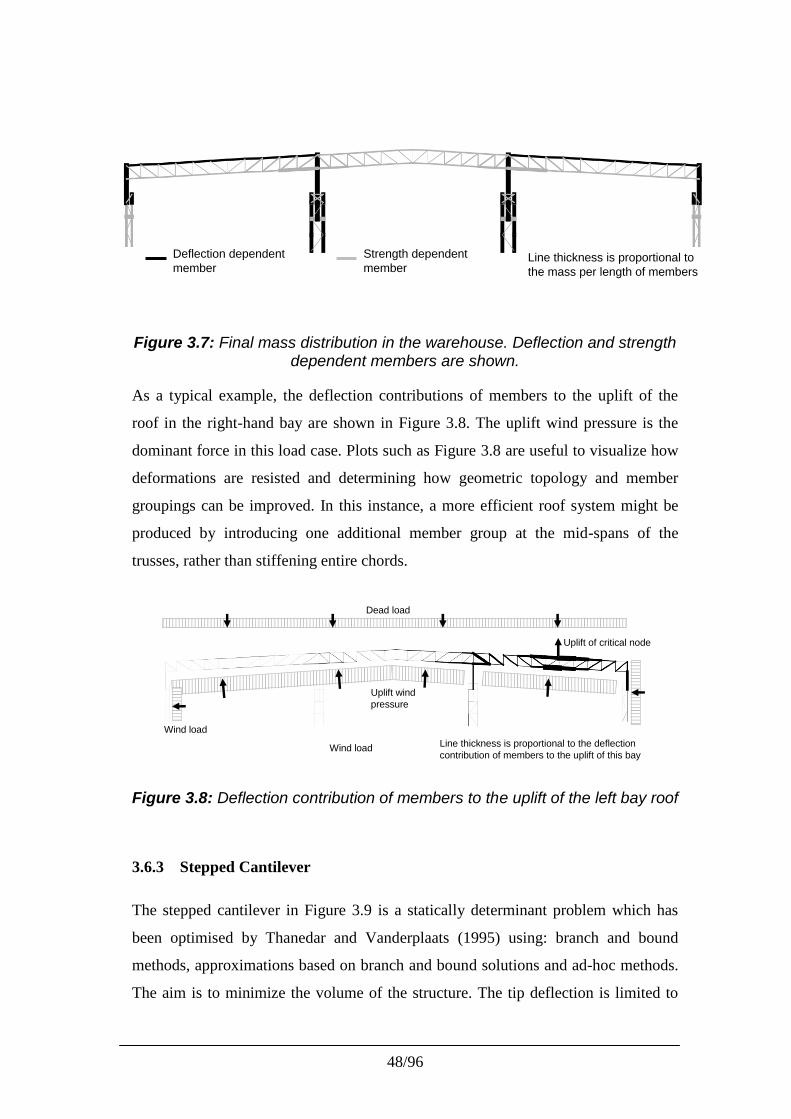
48/96
Strength dependentmember
Deflection dependentmember
Line thickness is proportional tothe mass per length of members
Figure 3.7: Final mass distribution in the warehouse. Deflection and strengthdependent members are shown.
As a typical example, the deflection contributions of members to the uplift of the
roof in the right-hand bay are shown in Figure 3.8. The uplift wind pressure is the
dominant force in this load case. Plots such as Figure 3.8 are useful to visualize how
deformations are resisted and determining how geometric topology and member
groupings can be improved. In this instance, a more efficient roof system might be
produced by introducing one additional member group at the mid-spans of the
trusses, rather than stiffening entire chords.
Uplift windpressure
Dead load
Line thickness is proportional to the deflectioncontribution of members to the uplift of this bay
Uplift of critical node
Wind load
Wind load
Figure 3.8: Deflection contribution of members to the uplift of the left bay roof
3.6.3 Stepped Cantilever
The stepped cantilever in Figure 3.9 is a statically determinant problem which has
been optimised by Thanedar and Vanderplaats (1995) using: branch and bound
methods, approximations based on branch and bound solutions and ad-hoc methods.
The aim is to minimize the volume of the structure. The tip deflection is limited to
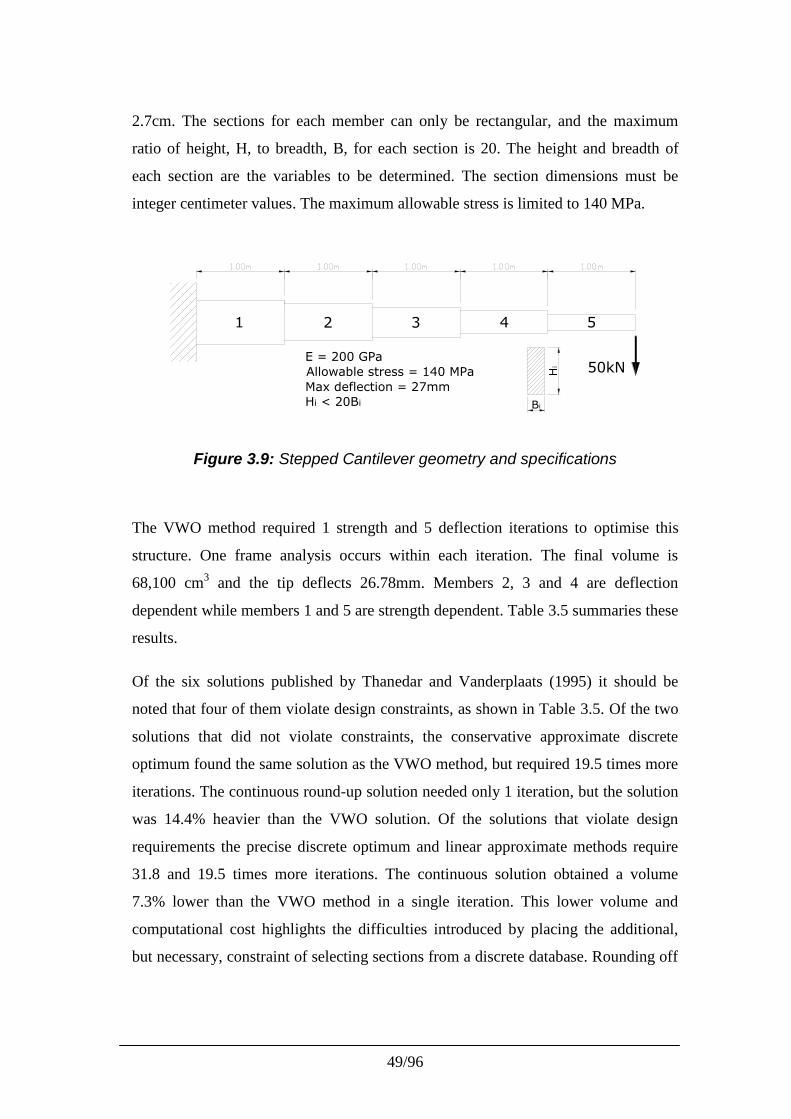
49/96
2.7cm. The sections for each member can only be rectangular, and the maximum
ratio of height, H, to breadth, B, for each section is 20. The height and breadth of
each section are the variables to be determined. The section dimensions must be
integer centimeter values. The maximum allowable stress is limited to 140 MPa.
1 2 3 4 5
50kN
Bi
Hi
E = 200 GPaAllowable stress = 140 MPaMax deflection = 27mmHi < 20Bi
Figure 3.9: Stepped Cantilever geometry and specifications
The VWO method required 1 strength and 5 deflection iterations to optimise this
structure. One frame analysis occurs within each iteration. The final volume is
68,100 cm3 and the tip deflects 26.78mm. Members 2, 3 and 4 are deflection
dependent while members 1 and 5 are strength dependent. Table 3.5 summaries these
results.
Of the six solutions published by Thanedar and Vanderplaats (1995) it should be
noted that four of them violate design constraints, as shown in Table 3.5. Of the two
solutions that did not violate constraints, the conservative approximate discrete
optimum found the same solution as the VWO method, but required 19.5 times more
iterations. The continuous round-up solution needed only 1 iteration, but the solution
was 14.4% heavier than the VWO solution. Of the solutions that violate design
requirements the precise discrete optimum and linear approximate methods require
31.8 and 19.5 times more iterations. The continuous solution obtained a volume
7.3% lower than the VWO method in a single iteration. This lower volume and
computational cost highlights the difficulties introduced by placing the additional,
but necessary, constraint of selecting sections from a discrete database. Rounding off
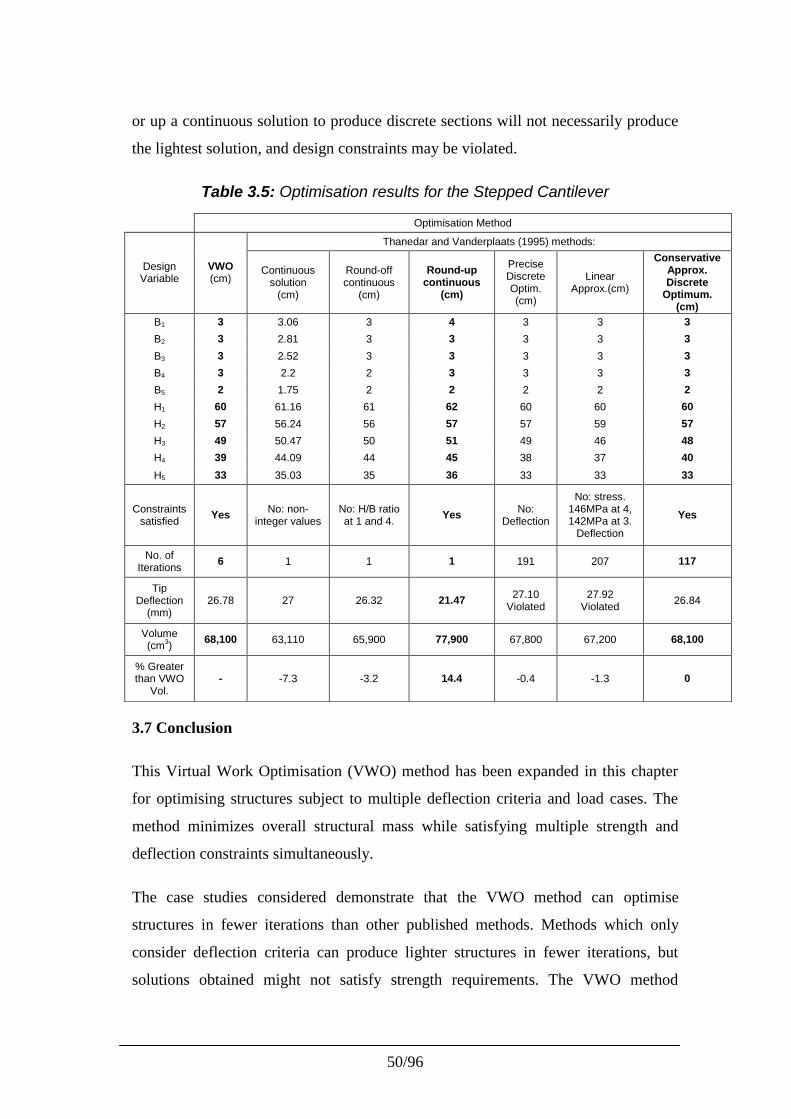
50/96
or up a continuous solution to produce discrete sections will not necessarily produce
the lightest solution, and design constraints may be violated.
Table 3.5: Optimisation results for the Stepped Cantilever
3.7 Conclusion
This Virtual Work Optimisation (VWO) method has been expanded in this chapter
for optimising structures subject to multiple deflection criteria and load cases. The
method minimizes overall structural mass while satisfying multiple strength and
deflection constraints simultaneously.
The case studies considered demonstrate that the VWO method can optimise
structures in fewer iterations than other published methods. Methods which only
consider deflection criteria can produce lighter structures in fewer iterations, but
solutions obtained might not satisfy strength requirements. The VWO method
Optimisation Method
Thanedar and Vanderplaats (1995) methods:
DesignVariable
VWO(cm)
Continuoussolution
(cm)
Round-offcontinuous
(cm)
Round-upcontinuous
(cm)
PreciseDiscreteOptim.(cm)
LinearApprox.(cm)
ConservativeApprox.Discrete
Optimum.(cm)
B1 3 3.06 3 4 3 3 3B2 3 2.81 3 3 3 3 3B3 3 2.52 3 3 3 3 3B4 3 2.2 2 3 3 3 3B5 2 1.75 2 2 2 2 2H1 60 61.16 61 62 60 60 60H2 57 56.24 56 57 57 59 57H3 49 50.47 50 51 49 46 48H4 39 44.09 44 45 38 37 40H5 33 35.03 35 36 33 33 33
Constraintssatisfied Yes No: non-
integer valuesNo: H/B ratioat 1 and 4. Yes No:
Deflection
No: stress.146MPa at 4,142MPa at 3.
Deflection
Yes
No. ofIterations 6 1 1 1 191 207 117
TipDeflection
(mm)26.78 27 26.32 21.47 27.10
Violated27.92
Violated 26.84
Volume(cm3) 68,100 63,110 65,900 77,900 67,800 67,200 68,100
% Greaterthan VWO
Vol.- -7.3 -3.2 14.4 -0.4 -1.3 0
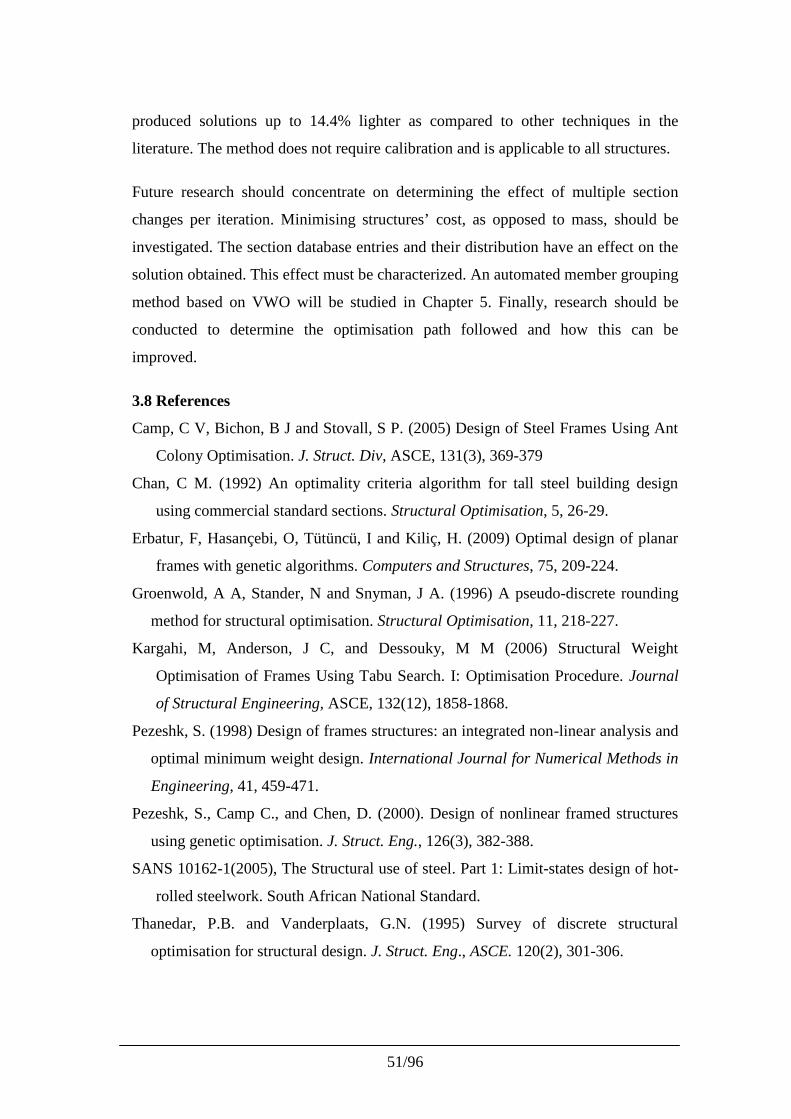
51/96
produced solutions up to 14.4% lighter as compared to other techniques in the
literature. The method does not require calibration and is applicable to all structures.
Future research should concentrate on determining the effect of multiple section
changes per iteration. Minimising structures’ cost, as opposed to mass, should be
investigated. The section database entries and their distribution have an effect on the
solution obtained. This effect must be characterized. An automated member grouping
method based on VWO will be studied in Chapter 5. Finally, research should be
conducted to determine the optimisation path followed and how this can be
improved.
3.8 References
Camp, C V, Bichon, B J and Stovall, S P. (2005) Design of Steel Frames Using Ant
Colony Optimisation. J. Struct. Div, ASCE, 131(3), 369-379
Chan, C M. (1992) An optimality criteria algorithm for tall steel building design
using commercial standard sections. Structural Optimisation, 5, 26-29.
Erbatur, F, Hasançebi, O, Tütüncü, I and Kiliç, H. (2009) Optimal design of planar
frames with genetic algorithms. Computers and Structures, 75, 209-224.
Groenwold, A A, Stander, N and Snyman, J A. (1996) A pseudo-discrete rounding
method for structural optimisation. Structural Optimisation, 11, 218-227.
Kargahi, M, Anderson, J C, and Dessouky, M M (2006) Structural Weight
Optimisation of Frames Using Tabu Search. I: Optimisation Procedure. Journal
of Structural Engineering, ASCE, 132(12), 1858-1868.
Pezeshk, S. (1998) Design of frames structures: an integrated non-linear analysis and
optimal minimum weight design. International Journal for Numerical Methods in
Engineering, 41, 459-471.
Pezeshk, S., Camp C., and Chen, D. (2000). Design of nonlinear framed structures
using genetic optimisation. J. Struct. Eng., 126(3), 382-388.
SANS 10162-1(2005), The Structural use of steel. Part 1: Limit-states design of hot-
rolled steelwork. South African National Standard.
Thanedar, P.B. and Vanderplaats, G.N. (1995) Survey of discrete structural
optimisation for structural design. J. Struct. Eng., ASCE. 120(2), 301-306.
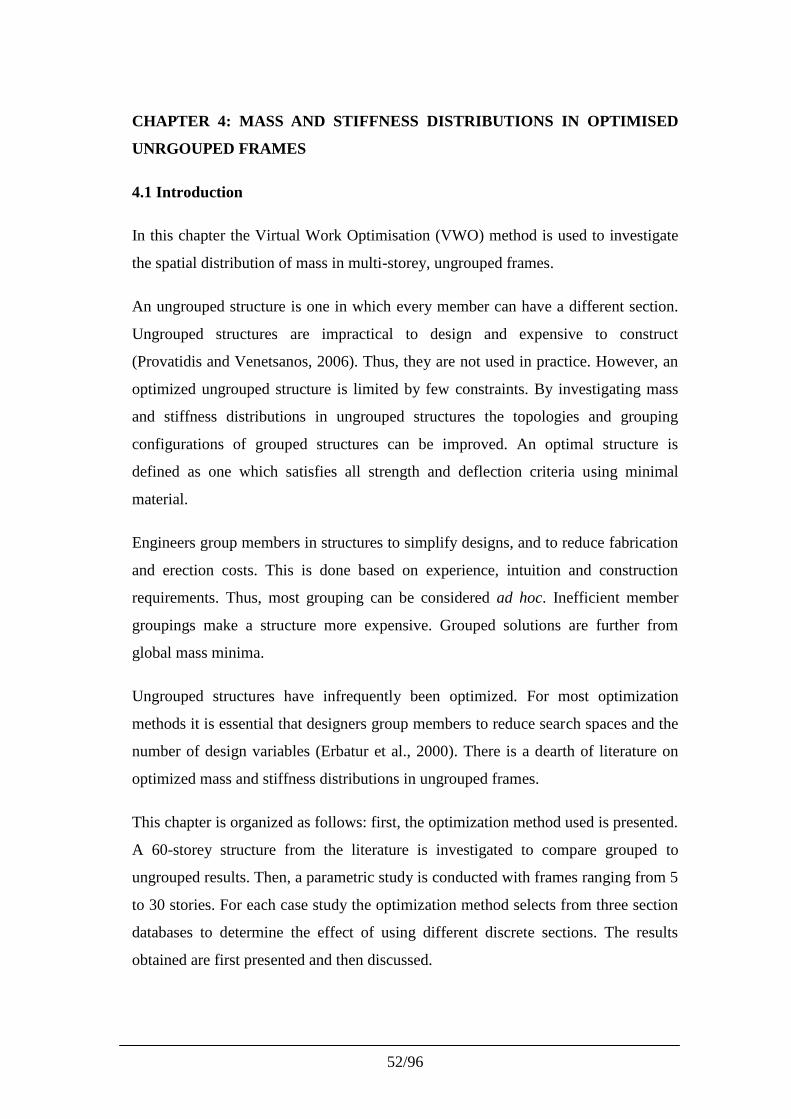
52/96
CHAPTER 4: MASS AND STIFFNESS DISTRIBUTIONS IN OPTIMISED
UNRGOUPED FRAMES
4.1 Introduction
In this chapter the Virtual Work Optimisation (VWO) method is used to investigate
the spatial distribution of mass in multi-storey, ungrouped frames.
An ungrouped structure is one in which every member can have a different section.
Ungrouped structures are impractical to design and expensive to construct
(Provatidis and Venetsanos, 2006). Thus, they are not used in practice. However, an
optimized ungrouped structure is limited by few constraints. By investigating mass
and stiffness distributions in ungrouped structures the topologies and grouping
configurations of grouped structures can be improved. An optimal structure is
defined as one which satisfies all strength and deflection criteria using minimal
material.
Engineers group members in structures to simplify designs, and to reduce fabrication
and erection costs. This is done based on experience, intuition and construction
requirements. Thus, most grouping can be considered ad hoc. Inefficient member
groupings make a structure more expensive. Grouped solutions are further from
global mass minima.
Ungrouped structures have infrequently been optimized. For most optimization
methods it is essential that designers group members to reduce search spaces and the
number of design variables (Erbatur et al., 2000). There is a dearth of literature on
optimized mass and stiffness distributions in ungrouped frames.
This chapter is organized as follows: first, the optimization method used is presented.
A 60-storey structure from the literature is investigated to compare grouped to
ungrouped results. Then, a parametric study is conducted with frames ranging from 5
to 30 stories. For each case study the optimization method selects from three section
databases to determine the effect of using different discrete sections. The results
obtained are first presented and then discussed.
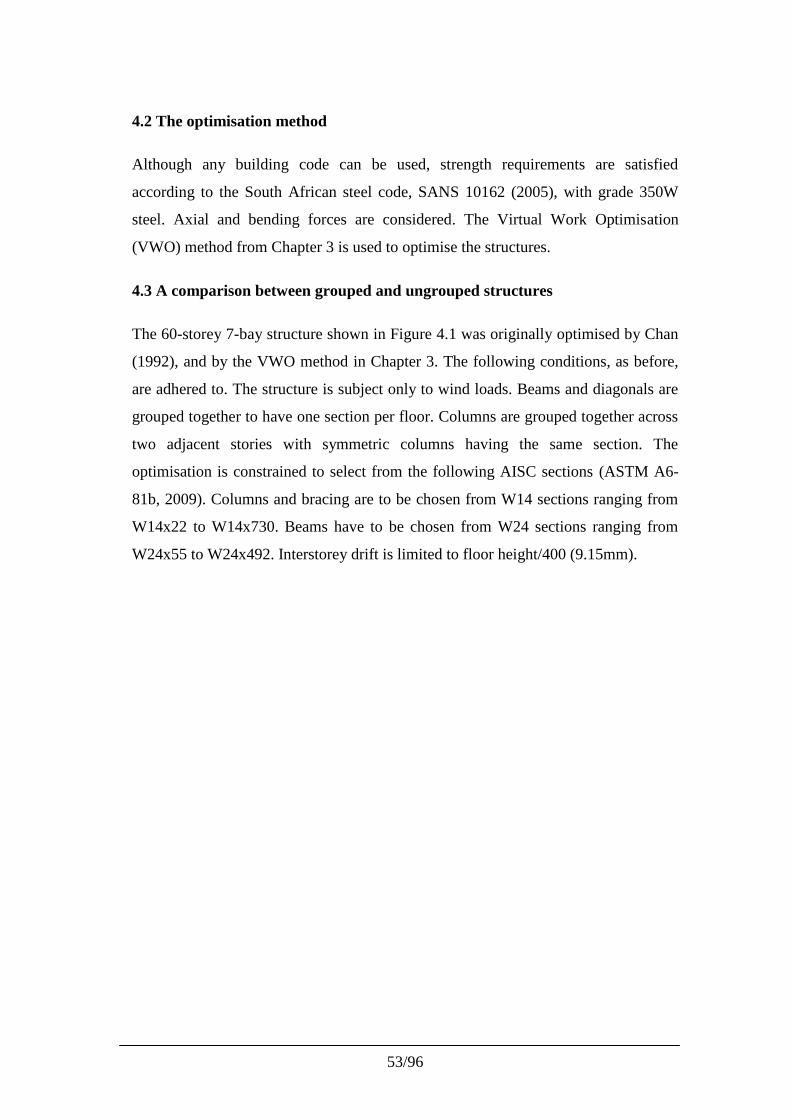
53/96
4.2 The optimisation method
Although any building code can be used, strength requirements are satisfied
according to the South African steel code, SANS 10162 (2005), with grade 350W
steel. Axial and bending forces are considered. The Virtual Work Optimisation
(VWO) method from Chapter 3 is used to optimise the structures.
4.3 A comparison between grouped and ungrouped structures
The 60-storey 7-bay structure shown in Figure 4.1 was originally optimised by Chan
(1992), and by the VWO method in Chapter 3. The following conditions, as before,
are adhered to. The structure is subject only to wind loads. Beams and diagonals are
grouped together to have one section per floor. Columns are grouped together across
two adjacent stories with symmetric columns having the same section. The
optimisation is constrained to select from the following AISC sections (ASTM A6-
81b, 2009). Columns and bracing are to be chosen from W14 sections ranging from
W14x22 to W14x730. Beams have to be chosen from W24 sections ranging from
W24x55 to W24x492. Interstorey drift is limited to floor height/400 (9.15mm).
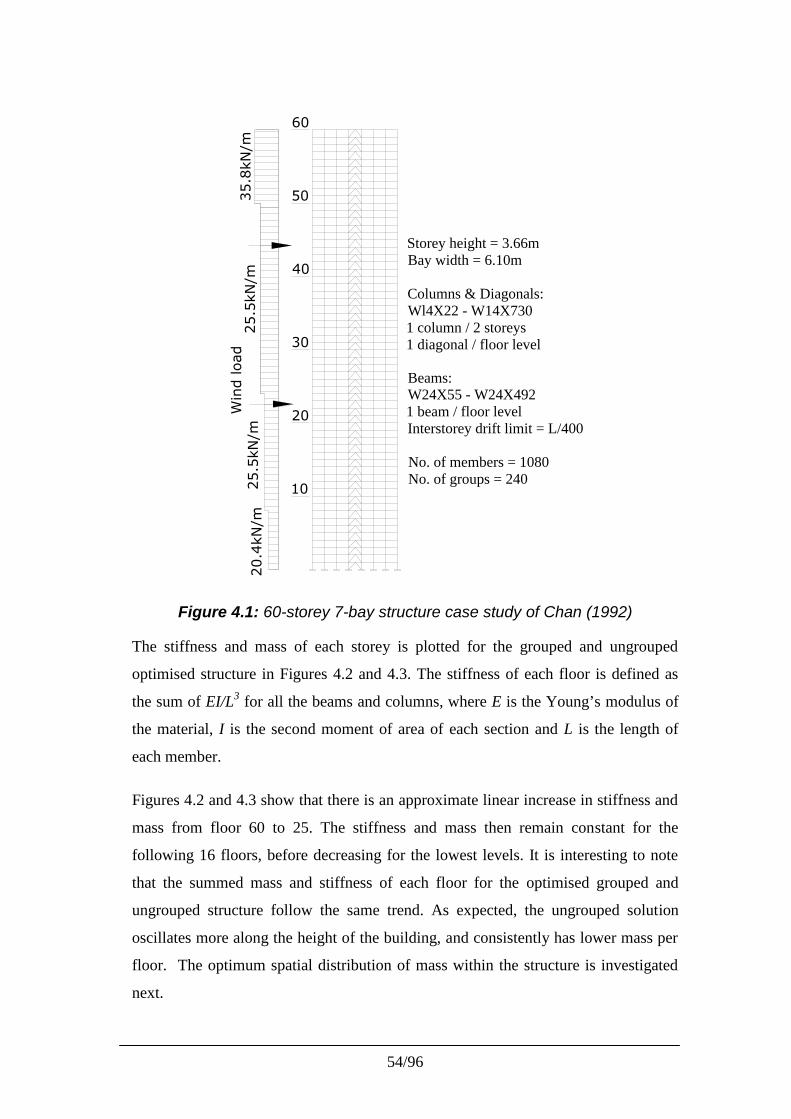
54/96
10
20
30
40
50
60
20.4
kN/m
25.5
kN/m
25.5
kN/m
35.8
kN/m
Storey height = 3.66mBay width = 6.10m
Columns & Diagonals:Wl4X22 - W14X7301 column / 2 storeys1 diagonal / floor level
Beams:W24X55 - W24X4921 beam / floor levelInterstorey drift limit = L/400
No. of members = 1080No. of groups = 240
Win
d load
Figure 4.1: 60-storey 7-bay structure case study of Chan (1992)
The stiffness and mass of each storey is plotted for the grouped and ungrouped
optimised structure in Figures 4.2 and 4.3. The stiffness of each floor is defined as
the sum of EI/L3 for all the beams and columns, where E is the Young’s modulus of
the material, I is the second moment of area of each section and L is the length of
each member.
Figures 4.2 and 4.3 show that there is an approximate linear increase in stiffness and
mass from floor 60 to 25. The stiffness and mass then remain constant for the
following 16 floors, before decreasing for the lowest levels. It is interesting to note
that the summed mass and stiffness of each floor for the optimised grouped and
ungrouped structure follow the same trend. As expected, the ungrouped solution
oscillates more along the height of the building, and consistently has lower mass per
floor. The optimum spatial distribution of mass within the structure is investigated
next.
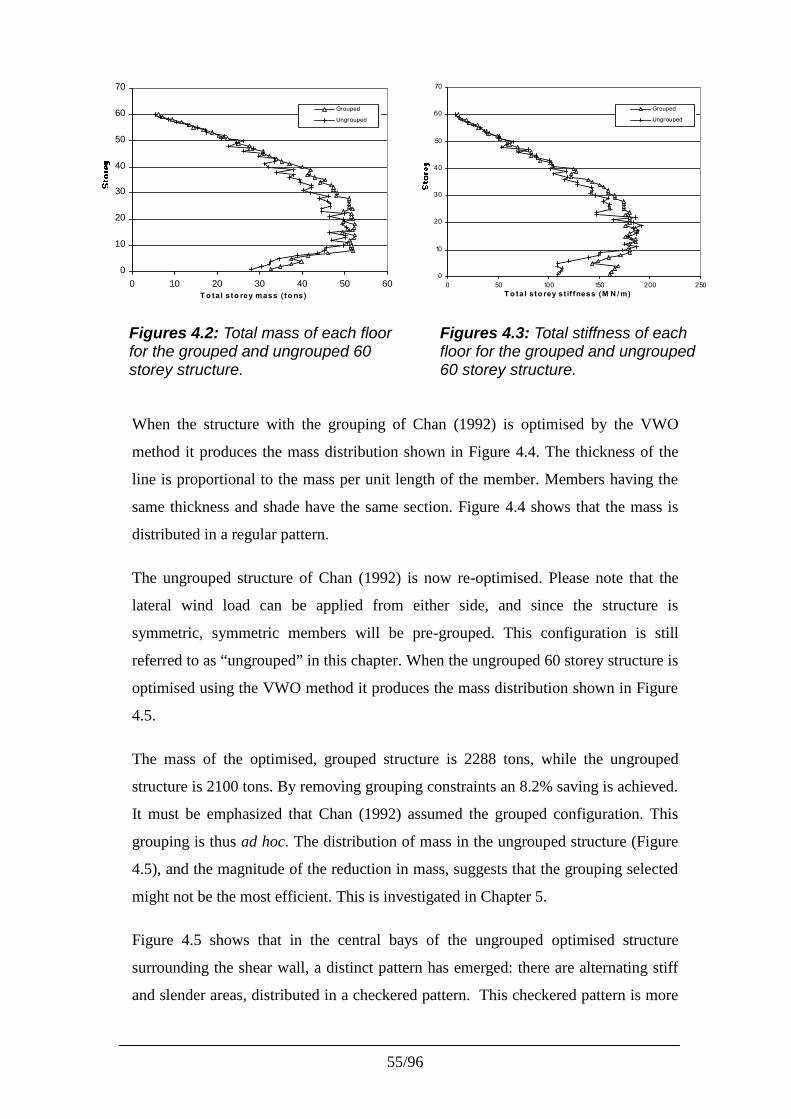
55/96
Figures 4.2: Total mass of each floorfor the grouped and ungrouped 60storey structure.
0
10
20
30
40
50
60
70
0 10 20 30 40 50 60T o tal sto rey mass ( to ns)
Grouped
Ungrouped
0
10
20
30
40
50
60
70
0 50 100 150 200 250T o tal sto rey st if fness (M N / m)
Grouped
Ungrouped
Figures 4.3: Total stiffness of eachfloor for the grouped and ungrouped60 storey structure.
When the structure with the grouping of Chan (1992) is optimised by the VWO
method it produces the mass distribution shown in Figure 4.4. The thickness of the
line is proportional to the mass per unit length of the member. Members having the
same thickness and shade have the same section. Figure 4.4 shows that the mass is
distributed in a regular pattern.
The ungrouped structure of Chan (1992) is now re-optimised. Please note that the
lateral wind load can be applied from either side, and since the structure is
symmetric, symmetric members will be pre-grouped. This configuration is still
referred to as “ungrouped” in this chapter. When the ungrouped 60 storey structure is
optimised using the VWO method it produces the mass distribution shown in Figure
4.5.
The mass of the optimised, grouped structure is 2288 tons, while the ungrouped
structure is 2100 tons. By removing grouping constraints an 8.2% saving is achieved.
It must be emphasized that Chan (1992) assumed the grouped configuration. This
grouping is thus ad hoc. The distribution of mass in the ungrouped structure (Figure
4.5), and the magnitude of the reduction in mass, suggests that the grouping selected
might not be the most efficient. This is investigated in Chapter 5.
Figure 4.5 shows that in the central bays of the ungrouped optimised structure
surrounding the shear wall, a distinct pattern has emerged: there are alternating stiff
and slender areas, distributed in a checkered pattern. This checkered pattern is more
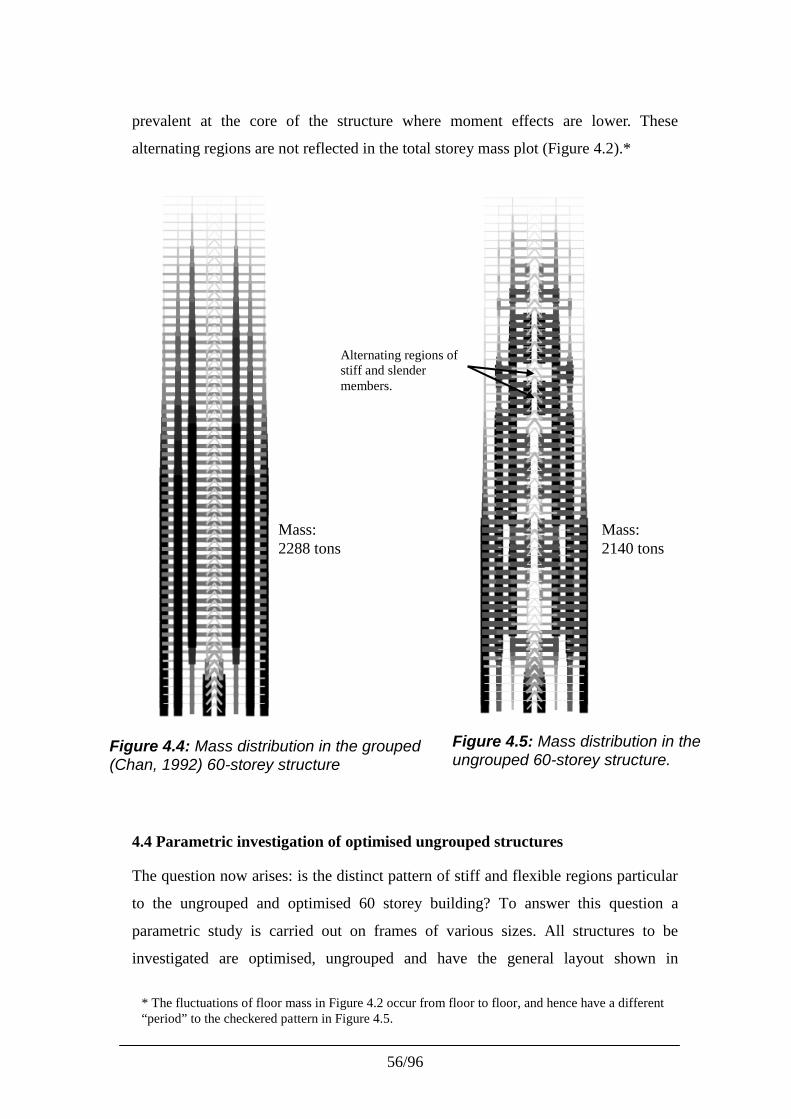
56/96
Figure 4.4: Mass distribution in the grouped(Chan, 1992) 60-storey structure
Figure 4.5: Mass distribution in theungrouped 60-storey structure.
Mass:2288 tons
Alternating regions ofstiff and slendermembers.
Mass:2140 tons
prevalent at the core of the structure where moment effects are lower. These
alternating regions are not reflected in the total storey mass plot (Figure 4.2).*
4.4 Parametric investigation of optimised ungrouped structures
The question now arises: is the distinct pattern of stiff and flexible regions particular
to the ungrouped and optimised 60 storey building? To answer this question a
parametric study is carried out on frames of various sizes. All structures to be
investigated are optimised, ungrouped and have the general layout shown in
* The fluctuations of floor mass in Figure 4.2 occur from floor to floor, and hence have a different“period” to the checkered pattern in Figure 4.5.
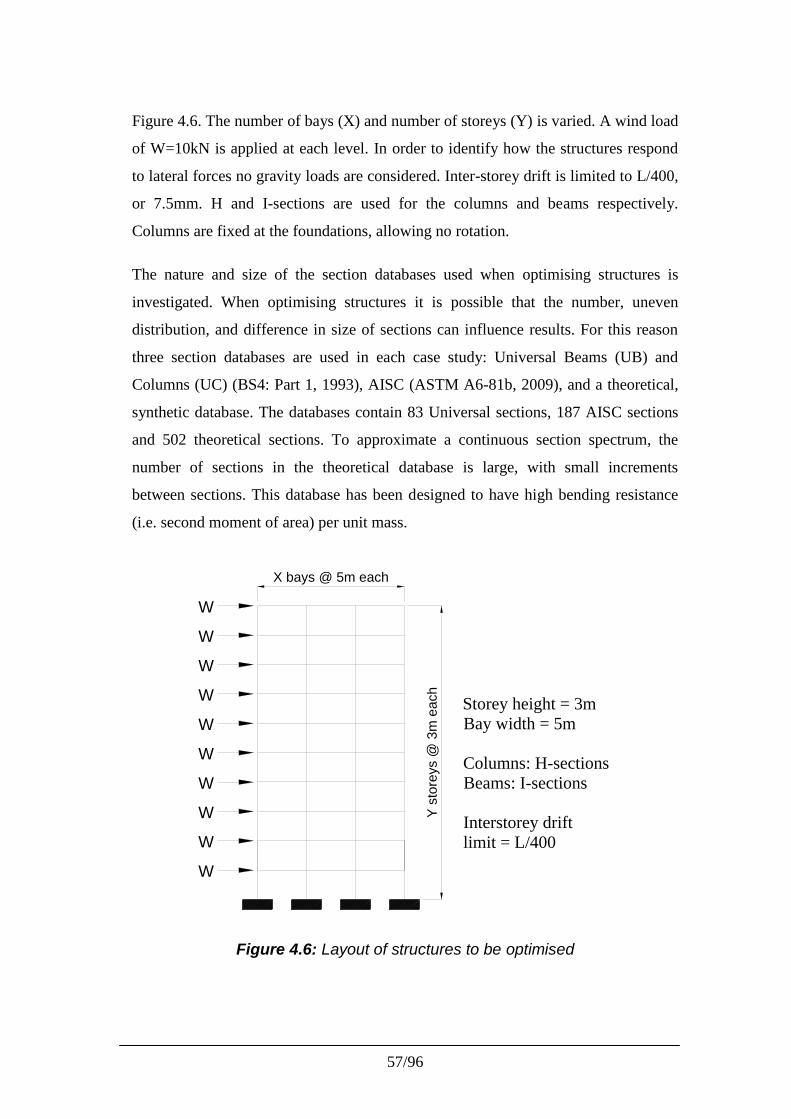
57/96
Figure 4.6. The number of bays (X) and number of storeys (Y) is varied. A wind load
of W=10kN is applied at each level. In order to identify how the structures respond
to lateral forces no gravity loads are considered. Inter-storey drift is limited to L/400,
or 7.5mm. H and I-sections are used for the columns and beams respectively.
Columns are fixed at the foundations, allowing no rotation.
The nature and size of the section databases used when optimising structures is
investigated. When optimising structures it is possible that the number, uneven
distribution, and difference in size of sections can influence results. For this reason
three section databases are used in each case study: Universal Beams (UB) and
Columns (UC) (BS4: Part 1, 1993), AISC (ASTM A6-81b, 2009), and a theoretical,
synthetic database. The databases contain 83 Universal sections, 187 AISC sections
and 502 theoretical sections. To approximate a continuous section spectrum, the
number of sections in the theoretical database is large, with small increments
between sections. This database has been designed to have high bending resistance
(i.e. second moment of area) per unit mass.
X bays @ 5m each
W
W
W
W
W
W
W
W
W
W
Y s
tore
ys @
3m
eac
h
Storey height = 3mBay width = 5m
Columns: H-sectionsBeams: I-sections
Interstorey driftlimit = L/400
Figure 4.6: Layout of structures to be optimised
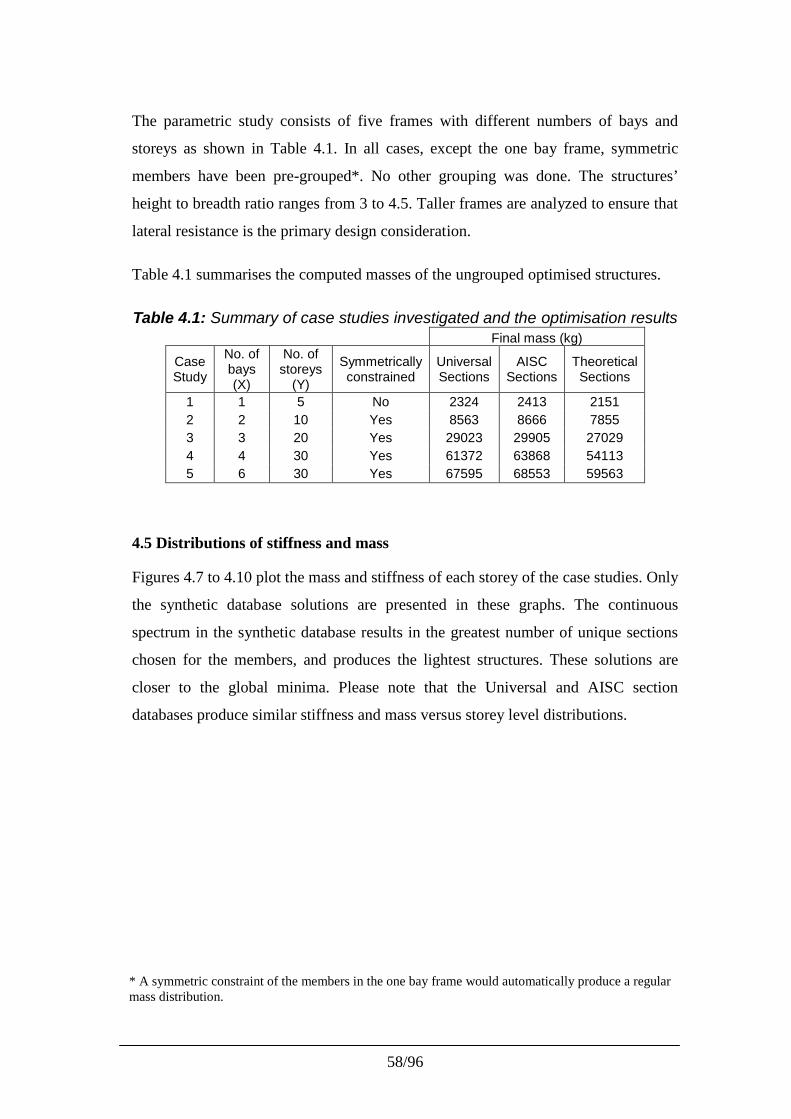
58/96
* A symmetric constraint of the members in the one bay frame would automatically produce a regularmass distribution.
The parametric study consists of five frames with different numbers of bays and
storeys as shown in Table 4.1. In all cases, except the one bay frame, symmetric
members have been pre-grouped*. No other grouping was done. The structures’
height to breadth ratio ranges from 3 to 4.5. Taller frames are analyzed to ensure that
lateral resistance is the primary design consideration.
Table 4.1 summarises the computed masses of the ungrouped optimised structures.
Table 4.1: Summary of case studies investigated and the optimisation resultsFinal mass (kg)
CaseStudy
No. ofbays(X)
No. ofstoreys
(Y)
Symmetricallyconstrained
UniversalSections
AISCSections
TheoreticalSections
1 1 5 No 2324 2413 21512 2 10 Yes 8563 8666 78553 3 20 Yes 29023 29905 270294 4 30 Yes 61372 63868 541135 6 30 Yes 67595 68553 59563
4.5 Distributions of stiffness and mass
Figures 4.7 to 4.10 plot the mass and stiffness of each storey of the case studies. Only
the synthetic database solutions are presented in these graphs. The continuous
spectrum in the synthetic database results in the greatest number of unique sections
chosen for the members, and produces the lightest structures. These solutions are
closer to the global minima. Please note that the Universal and AISC section
databases produce similar stiffness and mass versus storey level distributions.
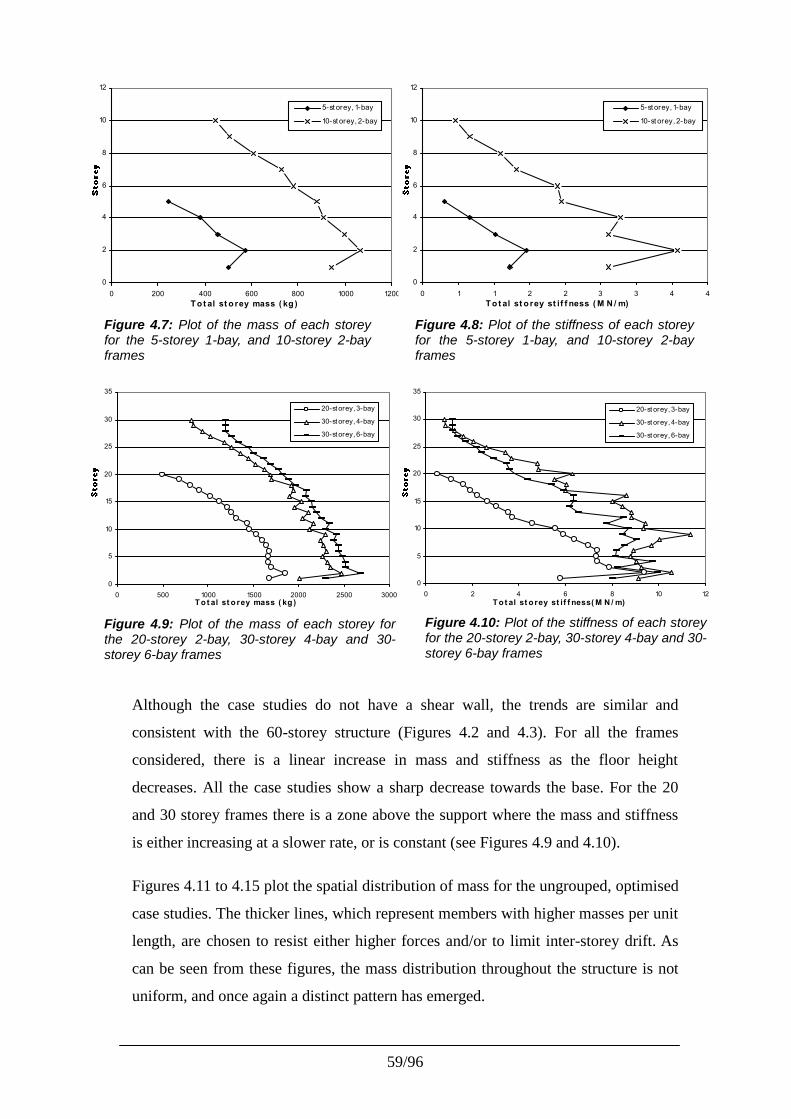
59/96
Although the case studies do not have a shear wall, the trends are similar and
consistent with the 60-storey structure (Figures 4.2 and 4.3). For all the frames
considered, there is a linear increase in mass and stiffness as the floor height
decreases. All the case studies show a sharp decrease towards the base. For the 20
and 30 storey frames there is a zone above the support where the mass and stiffness
is either increasing at a slower rate, or is constant (see Figures 4.9 and 4.10).
Figures 4.11 to 4.15 plot the spatial distribution of mass for the ungrouped, optimised
case studies. The thicker lines, which represent members with higher masses per unit
length, are chosen to resist either higher forces and/or to limit inter-storey drift. As
can be seen from these figures, the mass distribution throughout the structure is not
uniform, and once again a distinct pattern has emerged.
0
2
4
6
8
10
12
0 200 400 600 800 1000 1200Tot al st o rey mass ( kg )
5-st orey, 1-bay
10-st orey, 2-bay
0
2
4
6
8
10
12
0 1 1 2 2 3 3 4 4T o t al st o rey st if f ness ( M N / m)
5-st orey, 1-bay
10-st orey, 2-bay
0
5
10
15
20
25
30
35
0 500 1000 1500 2000 2500 3000Tot al st o rey mass ( kg )
20-st orey, 3-bay
30-st orey, 4-bay
30-st orey, 6-bay
0
5
10
15
20
25
30
35
0 2 4 6 8 10 12Tot al st o rey st if f ness( M N / m)
20-st orey, 3-bay
30-st orey, 4-bay
30-st orey, 6-bay
Figure 4.7: Plot of the mass of each storeyfor the 5-storey 1-bay, and 10-storey 2-bayframes
Figure 4.8: Plot of the stiffness of each storeyfor the 5-storey 1-bay, and 10-storey 2-bayframes
Figure 4.9: Plot of the mass of each storey forthe 20-storey 2-bay, 30-storey 4-bay and 30-storey 6-bay frames
frames
Figure 4.10: Plot of the stiffness of each storeyfor the 20-storey 2-bay, 30-storey 4-bay and 30-storey 6-bay frames
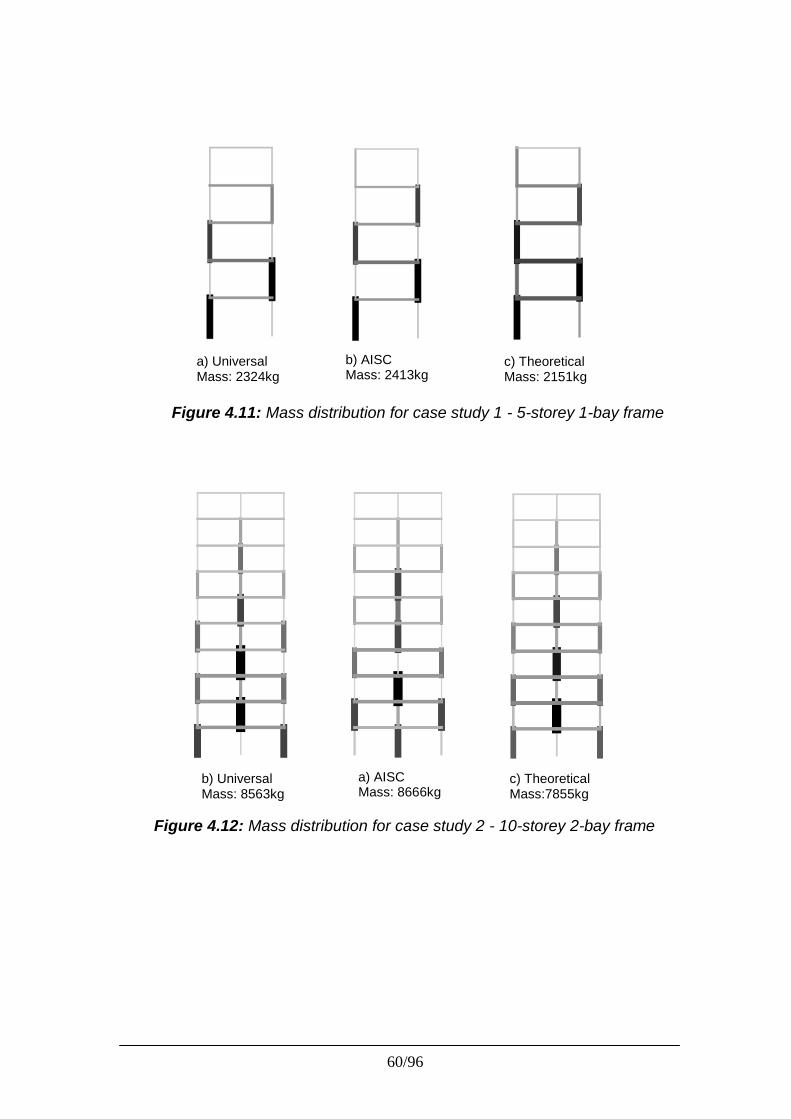
60/96
b) AISCMass: 2413kg
a) UniversalMass: 2324kg
c) TheoreticalMass: 2151kg
Figure 4.11: Mass distribution for case study 1 - 5-storey 1-bay frame
Figure 4.12: Mass distribution for case study 2 - 10-storey 2-bay frame
a) AISCMass: 8666kg
b) UniversalMass: 8563kg
c) TheoreticalMass:7855kg
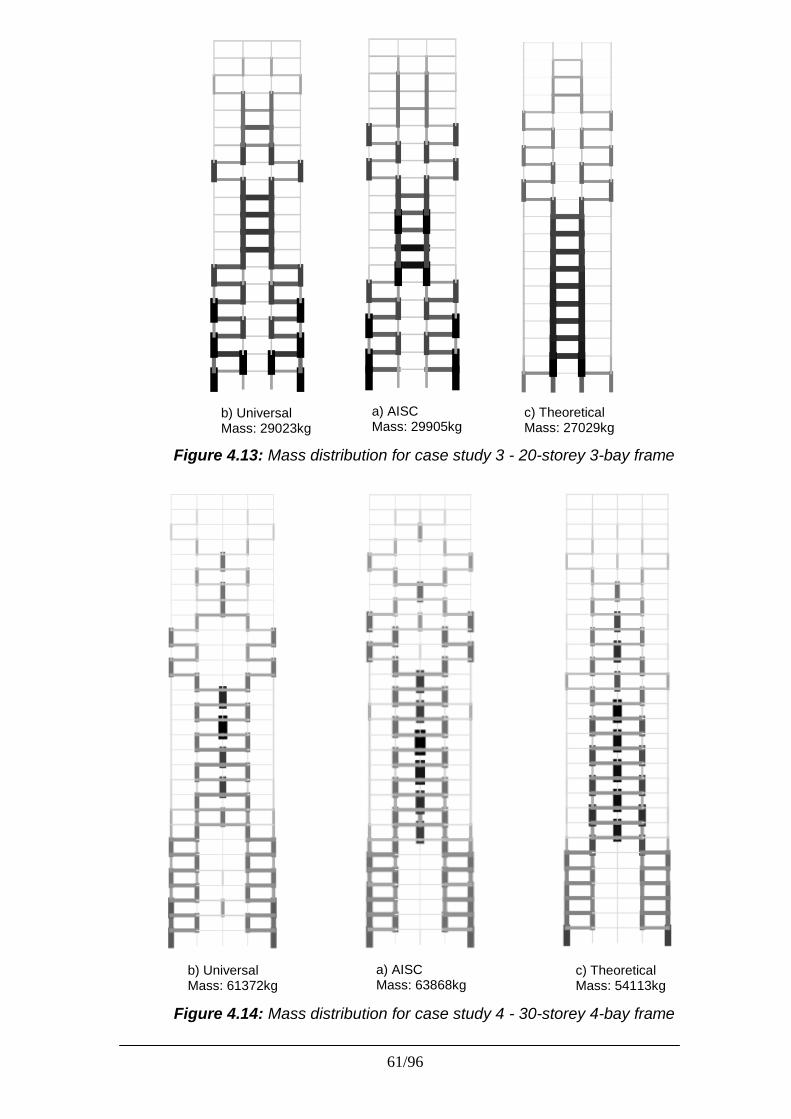
61/96
Figure 4.13: Mass distribution for case study 3 - 20-storey 3-bay frame
a) AISCMass: 29905kg
b) UniversalMass: 29023kg
c) TheoreticalMass: 27029kg
a) AISCMass: 63868kg
b) UniversalMass: 61372kg
c) TheoreticalMass: 54113kg
Figure 4.14: Mass distribution for case study 4 - 30-storey 4-bay frame
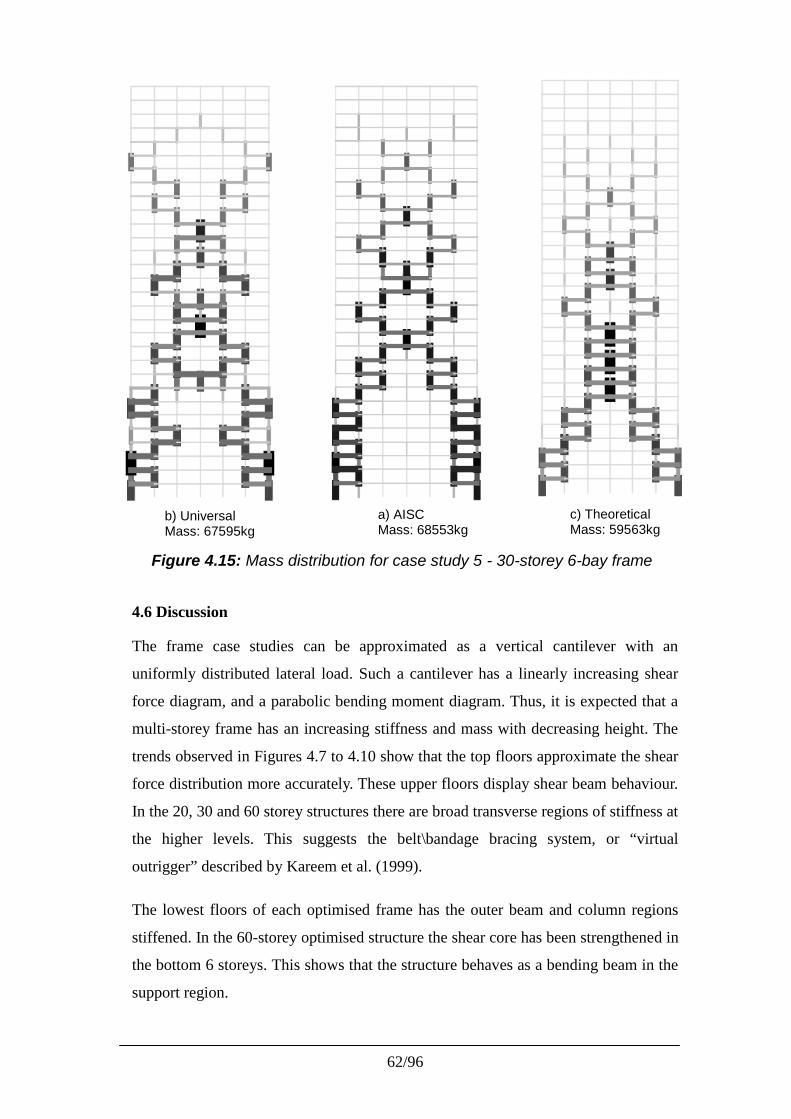
62/96
a) AISCMass: 68553kg
b) UniversalMass: 67595kg
c) TheoreticalMass: 59563kg
Figure 4.15: Mass distribution for case study 5 - 30-storey 6-bay frame
4.6 Discussion
The frame case studies can be approximated as a vertical cantilever with an
uniformly distributed lateral load. Such a cantilever has a linearly increasing shear
force diagram, and a parabolic bending moment diagram. Thus, it is expected that a
multi-storey frame has an increasing stiffness and mass with decreasing height. The
trends observed in Figures 4.7 to 4.10 show that the top floors approximate the shear
force distribution more accurately. These upper floors display shear beam behaviour.
In the 20, 30 and 60 storey structures there are broad transverse regions of stiffness at
the higher levels. This suggests the belt\bandage bracing system, or “virtual
outrigger” described by Kareem et al. (1999).
The lowest floors of each optimised frame has the outer beam and column regions
stiffened. In the 60-storey optimised structure the shear core has been strengthened in
the bottom 6 storeys. This shows that the structure behaves as a bending beam in the
support region.
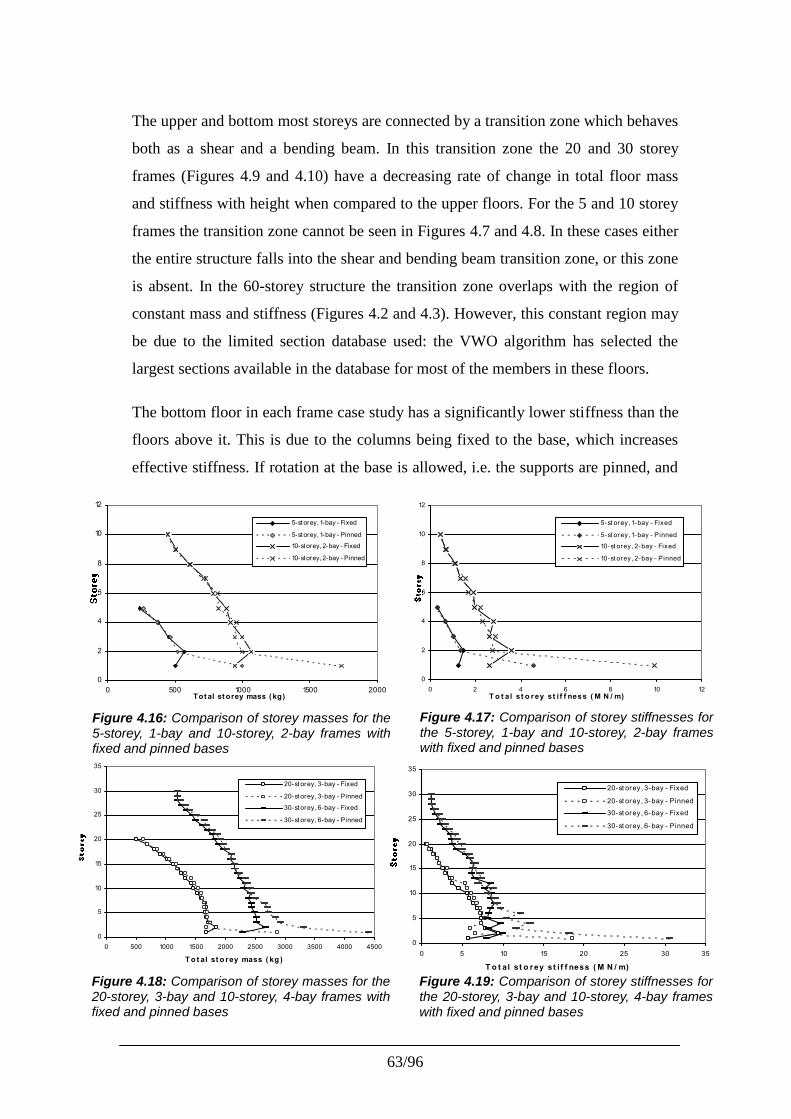
63/96
0
5
10
15
20
25
30
35
0 5 10 15 20 25 30 35
T o t al st o r ey st i f f ness ( M N / m)
20-st orey, 3-bay - Fixed
20-st orey, 3-bay - Pinned
30-st orey, 6-bay - Fixed
30-st orey, 6-bay - Pinned
Figure 4.16: Comparison of storey masses for the5-storey, 1-bay and 10-storey, 2-bay frames withfixed and pinned bases
frames
Figure 4.18: Comparison of storey masses for the20-storey, 3-bay and 10-storey, 4-bay frames withfixed and pinned bases
frames
Figure 4.19: Comparison of storey stiffnesses forthe 20-storey, 3-bay and 10-storey, 4-bay frameswith fixed and pinned bases
frames
Figure 4.17: Comparison of storey stiffnesses forthe 5-storey, 1-bay and 10-storey, 2-bay frameswith fixed and pinned bases
frames
0
5
10
15
20
25
30
35
0 500 1000 1500 2000 2500 3000 3500 4000 4500
T o t al st o rey mass ( kg )
20-st orey, 3-bay - Fixed
20-st orey, 3-bay - Pinned
30-st orey, 6-bay - Fixed
30-st orey, 6-bay - Pinned
0
2
4
6
8
10
12
0 500 1000 1500 2000Tot al st orey mass ( kg)
5-storey, 1-bay - Fixed
5-storey, 1-bay - Pinned
10-storey, 2-bay - Fixed
10-storey, 2-bay - Pinned
0
2
4
6
8
10
12
0 2 4 6 8 10 12T o t al st o r ey st i f f ness ( M N / m)
5-st orey, 1-bay - Fixed
5-st orey, 1-bay - Pinned
10-st orey, 2-bay - Fixed
10-st orey, 2-bay - Pinned
The upper and bottom most storeys are connected by a transition zone which behaves
both as a shear and a bending beam. In this transition zone the 20 and 30 storey
frames (Figures 4.9 and 4.10) have a decreasing rate of change in total floor mass
and stiffness with height when compared to the upper floors. For the 5 and 10 storey
frames the transition zone cannot be seen in Figures 4.7 and 4.8. In these cases either
the entire structure falls into the shear and bending beam transition zone, or this zone
is absent. In the 60-storey structure the transition zone overlaps with the region of
constant mass and stiffness (Figures 4.2 and 4.3). However, this constant region may
be due to the limited section database used: the VWO algorithm has selected the
largest sections available in the database for most of the members in these floors.
The bottom floor in each frame case study has a significantly lower stiffness than the
floors above it. This is due to the columns being fixed to the base, which increases
effective stiffness. If rotation at the base is allowed, i.e. the supports are pinned, and
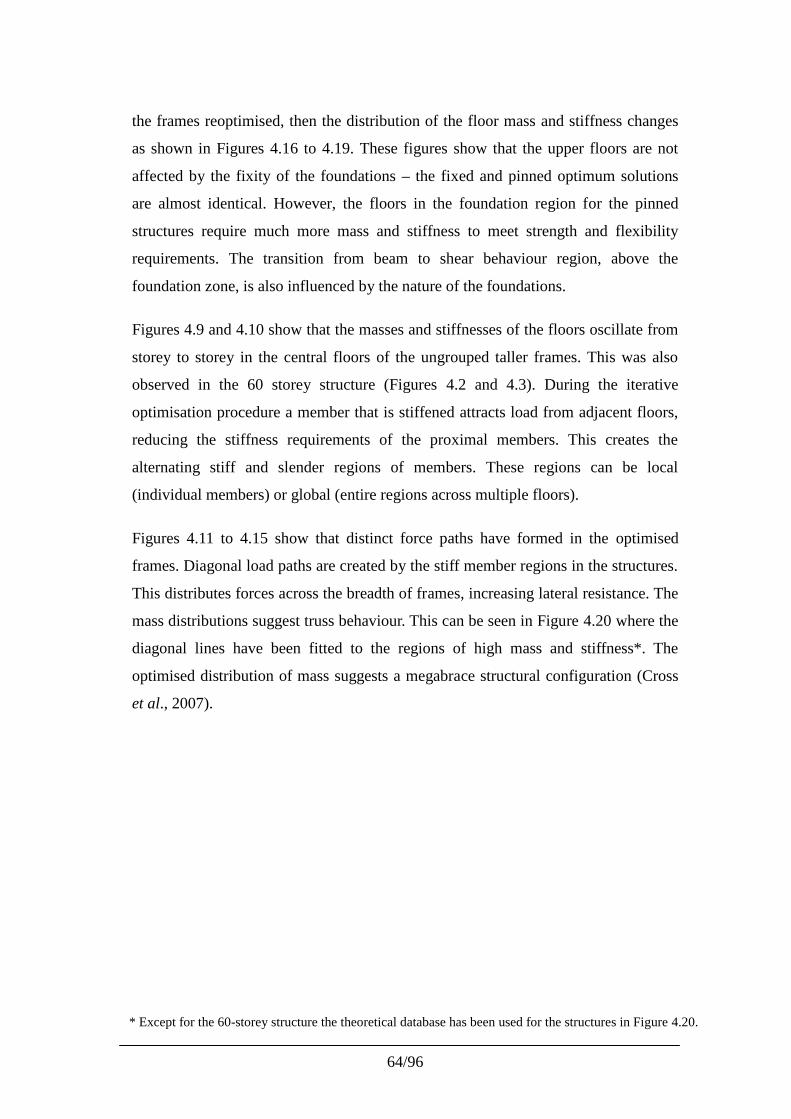
64/96
* Except for the 60-storey structure the theoretical database has been used for the structures in Figure 4.20.
the frames reoptimised, then the distribution of the floor mass and stiffness changes
as shown in Figures 4.16 to 4.19. These figures show that the upper floors are not
affected by the fixity of the foundations – the fixed and pinned optimum solutions
are almost identical. However, the floors in the foundation region for the pinned
structures require much more mass and stiffness to meet strength and flexibility
requirements. The transition from beam to shear behaviour region, above the
foundation zone, is also influenced by the nature of the foundations.
Figures 4.9 and 4.10 show that the masses and stiffnesses of the floors oscillate from
storey to storey in the central floors of the ungrouped taller frames. This was also
observed in the 60 storey structure (Figures 4.2 and 4.3). During the iterative
optimisation procedure a member that is stiffened attracts load from adjacent floors,
reducing the stiffness requirements of the proximal members. This creates the
alternating stiff and slender regions of members. These regions can be local
(individual members) or global (entire regions across multiple floors).
Figures 4.11 to 4.15 show that distinct force paths have formed in the optimised
frames. Diagonal load paths are created by the stiff member regions in the structures.
This distributes forces across the breadth of frames, increasing lateral resistance. The
mass distributions suggest truss behaviour. This can be seen in Figure 4.20 where the
diagonal lines have been fitted to the regions of high mass and stiffness*. The
optimised distribution of mass suggests a megabrace structural configuration (Cross
et al., 2007).
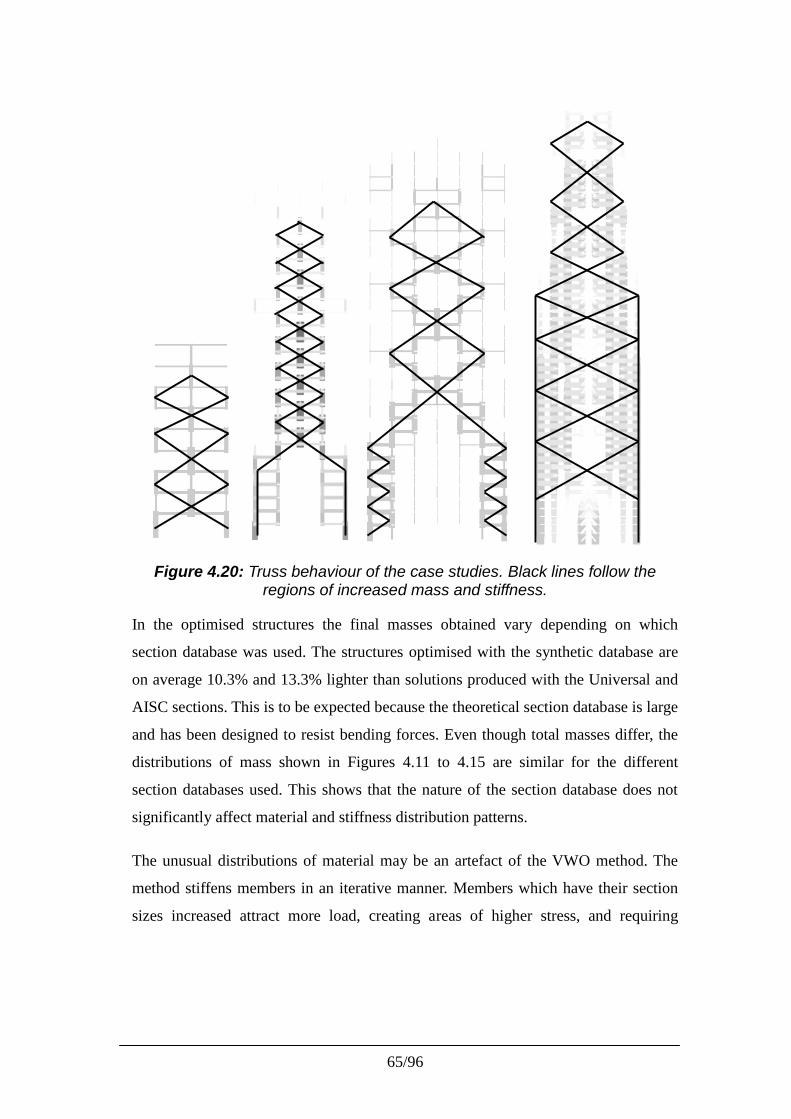
65/96
Figure 4.20: Truss behaviour of the case studies. Black lines follow theregions of increased mass and stiffness.
In the optimised structures the final masses obtained vary depending on which
section database was used. The structures optimised with the synthetic database are
on average 10.3% and 13.3% lighter than solutions produced with the Universal and
AISC sections. This is to be expected because the theoretical section database is large
and has been designed to resist bending forces. Even though total masses differ, the
distributions of mass shown in Figures 4.11 to 4.15 are similar for the different
section databases used. This shows that the nature of the section database does not
significantly affect material and stiffness distribution patterns.
The unusual distributions of material may be an artefact of the VWO method. The
method stiffens members in an iterative manner. Members which have their section
sizes increased attract more load, creating areas of higher stress, and requiring
66/96
section sizes to be increased even further. However, the fact that numerous structures
have shown similar distributions, indicates that such configurations are efficient to resist
lateral loads, and should not be strongly dependent on the optimisation method used.
4.7 Conclusion
In this chapter ungrouped, multi-storey frames have been optimised to investigate the
spatial distribution of mass and stiffness. It has been found that measured from the top,
the total storey mass and stiffness increase approximately linearly with decreasing height
of the structure. This is followed in some cases by a region of lower rate of increase or
constant floor mass and stiffness. The storeys at the foundation level show a sharp
decrease in floor mass and stiffness. This is due to rotational fixity offered by the
foundations. The section database used does effect the optimised total structural mass,
but does not significantly effect mass distribution.
Unexpected spatial distributions of mass and stiffness have been computed in
ungrouped, optimised frames. The mass configures in approximately diagonal patterns
across the frames. This suggests the load paths can be resisted effectively by a truss or
megabrace system. Members which are stiffened decrease the strength and flexibility
requirements of members in their proximity. While the floor to floor total mass
oscillates, larger spatial, checkered pattern of stiff and flexible regions are also
produced.
It is possible that the Virtual Work Optimisation (VWO) method used influences the
solutions obtained. However, the consistency of the results implies that the optimisation
method has yielded correct (or acceptably correct) results. Thus the mass and stiffness
distributions within the frames are efficient to resist lateral loads.
Future research should focus on comparing the results from other optimisation methods
to the VWO solutions. Methods which can address a large number of design variables
need to be used on such structures. This might be the reason why there is a dearth of
literature investigating the spatial distribution of mass in ungrouped frames. The effect
of grouping, or partially grouping, members should be characterized. Gravity loads must
be included. How shear walls influence and alter the optimised pure frame behaviour
should be investigated.
67/96
4.8 References
ASTM A6-81 (2009) Specifications from ASTM A6 – Standard Specification for
General Requirements for Rolled Structural Steel Bars, Plates, Shapes and Steel
Piling. American Society for Testing and Materials.
Barbosa, H J C, Lemonge, A C C and Borges, C C H. (2008) A genetic algorithm
encoding for cardinality constraints and automatics variable linking in structural
optimisation. Engineering Structures, 30, 3708-3723.
Barthelemy, J F M, and Haftka, R T. (1993) Approximation concepts for optimal
structural design – a review. Structural Optimisation, 5, 129-144.
BS4:Part 1 (1993). Structural steel sections. Specification for hot-rolled sections. British
Standard.
Chan, C M (1992). An optimality criteria algorithm for tall steel building design using
commercial standard sections. Structural Optimisation, 5, 26-29.
Choi, B H, and Kim, Y M (2008) Decision support system in the design of steel
moment-resisting frames using a realistic cost model. The Structural Design of Tall
and Special Buildings. Published online at Wiley Interscience.
www.interscience.wiley.com. Accessed 28 November 2009.
Erbatur, F, Oguzhan, H, Tutuncu, I, and Kilic, H. (2000). Optimal design of planar and
space structures with genetic algorithms. Computers & Structures, 75, 209-24
Kareem, A, Kijewski, T, amd Tamrua, Y. (1999) Mitigation of Motions of Tall
Buildings with Specific Examples of Recent Applications. Wind and Structures, 2(3),
201-251.
Cross, P, Vesey, D, and Chan C M. (2007) High Rise Buildings. Modelling complex
engineering structures. Melchers, R.E. and Hough, R. (eds.). ASCE Press, Virginia.
Provatidis, C.G., and Venetsanos, D.T. (2006) Cost minimization of 2D continuum
structures under stress constraints by increasing commonality in their skeletal
equivalents. Forsch Ingenieurwes, 70, 159-169.
SANS 10162-1. (2005) The Structural use of steel. Part 1: Limit-states design of hot-
rolled steelwork. South African National Standard.
Smith, B.S., and Coull, A. (1991). Tall building structures – Analysis and design. John
Wiley and Sons. Canada.
68/96
CHAPTER 5: AN ALGORITHM FOR GROUPING MEMBERS IN A
STRUCTURE
5.1 Introduction
This chapter presents an automated method for grouping discrete structural members.
In Chapters 2, 3 and 4 mass distributions in optimised, ungrouped structures suggest
ways in which structures can be efficiently grouped. The grouping algorithm
presented is based on these observations.
A group is defined as all members in a structure which have the same section.
Grouping is related to the principle of commonality (Provatidis and Venetsanos,
2006). The fewer section types a structure has, and the more similar the members are,
the lower the construction costs become. The process of grouping elements is also
known as variable linking (Barthelemy and Haftka, 1993). In a structure each time
variables are linked the optimisation problem changes, producing different solutions.
It is unclear how a structure’s behaviour will change once it has been grouped,
making it difficult to develop generalized grouping methods.
For construction purposes engineers group members together based on past
experience, personal preferences and fabrication requirements. This is ad hoc
grouping. In complex structures it may not be apparent how sections should be
linked to reduce material costs. Inexperienced designers can create poor groupings.
Only a few grouping algorithms can be found in the literature. Krishnamoorthy et al.
(2002) and Toğan and Doloğlu (2006, 2008) have developed methods which group
members in trusses according to the magnitude of axial forces in members. A second
method suggested by Toğan and Doloğlu (2008) is to group tension members
together according to internal axial forces, and to group compression members
according to slenderness ratios. Biedermann and Grierson (1995) group beams based
on member lengths; beams with spans within 20% of each other are assigned a
common section. Shea et al. (1997) group truss members according to similar
sectional areas. Barbosa and Lemonge (2005) and Barbosa et al. (2008) have
developed methods for variable linking using an adaptive penalty scheme. In general
69/96
the methods in the literature suffer from either being only suitable for specific types
of structures, such as trusses, or not taking both deflection and strength requirements
into account. Most methods cannot consider multiple load cases. These weaknesses
of the grouping techniques are addressed in this chapter.
The algorithm developed in this chapter determines how a user-specified number of
groups can be created to minimise the mass of the structure. The number of groups is
an independent variable and should be chosen to satisfy fabrication and construction
requirements. Structures with fixed geometric topologies and loading conditions
subject to multiple load cases are considered. The Virtual Work Optimisation
(VWO) method, presented in Chapter 3, has been adopted in the grouping algorithm,
but any optimisation method can be used.
This chapter is arranged as follows: first, the theories and limitations regarding
various grouping techniques are discussed. The new method for grouping members is
then presented. A simple frame is grouped to illustrate the algorithm. Four case
studies are shown to demonstrate the effectiveness of the method. A simple, stepped
cantilever is considered first. A 15-storey 5-bay frame, and a truss, are considered to
compare ad hoc grouping to the results produced by the algorithm. Finally, a
warehouse, as designed by professional engineers, is investigated and the results
compared.
5.2 Limitations of grouping methods found in the literature
One aim of a good design should be to satisfy strength and deflection constraints
whilst being as economical as possible. To standardize designs and reduce
fabrication and erection costs members have to be grouped together. It is necessary
to determine which parameters should be used as a basis for specifying groups.
Either the geometric properties of members, or stresses induced by loads, have been
considered. Specific properties which have been used include: axial forces in
members (Krishnamoorthy et al., 2002), Toğan and Doloğlu (2006, 2008), sectional
areas (Shea et al., 1997), or member lengths (Biedermann and Grierson, 1995). Other
parameters which could be considered, but have not been explored in the literature,
70/96
* Please note that the grouping algorithm presented here is very different to that of Shea et al. (1997)who also used cross-sectional areas as the basis of grouping. This reference considered only trusseswith members grouped according to pre-specified ranges. The proposed algorithm is more generaland does not have these limitations.
include second moment of areas, locations of members within the structure, stresses,
or member energies per unit volume.
A major weakness of grouping members according to internal stresses, forces or
energies is that in general only a single load case can be considered at a time. For
grouping according to internal forces, members must have only one dominant type of
force: either axial, bending, or torsion. It is difficult to combine multiple forces for
grouping members. Further, a strength dependent member may have its section
governed by a combination of internal forces, while a deflection dependent
member’s size is not only governed by the load it carries. Compression members and
laterally unsupported beams require extra factors to take buckling into account.
When members are grouped together based on their length then geometric properties,
forces in members, stress requirements and deflection criteria might not be accounted
for. A member’s length does not adequately represent its geometric properties.
If members are grouped together based on second moments of area then implcitly
only bending forces are considered. The same limitations as using cross-sectional
areas are encountered, as discussed above. There is a large variation in second
moment of area in section databases making it difficult to group sections based on
this parameter alone.
5.3 Grouping members according to mass per unit length
It is proposed that members should be grouped according to their mass per unit
length, i.e. their cross-sectional area*. For a structure in which all design constraints
have been satisfied it is assumed that members with similar mass per unit length have
comparable section properties. Grouping members, which have been selected to
satisfy all design criteria, according to section properties solves the problems
associated with multiple load cases and strength requirements. It is important to note
that when optimising structures for weight, the mass per unit length of members
serves as part of the objective function.
71/96
5.4 Single and multi step grouping
It is possible to group members in either a single or multiple steps. For a multi-step
process the number of sections used in the structure is reduced by one in each
iteration, until the user-defined number of groups has been produced. Groups that are
created are linked either with other members or groups. The problem encountered is
that in one iteration it may be optimal to group certain members together, but in a
later iteration such a group may need to be split to create a different, but more
effective, configuration. It was found that a single step procedure is less
computationally expensive, more effective and easier to implement. For these
reasons the algorithm presented is based on a single step grouping method. The
results from single versus multiple step methods are discussed in case study 2.
5.5 The Single Step Grouping Algorithm
The aim of the presented algorithm is to determine a grouping configuration which
will result in the lightest structure. An overview of the grouping process is: first, an
ungrouped structure is optimised to produce an initial solution. Second, all possible
grouping configurations are investigated. The lightest, predicted configuration is
chosen for the structure. The structure is then optimised again to satisfy all design
criteria and produce the solution.
5.5.1 Step 0 – Setting grouping parameters
The following information is required for the grouping algorithm: the structure’s
geometric topology, loading, load combinations, deflection requirements, design
code and the properties of the materials to be used. The user must define how many
different groups, n, need to be created. The method will group the members in the
structures such that the maximum number of groups is limited to n.
5.5.2 Step 1 – Obtaining the initial, ungrouped solution
If a structure in which every member can have a different section is optimised, the
lightest solution is produced. The aim of the grouping method is to create a
configuration that weighs as close to the ungrouped solution as possible.
72/96
The Virtual Work Optimisation (VWO) method (Chapter 3) is used to obtain the
initial, ungrouped solution. The VWO method is based on the principle of virtual
work, and selects members to satisfy both strength and deflection criteria to produce
the lightest structure. Sections are chosen from standard databases by determining
which sections provide the highest deformation and strength resistance per unit mass.
The VWO method is chosen because it requires fewer iterations than other methods,
and is influenced linearly by the number of optimisation variables. It must be
emphasised that any optimisation method can be incorporated into the grouping
algorithm.
Once sections have been selected for the ungrouped structure they are ordered from
largest to smallest according to their mass per unit length. Members with identical
sections are grouped together. This configuration is still referred to as the ungrouped
structure, or the initial grouping configuration. The total number of different
sections, i, selected for the ungrouped solution is less than or equal to the number of
members in the structure.
5.5.3 Step 2 – Investigating grouping configurations
An exhaustive search is performed on the ungrouped structure by computing all
possible member groupings. For each permutation the mass of the structure is
calculated. The assumption in this step is that the section of a heavier member will
satisfy the strength and deflection constraints of a lighter member. Thus, in any
permutation a member cannot have its section size reduced from the one initially
selected in Step 1. Also, the largest section of all the members in a group will be
selected for each member in that group.
A structure with i initial sections will be reduced to the user-defined number of
groups, n, where 1 ≤ n ≤ i. Thus, the number of sections must be reduced by (i – n).
The total number of grouping permutations, N, is defined by the binomial coefficient:
)!()!1(
)!1(1
1
nin
i
n
iN
(5.1)
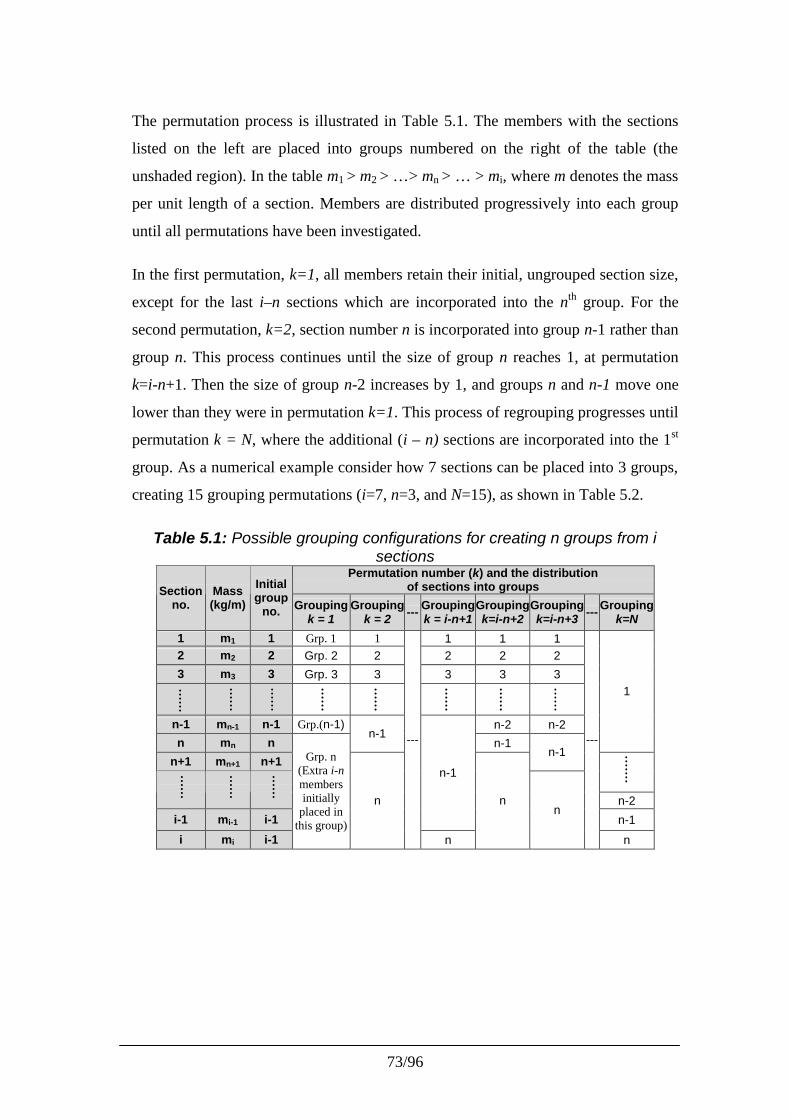
73/96
The permutation process is illustrated in Table 5.1. The members with the sections
listed on the left are placed into groups numbered on the right of the table (the
unshaded region). In the table m1 > m2 > …> mn > … > mi, where m denotes the mass
per unit length of a section. Members are distributed progressively into each group
until all permutations have been investigated.
In the first permutation, k=1, all members retain their initial, ungrouped section size,
except for the last i–n sections which are incorporated into the nth group. For the
second permutation, k=2, section number n is incorporated into group n-1 rather than
group n. This process continues until the size of group n reaches 1, at permutation
k=i-n+1. Then the size of group n-2 increases by 1, and groups n and n-1 move one
lower than they were in permutation k=1. This process of regrouping progresses until
permutation k = N, where the additional (i – n) sections are incorporated into the 1st
group. As a numerical example consider how 7 sections can be placed into 3 groups,
creating 15 grouping permutations (i=7, n=3, and N=15), as shown in Table 5.2.
Table 5.1: Possible grouping configurations for creating n groups from isections
Permutation number (k) and the distributionof sections into groupsSection
no.Mass(kg/m)
Initialgroup
no. Groupingk = 1
Groupingk = 2 --- Grouping
k = i-n+1Groupingk=i-n+2
Groupingk=i-n+3 --- Grouping
k=N1 m1 1 Grp. 1 1 1 1 12 m2 2 Grp. 2 2 2 2 23 m3 3 Grp. 3 3 3 3 3
n-1 mn-1 n-1 Grp.(n-1) n-2 n-2n mn n
n-1n-1
1
n+1 mn+1 n+1n-1
n-2i-1 mi-1 i-1
n-1
n-1i mi i-1
Grp. n(Extra i-nmembersinitially
placed inthis group)
n
---
n
nn
---
n
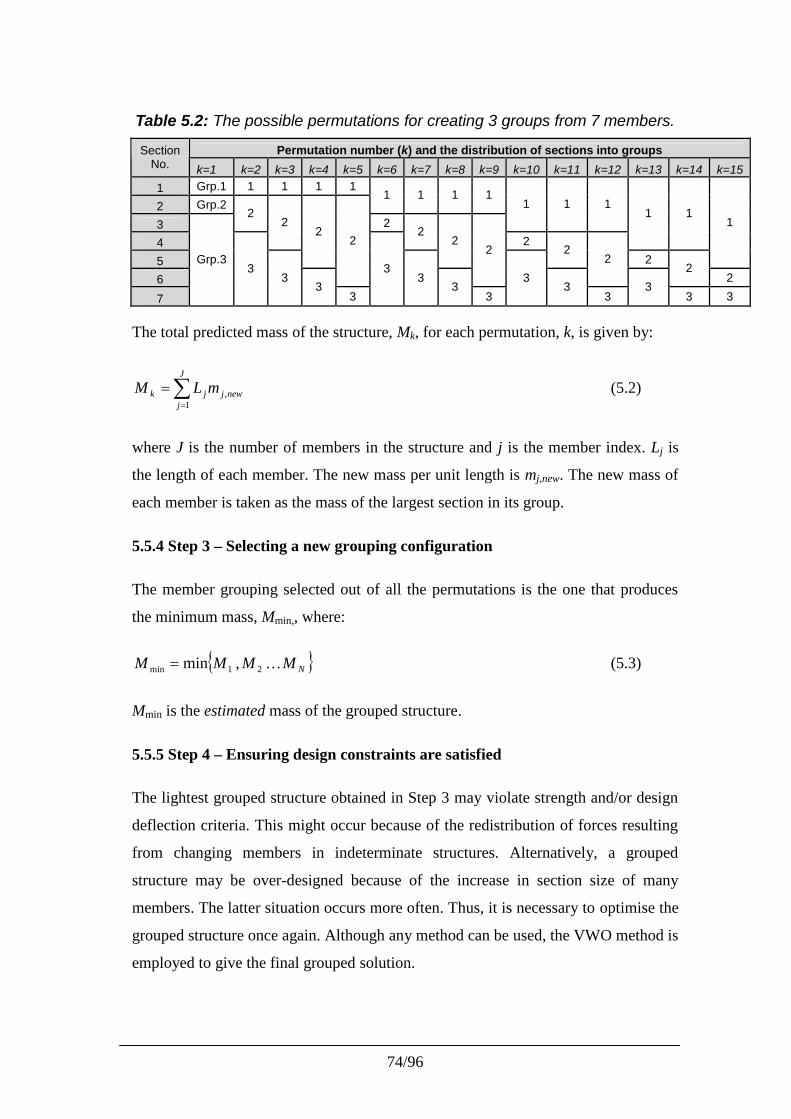
74/96
Table 5.2: The possible permutations for creating 3 groups from 7 members.
Permutation number (k) and the distribution of sections into groupsSectionNo. k=1 k=2 k=3 k=4 k=5 k=6 k=7 k=8 k=9 k=10 k=11 k=12 k=13 k=14 k=151 Grp.1 1 1 1 1
2 Grp.21 1 1 1
32
21 1 1
4
22
2
1 1
5
22
22
1
6
22
22
2
7
Grp.33
33
3
33
33
33
33
3 3
The total predicted mass of the structure, Mk, for each permutation, k, is given by:
J
jnewjjk mLM
1, (5.2)
where J is the number of members in the structure and j is the member index. Lj is
the length of each member. The new mass per unit length is mj,new. The new mass of
each member is taken as the mass of the largest section in its group.
5.5.4 Step 3 – Selecting a new grouping configuration
The member grouping selected out of all the permutations is the one that produces
the minimum mass, Mmin,, where:
NMMMM 21min ,min (5.3)
Mmin is the estimated mass of the grouped structure.
5.5.5 Step 4 – Ensuring design constraints are satisfied
The lightest grouped structure obtained in Step 3 may violate strength and/or design
deflection criteria. This might occur because of the redistribution of forces resulting
from changing members in indeterminate structures. Alternatively, a grouped
structure may be over-designed because of the increase in section size of many
members. The latter situation occurs more often. Thus, it is necessary to optimise the
grouped structure once again. Although any method can be used, the VWO method is
employed to give the final grouped solution.
75/96
The difference in the estimated and final masses will depend on numerous factors. In
statically determinate structures, with strength dependent members, the estimation
will be accurate. In statically indeterminate structures, which are predominantly
deflection dependent, the estimated mass is usually inaccurate, and probably an over-
estimate. However, the estimation provides an effective method for specifying
groups, and not the final members sizes.
5.6 Using multiple section types – a further constraint
In most structures a further constraint can be imposed by selecting the type of section
to be used for each member (I-section, angle, channel). These sections must be
grouped separately, and are treated as subgroups. The user must specify the number
of groups to be created for each type of section: n1, n2,…,nα where α is the number of
different types of sections in the structure. The number of sections of each type in the
initial ungrouped structure is i1, i2,…,iα. The total number of sections in the
ungrouped structure, i, is the summation of i1, i2,…,iα. The number of permutations
to be investigated for each section type is calculated using Equation 5.1, with the
values of il and nl of each type, where l is the section type index of each subgroup.
The total number of permutations to be investigated is:
1llNN (5.4)
The predicted mass of the structure is the summation of the minimum mass
permutation of each section type:
1min,min
llMM (5.5)
By considering different section types as subgroups the number of permutations to be
investigated is limited. Please note that members having different section types, but
the same mass per unit length, cannot be grouped together because of the possible
large variation in geometric properties.
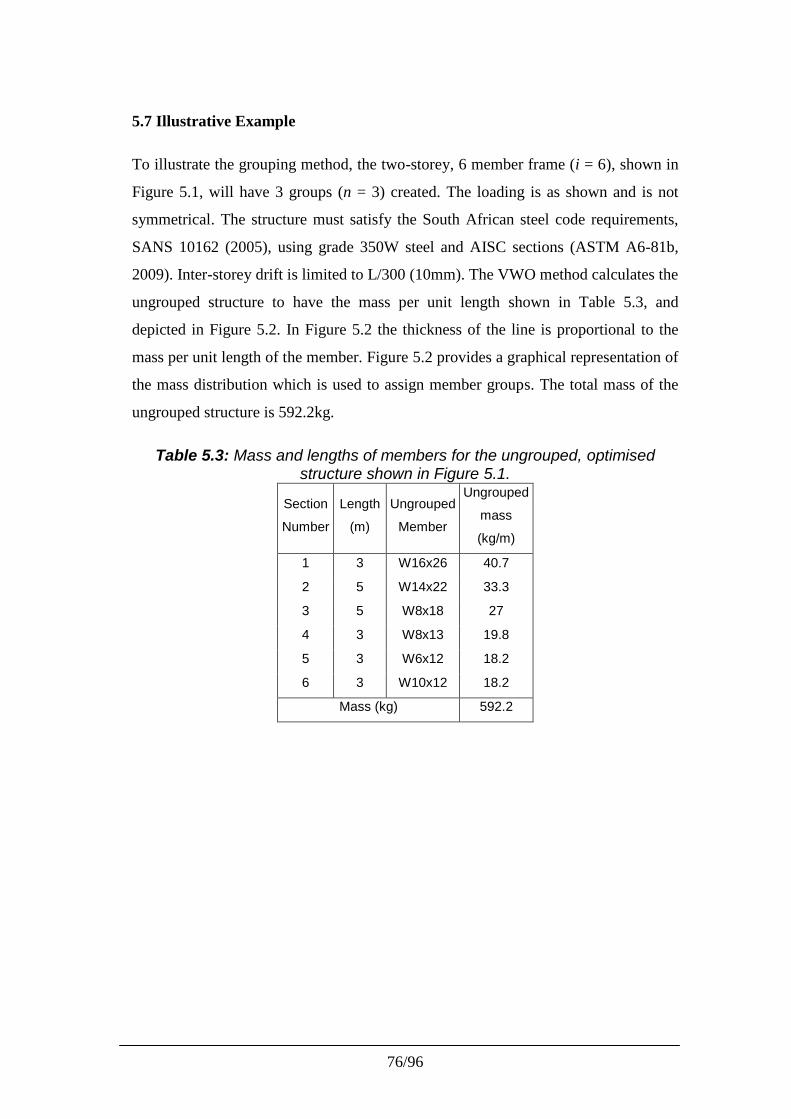
76/96
5.7 Illustrative Example
To illustrate the grouping method, the two-storey, 6 member frame (i = 6), shown in
Figure 5.1, will have 3 groups (n = 3) created. The loading is as shown and is not
symmetrical. The structure must satisfy the South African steel code requirements,
SANS 10162 (2005), using grade 350W steel and AISC sections (ASTM A6-81b,
2009). Inter-storey drift is limited to L/300 (10mm). The VWO method calculates the
ungrouped structure to have the mass per unit length shown in Table 5.3, and
depicted in Figure 5.2. In Figure 5.2 the thickness of the line is proportional to the
mass per unit length of the member. Figure 5.2 provides a graphical representation of
the mass distribution which is used to assign member groups. The total mass of the
ungrouped structure is 592.2kg.
Table 5.3: Mass and lengths of members for the ungrouped, optimisedstructure shown in Figure 5.1.
Section
Number
Length
(m)
Ungrouped
Member
Ungrouped
mass
(kg/m)
1 3 W16x26 40.7
2 5 W14x22 33.3
3 5 W8x18 27
4 3 W8x13 19.8
5 3 W6x12 18.2
6 3 W10x12 18.2
Mass (kg) 592.2
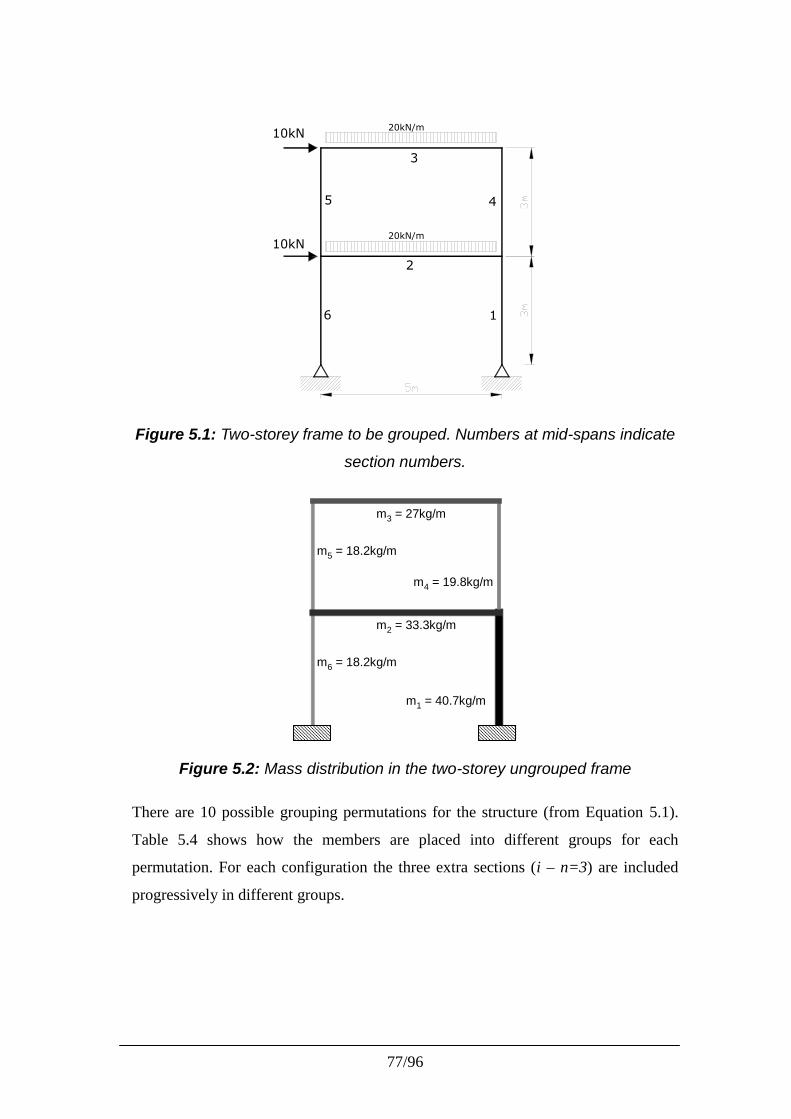
77/96
10kN
20kN/m
20kN/m
2
3
6 1
5 4
10kN
Figure 5.1: Two-storey frame to be grouped. Numbers at mid-spans indicate
section numbers.
m3 = 27kg/m
m5 = 18.2kg/m
m4 = 19.8kg/m
m2 = 33.3kg/m
m6 = 18.2kg/m
m1 = 40.7kg/m
Figure 5.2: Mass distribution in the two-storey ungrouped frame
There are 10 possible grouping permutations for the structure (from Equation 5.1).
Table 5.4 shows how the members are placed into different groups for each
permutation. For each configuration the three extra sections (i – n=3) are included
progressively in different groups.
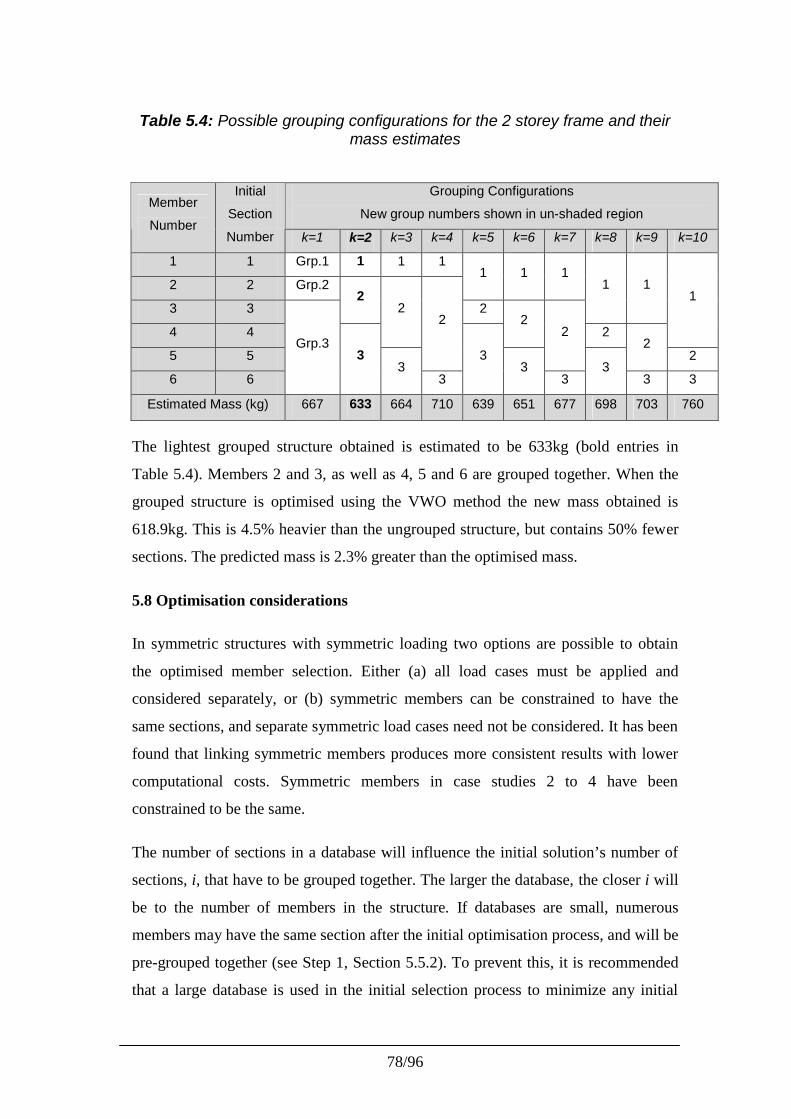
78/96
Table 5.4: Possible grouping configurations for the 2 storey frame and theirmass estimates
Grouping Configurations
New group numbers shown in un-shaded regionMember
Number
Initial
Section
Number k=1 k=2 k=3 k=4 k=5 k=6 k=7 k=8 k=9 k=10
1 1 Grp.1 1 1 1
2 2 Grp.21 1 1
3 32
2
1 1
4 4
22
2
1
5 5
22
22
6 6
Grp.33
33
33
33
3 3
Estimated Mass (kg) 667 633 664 710 639 651 677 698 703 760
The lightest grouped structure obtained is estimated to be 633kg (bold entries in
Table 5.4). Members 2 and 3, as well as 4, 5 and 6 are grouped together. When the
grouped structure is optimised using the VWO method the new mass obtained is
618.9kg. This is 4.5% heavier than the ungrouped structure, but contains 50% fewer
sections. The predicted mass is 2.3% greater than the optimised mass.
5.8 Optimisation considerations
In symmetric structures with symmetric loading two options are possible to obtain
the optimised member selection. Either (a) all load cases must be applied and
considered separately, or (b) symmetric members can be constrained to have the
same sections, and separate symmetric load cases need not be considered. It has been
found that linking symmetric members produces more consistent results with lower
computational costs. Symmetric members in case studies 2 to 4 have been
constrained to be the same.
The number of sections in a database will influence the initial solution’s number of
sections, i, that have to be grouped together. The larger the database, the closer i will
be to the number of members in the structure. If databases are small, numerous
members may have the same section after the initial optimisation process, and will be
pre-grouped together (see Step 1, Section 5.5.2). To prevent this, it is recommended
that a large database is used in the initial selection process to minimize any initial
79/96
grouping. For constructability only the available section database can then be used in
Step 4.
Members with the same section type, but different requirements, can be isolated and
grouped separately. This creates additional subgroups, which are addressed in the
same manner as using different section types. An example of such a requirement is
specifying that the chords of a truss must not be grouped with bracing or diagonal
members (see case study 3, Section 5.12.3).
Linking existing groups is possible, and performed in an identical manner to linking
individual members. In Step 1 the number of sections, i, is set to the number of
existing groups.
5.9 Reducing computational costs
Large search spaces are rare because of the size and nature of existing section
databases. It is unusual to find more than 20 different sections of each type in an
optimised, ungrouped structure; this produces less than 100,000 permutations for
each section type. In the case studies it was not necessary to reduce the search
spaces. However, if large or continuous, synthetic section databases had been used to
obtain the ungrouped solutions, it would have been essential to decrease computer
time. If search spaces do become too large, two ways to reduce computational costs
are proposed: (a) creating subgroups, and (b) investigating permutations only within
a viable ‘radius’.
Creating subgroups introduces extra constraints but reduces computational cost. For
example if 80 sections have to be placed into 10 groups there would be 2.06 x 10¹¹
permutations (Equation 5.1). However, creating 2 subgroups of 40 members and
placing them into 5 groups each would only result in 1.64 x 10⁵ permutations.
Reducing computational cost by performing a radius search is based on the following
observation: the lightest and heaviest members in a group are separated by only a
few section sizes found in the initial solution. Permutations can thus be performed
only a user defined radius, X, away from any one entry.
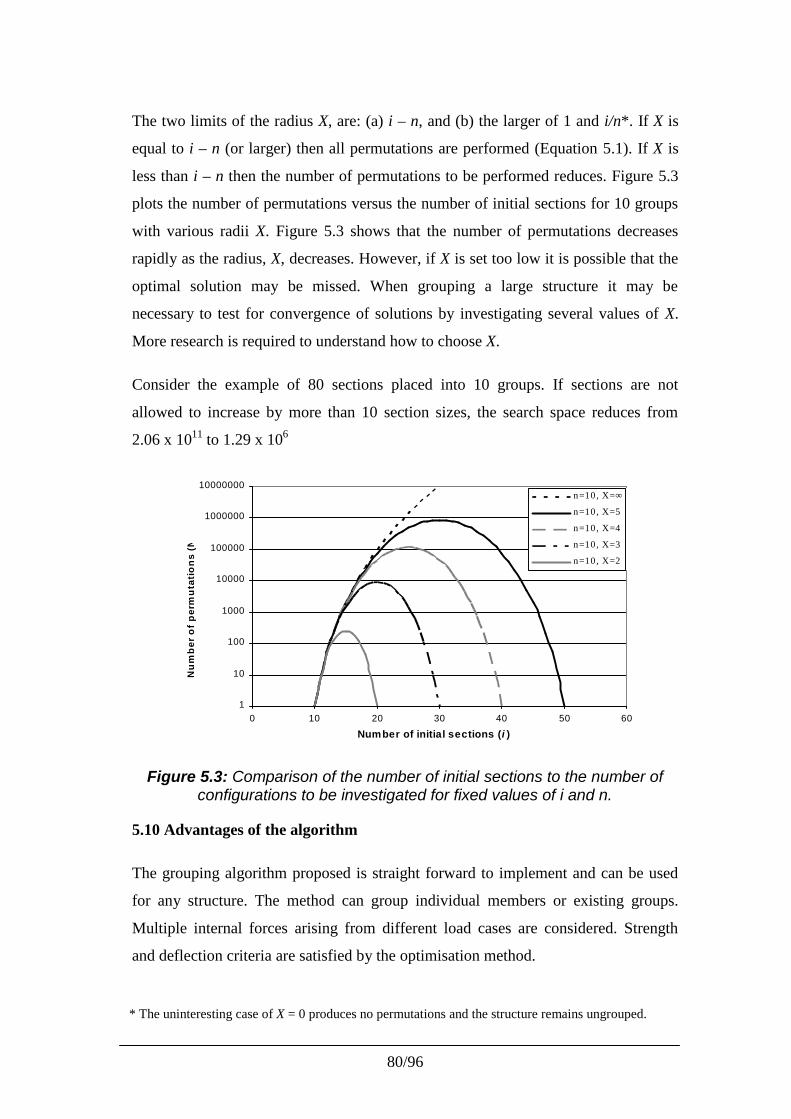
80/96
The two limits of the radius X, are: (a) i – n, and (b) the larger of 1 and i/n*. If X is
equal to i – n (or larger) then all permutations are performed (Equation 5.1). If X is
less than i – n then the number of permutations to be performed reduces. Figure 5.3
plots the number of permutations versus the number of initial sections for 10 groups
with various radii X. Figure 5.3 shows that the number of permutations decreases
rapidly as the radius, X, decreases. However, if X is set too low it is possible that the
optimal solution may be missed. When grouping a large structure it may be
necessary to test for convergence of solutions by investigating several values of X.
More research is required to understand how to choose X.
Consider the example of 80 sections placed into 10 groups. If sections are not
allowed to increase by more than 10 section sizes, the search space reduces from
2.06 x 10¹¹ to 1.29 x 10⁶
1
10
100
1000
10000
100000
1000000
10000000
0 10 20 30 40 50 60
Number of initial sections (i )
Nu
mb
er o
f p
erm
uta
tio
ns
(N)
n=10, X=∞
n=10, X=5
n=10, X=4
n=10, X=3
n=10, X=2
Figure 5.3: Comparison of the number of initial sections to the number ofconfigurations to be investigated for fixed values of i and n.
5.10 Advantages of the algorithm
The grouping algorithm proposed is straight forward to implement and can be used
for any structure. The method can group individual members or existing groups.
Multiple internal forces arising from different load cases are considered. Strength
and deflection criteria are satisfied by the optimisation method.
* The uninteresting case of X = 0 produces no permutations and the structure remains ungrouped.
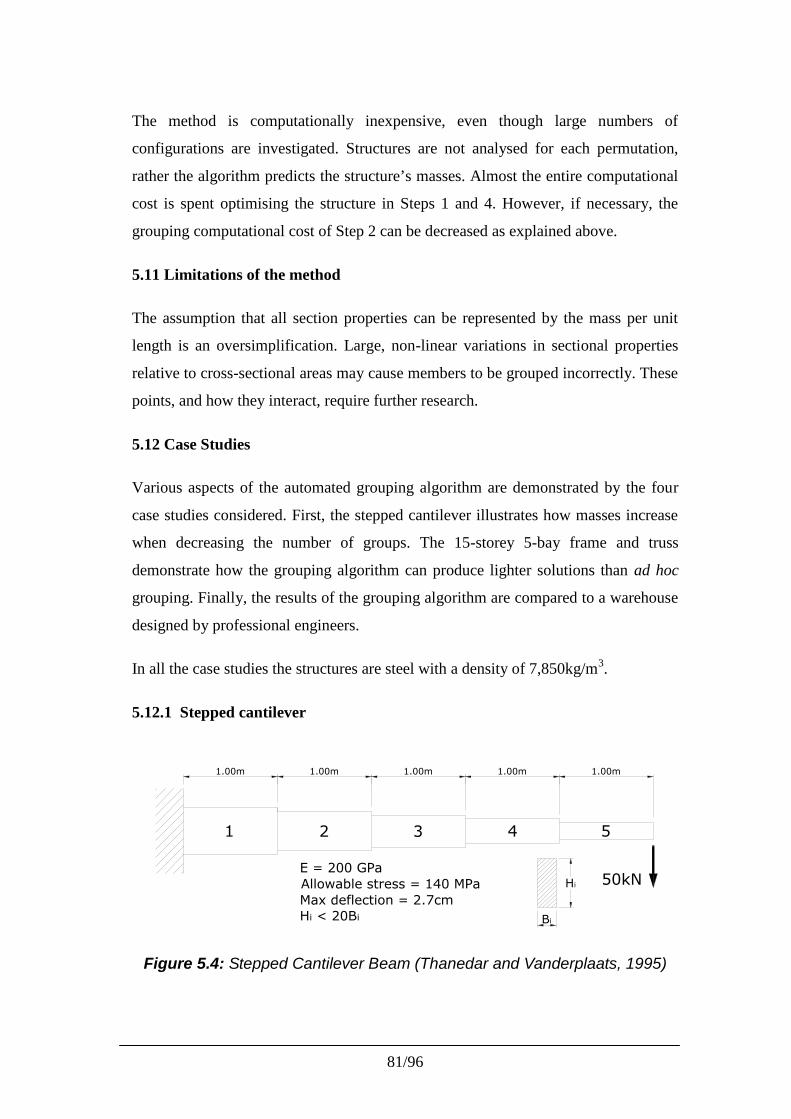
81/96
The method is computationally inexpensive, even though large numbers of
configurations are investigated. Structures are not analysed for each permutation,
rather the algorithm predicts the structure’s masses. Almost the entire computational
cost is spent optimising the structure in Steps 1 and 4. However, if necessary, the
grouping computational cost of Step 2 can be decreased as explained above.
5.11 Limitations of the method
The assumption that all section properties can be represented by the mass per unit
length is an oversimplification. Large, non-linear variations in sectional properties
relative to cross-sectional areas may cause members to be grouped incorrectly. These
points, and how they interact, require further research.
5.12 Case Studies
Various aspects of the automated grouping algorithm are demonstrated by the four
case studies considered. First, the stepped cantilever illustrates how masses increase
when decreasing the number of groups. The 15-storey 5-bay frame and truss
demonstrate how the grouping algorithm can produce lighter solutions than ad hoc
grouping. Finally, the results of the grouping algorithm are compared to a warehouse
designed by professional engineers.
In all the case studies the structures are steel with a density of 7,850kg/m3.
5.12.1 Stepped cantilever
1.00m 1.00m 1.00m 1.00m 1.00m
1 2 3 4 5
50kN
Bi
Hi
E = 200 GPaAllowable stress = 140 MPaMax deflection = 2.7cmHi < 20Bi
Figure 5.4: Stepped Cantilever Beam (Thanedar and Vanderplaats, 1995)
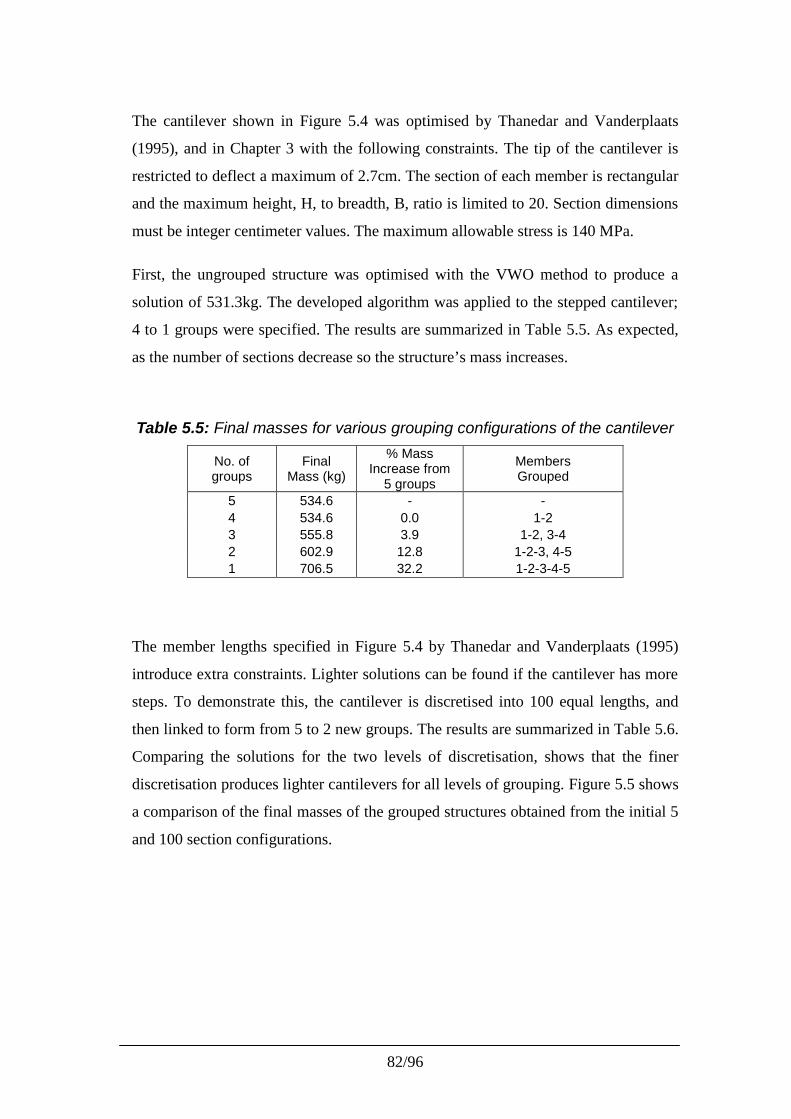
82/96
The cantilever shown in Figure 5.4 was optimised by Thanedar and Vanderplaats
(1995), and in Chapter 3 with the following constraints. The tip of the cantilever is
restricted to deflect a maximum of 2.7cm. The section of each member is rectangular
and the maximum height, H, to breadth, B, ratio is limited to 20. Section dimensions
must be integer centimeter values. The maximum allowable stress is 140 MPa.
First, the ungrouped structure was optimised with the VWO method to produce a
solution of 531.3kg. The developed algorithm was applied to the stepped cantilever;
4 to 1 groups were specified. The results are summarized in Table 5.5. As expected,
as the number of sections decrease so the structure’s mass increases.
Table 5.5: Final masses for various grouping configurations of the cantilever
No. ofgroups
FinalMass (kg)
% MassIncrease from
5 groups
MembersGrouped
5 534.6 - -4 534.6 0.0 1-23 555.8 3.9 1-2, 3-42 602.9 12.8 1-2-3, 4-51 706.5 32.2 1-2-3-4-5
The member lengths specified in Figure 5.4 by Thanedar and Vanderplaats (1995)
introduce extra constraints. Lighter solutions can be found if the cantilever has more
steps. To demonstrate this, the cantilever is discretised into 100 equal lengths, and
then linked to form from 5 to 2 new groups. The results are summarized in Table 5.6.
Comparing the solutions for the two levels of discretisation, shows that the finer
discretisation produces lighter cantilevers for all levels of grouping. Figure 5.5 shows
a comparison of the final masses of the grouped structures obtained from the initial 5
and 100 section configurations.
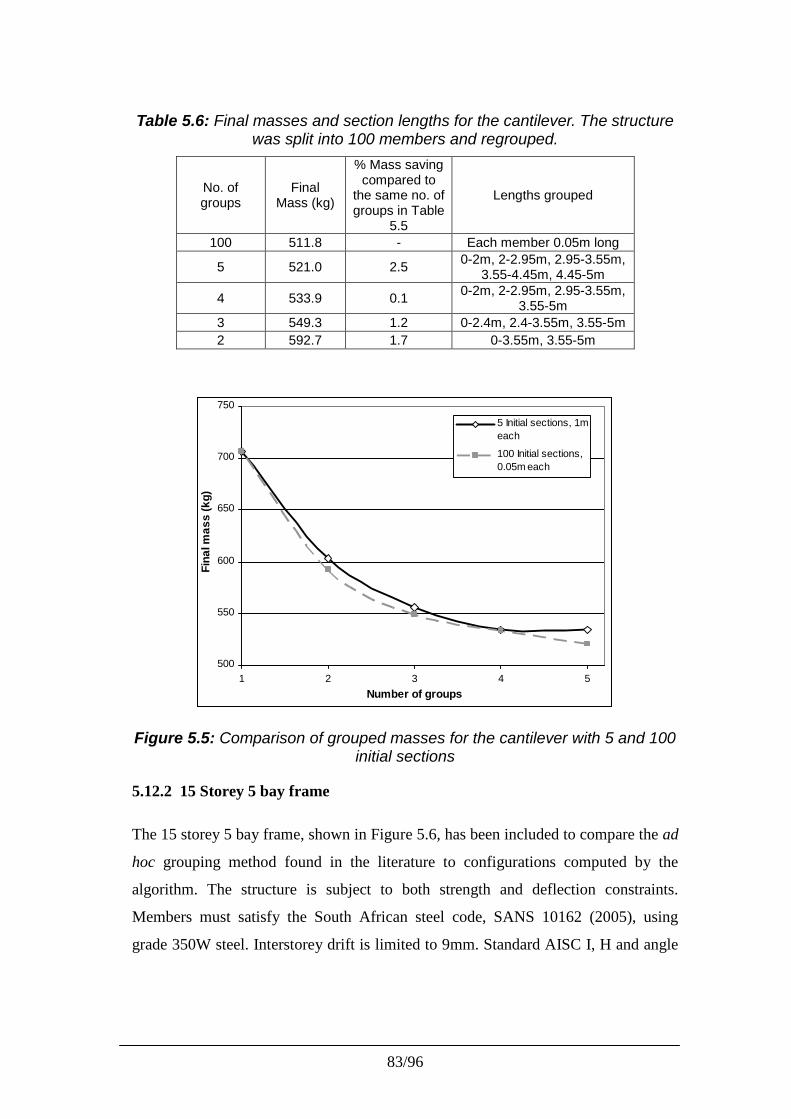
83/96
Table 5.6: Final masses and section lengths for the cantilever. The structurewas split into 100 members and regrouped.
No. ofgroups
FinalMass (kg)
% Mass savingcompared to
the same no. ofgroups in Table
5.5
Lengths grouped
100 511.8 - Each member 0.05m long
5 521.0 2.5 0-2m, 2-2.95m, 2.95-3.55m,3.55-4.45m, 4.45-5m
4 533.9 0.1 0-2m, 2-2.95m, 2.95-3.55m,3.55-5m
3 549.3 1.2 0-2.4m, 2.4-3.55m, 3.55-5m2 592.7 1.7 0-3.55m, 3.55-5m
500
550
600
650
700
750
1 2 3 4 5Number of groups
Fina
l mas
s (k
g)
5 Initial sections, 1meach
100 Initial sections,0.05m each
Figure 5.5: Comparison of grouped masses for the cantilever with 5 and 100initial sections
5.12.2 15 Storey 5 bay frame
The 15 storey 5 bay frame, shown in Figure 5.6, has been included to compare the ad
hoc grouping method found in the literature to configurations computed by the
algorithm. The structure is subject to both strength and deflection constraints.
Members must satisfy the South African steel code, SANS 10162 (2005), using
grade 350W steel. Interstorey drift is limited to 9mm. Standard AISC I, H and angle
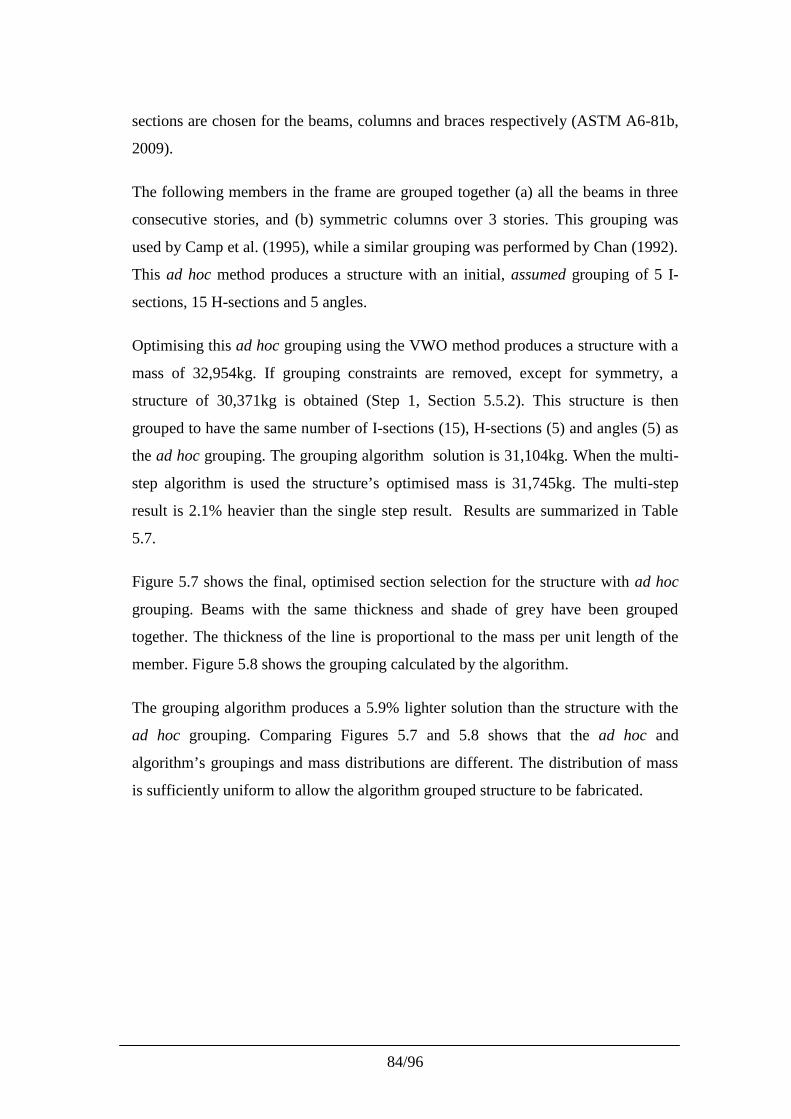
84/96
sections are chosen for the beams, columns and braces respectively (ASTM A6-81b,
2009).
The following members in the frame are grouped together (a) all the beams in three
consecutive stories, and (b) symmetric columns over 3 stories. This grouping was
used by Camp et al. (1995), while a similar grouping was performed by Chan (1992).
This ad hoc method produces a structure with an initial, assumed grouping of 5 I-
sections, 15 H-sections and 5 angles.
Optimising this ad hoc grouping using the VWO method produces a structure with a
mass of 32,954kg. If grouping constraints are removed, except for symmetry, a
structure of 30,371kg is obtained (Step 1, Section 5.5.2). This structure is then
grouped to have the same number of I-sections (15), H-sections (5) and angles (5) as
the ad hoc grouping. The grouping algorithm solution is 31,104kg. When the multi-
step algorithm is used the structure’s optimised mass is 31,745kg. The multi-step
result is 2.1% heavier than the single step result. Results are summarized in Table
5.7.
Figure 5.7 shows the final, optimised section selection for the structure with ad hoc
grouping. Beams with the same thickness and shade of grey have been grouped
together. The thickness of the line is proportional to the mass per unit length of the
member. Figure 5.8 shows the grouping calculated by the algorithm.
The grouping algorithm produces a 5.9% lighter solution than the structure with the
ad hoc grouping. Comparing Figures 5.7 and 5.8 shows that the ad hoc and
algorithm’s groupings and mass distributions are different. The distribution of mass
is sufficiently uniform to allow the algorithm grouped structure to be fabricated.
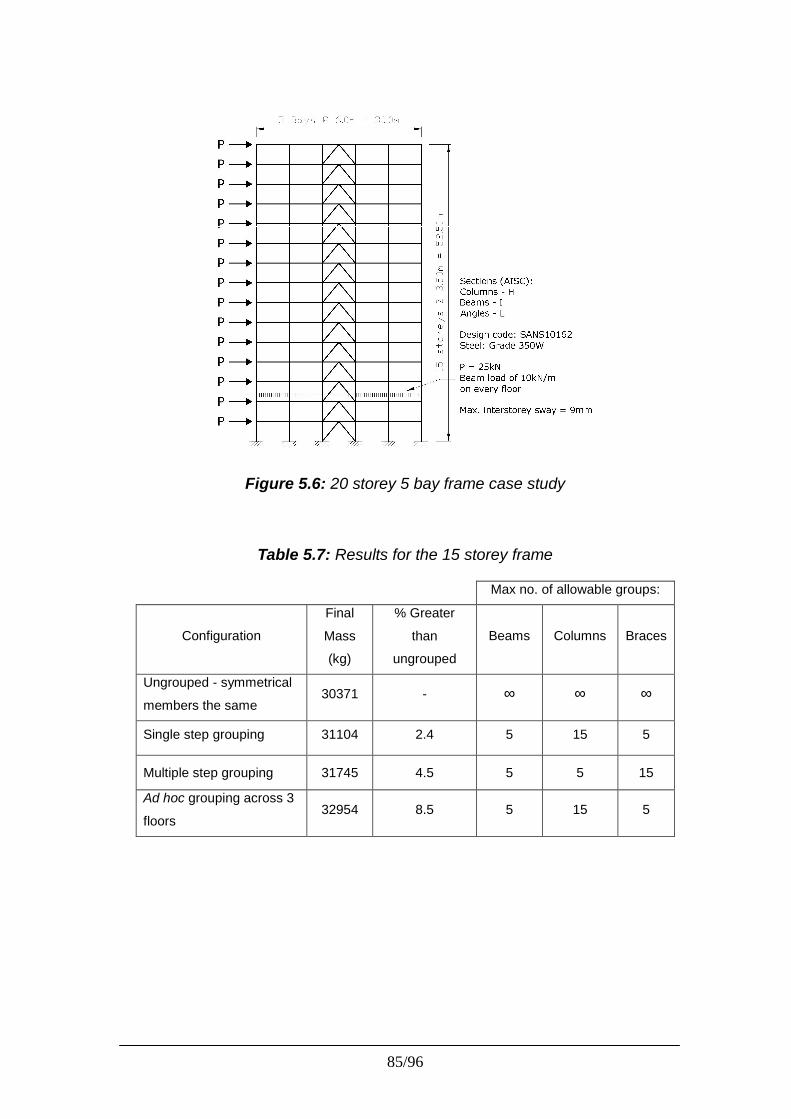
85/96
Figure 5.6: 20 storey 5 bay frame case study
Table 5.7: Results for the 15 storey frame
Max no. of allowable groups:
Configuration
Final
Mass
(kg)
% Greater
than
ungrouped
Beams Columns Braces
Ungrouped - symmetrical
members the same30371 - ∞ ∞ ∞
Single step grouping 31104 2.4 5 15 5
Multiple step grouping 31745 4.5 5 5 15
Ad hoc grouping across 3
floors32954 8.5 5 15 5
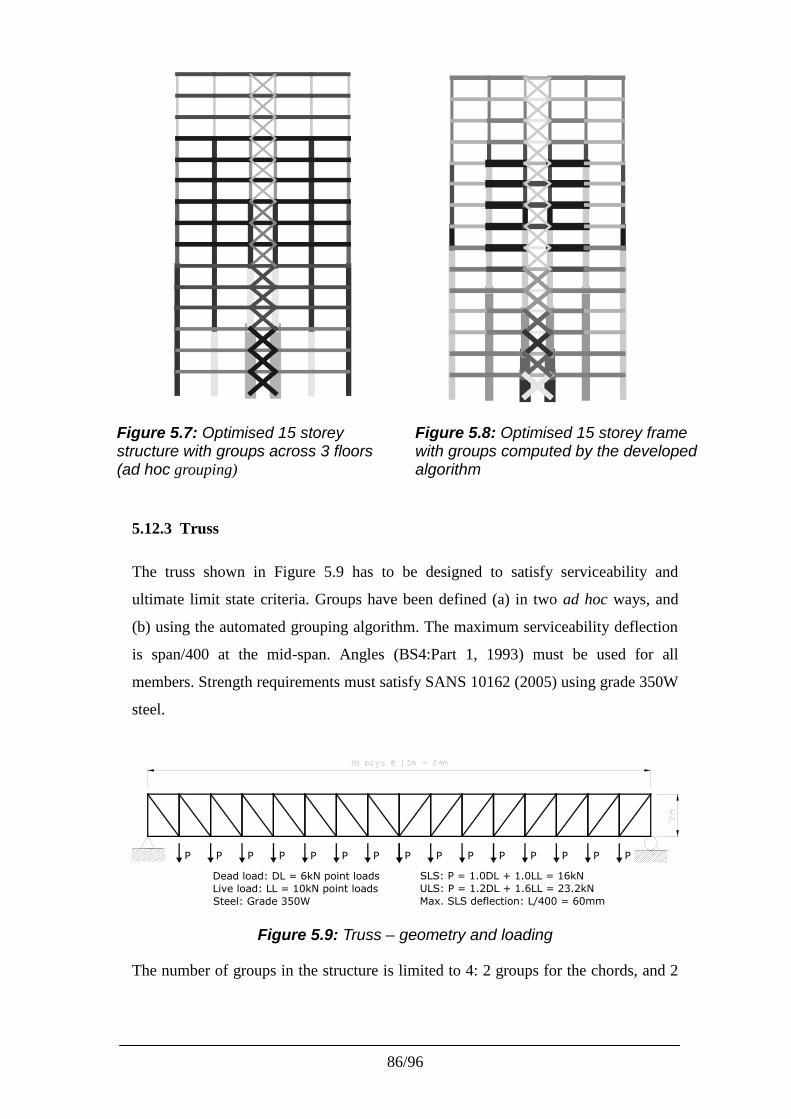
86/96
Figure 5.7: Optimised 15 storeystructure with groups across 3 floors(ad hoc grouping)
Figure 5.8: Optimised 15 storey framewith groups computed by the developedalgorithm
5.12.3 Truss
The truss shown in Figure 5.9 has to be designed to satisfy serviceability and
ultimate limit state criteria. Groups have been defined (a) in two ad hoc ways, and
(b) using the automated grouping algorithm. The maximum serviceability deflection
is span/400 at the mid-span. Angles (BS4:Part 1, 1993) must be used for all
members. Strength requirements must satisfy SANS 10162 (2005) using grade 350W
steel.
Dead load: DL = 6kN point loadsLive load: LL = 10kN point loadsSteel: Grade 350W
SLS: P = 1.0DL + 1.0LL = 16kNULS: P = 1.2DL + 1.6LL = 23.2kNMax. SLS deflection: L/400 = 60mm
P P P P P P P PPPPPPP P
Figure 5.9: Truss – geometry and loading
The number of groups in the structure is limited to 4: 2 groups for the chords, and 2
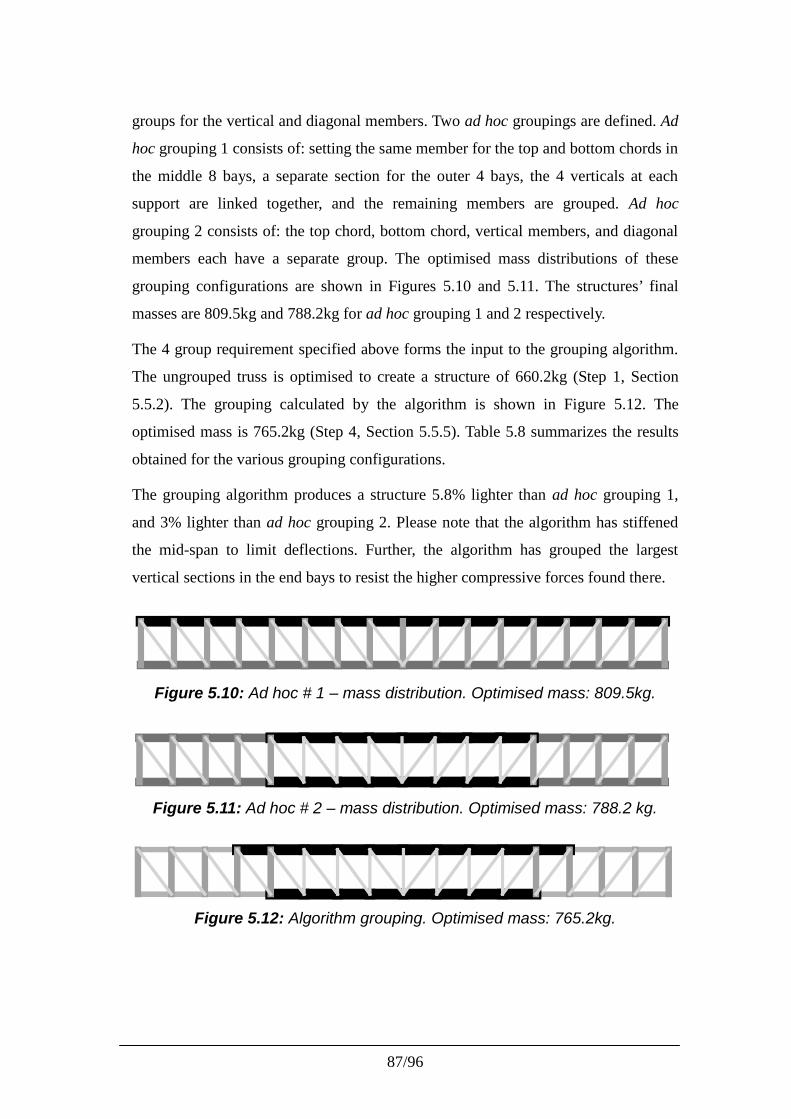
87/96
groups for the vertical and diagonal members. Two ad hoc groupings are defined. Ad
hoc grouping 1 consists of: setting the same member for the top and bottom chords in
the middle 8 bays, a separate section for the outer 4 bays, the 4 verticals at each
support are linked together, and the remaining members are grouped. Ad hoc
grouping 2 consists of: the top chord, bottom chord, vertical members, and diagonal
members each have a separate group. The optimised mass distributions of these
grouping configurations are shown in Figures 5.10 and 5.11. The structures’ final
masses are 809.5kg and 788.2kg for ad hoc grouping 1 and 2 respectively.
The 4 group requirement specified above forms the input to the grouping algorithm.
The ungrouped truss is optimised to create a structure of 660.2kg (Step 1, Section
5.5.2). The grouping calculated by the algorithm is shown in Figure 5.12. The
optimised mass is 765.2kg (Step 4, Section 5.5.5). Table 5.8 summarizes the results
obtained for the various grouping configurations.
The grouping algorithm produces a structure 5.8% lighter than ad hoc grouping 1,
and 3% lighter than ad hoc grouping 2. Please note that the algorithm has stiffened
the mid-span to limit deflections. Further, the algorithm has grouped the largest
vertical sections in the end bays to resist the higher compressive forces found there.
Figure 5.10: Ad hoc # 1 – mass distribution. Optimised mass: 809.5kg.
Figure 5.11: Ad hoc # 2 – mass distribution. Optimised mass: 788.2 kg.
Figure 5.12: Algorithm grouping. Optimised mass: 765.2kg.
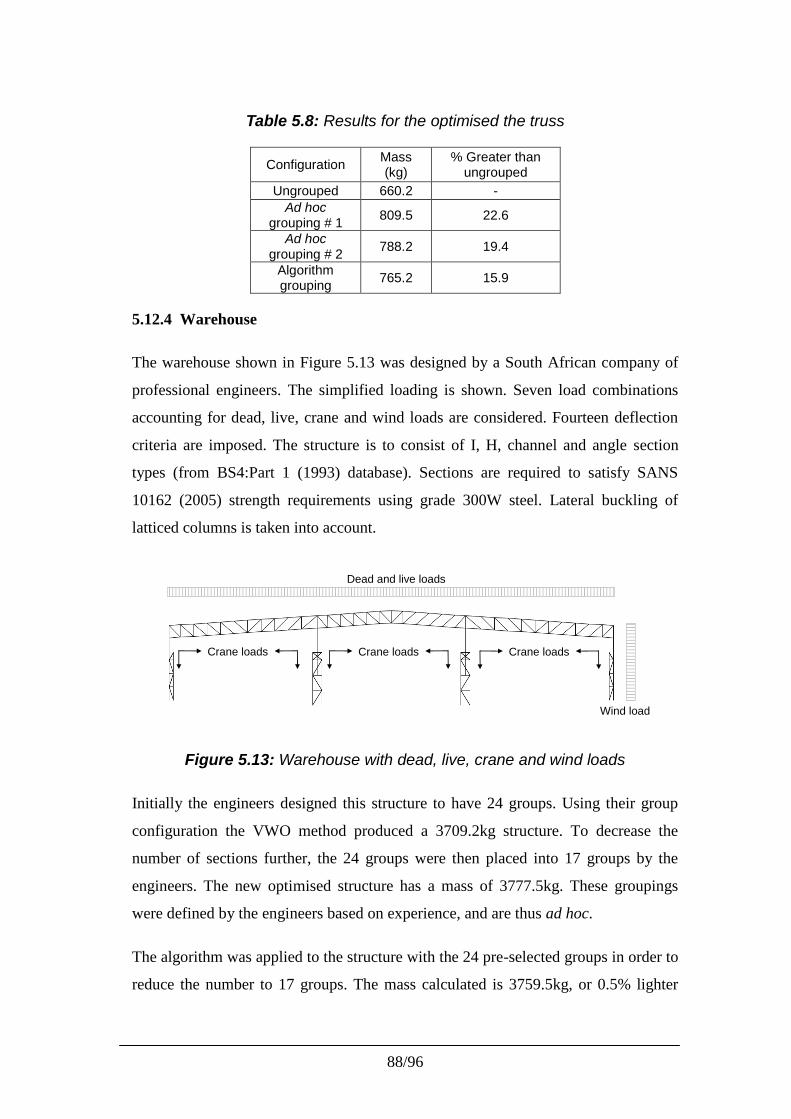
88/96
Table 5.8: Results for the optimised the truss
Configuration Mass(kg)
% Greater thanungrouped
Ungrouped 660.2 -Ad hoc
grouping # 1 809.5 22.6
Ad hocgrouping # 2 788.2 19.4
Algorithmgrouping 765.2 15.9
5.12.4 Warehouse
The warehouse shown in Figure 5.13 was designed by a South African company of
professional engineers. The simplified loading is shown. Seven load combinations
accounting for dead, live, crane and wind loads are considered. Fourteen deflection
criteria are imposed. The structure is to consist of I, H, channel and angle section
types (from BS4:Part 1 (1993) database). Sections are required to satisfy SANS
10162 (2005) strength requirements using grade 300W steel. Lateral buckling of
latticed columns is taken into account.
Dead and live loads
Crane loads
Wind load
Crane loads Crane loads
Figure 5.13: Warehouse with dead, live, crane and wind loads
Initially the engineers designed this structure to have 24 groups. Using their group
configuration the VWO method produced a 3709.2kg structure. To decrease the
number of sections further, the 24 groups were then placed into 17 groups by the
engineers. The new optimised structure has a mass of 3777.5kg. These groupings
were defined by the engineers based on experience, and are thus ad hoc.
The algorithm was applied to the structure with the 24 pre-selected groups in order to
reduce the number to 17 groups. The mass calculated is 3759.5kg, or 0.5% lighter
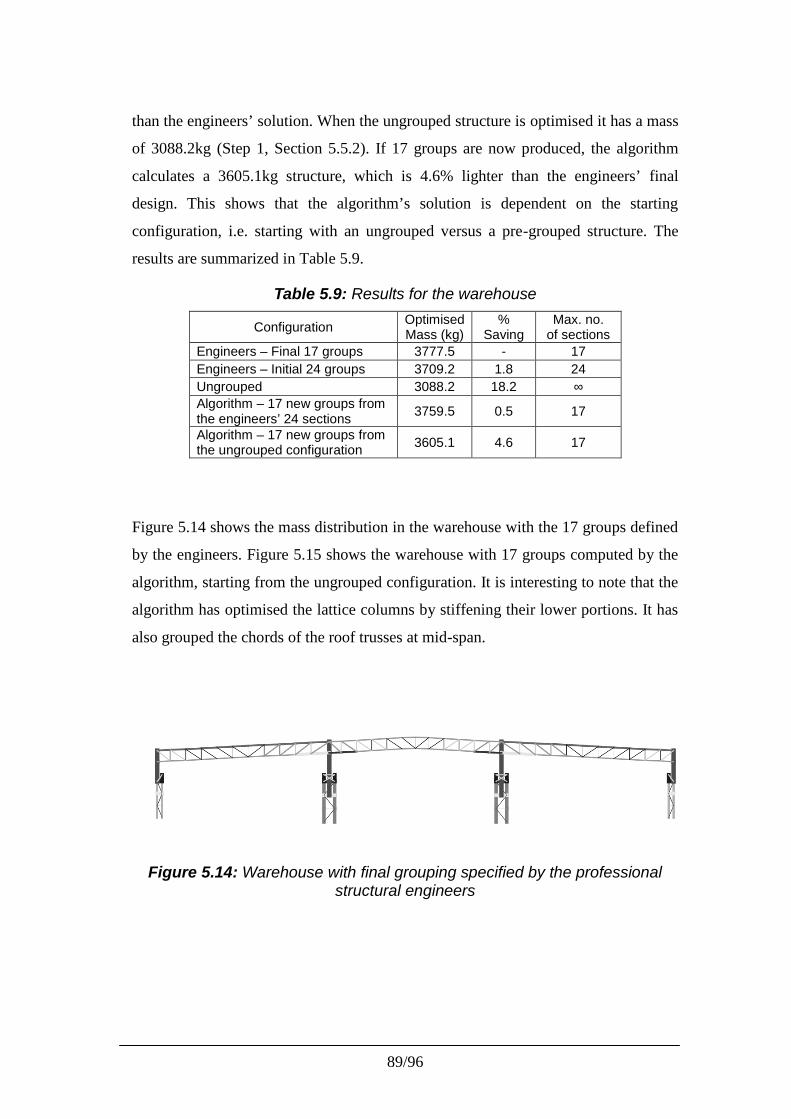
89/96
than the engineers’ solution. When the ungrouped structure is optimised it has a mass
of 3088.2kg (Step 1, Section 5.5.2). If 17 groups are now produced, the algorithm
calculates a 3605.1kg structure, which is 4.6% lighter than the engineers’ final
design. This shows that the algorithm’s solution is dependent on the starting
configuration, i.e. starting with an ungrouped versus a pre-grouped structure. The
results are summarized in Table 5.9.
Table 5.9: Results for the warehouse
Configuration OptimisedMass (kg)
%Saving
Max. no.of sections
Engineers – Final 17 groups 3777.5 - 17Engineers – Initial 24 groups 3709.2 1.8 24Ungrouped 3088.2 18.2 ∞Algorithm – 17 new groups fromthe engineers’ 24 sections 3759.5 0.5 17
Algorithm – 17 new groups fromthe ungrouped configuration 3605.1 4.6 17
Figure 5.14 shows the mass distribution in the warehouse with the 17 groups defined
by the engineers. Figure 5.15 shows the warehouse with 17 groups computed by the
algorithm, starting from the ungrouped configuration. It is interesting to note that the
algorithm has optimised the lattice columns by stiffening their lower portions. It has
also grouped the chords of the roof trusses at mid-span.
Figure 5.14: Warehouse with final grouping specified by the professionalstructural engineers
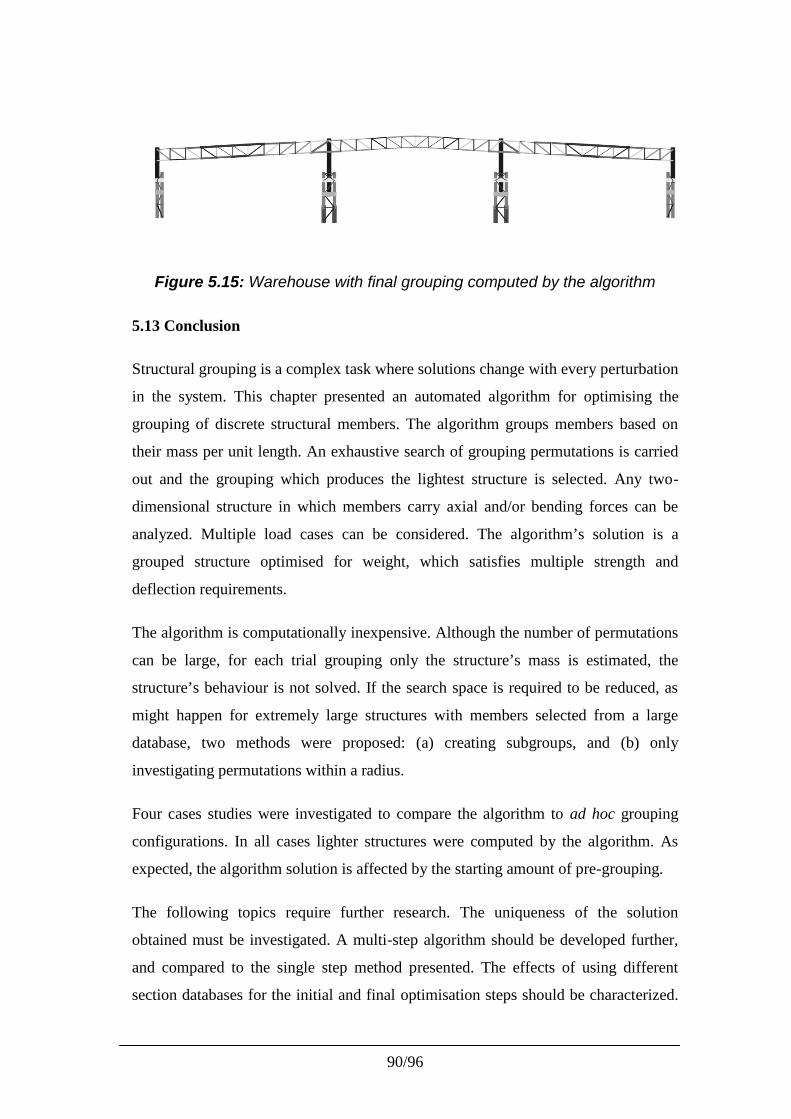
90/96
Figure 5.15: Warehouse with final grouping computed by the algorithm
5.13 Conclusion
Structural grouping is a complex task where solutions change with every perturbation
in the system. This chapter presented an automated algorithm for optimising the
grouping of discrete structural members. The algorithm groups members based on
their mass per unit length. An exhaustive search of grouping permutations is carried
out and the grouping which produces the lightest structure is selected. Any two-
dimensional structure in which members carry axial and/or bending forces can be
analyzed. Multiple load cases can be considered. The algorithm’s solution is a
grouped structure optimised for weight, which satisfies multiple strength and
deflection requirements.
The algorithm is computationally inexpensive. Although the number of permutations
can be large, for each trial grouping only the structure’s mass is estimated, the
structure’s behaviour is not solved. If the search space is required to be reduced, as
might happen for extremely large structures with members selected from a large
database, two methods were proposed: (a) creating subgroups, and (b) only
investigating permutations within a radius.
Four cases studies were investigated to compare the algorithm to ad hoc grouping
configurations. In all cases lighter structures were computed by the algorithm. As
expected, the algorithm solution is affected by the starting amount of pre-grouping.
The following topics require further research. The uniqueness of the solution
obtained must be investigated. A multi-step algorithm should be developed further,
and compared to the single step method presented. The effects of using different
section databases for the initial and final optimisation steps should be characterized.
91/96
The algorithm’s framework is suitable for three-dimensional structures, but this
needs to be implemented and the performance investigated.
5.14 References
ASTM A6-81b. (2009). Specifications from ASTM A6 – Standard Specification for
General Requirements for Rolled Structural Steel Bars, Plates, Shapes and Steel
Piling. American Society for Testing and Materials.
Barbosa, H.J.C. and Lemonge, A.C.C. (2005) A Genetic Algorithm Encoding for a
Class of Cardinality Constraints. GECCO, June, 25-29.
Barbosa, H.J.C., Lemonge, A.C.C., and Borges, C.C.H. (2008) A genetic algorithm
encoding for cardinality constraints and automatic variable linking in structural
optimisation. Engineering Stuctures, 30, 3708-3723.
Barthelemy, J.F.M, and Haftka, R.T. (1993) Approximation concepts for optimal
structural design – a review. Structural Optimisation, 5, 129-144.
Biedermann, J.D., and Grierson, D.E. (1995) A Generic Model for Building Design.
Engineering with Computers, 11, 173-184.
BS4:Part 1 (1993). Structural steel sections. Specification for hot-rolled sections.
British Standard.
Camp, C V, Bichon, B J and Stovall, S P. (2005) Design of Steel Frames Using Ant
Colony Optimisation. J. Struct. Div, ASCE, 131(3), 369-379
Chan, C M. (1992) An optimality criteria algorithm for tall steel building design
using commercial standard sections. Structural Optimisation, 5, 26-29.
Provatidis, C.G., and Venetsanos, D.T. (2006) Cost minimization of 2D continuum
structures under stress constraints by increasing commonality in their skeletal
equivalents. Forsch Ingenieurwes, 70, 159-169.
SANS 10162-1(2005), The Structural use of steel. Part 1: Limit-states design of hot-
rolled steelwork. South African National Standard.
Shea, K., Cagan, J., and Fenves, S.J. (1997) A Shape Annealing Approach to
Optimal Truss Design With Dynamic Grouping of Members. Journal of
Mechanical Design, ASME, September, 119, 388-394.
Thanedar, P.B. and Vanderplaats, G.N. (1995) Survey of discrete structural
optimisation for structural design. J. Struct. Eng., ASCE. 120(2), 301-306.
92/96
Toğan, V, and Doloğlu, A. (2006) “Optimisation of 3D trusses with adaptive
approach in genetic algorithms”. Engineering Structures, 28, 1019-1027.
Toğan, V, and Doloğlu, A. (2008) “An improved genetic algorithm with initial
population strategy and self-adaptive member groupings.” Computers and
Structures.86, 1204-1218.
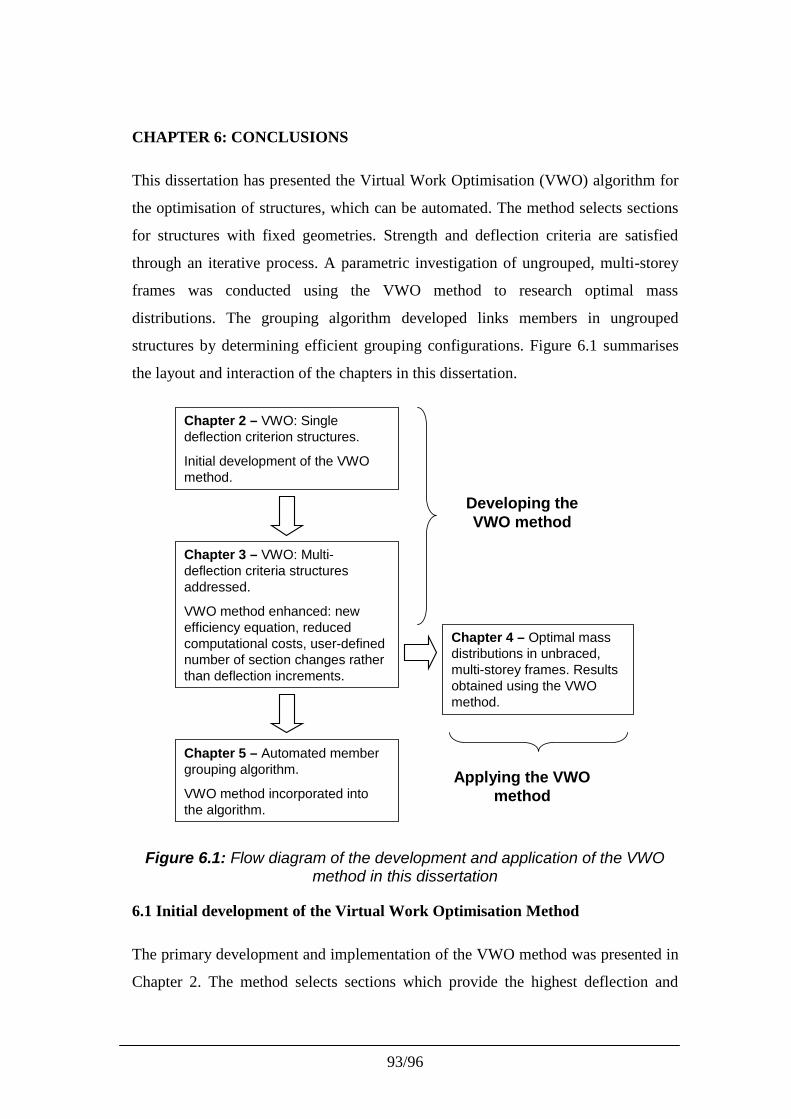
93/96
CHAPTER 6: CONCLUSIONS
This dissertation has presented the Virtual Work Optimisation (VWO) algorithm for
the optimisation of structures, which can be automated. The method selects sections
for structures with fixed geometries. Strength and deflection criteria are satisfied
through an iterative process. A parametric investigation of ungrouped, multi-storey
frames was conducted using the VWO method to research optimal mass
distributions. The grouping algorithm developed links members in ungrouped
structures by determining efficient grouping configurations. Figure 6.1 summarises
the layout and interaction of the chapters in this dissertation.
Chapter 2 – VWO: Singledeflection criterion structures.
Initial development of the VWOmethod.
Chapter 3 – VWO: Multi-deflection criteria structuresaddressed.
VWO method enhanced: newefficiency equation, reducedcomputational costs, user-definednumber of section changes ratherthan deflection increments.
Chapter 4 – Optimal massdistributions in unbraced,multi-storey frames. Resultsobtained using the VWOmethod.
Chapter 5 – Automated membergrouping algorithm.
VWO method incorporated intothe algorithm.
Developing theVWO method
Applying the VWOmethod
Figure 6.1: Flow diagram of the development and application of the VWOmethod in this dissertation
6.1 Initial development of the Virtual Work Optimisation Method
The primary development and implementation of the VWO method was presented in
Chapter 2. The method selects sections which provide the highest deflection and
94/96
strength resistance per unit mass. In this chapter the method only addressed
structures with a single deflection criterion and one load case. Deflections were
reduced by a user-defined increment, and a variable number of section changes were
made in each iteration. Any database of discrete sections, design code or material can
be considered by the method. Previous structural optimisation shortcomings such as
only considering trusses are overcome. Savings of up to 15.1% were realised using
the method, in comparison to methods in the literature.
6.2 The VWO method for multi-deflection criteria structures
In Chapter 3 the VWO method was expanded to address structures with multiple
deflection criteria and load cases. A new efficiency equation was proposed and
implemented. A user-defined number of section changes was made in each iteration,
rather than reducing deflections by a specified amount. Computational costs were
reduced by performing structural analyses only when calculating deflections, and not
when checking strength criteria as well (as done in Chapter 2). Any number of
strength and deflection criteria can be considered. Structures up to 14.4% lighter than
those presented in the literature were computed by the method.
6.3 Applications of the VWO method – Mass distributions in ungrouped frames
The parametric investigation into the stiffness and mass distribution in ungrouped,
multi-storey frames (Chapter 4) has demonstrated how mass should be configured to
resist lateral loads efficiently. It has been found that measured from the top, the total
storey mass and stiffness increase approximately linearly with decreasing height of
the structure. In some cases this is followed by a region of lower increase or constant
mass and stiffness. Distinct patterns were consistently seen in all structures tested.
The mass distributes in diagonal paths across the breadth of structures, which seems
to imitate truss behaviour.
6.4 Optimisation of member groupings
The grouping algorithm presented in Chapter 5 improves designs by optimally
linking members. The algorithm first optimises ungrouped structures using the VWO
method. Groups are then created by selecting the most optimal permutation obtained
95/96
using an exhaustive search. Structures grouped by the algorithm were found to be up to
5.9% lighter than structures grouped using standard configurations presented in the
literature. These configurations are based on experience and logic and considered ad
hoc. Please note that only a small number of grouping algorithms have been found in
the literature.
The grouping algorithm provides a way for efficiently grouping members in structures,
independent of the engineer’s experience. The method can be applied to any grouped or
ungrouped structure and is generally not computationally expensive. However, if
computational costs do become a problem they can be reduced by two methods.
Subgroups can be created or permutations only within a viable ‘radius’ can be
considered.
6.5 Limitations of the research
The optimisation method presented is limited in that it can only address structures with
fixed geometries and loading. Topology optimisation has not been considered.
As with all other optimisation methods it is unknown whether results produced are
local or global minima. This cannot easily be ascertained, because exhaustive searches
are not feasible.
Only two-dimensional structures have been considered. However, the algorithms
presented can be extended to three-dimensional structures.
Composite structures are not investigated in this dissertation. Only steel structures were
optimised, even though the theory underlying the algorithms are applicable to all
materials. The VWO method cannot address structures in which multiple materials are
used simultaneously.
6.6 Future research
The VWO method and grouping algorithm can be developed further and improved in
the following ways.
96/96
The VWO method has user-defined parameters, such as the number of changes made
per iteration, which need to be investigated. These parameters affect solutions and
computational costs, and so should be correctly defined. The efficiency equation should
be tested to determine if there is any way in which it can be improved.
The developed algorithms have focussed on minimising structural masses. However, it
is an over-simplification to assume a structure of minimum mass will be the most
economic. Not all members have the same cost per kilogram. Factors such as
fabrication and construction impact the final costs. Future research should focus on
minimising overall costs.
The VWO method must be upgraded to address three-dimensional structures. Torsion
and biaxial bending will need to be considered in the efficiency equation. No
foreseeable changes will need to be made to the grouping algorithm.
In very large structures the grouping algorithm and VWO method may require
substantial computational time. It should be investigated how the VWO method and
grouping algorithm can be streamlined to converge to solutions in fewer iterations.
It appears that unusual distributions of mass are found in optimised, multi-storey
frames with no grouping of members. These results need to be verified using other
optimisation methods. Bracing or shear wall systems could be developed based on the
distributions observed.
Solutions obtained are dependent on the section database used. If sections are
uneconomical to satisfy design criteria then solutions are not optimal. It should be
researched if and how databases can be altered to efficiently satisfy design criteria.
Only steel has been considered in the case studies presented. Other materials such as
concrete and wood should be included in the method. Structures in which multiple
materials are present should also be addressed. This may necessitate a change in the
efficiency equation proposed in the VWO method.
Linear elastic analyses have been performed exclusively in this research. Non-linear
behavior, both geometric and material, has to be considered in the future.
Related Documents