pubs.acs.org/cm Published on Web 11/30/2009 r 2009 American Chemical Society 5836 Chem. Mater. 2009, 21, 5836–5847 DOI:10.1021/cm902466p Structural Investigation of Activated Lattice Oxygen in Ce 1-x Sn x O 2 and Ce 1-x-y Sn x Pd y O 2-δ by EXAFS and DFT calculation Asha Gupta, † M. S. Hegde,* ,‡ K. R. Priolkar, § U. V. Waghmare, ) P. R. Sarode, § and S. Emura ^ † Materials Research Centre, ‡ Solid State and Structural Chemistry Unit, Indian Institute of Science, Bangalore 560012, India, § Department of Physics, Goa University, Taleigao Plateau, Goa 403206, India, ) Theoretical Sciences Unit, Jawaharlal Nehru Centre for Advanced Scientific Research, Jakkur Campus, Bangalore 560064, India, and ^ Institute of Scientific and Industrial Research, Osaka University, Mihoga-oka 8-1, Ibaraki, Osaka, 567-0047, Japan Received August 11, 2009. Revised Manuscript Received October 27, 2009 Substitution of Sn 4þ ion in CeO 2 creates activated oxygen in Ce 0.8 Sn 0.2 O 2 leading to higher oxygen storage capacity compared to Ce 0.8 Zr 0.2 O 2 . With Pd ion substitution in Ce 0.8 Sn 0.2 O 2 , activation of oxygen is further enhanced as observed from the H 2 /TPR study. Both EXAFS analysis and DFT calculation reveal that in the solid solution Ce exhibits 4 þ 4 coordination, Sn exhibits 4 þ 2 þ 2 coordination and Pd has 4 þ 3 coordination. While the oxygen in the first four coordination with short M-O bonds are strongly held in the lattice, the oxygens in the second and higher coordinations with long M-O bonds are weakly bound, and they are the activated oxygen in the lattice. Bond valence analysis shows that oxygen with valencies as low as 1.65 are created by the Sn and Pd ion substitution. Another interesting observation is that H 2 /TPR experiment of Ce 1-x Sn x O 2 shows a broad peak starting from 200 to 500 °C, while the same reduction is achieved in a single step at ∼110 °C in presence Pd 2þ ion. Substitution of Pd 2þ ion thus facilitates synergistic reduction of the catalyst at lower temperature. We have shown that simultaneous reduction of the Ce 4þ and Sn 4þ ions by Pd 0 is the synergistic interaction leading to high oxygen storage capacity at low temperature. 1. Introduction Release of oxygen from CeO 2 fluorite lattice for CO oxidation in autoexhaust and its reversible uptake of oxygen from stream is defined as the oxygen storage capacity (OSC): 1,2 CeO 2 þ δCO f CeO 2-δ þ δCO 2 , CeO 2-δ þ δ / 2 O 2 f CeO 2 . Quantitatively, δ is the OSC. Thus, CeO 2 is continuously reduced and oxidized follow- ing the well-known Mars-van Krevelen mechanism. Ap- plication of oxygen storage materials in autoexhaust catalysis has led to the development of CeO 2 -based oxy- gen storage materials, prominent among them being Ce 1-x Zr x O 2. 3-6 Substitution of Zr in CeO 2 not only increases the OSC, the temperature at which oxygen is extracted by CO was lowered compared to CeO 2 , even though ZrO 2 itself is not a reducible oxide. Higher reducibility and CO oxidation activity of Ce 1-x Zr x O 2 at lower temperature indicates that the lattice oxygen is more activated compared to CeO 2 . Solid solutions of TiO 2 and SnO 2 with CeO 2 of the type Ce 1-x Ti x O 2 and Ce 1-x Sn x O 2 have been reported from this laboratory to show high OSC and low temperature activity, and the concept of activation of lattice oxygen has been invoked. 7-9 On the basis of DFT calculations, Metiu and co-workers have reported that dopant atom weakens the surrounding oxygen bond of the doped oxide making it a better oxidant and thus facilitates CO oxidation. 10,11 Incorporation of noble metal ions like Pd 2þ and Pt 2þ in CeO 2 and Ce 1-x M x O 2 (M = Zr, Ti, and Sn) is reported to further enhance the OSC and catalytic activity of the catalyst. 7,8,12-15 In addition to application in the catalytic converters to minimize the emission of toxic pollu- tants (CO, NO x , and hydrocarbons, etc.) from auto- mobile exhaust, these high oxygen storage materials have *Corresponding author. E-mail: [email protected]. (1) Gandhi, H. S.; Graham, G. W.; McCabe, R. W. J. Catal. 2003, 216, 433. (2) Yao, H. C.; Yao, Y. F. Y. J. Catal. 1984, 86, 254. (3) Ozawa, M.; Kimura, M.; Isogai, A. J. Alloys Compd. 1993, 193, 73. (4) Nagai, Y.; Yamamoto, T.; Tanaka, T.; Yoshida, S.; Nonaka, T.; Okamoto, T.; Suda, A.; Sugiura, M. Catal. Today 2002, 74, 225. (5) Fornasiero, P.; Dimonte, R.; Rao, G. R.; Kaspar, J.; Meriani, S.; Trovarelli, A.; Graziani, M. J. Catal. 1995, 151, 168. (6) Baidya, T.; Hegde, M. S.; Gopalakrishnan, J. J. Phys. Chem. B 2007, 111, 5149. (7) Baidya, T.; Gayen, A.; Hegde, M. S.; Ravishankar, N.; Dupont, L. J. Phys. Chem. B 2006, 110, 5262. (8) Baidya, T.; Gupta, A.; Deshpandey, P. A.; Madras, G.; Hegde, M. S. J. Phys. Chem. C 2009, 113, 4059. (9) Baidya, T.; Dutta, G.; Hegde, M. S.; Waghmare, U. V. Dalton Trans. 2009, 455. (10) Nolan, M.; Verdugo, V. S.; Metiu, H. Surf. Sci. 2008, 602, 2734. (11) Shapovalov, V.; Metiu, H. J. Catal. 2007, 245, 205. (12) Hegde, M. S.; Madras, G.; Patil, K. C. Acc. Chem. Res. 2009, 42, 704. (13) Baidya, T.; Marimuthu, A.; Hegde, M. S.; Ravishankar, N.; Madras, G. J. Phys. Chem. C 2007, 111, 830. (14) Bekyarova, E.; Fornasiero, P.; Kaspar, J.; Graziani, M. Catal. Today 1998, 45, 179. (15) Roy, S.; Marimuthu, A.; Hegde, M. S.; Madras, G. Appl. Catal., B 2007, 71, 23.

Welcome message from author
This document is posted to help you gain knowledge. Please leave a comment to let me know what you think about it! Share it to your friends and learn new things together.
Transcript
pubs.acs.org/cm Published on Web 11/30/2009 r 2009 American Chemical Society
5836 Chem. Mater. 2009, 21, 5836–5847DOI:10.1021/cm902466p
Structural Investigation of Activated Lattice Oxygen in Ce1-xSnxO2
and Ce1-x-ySnxPdyO2-δ by EXAFS and DFT calculation
Asha Gupta,† M. S. Hegde,*,‡ K. R. Priolkar,§ U. V. Waghmare, ) P. R. Sarode,§
and S. Emura^
†Materials Research Centre, ‡Solid State and Structural Chemistry Unit, Indian Institute of Science,Bangalore 560012, India, §Department of Physics, Goa University, Taleigao Plateau, Goa 403206, India,
)Theoretical Sciences Unit, Jawaharlal Nehru Centre for Advanced Scientific Research, Jakkur Campus,Bangalore 560064, India, and ^Institute of Scientific and Industrial Research, Osaka University,
Mihoga-oka 8-1, Ibaraki, Osaka, 567-0047, Japan
Received August 11, 2009. Revised Manuscript Received October 27, 2009
Substitution of Sn4þ ion in CeO2 creates activated oxygen in Ce0.8Sn0.2O2 leading to higher oxygenstorage capacity compared to Ce0.8Zr0.2O2. With Pd ion substitution in Ce0.8Sn0.2O2, activation ofoxygen is further enhanced as observed from the H2/TPR study. Both EXAFS analysis and DFTcalculation reveal that in the solid solution Ce exhibits 4 þ 4 coordination, Sn exhibits 4 þ 2 þ 2coordination and Pd has 4 þ 3 coordination. While the oxygen in the first four coordination withshortM-Obonds are strongly held in the lattice, the oxygens in the second and higher coordinationswith long M-O bonds are weakly bound, and they are the activated oxygen in the lattice. Bondvalence analysis shows that oxygen with valencies as low as 1.65 are created by the Sn and Pd ionsubstitution. Another interesting observation is that H2/TPR experiment of Ce1-xSnxO2 shows abroad peak starting from 200 to 500 �C, while the same reduction is achieved in a single step at∼110 �C in presence Pd2þ ion. Substitution of Pd2þ ion thus facilitates synergistic reduction of thecatalyst at lower temperature.We have shown that simultaneous reduction of the Ce4þ and Sn4þ ionsby Pd0 is the synergistic interaction leading to high oxygen storage capacity at low temperature.
1. Introduction
Release of oxygen from CeO2 fluorite lattice for COoxidation in autoexhaust and its reversible uptake ofoxygen from stream is defined as the oxygen storagecapacity (OSC):1,2 CeO2 þ δCO f CeO2-δ þ δCO2,CeO2-δ þ δ/2O2 f CeO2. Quantitatively, δ is the OSC.Thus, CeO2 is continuously reduced and oxidized follow-ing the well-known Mars-van Krevelen mechanism. Ap-plication of oxygen storage materials in autoexhaustcatalysis has led to the development of CeO2-based oxy-gen storage materials, prominent among them beingCe1-xZrxO2.
3-6 Substitution of Zr in CeO2 not onlyincreases the OSC, the temperature at which oxygen isextracted by CO was lowered compared to CeO2, eventhough ZrO2 itself is not a reducible oxide. Higherreducibility and CO oxidation activity of Ce1-xZrxO2 atlower temperature indicates that the lattice oxygen ismore activated compared to CeO2. Solid solutions of
TiO2 and SnO2 with CeO2 of the type Ce1-xTixO2 andCe1-xSnxO2 have been reported from this laboratory toshow high OSC and low temperature activity, andthe concept of activation of lattice oxygen has beeninvoked.7-9 On the basis of DFT calculations, Metiuand co-workers have reported that dopant atom weakensthe surrounding oxygen bond of the doped oxide makingit a better oxidant and thus facilitates CO oxidation.10,11
Incorporation of noble metal ions like Pd2þ and Pt2þ inCeO2 andCe1-xMxO2 (M=Zr, Ti, and Sn) is reported tofurther enhance the OSC and catalytic activity of thecatalyst.7,8,12-15 In addition to application in the catalyticconverters to minimize the emission of toxic pollu-tants (CO, NOx, and hydrocarbons, etc.) from auto-mobile exhaust, these high oxygen storage materials have
*Corresponding author. E-mail: [email protected].(1) Gandhi,H. S.; Graham,G.W.;McCabe, R.W. J. Catal. 2003, 216,
433.(2) Yao, H. C.; Yao, Y. F. Y. J. Catal. 1984, 86, 254.(3) Ozawa,M.; Kimura,M.; Isogai, A. J. Alloys Compd. 1993, 193, 73.(4) Nagai, Y.; Yamamoto, T.; Tanaka, T.; Yoshida, S.; Nonaka, T.;
Okamoto, T.; Suda, A.; Sugiura, M. Catal. Today 2002, 74, 225.(5) Fornasiero, P.; Dimonte, R.; Rao, G. R.; Kaspar, J.; Meriani, S.;
Trovarelli, A.; Graziani, M. J. Catal. 1995, 151, 168.(6) Baidya, T.; Hegde, M. S.; Gopalakrishnan, J. J. Phys. Chem. B
2007, 111, 5149.
(7) Baidya, T.; Gayen, A.; Hegde,M. S.; Ravishankar, N.; Dupont, L.J. Phys. Chem. B 2006, 110, 5262.
(8) Baidya, T.; Gupta, A.; Deshpandey, P. A.; Madras, G.; Hegde,M.S. J. Phys. Chem. C 2009, 113, 4059.
(9) Baidya, T.; Dutta, G.; Hegde, M. S.; Waghmare, U. V. DaltonTrans. 2009, 455.
(10) Nolan, M.; Verdugo, V. S.; Metiu, H. Surf. Sci. 2008, 602, 2734.(11) Shapovalov, V.; Metiu, H. J. Catal. 2007, 245, 205.(12) Hegde, M. S.; Madras, G.; Patil, K. C. Acc. Chem. Res. 2009, 42,
704.(13) Baidya, T.; Marimuthu, A.; Hegde, M. S.; Ravishankar, N.;
Madras, G. J. Phys. Chem. C 2007, 111, 830.(14) Bekyarova, E.; Fornasiero, P.; Kaspar, J.; Graziani, M. Catal.
Today 1998, 45, 179.(15) Roy, S.; Marimuthu, A.; Hegde,M. S.; Madras, G.Appl. Catal., B
2007, 71, 23.
Article Chem. Mater., Vol. 21, No. 24, 2009 5837
potential applications in generation of hydrogen fuel viawater-gas shift reaction16,17 and thermo chemical split-ting of water,18 partial oxidation of methane to producesyngas19 and oxidation of methanol20 and formal-dehyde.21,22 In order to find new high oxygen storagematerials of the type Ce1-xZrxO2, it is essential to under-stand the mechanism behind improved OSC, and hencethe process bywhich activation of lattice oxygen occurs inthese CeO2-based fluorite lattices.According to Trovarelli23 any chemical modification of
CeO2 involving an increase in the number of defects(oxygen vacancies) should produce amaterial with higheroxygen storage capacity. Numerous studies have beencarried out to understand the enhanced reducibility basedon physical and structural properties and first principlecalculations by many groups.4,23-29 Nagai et al. havestudied local structure of Zr and Ce in CeO2-ZrO2 withdifferent homogeneity of the samples, and showed thatdifferent homogeneity results in different coordinationnumber (CN) around Zr ion, whereas the CN of Ce wasreported to be 8 in all samples.4 According to Vlaic et al.Zr ion is too small to accommodate eight oxygen atoms inits first coordination sphere, favoring a displacement ofone oxygen atom at a nonbonding distance from Zr ion;this order/disorder oxygen sublattice generated by Zr ionin CeO2 enhances the reducibility of the mixed oxides.26
Earlier studies based on EXAFS and first principlecalculations from this laboratory, have shown thathigher reducibility of CeO2-ZrO2 and CeO2-TiO2 solidsolutions is the result of distortion of oxygen sub-lattice creating long and short Ce-O and Zr-O/Ti-Obonds, and the longer bonds can be utilized for COoxidation.27,30
Recently 2% Pd ion substituted CeO2-SnO2 solidsolution was reported to show much higher OSC andcatalytic activity because of the highly labile lattice oxy-gen and oxide ion vacancies compared to CeO2-ZrO2
solid solution.8 Unlike Zr which can adopt only þ4oxidation, Sn can adopt two oxidation states: Sn2þ andSn4þ. This Sn4þ/Sn2þ redox couple can also participate inredox reactions along with Ce4þ/Ce3þ couple. The localcoordination around Sn4þ ion should be different fromthat of an ideal fluorite CeO2 structure because Sn
4þ is asmaller ion (Shannon ionic radii, r=0.81 A) compared toCe4þ ion (r=0.97 A). SnO2 crystallizes in rutile structureand CN of Sn is 6 which is different from 8-fold coordina-tion of Ce inCeO2. These differences in the structure openthe possibility of substantial perturbation within the cerialattice. Thus, the questions that arise and should beaddressed are as follows: (a) How the local coordinationof dopant Sn ion and the host Ce ion changes onsubstitution in the fluorite? (b) If the concentration ofthe dopant Sn is increased, does it further increase thestress in the host lattice? (c) How smaller percentage of Pdion substitution in the solid solution changes the oxygensublattice aroundCe, Sn, and Pd? (d) Canwe relateM-Obond distances (M= Pd, Sn, Ce) with OSC and tell howthe destabilization of the oxygen bonds can lead to higherreducibility of the solid solution? To probe into suchissues, we carried out H2/TPR studies of Ce1-xSnxO2
and Ce1-x-ySnxPdyO2-δ (x = 0.2 and 0.5, y = 0.02)systems complemented with first-principles DFT calcula-tions. The theoretically determined structures have beencompared with the local structure obtained from EXAFSanalysis. We show that the local coordination of Ce, Snand Pd gets modified into long and short bonds from theideal 8-fold coordination present in fluorite lattice. Thelonger oxygen bonds are weakly held in the lattice andthese oxygen act as activated oxygen. We propose thatsimultaneous reduction of the Ce4þ and Sn4þ ions by thereduced Pd0 is the synergistic interaction responsible forhigh OSC at lower temperature.
2. Methods
2.1. Experiment.Ce1-xSnxO2 (x=0.1-0.5) was prepared by
the solution combustion method using ceric ammonium nitrate,
tin oxalate, and glycine. For the preparation of Ce0.5Sn0.5O2,
5.48 g (0.01 mol) of (NH4)2Ce(NO3)6 (Loba Chemie, 99%),
2.07 g (0.01 mol) of SnC2O4 (precipitated from SnCl2, Sigma
Aldrich, 99.9%), and 3.67 g (0.049 mol) of glycine (C2H5O2N,
Merck, 99%) were taken, and dissolved in minimum volume of
HNO3 and 20mLof water in a 300mL crystallizing dish to form
a clear solution. The dishwas then kept in a preheated furnace at
320 �C. The combustion started after dehydration, and the
productwas obtainedwithin 60 s. For synthesizingCe0.8Zr0.2O2,
(NH4)2Ce(NO3)6, Zr(NO3)4 3 5H2O (Loba Chemie, 99%), and
glycine were taken in molar ratio 0.8:0.2:2.58. For 2 atom%Pd
ion substituted Ce0.8Sn0.2O2/Ce0.8Zr0.2O2, (NH4)2Ce(NO3)6,
PdCl2 (Sigma Aldrich, 99.9þ%), SnC2O4/Zr(NO3)4, and
L-tartaric acid (Laboratory Rasayan, 97%)/glycine were taken
in 0.78:0.02:0.2:2.42/2.52 molar ratio.
XRD data were recorded on a Philips X’Pert diffractometer
at a scan rate of 0.12�/min with a 0.02� step size in the 2θ range
between 20� and 100�. X-ray photoelectron spectra were recor-
ded on a Thermo Fisher Scientific Multilab 2000 (England)
instrument with Al KR radiation (1486.6 eV). The binding
energies reported here is with reference to graphite at 284.5 eV
(16) Fu, Q.;Weber, A.; Flytzani-Stephanopoulos,M.Catal. Lett. 2001,77, 87.
(17) Hilaire, S.;Wang,X.; Luo,T.;Gorte,R. J.;Wagner, J.Appl.Catal.,A 2004, 258, 271.
(18) Abanades, S.; Flamant, G. Solar Energy 2006, 80, 1611.(19) Pino, L.; Recupero, V.; Beninati, S.; Shukla, A. K.; Hegde, M. S.;
Bera, P. Appl. Catal., A 2002, 225, 63.(20) Scibioh, M. A.; Kim, S.-K.; Cho, E. A.; Lim, T.-H.; Hong, S.-A.;
Ha, H. Y. Appl. Catal., B 2008, 84, 773.(21) Shen, Y.; Yang, X.;Wang,Y.; Zhang, Y.; Zhu,H.;Gao, L.; Jia,M.
Appl. Catal., B 2008, 79, 142.(22) Tang, X.; Chen, J.; Huang, X.; Xu, Y.; Shen, W. Appl. Catal., B
2008, 81, 115.(23) Trovarelli, A. Catalysis by Ceria and Related Materials; Imperial
College Press: London, U.K., 2002.(24) Shah, P. R.; Kim, T.; Zhou, G.; Fornasiero, P.; Gorte, R. J. Chem.
Mater. 2006, 18, 5363.(25) Lemaux, S.; Bensaddik, A.; van der Eerden, A. M. J.; Bitter, J. H.;
Koningsberger, D. C. J. Phys. Chem. B 2001, 105, 4810.(26) Vlaic, G.; Fornasiero, P.; Geremia, S.; Kaspar, J.; Graziani, M. J.
Catal. 1997, 168, 386.(27) Dutta, G.; Waghmare, U.; Baidya, T.; Hegde, M.; Priolkar, K.;
Sarode, P. Catal. Lett. 2006, 108, 165.(28) Andersson,D. A.; Simak, S. I.; Skorodumova,N. V.; Abrikosov, I.
A.; Johansson, B. Appl. Phys. Lett. 2007, 90, 031909.(29) Andersson,D. A.; Simak, S. I.; Skorodumova,N. V.; Abrikosov, I.
A.; Johansson, B. Phys. Rev. B: Condens. Matter Mater. Phys.2007, 76, 174119.
(30) Dutta, G.; Waghmare, U. V.; Baidya, T.; Hegde, M. S.; Priolkar,K. R.; Sarode, P. R. Chem. Mater. 2006, 18, 3249.
5838 Chem. Mater., Vol. 21, No. 24, 2009 Gupta et al.
orAg (3d5/2) at 368.2 eV having an accuracy of( 0.1 eV. Oxide
samples were ground with 30 wt % graphite powder, made
into thin pellet at room temperature. For transmission elec-
tron microscopy (TEM) studies, an acetone dispersion of the
sample was dropped onto holey carbon-coated Cu grids, and
the images were recorded with FeI Technai 20 instrument at
200 kV. Temperature programmed reduction (TPR) was
carried out by passing 5% H2 in Ar at a 30 mL/min flow rate
at heating rate of 10 �C/min over 50 mg of oxide, and the
amount of H2 uptake was detected by using a TCD detector,
which was calibrated against the uptake of H2 with a known
amount of CuO. Reoxidation was carried out by passing pure
oxygen at 300 �C, cooled to room temperature and the H2 uptake
experiment was then repeated with the reoxidized sample.
Ce L3, Sn K, and Pd K edge EXAFS spectra in catalyst and
reference samples were recorded at room temperature in the
transmission mode with Si (111) double-crystal monochroma-
tors at BL0B1 beamline at SPring-8, Japan. The Ce EXAFS
spectrawere scanned in the range of 5.425-6.145 keVand the Sn
EXAFS was scanned from 28.93 to 30.22 keV, while
24.01-25.30 keV formed the range of scan for Pd EXAFS
spectra. The photon energy was calibrated for each scan with
respect to Cu K and Pd K edge in respective metal foils. Both
the incident (Io) and transmitted (I) synchrotron beam inten-
sities were measured simultaneously using ionization chamber
filled with appropriate gases. The absorbers were made by
pressing the fine powder samples into pellets of 10 mm dia-
meter with boron nitride. To avoid the sample thickness effect,
the edge step (Δμ0x) was restricted to a value e1 by adjusting
the thickness of the absorber pellet whereΔμ0 is edge step in theabsorption coefficient and x is the sample thickness.31 EXAFS
data analysis was done using ATHENA and ARTEMIS
program.32 The value of amplitude reduction factor (So2) is
deduced from the EXAFS spectra of respective metals with
known crystal structural data.33 The theoretical calculation of
back scattering amplitude and phase shift functions are ob-
tained by using FEFF (6.01) program.34 The experimental
EXAFS data was fitted with the theoretical EXAFS function
in ARTEMIS.
2.2. Theory. We use plane wave self-consistent field
(PWscf)35 implementation of DFT with periodic boundary
conditions to relax the internal structure. Our total energy
calculations are based on local density approximation (LDA)
to the exchange correlation energy of electrons. Interaction
between valence electrons and ionic cores is treated using first-
principles ultrasoft pseudopotentials36 and a plane wave basis
with an energy cut off of 30 Ry in the representation of the
Kohn-Sham wave functions was employed. Semicore states of
Ce andSn are included in the valence and spin polarization is not
considered in our calculation. The total energy was minimized
with respect to lattice constant for CeO2 fluorite structure,
whereas for the other system, the lattice parameter was kept
constant at the values obtained from Rietveld refined XRD
results, and only the internal atomic positions were relaxed to
minimize the total energy. We have performed calculation for
the following system:
(a) Pure CeO2 was simulated in the fluorite structure with
conventional cubic unit cell (with four formula units of
CeO2) integrals over the Brillouin zone were sampled on
6� 6� 6Monkhorst-Pack37k-pointmesh.Theprimitive
unit cellhas threeatomswhereCeatomis locatedat (0,0, 0)
and the two oxygen atoms at (( 0.25,( 0.25,( 0.25).
(b) Tosimulate thedopingof smallerpercentage (∼2atom%)
Pd ion in Ce1-xSnxO2, a larger unit cell is needed.We use a
2 � 2 � 2 supercell (built from conventional cubic cell)
comprising 96 atoms (i.e., 32 formula units of CeO2) for
simulating Ce0.5Sn0.5O2 system. 50% Sn substitution was
done by randomly substituting 16 Ce atoms with Sn
atoms, and the Brillouin zone integration was sampled
on 4 � 4 � 4 k-point mesh.
(c) Ce0.8Sn0.2O2 system was simulated using a similar
96-atom supercell model. Six Ce atoms were replaced
by Sn, and the formula of the resultant cell is Ce26S-
n6O64 corresponding to 18.75% of Sn substitution in
CeO2, close to the experimental composition.
(d) For the 2% Pd ion substitution in Ce1-xSnxO2 solid
solution, an additional Ce atom was replaced by Pd in
the 2 � 2 � 2 supercell and one oxide ion vacancy was
created to compensate for the charge created by lower
valent Pd2þ substitution. The resulting formulas are rep-
resented as Ce25Sn6Pd1O63 and Ce16Sn15Pd1O63 corre-
sponding to additional 3.125% Pd in the solid solution.
The M-O bond lengths (M = Ce, Sn Pd) determined from
the optimized structures are used to estimate bond valence of
oxygen following the bond valence method described by Brown
and O’Keeffe.38 Bond valence is defined as (a) si = exp [-(Ri -R0)/B] for Ce-O and Pd-O bond and (b) si = (Ri/R0)
-N for
Sn-O, whereRi is the ith bond length,R0 is the length of a bond
of unit valence, and B and N are the fitted parameters. The
atomic valence V is obtained by summing the bond valencies
associated with a particular ion given by V = Σisi.
3. Results and Discussion
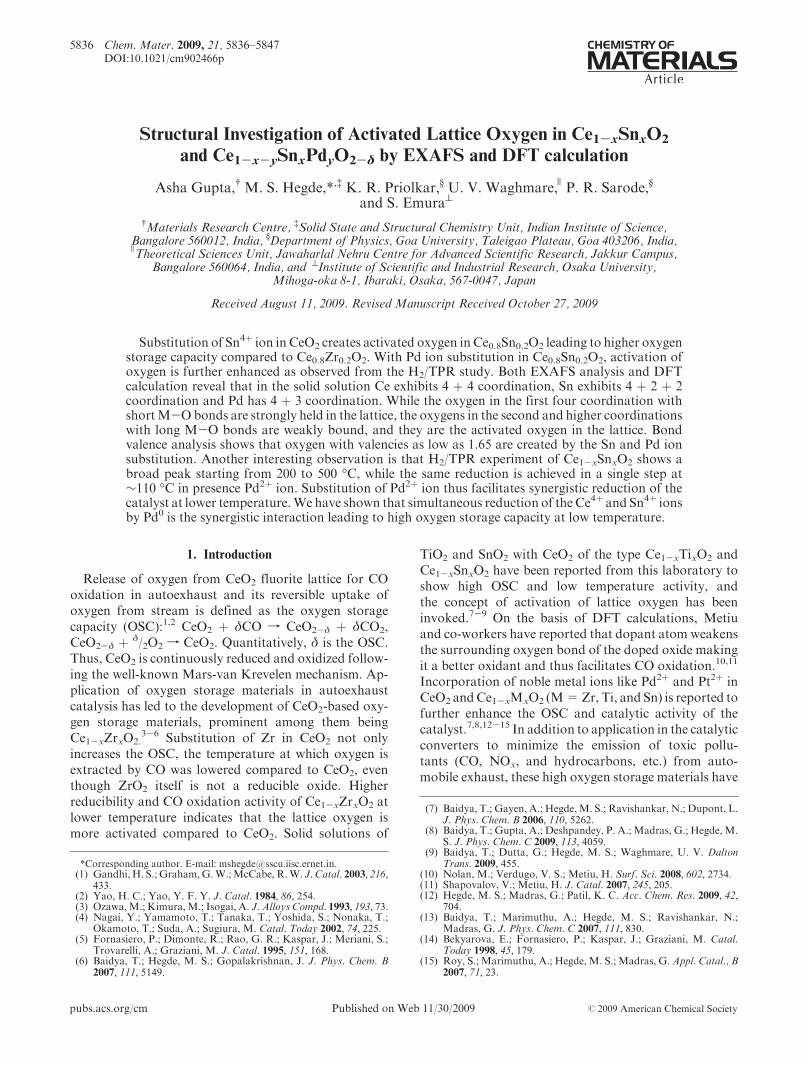
Characterization of the samples was done with XRD tocheckwhether palladium ions are substituted intoCe1-xSnx-O2 matrix. XRD patterns of as-prepared Ce1-xSnx-O2 and 2 atom % Pd substituted oxide, shown inFigure 1a and b, were identical and could be indexed tothe standard CeO2 with fluorite structure (JCPDS no.340394) and diffraction lines due tin-oxide or palladium-oxide were not observed indicating formation of solidsolution given by the formula Ce0.8Sn0.2O2 and Ce0.5-Sn0.48Pd0.02O2-δ, respectively. The XRD patterns ofCe0.78Sn0.2Pd0.02O2-δ and Ce0.5Sn0.5O2 were refined bythe Rietveld method using the Fullprof Suite Program.39
Refinement was carried out by simultaneously varying18 parameters that include the overall scale factor,background parameters, unit cell, half width, shape, andisotropic thermal parameters along with the oxygen
(31) Stern, E. A.; Kim, K. Phys. Rev. B 1981, 23, 3781.(32) Ravel, B.; Newville, M. J. Synchrotron Rad. 2005, 12, 537.(33) Pearson, W. P. Handbook of Lattice Spacing and Structure of
Metals and Alloys; Pergamon: New York, 1958.(34) Zabinsky, S. I.; Rehr, J. J.; Ankudinov, A.; Albers, R. C.; Eller, M.
J. Phys. Rev. B 1995, 52, 2995.(35) Baroni, S.;DalCorso,A.; deGironcoli, S.;Giannozzi, P.; Cavazzoni,
C.; Ballabio,G.; Scandolo, S.; Chiarotti, G.; Focher, P.; Pasquarello,A.; Laasonen, K.; Trave, A.; Car, R.; Marzari, N.; Kokalj, A.http://www.pwscf.org/.
(36) Vanderbilt, D. Phys. Rev. B: Condens. Matter Mater. Phys. 1990,41, 7892.
(37) Monkhorst, H. J.; Pack, J. D. Phys. Rev. B 1976, 13, 5188.(38) Brown, I. D. The Bond-Valence Method: An Empirical Approach
to Chemical Structure and Bonding. In Structure and Bonding inCrystals; O'Keeffe,M., Navrotsky, A., Eds.; Academic Press:NewYork,1981; Vol. 2.
(39) Rodriguez-Carvajal, J. Multi-pattern Rietveld Refinement Pro-gram Fullprof. 2k, version 3.30; Laboratiore Le�on Brillouin, CEA:Saclay, France, June 2005-LLB.
Article Chem. Mater., Vol. 21, No. 24, 2009 5839
occupancy; Sn4þ and Pd2þ ions were taken in Ce4þ sites.The typical observed XRD patterns along with the calcu-lated pattern are shown in panels b and c of Figure 1. Thegoodness of the profile refinements were determined fromtheR values, given in Table 1. Decrease in lattice parameteris observed with the increase in Sn substitution which isconsistent with the substitution of smaller Sn4þ (ionic radii,r= 0.81 A) ion for larger Ce4þ (r= 0.97 A) ion; on Pd2þ
ion (r = 0.86 A) substitution the lattice parameter furtherdecreases.
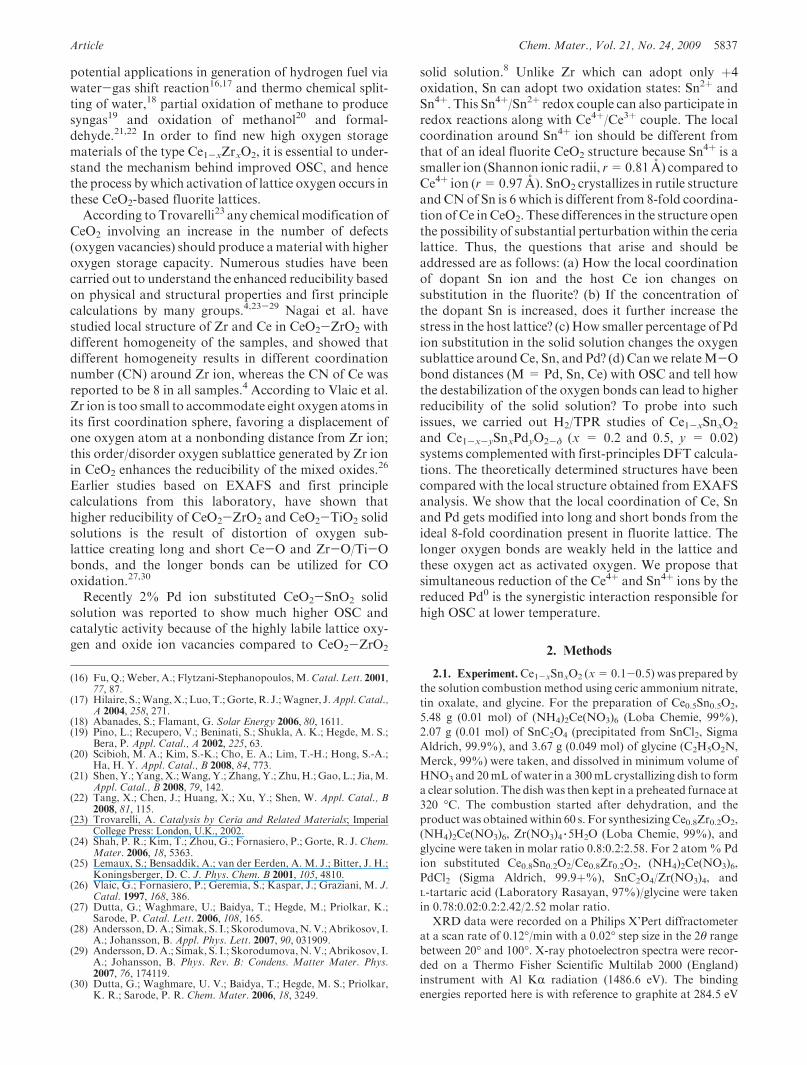
Transmission electron microscope image of Ce0.78-Sn0.2Pd0.02O2-δ and Ce0.5Sn0.5O2 are shown in Figure 2.The bright field image of Ce0.78Sn0.2Pd0.02O2-δ is given inpanel (a) and the crystallite sizes are in the rangeof 3-5 nm.The inset of Figure 2a shows the high resolution micro-graph image; well-defined lattice fringes indicate that theparticles are crystalline in nature and presence of otherphase is not observed. Selected area diffraction pattern ofCe0.78Sn0.2Pd0.02O2-δ is shown in the panel b and it isindexed to fluorite structure and no other ring pattern isobserved. The bright field image of Ce0.5Sn0.5O2 is given inFigure 2c, the crystallite sizes are in the range of 5-8 nm.The reactivity of lattice oxygen and oxygen storage/release
property of oxide catalyst is measured by H2/TPR; thevalues of OSC and composition of the reduced compoundare summarized in Table 2. H2-TPR profiles of Ce0.8Sn0.2O2
and Ce0.78Sn0.2Pd0.02O1.98 are shown in Figure 3. In case ofCe0.8Sn0.2O2, reduction starts from 200 �C, peak is observedat 300 �Cand continues up to 550 �C.OSC corresponding tothis broad reduction peak is ∼1700 μmol g-1 and thecompositionof the reducedcatalyst is givenasCe0.8Sn0.2O1.71.In case of Ce0.78Sn0.2Pd0.02O1.98, a sharp peak appears at110 �C, OSC for the reduction up to 150 �C is 1650 μmloes.gm-1 and the composition of the reduced sample is Ce0.78-Sn0.2Pd0.02O1.70. PdO itself is reduced by H2 at ∼80 �C.40
Figure 1. (a) XRD pattern of Ce0.8Sn0.2O2. Rietveld refined XRD pat-tern of (b) Ce0.78Sn0.2Pd0.02O1.98 and (c) Ce0.5Sn0.5O2. (d) XRD of Ce0.5-Sn0.48Pd0.02O1.98.
Figure 2. (a) Bright field TEM image of Ce0.78Sn0.2Pd0.02O1.98, the highresolution-TEM (inset) and (b) the indexed diffraction pattern, and the(c) bright field TEM image of Ce0.5Sn0.48Pd0.02O1.98.
Table 1. Rietveld Refined Lattice Parameters of Ce0.8Sn0.2O2,
Ce0.78Sn0.2Pd0.02O1.98, Ce0.5Sn0.5O2, and Ce0.5Sn0.48Pd0.02O1.98
catalyst lattice parameter, a (A) RBragg Rf χ2
CeO2 (JCPDS No. 340394) 5.411Ce0.8Sn0.2O2 5.3948(5) 0.92 0.77 1.01Ce0.78Sn0.2Pd0.02O1.98 5.3893(7) 0.40 0.34 1.49Ce0.5Sn0.5O2 5.2931(1) 2.49 1.58 3.01Ce0.5Sn0.48Pd0.02O1.98 5.2861(2) 2.35 1.25 3.22
(40) Paryjczak, T.; Farbotko, J.M.; J�o�zwiak,K.W.React. Kinet. Catal.Lett. 1982, 20, 227.
5840 Chem. Mater., Vol. 21, No. 24, 2009 Gupta et al.
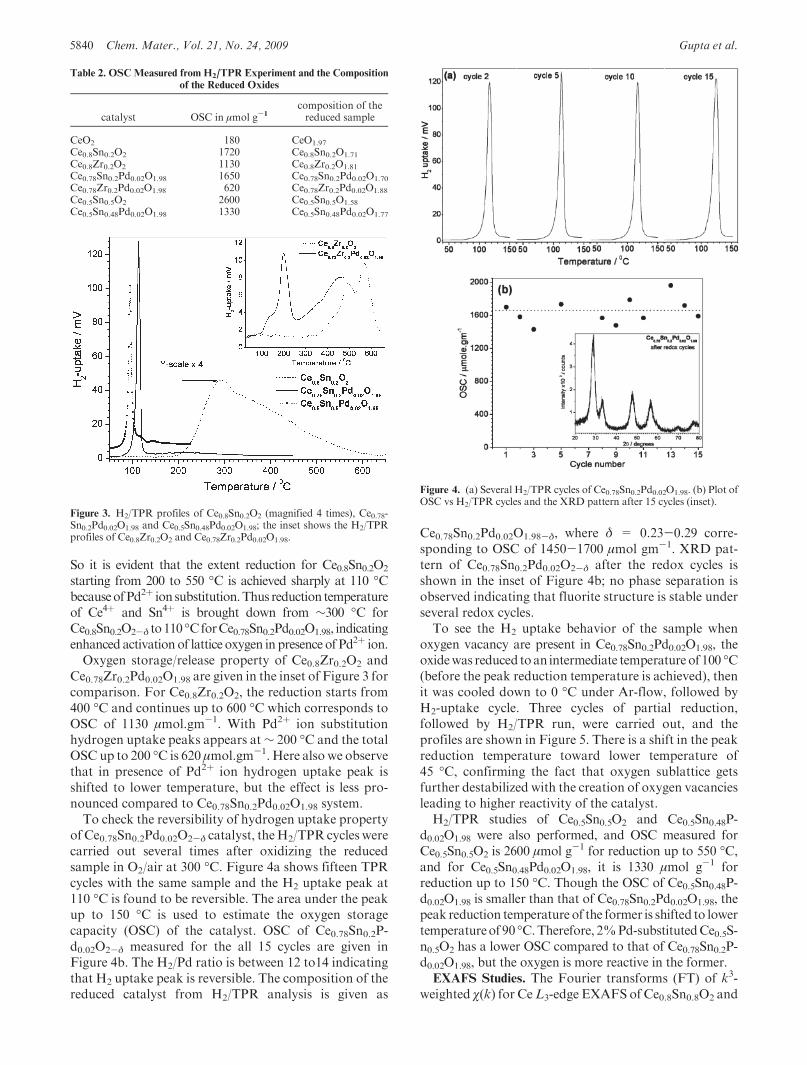
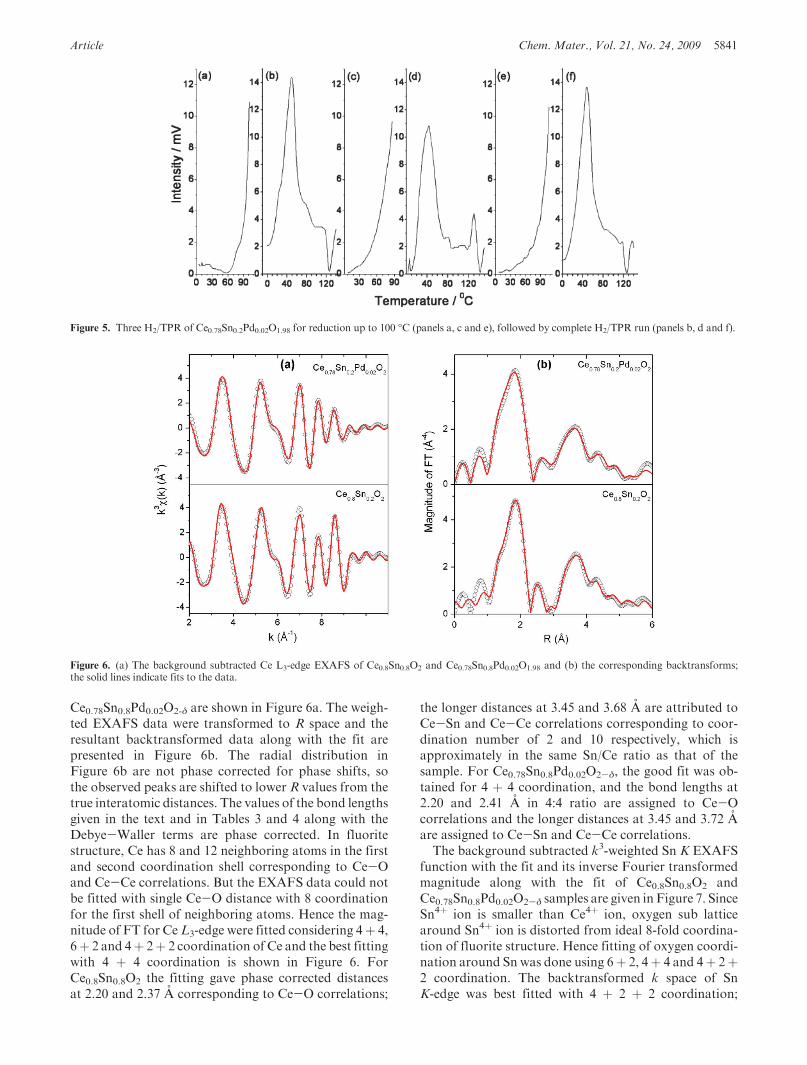
So it is evident that the extent reduction for Ce0.8Sn0.2O2
starting from 200 to 550 �C is achieved sharply at 110 �CbecauseofPd2þ ion substitution.Thus reduction temperatureof Ce4þ and Sn4þ is brought down from ∼300 �C forCe0.8Sn0.2O2-δ to110 �CforCe0.78Sn0.2Pd0.02O1.98, indicatingenhanced activation of lattice oxygen in presence of Pd2þ ion.Oxygen storage/release property of Ce0.8Zr0.2O2 and
Ce0.78Zr0.2Pd0.02O1.98 are given in the inset of Figure 3 forcomparison. For Ce0.8Zr0.2O2, the reduction starts from400 �C and continues up to 600 �C which corresponds toOSC of 1130 μmol.gm-1. With Pd2þ ion substitutionhydrogen uptake peaks appears at∼ 200 �C and the totalOSC up to 200 �C is 620 μmol.gm-1. Here also we observethat in presence of Pd2þ ion hydrogen uptake peak isshifted to lower temperature, but the effect is less pro-nounced compared to Ce0.78Sn0.2Pd0.02O1.98 system.To check the reversibility of hydrogen uptake property
of Ce0.78Sn0.2Pd0.02O2-δ catalyst, theH2/TPR cycles werecarried out several times after oxidizing the reducedsample in O2/air at 300 �C. Figure 4a shows fifteen TPRcycles with the same sample and the H2 uptake peak at110 �C is found to be reversible. The area under the peakup to 150 �C is used to estimate the oxygen storagecapacity (OSC) of the catalyst. OSC of Ce0.78Sn0.2P-d0.02O2-δ measured for the all 15 cycles are given inFigure 4b. The H2/Pd ratio is between 12 to14 indicatingthat H2 uptake peak is reversible. The composition of thereduced catalyst from H2/TPR analysis is given as
Ce0.78Sn0.2Pd0.02O1.98-δ, where δ = 0.23-0.29 corre-sponding to OSC of 1450-1700 μmol gm-1. XRD pat-tern of Ce0.78Sn0.2Pd0.02O2-δ after the redox cycles isshown in the inset of Figure 4b; no phase separation isobserved indicating that fluorite structure is stable underseveral redox cycles.To see the H2 uptake behavior of the sample when
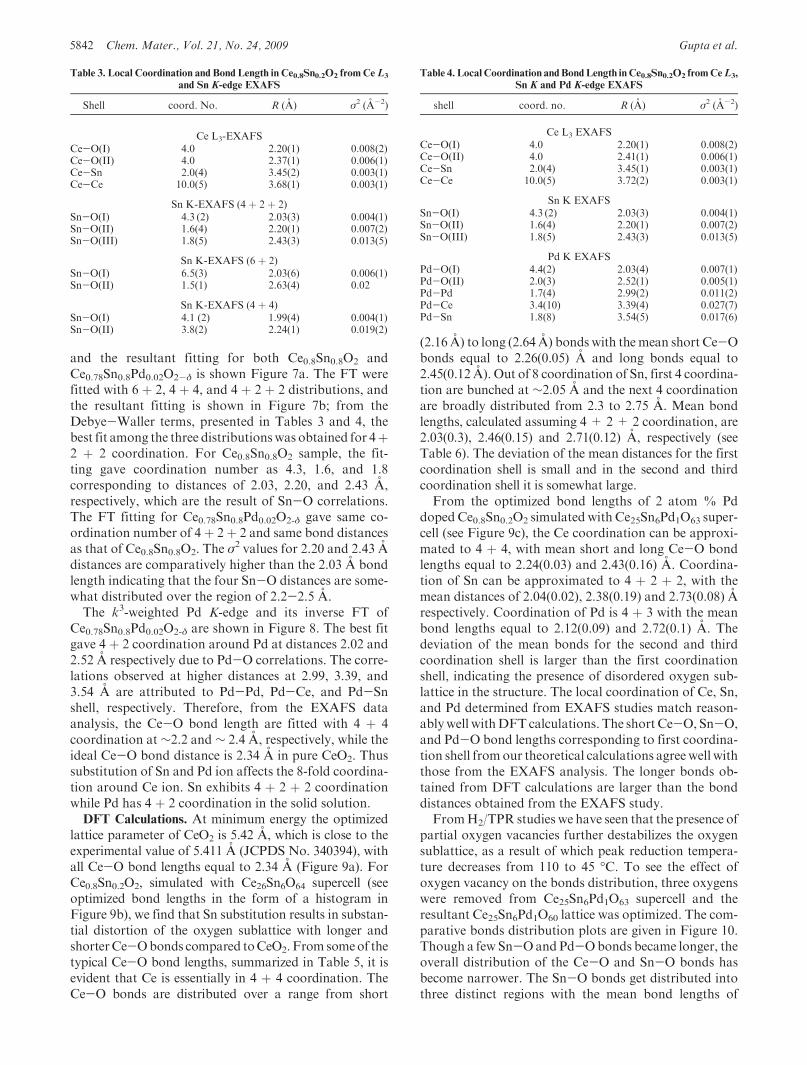
oxygen vacancy are present in Ce0.78Sn0.2Pd0.02O1.98, theoxidewas reduced toan intermediate temperature of 100 �C(before the peak reduction temperature is achieved), thenit was cooled down to 0 �C under Ar-flow, followed byH2-uptake cycle. Three cycles of partial reduction,followed by H2/TPR run, were carried out, and theprofiles are shown in Figure 5. There is a shift in the peakreduction temperature toward lower temperature of45 �C, confirming the fact that oxygen sublattice getsfurther destabilized with the creation of oxygen vacanciesleading to higher reactivity of the catalyst.H2/TPR studies of Ce0.5Sn0.5O2 and Ce0.5Sn0.48P-
d0.02O1.98 were also performed, and OSC measured forCe0.5Sn0.5O2 is 2600 μmol g-1 for reduction up to 550 �C,and for Ce0.5Sn0.48Pd0.02O1.98, it is 1330 μmol g-1 forreduction up to 150 �C. Though the OSC of Ce0.5Sn0.48P-d0.02O1.98 is smaller than that of Ce0.78Sn0.2Pd0.02O1.98, thepeak reduction temperature of the former is shifted to lowertemperatureof 90 �C.Therefore, 2%Pd-substitutedCe0.5S-n0.5O2 has a lower OSC compared to that of Ce0.78Sn0.2P-d0.02O1.98, but the oxygen is more reactive in the former.EXAFS Studies. The Fourier transforms (FT) of k3-
weighted χ(k) for CeL3-edge EXAFS of Ce0.8Sn0.8O2 and
Figure 3. H2/TPR profiles of Ce0.8Sn0.2O2 (magnified 4 times), Ce0.78-Sn0.2Pd0.02O1.98 and Ce0.5Sn0.48Pd0.02O1.98; the inset shows the H2/TPRprofiles of Ce0.8Zr0.2O2 and Ce0.78Zr0.2Pd0.02O1.98.
Figure 4. (a) Several H2/TPR cycles of Ce0.78Sn0.2Pd0.02O1.98. (b) Plot ofOSC vs H2/TPR cycles and the XRD pattern after 15 cycles (inset).
Table 2. OSCMeasured from H2/TPR Experiment and the Composition
of the Reduced Oxides
catalyst OSC in μmol g-1composition of thereduced sample
CeO2 180 CeO1.97
Ce0.8Sn0.2O2 1720 Ce0.8Sn0.2O1.71
Ce0.8Zr0.2O2 1130 Ce0.8Zr0.2O1.81
Ce0.78Sn0.2Pd0.02O1.98 1650 Ce0.78Sn0.2Pd0.02O1.70
Ce0.78Zr0.2Pd0.02O1.98 620 Ce0.78Zr0.2Pd0.02O1.88
Ce0.5Sn0.5O2 2600 Ce0.5Sn0.5O1.58
Ce0.5Sn0.48Pd0.02O1.98 1330 Ce0.5Sn0.48Pd0.02O1.77
Article Chem. Mater., Vol. 21, No. 24, 2009 5841
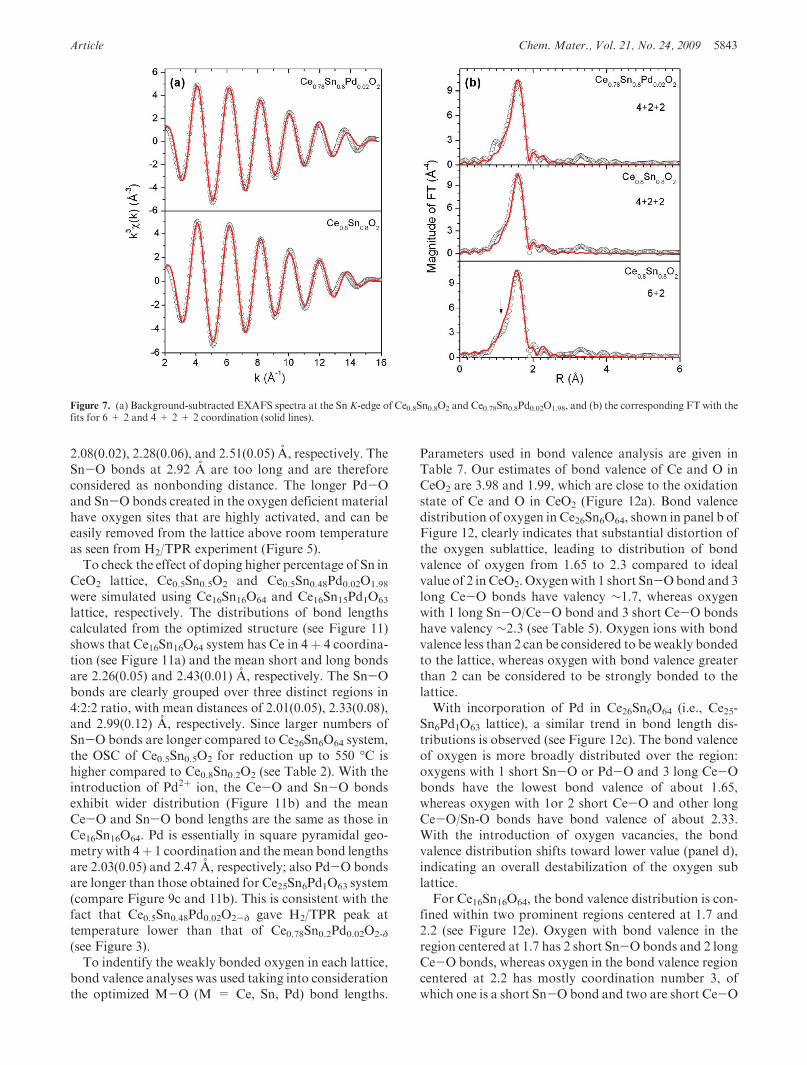
Ce0.78Sn0.8Pd0.02O2-δ are shown in Figure 6a. The weigh-ted EXAFS data were transformed to R space and theresultant backtransformed data along with the fit arepresented in Figure 6b. The radial distribution inFigure 6b are not phase corrected for phase shifts, sothe observed peaks are shifted to lower R values from thetrue interatomic distances. The values of the bond lengthsgiven in the text and in Tables 3 and 4 along with theDebye-Waller terms are phase corrected. In fluoritestructure, Ce has 8 and 12 neighboring atoms in the firstand second coordination shell corresponding to Ce-Oand Ce-Ce correlations. But the EXAFS data could notbe fitted with single Ce-O distance with 8 coordinationfor the first shell of neighboring atoms. Hence the mag-nitude of FT for CeL3-edge were fitted considering 4þ 4,6þ 2 and 4þ 2þ 2 coordination of Ce and the best fittingwith 4 þ 4 coordination is shown in Figure 6. ForCe0.8Sn0.8O2 the fitting gave phase corrected distancesat 2.20 and 2.37 A corresponding to Ce-O correlations;
the longer distances at 3.45 and 3.68 A are attributed toCe-Sn and Ce-Ce correlations corresponding to coor-dination number of 2 and 10 respectively, which isapproximately in the same Sn/Ce ratio as that of thesample. For Ce0.78Sn0.8Pd0.02O2-δ, the good fit was ob-tained for 4 þ 4 coordination, and the bond lengths at2.20 and 2.41 A in 4:4 ratio are assigned to Ce-Ocorrelations and the longer distances at 3.45 and 3.72 Aare assigned to Ce-Sn and Ce-Ce correlations.The background subtracted k3-weighted Sn K EXAFS
function with the fit and its inverse Fourier transformedmagnitude along with the fit of Ce0.8Sn0.8O2 andCe0.78Sn0.8Pd0.02O2-δ samples are given in Figure 7. SinceSn4þ ion is smaller than Ce4þ ion, oxygen sub latticearound Sn4þ ion is distorted from ideal 8-fold coordina-tion of fluorite structure. Hence fitting of oxygen coordi-nation around Sn was done using 6þ 2, 4þ 4 and 4þ 2þ2 coordination. The backtransformed k space of SnK-edge was best fitted with 4 þ 2 þ 2 coordination;
Figure 5. Three H2/TPR of Ce0.78Sn0.2Pd0.02O1.98 for reduction up to 100 �C (panels a, c and e), followed by complete H2/TPR run (panels b, d and f).
Figure 6. (a) The background subtracted Ce L3-edge EXAFS of Ce0.8Sn0.8O2 and Ce0.78Sn0.8Pd0.02O1.98 and (b) the corresponding backtransforms;the solid lines indicate fits to the data.
5842 Chem. Mater., Vol. 21, No. 24, 2009 Gupta et al.
and the resultant fitting for both Ce0.8Sn0.8O2 andCe0.78Sn0.8Pd0.02O2-δ is shown Figure 7a. The FT werefitted with 6 þ 2, 4 þ 4, and 4 þ 2 þ 2 distributions, andthe resultant fitting is shown in Figure 7b; from theDebye-Waller terms, presented in Tables 3 and 4, thebest fit among the three distributionswas obtained for 4þ2 þ 2 coordination. For Ce0.8Sn0.8O2 sample, the fit-ting gave coordination number as 4.3, 1.6, and 1.8corresponding to distances of 2.03, 2.20, and 2.43 A,respectively, which are the result of Sn-O correlations.The FT fitting for Ce0.78Sn0.8Pd0.02O2-δ gave same co-ordination number of 4þ 2þ 2 and same bond distancesas that of Ce0.8Sn0.8O2. The σ
2 values for 2.20 and 2.43 Adistances are comparatively higher than the 2.03 A bondlength indicating that the four Sn-O distances are some-what distributed over the region of 2.2-2.5 A.The k3-weighted Pd K-edge and its inverse FT of
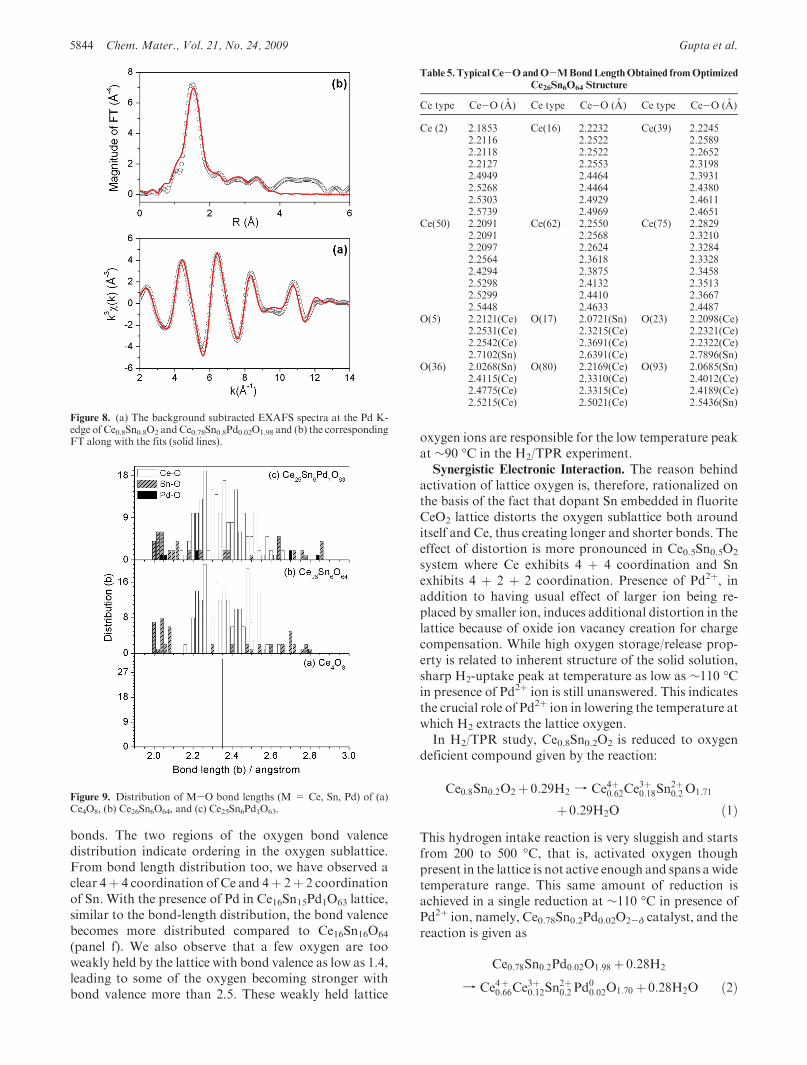
Ce0.78Sn0.8Pd0.02O2-δ are shown in Figure 8. The best fitgave 4 þ 2 coordination around Pd at distances 2.02 and2.52 A respectively due to Pd-O correlations. The corre-lations observed at higher distances at 2.99, 3.39, and3.54 A are attributed to Pd-Pd, Pd-Ce, and Pd-Snshell, respectively. Therefore, from the EXAFS dataanalysis, the Ce-O bond length are fitted with 4 þ 4coordination at ∼2.2 and ∼ 2.4 A, respectively, while theideal Ce-O bond distance is 2.34 A in pure CeO2. Thussubstitution of Sn and Pd ion affects the 8-fold coordina-tion around Ce ion. Sn exhibits 4 þ 2 þ 2 coordinationwhile Pd has 4 þ 2 coordination in the solid solution.DFT Calculations. At minimum energy the optimized
lattice parameter of CeO2 is 5.42 A, which is close to theexperimental value of 5.411 A (JCPDS No. 340394), withall Ce-O bond lengths equal to 2.34 A (Figure 9a). ForCe0.8Sn0.2O2, simulated with Ce26Sn6O64 supercell (seeoptimized bond lengths in the form of a histogram inFigure 9b), we find that Sn substitution results in substan-tial distortion of the oxygen sublattice with longer andshorterCe-Obonds compared toCeO2.From someof thetypical Ce-O bond lengths, summarized in Table 5, it isevident that Ce is essentially in 4 þ 4 coordination. TheCe-O bonds are distributed over a range from short
(2.16 A) to long (2.64 A) bonds with themean short Ce-Obonds equal to 2.26(0.05) A and long bonds equal to2.45(0.12 A). Out of 8 coordination of Sn, first 4 coordina-tion are bunched at ∼2.05 A and the next 4 coordinationare broadly distributed from 2.3 to 2.75 A. Mean bondlengths, calculated assuming 4 + 2+ 2 coordination, are2.03(0.3), 2.46(0.15) and 2.71(0.12) A, respectively (seeTable 6). The deviation of the mean distances for the firstcoordination shell is small and in the second and thirdcoordination shell it is somewhat large.From the optimized bond lengths of 2 atom % Pd
doped Ce0.8Sn0.2O2 simulated with Ce25Sn6Pd1O63 super-cell (see Figure 9c), the Ce coordination can be approxi-mated to 4 þ 4, with mean short and long Ce-O bondlengths equal to 2.24(0.03) and 2.43(0.16) A. Coordina-tion of Sn can be approximated to 4 þ 2 þ 2, with themean distances of 2.04(0.02), 2.38(0.19) and 2.73(0.08) Arespectively. Coordination of Pd is 4 þ 3 with the meanbond lengths equal to 2.12(0.09) and 2.72(0.1) A. Thedeviation of the mean bonds for the second and thirdcoordination shell is larger than the first coordinationshell, indicating the presence of disordered oxygen sub-lattice in the structure. The local coordination of Ce, Sn,and Pd determined from EXAFS studies match reason-ablywell withDFT calculations. The short Ce-O, Sn-O,and Pd-O bond lengths corresponding to first coordina-tion shell fromour theoretical calculations agreewell withthose from the EXAFS analysis. The longer bonds ob-tained from DFT calculations are larger than the bonddistances obtained from the EXAFS study.FromH2/TPR studies we have seen that the presence of
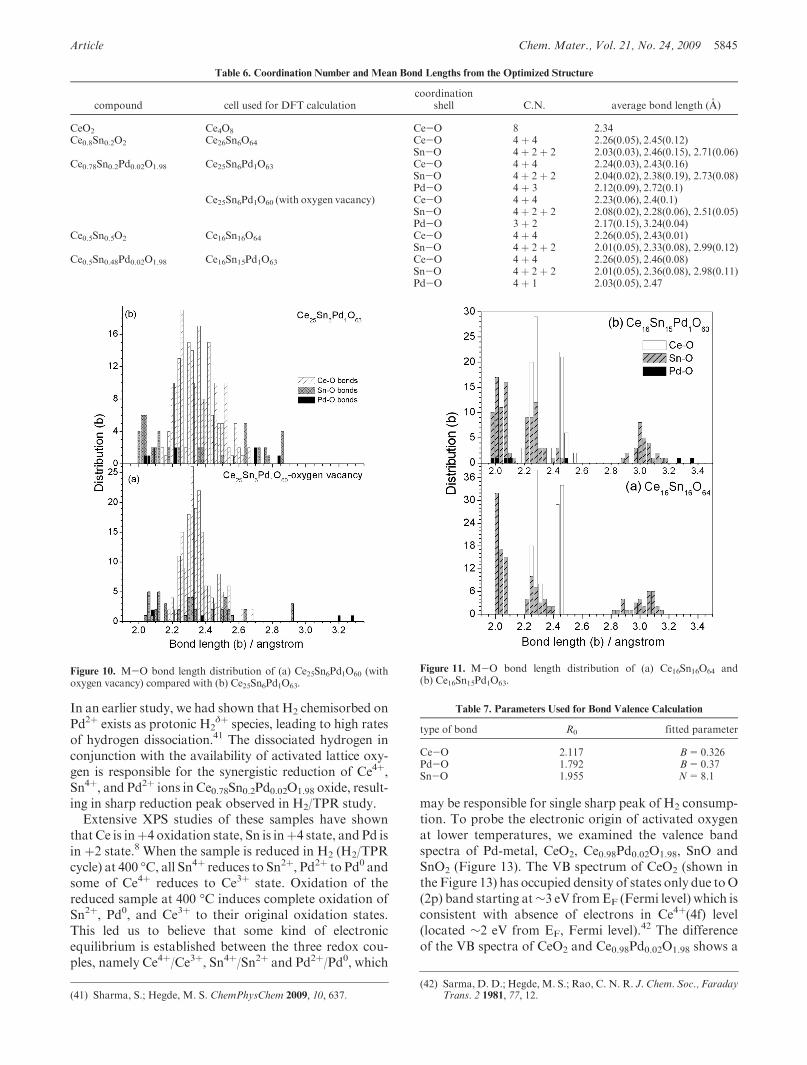
partial oxygen vacancies further destabilizes the oxygensublattice, as a result of which peak reduction tempera-ture decreases from 110 to 45 �C. To see the effect ofoxygen vacancy on the bonds distribution, three oxygenswere removed from Ce25Sn6Pd1O63 supercell and theresultant Ce25Sn6Pd1O60 lattice was optimized. The com-parative bonds distribution plots are given in Figure 10.Though a few Sn-Oand Pd-Obonds became longer, theoverall distribution of the Ce-O and Sn-O bonds hasbecome narrower. The Sn-O bonds get distributed intothree distinct regions with the mean bond lengths of
Table 3. Local Coordination and Bond Length in Ce0.8Sn0.2O2 fromCeL3
and Sn K-edge EXAFS
Shell coord. No. R (A) σ2 (A-2)
Ce L3-EXAFSCe-O(I) 4.0 2.20(1) 0.008(2)Ce-O(II) 4.0 2.37(1) 0.006(1)Ce-Sn 2.0(4) 3.45(2) 0.003(1)Ce-Ce 10.0(5) 3.68(1) 0.003(1)
Sn K-EXAFS (4 þ 2 þ 2)Sn-O(I) 4.3 (2) 2.03(3) 0.004(1)Sn-O(II) 1.6(4) 2.20(1) 0.007(2)Sn-O(III) 1.8(5) 2.43(3) 0.013(5)
Sn K-EXAFS (6 þ 2)Sn-O(I) 6.5(3) 2.03(6) 0.006(1)Sn-O(II) 1.5(1) 2.63(4) 0.02
Sn K-EXAFS (4 þ 4)Sn-O(I) 4.1 (2) 1.99(4) 0.004(1)Sn-O(II) 3.8(2) 2.24(1) 0.019(2)
Table 4. LocalCoordination andBondLength in Ce0.8Sn0.2O2 fromCeL3,
Sn K and Pd K-edge EXAFS
shell coord. no. R (A) σ2 (A-2)
Ce L3 EXAFSCe-O(I) 4.0 2.20(1) 0.008(2)Ce-O(II) 4.0 2.41(1) 0.006(1)Ce-Sn 2.0(4) 3.45(1) 0.003(1)Ce-Ce 10.0(5) 3.72(2) 0.003(1)
Sn K EXAFSSn-O(I) 4.3 (2) 2.03(3) 0.004(1)Sn-O(II) 1.6(4) 2.20(1) 0.007(2)Sn-O(III) 1.8(5) 2.43(3) 0.013(5)
Pd K EXAFSPd-O(I) 4.4(2) 2.03(4) 0.007(1)Pd-O(II) 2.0(3) 2.52(1) 0.005(1)Pd-Pd 1.7(4) 2.99(2) 0.011(2)Pd-Ce 3.4(10) 3.39(4) 0.027(7)Pd-Sn 1.8(8) 3.54(5) 0.017(6)
Article Chem. Mater., Vol. 21, No. 24, 2009 5843
2.08(0.02), 2.28(0.06), and 2.51(0.05) A, respectively. TheSn-O bonds at 2.92 A are too long and are thereforeconsidered as nonbonding distance. The longer Pd-Oand Sn-O bonds created in the oxygen deficient materialhave oxygen sites that are highly activated, and can beeasily removed from the lattice above room temperatureas seen from H2/TPR experiment (Figure 5).To check the effect of doping higher percentage of Sn in
CeO2 lattice, Ce0.5Sn0.5O2 and Ce0.5Sn0.48Pd0.02O1.98
were simulated using Ce16Sn16O64 and Ce16Sn15Pd1O63
lattice, respectively. The distributions of bond lengthscalculated from the optimized structure (see Figure 11)shows that Ce16Sn16O64 system has Ce in 4þ 4 coordina-tion (see Figure 11a) and the mean short and long bondsare 2.26(0.05) and 2.43(0.01) A, respectively. The Sn-Obonds are clearly grouped over three distinct regions in4:2:2 ratio, with mean distances of 2.01(0.05), 2.33(0.08),and 2.99(0.12) A, respectively. Since larger numbers ofSn-O bonds are longer compared to Ce26Sn6O64 system,the OSC of Ce0.5Sn0.5O2 for reduction up to 550 �C ishigher compared to Ce0.8Sn0.2O2 (see Table 2). With theintroduction of Pd2þ ion, the Ce-O and Sn-O bondsexhibit wider distribution (Figure 11b) and the meanCe-O and Sn-O bond lengths are the same as those inCe16Sn16O64. Pd is essentially in square pyramidal geo-metry with 4þ 1 coordination and themean bond lengthsare 2.03(0.05) and 2.47 A, respectively; also Pd-O bondsare longer than those obtained for Ce25Sn6Pd1O63 system(compare Figure 9c and 11b). This is consistent with thefact that Ce0.5Sn0.48Pd0.02O2-δ gave H2/TPR peak attemperature lower than that of Ce0.78Sn0.2Pd0.02O2-δ
(see Figure 3).To indentify the weakly bonded oxygen in each lattice,
bond valence analyses was used taking into considerationthe optimized M-O (M = Ce, Sn, Pd) bond lengths.
Parameters used in bond valence analysis are given inTable 7. Our estimates of bond valence of Ce and O inCeO2 are 3.98 and 1.99, which are close to the oxidationstate of Ce and O in CeO2 (Figure 12a). Bond valencedistribution of oxygen in Ce26Sn6O64, shown in panel b ofFigure 12, clearly indicates that substantial distortion ofthe oxygen sublattice, leading to distribution of bondvalence of oxygen from 1.65 to 2.3 compared to idealvalue of 2 in CeO2. Oxygenwith 1 short Sn-Obond and 3long Ce-O bonds have valency ∼1.7, whereas oxygenwith 1 long Sn-O/Ce-O bond and 3 short Ce-O bondshave valency ∼2.3 (see Table 5). Oxygen ions with bondvalence less than 2 can be considered to be weakly bondedto the lattice, whereas oxygen with bond valence greaterthan 2 can be considered to be strongly bonded to thelattice.With incorporation of Pd in Ce26Sn6O64 (i.e., Ce25-
Sn6Pd1O63 lattice), a similar trend in bond length dis-tributions is observed (see Figure 12c). The bond valenceof oxygen is more broadly distributed over the region:oxygens with 1 short Sn-O or Pd-O and 3 long Ce-Obonds have the lowest bond valence of about 1.65,whereas oxygen with 1or 2 short Ce-O and other longCe-O/Sn-O bonds have bond valence of about 2.33.With the introduction of oxygen vacancies, the bondvalence distribution shifts toward lower value (panel d),indicating an overall destabilization of the oxygen sublattice.For Ce16Sn16O64, the bond valence distribution is con-
fined within two prominent regions centered at 1.7 and2.2 (see Figure 12e). Oxygen with bond valence in theregion centered at 1.7 has 2 short Sn-O bonds and 2 longCe-O bonds, whereas oxygen in the bond valence regioncentered at 2.2 has mostly coordination number 3, ofwhich one is a short Sn-O bond and two are short Ce-O
Figure 7. (a) Background-subtracted EXAFS spectra at the SnK-edge of Ce0.8Sn0.8O2 and Ce0.78Sn0.8Pd0.02O1.98, and (b) the corresponding FT with thefits for 6 + 2 and 4 + 2 + 2 coordination (solid lines).
5844 Chem. Mater., Vol. 21, No. 24, 2009 Gupta et al.
bonds. The two regions of the oxygen bond valencedistribution indicate ordering in the oxygen sublattice.From bond length distribution too, we have observed aclear 4þ 4 coordination of Ce and 4þ 2þ 2 coordinationof Sn. With the presence of Pd in Ce16Sn15Pd1O63 lattice,similar to the bond-length distribution, the bond valencebecomes more distributed compared to Ce16Sn16O64
(panel f). We also observe that a few oxygen are tooweakly held by the lattice with bond valence as low as 1.4,leading to some of the oxygen becoming stronger withbond valence more than 2.5. These weakly held lattice
oxygen ions are responsible for the low temperature peakat ∼90 �C in the H2/TPR experiment.Synergistic Electronic Interaction. The reason behind
activation of lattice oxygen is, therefore, rationalized onthe basis of the fact that dopant Sn embedded in fluoriteCeO2 lattice distorts the oxygen sublattice both arounditself and Ce, thus creating longer and shorter bonds. Theeffect of distortion is more pronounced in Ce0.5Sn0.5O2
system where Ce exhibits 4 þ 4 coordination and Snexhibits 4 þ 2 þ 2 coordination. Presence of Pd2þ, inaddition to having usual effect of larger ion being re-placed by smaller ion, induces additional distortion in thelattice because of oxide ion vacancy creation for chargecompensation. While high oxygen storage/release prop-erty is related to inherent structure of the solid solution,sharp H2-uptake peak at temperature as low as ∼110 �Cin presence of Pd2þ ion is still unanswered. This indicatesthe crucial role of Pd2þ ion in lowering the temperature atwhich H2 extracts the lattice oxygen.In H2/TPR study, Ce0.8Sn0.2O2 is reduced to oxygen
deficient compound given by the reaction:
Ce0:8Sn0:2O2 þ 0:29H2 f Ce4þ0:62Ce3þ0:18Sn
2þ0:2 O1:71
þ 0:29H2O ð1ÞThis hydrogen intake reaction is very sluggish and startsfrom 200 to 500 �C, that is, activated oxygen thoughpresent in the lattice is not active enough and spans a widetemperature range. This same amount of reduction isachieved in a single reduction at ∼110 �C in presence ofPd2þ ion, namely, Ce0.78Sn0.2Pd0.02O2-δ catalyst, and thereaction is given as
Ce0:78Sn0:2Pd0:02O1:98 þ 0:28H2
f Ce4þ0:66Ce3þ0:12Sn
2þ0:2 Pd
00:02O1:70 þ 0:28H2O ð2Þ
Figure 8. (a) The background subtracted EXAFS spectra at the Pd K-edge of Ce0.8Sn0.8O2 andCe0.78Sn0.8Pd0.02O1.98 and (b) the correspondingFT along with the fits (solid lines).
Figure 9. Distribution of M-O bond lengths (M = Ce, Sn, Pd) of (a)Ce4O8, (b) Ce26Sn6O64, and (c) Ce25Sn6Pd1O63.
Table 5. TypicalCe-OandO-MBondLengthObtained fromOptimized
Ce26Sn6O64 Structure
Ce type Ce-O (A) Ce type Ce-O (A) Ce type Ce-O (A)
Ce (2) 2.1853 Ce(16) 2.2232 Ce(39) 2.22452.2116 2.2522 2.25892.2118 2.2522 2.26522.2127 2.2553 2.31982.4949 2.4464 2.39312.5268 2.4464 2.43802.5303 2.4929 2.46112.5739 2.4969 2.4651
Ce(50) 2.2091 Ce(62) 2.2550 Ce(75) 2.28292.2091 2.2568 2.32102.2097 2.2624 2.32842.2564 2.3618 2.33282.4294 2.3875 2.34582.5298 2.4132 2.35132.5299 2.4410 2.36672.5448 2.4633 2.4487
O(5) 2.2121(Ce) O(17) 2.0721(Sn) O(23) 2.2098(Ce)2.2531(Ce) 2.3215(Ce) 2.2321(Ce)2.2542(Ce) 2.3691(Ce) 2.2322(Ce)2.7102(Sn) 2.6391(Ce) 2.7896(Sn)
O(36) 2.0268(Sn) O(80) 2.2169(Ce) O(93) 2.0685(Sn)2.4115(Ce) 2.3310(Ce) 2.4012(Ce)2.4775(Ce) 2.3315(Ce) 2.4189(Ce)2.5215(Ce) 2.5021(Ce) 2.5436(Sn)
Article Chem. Mater., Vol. 21, No. 24, 2009 5845
In an earlier study, we had shown that H2 chemisorbed onPd2þ exists as protonic H2
δþ species, leading to high ratesof hydrogen dissociation.41 The dissociated hydrogen inconjunction with the availability of activated lattice oxy-gen is responsible for the synergistic reduction of Ce4þ,Sn4þ, and Pd2þ ions in Ce0.78Sn0.2Pd0.02O1.98 oxide, result-ing in sharp reduction peak observed in H2/TPR study.Extensive XPS studies of these samples have shown
that Ce is inþ4 oxidation state, Sn is inþ4 state, and Pd isin þ2 state.8 When the sample is reduced in H2 (H2/TPRcycle) at 400 �C, all Sn4þ reduces to Sn2þ, Pd2þ to Pd0 andsome of Ce4þ reduces to Ce3þ state. Oxidation of thereduced sample at 400 �C induces complete oxidation ofSn2þ, Pd0, and Ce3þ to their original oxidation states.This led us to believe that some kind of electronicequilibrium is established between the three redox cou-ples, namely Ce4þ/Ce3þ, Sn4þ/Sn2þ and Pd2þ/Pd0, which
may be responsible for single sharp peak of H2 consump-tion. To probe the electronic origin of activated oxygenat lower temperatures, we examined the valence bandspectra of Pd-metal, CeO2, Ce0.98Pd0.02O1.98, SnO andSnO2 (Figure 13). The VB spectrum of CeO2 (shown inthe Figure 13) has occupied density of states only due toO(2p) band starting at∼3 eV fromEF (Fermi level) which isconsistent with absence of electrons in Ce4þ(4f) level(located ∼2 eV from EF, Fermi level).42 The differenceof the VB spectra of CeO2 and Ce0.98Pd0.02O1.98 shows a
Table 6. Coordination Number and Mean Bond Lengths from the Optimized Structure
compound cell used for DFT calculationcoordination
shell C.N. average bond length (A)
CeO2 Ce4O8 Ce-O 8 2.34Ce0.8Sn0.2O2 Ce26Sn6O64 Ce-O 4 þ 4 2.26(0.05), 2.45(0.12)
Sn-O 4 þ 2 þ 2 2.03(0.03), 2.46(0.15), 2.71(0.06)Ce0.78Sn0.2Pd0.02O1.98 Ce25Sn6Pd1O63 Ce-O 4 þ 4 2.24(0.03), 2.43(0.16)
Sn-O 4 þ 2 þ 2 2.04(0.02), 2.38(0.19), 2.73(0.08)Pd-O 4 þ 3 2.12(0.09), 2.72(0.1)
Ce25Sn6Pd1O60 (with oxygen vacancy) Ce-O 4 þ 4 2.23(0.06), 2.4(0.1)Sn-O 4 þ 2 þ 2 2.08(0.02), 2.28(0.06), 2.51(0.05)Pd-O 3 þ 2 2.17(0.15), 3.24(0.04)
Ce0.5Sn0.5O2 Ce16Sn16O64 Ce-O 4 þ 4 2.26(0.05), 2.43(0.01)Sn-O 4 þ 2 þ 2 2.01(0.05), 2.33(0.08), 2.99(0.12)
Ce0.5Sn0.48Pd0.02O1.98 Ce16Sn15Pd1O63 Ce-O 4 þ 4 2.26(0.05), 2.46(0.08)Sn-O 4 þ 2 þ 2 2.01(0.05), 2.36(0.08), 2.98(0.11)Pd-O 4 þ 1 2.03(0.05), 2.47
Figure 10. M-O bond length distribution of (a) Ce25Sn6Pd1O60 (withoxygen vacancy) compared with (b) Ce25Sn6Pd1O63.
Figure 11. M-O bond length distribution of (a) Ce16Sn16O64 and(b) Ce16Sn15Pd1O63.
Table 7. Parameters Used for Bond Valence Calculation
type of bond R0 fitted parameter
Ce-O 2.117 B=0.326Pd-O 1.792 B=0.37Sn-O 1.955 N=8.1
(41) Sharma, S.; Hegde, M. S. ChemPhysChem 2009, 10, 637.(42) Sarma, D. D.; Hegde, M. S.; Rao, C. N. R. J. Chem. Soc., Faraday
Trans. 2 1981, 77, 12.
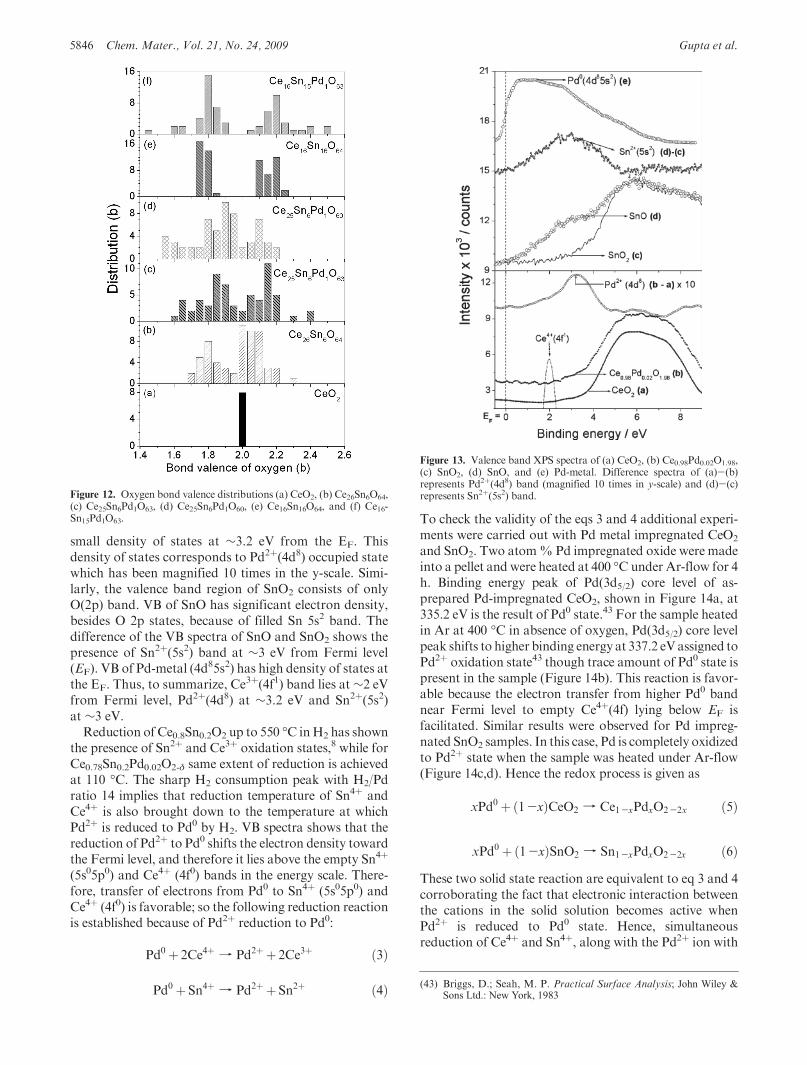
5846 Chem. Mater., Vol. 21, No. 24, 2009 Gupta et al.
small density of states at ∼3.2 eV from the EF. Thisdensity of states corresponds to Pd2þ(4d8) occupied statewhich has been magnified 10 times in the y-scale. Simi-larly, the valence band region of SnO2 consists of onlyO(2p) band. VB of SnO has significant electron density,besides O 2p states, because of filled Sn 5s2 band. Thedifference of the VB spectra of SnO and SnO2 shows thepresence of Sn2þ(5s2) band at ∼3 eV from Fermi level(EF). VB of Pd-metal (4d85s2) has high density of states atthe EF. Thus, to summarize, Ce3þ(4f1) band lies at∼2 eVfrom Fermi level, Pd2þ(4d8) at ∼3.2 eV and Sn2þ(5s2)at ∼3 eV.Reduction of Ce0.8Sn0.2O2 up to 550 �C inH2 has shown
the presence of Sn2þ and Ce3þ oxidation states,8 while forCe0.78Sn0.2Pd0.02O2-δ same extent of reduction is achievedat 110 �C. The sharp H2 consumption peak with H2/Pdratio 14 implies that reduction temperature of Sn4þ andCe4þ is also brought down to the temperature at whichPd2þ is reduced to Pd0 by H2. VB spectra shows that thereduction of Pd2þ to Pd0 shifts the electron density towardthe Fermi level, and therefore it lies above the empty Sn4þ
(5s05p0) and Ce4þ (4f0) bands in the energy scale. There-fore, transfer of electrons from Pd0 to Sn4þ (5s05p0) andCe4þ (4f0) is favorable; so the following reduction reactionis established because of Pd2þ reduction to Pd0:
Pd0 þ 2Ce4þ f Pd2þ þ 2Ce3þ ð3Þ
Pd0 þ Sn4þ f Pd2þ þ Sn2þ ð4Þ
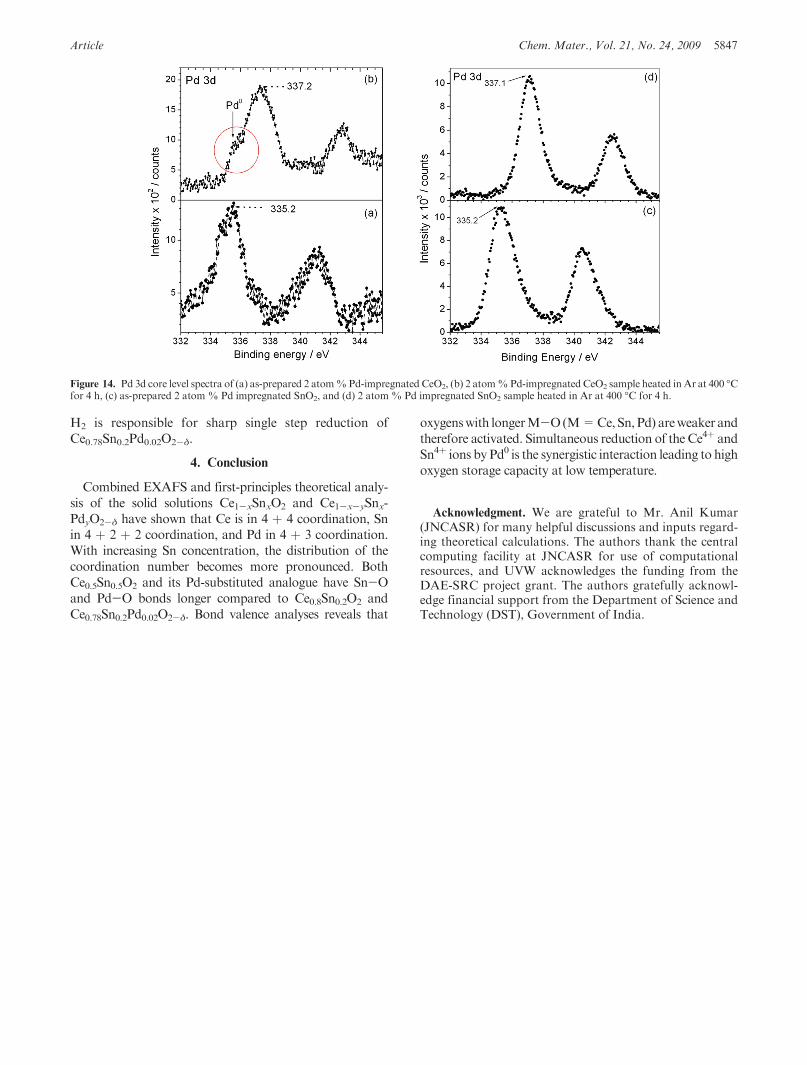
To check the validity of the eqs 3 and 4 additional experi-ments were carried out with Pd metal impregnated CeO2
and SnO2. Two atom%Pd impregnated oxide were madeinto a pellet and were heated at 400 �C under Ar-flow for 4h. Binding energy peak of Pd(3d5/2) core level of as-prepared Pd-impregnated CeO2, shown in Figure 14a, at335.2 eV is the result of Pd0 state.43 For the sample heatedin Ar at 400 �C in absence of oxygen, Pd(3d5/2) core levelpeak shifts to higher binding energy at 337.2 eVassigned toPd2þ oxidation state43 though trace amount of Pd0 state ispresent in the sample (Figure 14b). This reaction is favor-able because the electron transfer from higher Pd0 bandnear Fermi level to empty Ce4þ(4f) lying below EF isfacilitated. Similar results were observed for Pd impreg-nated SnO2 samples. In this case, Pd is completely oxidizedto Pd2þ state when the sample was heated under Ar-flow(Figure 14c,d). Hence the redox process is given as
xPd0 þð1-xÞCeO2 f Ce1-xPdxO2-2x ð5Þ
xPd0 þð1-xÞSnO2 f Sn1-xPdxO2-2x ð6ÞThese two solid state reaction are equivalent to eq 3 and 4corroborating the fact that electronic interaction betweenthe cations in the solid solution becomes active whenPd2þ is reduced to Pd0 state. Hence, simultaneousreduction of Ce4þ and Sn4þ, along with the Pd2þ ion with
Figure 12. Oxygen bond valence distributions (a) CeO2, (b) Ce26Sn6O64,(c) Ce25Sn6Pd1O63, (d) Ce25Sn6Pd1O60, (e) Ce16Sn16O64, and (f) Ce16-Sn15Pd1O63.
Figure 13. Valence band XPS spectra of (a) CeO2, (b) Ce0.98Pd0.02O1.98,(c) SnO2, (d) SnO, and (e) Pd-metal. Difference spectra of (a)-(b)represents Pd2þ(4d8) band (magnified 10 times in y-scale) and (d)-(c)represents Sn2þ(5s2) band.
(43) Briggs, D.; Seah, M. P. Practical Surface Analysis; John Wiley &Sons Ltd.: New York, 1983
Article Chem. Mater., Vol. 21, No. 24, 2009 5847
H2 is responsible for sharp single step reduction ofCe0.78Sn0.2Pd0.02O2-δ.
4. Conclusion
Combined EXAFS and first-principles theoretical analy-sis of the solid solutions Ce1-xSnxO2 and Ce1-x-ySnx-PdyO2-δ have shown that Ce is in 4 þ 4 coordination, Snin 4 þ 2 þ 2 coordination, and Pd in 4 þ 3 coordination.With increasing Sn concentration, the distribution of thecoordination number becomes more pronounced. BothCe0.5Sn0.5O2 and its Pd-substituted analogue have Sn-Oand Pd-O bonds longer compared to Ce0.8Sn0.2O2 andCe0.78Sn0.2Pd0.02O2-δ. Bond valence analyses reveals that
oxygenswith longerM-O(M=Ce,Sn,Pd) areweaker andtherefore activated. Simultaneous reduction of the Ce4þ andSn4þ ions by Pd0 is the synergistic interaction leading to highoxygen storage capacity at low temperature.
Acknowledgment. We are grateful to Mr. Anil Kumar(JNCASR) for many helpful discussions and inputs regard-ing theoretical calculations. The authors thank the centralcomputing facility at JNCASR for use of computationalresources, and UVW acknowledges the funding from theDAE-SRC project grant. The authors gratefully acknowl-edge financial support from the Department of Science andTechnology (DST), Government of India.
Figure 14. Pd 3d core level spectra of (a) as-prepared 2 atom%Pd-impregnated CeO2, (b) 2 atom%Pd-impregnated CeO2 sample heated in Ar at 400 �Cfor 4 h, (c) as-prepared 2 atom% Pd impregnated SnO2, and (d) 2 atom% Pd impregnated SnO2 sample heated in Ar at 400 �C for 4 h.
Related Documents