JOURNAL OF GEOPHYSICAL RESEARCH, VOL. 101, NO. B9, PAGES 20,449-20,466, SEPTEMBER 10, 1996 Strombolian explosions 2. Eruption dynamics determined from acoustic measurements S. Vergniolle 1 Institute of Theoretical Geophysics, University of Cambridge,Cambridge, England G. Brandeis 2 and J.-C. Mareschal 3 Laboratoire de Dynamique des Syst•mes G6ologiques, Institut de Physique du Globe de Paris Abstract. Strombolianactivity consists of a series of explosions due to the breaking of a large overpressurized bubble at the surface of the magma column. Acoustic pressure due to sound waves has been measuredand analyzed at Stromboli for more than 50 explosions. Three parts can be distinguished in the acoustic pressure waveform,which are related to the behaviorof the bubble before,during, and after its bursting. Before the sharp rise in acoustic pressure, the signalis dominated by waves with a frequencyof 2 Hz, which developon the noseof the bubble. They producesound in air by imposinga rapid motion to the interface, and one could detect a bubble travelling in the uppermost30 m of the magma column. When the bubble reaches the air-magma interface, its strong vibration, driven by a large overpressure inside the gas, generates the main event with a frequency around 9 Hz. After the bubble has burst, kinematic wavesof frequency around 4.5 Hz are the main sourceof sound. They develop at the surfaceof the magma left on the conduit side. The three types of motion, although determinedindependently, give consistent results. Furthermore, combining the resultsobtained for the two types of kinematic waves, the magma viscosity is estimatedto be of 300 q- 65 Pa s, which is in good agreement with petrological constraints and corroborates the validity of our analysis. This suggests that acoustic measurements constitute a powerful tool in the understanding of eruption dynamics. Introduction Recordsof atmosphericpressure and seismicityhave been used to constrain the mechanism of volcanic erup- tions. Long-period seismic events recorded during erup- tions, like at Mount St. Helens, were used to cal- culate the driving force [Kanamori and Given, 1982; Kanamori et al., 1984]. Violent eruptions, like that of Mount Pinatubo(Philipines) in 1991, canexcite atmo- spheric oscillations [Kanamori andMori, 1992].During the Mount St. Helens eruption, several acousticmodes a Now at Laboratoire de Dynamique des SystkmesG6o- 1ogiques, Institut de Physique du Globe de Paris. •'Now at UMR 5562 CNRS, Groupe de Recherches de G6od6sie SpatiMe, Observatoire Midi-Pyr6n6es, Toulouse, France. SNow at GEOTOP, Universit6 de Qu6bec k Montr6al, Montreal, Quebec, Canada. Copyright 1996 by the American GeophysicalUnion. Paper number 96JB01925. 0148-0227 / 96 / 96 JB-01925509.00 propagating in the lower atmosphere were recognized on an array of sensitive microbarographs [Donn and Bal- anchandran, 1981; MikumoandBolt, 1985]. Hydrophones were used to locate and describe sub- marine volcanic activityin the Pacific [Norris andJohn- son,1969].They also have been used in craterlakes to monitor activityof volcanoes [Bercy et al., 1983;Vande- meulebrouck et al., 1994].Morerecently, measurements suggest that monitoringacoustic pressure in crater lakes mightbe used to forecast eruptions [Vandemeulebrouck et al., 1994].Studies of acoustic pressure recorded in air aresparse [Machado et al., 1962; Richards, 1963;Woulff and MacGetchin, 1976; Vergniolle and Brandeis,1994, this issue]. The first studies of acoustics used a rather restricted frequency band, above 50 Hz. However, most of the energy of Strombolian explosions is below 50 Hz [Vergniolle andBrandeis, 1994]. Richards [1963] com- pared the characteristic sounds produced by eachtype of volcanic activity. Woulff andMcGetchin [1976] were the first to calculate gasvelocityfrom the total acoustic power. Their analysis,tested on fumaroles emitted by the Acatenango volcano (Guatemala), suggested that Strombolian eruptions produce a dipolar radiation. A 20,449

Welcome message from author
This document is posted to help you gain knowledge. Please leave a comment to let me know what you think about it! Share it to your friends and learn new things together.
Transcript
JOURNAL OF GEOPHYSICAL RESEARCH, VOL. 101, NO. B9, PAGES 20,449-20,466, SEPTEMBER 10, 1996
Strombolian explosions 2. Eruption dynamics determined from acoustic measurements
S. Vergniolle 1 Institute of Theoretical Geophysics, University of Cambridge, Cambridge, England
G. Brandeis 2 and J.-C. Mareschal 3
Laboratoire de Dynamique des Syst•mes G6ologiques, Institut de Physique du Globe de Paris
Abstract. Strombolian activity consists of a series of explosions due to the breaking of a large overpressurized bubble at the surface of the magma column. Acoustic pressure due to sound waves has been measured and analyzed at Stromboli for more than 50 explosions. Three parts can be distinguished in the acoustic pressure waveform, which are related to the behavior of the bubble before, during, and after its bursting. Before the sharp rise in acoustic pressure, the signal is dominated by waves with a frequency of 2 Hz, which develop on the nose of the bubble. They produce sound in air by imposing a rapid motion to the interface, and one could detect a bubble travelling in the uppermost 30 m of the magma column. When the bubble reaches the air-magma interface, its strong vibration, driven by a large overpressure inside the gas, generates the main event with a frequency around 9 Hz. After the bubble has burst, kinematic waves of frequency around 4.5 Hz are the main source of sound. They develop at the surface of the magma left on the conduit side. The three types of motion, although determined independently, give consistent results. Furthermore, combining the results obtained for the two types of kinematic waves, the magma viscosity is estimated to be of 300 q- 65 Pa s, which is in good agreement with petrological constraints and corroborates the validity of our analysis. This suggests that acoustic measurements constitute a powerful tool in the understanding of eruption dynamics.
Introduction
Records of atmospheric pressure and seismicity have been used to constrain the mechanism of volcanic erup- tions. Long-period seismic events recorded during erup- tions, like at Mount St. Helens, were used to cal- culate the driving force [Kanamori and Given, 1982; Kanamori et al., 1984]. Violent eruptions, like that of Mount Pinatubo (Philipines) in 1991, can excite atmo- spheric oscillations [Kanamori and Mori, 1992]. During the Mount St. Helens eruption, several acoustic modes
a Now at Laboratoire de Dynamique des Systkmes G6o- 1ogiques, Institut de Physique du Globe de Paris.
•'Now at UMR 5562 CNRS, Groupe de Recherches de G6od6sie SpatiMe, Observatoire Midi-Pyr6n6es, Toulouse, France.
SNow at GEOTOP, Universit6 de Qu6bec k Montr6al, Montreal, Quebec, Canada.
Copyright 1996 by the American Geophysical Union.
Paper number 96JB01925. 0148-0227 / 96 / 96 JB-01925509.00
propagating in the lower atmosphere were recognized on an array of sensitive microbarographs [Donn and Bal- anchandran, 1981; Mikumo and Bolt, 1985].
Hydrophones were used to locate and describe sub- marine volcanic activity in the Pacific [Norris and John- son, 1969]. They also have been used in crater lakes to monitor activity of volcanoes [Bercy et al., 1983; Vande- meulebrouck et al., 1994]. More recently, measurements suggest that monitoring acoustic pressure in crater lakes might be used to forecast eruptions [Vandemeulebrouck et al., 1994]. Studies of acoustic pressure recorded in air are sparse [Machado et al., 1962; Richards, 1963; Woulff and MacGetchin, 1976; Vergniolle and Brandeis, 1994, this issue]. The first studies of acoustics used a rather restricted frequency band, above 50 Hz. However, most of the energy of Strombolian explosions is below 50 Hz [Vergniolle and Brandeis, 1994]. Richards [1963] com- pared the characteristic sounds produced by each type of volcanic activity. Woulff and McGetchin [1976] were the first to calculate gas velocity from the total acoustic power. Their analysis, tested on fumaroles emitted by the Acatenango volcano (Guatemala), suggested that Strombolian eruptions produce a dipolar radiation. A
20,449
20,450 VERGNIOLLE ET AL.' STROMBOLIAN EXPLOSIONS, 2
recent study has, however, shown that the source of the sound at Stromboli is a monopole [ Vergniolle and Bran- deis, 1994]. More recently, the airborne structure of the sound at Stromboll, mainly in audible frequencies, was analyzed in great detail and explained by resonances in the magma column [Buckingham and Garcds, 1996].
Application of fluid mechanics to volcanic activity is even more recent. Most studies are focused on under-
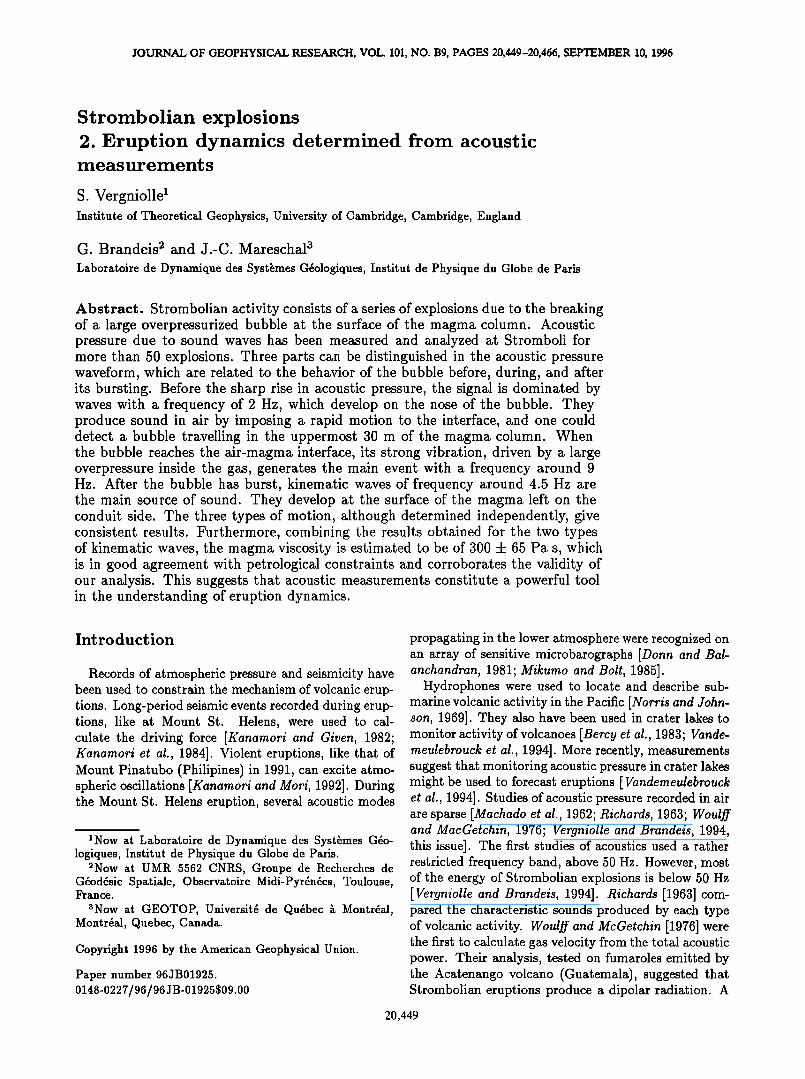
standing the dynamics of volcanic plumes [e.g., Wil- son et al., 1978; Kieffer and Sturtevant, 1984; Sparks, 1986; Woods, 1988]. Models for basaltic eruptions are less common [e.g., Wilson and Head, 1981; Jaupart and Vergniolle, 1988; Vergniolle and Jaupart, 1990]. Field data are needed to test laboratory and numerical mod- els of eruption dynamics. Stromboll is an excellent can- didate to be a laboratory volcano for basaltic eruptions because of its permanent activity. It consists of a series of explosions, caused by the breaking of a large over- pressurised bubble at the surface of the magma column [Blackburn et al., 1976; Wilson, 1980]. All explosions present a similar pattern and have a regular intermit- tency, typical of a well-developed slug flow in which bubbles, almost as large as the volcanic conduit, rise before bursting at the surface [Jaupart and Vergniolle, 1988]. Vergniolle and Brandeis [1994, this issue] have interpreted sharp variations in acoustic pressure (Fig- ure 1) as due to the vibration of these large bubbles at the surface of the magma column just before they burst.
These bubbles form at depth, probably in a shallow magma chamber [Jaupart and Vergniolle, 1988], a few hundred meters deep [Giberti et al., 1992]. Because they rise at a rather slow velocity, • 1.6 m s-1 if the volcanic conduit is • i m in radius [Wallis, 1969], they are at shallow depths during the last few seconds before they reach the surface. Therefore their behavior should af-
fect the nearby air-magma interface. Strong motions on this interface could radiate sound waves into air, which can be detected by monitoring acoustic pressure. Simi- larly, the study of acoustic pressure after the bubble has burst may provide additional information on the erup- tion dynamics. The aim of this study is thus to perform a quantitative analysis of the frequencies of the sound before and after the bubble has burst.
General Features of Stromboli
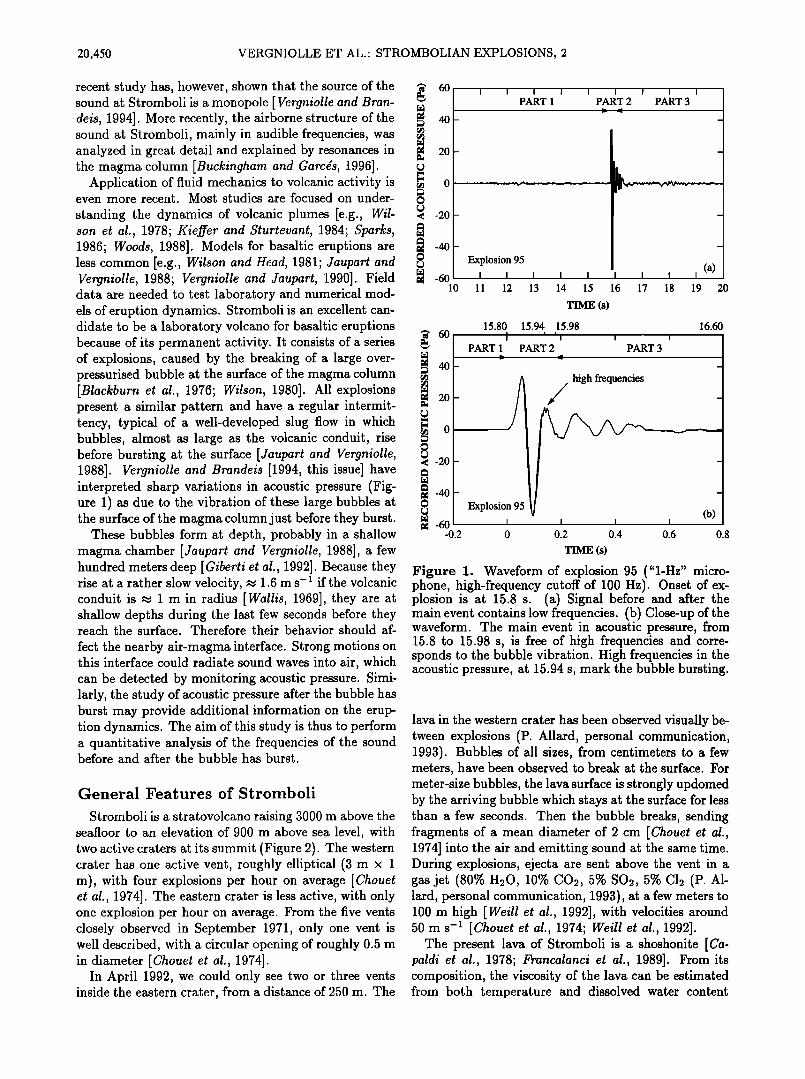
Stromboli is a stratovolcano raising 3000 m above the seafloor to an elevation of 900 m above sea level, with two active craters at its summit (Figure 2). The western crater has one active vent, roughly elliptical (3 m x 1 m), with four explosions per hour on average [Chouet et al., 1974]. The eastern crater is less active, with only one explosion per hour on average. From the five vents closely observed in September 1971, only one vent is well described, with a circular opening of roughly 0.5 m in diameter [Chouet et al., 1974].
In April 1992, we could only see two or three vents inside the eastern crater, from a distance of 250 m. The
60
40- :20-
o
-:20 -
-40 -
-60 10
I I I I I I I I I
PART 1 PART 2 PART 3
Explosion 95 (a)
11 12 13 14 15 16 17 18 19 20
TIME (s)
15.80 15.94 15.98 16.60 60 I ' 'l I
l PART 1 PART 2 PART 3 40
high frequencies
:20 / -
o -20 -
-40 -
(b) -60 i i I
-0.2 0 0.2 0.4 0.6 0.8
TIME (s)
Figure 1. Waveform of explosion 95 ("l-Hz" micro- phone, high-frequency cutoff of 100 Hz). Onset of ex- plosion is at 15.8 s. (a) Signal before and after the main event contains low frequencies. (b) Close-up of the waveform. The main event in acoustic pressure, from 15.8 to 15.98 s, is free of high frequencies and corre- sponds to the bubble vibration. High frequencies in the acoustic pressure, at 15.94 s, mark the bubble bursting.
lava in the western crater has been observed visually be- tween explosions (P. Allard, personal communication, 1993). Bubbles of all sizes, from centimeters to a few meters, have been observed to break at the surface. For meter-size bubbles, the lava surface is strongly updomed by the arriving bubble which stays at the surface for less than a few seconds. Then the bubble breaks, sending fragments of a mean diameter of 2 cm [Chouet et al., 1974] into the air and emitting sound at the same time. During explosions, ejecta are sent above the vent in a gas jet (80% H20, 10% CO2, 5% SO2, 5% C12 (P. A1- lard, personal communication, 1993), at a few meters to 100 m high [Weill et al., 1992], with velocities around 50 m s -x [Chouet et al., 1974; Weill et al., 1992].
The present lava of Stromboli is a shoshonite [Ca- paldi et al., 1978; Francalanci et al., 1989]. From its composition, the viscosity of the lava can be estimated from both temperature and dissolved water content
VERGNIOLLE ET AL.: STROMBOLIAN EXPLOSIONS, 2 20,451
P•sc•ta
F•cogrande
ß 100 m 782
Crater 0 • • ß
Wo
Figure 2. Map of Stromboli showing western crater (point W) and eastern crater (point E) and location of measurements (point M) with one microphone. The to- pography of the summit (square box) is adapted from [Chouet et al., 1974; Settle and McGetchin, 1980]. Tri- angles represent points of known elevation [Chouet et al., 1974]. When two microphones are used, DAT is at point M, the "4-Hz" microphone is at point I and the "l-Hz" microphone at point L on the southwest ridge.
[Shaw, 1972] or from its temperature only [Bottinga and Weill, 1972]. For the samples described by Ca- paldi et al. [1978] and Francalanci et al. [1989] and assuming no crystals, estimates range between 50 and 500 Pa s, for temperatures between 1273 K and 1373 K and water content between 0 wt% and 0.6 wt% [Ca- paldi et al., 1978]. The phenocryst content is, however, highly variable, between 10 and 40% [Francalanci et al., 1989]. Taking an average value of 20%, and following the Roscoe [1952] equation, the value of viscosity in- creases by a factor 2.5, giving a range of 125 to 1250 ra s.
Stromboll has a low seismicity that has been at- tributed to the gas-magma dynamics in the uppermost portion of the magma column [Ripepe et al., 1993, 1996]. Sharp and monochromatic seismic events, • 2.5 Hz, in the western crater have been explained by a buried source [Ripepe et al., 1993]. By contrast, the seismic- ity of the eastern vents is extremely shallow [Ripepe et al., 1993]. For both craters, the volcano-seismic source is attributed to an explosion at the top of the magma column, generated by rising gas bubbles reaching the magma surface [Braun and Ripepe, 1993; Ripepe et al., 1996], but the exact seismic signature of each vent is unknown [Ntepe and Dorel, 1990]. Measurements of
seismic waves induced by explosions show that the first seismic waves at 1 Hz appear about I s before the second seismic waves, which contains two dominant frequencies at 2 and 5 Hz [Lo Bascio et al., 1973; Del Pezzo et al., 1992].
Acoustical Measurements
Experimental Setup
During 3 weeks in April 1992, acoustic measurements were performed on Stromboli volcano on a small crest close to the summit (Figure 2). Three different setups have been used. The first one, devoted to the waveform analysis, especially at low frequencies (1 Hz to 70 kHz), consists of a microphone (Bruel-Kjaer 4155), an am- plifier (Bruel-Kjaer 2231), and a DAT recorder (Sony TCD-10 Pro) modified to accept low frequencies (-3 dB at I Hz). The second setup, used for the radiation pat- tern of the source, consists in two microphones, two amplifiers and two DAT recorders, at two different sites (points M and S, 250 and 370 m, respectively, from the eastern vents, on either side of the Stromboli summit, Figure 2). The second microphone (Bruel-Kjaer 4165) and amplifier (Bruel-Kjaer 2230) cover a narrower fre- quency range (4 Hz to 20 kHz). Each DAT has a time code in order to correlate arrival times. Finally, the third setup, used to locate the sources, connects the two pairs of microphones and amplifiers to the same DAT recorder. All instruments were calibrated with a
sound level calibrator (Bruel-Kjaer 4230) of intensity 94 dB (rms pressure of 1 Pa) at 1000 Hz.
For all setups, the propagation from the vents toward the microphones is in direct line without any solid ob- stacle along the path. Although strongly dependent on humidity, the absorption coefficient in air is sufficiently small (10 -3 dB m -1 [Pierce, 1981]) to be negligible, 0.25 dB at 250 m, before the 100 dB radiated by a small explosion. Therefore the acoustic pressure, measured in air with perfect weather conditions (dry, sunny, and without wind), is only due to the source. These experi- ments have shown that the source of sound radiates like
a monopole, as the recorded intensity is inversely pro- portional to distance between vents and microphones.
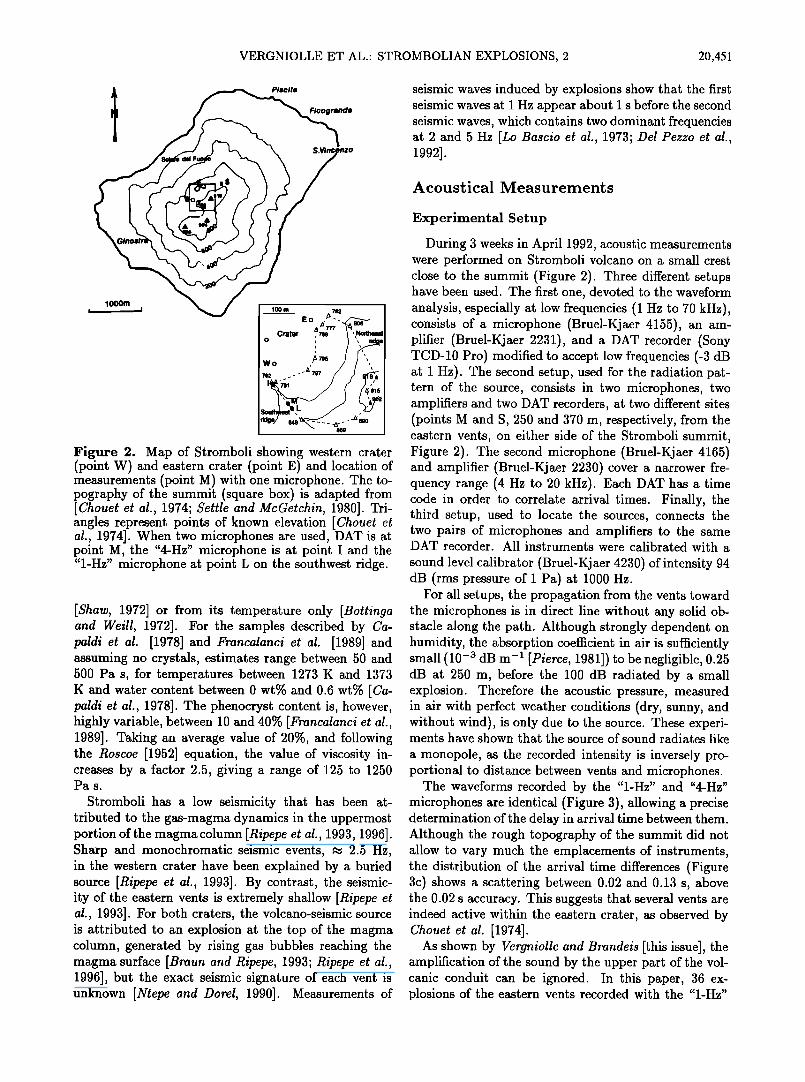
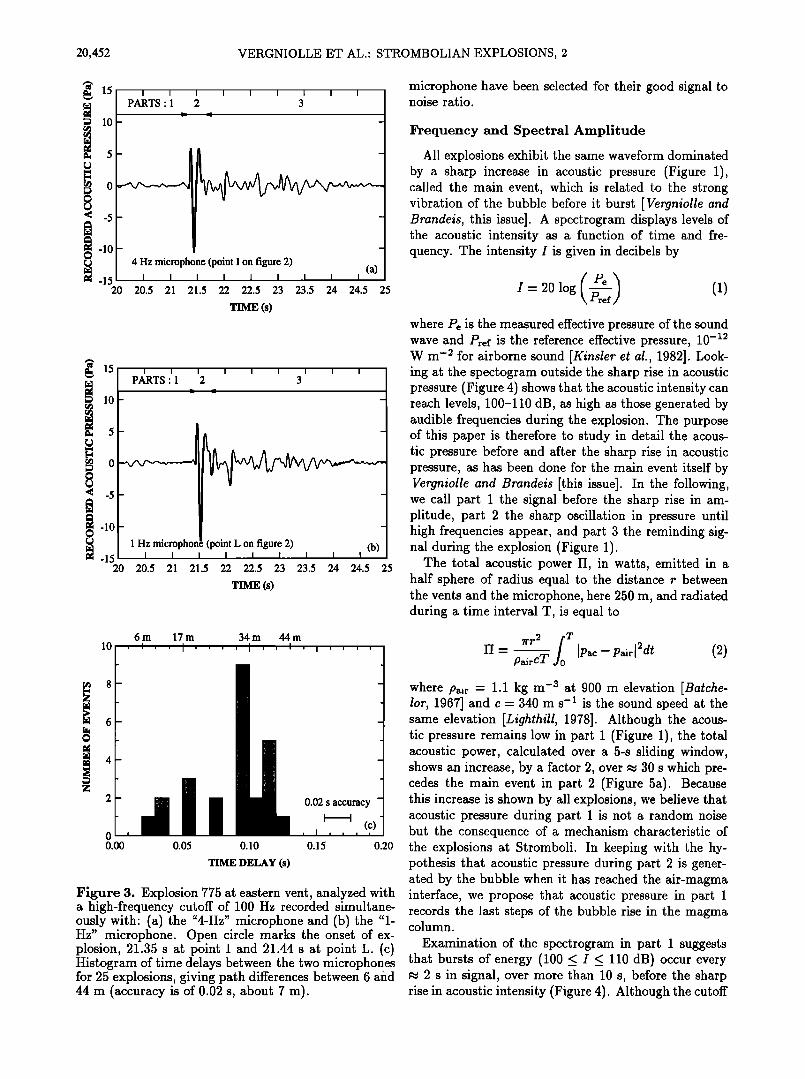
The waveforms recorded by the "l-Hz" and "4-Hz" microphones are identical (Figure 3), allowing a precise determination of the delay in arrival time between them. Although the rough topography of the summit did not allow to vary much the emplacements of instruments, the distribution of the arrival time differences (Figure 3c) shows a scattering between 0.02 and 0.13 s, above the 0.02 s accuracy. This suggests that several vents are indeed active within the eastern crater, as observed by Chouet et al. [1974].
As shown by Vergniolle and Brandeis [this issue], the amplification of the sound by the upper part of the vol- canic conduit can be ignored. In this paper, 36 ex- plosions of the eastern vents recorded with the "l-Hz"
20,452 VERGNIOLLE ET AL.' STROMBOLIAN EXPLOSIONS, 2
lO
(•-10 -15
20
I I I I I I I I I
PARTS ß 1 2 3
4 Hz microphone (point I on figure 2) (a)
20.5 21 21.5 22 22.5 23 23.5 24 24.5 25
TIME (s)
15
10
5
0
-5
-10
-15 20
I I I I I I I I I
PARTS' 1 2 3
1 Hz microphone (point L on lgur½ 2) (b) 20.5 21 21.5 22 22.5 23 23.5 24 24.5
TIME (s)
25
microphone have been selected for their good signal to noise ratio.
Frequency and Spectral Amplitude
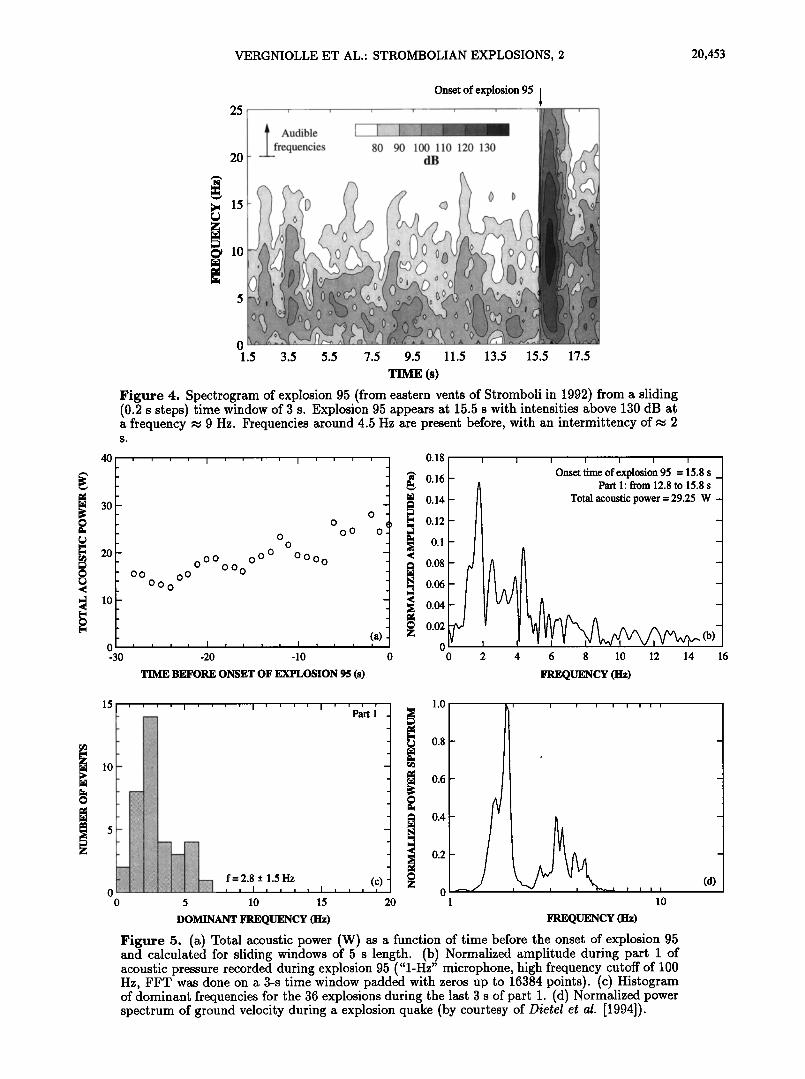
All explosions exhibit the same waveform dominated by a sharp increase in acoustic pressure (Figure 1), called the main event, which is related to the strong vibration of the bubble before it burst [Vergniolle and Brandeis, this issue]. A spectrogram displays levels of the acoustic intensity as a function of time and fre- quency. The intensity I is given in decibels by
I-20 log (p••r) (1) where Pe is the measured effective pressure of the sound wave and Pref is the reference effective pressure, 10 -x2 W m -2 for airborne sound [Kinsler et al., 1982]. Look- ing at the spectogram outside the sharp rise in acoustic pressure (Figure 4) shows that the acoustic intensity can reach levels, 100-110 dB, as high as those generated by audible frequencies during the explosion. The purpose of this paper is therefore to study in detail the acous- tic pressure before and after the sharp rise in acoustic pressure, as has been done for the main event itself by Vergniolle and Brandeis [this issue]. In the following, we call part 1 the signal before the sharp rise in am- plitude, part 2 the sharp oscillation in pressure until high frequencies appear, and part 3 the reminding sig- nal during the explosion (Figure 1).
The total acoustic power H, in watts, emitted in a half sphere of radius equal to the distance r between the vents and the microphone, here 250 m, and radiated during a time interval T, is equal to
10 6m 17m 34m 44m
0 0.0o 0.05 0.10
TIME DELAY (s)
0.02 s accuracy I I
(c)
0.15 0.20
Figure 3. Explosion 775 at eastern vent, analyzed with a high-frequency cutoff of 100 Hz recorded simultane- ously with: (a)the "4-Hz" microphone and (b)the "l- Hz" microphone. Open circle marks the onset of ex- plosion, 21.35 s at point I and 21.44 s at point L. (c) Histogram of time delays between the two microphones for 25 explosions, giving path differences between 6 and 44 m (accuracy is of 0.02 s, about 7 m).
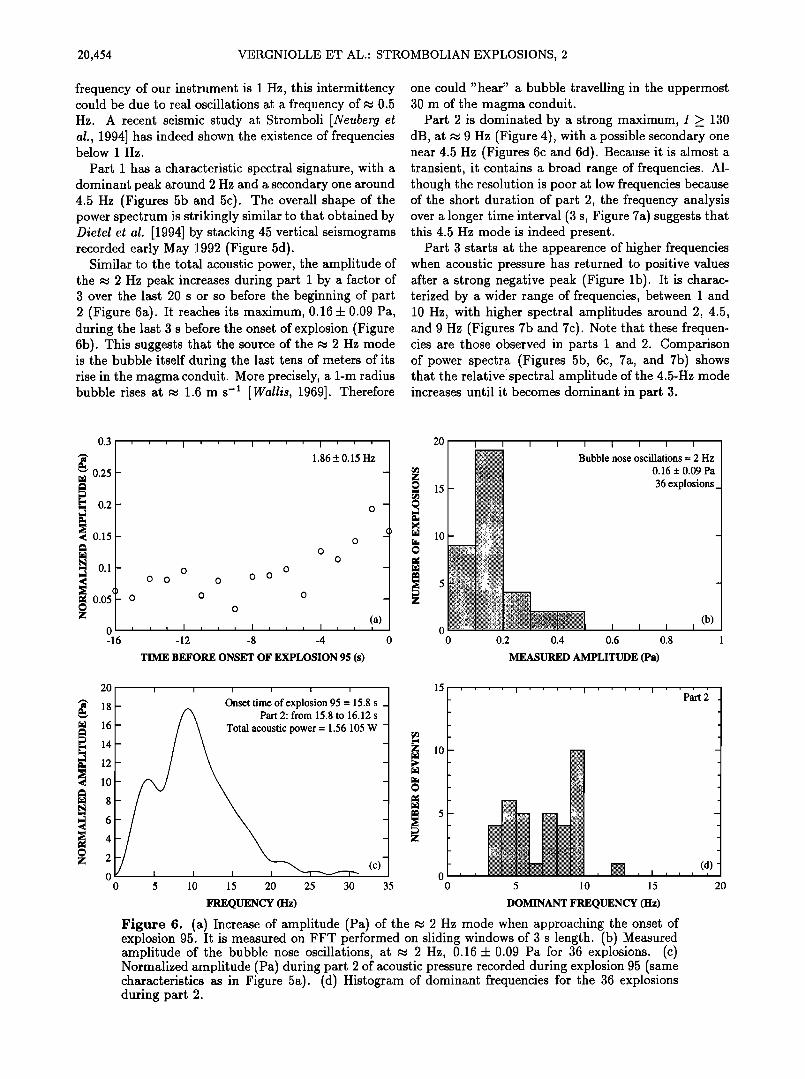
II - 71'•'2 /T PaircT ]p• - pairl2dt (2) where Pair -- 1.1 kg m -3 at 900 m elevation [Batche- lot, 1967] and c- 340 m s -x is the sound speed at the same elevation [Lighthill, 1978]. Although the acous- tic pressure remains low in part i (Figure 1), the total acoustic power, calculated over a 5-s sliding window, shows an increase, by a factor 2, over • 30 s which pre- cedes the main event in part 2 (Figure 5a). Because this increase is shown by all explosions, we believe that acoustic pressure during part i is not a random noise but the consequence of a mechanism characteristic of the explosions at Stromboli. In keeping with the hy- pothesis that acoustic pressure during part 2 is gener- ated by the bubble when it has reached the air-magma interface, we propose that acoustic pressure in part 1 records the last steps of the bubble rise in the magma column.
Examination of the spectrogram in part 1 suggests that bursts of energy (100 _< I _< 110 dB) occur every • 2 s in signal, over more than 10 s, before the sharp rise in acoustic intensity (Figure 4). Although the cutoff
VERGNIOLLE ET AL.: STROMBOLIAN EXPLOSIONS, 2 20,453
4O
3O
2O
l0
0 -30
25
2O
Onset of explosion 95 1 [ [ [ [ ] [ i •i• ..... : [
_[_frequencies 80 90 10•1•10 120 130 :[l•/••t. • : 0 • " ,:".":•'- -'- ( ,i.:: i"Jtl .... ::: •.
-'t 0-'" i : ' ':' '/'3i• :'"
3.5 5.5 7.5 9.5 11.5 13.5 15.5 17.5 0 1.5
TIME (s)
Figure 4. Spectrogram of explosion 95 (from eastern vents of Stromboli in 1992) from a sliding (0.2 s steps) time window of 3 s. Explosion 95 appears at 15.5 s with intensities above 130 dB at a frequency • 9 Hz. Frequencies around 4.5 Hz are present before, with an intermittency of • 2
Oo o o ̧
o o
oo o O0 øOo 0 o oo 0
o
o ¸
o
(a) • -20 -10 0
0.18
0.16
0.14
0.12 0.1
0.08 0.06 0.04 0.02
0
TIME BEFORE ONSET OF EXPLOSION 95 (s)
i i i i i i i
Onset time of explosion 95 = 15.8 s _ Part 1' from 12.8 to 15.8 s
Total acoustic power = 29.25 W -
I
2 4 6 8 10 12 14
FREQUENCY (Hz)
15
l0
0 0
.... [ .... [ .... [' ' P•rt i
f = 2.8 + 1.5 Hz (c) , , I , , , , I , , , ,
5 10 15 2O
1.O
0.8
0.6
1
! I I I
lO
DOMINANT FREQUENCY (Hz) FREQUENCY (Hz)
Figure 5. (a) Total acoustic power (W) as a function of time before the onset of explosion 95 and calculated for sliding windows of 5 s length. (b) Normalized amplitude during part I of acoustic pressure recorded during explosion 95 ("l-Hz" microphone, high frequency cutoff of 100 Hz, FFT was done on a 3-s time window padded with zeros up to 16384 points). (c) Histogram of dominant frequencies for the 36 explosions during the last 3 s of part 1. (d) Normalized power spectrum of ground velocity during a explosion quake (by courtesy' of Dietel et al. [1994]).
(b)
16
(d)
20,4:54 VERGNIOLLE ET AL.' STROMBOLIAN EXPLOSIONS, 2
frequency of our instrument is I Hz, this intermittency could be due to real oscillations at a frequency of • 0.5 Hz. A recent seismic study at Stromboli [Neuberg et al., 1994] has indeed shown the existence of frequencies below i Hz.
Part i has a characteristic spectral signature, with a dominant peak around 2 Hz and a secondary one around 4.5 Hz (Figures 5b and 5c). The overall shape of the power spectrum is strikingly similar to that obtained by Dietel et al. [1994] by stacking 45 vertical seismograms recorded early May 1992 (Figure 5d).
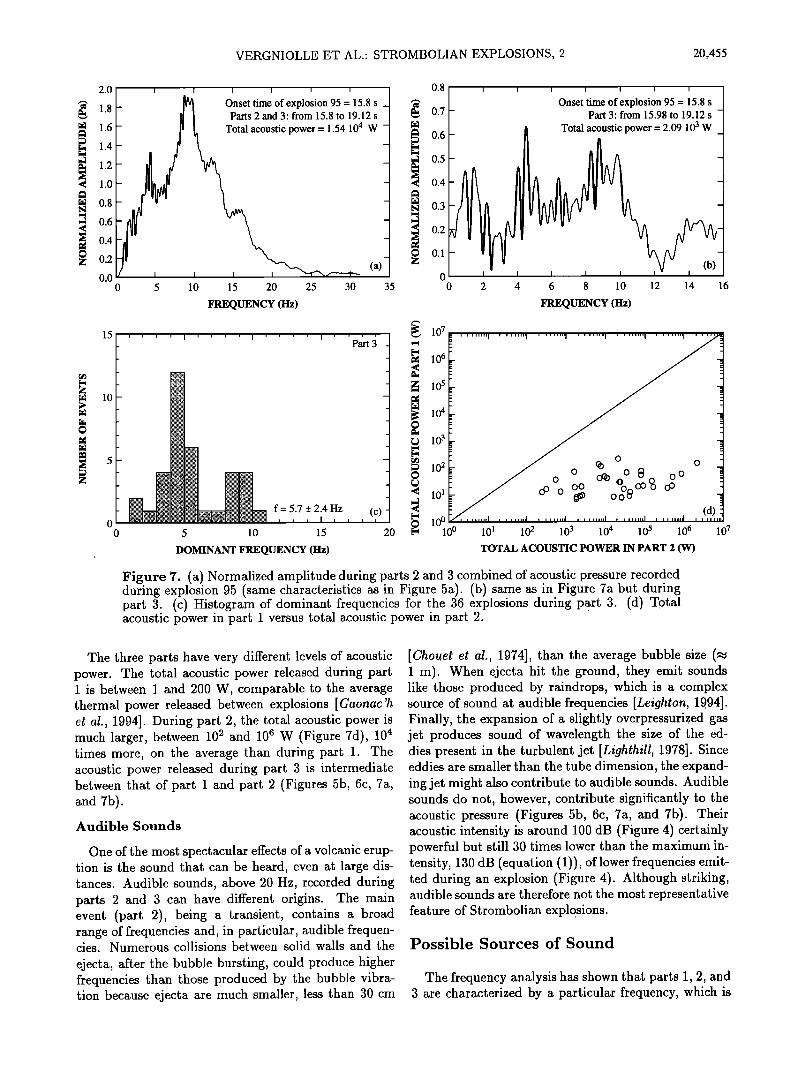
Similar to the total acoustic power, the amplitude of the ..• 2 Hz peak increases during part i by a factor of 3 over the last 20 s or so before the beginning of part 2 (Figure 6a). It reaches its maximum, 0.16 4-0.09 Pa, during the last 3 s before the onset of explosion (Figure 6b). This suggests that the source of the • 2 Hz mode is the bubble itself during the last tens of meters of its rise in the magma conduit. More precisely, a 1-m radius bubble rises at • 1.6 m s -• [Wallis, 1969]. Therefore
one could "hear" a bubble travelling in the uppermost 30 m of the magma conduit.
Part 2 is dominated by a strong maximum, I _> 130 dB, at ..• 9 Hz (Figure 4), with a possible secondary one near 4.5 Hz (Figures 6c and 6d). Because it is almost a transient, it contains a broad range of frequencies. Al- though the resolution is poor at low frequencies because of the short duration of part 2, the frequency analysis over a longer time interval (3 s, Figure 7a) suggests that this 4.5 Hz mode is indeed present.
Part 3 starts at the appearence of higher frequencies when acoustic pressure has returned to positive values after a strong negative peak (Figure lb). It is charac- terized by a wider range of frequencies, between i and 10 Hz, with higher spectral amplitudes around 2, 4.5, and 9 Hz (Figures 7b and 7c). Note that these frequen- cies are those observed in parts i and 2. Comparison of power spectra (Figures 5b, 6c, 7a, and 7b) shows that the relative spectral amplitude of the 4.5-Hz mode increases until it becomes dominant in part 3.
0.3
0.25 -
0.2-
0.15-
0.1-
•0.05 f
' ' ' I ' ' ' I ' ' ' I ' ' '
1.86 _+ 0.15 Hz
o o o o o o o
o o
o
o
!a) 0 , , , I , • , I , , • I , , -16 -12 -8 -4 0
TIME BEFORE ONSET OF EXPLOSION 95 (s)
20
Bubble nose oscillations -- 2 Hz
36explosions_
0 0.2 0.4 0.6 0.8
MEASURED AMPLITUDE (Pa)
20 / , , , , , , [._ Onset time of explosion 95 = 15.8 s _
• 18 / f• Part 2: from 15.8 to 16.12s • 16 wer = 1.56 105 W • 14 12
lO
6
• 4 2 (c) o
o 5 lO 15 20 25 30 35
15
lO
o o
ß I I I I I I
5 l0 15
FREQUENCY (Hz) DOMINANT FREQUENCY (Hz)
Figure 6. (a) Increase of amplitude (Pa) of the m 2 Hz mode when approaching the onset of explosion 95. It is measured on FFT performed on sliding windows of 3 s length. (b) Measured amplitude of the bubble nose oscillations, at m 2 Hz, 0.16 4-0.09 Pa for 36 explosions. (c) Normalized amplitude (Pa) during part 2 of acoustic pressure recorded during explosion 95 (same characteristics as in Figure 5a). (d) Histogram of dominant frequencies for the 36 explosions during part 2.
20
VERGNIOLLE ET AL.' STROMBOLIAN EXPLOSIONS, 2 20,455
2.0
1.8
1.6
1.4
1.2
1.0
0.8
0.6
0.4
0.2
0.0
15
10
• • • • 0.8 • • • • , •
Onset time of explosion 95 = 15.8 s _ •' Onset time of explosion 95 = 15.8 s
Parts 2 and 3: from 15.8 to 19.12 s i 0.7 Part 3: from 15.98 to 19.12 s - er = 1.54 104 W 0.6 2.09 103 W _
• 0.5 • 0.4
.• 0.3 • 0.2
0.1 (a)
• I 0 0 5 10 15 20 25 30 35
FREQUENCY (Hz)
i i i I I i i i
0 5 10 15 20
DOMINANT FREQUENCY (Hz)
0 2 4 6 8 10 12 14 16
FREQUENCY (Hz)
107
106 105
104 103
- •> o
10 0 • •,•1 , •,,,l•,l ........ I ........ I , ,, ..... I ........ I .... 10 ø 101 102 103 104 105 106 107
TOTAL ACOUSTIC POWER IN PART 2 (W)
Figure 7. (a) Normalized amplitude during parts 2 and 3 combined of acoustic pressure recorded during explosion 95 (same characteristics as in Figure 5a). (b) same as in Figure 7a but during part 3. (c) Histogram of dominant frequencies for the 36 explosions during part 3. (d) Total acoustic power in part 1 versus total acoustic power in part 2.
The three parts have very different levels of acoustic power. The total acoustic power released during part 1 is between 1 and 200 W, comparable to the average thermal power released between explosions [Gaonac'h et al., 1994]. During part 2, the total acoustic power is much larger, between 102 and 106 W (Figure 7d), 104 times more, on the average than during part 1. The acoustic power released during part 3 is intermediate between that of part 1 and part 2 (Figures 5b, 6c, 7a, and 7b).
Audible Sounds
One of the most spectacular effects of a volcanic erup- tion is the sound that can be heard, even at large dis- tances. Audible sounds, above 20 Hz, recorded during parts 2 and 3 can have different origins. The main event (part 2), being a transient, contains a broad range of frequencies and, in particular, audible frequen- cies. Numerous collisions between solid walls and the
ejecta, after the bubble bursting, could produce higher frequencies than those produced by the bubble vibra- tion because ejecta are much smaller, less than 30 cm
[Chouet et al., 1974], than the average bubble size 1 m). When ejecta hit the ground, they emit sounds like those produced by raindrops, which is a complex source of sound at audible frequencies [Leighton, 1994]. Finally, the expansion of a slightly overpressurized gas jet produces sound of wavelength the size of the ed- dies present in the turbulent jet [Lighthill, 1978]. Since eddies are smaller than the tube dimension, the expand- ing jet might also contribute to audible sounds. Audible sounds do not, however, contribute significantly to the acoustic pressure (Figures 5b, 6c, 7a, and 7b). Their acoustic intensity is around 100 dB (Figure 4) certainly powerful but still 30 times lower than the maximum in- tensity, 130 dB (equation (1)), of lower frequencies emit- ted during an explosion (Figure 4). Although striking, audible sounds are therefore not the most representative feature of Strombolian explosions.
Possible Sources of Sound
The frequency analysis has shown that parts 1, 2, and 3 are characterized by a particular frequency, which is
20,456 VERGNIOLLE ET AL.- STROMBOLIAN EXPLOSIONS, 2
natural to relate to a specific mechanism. The very existence of large bubbles [Blackburn et al., 1976; Wil- son, 1980], also overpressurized [ Vergniolle and Bran- deis, this issue] leads us to propose that all these mech- anisms are related to the behavior of the bubble and its
consequences on the surrounding magma.
Longitudinal Oscillations for a Rising Bubble
When gas pockets form at depth by coalescence of a foam layer [Jaupart and Vergniolle, 1989], they are over- pressurized by the release of surface tension from the numerous small bubbles [Vergniolle and Brandeis, this issue]. The overpressure in the large bubble will force it to grow and oscillate, as observed in underwater ex- plosion [Taylor and Davies, 1963]. Because the bubble cannot expand in width here, far from the air-magma interface, the oscillations will be longitudinal (Figure 8). Assuming that the magma layer above the bubble follows passively its motion, it may be considered as a mass attached to a vertically oscillating spring.
Assuming small oscillations and no damping, as by Vergniolle and Brandeis [1994], the radian frequency is the square root of the ratio between generalized stiff- ness and inertia, both derived from potential and ki- netic energies, respectively [Lighthill, 1978]. Assuming for simplicity that the bubble is a cylinder of length L and radius Ro pushing a layer of magma of thickness H• and density p• = 2700 kg m -a, the kinetic energy Ek of the oscillator is then
1
]•]k- •(7rpl•2oH1) j)2 (3)
where L - dL/dt is the vertical velocity of the layer of magma and the term in parentheses is the generalized inertia. The potential energy for small oscillations is re- lated to relative changes in gas density inside the bub- ble Apg/Pgeq, which are equal to the relative changes in length AL/Leq, where index eq refers to equilibrium values. The potential energy Ep of the oscillator is then
[ Zeq ](Am (4) where Pg is the pressure in the gas and 3' is the ratio of specific heats, equal to 1.1 for hot gas [Lighthill, 1978]. The generalized stiffness is the term in square brackets in the expression of the potential energy. The frequency fL of the oscillator is therefore
(s) fL- plLeqH It is clear that this calculation is only approximate be- cause, in particular, the magma layer gets thinner as the bubble rises and increases in length by decompression. Keeping this in mind and setting Pg at the lithostatic value, the range of frequencies is from 0.4 Hz, for a 20-m-long bubble at a depth of 1 m, to 0.6 Hz for a 1-m-long bubble at a depth of 20 m, typical values of bubble lengths at Stromboli [Vergniolle and Brandeis, this issue]. Overpressure in the bubble would increase these values, but viscous dissipation in the magma layer would tend to decrease them. Although approximately
Bubble nose
Cylind;•
Longitudinal oscillations Bubble nose oscillations + Kinematic waves on Ro
Surface waves k = 2nRo
I I I I
•, ,• • film •5 Ro
Bubble vibration mode
Kinematic waves
on •5
)• = 2•
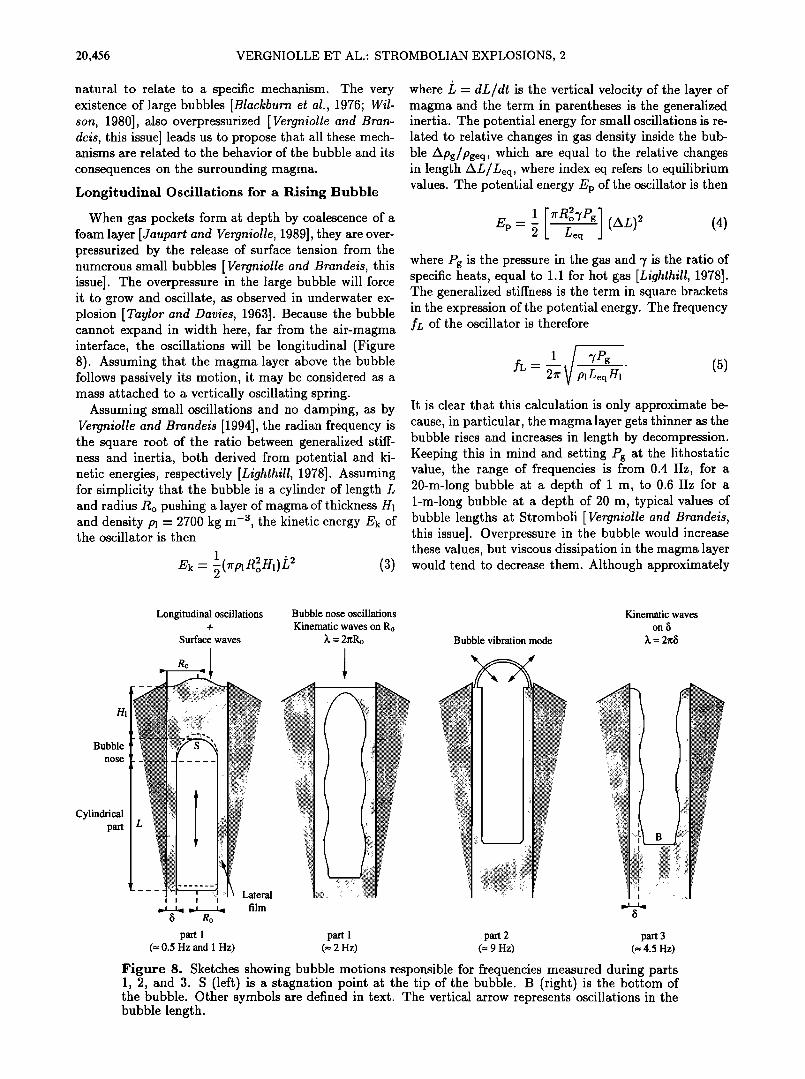
part I part 1 part 2 part 3 (-- 0.5 Hz and 1 Hz) (-- 2 Hz) (-- 9 Hz) (= 4.5 Hz)
Figure 8. Sketches showing bubble motions responsible for frequencies measured during parts 1, 2, and 3. S (left) is a stagnation point at the tip of the bubble. B (right) is the bottom of the bubble. Other symbols are defined in text. The vertical arrow represents oscillations in the bubble length.
VERGNIOLLE ET AL.' STROMBOLIAN EXPLOSIONS, 2 20,457
modeled, these longitudinal oscillations might explain the • 0.5-Hz intermittency revealed by the spectrogram before the onset of explosion (Figure 4).
Kinematic Waves at the Nose of a Rising Bubble
We have considered so far that although its length could vary, the bubble kept a simple shape. Periodic changes in the bubble shape due to its overpressure [Vergniolle and Brandeis, this issue] could be the source of vibrations in the overlying magma layer and therefore be at the origin of fluctuations in the acoustic pressure in air. Two types of such changes in shape can be en- visaged, one located at the nose and one on the sides of the bubble (Figure 8), each corresponding to a partic- ular frequency.
When the overpressurised bubble arrives at shallow depths, the pressure difference between the top and the base of its cap becomes comparable to the general pres- sure field. This may force the tip of the bubble (S on Figure 8) to rise faster than the base of the cap, giving a pointy aspect to the bubble. The increase in length of the bubble nose will increase the downward veloc-
ity of the magma around the bubble and decrease the thickness of the lateral film (Figures 8 and 9) [Batch- elor, 1967]. This will lead to an increase in dynamical pressure at the tip, thus forcing the nose to become fiat again. Oscillations of the bubble shape will ensue, gen- erating variations in thickness of the lateral film with the same frequency and wavelength as in the bubble nose.
Oscillations of the nose can then be understood as
waves propagating at the gas-magma interface. Be- cause magma is draining downward around the nose,
the propagation of these waves is controlled by the drainage velocity. Assuming that drainage is laminar in a layer of thickness •, Vdr is equal to
Vdr- plg?----•' (6) 3y
For a viscous slug flow in a conduit of I m [C honer et al., 1974], • is of the order of a few tens of centimeters. With a viscosity of a few hundreds pascal seconds, the Reynolds number in the lateral film is of the order of 10, small enough to justify our assumption of a laminar flow. Treating the magma around the bubble nose as a thin film, the velocity V• of these kinematic waves, which occur in systems where momentum can be ne- glected [Wallis, 1969; Whitham, 1973], is
Vw - 3Vdr (7)
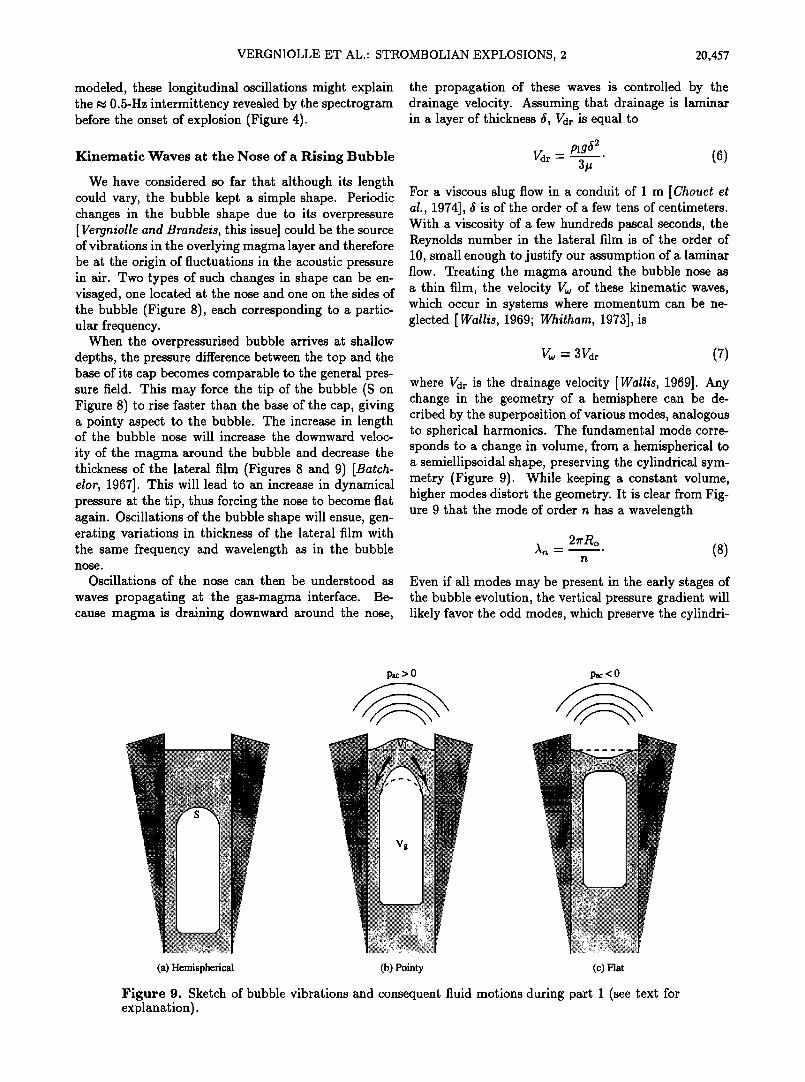
where Vdr is the drainage velocity [Wallis, 1969]. Any change in the geometry of a hemisphere can be de- cribed by the superposition of various modes, analogous to spherical harmonics. The fundamental mode corre- sponds to a change in volume, from a hemispherical to a semiellipsoidal shape, preserving the cylindrical sym- metry (Figure 9). While keeping a constant volume, higher modes distort the geometry. It is clear from Fig- ure 9 that the mode of order n has a wavelength
2•cRo = (8)
n
Even if all modes may be present in the early stages of the bubble evolution, the vertical pressure gradient will likely favor the odd modes, which preserve the cylindri-
Pac > 0 Pac < 0
(a) Hemispherical (b) Pointy (c) Flat
Figure 9. Sketch of bubble vibrations and consequent fluid motions during part I (see text for explanation).
20,458 VERGNIOLLE ET AL.' STROMBOLIAN EXPLOSIONS, 2
cal symmetry, at the expense of the even modes which break the cylindrical symmetry. Combining equations (6), (7), and (8) gives the frequency of mode n
nplg• 2 f.o = (o)
2•rpRo
with n being odd, as explained above. This relation shows that f•Ro depends on the viscosity of the magma and of the film thickness • which are not precisely known. For a bubble far from the interface, the mini- mum thickness of the lateral film in a slug flow, called the asymptotic thickness [Batchelor, 1967], is given by
dc• - 0.9Ro (p• R•og) ß (10) Setting d - do• in equation (9) and eliminating doo be- tween equations (9) and (10) gives
fnRo -- [(0'9)6n3 Plg2] « ' 8•ra P (11) Equation (11) shows that the m 2-Hz frequency can be generated by the fundamental mode (n - 1) for a vis- cosity of 100 Pa s, and by the third mode (n - 3) for a viscosity of 2700 Pa s, much higher than any esti- mate at Stromboli (see above). Considering that the asymptotic thickness is seldom achieved, even for long bubbles [Fabre and Linn4, 1992], the viscosity of 100 Pa s is certainly a lower bound in our framework, al- though it is the accepted value at Stromboli [Blackburn et al., 1976]. Therefore we can exclude that the m 2-Hz frequency is generated by the third order mode. Con- sidering the same value for the viscosity, the third mode has a frequency of 54 Hz, which is not observed as an energetic mode in our acoustic records (Figures 5b, 6c, 74, and 7b). The frequency of m 2 Hz recorded in part i of acoustic pressure is therefore compatible with os- cillations of the nose of the rising bubble. It remains to be shown that oscillations of the bubble nose can be
transmitted as sound waves propagating in air when the bubble approaches the air-magma interface.
Acoustic Coupling of the Bubble Nose Oscillation for a Rising Bubble
The magma above the rising bubble being incom- pressible for low frequencies, any change in bubble vol- ume, due to its overpressure [Vergniolle and Brandeis, this issue], is transmitted as a motion of the nearby air-magma interface with the same frequency: while in expansion the pointy bubble distorts the interface up- ward, during contraction the fiat bubble pulls the free surface of magma downwards (Figures 8 and 9). At the same time, the lateral film is thinner for a pointy bubble, which enhances drainage around the bubble, and thicker for a fiat bubble as shown for potential flow [Batchelor, 1967]. However, the variations in thick-
ness of the lateral film produced by the change between pointy and fiat do not affect significantly the nearby air- magma interface. Here, we propose that changes in the shape of the air-magma interface around its fiat equilib- rium value are capable of producing sound waves. The volume Vi of the radiating body at time t is the space delimitated on one side by the fiat interface at equi- librium and on the other side by its surface at time t (Figure 9): this volume • is zero for equilibrium, i.e., a fiat interface, positive when the interface is above its equilibrium value and negative when it is below. These changes in volume around the air-magma interface ra- diate sound waves like a monopole source but in half a sphere of radius r, distance between the vent and the microphone. The excess in acoustic pressure Pa½- Pair at time t is [Lighthill, 1978]
d 2
Pac - Pair -dt 2 [•v•(t - r/c)] Pair (12) where Pair is air density (1.1 kg m -3 at 900 m above sea level [Batchelor, 1967]), c is the sound speed at the same elevation (340 m s -• [Lighthill, 1978]), and Pair is the atmospheric pressure, .• 105 Pa. Because the magma is incompressible, all changes in the bubble volume Vg are entirely transmitted to changes in volume around the interface Vi, which gives
(t- - 2 2
= 4•r Vg•qf,•noAsin(wt + 4)) (13)
when assuming small oscillations of amplitude A, fre- quency f. no and phase 4 for the bubble volume Vg and where indices eq and g stand for equilibrium values and gas, respectively. When the bubble is at its minimum volume, Vg - Vgeq- AV, its internal pressure is maxi- mum, Pg - Pgeq + Ap, where AP is the bubble over- pressure, here assumed constant. It gives A- A V/Vgeq and the maximum excess pressure PthRo becomes
2/rPairA 2 V f.l•o PthRo ---- ß (14)
Assuming that the bubble nose oscillation is the only mode present before the onset of explosion (Figures 5b and 5c), variations in bubble volume AV are related to variations in pressure AP through the adiabatic law by
Pg•qVg•q - (Pg•q + AP)(Vg•q- AV) •. (15) Because the deformations of the bubble nose occur at a
velocity 3 times higher than the drainage in the lateral film (equation (7)), the latter can be neglected on the average during one cycle of vibration. The equilibrium pressure in the bubble Pgeq is simply the weight of the overlying magma of thickness Hi. If we assume that the rise speed of the bubble Ub is also constant on the average over one cycle, • 1.55 m s- • for a tube of 2 m
VERGNIOLLE ET AL.: STROMBOLIAN EXPLOSIONS, 2 20,459
in diameter [Wallis, 1969], the pressure in the bubble Pg varies in time as
Pgeq - plg(Zlo -- Vbt) q- Fair (16)
where Hlo is the thickness of the magma layer of density pl at time t = 0 and Pair the atmospheric pressure m 10 * Pa.
The maximum amplitude radiated by the bubble nose oscillations in part i of acoustic pressure can be calcu- lated from equation (14) for the 36 explosions. Taking estimates of bubble radius, length and overpressure de- termined from the bubble vibration mode [Vergniolle and Brandeis, this issue], and the average value of 2 Hz as the frequency of the bubble nose oscillations (Fig- ures 5b and 5c), we obtain a theoretical value of a few tenths of a pascal (0.36 + 0.30 Pa), the same order of magnitude as for measured amplitudes, 0.16 -4- 0.09 Pa (Figure 6b).
The theoretical amplitude is slightly larger than the measured one, but our calculations rely on several as- sumptions. First, we have assumed for simplicity that the entire bubble overpressure triggers oscillations in the bubble nose. However, the bubble overpressure could also excite regular variations in the bubble length, a mode of very low frequency, • 0.5 Hz. Therefore this latter mode can remove some of the energy driving the oscillations of the bubble nose at m 2 Hz. Second, the viscosity of magma above the bubble might add another significant source of energy dissipation. Hence we sug- gest that the oscillation of the bubble nose is the main mechanism present during the rise of the bubble, part i of acoustic pressure, although it may be sometimes partially weakened by a different process such as the oscillations of the bubble length.
Surface Waves at the Air-Magma Interface
Finally, the last mechanism that can be envisionned during the last stage of the bubble ascent toward the top of the magma column is the deformation at the surface of the nearby air-magma interface. More generally, the motion of the air-magma interface can be described as the superposition of a global up-and-down motion and more complex deformations which can be interpreted as surface gravity waves, in a way analogous to sloshing in a cylindrical container. Two types of motion occur, one with pure radial dependence and one with angu- lar dependence [Paterson, 1983]. When the depth of the container is larger than two thirds of its radius and assuming a potential flow, the frequency fg is
1
fg - •-•V• (17) where k is the wavenumber and g is the acceleration of gravity [Paterson, 1983]. If Rc is the radius of the container, the first radial modes have a wavenumber such that kRc/•r = 1.2197, 2.2330, 3.2383... [Paterson, 1983]. For a tube of radius equal to i rn as for an
average explosion [Vergniolle and Brandeis, this issue], corresponding frequencies are 0.98 Hz, 1.32 Hz, 1.59 Hz .... For angular modes, the wavenumber k is such that kRc/•r = 0.586, 1.697, 2.717..., giving frequencies of 0.68 Hz, 1.2 Hz, 1.5 Hz ... [Paterson, 1983]. Al- though difficult to quantify, the effect of viscosity in the magma layer would be to lower these values. This wide range of frequencies show that the conduit does not filter out the low frequencies generated by the bub- ble below. Furthermore, if the • 2 Hz value is related to sloshing, it has to be an harmonic of either • 0.98 Hz or • 0.68 Hz. In this case, we would expect the fundamental to have more energy than the harmonic, which is not what we observe.
Therefore in acoustic pressure, part i is a superposi- tion of the three mechanisms described above and gen- erated by the rising bubble: probably the oscillation of the bubble length (• 0.5 Hz), almost certainly the os- cillations of the bubble nose (• 2 Hz), and probably some of the sloshing modes (• I Hz). During the bub- ble rise at the vicinity of the surface, the oscillations of the bubble nose are driven by the overpressure; hence the • 2 Hz is the most energetic mode in part 1. Fur- thermore, we have shown that its acoustic intensity is a significant measurement and that its amplitude can be theoretically reproduced.
Bubble Vibration Mode
As the bubble keeps rising, the magma layer above it gets thinner, to a point where the bubble can rise above the tube (Figure 8). There, strong radial motions of the bubble cap become possible, generating a new set of frequencies (Figures 6c and 6d), which are recorded in part 2. By fitting the waveform of the same 36 ex- plosions [Vergniolle and Brandeis, this issue], we could constrain the bubble radius, the bubble length, and the internal overpressure to be 0.9 -4- 0.3 m, 7.3-4- 3.0 m, and 2.0 q- 1.8 x 10⁵ Pa, respectively.
Kinematic Waves of the Lateral Film Thickness
After Bubble Bursting
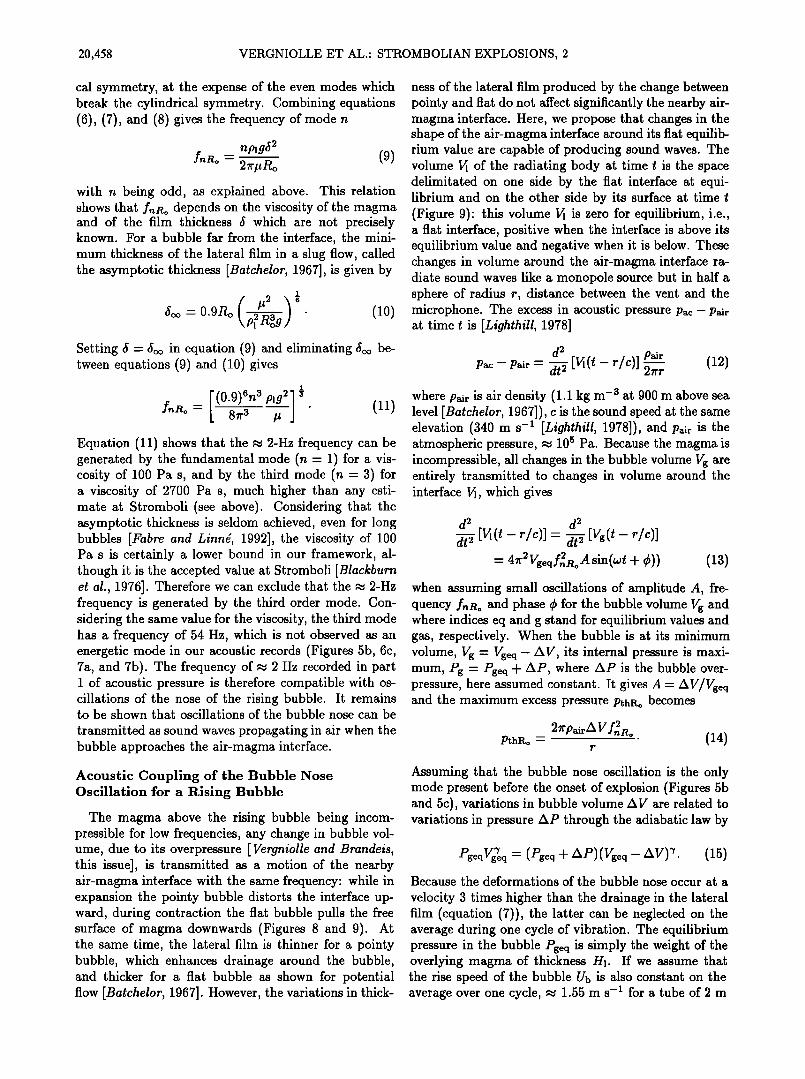
After the bubble has burst, most of the lateral film of magma remains in the conduit, as shown from the volume of ejecta [Vergniolle and Brandeis, this issue]. Then, the film of magma is drained down into the tube (Figure 10), as observed also in basaltic eruptions at Hawaii [Swanson et al., 1971]. It is well known that except at really small Reynolds numbers, waves can de- velop at the surface of a thin vertical film [Wallis, 1969; Whitham, 1973]. Kinematic waves occur in fluids where gravity is balanced by drag forces, here due to the vis- cosity of the magma [Wallis, 1969; Whitham, 1973], as shown in laboratory experiments (Figure 10). Since the Reynolds number in the lateral film is of the order of 10 (see above), kinematic waves are likely to develop along the volcanic conduit at Stromboll. Here we propose that' they are a possible source for the • 4.5 Hz frequency
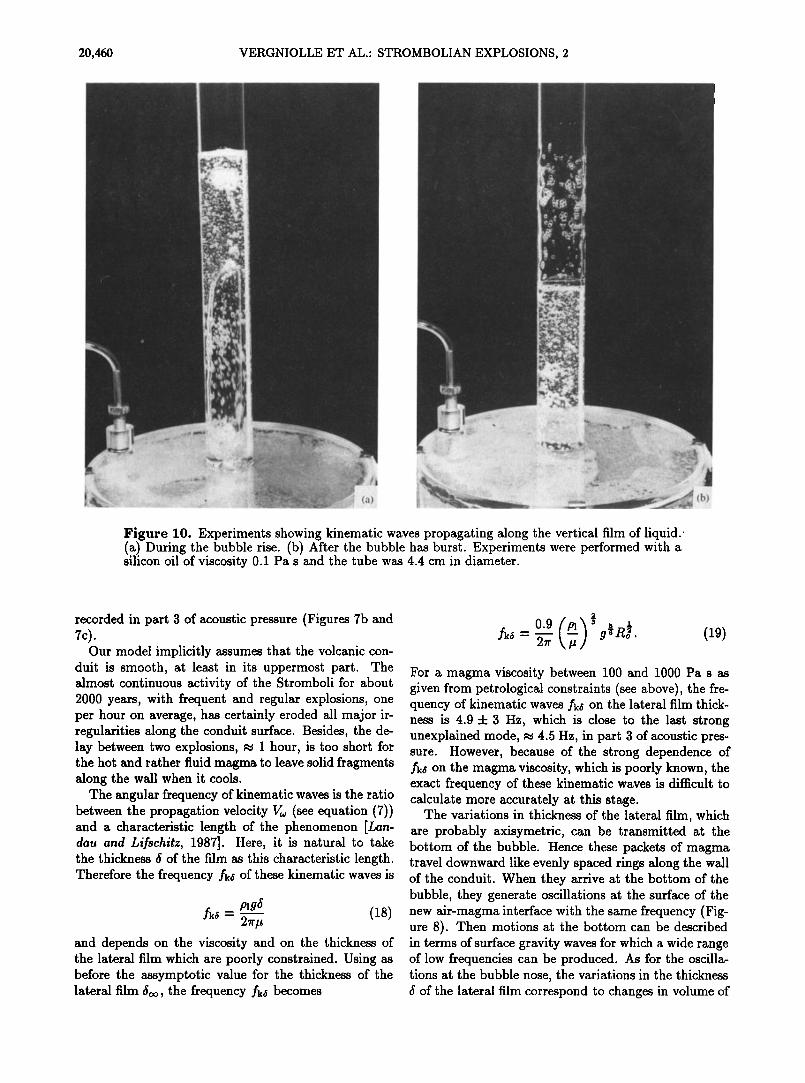
20,460 VERGNIOLLE ET AL.- STROMBOLIAN EXPLOSIONS, 2
Figure 10. Experiments showing kinematic waves propagating along the vertical film of liquid.' (a) During the bubble rise. (b) After the bubble has burst. Experiments were performed with a silicon oil of viscosity 0.1 Pa s and the tube was 4.4 cm in diameter.
recorded in part 3 of acoustic pressure (Figures 7b and
Our model implicitly assumes that the volcanic con- duit is smooth, at least in its uppermost part. The almost continuous activity of the Stromboli for about 2000 years, with frequent and regular explosions, one per hour on average, has certainly eroded all major ir- regularities along the conduit surface. Besides, the de- lay between two explosions, • i hour, is too short for the hot and rather fluid magma to leave solid fragments along the wall when it cools.
The angular frequency of kinematic waves is the ratio between the propagation velocity V•o (see equation (7)) and a characteristic length of the phenomenon [Lan- dau and Lifschitz, 1987]. Here, it is natural to take the thickness • of the film as this characteristic length. Therefore the frequency fk5 of these kinematic waves is
pig5 /ks - 2-•y (18)
and depends on the viscosity and on the thickness of the lateral film which are poorly constrained. Using as before the assymptotic value for the thickness of the lateral film •oo, the frequency fk• becomes
(19) For a magma viscosity between 100 and 1000 Pa s as given from petrological constraints (see above), the fre- quency of kinematic waves fk, on the lateral film thick- ness is 4.9 :b 3 Hz, which is close to the last strong unexplained mode, m 4.5 Hz, in part 3 of acoustic pres- sure. However, because of the strong dependence of fk, on the magma viscosity, which is poorly known, the exact frequency of these kinematic waves is difficult to calculate more accurately at this stage.
The variations in thickness of the lateral film, which are probably axisymetric, can be transmitted at the bottom of the bubble. Hence these packets of magma travel downward like evenly spaced rings along the wall of the conduit. When they arrive at the bottom of the bubble, they generate oscillations at the surface of the new air-magma interface with the same frequency (Fig- ure 8). Then motions at the bottom can be described in terms of surface gravity waves for which a wide range of low frequencies can be produced. As for the oscilla- tions at the bubble nose, the variations in the thickness • of the lateral film correspond to changes in volume of
VERGNIOLLE ET AL.' STROMBOLIAN EXPLOSIONS, 2 20,461
the new air-magma interface around its flat equilibrium position at the bottom of the bubble. Hence as for the bubble nose oscillation, the excess in acoustic pressure is related to the second time derivative of the volume
of the lateral film and is a monopole source (equation (12)). Assuming small oscillations in the thickness of the lateral film around its equilibrium value 5o, 5 be- comes
• - •o [1 + A sin(2rrfk• t + •b)] (20) where A is the normalized amplitude and •b is the phase. The variation in the elementary volume of liquid dVi, is
dVi, = dt
where the velocity of these kinematic waves is V• - 2•f•, • (equation (7)) and giving
dt • [•5] - 16•aARoS• f•, [-cos(2•f•,t + •)]. (22) As before (equation (12)), the maximum excess pressure Pth5 becomes
8 •2 Pair •o 5• A f•5 (23) Pth5 -- ß
Because the conditions on the lateral film when the bub-
ble bursts are difficult to estimate, we cannot predict the amplitude A of these waves, except that they are probably small. Taking arbitrarily A - 0.3, 5o - 0.6Ro as predicted by theory [Wallis, 1969] and setting fk, • 4.5 Hz, the theoretical amplitude of these waves is 0.60 Pa for the average bubble radius Ro - 0.9 m [Vewniolle and Brandeis, this issue]. This is in very good agree- ment with the measured amplitude, 0.62 • 0.35 Pa (Ta- ble 1). Therefore the mode at m 4.5 Hz recorded in part 3 of acoustic pressure could be generated by kinematic waves of the lateral film thickness, and these waves are able to radiate sound at the measured levels. The
presence of the m 4.5-Hz frequency during part 1, al- beit with an extremely low amplitude (Figure 5b), and which could not be explained by an harmonic of the bubble nose oscillations, suggests that this mechanism was already at work during the last stage of the bubble rise.
Application to Stromboli Unlike for the m 2-Hz mode, the strong dependence
between magma viscosity and the frequency of kine- matic waves on the lateral film thickness (equation (19)) has prevented us to show that they correspond to the m 4.5-Hz mode recorded in part 3 of acoustic pressure, although we obtain a good order of magnitude for its amplitude. In the following, we reinforce this interpre- tation and show how to constrain independently the magma viscosity and the thickness of the lateral film.
Determination of Viscosity
The most energetic frequencies in parts i and 3 are 2.8 q- 1.5 Hz and 5.7 q-2.4 Hz, respectively (Figures 5c
and 7c). These modes show a wide scattering which may be interpreted in two different ways. The first one is to consider that all dominant frequencies are due to the same mechanism, oscillations of order 1 of the bubble nose and kinematic waves in part 3. The dis- persion in frequencies would simply reflect a spread in contributing parameters, namely, bubble radius and vis- cosity. The distribution in time delays between the two microphones (Figure 3c) has indeed suggested that sev- eral vents are active within the eastern crater and there
is no reason to think that all vents have identical radii. For a well-developed slug flow in which the flow
within the lateral film around the bubble is laminar, the theoretical thickness 5 of the lateral film is shown to be
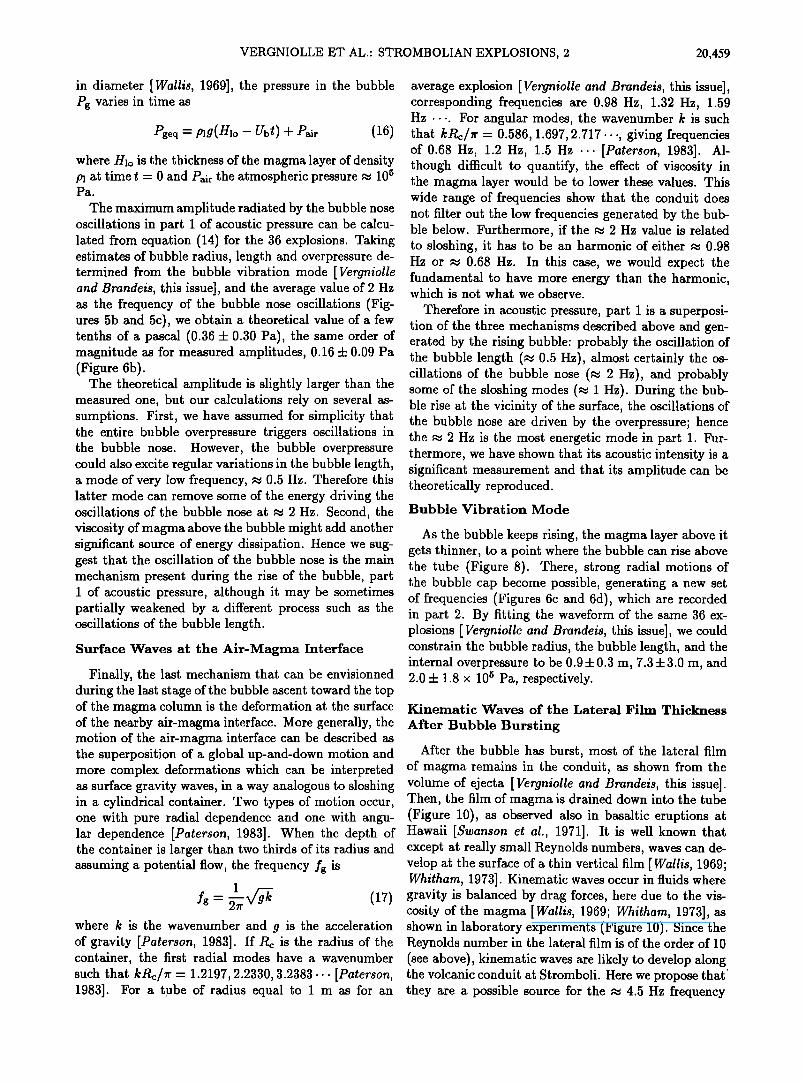
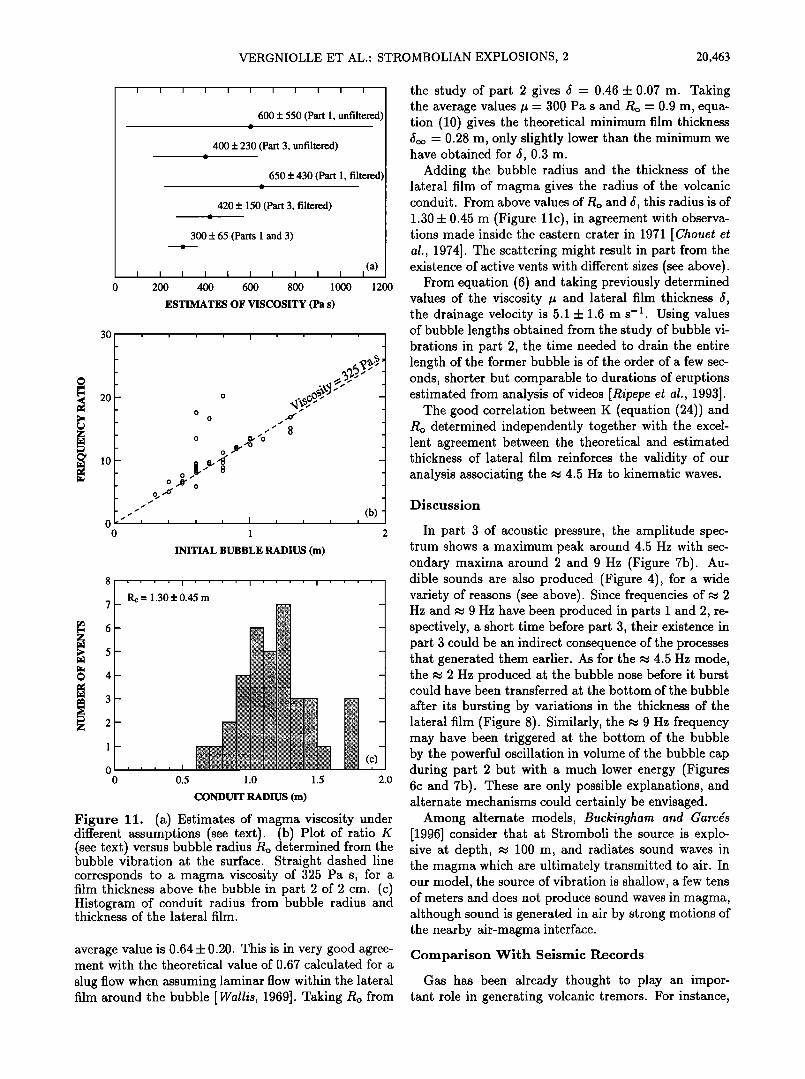
0.6 times the bubble radius [Wallis, 1969]. Taking esti- mates of the bubble radius given for each explosion by the bubble vibration mode during part 2 (Table 1), the 2.8 4- 1.5 Hz frequency of part 1 (Figure 5c) constrains the viscosity to be 600 4- 550 Pa s (Figure l 1 a), from equation (9). Similarly, the 5.7 4- 2.4 Hz frequency in part 3 gives, from equation (18), a viscosity of 4004-230 Pa s (Figure l 1 a). The range of viscosities compatible for both parts 1 and 3 is thus 4004-230 Pa s (Figure 1 la) if ones takes the most energetic frequencies in parts 1 and 3 as due to oscillations of the bubble nose and to
kinematic waves on the lateral film respectively. The second way to interprete the scattering in fre-
quencies (Figures 5c and 7c) is to consider that it results from the superposition of frequencies generated by at least two different mechanisms, as suggested by the am- plitude spectrum of explosion 95 (Figures 5b and 7b). All explosions, except four, show two significant peaks of spectral amplitude during part 1 (Table 1). Guided by the example of explosion 95, we have selected the fre- quency that is closest to 2 Hz. For 26 explosions among 36, this frequency has the highest spectral amplitude (Table 1). This reduces the scattering to 2.2 4- 0.8 Hz. From equation (9) and again taking 5 = 0.6 Ro for each explosion [Wallis, 1969], the corresponding viscosity is of 650 4- 430 Pa s (Figure 11a).
In part 3, all explosions show three peaks in which the mode at m 2 Hz is dominant for three explosions and the mode at m 9 Hz for 10 explosions (Figure 7c and Table 1). For the remainding 23 explosions, the frequency of ..• 4.5 Hz is the most energetic and for 12 others, it is among the three most energetic but not far from the maximum (Table 1). When selecting the mode closest to m 4.5 Hz as representative of the kinematic waves, an average frequency of 4.5 4- 0.5 Hz is obtained. From equation (18), and again taking 5 = 0.6 Ro for each explosion, the viscosity is 420 4- 150 Pa s (Figure 11a), well within the range of values derived from part 1. Comparison between the different values of viscosity shows that the values derived from kinematic waves are
better constrained and that the filtering of frequencies does not change much the viscosity. A range of 4204-150 Pa s would reconcile all interpretations in parts 1 and 3.
20,462 VERGNIOLLE ET AL.: STROMBOLIAN EXPLOSIONS, 2
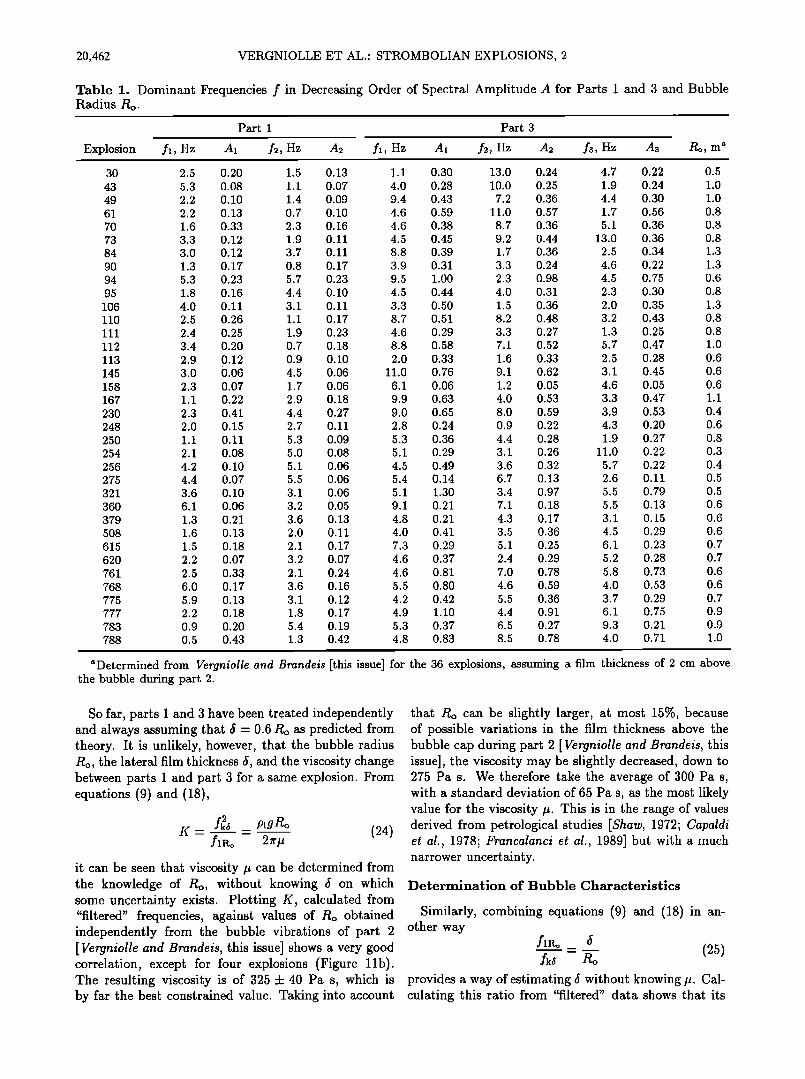
Table 1. Dominant Frequencies f in Decreasing Order of Spectral Amplitude A for Parts 1 and 3 and Bubble Radius Ro.
Part 1 Part 3
Explosion f•, Hz A• f2, Hz A2 f•, Hz A• f2, Hz A2 rs, Hz As Ro, m a
30 2.5 0.20 1.5 0.13 1.1 0.30 13.0 0.24 4.7 0.22 0.5 43 5.3 0.08 1.1 0.07 4.0 0.28 10.0 0.25 1.9 0.24 1.0 49 2.2 0.10 1.4 0.09 9.4 0.43 7.2 0.36 4.4 0.30 1.0 61 2.2 0.13 0.7 0.10 4.6 0.59 11.0 0.57 1.7 0.56 0.8 70 1.6 0.33 2.3 0.16 4.6 0.38 8.7 0.36 5.1 0.36 0.8 73 3.3 0.12 1.9 0.11 4.5 0.45 9.2 0.44 13.0 0.36 0.8 84 3.0 0.12 3.7 0.11 8.8 0.39 1.7 0.36 2.5 0.34 1.3 90 1.3 0.17 0.8 0.17 3.9 0.31 3.3 0.24 4.6 0.22 1.3 94 5.3 0.23 5.7 0.23 9.5 1.00 2.3 0.98 4.5 0.75 0.6 95 1.8 0.16 4.4 0.10 4.5 0.44 4.0 0.31 2.3 0.30 0.8 106 4.0 0.11 3.1 0.11 3.3 0.50 1.5 0.36 2.0 0.35 1.3 110 2.5 0.26 1.1 0.17 8.7 0.51 8.2 0.48 3.2 0.43 0.8 111 2.4 0.25 1.9 0.23 4.6 0.29 3.3 0.27 1.3 0.25 0.8 112 3.4 0.20 0.7 0.18 8.8 0.58 7.1 0.52 5.7 0.47 1.0 113 2.9 0.12 0.9 0.10 2.0 0.33 1.6 0.33 2.5 0.28 0.6 145 3.0 0.06 4.5 0.06 11.0 0.76 9.1 0.62 3.1 0.45 0.6 158 2.3 0.07 1.7 0.06 6.1 0.06 1.2 0.05 4.6 0.05 0.6 167 1.1 0.22 2.9 0.18 9.9 0.63 4.0 0.53 3.3 0.47 1.1 230 2.3 0.41 4.4 0.27 9.0 0.65 8.0 0.59 3.9 0.53 0.4 248 2.0 0.15 2.7 0.11 2.8 0.24 0.9 0.22 4.3 0.20 0.6 250 1.1 0.11 5.3 0.09 5.3 0.36 4.4 0.28 1.9 0.27 0.8 254 2.1 0.08 5.0 0.08 5.1 0.29 3.1 0.26 11.0 0.22 0.3 256 4.2 0.10 5.1 0.06 4.5 0.49 3.6 0.32 5.7 0.22 0.4 275 4.4 0.07 5.5 0.06 5.4 0.14 6.7 0.13 2.6 0.11 0.5 321 3.6 0.10 3.1 0.06 5.1 1.30 3.4 0.97 5.5 0.79 0.5 360 6.1 0.06 3.2 0.05 9.1 0.21 7.1 0.18 5.5 0.13 0.6 379 1.3 0.21 3.6 0.13 4.8 0.21 4.3 0.17 3.1 0.15 0.6 508 1.6 0.13 2.0 0.11 4.0 0.41 3.5 0.36 4.5 0.29 0.6 615 1.5 0.18 2.1 0.17 7.3 0.29 5.1 0.25 6.1 0.23 0.7 620 2.2 0.07 3.2 0.07 4.6 0.37 2.4 0.29 5.2 0.28 0.7 761 2.5 0.33 2.1 0.24 4.6 0.81 7.0 0.78 5.8 0.73 0.6 768 6.0 0.17 3.6 0.16 5.5 0.80 4.6 0.59 4.0 0.53 0.6 775 5.9 0.13 3.1 0.12 4.2 0.42 5.5 0.36 3.7 0.29 0.7 777 2.2 0.18 1.8 0.17 4.9 1.10 4.4 0.91 6.1 0.75 0.9 783 0.9 0.20 5.4 0.19 5.3 0.37 6.5 0.27 9.3 0.21 0.9 788 0.5 0.43 1.3 0.42 4.8 0.83 8.5 0.78 4.0 0.71 1.0
a Determined from Vergniolle and Brandeis [this issue] for the 36 explosions, assuming a film thickness of 2 cm above the bubble during part 2.
So far, parts 1 and 3 have been treated independently and always assuming that • = 0.6 Ro as predicted from theory. It is unlikely, however, that the bubble radius Ro, the lateral film thickness •, and the viscosity change between parts i and part 3 for a same explosion. From equations (9) and (18),
K- f•5 = plgRo (24) f•ao 2rrt•
it can be seen that viscosity tt can be determined from the knowledge of Ro, without knowing • on which some uncertainty exists. Plotting K, calculated from "filtered" frequencies, against values of Ro obtained independently from the bubble vibrations of part 2 [Vergniolle and Brandeis, this issue] shows a very good correlation, except for four explosions (Figure 11b). The resulting viscosity is of 325 4- 40 Pa s, which is by far the best constrained value. Taking into account
that Ro can be slightly larger, at most 15%, because of possible variations in the film thickness above the bubble cap during part 2 [Vergniolle and Brandeis, this issue], the viscosity may be slightly decreased, down to 275 Pa s. We therefore take the average of 300 Pa s, with a standard deviation of 65 Pa s, as the most likely value for the viscosity it. This is in the range of values derived from petrological studies [Shaw, 1972; Capaldi et al., 1978; Francalanci et al., 1989] but with a much narrower uncertainty.
Determination of Bubble Characteristics
Similarly, combining equations (9) and (18)in an- other way
fao 5 =
provides a way of estimating 5 without knowing it. Cal- culating this ratio from "filtered" data shows that its
VERGNIOLLE ET AL.' STROMBOLIAN EXPLOSIONS, 2 20,463
600 + 550 (Part 1, unfiltered)
400 + 230 (Part 3, unfiltered)
650 + 430 (Part 1, filtered)
420 + 150 (Part 3, filtered)
300 + 65 (Parts 1 and 3)
(a)
200 400 600 800 1000 1200
ESTIMATES OF VISCOSITY (Pa s)
3O
20
10
i i i I i i i i
o
O/•' O o•-
8
0 , • , • I , 0 1
INITIAL BUBBLE RADIUS (m)
(b) i i
2
Rc = 1.30 + 0.45 m -- •:•:•:•:•:•:•:•:....• -
.........
7
• 4
m 3
1
0 0 0.5 1.0 1.5 2.0
CONDUIT RADIUS (m)
Figure 11. (a) Estimates of magma viscosity under different assumptions (see text). (b) Plot of ratio Ixf (see text) versus bubble radius Ro determined from the bubble vibration at the surface. Straight dashed line corresponds to a magma viscosity of 325 Pa s, for a film thickness above the bubble in part 2 of 2 cm. (c) Histogram of conduit radius from bubble radius and thickness of the lateral film.
average value is 0.64-t-0.20. This is in very good agree- ment with the theoretical value of 0.67 calculated for a
slug flow when assuming laminar flow within the lateral film around the bubble [Wallis, 1969]. Taking Ro from
the study of part 2 gives 6 - 0.46 q-0.07 m. Taking the average values it - 300 Pa s and Ro - 0.9 m, equa- tion (10) gives the theoretical minimum film thickness •oo - 0.28 m, only slightly lower than the minimum we have obtained for •, 0.3 m.
Adding the bubble radius and the thickness of the lateral film of magma gives the radius of the volcanic conduit. From above values of Ro and •, this radius is of 1.30 q- 0.45 m (Figure 11c), in agreement with observa- tions made inside the eastern crater in 1971 [Chouet et al., 1974]. The scattering might result in part from the existence of active vents with different sizes (see above).
From equation (6) and taking previously determined values of the viscosity it and lateral film thickness •, the drainage velocity is 5.1 q- 1.6 m s -1. Using values of bubble lengths obtained from the study of bubble vi- brations in part 2, the time needed to drain the entire length of the former bubble is of the order of a few sec- onds, shorter but comparable to durations of eruptions estimated from analysis of videos [Ripepe et al., 1993].
The good correlation between K (equation (24)) and Ro determined independently together with the excel- lent agreement between the theoretical and estimated thickness of lateral film reinforces the validity of our analysis associating the m 4.5 Hz to kinematic waves.
Discussion
In part 3 of acoustic pressure, the amplitude spec- trum shows a maximum peak around 4.5 Hz with sec- ondary maxima around 2 and 9 Hz (Figure 7b). Au- dible sounds are also produced (Figure 4), for a wide variety of reasons (see above). Since frequencies of m 2 Hz and m 9 Hz have been produced in parts 1 and 2, re- spectively, a short time before part 3, their existence in part 3 could be an indirect consequence of the processes that generated them earlier. As for the m 4.5 Hz mode, the m 2 Hz produced at the bubble nose before it burst could have been transferred at the bottom of the bubble
after its bursting by variations in the thickness of the lateral film (Figure 8). Similarly, the m 9 Hz frequency may have been triggered at the bottom of the bubble by the powerful oscillation in volume of the bubble cap during part 2 but with a much lower energy (Figures 6c and 7b). These are only possible explanations, and alternate mechanisms could certainly be envisaged.
Among alternate models, Buckingham and Garc•s [1996] consider that at Stromboli the source is explo- sive at depth, m 100 m, and radiates sound waves in the magma which are ultimately transmitted to air. In our model, the source of vibration is shallow, a few tens of meters and does not produce sound waves in magma, although sound is generated in air by strong motions of the nearby air-magma interface.
Comparison With Seismic Records
Gas has been already thought to play an impor- tant role in generating volcanic tremors. For instance,
20,464 VERGNIOLLE ET AL.: STROMBOLIAN EXPLOSIONS, 2
Chouet [1985] suggests that an hemispherical cavity filled with gas can trigger oscillations in a buried mag- matic pipe and produce tremors. At Hawaii, it was shown for long-period seismic events that tremors and gas-piston events have a similar source [Ferrazzini and Aki, 1992]. Recent coupled measurements of infrasonic waves with seismic waves between the explosions show that the two waves are strongly coupled [Ripepe et al., 1996]. Consequently, Ripepe et al., [1996] attribute the tremor at Stromboll to the regular bursting, approxi- mately each second, of bubbles at the top of the mag- matic column. However, during explosions, the bubble vibration mode at • 9 Hz during part 2 does not appear on seismic records, although it is the most energetic on acoustic records (Figures 5d and 6c). The most likely reason is that there is no coupling between the source (i.e., the bubble cap oscillating in air) and the solid walls beneath. The proximity of these two seismic frequen- cies 1.9 and 3.8 Hz observed during explosion quakes and reproduced from Dietel et al. [1994] (Figure 5d) with those near 2 Hz and 4.5 Hz observed on acous-
tic records (Figure 5b) leads us to suggest that these seismic waves could be produced by the oscillation of the bubble nose when the bubble is at shallow depths and by kinematic waves along the lateral film along the conduit during part 1.
It remains to be shown that the oscillations of the
bubble nose, • 2 Hz, contain enough energy to be de- tected on seismic records. Assuming that the amplitude of these oscillations scales as the size of the bubble nose
(• I m) and taking a bubble length of several meters, the average pressure variation in the bubble is about 25% of the mean pressure, m 2.0x 10⁵ Pa [ Vergniolle and Brandeis, this issue], therefore on the order of 5 x 10⁴ Pa. From measurements of deformation at Campi Fle- grei, an active volcanic site like Stromboll, the Young modulus E is estimated to be 4 x 10¹⁰ Pa [Russo et al., 1996]. The pressure variation of 5 x 10⁴ Pa will gener- ate deformations above 10 -6. For a P wave velocity of 1600 m s -1 at Stromboli [Braun and Ripepe, 1993], the wavelength is 800 m for a frequency of 2 Hz. The cor- responding displacement u is equal to 10 -3 m. Because attenuation is inversely proportional to the distance, at 300 m away from the source (assumed to be i m in radius), the displacement is equal to 3 x 10 -6 m, still above the typical detection threshold of a seismometer and above the ground noise, 10 -6 m, at the noisiest fre- quency of 0.15 Hz [Aki and Richards, 1980]. The same explanation could hold for the • 4.5 Hz frequency, al- though the exact coupling between waves along the con- duit and seismic waves in the volcanic edifice is not fully established.
Conclusion
In this paper and its companion [ Vergniolle and Bran- deis, this issue], we have proposed to relate variations in acoustic pressure at Stromboli to the behavior of a large bubble rising in the volcanic conduit and breaking
at the air-magma interface. We have identified three phases on acoustic pressure records and related each phase to a specific type of oscillations. The first part of the signal is mostly due to oscillations of the bubble nose, at • 2 Hz, when it is approaching the surface and one could "hear" a bubble travelling in the uppermost 30 m of the magma column. The second part, the most energetic, is due to the vibration of this bubble at the interface, at • 9 Hz. After the bubble bursts, kine- matic waves develop along the vertical film of magma draining on the conduit walls and generate frequencies of • 4.5 Hz.
Our interpretation is based on reasonable mecha- nisms, bubble vibrations and slug flow, which have been observed and studied before. Hence we have been able
to derive some physical characteristics of the magma and the conduit. From the bubble vibration during part 2, we have constrained the bubble radius to be of the order of 0.9 m, compatible with independent determina- tions. From this value we have estimated the thickness
of the lateral film of magma to be 0.46 q-0.07 m, in excellent agreement with theoretical studies of viscous slug flow. We also have obtained a robust constraint on the magma viscosity by combining results. From the spectral analysis of parts 1 and 3 and modeling of the bubble vibration mode, we have obtained a viscosity of 300 4-65 Pa s, in agreement with petrological modeling but in a much narrower range.
The fact that the • 2 Hz and • 4.5 Hz frequencies are observed both on acoustic and seismic records leads
us to propose that bubble vibrations could be a source of seismicity as well as airborne sound. Combining seis- mic and acoustic measurements would certainly help to distinguish shallow sources, linked to degassing phe- nomena, from deeper events in the seismic records and thus provide valuable informations on the dynamics of volcanic eruptions.
Acknowledgments. We thank X. Hill, G. Sartoris, V. Ferrazini, P. Allard, C. Bercy, D. Br•fort, R. Verhille, G. Bi- enfait, M. Martini, F. Barberi, H. Lyon-Caen, P. Briole, Y. Gaudemer, T. Trull, M.-F. Le Cloarec, S. Cardoso. Thor- ough reviews by R. S. J. Sparks, M. J. Buckingham, and T. K oyaguchi greatly improved the manuscript. This work was supported by CNRS-INSU-DBT Terre profonde and EEC grants SC1'CT005010 and EVSV-CT92-0189. This is IPGP Contribution 1442 and INSU-DBT contribution 765.
References
Aki, K., and P. G. Richards, Quantitative Seisinology: The- ory and Methods, vol. 1, 557 pp., W. H. Freeman, New York, 1980.
Batchelor, G. K., An Introduction to Fluid Dynamics, 615 pp., Cambridge Univ. Press, New York, 1967.
Bercy, C., J.-C. Sabroux, and G. Suparwoto, Underwater noise survey in the crater lake of Kelut volcano (Indonea- sia), in Development in Volcanology: Forecasting Volcanic Events, edited by H. Tazieff and J.-C. Sabroux, pp. 529- 543, Elsevier, New York, 1983.
Blackburn, E. A., L. Wilson, and R. S. J. Sparks, Mechan- ics and dynamics of Strombohan activity, J. Geol. Soc. London, 132, 429-440, 1976.
VERGNIOLLE ET AL.: STROMBOLIAN EXPLOSIONS, 2 20,465
Bottinga, Y., and D. F. Weill, The viscosity of magmatic silicate liquids: a model for calculation, Am. J. Sci., 272, 438-475, 1972.
Braun, T., and M. Ripepe, Interaction of seismic and air waves recorded at Stromboli volcano, Geophys. Res. Lett., 20, 65-68, 1993.
Buckingham, M. J., and M. A. Garc•s, Canonical model of volcano acoustics, J. Geophys. Res., 101, 8129-8151, 1996.
Capaldi, G., et al., Stromboll and its 1975 eruption, Bull. Volcanol., •1, 1-27, 1978.
Chouet, B., Excitation of a buried magmatic pipe: a seismic source model for volcanic tremor, J. Geophys. Res., 90, 1881-1893, 1985.
Chouet, B., N. Hamisevicz, and T. R. McGetchin, Photobal- listics of volcanic jet activity at Stromboli, Italy, J. Geo- phys. Res., 79, 4961-4975, 1974.
Del Pezzo E., C. Godano, A. Gorini and M. Martini, Wave polarisation and the location of the source of the explo- sion quakes at Stromboli volcano, in Volcanic Seisinology, edited by P. Gasparini, R. Scarpa, and K. Aki, pp. 279- 296, Springer-Verlag, New York, 1992.
Dietel, C., B. Chouet, J. Kleinman, G. de Luca, M. Martini, G. Milana, J. Power, D. Harlow, and R. Scarpa, Array tracking of tremor sources at Stromboll volcano, Italy, U.S. Geol. Surv. Open File Rep. 9•-l.i2, 1994.
Donn, W. L., and N. K. Balachandran, Mount St. Helens eruption of 18 May 1980: Air waves and explosive yield, Science, œ13, 539-541, 1981.
Fabre, J., and A. Linn•, Modelling of two-phase slug flow, Annu. Rev. Fluid Mech., œJ, 21-46, 1992.
Ferrazzini, V., and K. Aki, Preliminary results from a field experiment on volcanic events at Kilauea using an array of digital seismographs, IA VCEI Proc. Volcanol., 3, 168- 189, 1992.
Francalanci, L., P. Manetti, and A. Pecerillo, Volcanolog- ical and magmatological evolution of Stromboll volcano (Aeolian islands): The roles of fractional crystallization, magma mixing, crustal contamination, and source hetero- geneity, Bull. Volcanol., 51, 335-378, 1989.
Gaonac'h, H., J. Vandemeulebrouck, J. Stix, and M. Halb- wachs, Thermal infrared satellite measurements of vol- canic activity at Stromboll and Vulcano, J. Geophys. Res., 99, 9477-9485, 1994.
Giberti, G., C. Jaupart, and G. Sartoris, Steady-state op- eration of Stromboli volcano, Italy: Constraints on the feeding system, Bull. Volcanol., 5.i, 535-541, 1992.
Golstein, P., and B. Chouet, Array measurements and mod- eling of sources of shallow volcanic tremor at Kilauea vol- cano, Hawaii, J. Geophys. Res., 99, 2637-2652, 1994.
Jaupart, C., and S. Vergniolle, Dynamics of degassing at Kilauea volcano, Hawaii, Nature, 331, 58-60, 1988.
Jaupart, C., and S. Vergniolle, The generation and collapse of a foam layer at the roof of a basaltic magma chamber, J. Fluid Mechanics, œ03, 347-380, 1989.
Kanamori, H., and J. W. Given, Analysis of long-period seis- mic waves ecited by the May 18, 1980, eruption of Mount St. Helens: A terrestrial monopole, J. Geophys. Res., 87, 5422-5432, 1982.
Kanamori, H., and J. Mori, Harmonic excitation of mantle Rayleigh waves by the 1991 eruption of Mount Pinatubo, Philippines, Geophys. Res. Lett., 19, 721-724, 1992.
Kanamori, H., J. W. Given, and T. Lay, Analysis of seismic body waves by the Mount St. Helens eruption of May 1980, J. Geophys. Res., 89, 1856-1866, 1984.
Kieffer, S. W., and B. Sturtevant, Laboratory studies of volcanic jets, J. Geophys. Res., 89, 8253-8268, 1984.
Kinsler, L. E., A. R. Frey, A. B. Coppens, and J. V. Sanders, Fundamentals of Acoustics, 480 pp., John Wiley, New York, 1982.
Landau, L. D., and E. M. Lifshitz, Course in Theoretical Physics: Fluids Mechanics, vol. 6, 536 pp., Pergamon, Tarrytown, N.Y., 1987.
Leighton, T.G., The Acoustic Bubble, 613 pp., Academic, San Diego, Calif., 1994.
Lighthill, J., Waves in Fluids, 504 pp., Cambridge Univ. Press, New York, 1978.
Lo Bascio A., G. Luongo, and G. Nappi, Microtremors and volcanic explosions at Stromboli (Aeolian Islands), Bull. Volcanol., 37, 596-606, 1973.
Machado, F., W. H. Parsons, A. F. Richards, and J. W. Mulford, Capelinhos eruption of Fayal volcano, Azores, 1957-1958, J. Geophys. Res., 67, 3519-3529, 1962.
Mikumo, T., and B. A. Bolt, Excitation mechanism of atmo- spheric pressure waves from the 1980 Mount St. Helens eruption, Geophys. J. R. Astron. Soc., 81,445-461, 1985.
Neuberg, J., R. Luckett, M. Ripepe, and T. Braun, High- lights from a seismic broadband array on Stromboll, Geo- phys. Res. Lett., 21, 749-752, 1994.
Norris, R. A., and R. H. Johnson, Submarine volcanic erup- tions recently located in the pacific by sofar hydrophones, J. Geophys. Res., 7./, 650-664, 1969.
Ntepe, N., and J. Dorel, Observations of seismic volcanic sig- nals at Stromboli volcano, Italy, J. Volcanol. Geotherm. Res., .i3, 235-251, 1990.
Paterson, A. R., A First Course in Fluid Dynamics, 528 pp., Cambridge Univ. Press, New York, 1983.
Pierce, A.D., Acoustics: An Introduction to Its Physical Principles and Applications, 678 pp., McGraw-Hill, New York, 1981.
Richards, A. F., Volcanic sounds, investigation and analysis, J. Geophys. Res., 68, 919-928, 1963.
Ripepe, M., M. Rossi, and G. Saccarotti, Image processing of explosive activity at Stromboli, J. Volcanol. Geotherm. Res., 5.i, 335-351, 1993.
Ripepe, P. Poggi, T. Braun, and E. Gordeev, Infrasonic waves and volcanic trem•or at Stromboli, Geophys. Res. Lett., œ3, œ, 181-184, 1996.
Roscoe, R., The viscosity of suspensions of rigid spheres, J. Br. Appl. Phys., 3, 267-269, 1952.
Russo, G., G. Giberti, and G. Sartoris, The influence of regional stresses on the mechanical stability of volcanoes: Stromboli (Italy), in Volcano Instability on the Earth and Other Planets, Spec. Pub. Geol. Soc., 110, 65-75, 1996.
Settle, M., and T. R. McGetchin, Statistical analysis of per- sistent explosive activity at Stromboli, 1971: Implications for eruption predictions, J. Volcanol. Geotherm. Res., 8, 45-58, 1980.
Shaw, H. R., Viscosities of magmatic silicate liquids: An empirical method of prediction, Am. J. Sci., œ7œ, 870- 893, 1972.
Sparks, R. S. J., The dimensions and dynamics of volcanic eruption columns, Bull. Volcanol., 56, 493-501, 1986.
Swanson, D. A., W. A. Duffield, D. B. Jackson, and D. W. Peterson, Mauna Ulu eruption, Kilauea volcano, Geo- times, 16, 12-16, 1971.
Taylor, G. I., and R. M. Davies, The motion and shape of the hollow produced by an explosion in a liquid, The Scientific Papers oj • G.I. Taylor, vol. 3, pp. 337-353, Cambridge Univ. Press, New York, 1963.
Vandemeulebrouk J., A. W. Hurst, and N. Poussielgue, Im- plications for the thermal regime of acoustic noise mea- surements in Crater Lake, Mount Ruapehu, New Zealand, Bull. Volcanol., 56, 493-501, 1994.
Vergniolle, S., and G. Brandeis, Origin of the sound gener- ated by Strombolian explosions, Geophys. Res. Lett., 21, 1959-1962, 1994.
Vergniolle, S., and G. Brandeis, Strombolian explosions, 1, A large bubble breaking at the surface of a lava column as a source of sound, J. Geophys. Res., this issue.
20,466 VERGNIOLLE ET AL.: STROMBOLIAN EXPLOSIONS, 2
Vergniolle, S., and C. Jaupart, The dynamics of degassing at Kilauea volcano, Hawaii, J. Geophys. Res., 95, 2793-2809, 1990.
Wallis, G. B., One Dimensional Two-Phase Flows, 408 pp., McGraw-Hill, New York, 1969.
Weill, A., G. Brandeis, $. Vergniolle, F. Baudin, J. Bilbille, J.-F. F•vre, B. Piron, and X. Hill, Acoustic sounder mea- surements of the vertical velocity of volcanic jets at Strom- boli volcano, Geophys. Res. Lett., 19, 2357-2360, 1992.
Whitham, G. B., Linear and Nonlinear Waves, 636 pp., John Wiley, New York, 1973.
Wilson, L., Relationships between pressure, volatile content and ejecta velocity, J. Volcanol. Geotherm. Res., 8, 297- 313, 1980.
Wilson, L., and J. W. Head, Ascent and eruption of basaltic magma on the Earth and Moon, J. Geophys. Res., 86, 2971-3001, 1981.
Wilson, L., R. S. J. Sparks, T. C. Huang, and N. D. Watkins, The control of volcanic column heights by eruption ener- getics and dynamics, J. Geophys. Res., 83, 1829-1835, 1978.
Woods, A.W., The fitfid dynamics and thermodynamics of eruption columns, Bull. Volcanol., 50, 169-193, 1988.
Woulff, G., and T.R. McGetchin, Acoustic noise from vol- canoes: Theory and experiments, Geophys. J. R. A s- tron. Soc.,-45, 601-616, 1976.
G. Brandeis, UMR 5562/CNRS, GRGS, Observatoire Midi-Pyrenees, 14 avenue Edouard-Belin, 31400 Toulouse, France. (e-mail: [email protected])
J.-C. Mareschal, GEOTOP, Universit• du Qudbec • Montrdal, Case postale 8888, Montreal, H3C 3P8, Quebec, Canada. (e-mail: [email protected])
S. Vergniolle, Laboratoire de Dynamique des Syst[mes G•ologiques, Institut de Physique du Globe, 4 place Jussieu, 75252 Paris cedex 05, Paris, France. (e- mail:[email protected])
(Received June 13, 1995; revised April 29, 1996; accepted June 4, 1996.)
Related Documents