RESEARCH PAPER Strength and dilatancy of jointed rocks with granular fill Ashutosh Trivedi Received: 18 October 2008 / Accepted: 18 May 2009 / Published online: 13 August 2009 Ó Springer-Verlag 2009 Abstract It is well recognised that the strength of rock masses depends upon the strain history, extent of discon- tinuities, orientation of plane of weakness, condition of joints, fill material in closely packed joints and extent of confinement. Several solutions are available for strength of jointed rock mass with a set of discontinuities. There is a great multiplicity in the proposed relationships for the strength of jointed rocks. In the present study, the author conceives the effect of increasing stresses to induce per- manent strains. This permanent strain appears as micro crack, macro crack and fracture. A fully developed network of permanent deformations forms joint. The joint may contain deposits of hydraulic and hydrothermal origin commonly known as gouge. The joint factor numerically captures varied engineering possibilities of joints in a rock mass. The joints grow as an effect of loading. The growth of the joints is progressive in nature. It increases the joint factor, which modifies the failure stresses. The dilatancy explains the progressive failure of granular media. Hence, a mutual relationship conjoins effectively the strength of jointed rock and a dilatancy-dependent parameter known as relative dilatancy. This study provides a simple and inte- gral solution for strength of jointed rocks, interpreted in relation to the commonly used soil, and rock parameters, used for a realistic design of structure on rock masses. It has scope for prediction of an equivalent strength for tri- axial and plane strain conditions for unconfined and con- fined rock masses using a simple technique. Keywords Gouge Joint factor Jointed rocks Relative dilatancy Strength ratio List of symbols / cn, / peak Angle of critical friction and peak internal friction, respectively (°) / j Equivalent friction angle for the jointed rocks (°) w Angle of dilatancy (°) c p , e p Plastic shear and plastic volumetric strain A Empirical constant and has a value of 3 for axe-symmetrical and 5 for plane strain case C 0 and C Initial confining pressure-dependant empirical fitting parameters for jointed rocks c g A modification factor for gouge d a Reference depth of joint (=sample diameter in mm) d j Depth of joint in mm D p Dilatancy as a function of plastic shear and volumetric strain de v /de 1 Ratio of changes in volumetric and axial strain g d Correction factor depending upon the density of gouge in joint I r relative dilatancy index J d j Joint depth parameter J f Joint factor J fg Joint factor corrected for gouge J n Number of joints in the direction of loading (joints per metre length of the sample) A. Trivedi Department of Civil Engineering, Faculty of Technology (FoT), University of Delhi, Delhi College of Engineering Campus, Bawana Road, House No. 8, Type V, Delhi 110042, India A. Trivedi (&) Delhi College of Engineering, Faculty of Technology (FoT), University of Delhi, House No. 8, Type V, Delhi College of Engineering, Bawana Road, Delhi 110042, India e-mail: [email protected]; [email protected] 123 Acta Geotechnica (2010) 5:15–31 DOI 10.1007/s11440-009-0095-2

Welcome message from author
This document is posted to help you gain knowledge. Please leave a comment to let me know what you think about it! Share it to your friends and learn new things together.
Transcript
RESEARCH PAPER
Strength and dilatancy of jointed rocks with granular fill
Ashutosh Trivedi
Received: 18 October 2008 / Accepted: 18 May 2009 / Published online: 13 August 2009
� Springer-Verlag 2009
Abstract It is well recognised that the strength of rock
masses depends upon the strain history, extent of discon-
tinuities, orientation of plane of weakness, condition of
joints, fill material in closely packed joints and extent of
confinement. Several solutions are available for strength
of jointed rock mass with a set of discontinuities. There is a
great multiplicity in the proposed relationships for the
strength of jointed rocks. In the present study, the author
conceives the effect of increasing stresses to induce per-
manent strains. This permanent strain appears as micro
crack, macro crack and fracture. A fully developed network
of permanent deformations forms joint. The joint may
contain deposits of hydraulic and hydrothermal origin
commonly known as gouge. The joint factor numerically
captures varied engineering possibilities of joints in a rock
mass. The joints grow as an effect of loading. The growth
of the joints is progressive in nature. It increases the joint
factor, which modifies the failure stresses. The dilatancy
explains the progressive failure of granular media. Hence, a
mutual relationship conjoins effectively the strength of
jointed rock and a dilatancy-dependent parameter known as
relative dilatancy. This study provides a simple and inte-
gral solution for strength of jointed rocks, interpreted in
relation to the commonly used soil, and rock parameters,
used for a realistic design of structure on rock masses. It
has scope for prediction of an equivalent strength for tri-
axial and plane strain conditions for unconfined and con-
fined rock masses using a simple technique.
Keywords Gouge � Joint factor � Jointed rocks �Relative dilatancy � Strength ratio
List of symbols
/cn, /peak Angle of critical friction and peak internal
friction, respectively (�)
/j Equivalent friction angle for the jointed
rocks (�)
w Angle of dilatancy (�)
cp, ep Plastic shear and plastic volumetric strain
A Empirical constant and has a value of 3 for
axe-symmetrical and 5 for plane strain case
C0 and C Initial confining pressure-dependant
empirical fitting parameters for jointed rocks
cg A modification factor for gouge
da Reference depth of joint (=sample diameter
in mm)
dj Depth of joint in mm
Dp Dilatancy as a function of plastic shear and
volumetric strain
dev/de1 Ratio of changes in volumetric and axial
strain
gd Correction factor depending upon the
density of gouge in joint
Ir relative dilatancy index
JdjJoint depth parameter
Jf Joint factor
Jfg Joint factor corrected for gouge
Jn Number of joints in the direction of loading
(joints per metre length of the sample)
A. Trivedi
Department of Civil Engineering, Faculty of Technology (FoT),
University of Delhi, Delhi College of Engineering Campus,
Bawana Road, House No. 8, Type V, Delhi 110042, India
A. Trivedi (&)
Delhi College of Engineering, Faculty of Technology (FoT),
University of Delhi, House No. 8, Type V, Delhi College of
Engineering, Bawana Road, Delhi 110042, India
e-mail: [email protected]; [email protected]
123
Acta Geotechnica (2010) 5:15–31
DOI 10.1007/s11440-009-0095-2
Jt Gouge thickness parameter
Lna Reference length (=1 m)
M and B Empirical rock constants
n Joint orientation parameter depending upon
inclination of the joint plane [b (�)] with
respect to the direction of loading
p Mean confining pressure (kPa)
pa and ra Reference pressure (=1 kPa)
pi Initial mean confining pressure (kPa)
q Shear stress (kPa)
Qj and rj Empirical material fitting constants for
gouge
r Joint strength parameter
RAC Ramamurthy–Arora criterion
RD Relative density of gouge
t Thickness of gouge in the joint (mm)
ta Reference thickness of gouge in the joint
(=1 mm)
k Empirical coefficient for joint factor
n Empirical coefficient for dilatancy
a Fitting constant
r1, r3 Major and minor principal stresses,
respectively (kPa)
rci, rcj, rcjg Uniaxial compressive strength of intact,
jointed and jointed rock with gouge
respectively (kPa)
rcr Strength ratio
Scr Strength reduction factor during shear along
the gouge
1 Introduction
The strength of jointed rock mass is important for the
design of structures built on rocks such as towers, bridge
piers, tunnels, deep-seated nuclear and hazardous waste
confinements and dams. The rock masses occur in nature
with joints and varying amount of infill material commonly
known as gouge. The in situ tests show indirect effect of an
expanding network of micro cracks in rock mass indirectly
incorporated through the effect of size [6, 7, 28] on rock
mass compressive strength. Interestingly, a large network
of micro fractures may have a similar effect of strength
reduction as observed in the case of jointed rocks with a
number of joints numerically simulated to similar strain
history. At a stress around 10% of the failure stress, its
redistribution begins. The deformation starts to be pro-
gressively non-linear. It is often classified as non-associ-
ated plastic flow.
Upon loading, rock masses experience early plasticity as
accommodated in crack closure for intact rocks or joint
closure for jointed rocks. Further deformations are elasto-
plastic until the brittle failure takes place in the intact
rocks. The rock masses with multiple joints conceal brittle
failure largely as the joints tolerate large plastic deforma-
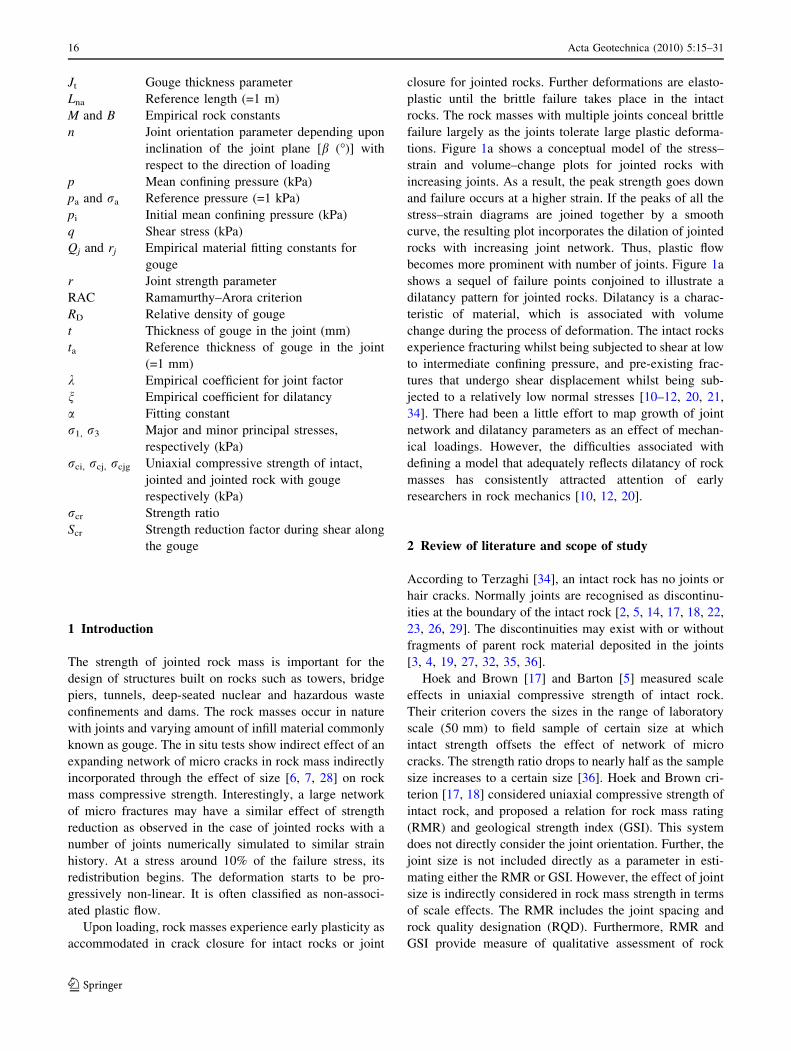
tions. Figure 1a shows a conceptual model of the stress–
strain and volume–change plots for jointed rocks with
increasing joints. As a result, the peak strength goes down
and failure occurs at a higher strain. If the peaks of all the
stress–strain diagrams are joined together by a smooth
curve, the resulting plot incorporates the dilation of jointed
rocks with increasing joint network. Thus, plastic flow
becomes more prominent with number of joints. Figure 1a
shows a sequel of failure points conjoined to illustrate a
dilatancy pattern for jointed rocks. Dilatancy is a charac-
teristic of material, which is associated with volume
change during the process of deformation. The intact rocks
experience fracturing whilst being subjected to shear at low
to intermediate confining pressure, and pre-existing frac-
tures that undergo shear displacement whilst being sub-
jected to a relatively low normal stresses [10–12, 20, 21,
34]. There had been a little effort to map growth of joint
network and dilatancy parameters as an effect of mechan-
ical loadings. However, the difficulties associated with
defining a model that adequately reflects dilatancy of rock
masses has consistently attracted attention of early
researchers in rock mechanics [10, 12, 20].
2 Review of literature and scope of study
According to Terzaghi [34], an intact rock has no joints or
hair cracks. Normally joints are recognised as discontinu-
ities at the boundary of the intact rock [2, 5, 14, 17, 18, 22,
23, 26, 29]. The discontinuities may exist with or without
fragments of parent rock material deposited in the joints
[3, 4, 19, 27, 32, 35, 36].
Hoek and Brown [17] and Barton [5] measured scale
effects in uniaxial compressive strength of intact rock.
Their criterion covers the sizes in the range of laboratory
scale (50 mm) to field sample of certain size at which
intact strength offsets the effect of network of micro
cracks. The strength ratio drops to nearly half as the sample
size increases to a certain size [36]. Hoek and Brown cri-
terion [17, 18] considered uniaxial compressive strength of
intact rock, and proposed a relation for rock mass rating
(RMR) and geological strength index (GSI). This system
does not directly consider the joint orientation. Further, the
joint size is not included directly as a parameter in esti-
mating either the RMR or GSI. However, the effect of joint
size is indirectly considered in rock mass strength in terms
of scale effects. The RMR includes the joint spacing and
rock quality designation (RQD). Furthermore, RMR and
GSI provide measure of qualitative assessment of rock
16 Acta Geotechnica (2010) 5:15–31
123
mass strength. It shows that the rock mass strength criteria
should be improved to have a capability of predicting rock
mass strength under different extents of joint spread and
unifying the scale dependence, anisotropy, and the effect of
discontinuities. The past studies have left out scope for
estimation of dilatancy of rock masses as one of the
unresolved issues. Second, the strength of jointed rock was
yet to relate a parameter estimated by direct measurements,
which could connect it with dilatancy.
2.1 Definition of the problem and applications
In routine engineering applications, the relation of rock
mass strength with dilatancy receives far a less attention,
which is essentially because of the fact that many problems
of rock mechanics are solved avoiding failure and secondly
due to inherent difficulties in estimating dilatancy. The aim
of present study is to advance a consistent model for
jointed rocks, which connects the strength with dilatancy
index frequently used for granular mass. It has potential
application in rock excavations, tunnelling and foundations
in rock masses. In view of the present trends in modelling,
the purpose of this study is not to obtain highly accurate
values of strength, but rather to focus on the issue that
considers the affects of dilatancy in theoretical and prac-
tical engineering problems. A large ensemble of studies on
this topic reveal that the dilatancy angle (w) and relative
dilatancy index (Ir) are rarely taken in to consideration.
Often, when it is considered, the approach is poorly drawn
consisting of an associated flow rule (w = /) or non-
associated flow rule (w = 0). Nevertheless, associated flow
rule does not necessarily represent failure behaviour of
rock masses.
The results of model studies on rocks and modified
masses [11, 14, 21, 26] illustrated the possibility of varied
failure modes owing to the highly intricate internal stress
distribution within a jointed rock mass. With the progress of
failure, there is a mutual adjustment of the micromechanical
strength parameters with the mean effective confining
pressure. So far, the strength behaviour of jointed rock mass
has been quantified as a function of joint orientation, joint
size, frequency, roughness and waviness of the joints. There
are some difficulties in mapping these parameters for rock
masses. Therefore, combined effect in terms of equivalent
values adopted for joint factor or relative dilatancy may
capture reasonably well the strength of jointed rock mass
right form a state of low-confinement to heavily confined
state using iterative inputs of the resultant strength.
εaxial
σd
Increasing number of joints
Intact rock
εv
εaxial
Increasing number of joints
J=1β=90°
J=1β=0
J=1β=45°
J=3β=90°
J=5β=90°
J=1β=90
J=1β=0
J=1β=45
J=3β=90
J=5β=90
J=1β=90°t/ta = 0.5
J=1β=90°t/ta = 1.2
J=1β=90°t/ta = 1
(a)
(b)
(c)
(d)
(e)
J=1β=90°dj/da = 0.2
J=1β=90°dj/da>1
J=1β=90°dj/da = 1
J=1β=90°dj/da = 0.6
J=1β=90°dj/da = 0.4
Fig. 1 a Stress–strain behaviour of rock mass with increasing joints.
b Typical examples of discontinuity (joint) at varying joint inclination
(b�) and joint number (@1J:Jn = 26). c Typical examples of
discontinuity (gouge thickness) at varying joint inclination (b�) and
joint number. d Typical variation gouge thickness factor (t/ta) at a
particular joint inclination (b = 90�) and joint number (J = 1).
e Typical variations of joint depth factor (dj/da) with gouge at a
particular joint inclination (b = 90�)
b
Acta Geotechnica (2010) 5:15–31 17
123
2.2 Preliminary definitions
In this study, the experimental results considered uniaxial
and triaxial testing of model material blocks having fully
persistent joints as an effect of plastic strain history. The
proposed technique is largely useful for jointed anisotropic
mass, where failure would be progressive over and above
experienced plasticity. The conventional strength evalua-
tion methods applied for jointed rocks do not consider
progressive failure. The author explains these effects based
on the non-linear strength behaviour of the granular fill
material and occurrence of progressive failure through the
joints. Few novel observations presented here show the
strength of jointed rocks as a compressed function of
material characteristics of the rocks and joint factor as a
function of dilatancy. The joint factor (Jf) is defined as a
ratio of joint frequency (Jn), to the product of joint orien-
tation parameter (n) and joint strength parameter (r) [2, 29].
Jf ¼ Jn=nr ð1Þ
Jn Number of joints in the direction of loading (equal to
number of joints per metre length of the sample)
N Orientation parameter related to inclination of joints
(b) with the direction of major principal stress and
r Joint strength parameter depending on the joint
condition (/j), which is equivalent friction angle
along the joint plane so that the roughness of the
surface is represented through this value (it is obtained
by a shear test on the rock joint)
Theoretically, joint factor has the effects of already
experienced dilatancy by the rock mass. Therefore, a
relation between joint factor (Jf) and dilatancy (DP) rep-
resents this effect as
Jf ¼ f cp; epð Þ ð2aÞ
Jf ¼ f 0 Dpð Þ ð2bÞ
cp, ep Plastic shear and volumetric strain
Dp Dilatancy which is defined as a change in volume
resulting from the shear distortion of an element in
a material. It is a function of plastic shear strain
and plastic volumetric strain. It may include the
effects of damage in the rock material, if any. In order
to consider the effect of damage in theoretical
framework of plasticity, there is a need of com-
ponents of damage (cpd, epd) in Eq. 2a. Since the joint
factor is, an empirical formulation for the effect
of stress, it should experimentally capture all its
consequences
Therefore, the experimentally obtained strength has been
evaluated corresponding to a joint factor, and applied stress
coupled with joint strength parameter. The constitutive
relationships for peak angle of internal friction based on
knowledge of compactness or relative density (RD) of in-fill
material, mean effective confining pressure (p0), and angle of
critical friction (/cn), for different rock materials. The value
of angle of critical friction (/cn) is the angle of shearing
observed in a simple shear test on a joint loose enough to be in
critical state with zero dilation. The granular material in the
joint’s rupture zone dilates fully to achieve the critical state at
which shear deformation can continue without any volume
change. The relative density (RD) is considered conven-
tionally as a ratio of difference of maximum void ratio (emax)
and natural state void ratio (en) to maximum void ratio (emax)
and minimum void ratio (emin) of the gouge material
[RD = (emax - en)/(emax - emin)]. The effect of pore pres-
sure is discounted having not considered in this analysis;
therefore, mean effective confining pressure (p0) is equal to
mean confining pressure (p) [p = (r1 ? r2 ? r3)/3, where
r1, r2, r3, are principal stresses].
The strength of jointed rock is often evaluated in terms
of strength ratio. The primary aim of finding strength ratio
relationship with joint factor is to get readily the strength of
jointed rock by conducting single uniaxial compression test
on the parent rock mass. The strength ratio (rcr) is defined
as a ratio of strength of a jointed rock (rcj) with respect to
uniaxial compressive strength of same sized intact rock
(rci) sample of the same parent material. If r1cj, r2cj, and
r3cj are triaxial principal stresses at failure in the jointed
rock and rci is uniaxial compressive strength of the intact
rock sample, then in the triaxial state, the strength ratio,
rcr ¼ r1cj þ r2cj þ r3cj
� �=3
� �rcið Þ=3½ � ð3Þ
¼ p= ðrciÞ=3½ � ¼ 3p= rcið Þ ð4Þ
In unconfined state, the strength ratio,
rcr ¼ ðrcjÞ=3� �
ðrciÞ=3½ � ¼ rcj
� ��rci½ � ð5Þ
The author analysed the test results with a focus on ways to
determine the dilatancy jointed rocks with and without
gouge in relation to the joint factor. Further, the author also
examined the result in light of the Johnston’s generalisation
evolving from triaxial testing [22, 23]. The author con-
joined these findings to propose a relationship for strength
ratio incorporating dilatancy dependant joint factor.
3 Materials and methods
The author prepared the cylindrical cores of Kota sand
stone, 38 mm diameter obtained from the block of rock
18 Acta Geotechnica (2010) 5:15–31
123
using diamond impregnator core drills. The author con-
sidered the cylindrical cores of plaster of Paris in the mould
of 38 mm internal diameter and 76 mm height. A disc
cutting power saw finished the desired length of the core.
The ends of the core specimen thus obtained were
smoothened to meet the tolerance limit as specified by
ISRM (1982). The height to the diameter ratio of the intact
specimen was kept as two. The anisotropy was introduced
in the rough broken joints at various inclinations by
adopting a special technique of notching and breaking in
the direction of desired orientation. It involved giving
direction to breaking by means of creating grooves in the
desired direction on the cylindrical sample using chisel and
scale. Having given a direction to the groove, the sample
was placed on a notch. With strike of the chisel along the
groove on the sample, two pieces of a jointed specimen
ware obtained. A thick paste of kaolin (specific grav-
ity = 2.6, liquid limit = 48%, plasticity index = 24%)
was prepared at water content of 27%. It was compressed
inside the joints thus developed as a gouge in the specimen.
The specimen was dried first in airtight desiccators then at
105�C in an electric oven. The uniaxial compression test-
ing was carried out as per ISRM (1979) testing procedure.
The Kota sand stone and plaster of Paris used in the present
study had uniaxial compressive strength of 80,400 and
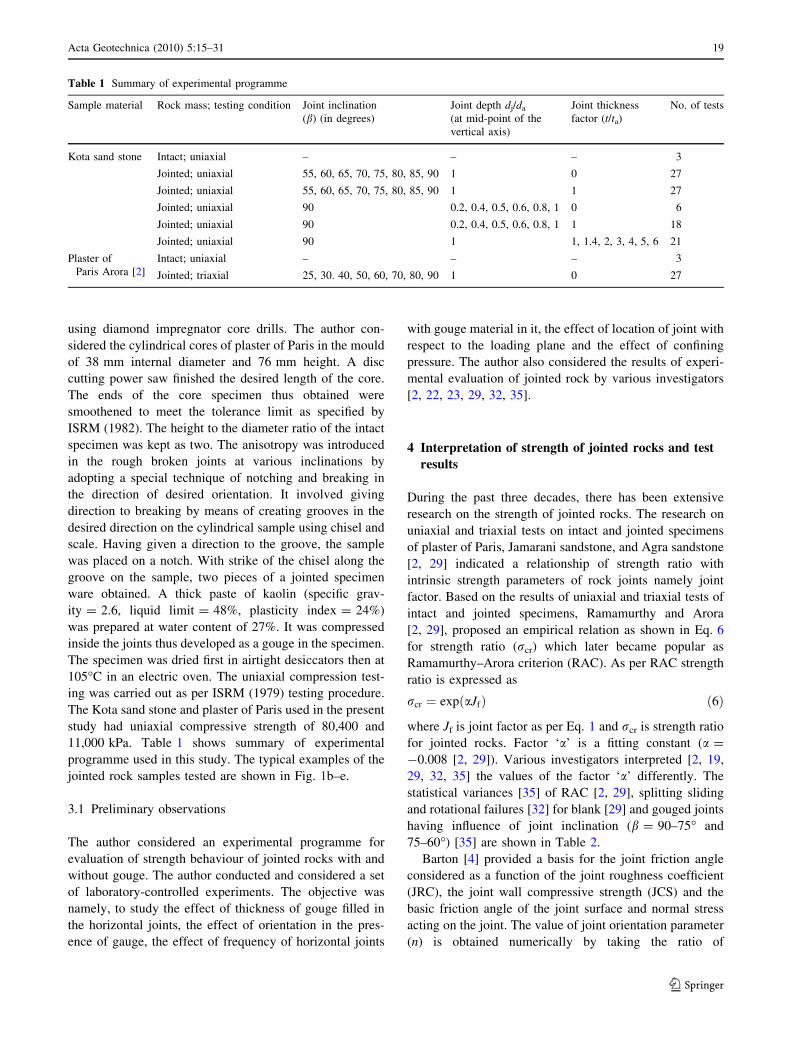
11,000 kPa. Table 1 shows summary of experimental
programme used in this study. The typical examples of the
jointed rock samples tested are shown in Fig. 1b–e.
3.1 Preliminary observations
The author considered an experimental programme for
evaluation of strength behaviour of jointed rocks with and
without gouge. The author conducted and considered a set
of laboratory-controlled experiments. The objective was
namely, to study the effect of thickness of gouge filled in
the horizontal joints, the effect of orientation in the pres-
ence of gauge, the effect of frequency of horizontal joints
with gouge material in it, the effect of location of joint with
respect to the loading plane and the effect of confining
pressure. The author also considered the results of experi-
mental evaluation of jointed rock by various investigators
[2, 22, 23, 29, 32, 35].
4 Interpretation of strength of jointed rocks and test
results
During the past three decades, there has been extensive
research on the strength of jointed rocks. The research on
uniaxial and triaxial tests on intact and jointed specimens
of plaster of Paris, Jamarani sandstone, and Agra sandstone
[2, 29] indicated a relationship of strength ratio with
intrinsic strength parameters of rock joints namely joint
factor. Based on the results of uniaxial and triaxial tests of
intact and jointed specimens, Ramamurthy and Arora
[2, 29], proposed an empirical relation as shown in Eq. 6
for strength ratio (rcr) which later became popular as
Ramamurthy–Arora criterion (RAC). As per RAC strength
ratio is expressed as
rcr ¼ exp aJfð Þ ð6Þ
where Jf is joint factor as per Eq. 1 and rcr is strength ratio
for jointed rocks. Factor ‘a’ is a fitting constant (a =
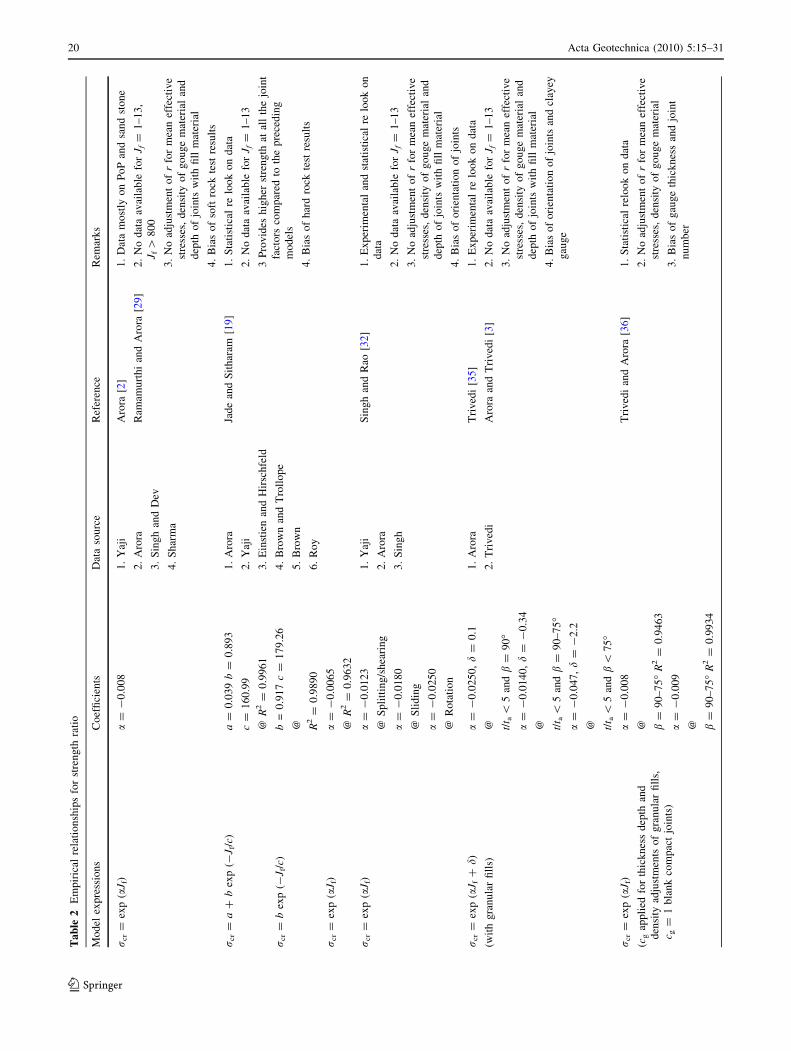
-0.008 [2, 29]). Various investigators interpreted [2, 19,
29, 32, 35] the values of the factor ‘a’ differently. The
statistical variances [35] of RAC [2, 29], splitting sliding
and rotational failures [32] for blank [29] and gouged joints
having influence of joint inclination (b = 90–75� and
75–60�) [35] are shown in Table 2.
Barton [4] provided a basis for the joint friction angle
considered as a function of the joint roughness coefficient
(JRC), the joint wall compressive strength (JCS) and the
basic friction angle of the joint surface and normal stress
acting on the joint. The value of joint orientation parameter
(n) is obtained numerically by taking the ratio of
Table 1 Summary of experimental programme
Sample material Rock mass; testing condition Joint inclination
(b) (in degrees)
Joint depth dj/da
(at mid-point of the
vertical axis)
Joint thickness
factor (t/ta)No. of tests
Kota sand stone Intact; uniaxial – – – 3
Jointed; uniaxial 55, 60, 65, 70, 75, 80, 85, 90 1 0 27
Jointed; uniaxial 55, 60, 65, 70, 75, 80, 85, 90 1 1 27
Jointed; uniaxial 90 0.2, 0.4, 0.5, 0.6, 0.8, 1 0 6
Jointed; uniaxial 90 0.2, 0.4, 0.5, 0.6, 0.8, 1 1 18
Jointed; uniaxial 90 1 1, 1.4, 2, 3, 4, 5, 6 21
Plaster of
Paris Arora [2]
Intact; uniaxial – – – 3
Jointed; triaxial 25, 30. 40, 50, 60, 70, 80, 90 1 0 27
Acta Geotechnica (2010) 5:15–31 19
123
Ta
ble
2E
mp
iric
alre
lati
on
ship
sfo
rst
ren
gth
rati
o
Mo
del
exp
ress
ion
sC
oef
fici
ents
Dat
aso
urc
eR
efer
ence
Rem
ark
s
rcr
=ex
p(a
J f)
a=
-0
.00
81
.Y
aji
2.
Aro
ra
3.
Sin
gh
and
Dev
4.
Sh
arm
a
Aro
ra[2
]
Ram
amu
rth
ian
dA
rora
[29
]
1.
Dat
am
ost
lyo
nP
oP
and
san
dst
on
e
2.
No
dat
aav
aila
ble
for
J f=
1–
13
,
J f[
80
0
3.
No
adju
stm
ent
of
rfo
rm
ean
effe
ctiv
e
stre
sses
,d
ensi
tyo
fg
ou
ge
mat
eria
lan
d
dep
tho
fjo
ints
wit
hfi
llm
ater
ial
4.
Bia
so
fso
ftro
ckte
stre
sult
s
rcr
=a
?b
exp
(-J f
/c)
a=
0.0
39
b=
0.8
93
c=
16
0.9
9
@R
2=
0.9
96
1
1.
Aro
ra
2.
Yaj
i
3.
Ein
stie
nan
dH
irsc
hfe
ld
4.
Bro
wn
and
Tro
llo
pe
5.
Bro
wn
6.
Ro
y
Jad
ean
dS
ith
aram
[19
]1
.S
tati
stic
alre
loo
ko
nd
ata
2.
No
dat
aav
aila
ble
for
J f=
1–
13
3P
rov
ides
hig
her
stre
ng
that
all
the
join
t
fact
ors
com
par
edto
the
pre
ced
ing
mo
del
s
4.
Bia
so
fh
ard
rock
test
resu
lts
rcr
=b
exp
(-J f
/c)
b=
0.9
17
c=
17
9.2
6
@ R2
=0
.98
90
rcr
=ex
p(a
J f)
a=
-0
.00
65
@R
2=
0.9
63
2
rcr
=ex
p(a
J f)
a=
-0
.01
23
@S
pli
ttin
g/s
hea
rin
g
1.
Yaj
i
2.
Aro
ra
3.
Sin
gh
Sin
gh
and
Rao
[32
]1
.E
xp
erim
enta
lan
dst
atis
tica
lre
loo
ko
n
dat
a
2.
No
dat
aav
aila
ble
for
J f=
1–
13
3.
No
adju
stm
ent
of
rfo
rm
ean
effe
ctiv
e
stre
sses
,d
ensi
tyo
fg
ou
ge
mat
eria
lan
d
dep
tho
fjo
ints
wit
hfi
llm
ater
ial
4.
Bia
so
fo
rien
tati
on
of
join
ts
a=
-0
.01
80
@S
lid
ing
a=
-0
.02
50
@R
ota
tio
n
rcr
=ex
p(a
J f?
d)
(wit
hg
ran
ula
rfi
lls)
a=
-0
.02
50
,d
=0
.1
@ t/t a
\5
and
b=
90�
1.
Aro
ra
2.
Tri
ved
i
Tri
ved
i[3
5]
Aro
raan
dT
riv
edi
[3]
1.
Ex
per
imen
tal
relo
ok
on
dat
a
2.
No
dat
aav
aila
ble
for
J f=
1–
13
3.
No
adju
stm
ent
of
rfo
rm
ean
effe
ctiv
e
stre
sses
,d
ensi
tyo
fg
ou
ge
mat
eria
lan
d
dep
tho
fjo
ints
wit
hfi
llm
ater
ial
4.
Bia
so
fo
rien
tati
on
of
join
tsan
dcl
ayey
gau
ge
a=
-0
.01
40
,d
=-
0.3
4
@ t/t a
\5
and
b=
90
–7
5�
a=
-0
.04
7,d
=-
2.2
@ t/t a
\5
and
b\
75�
rcr
=ex
p(a
J f)
(cg
app
lied
for
thic
kn
ess
dep
than
d
den
sity
adju
stm
ents
of
gra
nu
lar
fill
s,
c g=
1b
lan
kco
mp
act
join
ts)
a=
-0
.00
8
@ b=
90
–7
5�
R2
=0
.94
63
Tri
ved
ian
dA
rora
[36
]1
.S
tati
stic
alre
loo
ko
nd
ata
2.
No
adju
stm
ent
of
rfo
rm
ean
effe
ctiv
e
stre
sses
,d
ensi
tyo
fg
ou
ge
mat
eria
l
3.
Bia
so
fg
aug
eth
ick
nes
san
djo
int
nu
mb
era
=-
0.0
09
@ b=
90–
75
�R
2=
0.9
93
4
20 Acta Geotechnica (2010) 5:15–31
123
logarithmic of strength reduction [rcj@b=90] at b = 90� to
logarithmic strength reduction [rcj@b=bn] at the desired
value of inclination angle of the joint (b = bn). These
values of ‘n’ were almost same irrespective of number of
joints per unit length.
n ¼ log rcj@b¼90
� ��log rcj@b¼bn
� �ð7Þ
The results of triaxial shear testing with inclination of plane
of weakness for More-town phyllite, slate and Green river
shale reported by Maclamore and Gray [27] indicated
significant variation of strength ratio at low confining
pressure. As a result, the orientation parameter appears as a
composite parameter having combined effect of joint friction
and inclination of joints as emerged from the studies of
Maclamore and Gray [27] and Arora [2] and that of authors
[3, 36]. The joint orientation parameter varies independent of
joint frequency but not of the joint strength parameter.
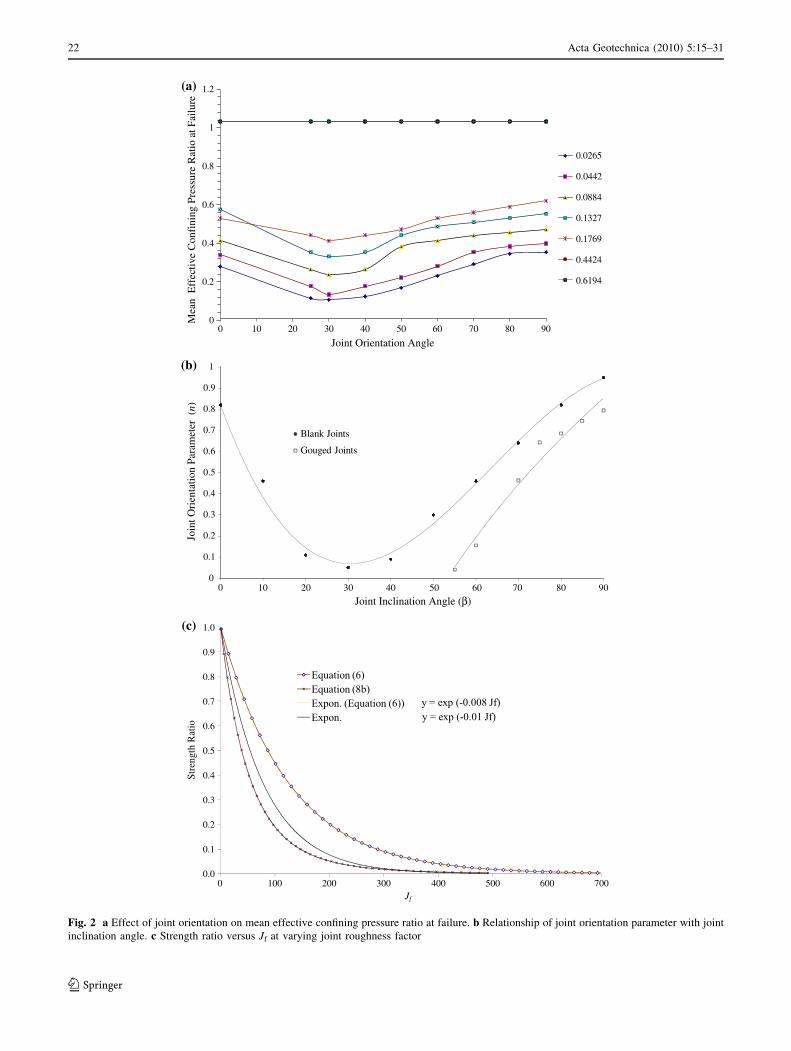
Figure 2a shows the results for plaster of Paris samples tested
in triaxial test [2]. It shows that the effect of joint inclination
upon strength ratio becomes insignificant with increasing
initial confining pressure ratio [pi/rci]. It is defined as a ratio
of initial mean effective confining pressure [pi = (r1j ?
r2j ? r3j)i/3, where (r1j, r2j, r3j)i are initial principal stresses
in the jointed rock] applied on the jointed rock in triaxial test
to the uniaxial compressive strength of intact rock (rci). An
equivalence amongst joint orientation parameter (n) often
referred as a number and joint inclination angle (b) is drawn
for the equal strength reduction for jointed rocks with and
without gouge [35] (Fig. 2b). In uniaxial state, there is a
significant strength reduction due to the presence of gouge at
the same joint inclination angle compared to the jointed rocks
without gouge [35]. Further, if the confinement is increased
significantly the strength reduction shall be indifferent to the
presence of gouge of parent material. The presence of a
gouge alters the joint strength according to its material
properties, placement and thickness. In past, a simplistic
view on adoption of joint strength parameter (r) has evolved.
The values of ‘r’ adopted for both blank joints and joints
filled with gouge material, considered a constant value for
joint strength parameter [2]. A constant value of joint
strength parameter if used in Eq. 2a, it fails to capture the
confining pressure and dilatancy effects of the joint material
upon the friction amid the joints. Figure 2c shows variation
of strength ratio with variation of joint strength parameter.
Selecting a series of value for joint strength parameter (r), the
strength ratio and joint factor fitting provides a few
correlations for joint strength parameter (r). The
experimental results of uniaxial compressive strength of
rock masses from varied geological origins [2] are analysed
by the author to examine a relationship for joint strength
parameter in non-dimensional terms (Table 3). The
compressive strength has an influence on values of joint
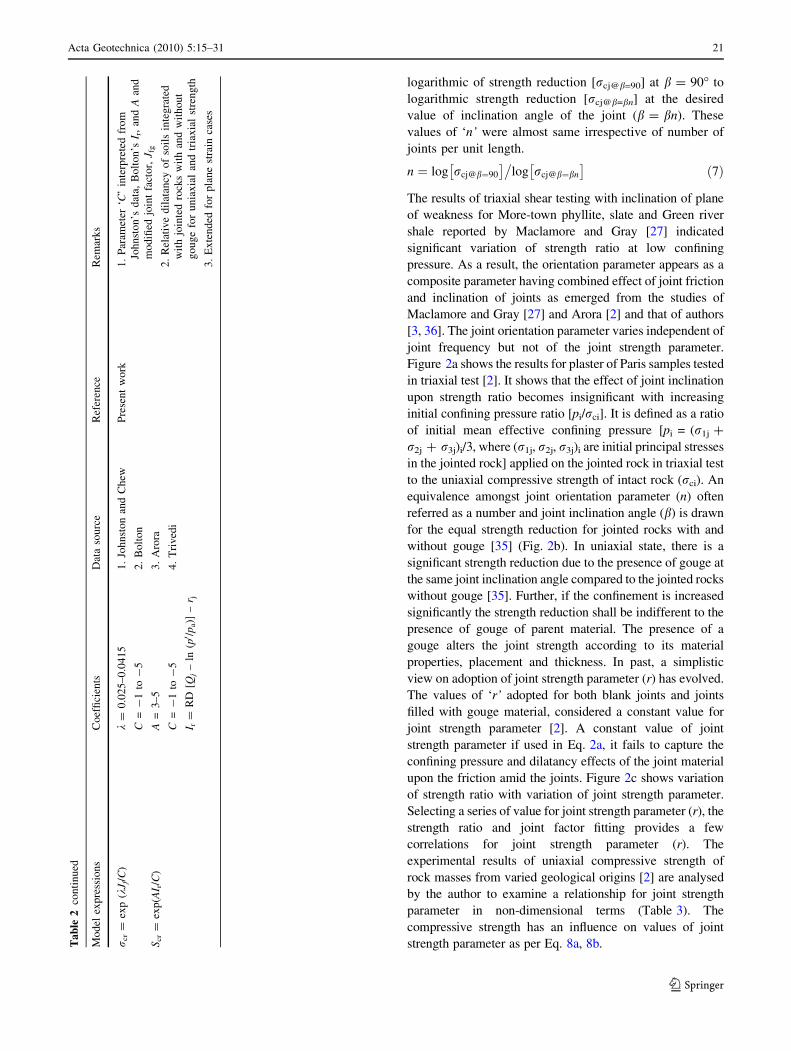
strength parameter as per Eq. 8a, 8b.Ta
ble
2co
nti
nu
ed
Mo
del
exp
ress
ion
sC
oef
fici
ents
Dat
aso
urc
eR
efer
ence
Rem
ark
s
rcr
=ex
p(k
J f/C
)k
=0
.02
5–
0.0
41
5
C=
-1
to-
5
1.
Joh
nst
on
and
Ch
ew
2.
Bo
lto
n
3.
Aro
ra
4.
Tri
ved
i
Pre
sen
tw
ork
1.
Par
amet
er‘C
’in
terp
rete
dfr
om
Joh
nst
on
’sd
ata,
Bo
lto
n’s
I r,
and
Aan
d
mo
difi
edjo
int
fact
or,
J fg
2.
Rel
ativ
ed
ilat
ancy
of
soil
sin
teg
rate
d
wit
hjo
inte
dro
cks
wit
han
dw
ith
ou
t
go
ug
efo
ru
nia
xia
lan
dtr
iax
ial
stre
ng
th
3.
Ex
ten
ded
for
pla
ne
stra
inca
ses
Scr
=ex
p(A
I r/C
)A
=3
–5
C=
-1
to-
5
I r=
RD
[Qj
–ln
(p0 /
pa)]
–r j
Acta Geotechnica (2010) 5:15–31 21
123
0
0.1
0.2
0.3
0.4
0.5
0.6
0.7
0.8
0.9
1
Join
t Ori
enta
tion
Para
met
er (
n)
Joint Inclination Angle (β)
Blank Joints
Gouged Joints
0 10 20 30 40 50 60 70 80 90
0.0
0.1
0.2
0.3
0.4
0.5
0.6
0.7
0.8
0.9
1.0
0 100 200 300 400 500 600 700
Stre
ngth
Rat
io
Jf
(c)
(b)
Equation (6)Equation (8b)Expon. (Equation (6))Expon.
y = exp (-0.008 Jf)y = exp (-0.01 Jf)
1
1.2
0.80.0265
0.0442
0.4
0.60.0884
0.1327
0.2
0.1769
0.4424
00 10 20 30 40 50 60 70 80 90
Mea
n E
ffec
tive
Con
fini
ng P
ress
ure
Rat
io a
t Fai
lure
Joint Orientation Angle
0.6194
(a)
Fig. 2 a Effect of joint orientation on mean effective confining pressure ratio at failure. b Relationship of joint orientation parameter with joint
inclination angle. c Strength ratio versus Jf at varying joint roughness factor
22 Acta Geotechnica (2010) 5:15–31
123
rci ¼ aci ln rci=rað Þ þ bci ð8aÞ
rcj ¼ acj ln rcj=ra
� �þ bcj ð8bÞ
where rcj = Uniaxial compressive strength of jointed rock
in kPa and ra = 1 kPa. a and b are fitting constants given
in Table 4.
The Eq. 8b calls for a necessity of adjustments for joint
strength parameter with a consideration of logarithmic of
pressure on the joint material. Keeping the same values of
joint number and orientation, if the joint strength parameter
is adopted as per Eq. 8b, RAC [29] and a fixed r (/j = p/4;
tan /j = 1), respectively; a gradual drop in the strength
ratio is observed (Fig. 2c).
This observation supports the effect of reduction of joint
strength parameter leading to increasing joint factor and
consequent strength reduction. In Hoek and Brown crite-
rion [17, 18], the increasing confinements have similar
effect of a non-linear strength reduction. There had been
subjectivity in the interpretation of joint factor (Table 2)
particularly in relation to joint strength parameter. Various
investigators [2, 19, 29, 32, 35] considered it arbitrarily as a
constant friction factor independent of dilatancy. In the
present framework, the author correlated the resultant
friction due to the joints with the dilatancy of the joint
material.
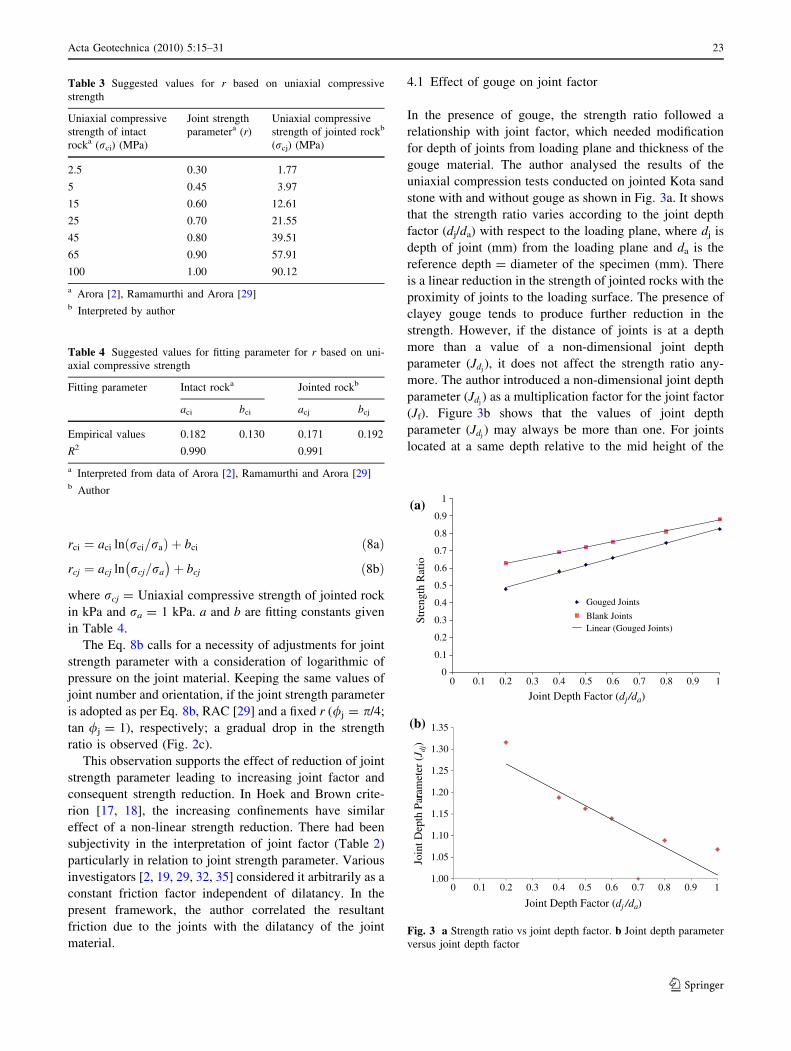
4.1 Effect of gouge on joint factor
In the presence of gouge, the strength ratio followed a
relationship with joint factor, which needed modification
for depth of joints from loading plane and thickness of the
gouge material. The author analysed the results of the
uniaxial compression tests conducted on jointed Kota sand
stone with and without gouge as shown in Fig. 3a. It shows
that the strength ratio varies according to the joint depth
factor (dj/da) with respect to the loading plane, where dj is
depth of joint (mm) from the loading plane and da is the
reference depth = diameter of the specimen (mm). There
is a linear reduction in the strength of jointed rocks with the
proximity of joints to the loading surface. The presence of
clayey gouge tends to produce further reduction in the
strength. However, if the distance of joints is at a depth
more than a value of a non-dimensional joint depth
parameter (Jdj), it does not affect the strength ratio any-
more. The author introduced a non-dimensional joint depth
parameter (Jdj) as a multiplication factor for the joint factor
(Jf). Figure 3b shows that the values of joint depth
parameter (Jdj) may always be more than one. For joints
located at a same depth relative to the mid height of the
Table 3 Suggested values for r based on uniaxial compressive
strength
Uniaxial compressive
strength of intact
rocka (rci) (MPa)
Joint strength
parametera (r)
Uniaxial compressive
strength of jointed rockb
(rcj) (MPa)
2.5 0.30 1.77
5 0.45 3.97
15 0.60 12.61
25 0.70 21.55
45 0.80 39.51
65 0.90 57.91
100 1.00 90.12
a Arora [2], Ramamurthi and Arora [29]b Interpreted by author
Table 4 Suggested values for fitting parameter for r based on uni-
axial compressive strength
Fitting parameter Intact rocka Jointed rockb
aci bci acj bcj
Empirical values 0.182 0.130 0.171 0.192
R2 0.990 0.991
a Interpreted from data of Arora [2], Ramamurthi and Arora [29]b Author
0
0.1
0.2
0.3
0.4
0.5
0.6
0.7
0.8
0.9
1
0 0.1 0.2 0.3 0.4 0.5 0.6 0.7 0.8 0.9 1
Stre
ngth
Rat
io
Joint Depth Factor (dj/da)
Gouged Joints
Blank Joints
1.20
1.25
1.30
1.35
1.00
1.05
1.10
1.15
ram
eter
(J d
j)Jo
int D
epth
Par
Joint Depth Factor (dj /da)
0 0.1 0.2 0.3 0.4 0.5 0.6 0.7 0.8 0.9 1
(b)
(a)
Linear (Gouged Joints)
Fig. 3 a Strength ratio vs joint depth factor. b Joint depth parameter
versus joint depth factor
Acta Geotechnica (2010) 5:15–31 23
123
sample, its value is taken as unity. Further, it does not
remain a relevant factor for joints located at significant
depths as the case may arise frequently in the field.
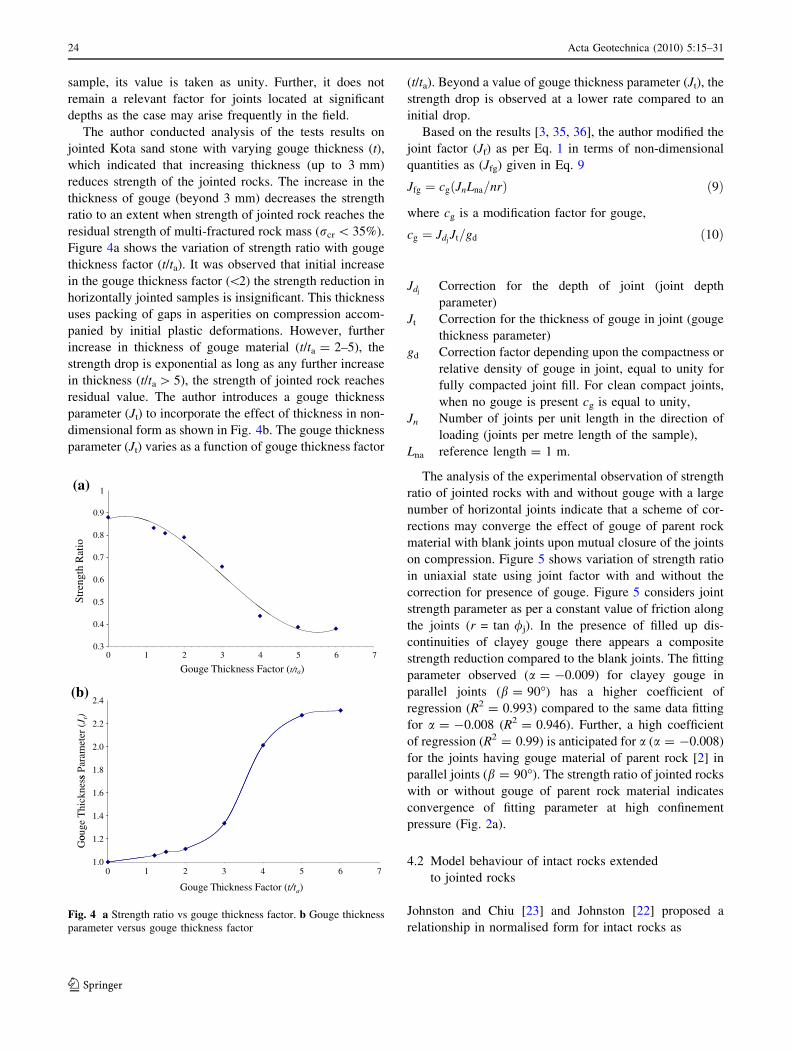
The author conducted analysis of the tests results on
jointed Kota sand stone with varying gouge thickness (t),
which indicated that increasing thickness (up to 3 mm)
reduces strength of the jointed rocks. The increase in the
thickness of gouge (beyond 3 mm) decreases the strength
ratio to an extent when strength of jointed rock reaches the
residual strength of multi-fractured rock mass (rcr \ 35%).
Figure 4a shows the variation of strength ratio with gouge
thickness factor (t/ta). It was observed that initial increase
in the gouge thickness factor (\2) the strength reduction in
horizontally jointed samples is insignificant. This thickness
uses packing of gaps in asperities on compression accom-
panied by initial plastic deformations. However, further
increase in thickness of gouge material (t/ta = 2–5), the
strength drop is exponential as long as any further increase
in thickness (t/ta [ 5), the strength of jointed rock reaches
residual value. The author introduces a gouge thickness
parameter (Jt) to incorporate the effect of thickness in non-
dimensional form as shown in Fig. 4b. The gouge thickness
parameter (Jt) varies as a function of gouge thickness factor
(t/ta). Beyond a value of gouge thickness parameter (Jt), the
strength drop is observed at a lower rate compared to an
initial drop.
Based on the results [3, 35, 36], the author modified the
joint factor (Jf) as per Eq. 1 in terms of non-dimensional
quantities as (Jfg) given in Eq. 9
Jfg ¼ cg JnLna=nrð Þ ð9Þ
where cg is a modification factor for gouge,
cg ¼ JdjJt=gd ð10Þ
JdjCorrection for the depth of joint (joint depth
parameter)
Jt Correction for the thickness of gouge in joint (gouge
thickness parameter)
gd Correction factor depending upon the compactness or
relative density of gouge in joint, equal to unity for
fully compacted joint fill. For clean compact joints,
when no gouge is present cg is equal to unity,
Jn Number of joints per unit length in the direction of
loading (joints per metre length of the sample),
Lna reference length = 1 m.
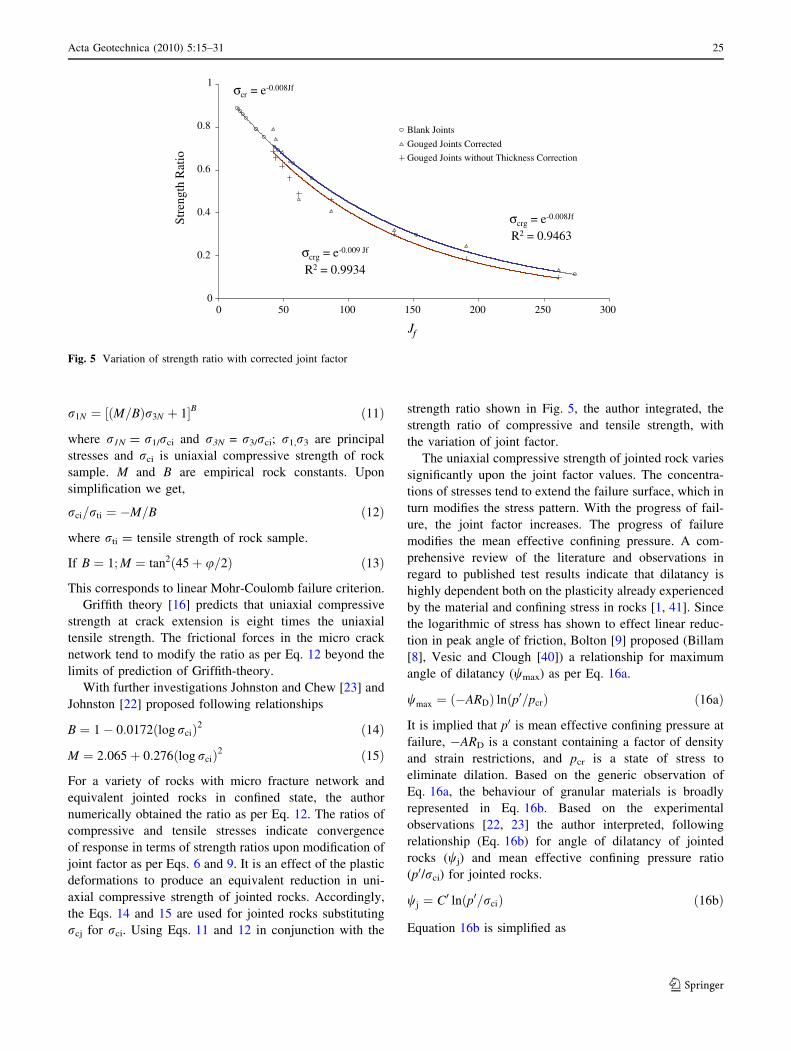
The analysis of the experimental observation of strength
ratio of jointed rocks with and without gouge with a large
number of horizontal joints indicate that a scheme of cor-
rections may converge the effect of gouge of parent rock
material with blank joints upon mutual closure of the joints
on compression. Figure 5 shows variation of strength ratio
in uniaxial state using joint factor with and without the
correction for presence of gouge. Figure 5 considers joint
strength parameter as per a constant value of friction along
the joints (r = tan /j). In the presence of filled up dis-
continuities of clayey gouge there appears a composite
strength reduction compared to the blank joints. The fitting
parameter observed (a = -0.009) for clayey gouge in
parallel joints (b = 90�) has a higher coefficient of
regression (R2 = 0.993) compared to the same data fitting
for a = -0.008 (R2 = 0.946). Further, a high coefficient
of regression (R2 = 0.99) is anticipated for a (a = -0.008)
for the joints having gouge material of parent rock [2] in
parallel joints (b = 90�). The strength ratio of jointed rocks
with or without gouge of parent rock material indicates
convergence of fitting parameter at high confinement
pressure (Fig. 2a).
4.2 Model behaviour of intact rocks extended
to jointed rocks
Johnston and Chiu [23] and Johnston [22] proposed a
relationship in normalised form for intact rocks as
0.9
1
0.8
0.7
0.5
0.6
Stre
ngth
Rat
io
0.4
0.30 1 2 3 4 5 6 7
Gouge Thickness Factor (t/ta)
2.4
2.2
2.0
1.8
1.4
1.6
1.2
s Pa
ram
eter
(J t
)ou
ge T
hick
ness
Go
1.00 1 2 3 4 5 6 7
Gouge Thickness Factor (t/ta)
(b)
(a)
Fig. 4 a Strength ratio vs gouge thickness factor. b Gouge thickness
parameter versus gouge thickness factor
24 Acta Geotechnica (2010) 5:15–31
123
r1N ¼ M=Bð Þr3N þ 1½ �B ð11Þ
where r1N = r1/rci and r3N = r3/rci; r1,r3 are principal
stresses and rci is uniaxial compressive strength of rock
sample. M and B are empirical rock constants. Upon
simplification we get,
rci=rti ¼ �M=B ð12Þ
where rti = tensile strength of rock sample.
If B ¼ 1; M ¼ tan2 45þ u=2ð Þ ð13Þ
This corresponds to linear Mohr-Coulomb failure criterion.
Griffith theory [16] predicts that uniaxial compressive
strength at crack extension is eight times the uniaxial
tensile strength. The frictional forces in the micro crack
network tend to modify the ratio as per Eq. 12 beyond the
limits of prediction of Griffith-theory.
With further investigations Johnston and Chew [23] and
Johnston [22] proposed following relationships
B ¼ 1� 0:0172 log rcið Þ2 ð14Þ
M ¼ 2:065þ 0:276 log rcið Þ2 ð15Þ
For a variety of rocks with micro fracture network and
equivalent jointed rocks in confined state, the author
numerically obtained the ratio as per Eq. 12. The ratios of
compressive and tensile stresses indicate convergence
of response in terms of strength ratios upon modification of
joint factor as per Eqs. 6 and 9. It is an effect of the plastic
deformations to produce an equivalent reduction in uni-
axial compressive strength of jointed rocks. Accordingly,
the Eqs. 14 and 15 are used for jointed rocks substituting
rcj for rci. Using Eqs. 11 and 12 in conjunction with the
strength ratio shown in Fig. 5, the author integrated, the
strength ratio of compressive and tensile strength, with
the variation of joint factor.
The uniaxial compressive strength of jointed rock varies
significantly upon the joint factor values. The concentra-
tions of stresses tend to extend the failure surface, which in
turn modifies the stress pattern. With the progress of fail-
ure, the joint factor increases. The progress of failure
modifies the mean effective confining pressure. A com-
prehensive review of the literature and observations in
regard to published test results indicate that dilatancy is
highly dependent both on the plasticity already experienced
by the material and confining stress in rocks [1, 41]. Since
the logarithmic of stress has shown to effect linear reduc-
tion in peak angle of friction, Bolton [9] proposed (Billam
[8], Vesic and Clough [40]) a relationship for maximum
angle of dilatancy (wmax) as per Eq. 16a.
wmax ¼ �ARDð Þ ln p0=pcrð Þ ð16aÞ
It is implied that p0 is mean effective confining pressure at
failure, -ARD is a constant containing a factor of density
and strain restrictions, and pcr is a state of stress to
eliminate dilation. Based on the generic observation of
Eq. 16a, the behaviour of granular materials is broadly
represented in Eq. 16b. Based on the experimental
observations [22, 23] the author interpreted, following
relationship (Eq. 16b) for angle of dilatancy of jointed
rocks (wj) and mean effective confining pressure ratio
(p0/rci) for jointed rocks.
wj ¼ C0 ln p0=rcið Þ ð16bÞ
Equation 16b is simplified as
σcr = e-0.008Jf
σcrg = e-0.008Jf
R2 = 0.9463σcrg = e-0.009 Jf
R2 = 0.9934
0
0.2
0.4
0.6
0.8
1
0 50 100 150 200 250 300
Stre
ngth
Rat
io
Jf
Blank Joints
Gouged Joints Corrected
Gouged Joints without Thickness Correction
Fig. 5 Variation of strength ratio with corrected joint factor
Acta Geotechnica (2010) 5:15–31 25
123
wj ¼ C ln 3p0=rcið Þ ð16cÞ
wj ¼ C ln rcrð Þ ð16dÞ
Therefore, in triaxial condition at failure
rcr ¼ exp wj=Ch i
ð17Þ
wj = angle of dilation for jointed rock corresponding to a
mean effective confining pressure at failure (p0) relative to
intact rock failure (rci).
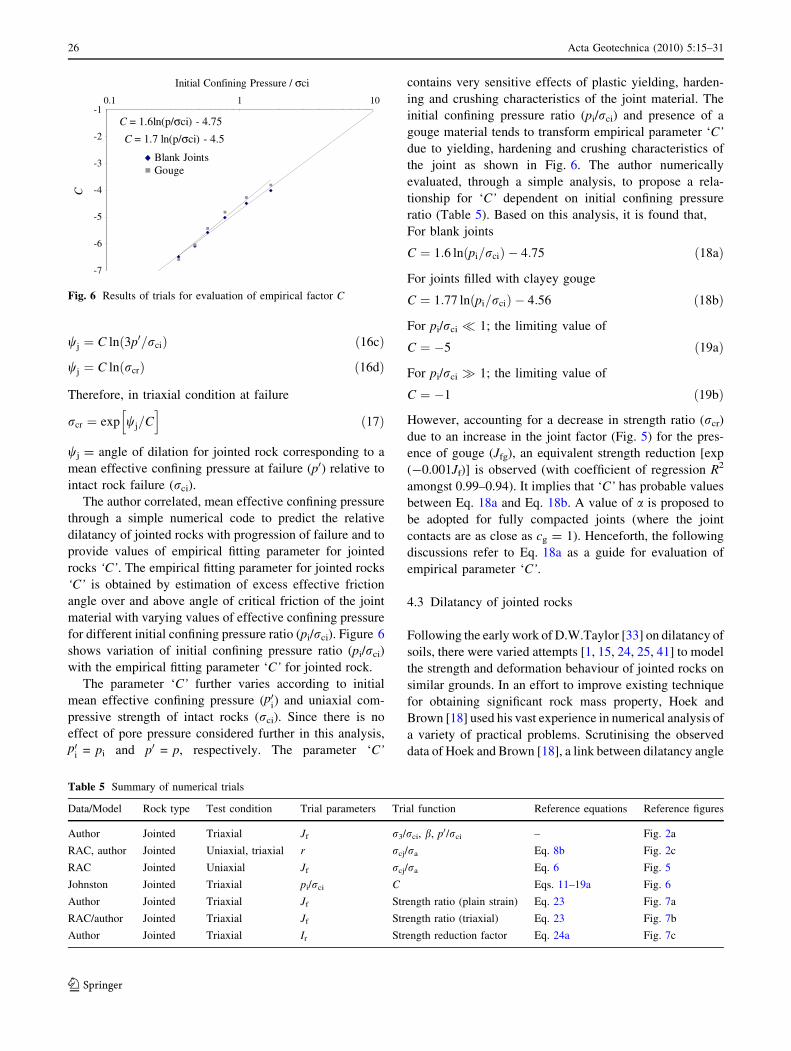
The author correlated, mean effective confining pressure
through a simple numerical code to predict the relative
dilatancy of jointed rocks with progression of failure and to
provide values of empirical fitting parameter for jointed
rocks ‘C’. The empirical fitting parameter for jointed rocks
‘C’ is obtained by estimation of excess effective friction
angle over and above angle of critical friction of the joint
material with varying values of effective confining pressure
for different initial confining pressure ratio (pi/rci). Figure 6
shows variation of initial confining pressure ratio (pi/rci)
with the empirical fitting parameter ‘C’ for jointed rock.
The parameter ‘C’ further varies according to initial
mean effective confining pressure (p0i) and uniaxial com-
pressive strength of intact rocks (rci). Since there is no
effect of pore pressure considered further in this analysis,p0
i = pi and p0 = p, respectively. The parameter ‘C’
contains very sensitive effects of plastic yielding, harden-
ing and crushing characteristics of the joint material. The
initial confining pressure ratio (pi/rci) and presence of a
gouge material tends to transform empirical parameter ‘C’
due to yielding, hardening and crushing characteristics of
the joint as shown in Fig. 6. The author numerically
evaluated, through a simple analysis, to propose a rela-
tionship for ‘C’ dependent on initial confining pressure
ratio (Table 5). Based on this analysis, it is found that,
For blank joints
C ¼ 1:6 ln pi=rcið Þ � 4:75 ð18aÞ
For joints filled with clayey gouge
C ¼ 1:77 ln pi=rcið Þ � 4:56 ð18bÞ
For pi/rci � 1; the limiting value of
C ¼ �5 ð19aÞ
For pi/rci � 1; the limiting value of
C ¼ �1 ð19bÞ
However, accounting for a decrease in strength ratio (rcr)
due to an increase in the joint factor (Fig. 5) for the pres-
ence of gouge (Jfg), an equivalent strength reduction [exp
(-0.001Jf)] is observed (with coefficient of regression R2
amongst 0.99–0.94). It implies that ‘C’ has probable values
between Eq. 18a and Eq. 18b. A value of a is proposed to
be adopted for fully compacted joints (where the joint
contacts are as close as cg = 1). Henceforth, the following
discussions refer to Eq. 18a as a guide for evaluation of
empirical parameter ‘C’.
4.3 Dilatancy of jointed rocks
Following the early work of D.W.Taylor [33] on dilatancy of
soils, there were varied attempts [1, 15, 24, 25, 41] to model
the strength and deformation behaviour of jointed rocks on
similar grounds. In an effort to improve existing technique
for obtaining significant rock mass property, Hoek and
Brown [18] used his vast experience in numerical analysis of
a variety of practical problems. Scrutinising the observed
data of Hoek and Brown [18], a link between dilatancy angle
Table 5 Summary of numerical trials
Data/Model Rock type Test condition Trial parameters Trial function Reference equations Reference figures
Author Jointed Triaxial Jf r3/rci, b, p0/rci – Fig. 2a
RAC, author Jointed Uniaxial, triaxial r rcj/ra Eq. 8b Fig. 2c
RAC Jointed Uniaxial Jf rcj/ra Eq. 6 Fig. 5
Johnston Jointed Triaxial pi/rci C Eqs. 11–19a Fig. 6
Author Jointed Triaxial Jf Strength ratio (plain strain) Eq. 23 Fig. 7a
RAC/author Jointed Triaxial Jf Strength ratio (triaxial) Eq. 23 Fig. 7b
Author Jointed Triaxial Ir Strength reduction factor Eq. 24a Fig. 7c
C = 1.6ln(p/σci) - 4.75
C = 1.7 ln(p/σci) - 4.5
-7
-6
-5
-4
-3
-2
-11010.1
CInitial Confining Pressure / σci
Blank JointsGouge
Fig. 6 Results of trials for evaluation of empirical factor C
26 Acta Geotechnica (2010) 5:15–31
123
and friction angle can be found. Interestingly, designated
rock mass quality is a good quality rock for w = //4 and a
poor quality rock for w = 0. Alejano and Alonso [1] reports
the interesting fact about this approach that reflects the
significant error induced in design calculation when a simple
associated flow rule is considered. Significantly, it happens
because of dilatancy consideration independent of confining
pressure. Hoek and Brown [18] also suggested a transition
from brittle to perfectly plastic rock masses for decreasing
rock mass quality. The volume change behaviour of rock
joint material is localised in the zone of shear for lower value
of joint number, whilst it shall be distributed well throughout
the rock mass for higher value of joint number. Therefore, an
average value of volume change is inherently interpretive in
nature. As an effect of volume change, during the shear, the
value of joint strength parameter does not remain constant.
During shear, the joints dilate to increase the joint factor as a
compressed function of the state of stress, compactness of
joints and material characteristics of the gouge, which in
actual practise are difficult to measure but easier to predict if
the concept of stress dilatancy [8, 9, 13, 30, 40] is used for
the rock joints.
Bolton [9] proposed an empirical equation for dilatancy
of soils
wmax ¼ AIr ð20Þ
where A is an empirical constant and has the value of three
for axe-symmetrical and five for plane strain conditions;
and Ir is a relative dilatancy index which is a function of
dilatancy angle (w). The dilatancy for soils is a value of wconsidered over and above the angle of critical friction
(/cn). /cn is constant volume friction angle also referred as
angle of critical friction of joint material, which is a
material characteristic. It is often approximated equal to
residual state friction angle of the joint material. In case of
rock masses, upon shearing it dilates and causes reduction
in its strength below the intact rocks. Henceforth, the
increasing values of Ir and w are essentially associated with
a strength reduction.
According to Bolton [9], relative dilatancy for granular
material is
Ir ¼ 10=3 �dev=de1½ � ð21Þ
where ev is the volumetric strain in the zone of shear and
e1 the axial strain.
Since the joint factor Jf is related to the joint strength
parameter ‘r’ which is a derivative of joint friction, it is
advanced for dilatancy of jointed rocks at very large value
of joint factor that
/peak � /j ¼ kJf ð22Þ
where k is an empirical fitting constant, /peak is peak angle
of internal friction; /j is angle of internal friction for
jointed rock. When Jf is very large (say Jf = 1,000), the
limiting value of /j = /cn and then k takes a typical value
[=0.025] for axe-symmetrical case and a typical value
[=0.0415] for plane strain. It indicates a reduction for peak
friction angle (25� for axe-symmetrical and 41.1� for plane
strain case). The values of k are obtained by data substi-
tution in the numerical trials for typical sand stone joints.
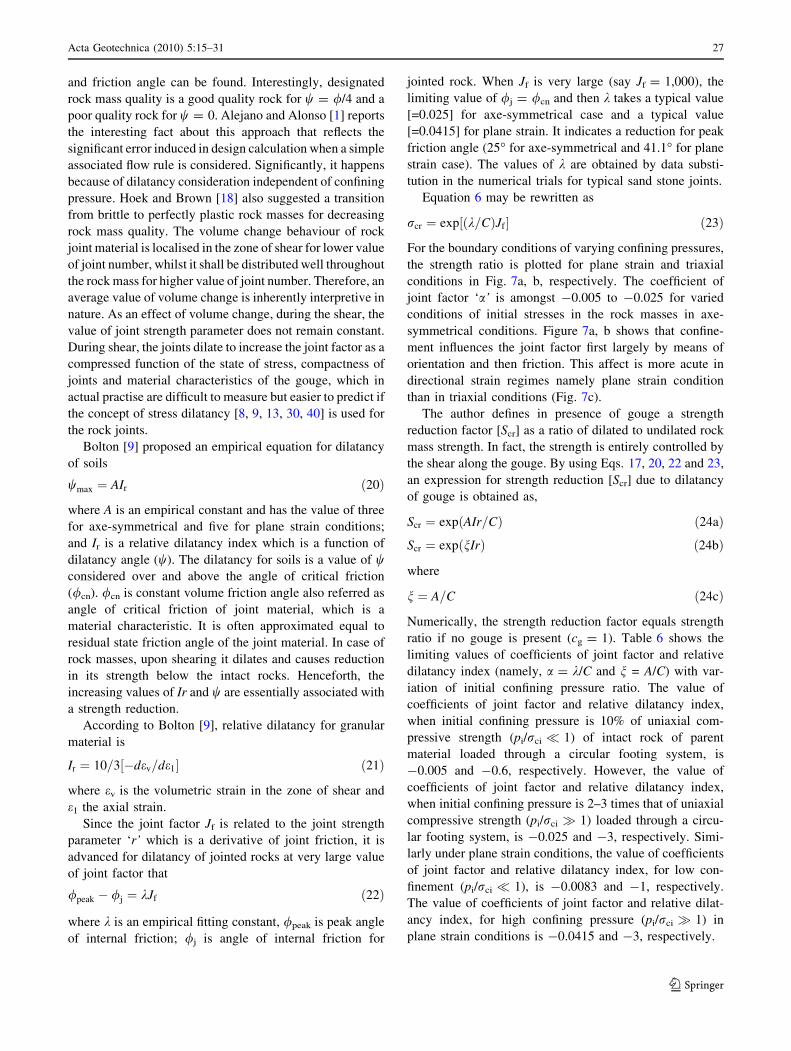
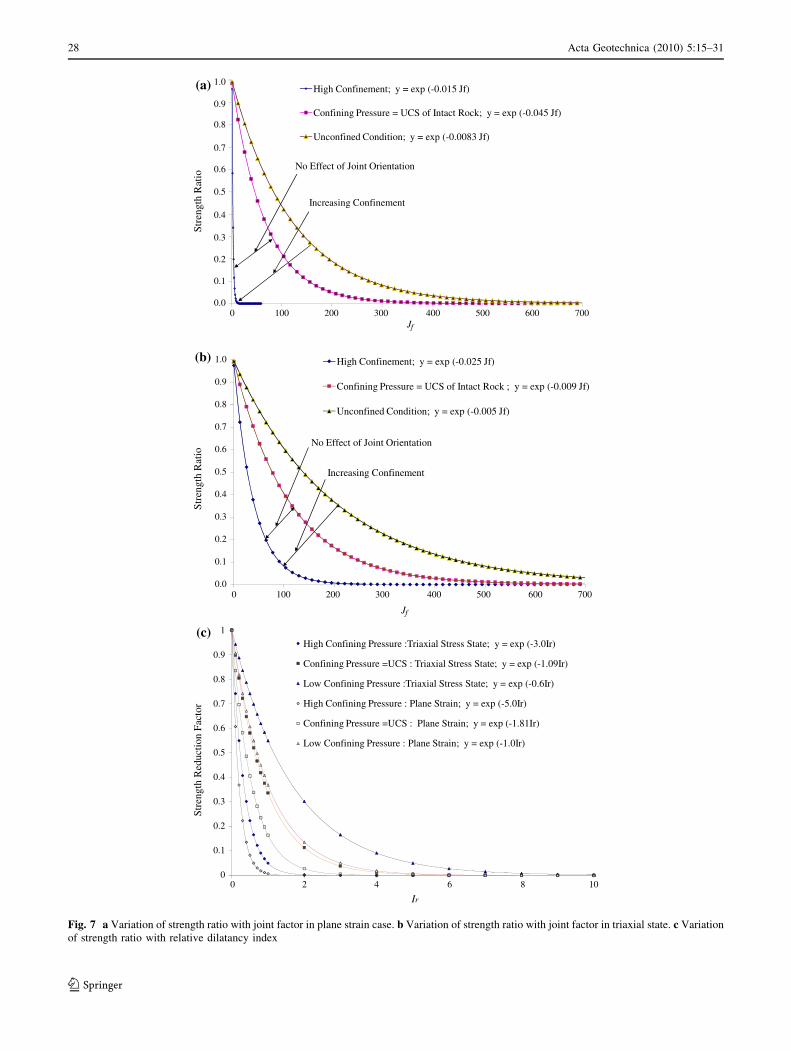
Equation 6 may be rewritten as
rcr ¼ exp k=Cð ÞJf½ � ð23Þ
For the boundary conditions of varying confining pressures,
the strength ratio is plotted for plane strain and triaxial
conditions in Fig. 7a, b, respectively. The coefficient of
joint factor ‘a’ is amongst -0.005 to -0.025 for varied
conditions of initial stresses in the rock masses in axe-
symmetrical conditions. Figure 7a, b shows that confine-
ment influences the joint factor first largely by means of
orientation and then friction. This affect is more acute in
directional strain regimes namely plane strain condition
than in triaxial conditions (Fig. 7c).
The author defines in presence of gouge a strength
reduction factor [Scr] as a ratio of dilated to undilated rock
mass strength. In fact, the strength is entirely controlled by
the shear along the gouge. By using Eqs. 17, 20, 22 and 23,
an expression for strength reduction [Scr] due to dilatancy
of gouge is obtained as,
Scr ¼ exp AIr=Cð Þ ð24aÞScr ¼ exp nIrð Þ ð24bÞ
where
n ¼ A=C ð24cÞ
Numerically, the strength reduction factor equals strength
ratio if no gouge is present (cg = 1). Table 6 shows the
limiting values of coefficients of joint factor and relative
dilatancy index (namely, a = k/C and n = A/C) with var-
iation of initial confining pressure ratio. The value of
coefficients of joint factor and relative dilatancy index,
when initial confining pressure is 10% of uniaxial com-
pressive strength (pi/rci � 1) of intact rock of parent
material loaded through a circular footing system, is
-0.005 and -0.6, respectively. However, the value of
coefficients of joint factor and relative dilatancy index,
when initial confining pressure is 2–3 times that of uniaxial
compressive strength (pi/rci � 1) loaded through a circu-
lar footing system, is -0.025 and -3, respectively. Simi-
larly under plane strain conditions, the value of coefficients
of joint factor and relative dilatancy index, for low con-
finement (pi/rci � 1), is -0.0083 and -1, respectively.
The value of coefficients of joint factor and relative dilat-
ancy index, for high confining pressure (pi/rci � 1) in
plane strain conditions is -0.0415 and -3, respectively.
Acta Geotechnica (2010) 5:15–31 27
123
0.5
0.6
0.7
0.8
0.9
1.0
0.0
0.1
0.2
0.3
0.4
0 100 200 300 400 500 600 700
Stre
ngth
Rat
ioSt
reng
th R
atio
Jf
Jf
0.6
0.7
0.8
0.9
1.0
0.0
0.1
0.2
0.3
0.4
0.5
0 100 200 300 400 500 600 700
(a)
(b)
0.5
0.6
0.7
0.8
0.9
1
0
0.1
0.2
0.3
0.4
0 2 4 6 8 10
Stre
ngth
Red
uctio
n Fa
ctor
Ir
(c)High Confining Pressure :Triaxial Stress State; y = exp (-3.0Ir)
Confining Pressure =UCS : Triaxial Stress State; y = exp (-1.09Ir)
Low Confining Pressure :Triaxial Stress State; y = exp (-0.6Ir)
High Confining Pressure : Plane Strain; y = exp (-5.0Ir)
Confining Pressure =UCS : Plane Strain; y = exp (-1.81Ir)
Low Confining Pressure : Plane Strain; y = exp (-1.0Ir)
High Confinement; y = exp (-0.025 Jf)
Confining Pressure = UCS of Intact Rock ; y = exp (-0.009 Jf)
Unconfined Condition; y = exp (-0.005 Jf)
Increasing Confinement
No Effect of Joint Orientation
High Confinement; y = exp (-0.015 Jf)
Confining Pressure = UCS of Intact Rock; y = exp (-0.045 Jf)
Unconfined Condition; y = exp (-0.0083 Jf)
Increasing Confinement
No Effect of Joint Orientation
Fig. 7 a Variation of strength ratio with joint factor in plane strain case. b Variation of strength ratio with joint factor in triaxial state. c Variation
of strength ratio with relative dilatancy index
28 Acta Geotechnica (2010) 5:15–31
123
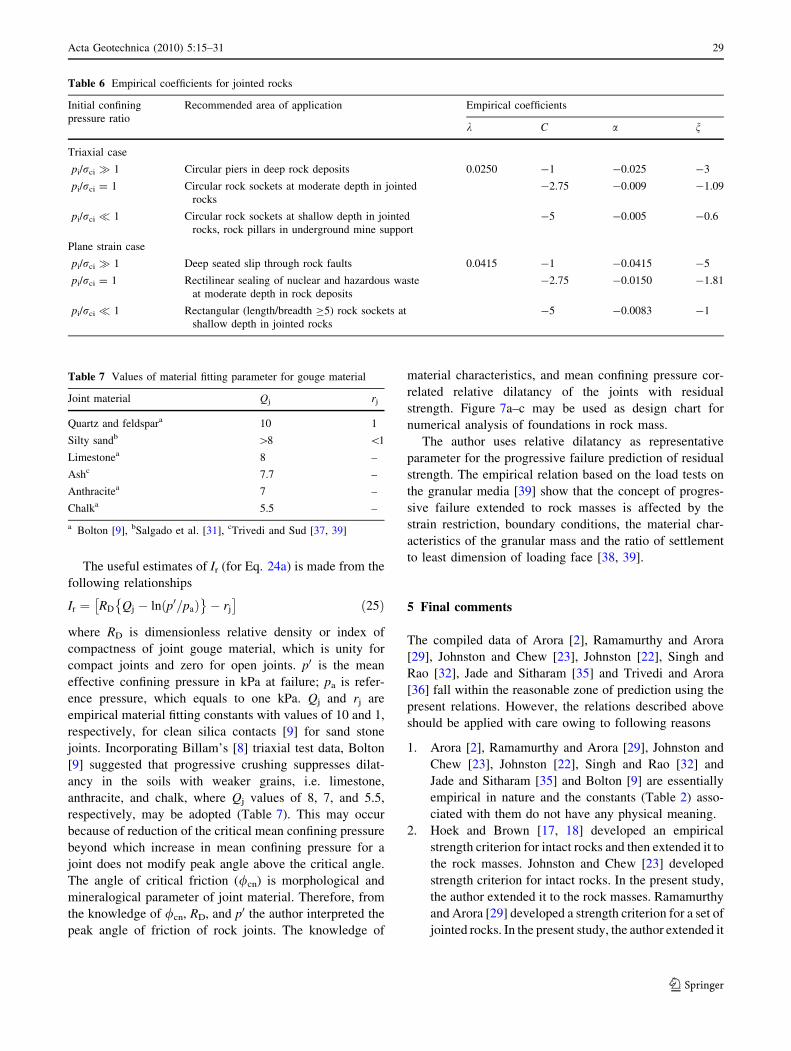
The useful estimates of Ir (for Eq. 24a) is made from the
following relationships
Ir ¼ RD Qj � ln p0=pað Þ� �
� rj
� �ð25Þ
where RD is dimensionless relative density or index of
compactness of joint gouge material, which is unity for
compact joints and zero for open joints. p0 is the mean
effective confining pressure in kPa at failure; pa is refer-
ence pressure, which equals to one kPa. Qj and rj are
empirical material fitting constants with values of 10 and 1,
respectively, for clean silica contacts [9] for sand stone
joints. Incorporating Billam’s [8] triaxial test data, Bolton
[9] suggested that progressive crushing suppresses dilat-
ancy in the soils with weaker grains, i.e. limestone,
anthracite, and chalk, where Qj values of 8, 7, and 5.5,
respectively, may be adopted (Table 7). This may occur
because of reduction of the critical mean confining pressure
beyond which increase in mean confining pressure for a
joint does not modify peak angle above the critical angle.
The angle of critical friction (/cn) is morphological and
mineralogical parameter of joint material. Therefore, from
the knowledge of /cn, RD, and p0 the author interpreted the
peak angle of friction of rock joints. The knowledge of
material characteristics, and mean confining pressure cor-
related relative dilatancy of the joints with residual
strength. Figure 7a–c may be used as design chart for
numerical analysis of foundations in rock mass.
The author uses relative dilatancy as representative
parameter for the progressive failure prediction of residual
strength. The empirical relation based on the load tests on
the granular media [39] show that the concept of progres-
sive failure extended to rock masses is affected by the
strain restriction, boundary conditions, the material char-
acteristics of the granular mass and the ratio of settlement
to least dimension of loading face [38, 39].
5 Final comments
The compiled data of Arora [2], Ramamurthy and Arora
[29], Johnston and Chew [23], Johnston [22], Singh and
Rao [32], Jade and Sitharam [35] and Trivedi and Arora
[36] fall within the reasonable zone of prediction using the
present relations. However, the relations described above
should be applied with care owing to following reasons
1. Arora [2], Ramamurthy and Arora [29], Johnston and
Chew [23], Johnston [22], Singh and Rao [32] and
Jade and Sitharam [35] and Bolton [9] are essentially
empirical in nature and the constants (Table 2) asso-
ciated with them do not have any physical meaning.
2. Hoek and Brown [17, 18] developed an empirical
strength criterion for intact rocks and then extended it to
the rock masses. Johnston and Chew [23] developed
strength criterion for intact rocks. In the present study,
the author extended it to the rock masses. Ramamurthy
and Arora [29] developed a strength criterion for a set of
jointed rocks. In the present study, the author extended it
Table 6 Empirical coefficients for jointed rocks
Initial confining
pressure ratio
Recommended area of application Empirical coefficients
k C a n
Triaxial case
pi/rci � 1 Circular piers in deep rock deposits 0.0250 -1 -0.025 -3
pi/rci = 1 Circular rock sockets at moderate depth in jointed
rocks
-2.75 -0.009 -1.09
pi/rci � 1 Circular rock sockets at shallow depth in jointed
rocks, rock pillars in underground mine support
-5 -0.005 -0.6
Plane strain case
pi/rci � 1 Deep seated slip through rock faults 0.0415 -1 -0.0415 -5
pi/rci = 1 Rectilinear sealing of nuclear and hazardous waste
at moderate depth in rock deposits
-2.75 -0.0150 -1.81
pi/rci � 1 Rectangular (length/breadth C5) rock sockets at
shallow depth in jointed rocks
-5 -0.0083 -1
Table 7 Values of material fitting parameter for gouge material
Joint material Qj rj
Quartz and feldspara 10 1
Silty sandb [8 \1
Limestonea 8 –
Ashc 7.7 –
Anthracitea 7 –
Chalka 5.5 –
a Bolton [9], bSalgado et al. [31], cTrivedi and Sud [37, 39]
Acta Geotechnica (2010) 5:15–31 29
123
to the various rock masses. The process used for the
development of strength criteria [17, 23] was one of pure
trial and error. Apart from conceptual starting point
provided by Griffith theory [16], there is no fundamental
relationship between the empirical constants included in
any of strength criterion and any physical characteristics
of the rock [42]. Because of the empirical nature of
strength criterion of rock masses, it is uncertain if it will
adequately predict the behaviour of all the rock masses.
3. The strength ratio considers the strength of jointed and
intact rock for the same size of sample therefore size
effects are assumed discounted. However, in practise,
the size effects may not be linearly discounted.
4. The failure as assumed for axe-symmetrical and plane
strain case is similar to that in soil mechanics, which
implicitly assumes that rock mass is isotropic and that
continuum behaviour prevails. In practise, contrary to
the assumption, the rock mass may be an-isotropic and
the rock failure may be discontinuous.
5. The values of peak friction of the rock masses are
estimated with greater certainty than the angle of critical
friction contrary to the case of soils. Hence, dilatancy for
soils is recognised as value of w considered over and
above the angle of critical friction /cn, whilst in case of
rock masses it is assumed to dilate and cause reduction
in strength below the peak strength. Therefore, the
increasing values of Ir and w for rock masses are
essentially associated with a strength reduction.
6. Whilst gouge within the joints undergoes volume
change, the strength reduction may accompany first,
due to strain softening of gouge and second, the
reduction in peak strength due to damage in the jointed
rock mass. The strength reduction factor considers
both the parts but largely the first. In order to isolate
the effects of damage accompanying dilation of gouge,
there is a need to fine-tune the results.
7. The purpose of the present relations is to provide a
framework to handle dilatancy problem with confining
pressure than to precisely predict strength of jointed
rocks.
The limitations described above account for the differ-
ence between the proposed relationship for the strength
ratio and the test data.
6 Conclusions
This paper describes an approach to find strength of jointed
rocks with and without gouge in terms of empirically
established joint factor (Jf). Historically, the joint factor is
adopted in relation to a constant joint strength parameter
(r), constant joint orientation parameter (n), constant
number of joints (Jn), and modification factor for gouge
(cg) in terms of gouge thickness (t), compactness of fill
material (gd) and distance of joints from loading plane (dj).
These consideration bring forth multiplicity in interpreta-
tion of empirical joint factor and hence strength ratio (rcr).
The joint strength parameter, joint orientation parameter,
number of joints and modification factor for gouge (cg) gets
altered according to initial confining pressure (pi) and
stress conditions of plain strain and triaxial states.
The dependencies of joint factor on initial confining
pressure provide input to a numerical technique to incor-
porate these effects in the strength ratio. Comparing the
results of the proposed model with the test data indicated
that multiplicity appearing in the interpretation of strength
ratio is essentially due to dilatancy. This paper considers
the effect of dilatancy in varied confinement conditions in
plane strain and axe-symmetrical case on strength by
coefficients (k, C and n) of readily estimated joint factor,
and clearly recognised relative dilatancy index (Ir) for
granular soils. These coefficients are presented along with
its potential area of application in rock mechanic designs.
The main advantage of this model is to provide estimate of
the strength of jointed rocks in terms of the already
established parameters (Jf and Ir). The relationship for
strength and relative dilatancy index tends to resolve the
diversity in interpretation of the behaviour of jointed rocks
and granular soils.
Acknowledgment The author is thankful to the Delhi College of
Engineering (Faculty of Technology, University of Delhi) for pro-
viding ample space for his research studies. The author sincerely
compliments the reviewers for their savant inputs, comments and
questions, which significantly improved the quality of this paper.
References
1. Alejano LR, Alonso E (2005) Considerations of the dilatancy
angle in rocks and rock masses. Int J Rock Mech Min Sci
42(4):481–507
2. Arora VK (1987) Strength and deformational behaviour of join-
ted rocks. PhD thesis, IIT Delhi, India
3. Arora VK, Trivedi A (1992) Effect of Kaolin gouge on strength
of jointed rocks. In: Asian regional symposium on rock slope,
New Delhi, pp 21–25
4. Barton N (1976) Recent experiences with the Q-system of tunnel
support design. In: Bieniawski (ed) Proceedings of symposium on
exploration for rock engineering, Johannesburg. Balkema, Rot-
terdam, pp 107–117
5. Barton N (1990) Scale effects or sampling bias? In: International
workshop on scale effects in rock masses. Balkema, Rotterdam,
pp 31–55
6. Bieniawski ZT (1968) The effect of specimen size on compres-
sive strength of coal. Int J Rock Mech Min Sci Geomech Abstr
5(4):321–335
7. Bieniawski ZT, Van Heerden WL (1975) The significance of in
situ tests on large rock specimens. Int J Rock Mech Min Sci
Geomech Abstr 12(4):101–103
30 Acta Geotechnica (2010) 5:15–31
123
8. Billam J (1972) Some aspects of the behaviour of granular
material at high pressures. In: Parry RHV (ed) Stress strain
behaviour of soils. Foulis, London, pp 69–80
9. Bolton MD (1986) The strength and dilatancy of sands. Geo-
technique 36(1):65–78
10. Brace WF, Paudding BW, Scholz C (1966) Dilatancy in fractures
of crystalline rock. J Geophys Rev 71(16):3939–3953
11. Brown ET (1970) Strength of models of rock with intermittent
joints. J Soil Mech Found Div ASCE 96(6):1935–1949
12. Cook NGW (1970) An experiment showing that dilatancy is a
pervasive volumetric property of brittle rock loaded to failure.
Rock Mech 2(4):181–188
13. de Jong G (1976) Rowe’s stress dilatancy relation based on
friction. Geotechnique 26(3):527–534
14. Einstein HH, Hirschfeld RC (1973) Model studies on mechanics
of jointed rock. J Soil Mech Found Div ASCE 99(3):229–248
15. Goodman RE, Dubois J (1972) Duplication of dilatancy in
analysis of jointed rocks. J Soil Mech Found Div ASCE
98(SM4):399–422
16. Griffith AA (1924) Theory of rupture. In: Proceedings of the 1st
international congress of applied mechanics, Delft, pp 55–63
17. Hoek E, Brown ET (1980) Empirical strength criterion for rock
masses. J Geotech Eng Div ASCE 106(9):1013–1035
18. Hoek E, Brown ET (1997) Practical estimates of rock mass
strength. Int J Rock Mech Min Sc Geomech Abstr 34(8):1165–
1186
19. Jade S, Sitharam TG (2003) Characterization of strength and
deformation of jointed rock mass based on statistical analysis. Int
J Geomech ASCE 3(1):43–54
20. Jaeger JC, Cook NGW (1976) Fundamentals of rock mechanics,
2nd edn. Science Paperbacks, Norwich
21. John KW (1970) Civil engineering approach to evaluate strength
and deformability of closely jointed rock. Rock mechanics—
theory and practice. In: Proceedings of 11th symposium on rock
mechanics. American Institute of Mining, Metallurgical and
Petroleum Engineers, New York, pp 69–80
22. Johnston IW (1985) Strength of intact geo-materials. J Geotech
Eng ASCE 111(GT6):730–749
23. Johnston IW, Chiu HK (1984) Strength of weathered Melbourne
mudstone. J Geotech Eng ASCE 110(GT7):875–898
24. Krsmanovic D (1967) Initial and residual shear strength of hard
rocks. Geotechnique 17(2):145–160
25. Kudoh K, Koyama T, Nambo S (1999) Support design of large
underground cavern considering strain softening of rock, In: 9th
ISRM congress, Paris, vol I, Balkema, pp 407–411
26. Ladanyi B, Archambault G (1970) Simulation of shear behavior
of a jointed rock mass. In: Proceedings of 11th symposium on
rock mechanics. American Institute of Mining, Metallurgical and
Petroleum Engineers, New York, pp 105–125
27. Maclamore R, Gray KE (1967) The mechanical behavior of
anisotropic sedimentary rocks. J Eng Ind Trans Am Soc Mech
Eng 89(8):62–73
28. Pratt HR, Black AD, Brown WS, Brace WF (1972) The effect of
specimen size on the mechanical properties of un-jointed diorite.
Int J Rock Mech Min Sc Geomech Abstr 9(4):513–529
29. Ramamurthy T, Arora VK (1994) Strength prediction for jointed
rocks in confined and unconfined states. Int J Rock Mech Min Sc
Geomech Abstr 31(1):9–22
30. Rowe PW (1962) The stress dilatancy relation for static equi-
librium of an assembly of particles in contact. Proc R Soc Lond
A269:500–527
31. Salgado R, Bandini P, Karim A (2000) Shear strength and stiff-
ness of silty sand. J Geotech Geoenv Eng ASCE 126(5):551–562
32. Singh M, Rao KS (2005) Bearing capacity of shallow foundations
in anisotropic non-Hoek–Brown rock masses. J Geotech Geoenv
Eng ASCE 131(8):1014–1023
33. Taylor DW (1948) Fundamentals of soil mechanics. Wiley, New
York
34. Terzaghi K (1946) Rock defects and load on tunnel support. In:
Rock tunnelling with steel supports. Commercial Shearing Co.,
Youngstown, pp 15–99
35. Trivedi A (1990) Effect of gouge on the strength of jointed rocks.
Dissertation, REC, Kurukshetra, India
36. Trivedi A, Arora VK (2007) Discussion of bearing capacity of
shallow foundations in anisotropic non-Hoek–Brown rock mas-
ses. J Geotech Geoenv Eng ASCE 133(2):238–240
37. Trivedi A, Sud VK (2002) Grain characteristics and engineering
properties of coal ash. Granul Matter 4(3):93–101
38. Trivedi A, Sud VK (2005) Ultimate bearing capacity of footings
on coal ash. Granul Matter 7(4):203–212
39. Trivedi A, Sud VK (2007) Settlement of compacted ash fills.
Geotech Geol Eng 25(2):163–177
40. Vesic AS, Clough GW (1968) Behaviour of granular materials
under high stresses. J Soil Mech Found Div ASCE 94(SM3):661–
668
41. Yuan Shih-Che, Harrison JP (2004) An empirical dilatancy index
for the dilatant deformation of rock. Int J Rock Mech Sci
41(4):679–686
42. Zhang L, Einstein HH (1998) End bearing capacity of drilled
shafts in rock. J Geotech Geoenv Eng ASCE 124(7):574–584
Acta Geotechnica (2010) 5:15–31 31
123
Related Documents


