1 STORYTELLING THROUGH DATA GARTNER QUANT IMMERSION, 11 OCT 2017

Welcome message from author
This document is posted to help you gain knowledge. Please leave a comment to let me know what you think about it! Share it to your friends and learn new things together.
Transcript

1
STORYTELLING THROUGH DATA
GARTNER QUANT IMMERSION, 11 OCT 2017

A DATA VISUALISATION
CHALLENGE…
You will see 3 questions.
You have 30 seconds.
Try it!
Your timer
starts now
3
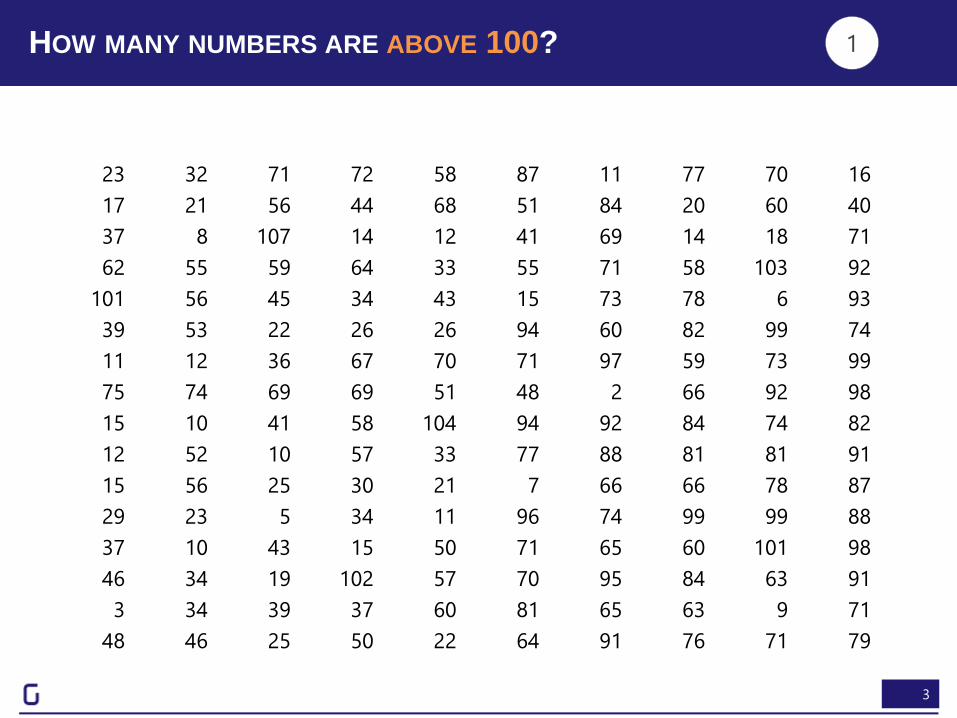
HOW MANY NUMBERS ARE ABOVE 100?
23 32 71 72 58 87 11 77 70 16
17 21 56 44 68 51 84 20 60 40
37 8 107 14 12 41 69 14 18 71
62 55 59 64 33 55 71 58 103 92
101 56 45 34 43 15 73 78 6 93
39 53 22 26 26 94 60 82 99 74
11 12 36 67 70 71 97 59 73 99
75 74 69 69 51 48 2 66 92 98
15 10 41 58 104 94 92 84 74 82
12 52 10 57 33 77 88 81 81 91
15 56 25 30 21 7 66 66 78 87
29 23 5 34 11 96 74 99 99 88
37 10 43 15 50 71 65 60 101 98
46 34 19 102 57 70 95 84 63 91
3 34 39 37 60 81 65 63 9 71
48 46 25 50 22 64 91 76 71 79
1

4
HOW MANY NUMBERS ARE BELOW 10?
23 32 71 72 58 87 11 77 70 16
17 21 56 44 68 51 84 20 60 40
37 8 107 14 12 41 69 14 18 71
62 55 59 64 33 55 71 58 103 92
101 56 45 34 43 15 73 78 6 93
39 53 22 26 26 94 60 82 99 74
11 12 36 67 70 71 97 59 73 99
75 74 69 69 51 48 2 66 92 98
15 10 41 58 104 94 92 84 74 82
12 52 10 57 33 77 88 81 81 91
15 56 25 30 21 7 66 66 78 87
29 23 5 34 11 96 74 99 99 88
37 10 43 15 50 71 65 60 101 98
46 34 19 102 57 70 95 84 63 91
3 34 39 37 60 81 65 63 9 71
48 46 25 50 22 64 91 76 71 79
2

5
WHICH QUADRANT HAS THE HIGHEST TOTAL?
23 32 71 72 58 87 11 77 70 16
17 21 56 44 68 51 84 20 60 40
37 8 107 14 12 41 69 14 18 71
62 55 59 64 33 55 71 58 103 92
101 56 45 34 43 15 73 78 6 93
39 53 22 26 26 94 60 82 99 74
11 12 36 67 70 71 97 59 73 99
75 74 69 69 51 48 2 66 92 98
15 10 41 58 104 94 92 84 74 82
12 52 10 57 33 77 88 81 81 91
15 56 25 30 21 7 66 66 78 87
29 23 5 34 11 96 74 99 99 88
37 10 43 15 50 71 65 60 101 98
46 34 19 102 57 70 95 84 63 91
3 34 39 37 60 81 65 63 9 71
48 46 25 50 22 64 91 76 71 79
3
A DATA VISUALISATION
CHALLENGE…
We’ll answer the same questions again.
But with simple visual cues.
See how long it takes.
Your timer
starts now

7
23 32 71 72 58 87 11 77 70 16
17 21 56 44 68 51 84 20 60 40
37 8 107 14 12 41 69 14 18 71
62 55 59 64 33 55 71 58 103 92
101 56 45 34 43 15 73 78 6 93
39 53 22 26 26 94 60 82 99 74
11 12 36 67 70 71 97 59 73 99
75 74 69 69 51 48 2 66 92 98
15 10 41 58 104 94 92 84 74 82
12 52 10 57 33 77 88 81 81 91
15 56 25 30 21 7 66 66 78 87
29 23 5 34 11 96 74 99 99 88
37 10 43 15 50 71 65 60 101 98
46 34 19 102 57 70 95 84 63 91
3 34 39 37 60 81 65 63 9 71
48 46 25 50 22 64 91 76 71 79
HOW MANY NUMBERS ARE ABOVE 100? 1

8
HOW MANY NUMBERS ARE BELOW 10?
23 32 71 72 58 87 11 77 70 16
17 21 56 44 68 51 84 20 60 40
37 8 107 14 12 41 69 14 18 71
62 55 59 64 33 55 71 58 103 92
101 56 45 34 43 15 73 78 6 93
39 53 22 26 26 94 60 82 99 74
11 12 36 67 70 71 97 59 73 99
75 74 69 69 51 48 2 66 92 98
15 10 41 58 104 94 92 84 74 82
12 52 10 57 33 77 88 81 81 91
15 56 25 30 21 7 66 66 78 87
29 23 5 34 11 96 74 99 99 88
37 10 43 15 50 71 65 60 101 98
46 34 19 102 57 70 95 84 63 91
3 34 39 37 60 81 65 63 9 71
48 46 25 50 22 64 91 76 71 79
2

9
WHICH QUADRANT HAS THE HIGHEST TOTAL? 3
23 32 71 72 58 87 11 77 70 16
17 21 56 44 68 51 84 20 60 40
37 8 107 14 12 41 69 14 18 71
62 55 59 64 33 55 71 58 103 92
101 56 45 34 43 15 73 78 6 93
39 53 22 26 26 94 60 82 99 74
11 12 36 67 70 71 97 59 73 99
75 74 69 69 51 48 2 66 92 98
15 10 41 58 104 94 92 84 74 82
12 52 10 57 33 77 88 81 81 91
15 56 25 30 21 7 66 66 78 87
29 23 5 34 11 96 74 99 99 88
37 10 43 15 50 71 65 60 101 98
46 34 19 102 57 70 95 84 63 91
3 34 39 37 60 81 65 63 9 71
48 46 25 50 22 64 91 76 71 79

DRAW FOCUS TO PRIORITIES
THIS IS ONE OF THE REASONS TO VISUALIZE DATA

11
CRICKET
FASTEST SCORERS
“I’ve always been curious… who
among India’s prolific one-day
run-getters had the best strike
rate?
Sachin?
Sehwag?
What about the rest of the world?

12
LET’S TAKE ONE DAY CRICKET DATA
Country Player Runs ScoreRate MatchDate Ground Versus
Australia Michael J Clarke 99* 93.39 30-06-2010The Oval England
Australia Dean M Jones 99* 128.57 28-01-1985Adelaide Oval Sri Lanka
Australia Bradley J Hodge 99* 115.11 04-02-2007Melbourne Cricket Ground New Zealand
India Virender Sehwag 99* 99 16-08-2010Rangiri Dambulla International Stad. Sri Lanka
New Zealand Bruce A Edgar 99* 72.79 14-02-1981Eden Park India
Pakistan Mohammad Yousuf 99* 95.19 15-11-2007Captain Roop Singh Stadium India
West Indies Richard B Richardson 99* 70.21 15-11-1985Sharjah CA Stadium Pakistan
West Indies Ramnaresh R Sarwan 99* 95.19 15-11-2002Sardar Patel Stadium India
Zimbabwe Andrew Flower 99* 89.18 24-10-1999Harare Sports Club Australia
Zimbabwe Alistair D R Campbell 99* 79.83 01-10-2000Queens Sports Club New Zealand
Zimbabwe Malcolm N Waller 99* 133.78 25-10-2011Queens Sports Club New Zealand
Australia David C Boon 98* 82.35 08-12-1994Bellerive Oval Zimbabwe
Australia Graeme M Wood 98* 63.22 11-01-1981Melbourne Cricket Ground India
England Ian J L Trott 98* 84.48 20-10-2011Punjab Cricket Association Stadium India
India Yuvraj Singh 98* 89.09 01-08-2001Sinhalese Sports Club Ground Sri Lanka
Ireland Kevin J O'Brien 98* 94.23 10-07-2010VRA Ground Scotland
Kenya Collins O Obuya 98* 75.96 13-03-2011M.Chinnaswamy Stadium Australia
Netherlands Ryan N ten Doeschate 98* 73.68 01-09-2009VRA Ground Afghanistan
New Zealand James E C Franklin 98* 142.02 07-12-2010M.Chinnaswamy Stadium India
Pakistan Ijaz Ahmed 98* 112.64 28-10-1994Iqbal Stadium South Africa
South Africa Jacques H Kallis 98* 74.24 06-02-2000St George's Park Zimbabwe

13
Against which countries are
higher averages scored?
Which countries’ players
score more per match?

14
Which player scores the
most per ball?
The player with the highest strike
rate is an obscure South African
whose name most of us have never
heard of.
In fact, this list is filled with players
we have never heard of.

15
ODI STRIKE RATES OF THE WORLD
We want to see the
prioritised performance.
That is, what is the strike
rate of the established
players?
LINK

16
Rs 7,700 cr

17
Dr Udayakumar
382 IPC cases
Pushparayan
380 IPC cases

SURFACE HIDDEN INSIGHT
THIS IS ONE OF THE REASONS TO VISUALIZE DATA

19
100 Y
EA
RS
OF
IND
IA’S
WEA
TH
ER
1901
1911
1921
1931
1941
1951
1961
1971
1981
1991
2001
Jan Feb Mar Apr May Jun Jul Aug Sep Oct Nov Dec
LINK

20
RESTAURANT FOUND AN UNUSUAL DIP IN SALES
A restaurant chain had data for every single
transaction made over a few years. Plotting
this as a time series showed them nothing
unusual.
However, the same data on a calendar map
reveals a very different story.
Specifically, at the bottom left point-of-sale terminal, sales dips on every
Wednesday. At the bottom right point-of-sale terminal, sales rises on
every Wednesday (almost as if to compensate for the loss.)
It turns out that the manager closes the bottom-left counter every
Wednesday afternoon due to shortage of staff, assuming that it results in
no loss of sales. There is, however, a net loss every Wednesday.
A similar visual helped a telecom company identify specific days on which their competitors’ market
share rose significantly, enabling them to negate the strategy.
Communicating data visually is the most effective way to a shared understanding

21

22
68% correlation
between AUD & EUR
Plot of 6 month daily
AUD - EUR values
Block of correlated
currencies
… clustered
hierarchically

ALLOW CONSISTENT INTERPRETATION
THIS IS ONE OF THE REASONS TO VISUALIZE DATA

24
CONSISTENT CONCLUSIONS FROM DATA
Stock market crash?
Doesn’t look so bad.. This gives the right perspective
Source: http://www.cc.gatech.edu/~stasko/7450/index.html
The same dataset can lead to very
different conclusions.
Visualizations freeze the
rendering of data, allowing a
consistent (and hopefully correct)
interpretation.

25
WINNING PARTIES
In the 2004 election to Lok
Sabha there were 1,351
candidates from 6 National
parties, 801 candidates from
36 State parties, 898
candidates from officially
recognised parties and 2385
Independent candidates.
The Congress (INC) won 145
seats in the 2004 elections.
BJP won 138, coming a close
second.
The constituencies where
each party won is shown
here.
Party BJP BSP CPM INC RJD SP

26
Party BJP BSP CPM INC RJD SPWINNING PARTIES
In the 2004 election to Lok
Sabha there were 1,351
candidates from 6 National
parties, 801 candidates from
36 State parties, 898
candidates from officially
recognised parties and 2385
Independent candidates.
The Congress (INC) won 145
seats in the 2004 elections.
BJP won 138, coming a close
second.
The constituencies where
each party won is shown
here.

WHAT SHOULD I TALK ABOUT NOW?I’VE ALWAYS HAD A PROBLEM DETERMINING AUDIENCE INTEREST

We have internal
information. Getting
information from outside is
our challenge. There’s no way
of doing that.
– Senior Editor
Leading Media Company
“


32
WHAT DO PEOPLE LOOKING FOR IN VISUALIZATION?
USA India
data visualization tools
data visualization software
data visualization examples
data visualization jobs
data visualization tools
data visualization techniques
data visualization examples
data visualization software
Tools &
Software
Techniques &
Examples

WHAT TOOLS SHOULD YOU USE?THIS IS ONE OF THE MOST FREQUENT QUESTIONS I’M ASKED

34
DATA SCIENCE TOOLS
Alteryx
Amazon EC2
Azure ML
BigQuery
Birst
Caffe
Cassandra
Cloud Compute
Cloudera
Cognos
CouchDB
D3
Decision tree
ElasticSearch
Excel
Gephi
ggplot2
Hadoop
HP Vertica
IBM Watson
Impala
Julia
Jupyter Notebook
Kafka
Kibana
Kinesis
Lambda
Logstash
MapR
MapReduce
Matplotlib
Microstrategy
MongoDB
NodeXL
Pandas
Pentaho
Pivotal
PowerPoint
Qlikview
R
R Studio
Random Forest
Redis
Redshift
Regression
Revolution R
S3
SAP Hana
SAS
Spark
Spotfire
SPSS
SQL Server
Stanford NLP
Storm
SVM
Tableau
TensorFlow
Teradata
Theano
Thrift
Torch
Weka
Word2Vec
The tool does not matter. A person’s skill with the tool does.
Pick the person. Let them pick the tool.

I’M FAMILIAR WITH EXCEL
I TURN TO IT AS A FIRST CHOICE FOR ALMOST EVERYTHING


39
Profits Made: Over the last 6
years, you would have beaten a 10%
Inflation about 82% of the time and lost out
about 18% of the time. So, mostly, you would
have made money on Cipla with an average
return of 14.9%.
Highest Returns: An average return of 14.1%
has been observed when held for a period of one year.
with a maximum of 79.6% if sold in Dec 2009, after being
held for a year. And a maximum of 486.9% if sold at the end
of Nov 2007 after holding for a month. The highest stock price
was Rs 414 in Nov/Dec 2012.
-50% +50%returns
WHEN TO
INVEST
This visual shows the
returns from buying
Cipla’s stock on any
given month, and
selling it in another.
The color of each cell is
the return (red is low,
green is high) if you
had invested in the
stock in a given month
and sold it on another.
For example this mild
red is the slightly
negative return if you
had bought Cipla stock
in Mar 2011 (the row)
and sold it in Jun 2011
(the column).
Link


I’M FAMILIAR WITH POWERPOINT
IT’S ALSO A TOOL MOST OF OUR CLIENTS USE

43
BJP
INC
JD(S)
IND
BJP sweep
INC
majority
80,000 voters
(Shivajinagar)
170,000 voters
(Bangalore
South)
KARNATAKA ASSEMBLY ELECTIONS: WINNING PARTIES (2008)

44

45
PORTFOLIO PERFORMANCE
VISUAL
Worldwide$288.0mn
A: Accelerate$68.9mn
B: Build$77.2mn
C: Cut down$141.9mn
Worldwide:
$288 mn
The visualization shows the market
opportunities across various countries to
identify areas of focus. This chart has
been built as an interactive-app to
present the key findings, while letting
user click-through and drill-down to a
custom view across 4 different levels.
LINK

TOOLS DO HELP, OF COURSE
FOR SOME THINGS, YOU NEED THE RIGHT PLATFORM

48
How does Mahabharata, one of the largest epics with 1.8
million words lend itself to text analytics?
Can this ‘unstructured data’ be processed to extract
analytical insights?
What does sentiment analysis of this tome convey?
Is there a better way to explore relations between
characters?
How can closeness of characters be analyzed & visualized?
VISUALISING THE MAHABHARATA
48

49
Recruiting top quality developers is always a problem. We decided to use an algorithmic approach and pulled out the social network of developers on Github (a social network for open source code).
In this visualization, each circle is a person. The size of the circle represents the number of followers. Larger circles have more followers (but not in proportion – it’s a log scale.)
The circle’s color represents the city the programmer’s live in. This visual is a slice showing the tale of two cities: Bangalore and Singapore
Two people are connected if one follows the other. This leads to a clustering of people in the form of a network.
Here, you can see that Bangalore and Singapore are reasonably well connected cities. Bangalore has more developers, but Singapore has more popular ones (larger circles).
However, the interaction between Bangalore and Singapore are few and far between. But for a few people across both cities, like:
… etc.
Sudar, Yahoo!Anand C, ConsultantKiran, HasgeekAnand S, Gramener
Mugunth, Steinlogic Honcheng, buUukSau Sheong, HP LabsLim Chee Aung
Bangalore
Singapore
1 follower
100 followers
A follows B (or)
B follows A
Most followed in Bangalore
Most followed in Singapore
Ciju CherianLin JunjieAmudhi Sebastian
There are, of course, a number of smaller independent circles – people who are not connected to others in the same city. (They may be connected to people in other cities.)
Apart from this, there are a few small networks of connected people – often people within the same company or start-up – who form a community of their own.
THE SOCIAL TALE OF TWO CITIES: BANGALORE & SINGAPORE

50
SERVICE REQUEST WORKFLOW

THE MEDIUM & AUDIENCE MATTER
ALIGN THE STORY TO WHO WILL CONSUME IT AND HOW

52
GRAMENER AND CNN-IBN COVERED THE 2014
GENERAL ELECTIONS
19 M
VIDEO
3 M
VIDEO
MediaMicrosoft

53
GRAMENER & TIMES NOW COVERED THE 2016
STATE ELECTIONSMedia
3 M
VIDEO
4 M
VIDEO
Continued… PlatformMicrosoft

54
HOW SEATS WERE RE-DISTRIBUTED ACROSS PARTIES
THIS CHORD DIAGRAM WAS THE MOST USED VISUAL DURING THE SHOW
LINK
MediaContinued…
55
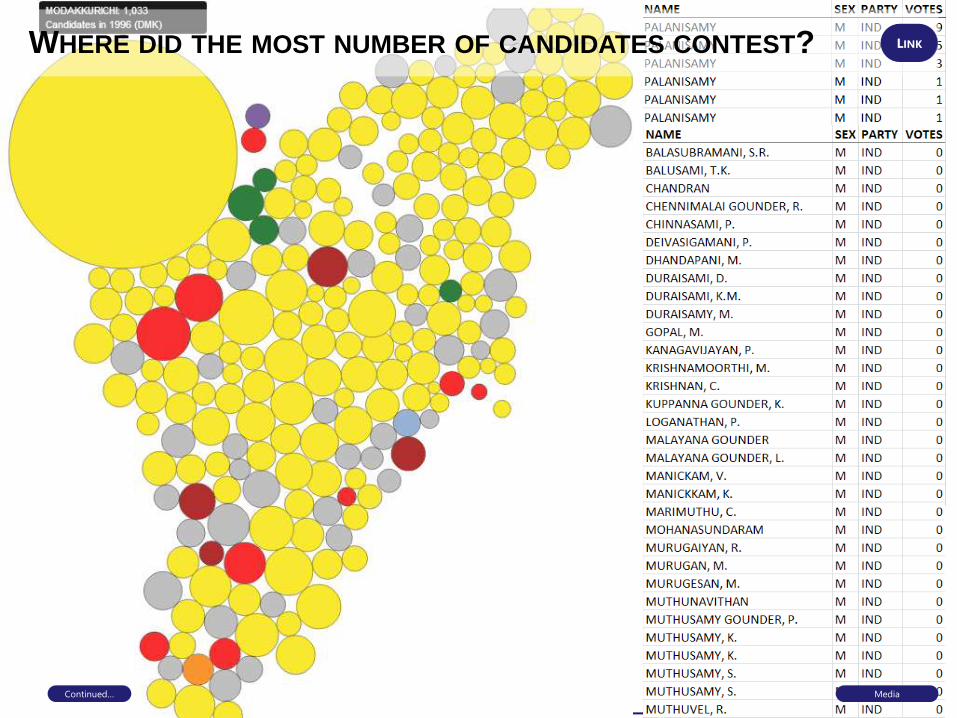
WHERE DID THE MOST NUMBER OF CANDIDATES CONTEST?
Media
LINK
Continued…

56
WE DESIGN OUR OWN WALLS TOO…
Design

57Public SectorVisualizationPlatform

58Design

59
VIJAY KARNATAKA’S PUBLICATION ON CANDIDATE WEALTH LINK
Media
Based on candidate declarations, Karnataka 2013
Continued… Microsoft
60
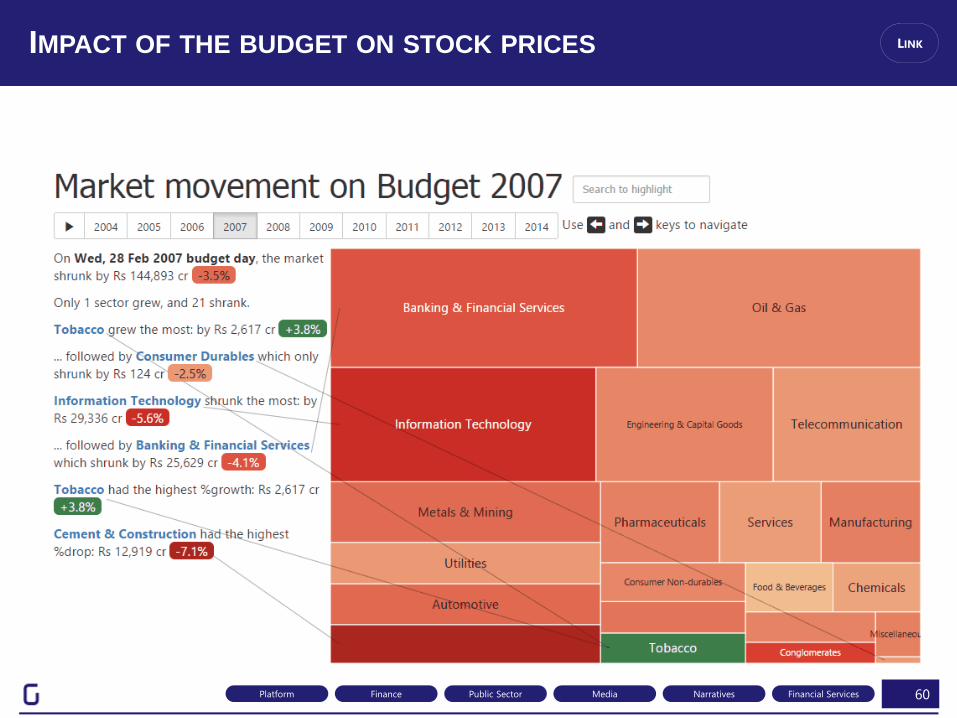
IMPACT OF THE BUDGET ON STOCK PRICES LINK
Financial ServicesNarrativesMediaPublic SectorFinancePlatform

61
WORLD BANK: INNOVATION, TECHNOLOGY & ENTREPRENEURSHIP
Does access to new Technology facilitate Innovation? Does it
facilitate Entrepreneurship? The Global Information Technology
Report findings tell us that "innovation is increasingly based on
digital technologies and business models, which can drive economic
and social gains from ICTs...".
We were curious about whether the data on TCData360 could tell a
story about influential factors on innovation and entrepreneurship.
With over 1800 indicators, we focused on the Networked Readiness
Index, as it has indicators on entrepreneurship, technology, and
innovation.
LINK
SocietyPlatform

… BUT CONTENT IS KING
KEEP THE STORY AT THE FOREFRONT

63
PREDICTING MARKS
EDUCATION
“What determines a child’s marks?
Do girls score better than boys?
Does the choice of subject
matter?
Does the medium of instruction
matter?
Does community or religion
matter?
Does their birthday matter?
Does the first letter of their name
matter?

64
TN CLASS X: ENGLISH
0
5,000
10,000
15,000
20,000
25,000
30,000
35,000
40,000
0 5 10 15 20 25 30 35 40 45 50 55 60 65 70 75 80 85 90 95 100

65
TN CLASS X: SOCIAL SCIENCE
0
5,000
10,000
15,000
20,000
25,000
30,000
35,000
40,000
0 5 10 15 20 25 30 35 40 45 50 55 60 65 70 75 80 85 90 95 100

66
TN CLASS X: MATHEMATICS
0
5,000
10,000
15,000
20,000
25,000
30,000
35,000
40,000
0 5 10 15 20 25 30 35 40 45 50 55 60 65 70 75 80 85 90 95 100

67
ICSE 2013 CLASS XII: TOTAL MARKS

68
PERFORMANCE
DRIVERS
Do girls score more than
boys, or is it the other way
around?
Gender is a known driver of
performance. Girls generally
score higher. There is
considerable variation across
subjects, however. The
differences in sciences is
minimal. But languages,
commerce and economics
give girls a significant edge.
There is also a correlation
between girls’ dropout ratio
and their over-performance
– indicating perhaps that the
smarter girls tend to stay
back in school.
Subject Girs higher by Girls Boys
Physics 0 119 119
Chemistry 1 123 122
English 4 130 126
Computers 6 137 131
Biology 6 129 123
Mathematics 11 123 112
Language 11 152 141
Accounting 12 138 126
Commerce 13 127 114
Economics 16 142 126
WHO SCORES MORE? BOYS OR
GIRLS?

69
The marks shoot
up for Aug borns
… and peaks for
Sep-borns
120 marks out of
1200 explainable
by month of birth
An identical pattern was observed in 2009 and 2010…
… and across districts, gender, subjects, and class X & XII.
“It’s simply that in Canada the eligibility
cut-off for age-class hockey is January
1. A boy who turns ten on January 2,
then, could be playing alongside
someone who doesn’t turn ten until the
end of the year—and at that age, in
preadolescence, a twelve-month gap in
age represents an enormous difference
in physical maturity.”
-- Malcolm Gladwell, Outliers
SUN SIGNS
Based on the results of the
20 lakh students taking the
Class XII exams at Tamil
Nadu over the last 3 years, it
appears that the month you
were born in can make a
difference of as much as 120
marks out of 1,200.
June borns
score the lowest

70
This is a dataset (1975 – 1990) that has
been around for several years, and has
been studied extensively. Yet, a
visualization can reveal patterns that
are neither obvious nor well known.
For example,
• Are birthdays uniformly distributed?
• Do doctors or parents exercise the C-section option to move dates?
• Is there any day of the month that has unusually high or low births?
• Are there any months with relatively high or low births?
Very high births in September.
But this is fairly well known. Most
conceptions happen during the
winter holiday season
Relatively few births during the
Christmas and Thanksgiving
holidays, as well as New Year and
Independence Day.
Most people prefer not
to have children on the
13th of any month, given
that it’s an unlucky day
Some special days like April
Fool’s day are avoided, but
Valentine’s Day is quite
popular
More births Fewer births … on average, for each day of the year (from 1975 to 1990)
LET’S LOOK AT 15 YEARS OF US BIRTH DATA

71
THE PATTERN IN INDIA IS QUITE DIFFERENT
This is a birth date dataset that’s
obtained from school admission data
for over 10 million children. When we
compare this with births in the US, we
see none of the same patterns.
For example,
• Is there an aversion to the 13th or is there a local cultural nuance?
• Are holidays avoided for births?
• Which months have a higher propensity for births, and why?
• Are there any patterns not found in the US data?
Very few children are born in the
month of August, and thereafter.
Most births are concentrated in
the first half of the year
We see a large number of
children born on the 5th, 10th,
15th, 20th and 25th of each month
– that is, round numbered dates
Such round numbered patterns a
typical indication of fraud. Here,
birthdates are brought forward to
aid early school admission
More births Fewer births … on average, for each day of the year (from 2007 to 2013)
72
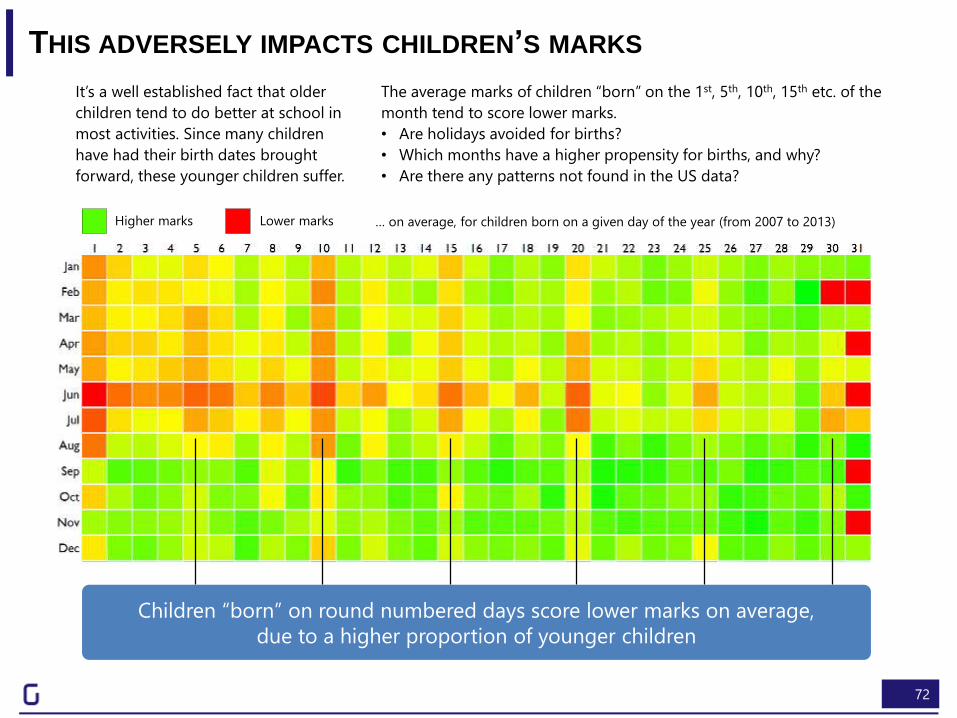
THIS ADVERSELY IMPACTS CHILDREN’S MARKS
It’s a well established fact that older
children tend to do better at school in
most activities. Since many children
have had their birth dates brought
forward, these younger children suffer.
The average marks of children “born” on the 1st, 5th, 10th, 15th etc. of the
month tend to score lower marks.
• Are holidays avoided for births?
• Which months have a higher propensity for births, and why?
• Are there any patterns not found in the US data?
Higher marks Lower marks … on average, for children born on a given day of the year (from 2007 to 2013)
Children “born” on round numbered days score lower marks on average,
due to a higher proportion of younger children

VISUALIZATION DESIGN TECHNIQUES
THE GRAMMAR OF GRAPHICS

74Source: Designing Data Visualizations by Noah Iliinsky and Julie Steele (O’Reilly).
Copyright 2011 Julie Steele and Noah Iliinsky, 978-1-449-31228-2.
Position is the most powerful encoding.The eye and brain are naturally wired to detect mis-alignment of
the smallest order
1
Colour, when used in context, is powerful.We can detect miniscule changes or variations in colour when
comparing an element with neighbouring elements. This is what
makes true colour (32-pixel colour, i.e. 4 billion) a necessity in
computer graphics
2
Size is a useful differentiator.The eye can detect moderate size variations at
moderate distances. Size also has a natural
interpretation: that of priority.
3
Several other encodings are possibleAesthetics such as angle, shadows, shapes, patterns,
density, labelling, enclosures, etc. can each be used to
map data.
4
VISUAL ENCODINGS VARY IN THEIR EFFECTIVENESS

75
POSITION IS EVERYTHING
Absolute & relative departure time (continuous)
Absolute & relative arrival time (continuous)
Absolute & relative length of trip (continuous)
Stopovers (binary)
Absolute & relative stopover duration (continuous)
Absolute & relative stopover start & stop time
(continuous)
Sort order (ranked)
Source: http://hipmunk.com

76
THE CONCEPT OF NATURAL ORDERING
Source: European Soil Bureau. Copyright © 1995–2011, European Union.
http://eusoils.jrc.ec.europa.eu/
Colour is not
ordered

77
BETTER USE OF COLOUR
Source: http://mapsof.net/uploads/static-maps/topographic_(altitude)_map_tamil_nadu.png

78
A DEFINITIVE HIERARCHY OF ENCODINGS EXISTS

WHERE TO LEARN MORE?REFERENCES

80
BOOKS BY EDWARD TUFTE

GRAMENER.COM/DEMO/MORE EXAMPLES TO EXPLORE
Related Documents