ORIGINAL ARTICLE Stoichiometry among bioactive trace metals in seawater on the Bering Sea shelf Abigail Parcasio Cid • Syouhei Urushihara • Tomoharu Minami • Kazuhiro Norisuye • Yoshiki Sohrin Received: 5 April 2011 / Revised: 15 August 2011 / Accepted: 22 August 2011 / Published online: 16 September 2011 Ó The Oceanographic Society of Japan and Springer 2011 Abstract The distribution of Al, Mn, Fe, Co, Ni, Cu, Zn, Cd, and Pb in seawater was investigated on the Bering Sea shelf (56–64°N, 165–169°W) in September 2000. The unfiltered and filtered seawater samples were used for determination of total dissolvable (TD) and dissolved (D) metals (M), respectively. The TD-M concentrations were generally higher than in the Pacific Ocean. TD-Cd was highest in deep water of the outer shelf domain and dominated by dissolved species. The other TD-M were highest at stations close to the Yukon River delta and had higher fractions of labile particulate (LP) species that were obtained as the difference between TD-M and D-M. Dis- solved Al, Ni, and Cu were characterized by input from the Yukon River. Dissolved Mn and Co showed maximums on the bottom of the coastal domain, suggesting influence of sedimentary Mn reduction. The correlations of D-Zn, D-Cd, and macronutrients indicated their distributions were largely controlled through uptake by microorganisms and remineralization from settling particles. All these three processes (river input, sedimentary reduction, and biogeo- chemical cycle) had an influence on the distribution of D-Fe. D-Pb was fairly uniformly distributed in the study area. The stoichiometry of D-M in the Bering Sea shelf showed enrichment of Co and Pb and depletion of Ni, Cu, Zn, and Cd compared with that in the North Pacific. The LP-M/LP-Al ratio revealed significant enrichment of the other eight metals relative to their crustal abundance, suggesting importance of formation of Fe–Mn oxides and adsorption of trace metals on the oxides. Keywords Eastern Bering Sea Seawater Bioactive trace metals Total dissolvable species Dissolved species Labile particulate species Sectional distribution Enrichment factor Stoichiometry Speciation 1 Introduction The Bering Sea is a semi-enclosed high-latitude sea, exchanging water, materials, and heat between the North Pacific and the Arctic Ocean through the Aleutian Archi- pelago and the Bering Strait. The eastern Bering Sea is characterized by a broad continental shelf that is one of the most productive areas in the world ocean (Walsh et al. 1989). The oceanography and biology in the Bering Sea seem particularly sensitive to climate change because of seasonal ice cover (Grebmeier et al. 2006b; Sigler et al. 2010). The southeastern Bering Sea shelf has undergone a warming of *3°C between 1995 and 2005 (Stabeno et al. 2007). Massive blooms of the coccolithophore Emiliania huxleyi caused the first bright waters in the summers of 1997–2000 (Merico et al. 2004). Three hydrographic domains appear over the Bering Sea shelf in summer: the coastal domain (0–50 m depth), the middle shelf domain (50–100 m depth), and the outer shelf domain (100–170 m depth) (Coachman 1986). The coastal domain is typically vertically mixed and separated from the middle shelf domain by the inner front, which is located nearly along the 50-m isobath with spatial variability depending on the wind and tidal strength (Kachel et al. 2002). The coastal domain experiences the direct effects of Electronic supplementary material The online version of this article (doi:10.1007/s10872-011-0070-z) contains supplementary material, which is available to authorized users. A. P. Cid S. Urushihara T. Minami K. Norisuye Y. Sohrin (&) Institute for Chemical Research, Kyoto University, Uji, Kyoto 611-0011, Japan e-mail: [email protected] 123 J Oceanogr (2011) 67:747–764 DOI 10.1007/s10872-011-0070-z

Welcome message from author
This document is posted to help you gain knowledge. Please leave a comment to let me know what you think about it! Share it to your friends and learn new things together.
Transcript

ORIGINAL ARTICLE
Stoichiometry among bioactive trace metals in seawateron the Bering Sea shelf
Abigail Parcasio Cid • Syouhei Urushihara •
Tomoharu Minami • Kazuhiro Norisuye •
Yoshiki Sohrin
Received: 5 April 2011 / Revised: 15 August 2011 / Accepted: 22 August 2011 / Published online: 16 September 2011
� The Oceanographic Society of Japan and Springer 2011
Abstract The distribution of Al, Mn, Fe, Co, Ni, Cu, Zn,
Cd, and Pb in seawater was investigated on the Bering Sea
shelf (56–64�N, 165–169�W) in September 2000. The
unfiltered and filtered seawater samples were used for
determination of total dissolvable (TD) and dissolved
(D) metals (M), respectively. The TD-M concentrations
were generally higher than in the Pacific Ocean. TD-Cd
was highest in deep water of the outer shelf domain and
dominated by dissolved species. The other TD-M were
highest at stations close to the Yukon River delta and had
higher fractions of labile particulate (LP) species that were
obtained as the difference between TD-M and D-M. Dis-
solved Al, Ni, and Cu were characterized by input from the
Yukon River. Dissolved Mn and Co showed maximums on
the bottom of the coastal domain, suggesting influence of
sedimentary Mn reduction. The correlations of D-Zn,
D-Cd, and macronutrients indicated their distributions were
largely controlled through uptake by microorganisms and
remineralization from settling particles. All these three
processes (river input, sedimentary reduction, and biogeo-
chemical cycle) had an influence on the distribution of
D-Fe. D-Pb was fairly uniformly distributed in the study
area. The stoichiometry of D-M in the Bering Sea shelf
showed enrichment of Co and Pb and depletion of Ni, Cu,
Zn, and Cd compared with that in the North Pacific. The
LP-M/LP-Al ratio revealed significant enrichment of the
other eight metals relative to their crustal abundance,
suggesting importance of formation of Fe–Mn oxides and
adsorption of trace metals on the oxides.
Keywords Eastern Bering Sea � Seawater � Bioactive
trace metals � Total dissolvable species � Dissolved
species � Labile particulate species � Sectional distribution �Enrichment factor � Stoichiometry � Speciation
1 Introduction
The Bering Sea is a semi-enclosed high-latitude sea,
exchanging water, materials, and heat between the North
Pacific and the Arctic Ocean through the Aleutian Archi-
pelago and the Bering Strait. The eastern Bering Sea is
characterized by a broad continental shelf that is one of the
most productive areas in the world ocean (Walsh et al.
1989). The oceanography and biology in the Bering Sea
seem particularly sensitive to climate change because of
seasonal ice cover (Grebmeier et al. 2006b; Sigler et al.
2010). The southeastern Bering Sea shelf has undergone a
warming of *3�C between 1995 and 2005 (Stabeno et al.
2007). Massive blooms of the coccolithophore Emiliania
huxleyi caused the first bright waters in the summers of
1997–2000 (Merico et al. 2004).
Three hydrographic domains appear over the Bering Sea
shelf in summer: the coastal domain (0–50 m depth), the
middle shelf domain (50–100 m depth), and the outer shelf
domain (100–170 m depth) (Coachman 1986). The coastal
domain is typically vertically mixed and separated from the
middle shelf domain by the inner front, which is located
nearly along the 50-m isobath with spatial variability
depending on the wind and tidal strength (Kachel et al.
2002). The coastal domain experiences the direct effects of
Electronic supplementary material The online version of thisarticle (doi:10.1007/s10872-011-0070-z) contains supplementarymaterial, which is available to authorized users.
A. P. Cid � S. Urushihara � T. Minami � K. Norisuye �Y. Sohrin (&)
Institute for Chemical Research, Kyoto University,
Uji, Kyoto 611-0011, Japan
e-mail: [email protected]
123
J Oceanogr (2011) 67:747–764
DOI 10.1007/s10872-011-0070-z

river discharge. The major river is the Yukon River, which
is the longest river in Alaska, delivering around
60 9 106 tons of suspended particles and more than
2 9 1011 m3 of freshwater a year to the eastern Bering Sea
(Holmes et al. 2002). The middle shelf domain is stratified
during summer, forming a nutrient-rich bottom water of
low temperature. This bottom water is referred to as the
cold pool (B2�C) or the cool pool ([2�C) (Stabeno et al.
2001). After nitrate is depleted in the upper mixed layer
during spring bloom, large quantities of ammonium are
produced in the bottom layer owing to denitrification in
sediments (Koike and Hattori 1979; Tanaka et al. 2004).
The outer shelf domain is separated from the middle shelf
domain by the middle front, centered near the 100-m iso-
bath, and from the oceanic domain by the shelf break front,
centered near the 170-m isobath. The presence of shelf
fronts prevents cross-shelf exchange in the Bering Sea. The
outer shelf domain develops a warm wind-mixed surface
layer, an intermediate layer, and a tidally mixed bottom
layer during summer. The annual primary production is
lower in the surface waters of the oceanic domain and
higher from the shelf break to the coast (Rho and Whitl-
edge 2007). The band of high and sustained productivity
observed approximately along the shelf break front is
known as the Green Belt (Okkonen et al. 2004; Springer
et al. 1996).
There are three key water masses that flow northward
over the Bering Sea shelf into the Bering Strait in the open
water season (Grebmeier et al. 2006a). More saline
([32.5), nutrient-rich Anadyr Water (AW) flows on the
western side of the northern Bering Sea, fresher (\31.8),
more nutrient-limited Alaska Coastal Water (ACW) flows
on the eastern side of the Bering Sea, and a third water
mass of intermediate salinity (31.8–32.5), Bering Shelf
Water (BSW), lies between AW and ACW (Fig. 1). The
major source of these water masses is the Aleutian North
Slope Current (ANSC) that flows northeastward. Pacific
water mainly comes from the passes along the Aleutian
Archipelago, flows along ANSC and then along the Bering
Slope Current (BSC) that flows in the upper 300 m over the
slope to the northwest, feeds into AW, and finally enters
the Arctic Ocean.
Bioactive trace metals are essential to organisms and/or
highly toxic at a high concentration. According to this
extensive definition, we include Al, Mn, Fe, Co, Ni, Cu,
Zn, Cd, and Pb in bioactive trace metals. Recently,
knowledge about the distribution of these elements in the
eastern Bering Sea has been increasing. Total dissolvable
(TD) Mn and Cu have been measured in seawaters col-
lected from the Bering Sea shelf (Heggie et al. 1987). It
was proposed that continental shelf sediments are a source
of Mn and Cu in the deep sea. During August 2003, the
physicochemical speciation of dissolved (D) Fe was
examined in surface and subsurface samples (Buck and
Bruland 2007), surface transects and vertical profiles of
dissolved Fe and Mn were investigated (Aguilar-Islas et al.
2007), a vertical mixing event was simulated in shipboard
incubation experiments in the middle shelf domain to
investigate Fe and Zn cycling between the soluble, col-
loidal, and particulate size-fractions (Hurst and Bruland
Fig. 1 Sampling locations on
the Bering Sea shelf
748 A. P. Cid et al.
123

2007), and surface transects and vertical profiles of total
and leachable particulate Fe, Mn, and Al, along with dis-
solved and soluble Fe were obtained (Hurst et al. 2010).
These studies gave the following conclusions: (1) because
D-Fe concentrations in surface outer shelf waters were
depleted, the Fe in the Green Belt waters originated from
the bottom layer of the outer shelf domain via enhanced
vertical mixing at the shelf break. These outer shelf sub-
surface waters also provide macronutrients to the Green
Belt; (2) the unusually high percentage of leachable par-
ticulate Fe was a potential major source of Fe for the
phytoplankton community; (3) Fe reduction is taking place
at a sediment/bottom water interface with denitrification,
leading to subsequent oxidation and elevated concentra-
tions of Fe in the bottom water; (4) D-Mn behaved rela-
tively conservatively with respect to salinity and it can be
used to trace the hydrographic domains of the Bering Sea.
In the present work, dissolved (D), total dissolvable
(TD), and labile particulate (LP) concentrations of Al, Mn,
Fe, Co, Ni, Cu, Zn, Cd, and Pb in seawater have been
determined in order to achieve a better understanding of the
distribution and behavior of these metals in the eastern
Bering Sea in summer. The results provide a comprehen-
sive view of the biogeochemistry of these nine elements on
the Bering Sea shelf.
2 Sample collections and methods
2.1 Sampling locations
Seawater samples were obtained during the cruise of R/V
Mirai MR00-K06 2–5 September 2000 from eight stations
on the eastern Bering Sea shelf (Fig. 1). Seawater samples
were collected with Niskin-X bottles mounted on a CTD-
rosette water sampling system (General Oceanics), the
frame of which was finished with epoxy paint. The inside
of the Niskin-X bottles was Teflon-coated and thoroughly
cleaned with detergent and HCl before the cruise. In order
to decrease the possibility of contamination from the ship,
the sampling was usually conducted as soon as possible
after arrival at a station using a gallows crane. Operators of
the sampling bottles wore plastic gloves.
The stations were labeled as BR plus a number. The
deepest station BR003 (56.0�N, 166.0�W; 109 m depth)
was located northeast of the Bering Canyon (Fig. 1).
BR005 (57.0�N, 166.0�W; 68 m) and BR007 (58.0�N,
166.0�W; 52 m) were located *240 km east of the Pri-
bilof Islands. BR011 (62.8�N, 166.8�W; 27 m) and
BR012 (63.5�N, 165.5�W; 18 m) were *100 km off the
Yukon River delta. BR013 (64.0�N, 167.0�W; 29 m) was
located in a pass from the Norton Sound to the Bering
Strait.
2.2 Water sampling and analytical methods
Upon retrieval of the CTD-rosette water sampling system,
the seawater samples were transferred to 500-ml pre-
cleaned low-density polyethylene bottles (LDPE, Nalge
Nunc) at No. 1 CTD & water drawing room (not a clean
room) of the vessel using a silicon tube and bell to avoid
contamination by airborne particles. The samples were
immediately brought into the clean room of the vessel. An
aliquot of seawater (250 ml) was filtered through a 0.2-lm
precleaned Nuclepore filter (Coaster) by N2 gas pressure
using a closed filtration system. The interior of the filter
holder was rinsed with pure water and the filter was
exchanged for each sample. The whole line of the filtration
system was rinsed with pure water after all samples were
filtered for each station. The filtered seawater was added
with HCl (TAMAPURE AA-10, Tama Chemicals) to a
final concentration of 0.01 M and pH 2.2. This subsample
was used for the determination of dissolved trace metals
(D-M). The other aliquot of seawater (250 ml) without
filtration was added to a mixed acid to a final concentration
of 0.01 M HCl and 0.002 M HF (TAMAPURE AA-10),
and used for the determination of total dissolvable trace
metals (TD-M). The low concentration of HF was added to
prevent adsorption to the walls of the bottles and precipi-
tation of Al and Fe in high concentration samples.
The seawater samples were stored at room temperature
in our laboratory until analysis. Preconcentration of the
bioactive trace metals was performed 6 and 9 years after
collection, using the chelating resin on which ethylenedi-
amine triacetic and iminodiacetic acids are immobilized
(NOBIAS CHELATE-PA1, Hitachi High-Technologies).
The details of the analytical method have been reported
elsewhere (Sohrin et al. 2008). The trace metals were
collected from 120 ml of seawater that had been adjusted
to pH 6 just before the preconcentration and eluted with
15 ml of 1 M HNO3 (TAMAPURE AA-10).
Concentrations of D-M and TD-M in the eluent were
mostly determined using an inductively coupled plasma
mass spectrometer (Elan DRC II, Perkin Elmer) by a cal-
ibration curve method. The isotopes used for the determi-
nation were 27Al, 55Mn, 54Fe, 59Co, 60Ni, 65Cu, 68Zn,114Cd, and 208Pb. Other isotopes were also measured for
cross-checking except mono-isotopic Al, Mn, and Co. High
concentrations of total dissolvable Al, Mn, and Fe were
determined using an inductively coupled plasma atomic
emission spectrometer (Optima 2000 DV, Perkin Elmer) by
a calibration curve method. The emission lines used were
396.153 and 308.215 nm for Al, 257.410 and 259.372 nm
for Mn, and 238.204 and 239.562 nm for Fe. The proce-
dure blanks, detection limits, and results from analysis of
seawater reference material NASS-5 (National Research
Council of Canada) are listed in Table 1.
Stoichiometry among bioactive trace metals in seawater on the Bering Sea shelf 749
123

Temperature (T) was measured with the CTD. Salinity
(S) was determined by conductivity on board the vessel.
Dissolved oxygen was determined by the Winkler
method. The average standard deviation was 0.97 lmol/
kg for replicate analysis. Macronutrients were measured
on board with an AutoAnalyzer (TRACSS). The average
relative standard deviations were 0.12–0.90% for replicate
analysis. Chlorophyll a (Chl. a) was determined by
fluorometry.
3 Results
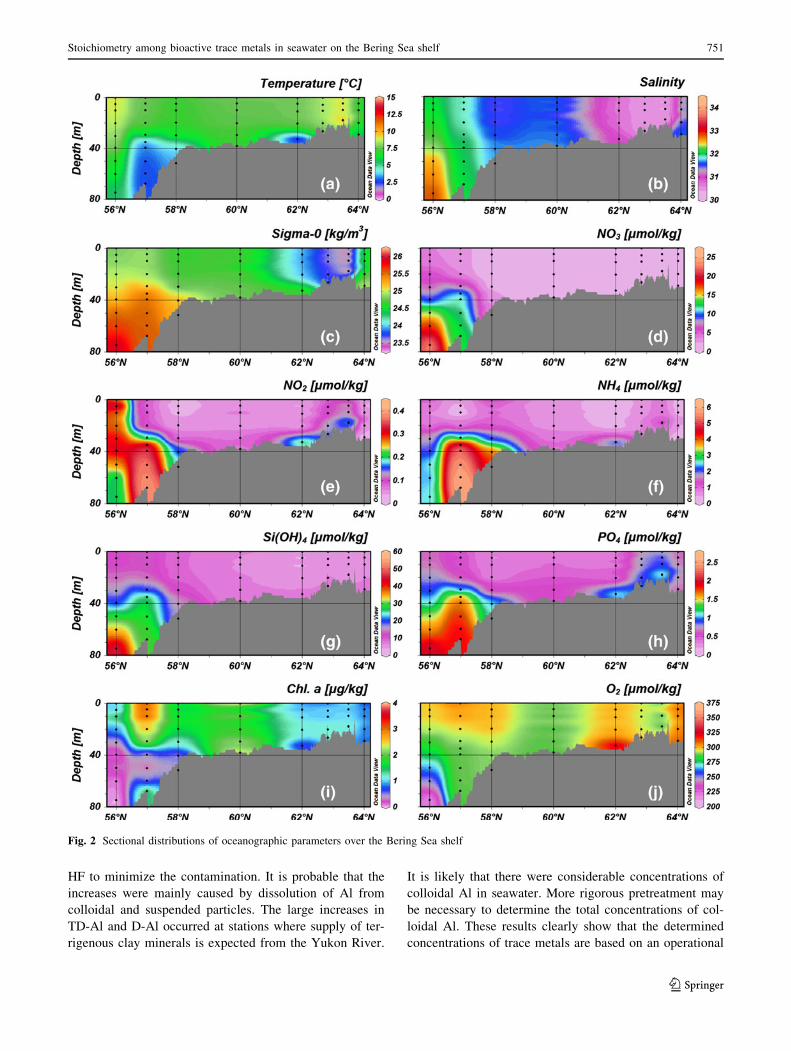
3.1 Hydrography
Figure 2 shows sectional plots of oceanographic parame-
ters in the study area. At the southern three stations, there
were a surface mixed layer (0–30 m depth) and a deep
layer. The cool pool (*2.6�C) appeared at BR005
(57.0�N) and BR007 (58.0�N). The northern five stations
were mostly vertically mixed throughout the water column,
except the cold bottom water (*1.2�C) at BR010 (62.0�N).
Thus, BR003 (56.0�N) was at the boundary between the
outer shelf domain and the middle shelf domain. BR005
was in the middle shelf domain. BR007 was at the
boundary between the middle shelf domain and the coastal
shelf domain. All other stations were within the coastal
domain. Waters in the surface layer of BR007 and at the
stations in the coastal domain are classified as ACW,
because S was less than 31.8. Waters in the surface layer of
BR003 and 005 had S of 31.9–32.2, belonging to BSW.
The decrease in S and increase in T result in substantial
depletion in density between BR011 (62.8�N) and BR012
(63.5�N), indicating the intrusion of the Yukon River
freshwater.
Bright waters with a transparency less than 1 m were
observed south of 62�N owing to massive blooming of
Emiliania huxleyi (Merico et al. 2004). The bottom water at
BR003 was rich in macronutrients including 24 lmol/kg
nitrate, which should have originated from deep water
ascending the Bering Canyon from the oceanic basin. A
maximum of ammonium (6 lmol/kg) occurred in the cool
pool of the middle shelf domain, being ascribed to sedi-
mentary denitrification (Tanaka et al. 2004). Nitrate and
silicate were mostly depleted in the coastal domain. In
contrast, phosphate showed a bottom maximum around
BR0010–012 concurrently with nitrite and ammonium,
resulting in enrichment of phosphate relative to nitrate and
silicate. Minor enrichment of phosphate was also detected
in the cool pool of the middle shelf domain. It is likely that
the excess phosphate has been accumulated as Fe-bound P
(Zhang et al. 2010) and released from the reductive
sediments.
Coastal stations had almost uniform oxygen concentra-
tions at all depths, whereas oxygen decreased with depth at
stations in the middle shelf domain. At the outer shelf
station, the oxygen concentration decreased as macronu-
trients increased.
3.2 Effect of storage time on the trace metal
concentrations
The Bering Sea water samples were stored at normal room
conditions and analyzed in 2006 and re-analyzed in 2009, 6
and 9 years after acidification, respectively. The change in
concentrations was less than 20% for most TD-M and
D-M. Significant increases were observed for TD-Al (2.7-
fold on average), D-Al (3.1-fold), TD-Mn (1.3-fold), D-Mn
(1.4-fold), TD-Ni (1.3-fold), and D-Pb (1.5-fold). All data
of TD-Al and D-Al analyzed in 2006 and 2009 are plotted
in Fig. 3. The largest increases in TD-Al were observed at
the coastal stations between 62.0 and 63.5�N. Although the
increases in D-Al were about one hundredth of those in
TD-Al and more uniform over the shelf, significantly high
increases in D-Al were observed at BR007, BR011, and
BR012. It has been reported the polypropylene caps of
LDPE bottles can be a source of Al contamination (Brown
and Bruland 2008). We had cleaned the caps with hot 5 M
Table 1 Procedure blank,
detection limit, and NASS-5
analysis
a Mean ± SDb 3SD of the procedure blank,
eightfold preconcentration,
detailed discussion reported in
Sohrin et al. (2008)c Not detected
Element Procedure
blanka (n = 3)
Detection
limitbNASS-5a
Certified Observed (n = 3)
Al (nmol/kg) 0.26 ± 0.06 0.17 2.66 ± 0.35
Mn (nmol/kg) NDc 0.01 16.7 ± 1.0 15.1 ± 1.8
Fe (nmol/kg) 0.04 ± 0.01 0.04 3.62 ± 0.61 3.69 ± 0.60
Co (pmol/kg) ND 1.2 182 ± 50 173 ± 0.2
Ni (nmol/kg) ND 0.01 4.21 ± 0.47 3.85 ± 0.12
Cu (nmol/kg) ND 0.01 4.56 ± 0.71 3.32 ± 0.14
Zn (nmol/kg) ND 0.09 1.52 ± 0.58 1.13 ± 0.05
Cd (nmol/kg) ND 0.009 0.20 ± 0.03 0.21 ± 0.001
Pb (pmol/kg) 0.85 ± 0.11 0.34 37.7 ± 23.5 33.8 ± 0.4
750 A. P. Cid et al.
123
HF to minimize the contamination. It is probable that the
increases were mainly caused by dissolution of Al from
colloidal and suspended particles. The large increases in
TD-Al and D-Al occurred at stations where supply of ter-
rigenous clay minerals is expected from the Yukon River.
It is likely that there were considerable concentrations of
colloidal Al in seawater. More rigorous pretreatment may
be necessary to determine the total concentrations of col-
loidal Al. These results clearly show that the determined
concentrations of trace metals are based on an operational
Fig. 2 Sectional distributions of oceanographic parameters over the Bering Sea shelf
Stoichiometry among bioactive trace metals in seawater on the Bering Sea shelf 751
123

definition. We expect, however, that TD-M consisting of
D-M and LP-M can be a good measure of total bioavailable
metal. In this regard, concentrations of TD-M, D-M, and
LP-M discussed in this paper are focused on the analysis
done after 9 years’ storage. The data of trace metals are
summarized in Appendix Table 1. Obviously contaminated
data were removed from the discussion.
3.3 Vertical profiles of bioactive trace metals
at BR003, a station at the boundary
between the outer and middle shelf domains
The vertical profiles of TD-M and D-M at BR003 are
shown in Fig. 4. The typical concentration ranges of D-M
in the Pacific Ocean (Nozaki 2001) are shown at the bottom
of each panel for comparison. A striking feature is that the
bioactive trace metals in seawater had considerably higher
concentrations at BR003. In particular, the dissolved con-
centrations of Mn, Fe, and Co reached 10–2000 times the
Pacific concentrations. The dissolved concentrations of
nutrient-type elements, Ni, Cu, Zn, and Cd, were compa-
rable to those in deep water of the Pacific Ocean. Another
striking feature is the high percentages of LP species, the
concentrations of which are obtained as the difference
between total dissolvable and dissolved concentrations. Al
and Fe were totally dominated by LP species in deep water
at BR003. Ni, Cu, Zn, and Cd also showed significant
concentrations of LP species throughout the water column
at BR003, whereas they are negligible in the North Pacific
Ocean (Ezoe et al. 2004).
3.4 Sectional distributions of dissolved metals
on the Bering Sea shelf
The sectional distributions of D-M are shown in Fig. 5. The
correlation matrix for D-M, T, S, and Chl. a is given in
Table 2. D-M can be divided into four groups based on the
distribution and correlation: (1) Al, Fe, Ni, and Cu; (2) Mn
and Co; (3) Zn and Cd; (4) Pb.
D-Al, D-Fe, D-Ni, and D-Cu showed maximum con-
centrations at BR012 (63.5�N). The correlation coefficients
of D-Fe, D-Ni, and D-Cu with D-Al were 0.60–0.69. These
results indicate that the Yukon River is a significant source
for these species in the coastal domain.
D-Mn had maximum concentrations (*23 nmol/kg) in
the bottom water of BR009 (60.0�N). This indicates Mn
reduction in the sediments (Heggie et al. 1987). It should
be noted that the bottom maximum of Mn was not coin-
cident with that of ammonium. It is likely that denitrifi-
cation is favorable in the cool pool in the middle shelf
domain, because nitrate is available. Mn reduction may be
favorable in the coastal domain, because there is significant
supply of Mn from the Yukon River but nitrate is limited.
D-Co showed a moderate correlation with D-Mn
(r = 0.64). This is because Co(II) is oxidized on the sur-
face of Mn oxides, scavenged from the water column, and
released from the sediments by reduction of Mn oxides
(Moffett and Ho 1996; Tebo et al. 1984). Although surface
depletion of D-Co indicative of biological utilization has
been observed in the open ocean (Saito and Moffett 2002),
it was not detected in this study area. D-Fe was also rela-
tively high in the bottom water with Mn maximums in the
coastal domain. It is possible that the redox potential
decreased to produce Fe(II) in some portions of the
sediments.
D-Cd exhibited strong correlations with macronutrients
(r = 0.79–0.86). D-Zn exhibited moderate correlations
with macronutrients and D-Cd (r = 0.54–0.64). D-Cd and
Zn showed minimums in surface waters of the middle shelf
domain, where the highest concentrations of Chl. a were
observed. These results suggest that biogeochemical
cycling, including uptake by phytoplankton, downward
transport by settling particles, and remineralization at
depth, is a major factor controlling the distribution of D-Cd
and D-Zn. D-Fe showed a slight increase with depth at
(a)
(b)
0
1000
2000
3000
4000
5000
56 58 60 62 64
2006 2009
TD
Al [
nm
ol/k
g]
Latitude [oN]
Latitude [oN]
0
10
20
30
40
50
56 58 60 62 64
D A
l [n
mo
l/kg
]
Fig. 3 Concentrations of a TD-Al and b D-Al determined after
storage for 6 years (closed diamonds) and 9 years (open squares)
752 A. P. Cid et al.
123

BR003 (56.0�N), whereas D-Ni and D-Cu did not show a
significant increase. For these elements, factors other than
biogeochemical cycling have prevailing effects on the
distributions on the Bering Sea shelf.
D-Pb was distributed fairly uniformly and did not
show a significant correlation with any parameters. This
may be ascribed to aeolian supply of Pb. Relatively high
concentrations of D-Pb occurred at BR012 and BR013
(64.0�N).
3.5 Sectional distributions of total dissolvable
and labile particulate metals on the Bering Sea
shelf
The sectional distributions of TD-M are shown in Fig. 6. The
correlation matrix for TD-M, T, and S is given in Table 3. It is
obvious that TD-M except TD-Cd had similar distributions
and strongly correlated with each other (r C 0.94). In general,
TD-M concentrations increased northward with a maximum
200 400 600 8000
20
40
60
80
100
120
Co [pmol/kg]
dep
th [
m]
10-1 101 103 105
Fe [nmol/kg]
4 8 12 16
Ni [nmol/kg]2 4 6 8
Cu [nmol/kg]
5 10 15 200
20
40
60
80
100
120
Zn [nmol/kg]
dep
th [
m]
0.50 1.00 1.50 2.00
Cd [nmol/kg]50 100 150 200
Pb [pmol/kg]
10-1 100 101 102
Mn [nmol/kg]
(b) (c)(a)
(e) (f)(d)
(h) (i)(g)
100 101 102 103
0
20
40
60
80
100
120
Al [nmol/kg]d
epth
[m
]
Fig. 4 Vertical profiles of TD-M (closed circles) and D-M (open circles) at BR003. The H-shaped bars at the bottom of each panel show the
typical concentration ranges of D-M in the North Pacific Ocean (Nozaki 2001)
Stoichiometry among bioactive trace metals in seawater on the Bering Sea shelf 753
123

at BR012 (63.5�N). There were negative and moderate cor-
relations between TD-M and S (r = -0.54 to -0.77). These
results indicate the effect of riverine input of TD-M on inner
shelf waters. In contrast, TD-Cd had the highest concentra-
tions at the bottom of outer and middle shelf domains. Surface
minimums of TD-Cd were detected at BR005 (57.0�N),
BR010 (62.0�N), and BR013 (64.0�N). TD-Zn also showed
the minimum concentrations in surface water at BR005.
The concentrations of LP-M were obtained as the differ-
ence between TD-M and D-M concentrations. LP-M was
Fig. 5 Sectional distributions of D-M over the Bering Sea shelf
754 A. P. Cid et al.
123

Ta
ble
2C
orr
elat
ion
mat
rix
of
dis
solv
edtr
ace
met
als,
tem
per
atu
re,
sali
nit
y,
ox
yg
en,
and
nu
trie
nts
for
the
po
ole
dd
ata
coll
ecte
din
the
Ber
ing
Sea
TS
Si(
OH
) 4N
O3
NO
2N
H3
PO
4C
hl.
aD
-Al
D-M
nD
-Fe
D-C
oD
-Ni
D-C
uD
-Zn
D-C
dD
-Pb
T1
.00
-0
.39
-0
.52
-0
.46
-0
.37
-0
.76
-0
.54
0.3
40
.45
-0
.11
-0
.03
-0
.14
0.3
30
.38
-0
.15
-0
.50
0.2
1
S1
.00
0.7
30
.72
0.4
30
.39
0.4
3-
0.0
8-
0.5
3-
0.0
1-
0.1
1-
0.4
4-
0.6
0-
0.8
60
.38
0.4
10
.03
Si(
OH
) 41
.00
0.9
90
.61
0.6
60
.86
-0
.40
-0
.32
0.0
30
.08
-0
.54
-0
.08
-0
.42
0.5
50
.80
-0
.07
NO
31
.00
0.6
10
.61
0.8
5-
0.4
3-
0.3
20
.01
0.0
3-
0.5
7-
0.0
7-
0.4
10
.54
0.7
9-
0.0
5
NO
21
.00
0.7
50
.74
-0
.40
-0
.14
-0
.33
-0
.16
-0
.56
0.2
1-
0.1
40
.55
0.6
0-
0.0
1
NH
31
.00
0.7
8-
0.4
0-
0.2
2-
0.1
70
.03
-0
.23
0.0
1-
0.2
10
.44
0.7
2-
0.1
5
PO
41
.00
-0
.55
-0
.11
0.1
10
.14
-0
.41
0.2
8-
0.0
20
.58
0.8
6-
0.0
1
Ch
l.a
1.0
00
.12
-0
.05
0.0
30
.06
-0
.12
-0
.02
-0
.55
-0
.70
-0
.11
D-A
l1
.00
0.0
40
.75
0.0
70
.60
0.6
9-
0.0
3-
0.1
70
.36
D-M
n1
.00
0.3
70
.64
0.0
10
.08
-0
.04
0.1
70
.15
D-F
e1
.00
0.2
40
.29
0.2
70
.05
0.1
60
.24
D-C
o1
.00
-0
.06
0.1
5-
0.4
0-
0.1
90
.02
D-N
i1
.00
0.8
40
.08
0.1
10
.13
D-C
u1
.00
-0
.11
-0
.16
0.1
6
D-Z
n1
.00
0.6
40
.27
D-C
d1
.00
-0
.05
D-P
b1
.00
Stoichiometry among bioactive trace metals in seawater on the Bering Sea shelf 755
123

assumed to be zero when the concentration of D-M was
higher than that of TD-M. The sectional distributions of
LP-M are shown in Fig. 7. The correlation matrix for LP-M,
T, S, and Chl. a is given in Table 4. Similar to the results
obtained with TD-M, LP-M except LP-Cd showed strong
correlations with LP-Al (r = 0.95–0.98). LP-Cd was mod-
erately correlated with Chl. a (r = 0.68), suggesting the
importance of biogeochemical cycling for this element.
Fig. 6 Sectional distributions of TD-M over the Bering Sea shelf
756 A. P. Cid et al.
123

4 Discussion
4.1 Comparison with published data
For dissolved species, Heggie (1982) observed the distri-
bution of D-Cu in surface (\75 m) waters of the central
Bering Sea in July 1977. In coastal domain, the concentra-
tions of D-Cu were 9.4–14.5 nmol/kg at 61.8�N, 169�W,
3.5–10.5 nmol/kg at 62�N, 170�W, and 6.5–11.8 nmol/kg at
61.5�N, 168.2�W. Hurst and Bruland (2007) observed the
concentrations of dissolved Fe, Zn, Co, Cu, and Cd at
57.4�N, 168.4�W, west of BR007, in the middle shelf domain
in August 2003. The concentrations of D-Fe and D-Zn were
0.22 and 0.25 nmol/l in surface water and 4.4 and 1.6 nmol/l
in subsurface water, respectively. The concentrations in a
mixture of surface and subsurface water were 0.32 nmol/l for
D-Co, 2.6–2.7 nmol/l for D-Cu, and 0.25–0.42 nmol/l for
D-Cd nmol/l. Aguilar-Islas et al. (2007) reported the con-
centrations of D-Mn and D-Fe along transects in the south-
eastern Bering Sea during August–September 2003. The
middle transect passed the vicinity of BR003. D-Mn was
*5 nmol/kg in surface water and *11 nmol/kg in bottom
water in the outer and middle shelf domains. Surface D-Fe
was *0.2–0.3 nmol/kg in the outer shelf domain and
*0.5–1 nmol/kg in the middle shelf domain. The cool pool
contained *5 nmol/kg of D-Fe. The maximum concentra-
tions of *6 nmol/kg D-Fe and *12 nmol/kg D-Mn were
observed near the Pribilof Islands. Surface D-Fe and D-Mn
increased to *4 and *34 nmol/kg, respectively, in the
coastal domain. The concentrations of D-M in this work are
comparable to these values.
Buck and Bruland (2007) reported the surface D-Fe
concentrations, organic ligand concentrations, and stability
constants for the Fe complexes along transects in the
southeastern Bering Sea. The concentrations of D-Fe are
also consistent with our data. They found that the con-
centrations of D-Fe were strongly correlated with ambient
stronger L1 ligand concentrations for all samples with D-Fe
concentrations greater than 0.2 nmol/l. Since D-Fe did not
increase significantly between 6 and 9 years’ storage in this
study, it is unlikely that the effects of ligands on the
determination of D-Fe change with storage time.
For total dissolvable species, Heggie et al. (1987)
observed the vertical and cross-shelf distributions of TD-
Mn and TD-Cu in the eastern Bering Sea during October
1980. Their seawater samples were not filtered and acidi-
fied to pH 2 with HCl. At outer shelf stations close to
BR003, the concentrations of TD-Mn were *8 nmol/kg in
surface water and *30 nmol/kg in bottom water with a
break at 60–80 m depth. The concentrations of TD-Cu
were *6 nmol/kg in surface water and *4 nmol/kg in
bottom water. These results are generally consistent with
our results for TD-Mn and TD-Cu at BR003, where TD-
Mn showed a shallower break and higher bottom concen-
trations, and TD-Cu exhibited a minimum at mid depth and
a bottom maximum. Heggie et al. (1987) reported that the
concentrations of TD-Mn were 13–20 nmol/kg in the sur-
face layer and 25–40 nmol/kg in the bottom layer of the
middle shelf domain around *57.5�N, *164�W. The
concentrations of TD-Cu were 4–7 nmol/kg. These values
are also comparable to those of our TD-Mn and TD-Cu.
For particulate species, Hurst and Bruland (2007) and
Hurst et al. (2010) reported the particulate concentrations
of Al, Mn, Fe, and Zn in the southeastern Bering Sea. The
leachable particulate metals from filter samples was based
upon a weak acid leach (pH 2) together with a mild
reducing agent to access readily reducible Fe oxy-
hydroxides and a short heating step to denature proteins
and promote the release of bound intracellular metals. The
filter and associated refractory particulate material were
then digested in a microwave bomb to determine total
particulate (TP) metals. At station 13 (57.7�N, 168.7�W) in
the middle shelf domain, TP values for Al, Mn, and Fe
were 10–40, 1–2, and 5–10 nmol/l in surface water and
Table 3 Correlation matrix of total dissolvable trace metals, temperature, and salinity for the pooled data collected in the Bering Sea
T S TD-Al TD-Mn TD-Fe TD-Co TD-Ni TD-Cu TD-Zn TD-Cd TD-Pb
T 1.00 -0.39 0.40 0.34 0.31 0.36 0.39 0.40 0.30 -0.36 0.34
S 1.00 -0.67 -0.69 -0.70 -0.75 -0.72 -0.77 -0.54 0.49 -0.72
TD-Al 1.00 0.94 0.96 0.97 0.97 0.95 0.94 -0.01 0.97
TD-Mn 1.00 0.97 0.98 0.95 0.92 0.91 0.00 0.97
TD-Fe 1.00 0.99 0.99 0.97 0.96 0.06 1.00
TD-Co 1.00 0.98 0.96 0.93 -0.02 0.99
TD-Ni 1.00 0.98 0.96 0.07 0.99
TD-Cu 1.00 0.93 0.00 0.97
TD-Zn 1.00 0.18 0.96
TD-Cd 1.00 0.01
TD-Pb 1.00
Stoichiometry among bioactive trace metals in seawater on the Bering Sea shelf 757
123

reached 290, 6.5, and 130 nmol/l in bottom water,
respectively. The fraction of leachable particulate M in TP-M
accounted for *35% for Al, *95% for Mn, and *75%
for Fe. TP-Zn was *0.5 nmol/l and leachable particulate
Zn was *0.1 nmol/l in a mixed seawater sample prepared
from surface and subsurface waters. LP-Al and LP-Zn at
BR005 are comparable to these values. LP-Mn and LP-Fe
at BR005 are, however, 6–17 times higher than the
reported TP-Mn and TP-Fe. These results suggest that
particulate Mn and Fe vary considerably with time and
Fig. 7 Sectional distributions of LP-M over the Bering Sea shelf
758 A. P. Cid et al.
123

space. According to the data of Hurst et al. (2010), the
fraction of refractory particulate Al was much higher
compared with Mn and Fe. These results are consistent
with our results that show a significant increase in TD-Al
with storage time (Sect. 3.2).
To the best of our knowledge, there were no published
data for Ni and Pb in this area.
4.2 Fractions of dissolved and labile particulate species
in total dissolvable bioactive trace metals
TD-M consists of D-M and LP-M. It has been suggested
that organisms can utilize at least some of LP-M (Berger
et al. 2008; Kinugasa et al. 2005). Thus, the concentrations
of TD-M would be a measure of total bioavailable trace
metals. Firstly, the Bering Sea shelf is characterized by
considerably higher concentrations of TD-M compared
with the North Pacific (Figs. 4, 6).
The average fraction of LP-M/TD-M throughout the
water column was calculated and plotted against latitude
in Fig. 8. More than 83% of TD-Fe is LP-Fe over the
entire area, whereas more than 70% of TD-Cd is D-Cd.
The other metals are plotted between Fe and Cd. LP-Al/
TD-Al is relatively low in the middle and outer shelf
domains. Mn, Co, Zn, and Pb have a similar distribution
of the LP-M/TD-M ratio. Ni and Cu show another type
of distribution. The LP-M/TD-M ratios are usually \10%
for Ni, Cu, Zn, and Cd in the North Pacific (Ezoe et al.
2004). Thus the generally high LP-M/TD-M ratios are
the second characteristic of the Bering Sea shelf. The
ratios for all metals show maximums between 62.8 and
63.5�N, suggesting the input of LP-M from the Yukon
River. The relatively high ratios for Mn, Co, Zn, and Pb
at 60.0�N can be attributed to the effect of Mn reduction
in the sediments and subsequent oxidation in the water
column.
According to Hurst et al. (2010), D-Fe was less than
10% of leachable particulate Fe, and D-Mn was about
0.6–3 times the leachable particulate Mn. These data will
give the ratios of leachable particulate M/(leachable par-
ticulate M ? D-M), which are comparable to the LP-M/
TD-M ratios in this study.
4.3 Input of bioactive trace metals from the Yukon
River
Our data show that the Yukon River is a significant source
of bioactive trace metals in the coastal domain. The river
plume is clearly observed on the sectional distributions of
TD-M and LP-M (except Cd; Figs. 6, 7). It is difficult to
explain such high concentrations by the other mechanisms.
It should be noted that the river plume is obvious for D-Al,
D-Ni, and D-Cu, whereas it is not so obvious for the other
D-M (Fig. 5).
Table 4 Correlation matrix of labile particulate trace metals, temperature, salinity, and Chl. a for the pooled data collected in the Bering Sea
T S Chl. a LP-Al LP-Mn LP-Fe LP-Co LP-Ni LP-Cu LP-Zn LP-Cd LP-Pb
T 1.00 -0.39 0.34 0.48 0.36 0.31 0.44 0.39 0.37 0.33 0.26 0.51
S 1.00 -0.08 -0.66 -0.71 -0.70 -0.71 -0.72 -0.70 -0.69 0.13 -0.74
Chl. a 1.00 -0.07 -0.01 -0.07 -0.06 -0.06 -0.10 -0.09 0.68 -0.05
LP-Al 1.00 0.95 0.96 0.98 0.97 0.96 0.97 -0.01 0.97
LP-Mn 1.00 0.98 0.98 0.97 0.94 0.97 0.02 0.98
LP-Fe 1.00 0.99 0.99 0.97 0.99 -0.05 1.00
LP-Co 1.00 0.99 0.98 0.99 -0.01 1.00
LP-Ni 1.00 0.98 0.99 0.03 0.99
LP-Cu 1.00 0.98 -0.08 0.99
LP-Zn 1.00 -0.04 0.99
LP-Cd 1.00 -0.01
LP-Pb 1.00
0
0.2
0.4
0.6
0.8
1
1.2
56 58 60 62 64
Al Fe Co Ni Cd
LP
M/ T
D M
Latitude [ oN]
Station BR0-03 05 07 09 10 11 12 13
Fig. 8 Latitudinal distribution of the LP-M/TD-M ratio
Stoichiometry among bioactive trace metals in seawater on the Bering Sea shelf 759
123

The concentrations of trace elements in river water
were measured during the synoptic sampling cruises in
the Yukon River basin in years 2002 and 2003 by the US
Geological Survey (Dornblaser and Halm 2006). River
water samples were collected using an equal discharge
increment and filtered through a 0.45-lm filter. The
concentrations of D-M in the Yukon River near Kaltag in
June 2003 were as follows: 0.14 lmol/kg for Mn,
3.7 lmol/kg for Fe, 1.4 nmol/kg for Co, 29 nmol/kg for
Ni, 58 nmol/kg for Cu, 0.11 nmol/kg for Cd, and
0.82 nmol/kg for Pb. S was *32 over the shelf and 30.22
at BR012 (63.5�N), suggesting that the contribution of
river water was 5.6% at this station. Assuming the same
dilution factor for D-M, input from river water would
account for 52% of D-Mn, 2300% of D-Fe, 27% of D-Co,
22% of D-Ni, 40% of D-Cu, 1.4% of D-Cd, and 91% of
D-Pb. Thus, the input from river water is actually sig-
nificant for D-M except D-Cd. It is probable that most
dissolved Mn, Fe, Co, and Pb from the Yukon River has
been transformed into particulate species before reaching
BR012. The sectional distributions of D-M suggest that
sedimentary reduction processes in the coastal domain are
a more significant source for D-Mn and D-Co. Deep
waters in the outer and middle shelf domain are a more
significant source for D-Zn and D-Cd. It seems that these
three sources give a comparable contribution to D-Fe and
little contribution to D-Pb.
The input of D-M from the Yukon River also would
account for 2.7% of TD-Mn, 1.8% of TD-Fe and Co, 7.0%
of TD-Ni, 17% of TD-Cu, 1.1% of TD-Cd, and 3.8% of
TD-Pb at BR012. These percentages seem too low to
explain the dominance of riverine supply on the distribu-
tions of TD-M except TD-Cd. There must be larger sup-
plies of LP-M from the Yukon River. It is interesting that
the concentrations of TD-M and LP-M at BR013 (64.0�N)
are mostly comparable to those at BR010 (62.0�N). The
effect of the river plume disappears at BR013. Further
observations are necessary to address the nature of the river
plume and to quantify the budget of bioactive trace metals
on the Bering Sea shelf.
4.4 Stoichiometry of dissolved bioactive trace metals
Dissolved inorganic nitrogen (DIN), which is the sum of
nitrate, nitrite, and ammonium, is plotted against phosphate
in Fig. 9a for all samples of this study. The regression line
for the BR003 data, at the boundary between the outer and
middle shelf domains, is given by the following equation:
DIN l mol/kgð Þ ¼ 15:3� PO4 l mol/kgð Þ � 5:1
r2 ¼ 1:00; n ¼ 11� �
The results suggest that N and P follow the
stoichiometry of Redfield ratios at BR003, whereas N
depletes earlier than P. All other data are plotted on the
right side of this line. This means that there is a substantial
additional supply of P on the Bering Sea shelf. Silicate
mo
l/kg
]
0
5
10
15
20
25
30
0.0 0.5 1.0 1.5 2.0 2.5
DIN
[m
ol/k
g]
PO4 [ mol/kg]
0 5 10 15 20
mo
l/kg
]
0
5
10
15
20
25
30
DIN
[m
ol/k
g]
D Fe [nmol/kg]
0
0.2
0.4
0.6
0.8
0 0.5 1 1.5 2 2.5
D C
d [
nm
ol/k
g]
PO4 [ mol/kg]
BR003BR005
BR007BR009
BR010BR011
BR012BR013
(a)
(b)
(c)
Fig. 9 Property versus property plots for macronutrients and D-M.
a Phosphate versus DIN. The regression line is for BR003 (see text).
b D-Fe versus DIN. The regression line was obtained from the data at
57.6�N, 179.9�E in the oceanic domain of the Bering Sea (Fujishima
et al. 2001). c Phosphate versus D-Cd. The regression line was
obtained from the data at 56.3�N, 171.6�E in the Green Belt (Cullen
2006)
760 A. P. Cid et al.
123

versus DIN for all data gives the following regression line
(the figure is not shown):
DIN l mol/kgð Þ ¼ 0:670� Si(OH)4 l mol/kgð Þ � 3:1
r2 ¼ 0:97; n ¼ 54� �
These results suggest that N is the limiting element for
organisms in this area.
DIN is plotted against D-Fe in Fig. 9b for all data of this
study. The regression line for nitrate vs. D-Fe observed in the
oceanic domain of the Bering Sea (57.6�N, 179.9�E; (Fuji-
shima et al. 2001)) is shown for comparison. The positive
intercept on the y-axis suggests that D-Fe is relatively
depleted. Actually, iron limitation in the oceanic domain has
been ascertained by shipboard incubations (Leblanc et al.
2005; Peers et al. 2005) and by underway fast repetition-rate
fluorometer measurements (Suzuki et al. 2002). All data
from the Bering Sea shelf are plotted on the right side of the
line. These results suggest that this area is rich with D-Fe
compared with N. Similar results are observed for D-Mn,
D-Ni, and D-Zn (the figures are not shown).
D-Cd is plotted against phosphate in Fig. 9c, where the
regression line observed in the Green Belt (56.3�N, 171.6�E;
(Cullen 2006)) is shown for comparison. Most data from the
Bering Sea shelf are plotted above the line. The Cd/P ratios
from the two Bering Sea stations have been reported (Cullen
2006). At the HNLC-Fe limited station (55�N, 179�W), the
Cd/P ratio was 0.17 ± 0.01 nmol/lmol in surface water and
0.33 ± 0.04 nmol/lmol below the mixed layer. At the Green
Belt station, the Cd/P ratio was 0.33 ± 0.02 nmol/lmol in the
upper 75 m and 0.36 ± 0.02 nmol/lmol below the mixed
layer. At BR003, the Cd/P ratio was 0.53 ± 0.06 nmol/lmol
in the upper 40 m and 0.37 ± 0.08 nmol/lmol below the
mixed layer. The Cd/P ratio further increases at the other
stations in this study.
All these results indicate that D-M is plentiful over the
Bering Sea shelf compared with macronutrients. In addi-
tion, there are considerable amounts of LP-M. Thus, the
bioactive trace metals should not have been limiting factors
for the growth of phytoplankton, even when massive
blooming of Emiliania huxleyi occurred.
The logarithms of D-M/phosphate and nutrient/phos-
phate were calculated for deep water in each domain and
are plotted in Fig. 10. For comparison, the data for the
SAFe D2 reference material (30�N, 140�W; 2000 m depth)
from the North Pacific Ocean are also plotted (Sohrin et al.
2008). The N/P ratio decreases with the flow of ACW as a
result of sedimentary denitrification (Koike and Hattori
1979; Tanaka et al. 2004). The Si/P ratio is lowest in the
North Pacific and highest in the outer shelf domain. The
D-M/P ratios show different variations from N/P and Si/P.
It is apparent that the Bering Shelf is enriched with Co and
Pb and depleted in Ni, Cu, Zn, and Cd compared with the
North Pacific. The major reasons should be as follows: (1)
the North Pacific deep water is enriched with Ni, Cu, Zn,
and Cd by remineralization and depleted in Co and Pb by
scavenging; (2) surface water, which has the depleted
concentrations of Ni, Cu, Zn, and Cd by uptake of phyto-
plankton and the elevated concentrations of Co and Pb by
lithogenic and anthropogenic input, contributes to the for-
mation of deep water on the Bering Sea shelf; (3) there is
preferential supply of P over Ni, Cu, Zn, and Cd on the
Bering Sea shelf. The dissolved elemental composition of
P/N/Si/Al/Mn/Fe/Co/Ni/Cu/Zn/Cd/Pb at the boundary
between the outer and middle shelf domains is
1:11.4:22.8:1.6 9 10-3:9.6 9 10-3:4.6 9 10-3:9.7 9 10-5:
2.9 9 10-3:1.4 9 10-3:4.0 9 10-3:3.2 9 10-4:1.5 9 10-5.
The composition is 1:7.8 9 10-2:11.4:1.3 9 10-2:3.2 9
10-2:1.1 9 10-2:6.8 9 10-4:8.1 9 10-3:6.1 9 10-3:1.1 9
10-2:6.6 9 10-4:7.8 9 10-5 at BR013 near the Bering
Strait. The latter ratios are two to eight times higher than
the former ratios for each D-M. It is possible that BSW had
higher ratios and increased the ratios at BR013 by mixing
with ACW. Since N is most depleted near the Bering Strait,
10-7
10-6
10-5
10-4
10-3
10-2
10-1
100
Al Mn Fe Co Ni Cu Zn Cd Pb
Pacific outer/middle (BR003)middle (BR005)coastal (BR09-BR012)near Bering Strait (BR013)
log
(D
M/ P
)
10-2
10-1
100
10
(b)
(a)
1
102
P N Si
log
(N
utr
ien
t/ P
)
Fig. 10 Stoichiometry of a D-M and b macronutrients. The concen-
trations of D-M and macronutrients were normalized relative to those
of phosphate. The Pacific deep water data were taken from the SAFe
D2 reference material (30�N, 140�W; 2000 m depth; Sohrin et al.
2008)
Stoichiometry among bioactive trace metals in seawater on the Bering Sea shelf 761
123

processes under reducing conditions may be involved for
producing the high ratios. In this way, the stoichiometry of
D-M is significantly altered in the Bering Sea. The sea-
water flowing into the Arctic Ocean through the Bering
Strait will have a stoichiometry of D-M distinct from that
of the North Pacific deep water.
4.5 Nature of labile particulate bioactive trace metals
To evaluate the nature of LP-M, the enrichment factor (EF)
was calculated by normalizing the LP-M/LP-Al ratio with
the M/Al ratio in the crust:
EF ¼ LP-M/LP-Alð ÞBering Sea
.M/Alð Þcrust
The composition of the upper crust (Rudnick and Gao
2005) was used to calculate the crustal ratio. Al was used
as the reference element, because it is abundant in
terrestrially derived aluminosilicate clays and relatively
unreactive in seawater that makes it a reliable indicator of
the contribution of the crust-derived particulate materials.
The average log EF throughout the water column for each
station is plotted against latitude in Fig. 11. A major
feature is that the EF is higher than 6 for all the elements.
This means that there is a small contribution of terrigenous
aluminosilicates to LP-M except LP-Al. LP-Cd shows the
highest EF over the whole area. The EF for Cd, Cu, Zn, and
Ni is relatively high in the outer and middle shelf domains.
It should be noted that the present EF is based on the labile
particulate concentrations. The high EF values are partly
due to fact that only a small percentage of particulate Al is
labile. Also the distribution of EF may be affected by the
formation of labile amorphous Al hydroxides from the
precipitation of soluble Al in river runoff.
LP-M can be assumed to be composed of three fractions:
(1) terrigenous aluminosilicates; (2) hydrogenous and
biogenic inorganic matter, such as Fe–Mn oxides and Ca
carbonates; (3) biogenic organic matter. Using the average
LP-M concentrations over the Bering Sea shelf, we have
estimated the percent composition of these fractions. We
firstly estimated the aluminosilicate fraction for each ele-
ment assuming that this fraction accounts for 100% of LP-
Al and is proportional to the product of the LP-Al con-
centration and the M/Alcrust ratio for the other elements.
The aluminosilicate fraction was 0.16% for LP-Cd. Taking
account of the correlation between LP-Cd and Chl.
a (r = 0.68), we assumed that LP-Cd consists of 80% of
the organic fraction and 20% of the oxide fraction, and
calculated the organic fraction of the other LP-M using the
LP-Cd concentration and the average elemental composi-
tion proposed for marine phytoplankton (Li 2000). Finally,
we attributed the remaining percentage to the oxide frac-
tion. The estimated average compositions of LP-M are
given in Fig. 12. This estimation did not work well for LP-
Zn and LP-Pb because of high concentrations of these
elements in phytoplankton. Figure 12 indicates that LP-
Mn, LP-Fe, and LP-Co are dominated by the oxide frac-
tion. The organic fractions account for higher percentages
for LP-Ni and LP-Cu. These conclusions do not change
significantly even when we slightly decrease the terrige-
nous fraction for LP-Al and/or the organic fraction for LP-
Cd. Thus, it can be concluded that the oxide fraction is
major for labile particulate Mn, Fe, Co, Ni, and Cu.
Fig. 12 Average composition of LP-M over the Bering Sea shelf.
Estimation of oxide and organic fractions was impossible for Zn and
Pb (see text)
100
101
102
103
104
105
56 58 60 62 64
MnFe
CoNi
CuZn
CdPb
log
EF
Latitude [oN]
Station BR0-
03 05 07 09 10 111213
Fig. 11 Latitudinal distribution of logarithms of the enrichment
factor (LP-M/LP-Al)Bering Sea/(M/Al)crust
762 A. P. Cid et al.
123

Formation of Fe–Mn oxides and adsorption of trace metals
on the oxides will be responsible for these results.
5 Conclusions
Seawater on the Bering Sea shelf was metalliferous. LP-M
comprised larger fractions in TD-M compared with those
in the North Pacific. LP-Al and LP-Cd were dominated by
terrigenous clay and organic matter, respectively, whereas
labile particulate Mn, Fe, Co, Ni, and Cu were dominated
by Fe–Mn oxides. D-M was abundant compared with
macronutrients even during massive blooming of Emiliania
huxleyi, suggesting there was no trace metal limitation on
the growth of organisms. Mn reduction occurred in the
sediments of the coastal domain, resulting in concurrent
increase of D-Mn and D-Co in the water column. It seems
that Fe reduction also occurred in the sediments. Relative
to phosphate, the Bering Sea shelf was enriched with D-Co
and D-Pb and depleted in D-Ni, D-Cu, D-Zn, and D-Cd
compared with the North Pacific. The stoichiometry of
D-M was further modified by the flow of ACW.
Acknowledgments A.P.C. was supported by a Monbukagakusho
(MEXT) scholarship. We are grateful to Captain Masaharu Akamine
and the crew of R/V Mirai (JAMSTEC) for their help during the
MR00-K06 cruise. We thank the chief scientist Dr. Takatoshi Tak-
izawa, Prof. Noriyuki Tanaka, and onboard scientists and technicians.
Basic oceanographic parameters were obtained thanks to staff from
JAMSTEC and Nippon Marine Enterprises. This research was partly
supported by funds from the Steel Industry Foundation for the
Advancement of Environmental Protection Technology and from
Grant-in-Aid of Scientific Research, the Ministry of Education, Cul-
ture, Sports, Science, and Technology of Japan.
References
Aguilar-Islas AM, Hurst MP, Buck KN, Sohst B, Smith GJ, Lohan
MC, Bruland KW (2007) Micro- and macronutrients in the
southeastern Bering Sea: insight into iron-replete and iron-
depleted regimes. Progr Oceanogr 73:99–126
Berger CJM, Lippiatt SM, Lawrence MG and Bruland KW (2008)
Application of a chemical leach technique for estimating labile
particulate aluminum, iron, and manganese in the Columbia
River plume and coastal waters off Oregon and Washington.
J Geophys Res, 113: C00B01. doi:10.1029/2007jc004703
Brown MT, Bruland KW (2008) An improved flow-injection analysis
method for the determination of dissolved aluminum in seawater.
Limnol Oceanogr Methods 6:87–95
Buck KN, Bruland KW (2007) The physicochemical speciation of
dissolved iron in the Bering Sea, Alaska. Limnol Oceanogr
52:1800–1808
Coachman LK (1986) Circulation, water masses, and fluxes on the
southeastern Bering Sea shelf. Cont Shelf Res 5:23–108
Cullen JT (2006) On the nonlinear relationship between dissolved
cadmium and phosphate in the modern global ocean: could
chronic iron limitation of phytoplankton growth cause the kink?
Limnol Oceanogr 51:1369–1380
Dornblaser MM, Halm DR (2006) Water and sediment quality of the
Yukon River and its tributaries, from Eagle to St. Marys, Alaska,
2002–2003. US Geological Survey Open-File Report
2006–1228. US Geological Survey, Reston
Ezoe M, Ishita T, Kinugasa M, Lai X, Norisuye K, Sohrin Y (2004)
Distribution of dissolved and acid-dissolvable bioactive trace
metals in the North Pacific Ocean. Geochem J 38:535–550
Fujishima Y, Ueda K, Maruo M, Nakayama E, Tokutome C,
Hasegawa H, Matsui M, Sohrin Y (2001) Distribution of trace
bioelements in the subarctic North Pacific Ocean and the Bering
Sea (the R/V Hakuho-Maru Cruise KH-97–2). J Oceanogr
57:261–273
Grebmeier JM, Cooper LW, Feder HM, Sirenko BI (2006a)
Ecosystem dynamics of the Pacific-influenced Northern Bering
and Chukchi Seas in the Amerasian Arctic. Progr Oceanogr
71:331–361
Grebmeier JM, Overland JE, Moore SE, Farley EV, Carmack EC,
Cooper LW, Frey KE, Helle JH, McLaughlin FA, McNutt SL
(2006b) A major ecosystem shift in the Northern Bering Sea.
Science 311:1461–1464
Heggie DT (1982) Copper in surface waters of the Bering Sea.
Geochim Cosmochim Acta 46:1301–1306
Heggie D, Klinkhammer G, Cullen D (1987) Manganese and copper
fluxes from continental margin sediments. Geochim Cosmochim
Acta 51:1059–1070
Holmes RM, McClelland JW, Peterson BJ, Shiklomanov IA, Shik-
lomanov AI, Zhulidov AV, Gordeev VV, Bobrovitskaya NN
(2002) A circumpolar perspective on fluvial sediment flux to the
Arctic Ocean. Global Biogeochem Cycles 16:1098. doi:
10.1029/2001gb001849
Hurst MP, Bruland KW (2007) An investigation into the exchange of
iron and zinc between soluble, colloidal, and particulate size-
fractions in shelf waters using low-abundance isotopes as tracers
in shipboard incubation experiments. Mar Chem 103:211–226
Hurst MP, Aguilar-Islas AM, Bruland KW (2010) Iron in the
southeastern Bering Sea: elevated leachable particulate Fe in
shelf bottom waters as an important source for surface waters.
Cont Shelf Res 30:467–480
Kachel NB, Hunt GL, Salo SA, Schumacher JD, Stabeno PJ,
Whitledge TE (2002) Characteristics and variability of the inner
front of the southeastern Bering Sea. Deep Sea Res II
49:5889–5909
Kinugasa M, Ishita T, Sohrin Y, Okamura K, Takeda S, Nishioka J,
Tsuda A (2005) Dynamics of trace metals during the subarctic
Pacific iron experiment for ecosystem dynamics study
(SEEDS2001). Progr Oceanogr 64:129–147
Koike I, Hattori A (1979) Estimates of denitrification in sediments of
the Bering Sea shelf. Deep Sea Res A 26:409–415
Leblanc K, Hare CE, Boyd PW, Bruland KW, Sohst B, Pickmere S,
Lohan MC, Buck K, Ellwood MJ, Hutchins DA (2005) Fe and
Zn effects on the Si cycle and diatom community structure in
two contrasting high and low-silicate HNLC areas. Deep Sea Res
I 52:1842–1864
Li Y-H (2000) A compendium of geochemistry. Princeton University
Press, Princeton, p 475
Merico A, Tyrrell T, Lessard EJ, Oguz T, Stabeno PJ, Zeeman SI,
Whitledge TE (2004) Modelling phytoplankton succession on
the Bering Sea shelf: role of climate influences and trophic
interactions in generating Emiliania huxleyi blooms 1997–2000.
Deep Sea Res I 51:1803–1826
Moffett JW, Ho J (1996) Oxidation of cobalt and manganese in
seawater via a common microbially catalyzed pathway. Geochim
Cosmochim Acta 60:3415–3424
Nozaki Y (2001) Elemental distribution. In: Steele JH, Thorpe SA,
Turekian KK (eds) Encyclopedia of ocean sciences, 2. Aca-
demic, San Diego, pp 840–845
Stoichiometry among bioactive trace metals in seawater on the Bering Sea shelf 763
123

Okkonen SR, Schmidt GM, Cokelet ED, Stabeno PJ (2004) Satellite
and hydrographic observations of the Bering Sea ‘Green Belt’.
Deep Sea Res II 51:1033–1051
Peers G, Quesnel S-A, Price NM (2005) Copper requirements for iron
acquisition and growth of coastal and oceanic diatoms. Limnol
Oceanogr 50:1149–1158
Rho T, Whitledge TE (2007) Characteristics of seasonal and spatial
variations of primary production over the southeastern Bering
Sea shelf. Cont Shelf Res 27:2556–2569
Rudnick RL, Gao S (2005) Composition of the continental crust. In:
Rudnick RL (ed) The crust. Elsevier-Pergamon, Oxford, pp 1–64
Saito MA, Moffett JW (2002) Temporal and spatial variability of
cobalt in the Atlantic Ocean. Geochim Cosmochim Acta
66:1943–1953
Sigler MF, Harvey HR, Ashjian CJ, Lomas MW, Napp JM, Stabeno
PJ, Pelt TIV (2010) How does climate change affect the Bering
Sea ecosystem? EOS 91:457–458
Sohrin Y, Urushihara S, Nakatsuka S, Kono T, Higo E, Minami T,
Norisuye K, Umetani S (2008) Multielemental determination of
GEOTRACES key trace metals in seawater by ICP-MS after
preconcentration using an ethylenediaminetriacetic acid chelat-
ing resin. Anal Chem 80:6267–6273
Springer AM, McRoy CP, Flint MV (1996) The Bering Sea Green
Belt: shelf-edge processes and ecosystem production. Fish
Oceanogr 5:205–223
Stabeno PJ, Bond NA, Kachel NB, Salo SA, Schumacher JD (2001)
On the temporal variability of the physical environment over the
south-eastern Bering Sea. Fish Oceanogr 10:81–98
Stabeno PJ, Bond NA, Salo SA (2007) On the recent warming of the
southeastern Bering Sea shelf. Deep Sea Res II 54:2599–2618
Suzuki K, Liu H, Saino T, Obata H, Takano M, Okamura K, Sohrin
Y, Fujishima Y (2002) East-west gradients in the photosynthetic
potential of phytoplankton and iron concentration in the
subarctic Pacific Ocean during early summer. Limnol Oceanogr
47:1581–1594
Tanaka T, Guo LD, Deal C, Tanaka N, Whitledge T, Murata A (2004)
N deficiency in a well-oxygenated cold bottom water over the
Bering Sea shelf: influence of sedimentary denitrification. Cont
Shelf Res 24:1271–1283
Tebo BM, Nealson KH, Emerson S, Jacobs L (1984) Microbial
mediation of Mn(II) and Co(II) precipitation at the O2/H2S
interfaces in two anoxic fjords. Limnol Oceanogr 29:1247–1258
Walsh JJ, McRoy CP, Coachman LK, Goering JJ, Nihoul JJ,
Whitledge TE, Blackburn TH, Parker PL, Wirick CD, Shuert
PG, Grebmeier JM, Springer AM, Tripp RD, Hansell DA,
Djenidi S, Deleersnijder E, Henriksen K, Lund BA, Andersen P,
Muller-Karger FE, Dean K (1989) Carbon and nitrogen cycling
within the Bering/Chukchi Seas: source regions for organic
matter effecting AOU demands of the Arctic Ocean. Progr
Oceanogr 22:277–359
Zhang J-Z, Guo L, Fischer C (2010) Abundance and chemical
speciation of phosphorus in sediments of the Mackenzie River
Delta, the Chukchi Sea and the Bering Sea: importance of
detrital apatite. Aquat Geochem 16:353–371
764 A. P. Cid et al.
123
Related Documents