Surface Science 129 (1983) 155-176 North-Holland Publishing Company 155 STOICHIOMETRIC AND OXYGEN DEFICIENT MoO,(OlO) SURFACES L.E. FIRMENT and A. FERRE’ITI Central Research and Development Department, E.I. du Pant de Nemours and Company, Expenmen- tal Station, Wilmington, Delaware 19898, USA Received 7 October 1982; accepted for publication 9 March 1983 The (010) surface of single crystal MOO, has been prepared and examined using LEED, XPS, UPS, and ELS. Three methods yield the stoichiometric surface: scraping in UHV and annealing, ion etching followed by reoxidation (770 K, IO* Pa 0,) or oxygen treatment to remove carbon contamination. LEED shows the surface periodicity is the same as that of the bulk (010). The MOO, valence band is 7 eV wide with density of states maxima at 1.5, 3.6, and 5.6 eV below the top of the valence band. Heating MOO, in vacuum reduces the surface region. XPS indicates the O/MO atomic ratio decreases to 2.85 + 0.12 on heating to 600 K. Ar ion bombardment disorders the surface and reduces the surface O/MO atomic ratio to 1.6. Annealing of reduced surfaces at > 770 K incompletely reoxidizes them by diffusion of oxygen from the bulk. UPS of reduced and annealed MOO, exhibits two new emission features in the bandgap at 0.9 and 2.0 eV above the top of the valence band. These features originate from MO derived states of a defect involving two or more MO atoms, such as crystallographic shear planes. Because of the insulating nature of MOO,. surface charging and electron beam induced damage were substantial hindrances to electron spectroscopic examination. 1. Introduction Molybdenum trioxide is an active and selective catalyst for the partial oxidation of hydrocarbons and alcohols [l-4]. In combination with other elements such as iron or bismuth, molybdates are major components of catalysts used in commercial processes for the manufacture of formaldehyde and acrylonitrile [5]. The surface properties of MOO, are crucial to its catalytic properties. In this paper, we report the results of a study of the MoO,(OlO) single crystal surface using modern, ultrahigh vacuum surface analysis tech- niques. Through the study of clean and ordered surfaces, we will measure the intrinsic properties of MOO, surfaces and we hope to be able to relate them to catalytic properties. MOO, has a layered structure with orthorhombic symmetry (a = 3.963 A, b = 13.86 A, c = 3.696 A) [6] (fig. 1). The oxygen coordination about the MO atoms is asymmetric, with each oxygen inequivalent to the others. MO-O bond lengths are 1.67, 1.73, 195 (twice), 2.25, and 2.33 A. The structure consists of 0039-6028/83/0000-0000/$03.00 0 1983 North-Holland

Welcome message from author
This document is posted to help you gain knowledge. Please leave a comment to let me know what you think about it! Share it to your friends and learn new things together.
Transcript
Surface Science 129 (1983) 155-176
North-Holland Publishing Company
155
STOICHIOMETRIC AND OXYGEN DEFICIENT MoO,(OlO) SURFACES
L.E. FIRMENT and A. FERRE’ITI
Central Research and Development Department, E.I. du Pant de Nemours and Company, Expenmen-
tal Station, Wilmington, Delaware 19898, USA
Received 7 October 1982; accepted for publication 9 March 1983
The (010) surface of single crystal MOO, has been prepared and examined using LEED, XPS,
UPS, and ELS. Three methods yield the stoichiometric surface: scraping in UHV and annealing,
ion etching followed by reoxidation (770 K, IO* Pa 0,) or oxygen treatment to remove carbon
contamination. LEED shows the surface periodicity is the same as that of the bulk (010). The
MOO, valence band is 7 eV wide with density of states maxima at 1.5, 3.6, and 5.6 eV below the
top of the valence band. Heating MOO, in vacuum reduces the surface region. XPS indicates the
O/MO atomic ratio decreases to 2.85 + 0.12 on heating to 600 K. Ar ion bombardment disorders
the surface and reduces the surface O/MO atomic ratio to 1.6. Annealing of reduced surfaces at
> 770 K incompletely reoxidizes them by diffusion of oxygen from the bulk. UPS of reduced and
annealed MOO, exhibits two new emission features in the bandgap at 0.9 and 2.0 eV above the top
of the valence band. These features originate from MO derived states of a defect involving two or
more MO atoms, such as crystallographic shear planes. Because of the insulating nature of MOO,.
surface charging and electron beam induced damage were substantial hindrances to electron
spectroscopic examination.
1. Introduction
Molybdenum trioxide is an active and selective catalyst for the partial oxidation of hydrocarbons and alcohols [l-4]. In combination with other elements such as iron or bismuth, molybdates are major components of catalysts used in commercial processes for the manufacture of formaldehyde and acrylonitrile [5]. The surface properties of MOO, are crucial to its catalytic properties. In this paper, we report the results of a study of the MoO,(OlO) single crystal surface using modern, ultrahigh vacuum surface analysis tech- niques. Through the study of clean and ordered surfaces, we will measure the
intrinsic properties of MOO, surfaces and we hope to be able to relate them to catalytic properties.
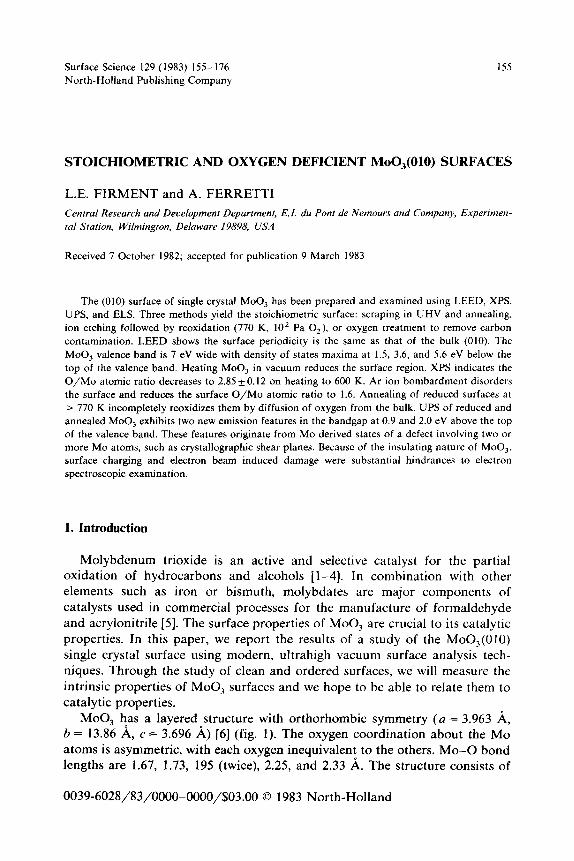
MOO, has a layered structure with orthorhombic symmetry (a = 3.963 A, b = 13.86 A, c = 3.696 A) [6] (fig. 1). The oxygen coordination about the MO atoms is asymmetric, with each oxygen inequivalent to the others. MO-O bond lengths are 1.67, 1.73, 195 (twice), 2.25, and 2.33 A. The structure consists of
0039-6028/83/0000-0000/$03.00 0 1983 North-Holland
156 LE. Firment. A. Ferretti / Stoichrometric and oxygen deficient MoO,(OlO)
b
Fig. 1. The MOO, crystal structure shown as assemblies of octahedrally coordinated MO. Three
projections illustrate the double layers along [OIO] and the chains along [OOI]. The actual MO
coordination is shown with MO-O bond lengths [6].
double layer sheets parallel to (010). Each layer can be described as planes of corner-linked octahedra or alternatively as chains along [OOl] of corner-linked tetrahedra. The actual asymmetric structure lies intermediate to these two idealized descriptions. There are only weak interactions between the double layers, which accounts for the easy cleavage along (010) and the plate-like habit of MOO, crystals.
A large fraction of the surface area of MOO, powders consists of the (010) plane, so its properties are likely to be important in controlling catalysis by MOO,. However, there are no broken chemical bonds or coordinatively un- saturated MO ions at the (010) surface so that it may tend to be unreactive compared to other higher energy surfaces. Studies of the adsorptive and reactive properties of various MOO, surfaces may determine which surfaces are catalytically active.
Previously, XPS chemical shifts and lineshapes of MOO, and other MO oxides have been reported [7-12,141. Valence band photoemission using He I
L. E. Firment, A. Ferretti / Stoichiometric and oxygen deficient MoO,(OlO) 157
[8,9] and Mg Kcu [7,13] radiation have been measured. Auger spectra and
electron beam induced reduction of MOO, were discussed by Lin and Licht- man [ 161. Reduction and disordering of MOO, by ion bombardment have been
observed [ 15,171. All of these studies were performed on powders or oxidized films on MO metal.
Here we report the preparation of the clean, crystalline, and stoichiometric MoO,(OlO) surface and the results of low energy electron diffraction (LEED), electron energy loss (ELS), and ultraviolet and X-ray induced photoemission
(UPS) and XPS) studies of this surface. In addition, thermal and ion beam induced reduction of the surface and reoxidation of the surface by oxygen from the crystal bulk or the gas phase have been observed. UPS of reduced surfaces shows a characteristic doublet emission above the valence band that is assigned to some form of oxygen deficient defect in the surface region of the sample.
2. Experimental
Large single crystals of MOO, (10 X 10 X 2 mm) were grown from the melt using the Bridgman technique. A typical preparation was as follows: Ap- proximately 25 g MOO, was loaded into a silica crucible 30 mm OD X 150 mm long with a conical bottom having a 6 mm OD X 90 mm closed end tubular extension. The extension restricts the surface area of initial nucleation and growth. The crucible was placed in a silica tube, and backfilled to 0.5 atmosphere pressure with air before sealing. This container was then vertically
mounted in an Ecco High Frequency Laboratory, Czochralski type crystal growing furnace having a tubular graphite susceptor protected by flowing N,. The MOO, container was lowered at 0.30 cm/h through the heated zone, which was held at 1270 K. The entire MOO, charge melted and remained molten during the early part of the procedure. As the container was lowered out of the furnace, solidification started in the narrow tubulation. The resulting crystals
grew with the (010) cleavage plane parallel to the axis of the crucible. An insignificant amount of the MOO, was transported by sublimation to upper end of the container. At the termination of growth, the crystals were removed from the crucible, sectioned and analyzed using the back-reflection Laue X-ray technique. The Laue patterns showed sharp, unsplit reflections across the both faces of the crystals. Frequently, the crystals had wedge-shaped cross-sections, i.e. non-parallel front and back faces.
The apparatus was a Varian ion pumped vacuum system equipped with 4-grid display LEED optics, an ion bombardment gun, and liquid nitrogen cooled sample manipulator. The electron energy analyzer was a Physical Electronics 15-2556 double pass cylindrical mirror analyzer. Photoelectron excitation sources were a Physical Electronics 04-151 X-ray source with a Mg
158 L. E. Firment, A. Ferretti / Stoichiometric and oxygen deficient MoO_,(OlO)
anode operated at 400 W and a differentially pumped DC discharge UV lamp with a water cooled discharge capillary of Shevchik’s design [ 181 operated typically at 80 mA.
The sample was mechanically held against a potted resistance heater. Sample temperature was measured with a chromel-alumel thermocouple spot welded to a metal disc against which the MOO, sample was held. Because of poor mechanical and thermal contact between the crystal and the thermocou- ple and heater, the reported temperatures can only be regarded as approxi-
mate. Ions of mass corresponding to MOO, (x = O-2) produced by evaporation of the sample were detected with the quadrupole mass spectrometer when the recorded sample temperature exceeded 850 K.
Photoelectron spectra were recorded digitally with a Fabri-Tek 1074 signal averager. Analyzer resolution was: XPS 0.8 eV; UPS 0.24 eV.
Photoelectron spectra were corrected in an approximate way for the pres- ence of satellite lines in the UV and X-radiation by numerically shifting a fraction of the spectrum an amount equal to the separation of the satellite line and subtracting it from the raw spectrum. Satellites corrected in this way are (satellite line, position, fractional intensity):
XPS: KCQ, 1261.95 eV, 0.10; Ka,, 1263.84 eV, 0.05;
He I: I/3,23.087 eV, 0.02; Iy, 23.742 eV, 0.005.
XPS core level emission peak areas were obtained by integration of the spectra after arbitrary assignment of linear baselines. XPS peak positions are reported after referencing to the O(ls) at 530.3 eV [7] to correct for charging shifts. UPS spectra are referenced to a zero of energy taken at the extrapola- tion of the steepest rise of the top of the valence band to baseline.
Ion bombardment was done with 500 eV Ar ions for 15-30 min at a current density of the order of 10-l A/m*,
Electron energy loss spectra were recorded using lock-in detection with a
CMA modulation voltage of 0.5 eV and a constant analyzer resolution of 0.3 eV. The integral electron gun of the CMA was used at incident energies of 90-135 eV and beam currents on the order of 1 PA.
3. Results
3.1. Preparation
Clean, stoichiometric, and crystalline MoO,(OlO) surfaces have been pre- pared in three ways: by oxygen cleaning of air cleaved crystals, by ion bombardment followed by reoxidation, and by scraping to expose a fresh surface in UHV followed by annealing. UPS, XPS, and LEED give identical results for surfaces prepared by any of the three methods.
L. E. Firment, A. Ferretti / Stoichiometric and oxygen deficient MoOJ(OIO) 159
Examination of XPS of crystals cleaved in air showed carbon contamination
equivalent to l-2 monolayers present on the surface. It was found that heating the sample to 770 K for 30 min in 100 Pa of oxygen was sufficient to remove the contamination and produce a stoichiometric MoO,(OlO) surface.
Alternatively, contamination could be removed by ion bombardment, but
this treatment leaves the sample oxygen deficient even after annealing at 850 K. Reoxidation for 0.5 h at 770 K in 100 Pa of oxygen restores ion bombarded
surfaces to stoichiometry.
Scraping to remove the superficial layers of a MOO, sample followed by heating to 770-850 K to anneal the surface and remove distortions of the electron spectra due to charging also yielded a clean, stoichiometric, and ordered MOO, (0 10) surface.
3.2. MoO,(OlO) surface
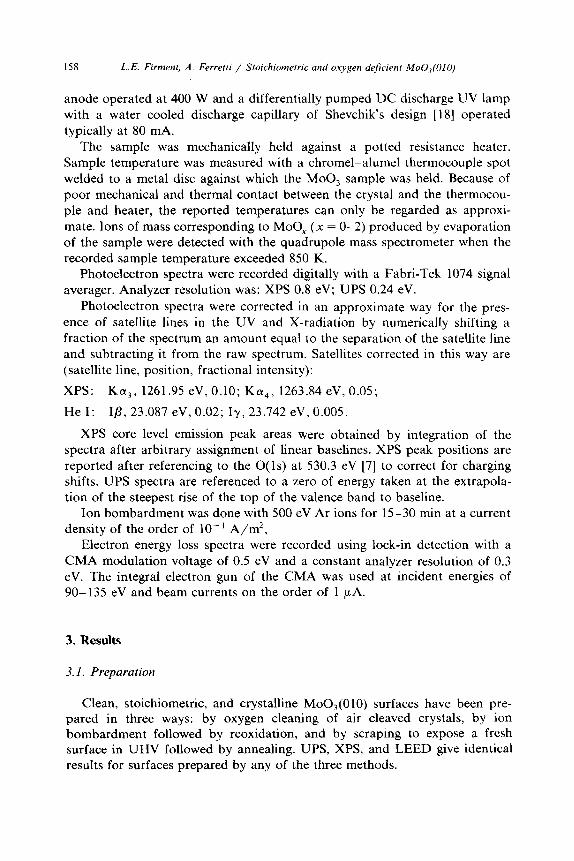
Photoemission spectra of the Mo(3d) and O(ls) core lines of the MOO, sample are presented in fig. 2. The width of the lines suggest that MO is present in one environment, and the positions of the MO 3d lines are those expected for Mo(V1) as in MOO, [7-151.
Repeated measurements of the O(ls) to Mo(3d) XPS peak area ratios of freshly scraped surfaces of previously untreated samples gave a ratio of 0.764
(standard deviation 4%). This value was taken as representative of a stoichio- metric surface. Surfaces prepared in any of the three ways discussed gave this ratio, and are thus stoichiometric within the limits of the measurement.
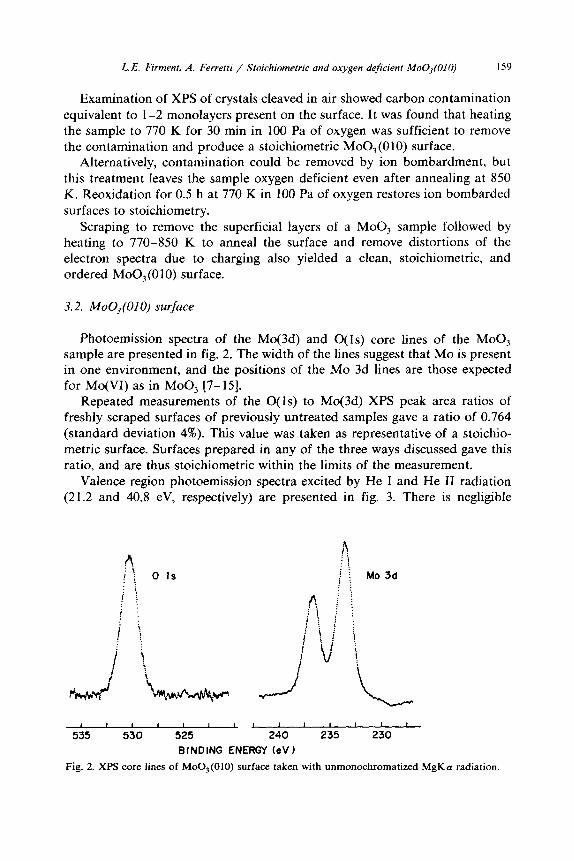
Valence region photoemission spectra excited by He I and He II radiation (21.2 and 40.8 eV, respectively) are presented in fig. 3. There is negligible
4 i i I i 0 Is . i
A Ii : i ; :
: I !, MO 3d
8 I I 1 I I 1 I 0 I 1 I I 1
535 530 525 240 235 230
BINDING ENERGY (eV)
Fig. 2. XPS core lines of MoO,(OlO) surface taken with unmonochromatized MgKa radiation.
160 L.E. Firment, A. Ferretti / Stoichiometric and oxygen deftcient MoO,(OlO)
intensity above the valence band edge in the He I spectrum consistent with the electronic structure and insulating properties of MOO,. Emission excited by the He IIp satellite line (48.4 eV) obscures this region in the He II spectrum. The
40.8 ev N (E)
-15 -10 -5 0 5
BINDING ENERGY (eV)
Fig. 3. UPS valence band emission of MoO,(OlO) excited with He I and He II radiation.
valence band of MOO, is 7 eV wide and the density of states has 3 maxima at approximately 1.5, 3.6, and 5.6 eV below the top of the valence band. An additional shoulder is often resolvable at 2.8 eV in the He I spectrum.
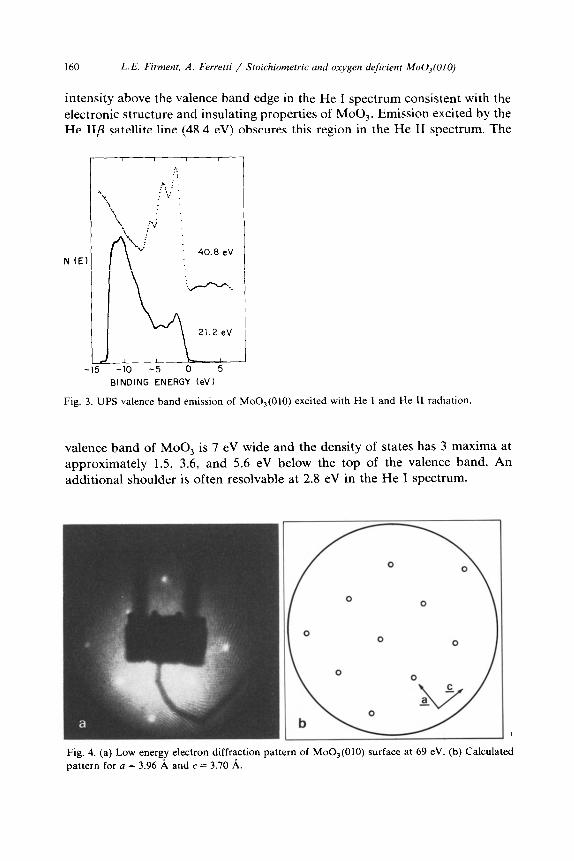
Fig. 4. (a) Low energy electron diffraction pattern of MoO,(OlO) surface at 69 eV. (b) Calculated
pattern for (I = 3.96 A and c = 3.70 A.
LE. Firment, A. Few&i / Stoichiometric and oxygen deficient Mo03(010) 161
ENERGY LOSS (eV) 30 20 1p
I
d N(E) dE
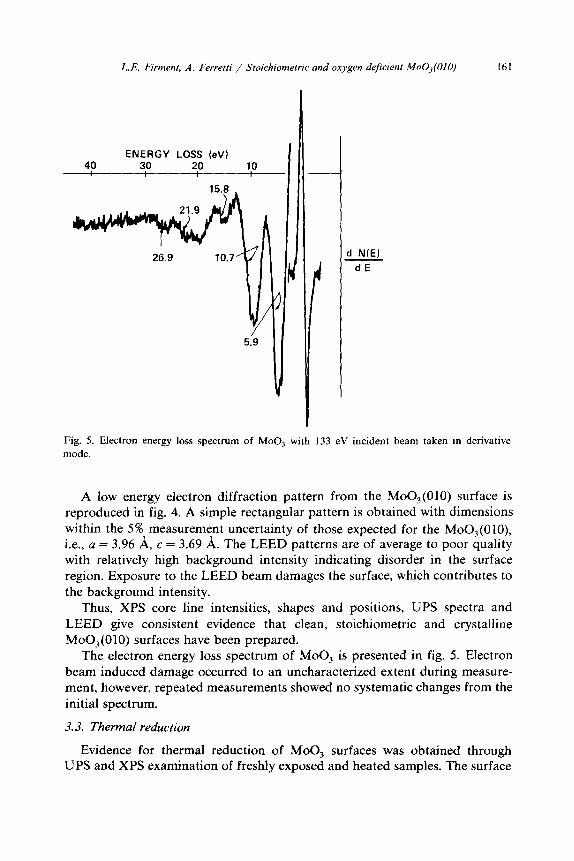
Fig. 5. Electron energy loss spectrum of MOO, with 133 eV incident beam taken in derivative mode.
A low energy electron diffraction pattern from the MoO,(OlO) surface is reproduced in fig. 4. A simple rectangular pattern is obtained with dimensions
within the 5% measurement uncertainty of those expected for the MoO,(OlO), i.e., a = 3.96 A, c = 3.69 A. The LEED patterns are of average to poor quality with relatively high background intensity indicating disorder in the surface region. Exposure to the LEED beam damages the surface, which contributes to the background intensity.
Thus, XPS core line intensities, shapes and positions, UPS spectra and
LEED give consistent evidence that clean, stoichiometric and crystalline MoO,(OlO) surfaces have been prepared.
The electron energy loss spectrum of MOO, is presented in fig. 5. Electron
beam induced damage occurred to an uncharacterized extent during measure- ment, however, repeated measurements showed no systematic changes from the
initial spectrum.
3.3. Thermal reduction
Evidence for thermal reduction of MOO, surfaces was obtained through UPS and XPS examination of freshly exposed and heated samples. The surface
162 L. E. Firment, A. Ferrettr / Stoichiometric and oxygen deficient MoO_,(OlO)
reduction is reversed through oxygen diffusion from the bulk at temperatures above 770 K.
Two new samples of MOO, were mounted in the vacuum chamber. The surfaces were scraped to remove any contamination or altered layers. Each sample was then heated in steps to 850 K. After each 30 min heating period,
the sample was cooled to room temperature. its XPS and UPS spectra were
recorded, and it was scraped to provide a new surface for the next step. Small but real changes in the surface were observed on sequential heating.
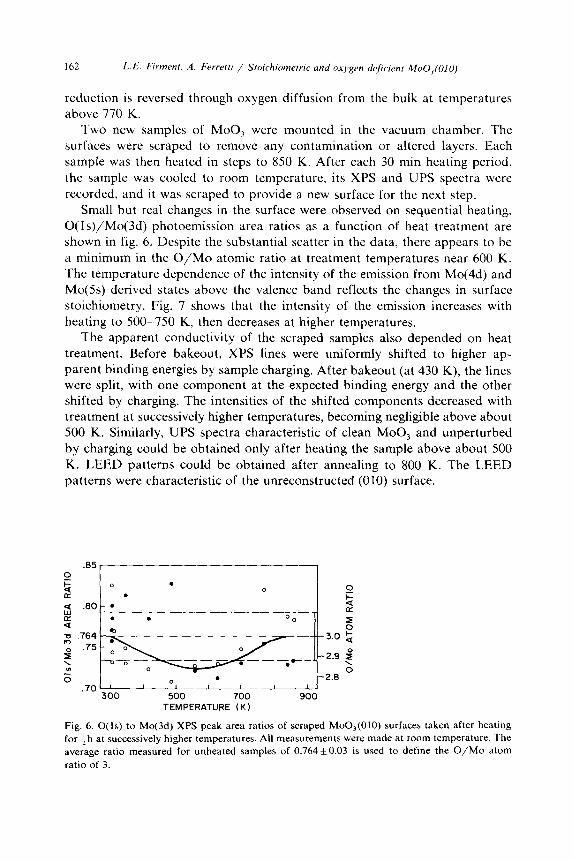
O(ls)/Mo(3d) photoemission area ratios as a function of heat treatment are shown in fig. 6. Despite the substantial scatter in the data, there appears to be
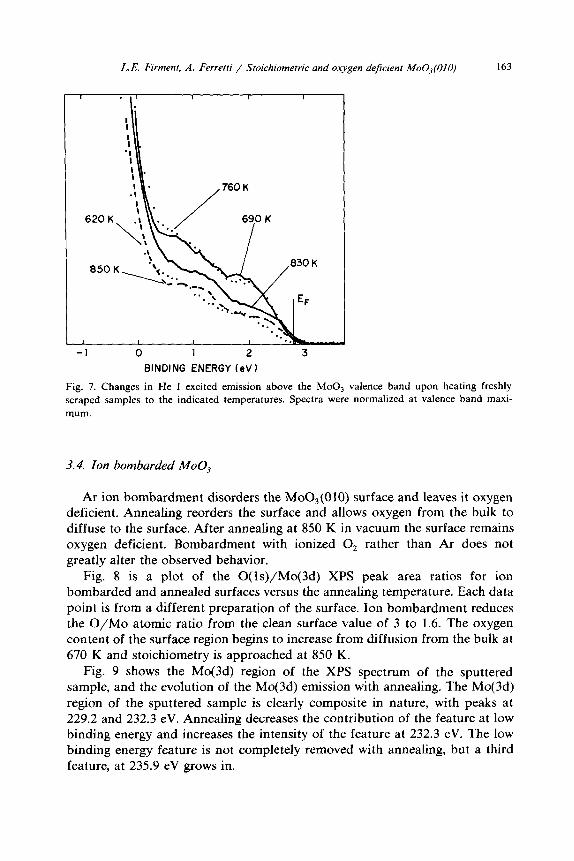
a minimum in the O/MO atomic ratio at treatment temperatures near 600 K. The temperature dependence of the intensity of the emission from Mo(4d) and Mo(5s) derived states above the valence band reflects the changes in surface stoichiometry. Fig. 7 shows that the intensity of the emission increases with
heating to 500-750 K, then decreases at higher temperatures. The apparent conductivity of the scraped samples also depended on heat
treatment. Before bakeout, XPS lines were uniformly shifted to higher ap-
parent binding energies by sample charging. After bakeout (at 430 K), the lines were split, with one component at the expected binding energy and the other shifted by charging. The intensities of the shifted components decreased with treatment at successively higher temperatures, becoming negligible above about 500 K. Similarly, UPS spectra characteristic of clean MOO, and unperturbed by charging could be obtained only after heating the sample above about 500
K. LEED patterns could be obtained after annealing to 800 K. The LEED patterns were characteristic of the unreconstructed (010) surface.
0 . 0 0
. F -. _---_--___-_ L
. . 0.3 e 5
3.0 5
-2.9 %
O 0 . -2.8 I I I I I ,
300 500 700 900 TEMPERATURE (K)
Fig. 6. O(ls) to Mo(3d) XPS peak area ratios of scraped MoO,(OlO) surfaces taken after heating for lh at successively higher temperatures. All measurements were made at room temperature. The average ratio measured for unheated samples of 0.76450.03 is used to define the O/MO atom
ratio of 3.
L. E. Firment, A. Ferretti / Stoichiometric and oxygen deficient MoO,(OlO) 163
-1 0 1 2 3
BINDING ENERGY (eV)
Fig. 7. Changes in He I excited emission above the MOO, valence band upon heating freshly scraped samples to the indicated temperatures. Spectra were normalized at valence band maxi-
mum.
3.4. Ion bombarded MOO,
Ar ion bombardment disorders the MoO,(OlO) surface and leaves it oxygen deficient. Annealing reorders the surface and allows oxygen from the bulk to diffuse to the surface. After annealing at 850 K in vacuum the surface remains oxygen deficient. Bombardment with ionized 0, rather than Ar does not
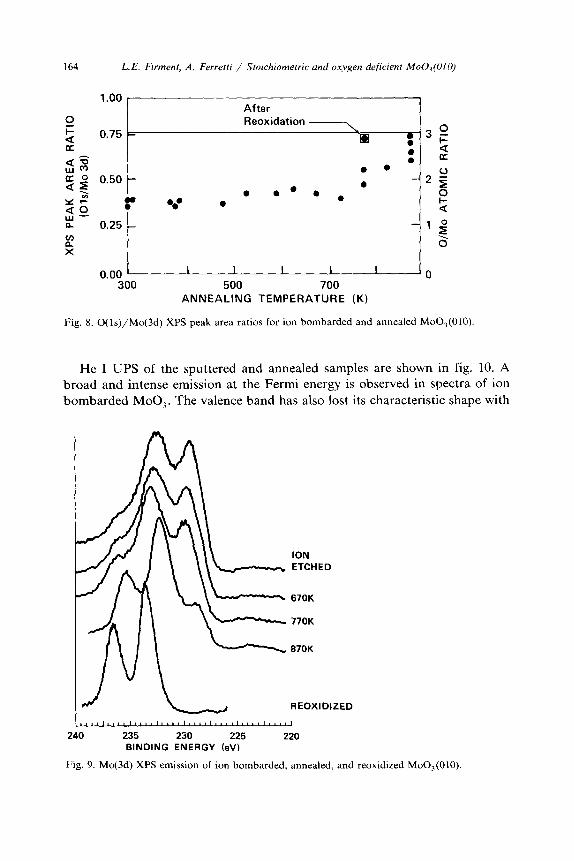
greatly alter the observed behavior. Fig. 8 is a plot of the O(ls)/Mo(3d) XPS peak area ratios for ion
bombarded and annealed surfaces versus the annealing temperature. Each data
point is from a different preparation of the surface. Ion bombardment reduces the O/MO atomic ratio from the clean surface value of 3 to 1.6. The oxygen content of the surface region begins to increase from diffusion from the bulk at 670 K and stoichiometry is approached at 850 K.
Fig. 9 shows the Mo(3d) region of the XPS spectrum of the sputtered sample, and the evolution of the Mo(3d) emission with annealing. The Mo(3d)
region of the sputtered sample is clearly composite in nature, with peaks at 229.2 and 232.3 eV. Annealing decreases the contribution of the feature at low binding energy and increases the intensity of the feature at 232.3 eV. The low binding energy feature is not completely removed with annealing, but a third
feature, at 235.9 eV grows in.
164 L.E. Fwment, A. Ferretti / Stoichiometric and oxygen deficient MoO,(OlO)
1.00
0.75 -
After Reoxidation
0.50 - l
f v l
0.00 I I I I I I IO 300 500 700
ANNEALING TEMPERATURE (K)
Fig. 8. O(ls)/Mo(3d) XPS peak area ratios for ion bombarded and annealed MoO,(OlO).
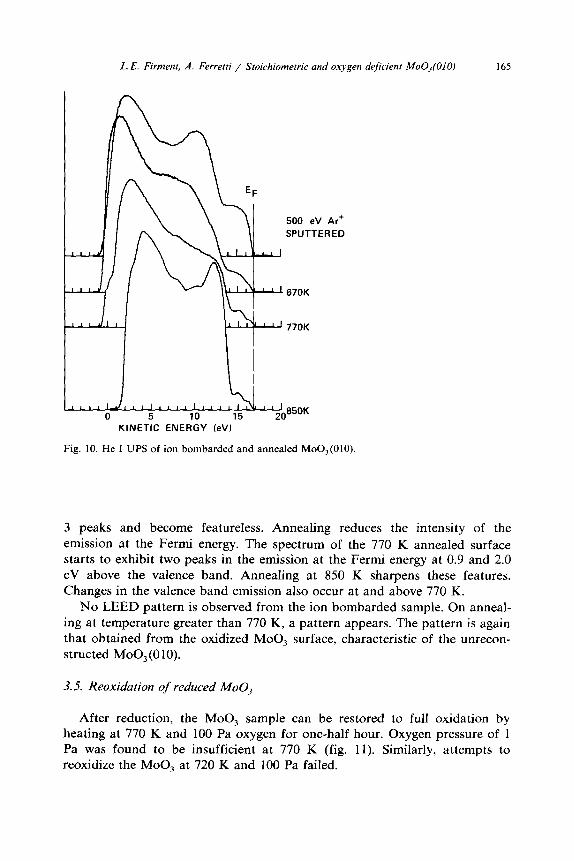
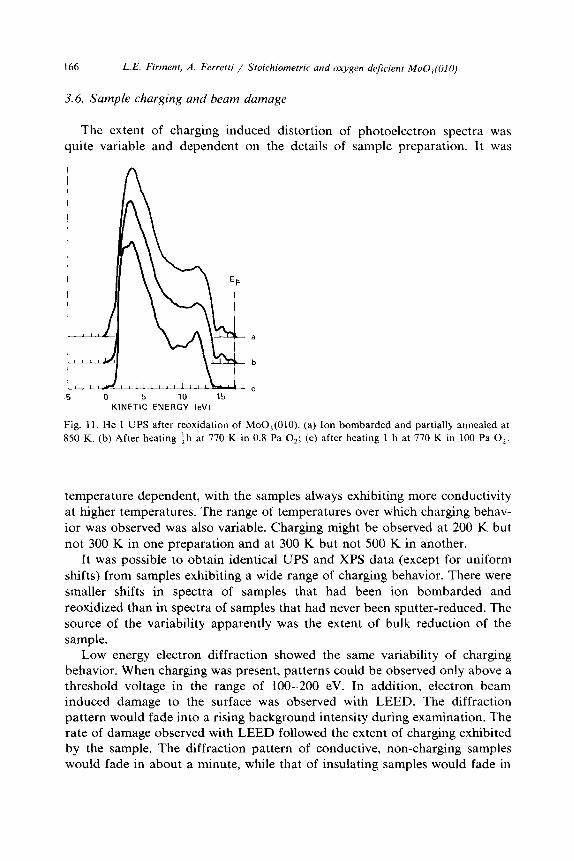
He I UPS of the sputtered and annealed samples are shown in fig. 10. A broad and intense emission at the Fermi energy is observed in spectra of ion
bombarded MOO,. The valence band has also lost its characteristic shape with
REOXIDIZED
240 235 230 225 BINDING ENERGY (eV)
220
Fig. 9. Mo(3d) XPS emission of ion bombarded, annealed, and reoxidized MoO,(OlO).
L.E. Firment, A. Ferretti / Stoichiometric and oxygen deficient MoO_,(OIO) 165
KINETIC ENERGY WJ
Fig. 10. He I UPS of ion bombarded and annealed MoO,(OlO).
3 peaks and become featureless. Annealing reduces the intensity of the
emission at the Fermi energy. The spectrum of the 770 K annealed surface starts to exhibit two peaks in the emission at the Fermi energy at 0.9 and 2.0 eV above the valence band. Annealing at 850 K sharpens these features. Changes in the valence band emission also occur at and above 770 K.
No LEED pattern is observed from the ion bombarded sample. On anneal- ing at temperature greater than 770 K, a pattern appears. The pattern is again that obtained from the oxidized MOO, surface, characteristic of the unrecon- structed MoO,(OlO).
3.5. Reoxidation of reduced MOO,
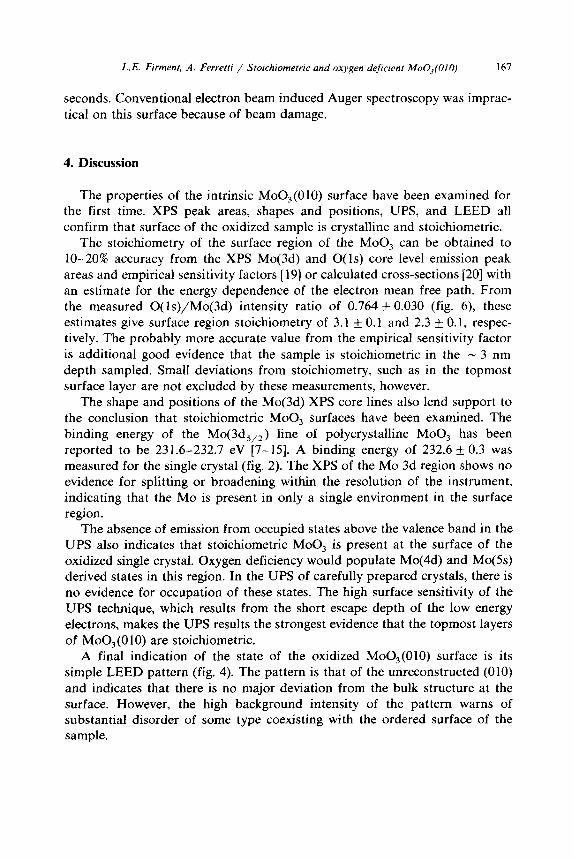
After reduction, the MOO, sample can be restored to full oxidation by heating at 770 K and 100 Pa oxygen for one-half hour. Oxygen pressure of 1 Pa was found to be insufficient at 770 K (fig. 11). Similarly, attempts to reoxidize the MOO, at 720 K and 100 Pa failed.
166 L. E. Firment, A. Ferretti / Stoichiometric and oxygen deficient MoO,(OlO)
3.6. Sample charging and beam damage
The extent of charging induced distortion of photoelectron spectra was quite variable and dependent on the details of sample preparation. It was
” -5 0 5 10 15
KINETIC ENERGY (eV)
Fig. 11. He I UPS after reoxidation of MoO,(OlO). (a) Ion bombarded and partially annealed at
850 K. (b) After heating :h at 770 K in 0.8 Pa 0,; (c) after heating 1 h at 770 K in 100 Pa 0,.
temperature dependent, with the samples always exhibiting more conductivity at higher temperatures. The range of temperatures over which charging behav- ior was observed was also variable. Charging might be observed at 200 K but not 300 K in one preparation and at 300 K but not 500 K in another.
It was possible to obtain identical UPS and XPS data (except for uniform shifts) from samples exhibiting a wide range of charging behavior. There were smaller shifts in spectra of samples that had been ion bombarded and reoxidized than in spectra of samples that had never been sputter-reduced. The source of the variability apparently was the extent of bulk reduction of the sample.
Low energy electron diffraction showed the same variability of charging behavior. When charging was present, patterns could be observed only above a threshold voltage in the range of 100-200 eV. In addition, electron beam induced damage to the surface was observed with LEED. The diffraction pattern would fade into a rising background intensity during examination. The rate of damage observed with LEED followed the extent of charging exhibited by the sample. The diffraction pattern of conductive, non-charging samples would fade in about a minute, while that of insulating samples would fade in
L.E. Firment, A. Ferretti / Stoichiometric and oxygen dejicrent MoO,(OlO) 161
seconds. Conventional electron beam induced Auger spectroscopy was imprac- tical on this surface because of beam damage.
4. Discussion
The properties of the intrinsic MoO,(OlO) surface have been examined for the first time. XPS peak areas, shapes and positions, UPS, and LEED all confirm that surface of the oxidized sample is crystalline and stoichiometric.
The stoichiometry of the surface region of the MOO, can be obtained to lo-20% accuracy from the XPS Mo(3d) and O(ls) core level emission peak areas and empirical sensitivity factors [ 191 or calculated cross-sections [20] with an estimate for the energy dependence of the electron mean free path. From the measured O(ls)/Mo(3d) intensity ratio of 0.764 &- 0.030 (fig. 6) these estimates give surface region stoichiometry of 3.1 + 0.1 and 2.3 _+ 0.1, respec- tively. The probably more accurate value from the empirical sensitivity factor
is additional good evidence that the sample is stoichiometric in the - 3 nm depth sampled. Small deviations from stoichiometry, such as in the topmost surface layer are not excluded by these measurements, however.
The shape and positions of the Mo(3d) XPS core lines also lend support to the conclusion that stoichiometric MOO, surfaces have been examined. The
binding energy of the Mo(3d,,, ) line of polycrystalline MOO, has been reported to be 231.6-232.7 eV [7-151. A binding energy of 232.6 _+ 0.3 was measured for the single crystal (fig. 2). The XPS of the MO 3d region shows no evidence for splitting or broadening within the resolution of the instrument, indicating that the MO is present in only a single environment in the surface region.
The absence of emission from occupied states above the valence band in the UPS also indicates that stoichiometric MOO, is present at the surface of the oxidized single crystal. Oxygen deficiency would populate Mo(4d) and Mo(5s) derived states in this region. In the UPS of carefully prepared crystals, there is no evidence for occupation of these states. The high surface sensitivity of the UPS technique, which results from the short escape depth of the low energy electrons, makes the UPS results the strongest evidence that the topmost layers
of MoO,(OlO) are stoichiometric. A final indication of the state of the oxidized MoO,(OlO) surface is its
simple LEED pattern (fig. 4). The pattern is that of the unreconstructed (010)
and indicates that there is no major deviation from the bulk structure at the surface. However, the high background intensity of the pattern warns of substantial disorder of some type coexisting with the ordered surface of the sample.
168 L.E. Firment, A. Ferrettr / Stoichiometric and oxygen deficient MoO_,(OlO)
4.1. Clean surface properties
The unchanged unit mesh at the MoO,(OlO) surface implies no substantial alteration of the bulk atomic geometry at the surface. Since no strong bonds must be broken on formation of the (010) surface, this result is not unexpected. If bulk-like coordination of the metal ion can be maintained at the surface,
reconstruction is unlikely to occur [21]. Transmission electron diffraction analysis of thin MOO, crystals showed that in all examined crystals, an integral number of the (010) double layers were present. Thus, there was no evidence for splitting of the double layers at the admittedly dirty surfaces of the thin crystals [22].
There is no evidence for occupied surface states split off from the valence
band into the bandgap. Since the (010) surfaces are so similar to the bulk layers, only small perturbations of the electronic structure are expected at the
surface. The valence band emission is fairly well described by a theoretical EMT0 calculation of the density of states and the photon energy dependence of the photoemission is consistent with calculated partial densities of states modulated by O(2p) and Mo(4d) emission cross-sections [23].
4.2. Electron energy loss spectra
Electron energy loss transitions were observed at 5.9(2), 10.7(l), 15.8(4), 21.9(9), and 26.9(7) eV in electron beam damaged MOO,. For the related oxides ReO, [24]. WO, [24-261, Na,WO, [24,25], and LiNbO, [27] strong transitions have been observed at 5.5-7 eV and 10.8-13.2 eV which have been assigned generally to interband transitions, although there is one assignment of these features to surface and bulk plasmons 1251. The presence of an empty
state - 6 eV above the valence band maximum in MOO, would allow assign- ment of the 5.9 and 10.7 eV ELS features to transitions to this state from states at the maxima near the top and bottom of the valence band, respectively, and the 26.9 feature to transitions from the O(2s) core state. Transitions from the top and bottom of the valence band to another empty state 16-17 eV above the valence band could result in the 15.8 and 21.9 eV features. However, these assignments ignore the contributions of surface and bulk plasma resonances.
4.3. Sputtered surface
The effects of ion bombardment on MOO, powders have been observed previously [15,17]. The MOO, lattice disorders, oxygen is lost, and a final product is MOO, as determined independently by XPS [15] and electron diffraction [17]. Ar ion bombardment of the MoO,(OlO) surface yields basi- cally the same results.
The stoichiometry deduced from the 0( 1s) and Mo(3d) peak areas of the
L.E. Firment, A. Ferretti / Stoichiometric and oxygen deficient MoO,(OlO) 169
sputtered surface is MOO,., (normalized to O/MO = 3 in the oxidized sample) (fig. 8). This appears to be a real deviation from MOO,. The Mo(3d) region of
the XPS is very much broadened and appears to be a superposition of at least two doublets (fig. 9). The primary contribution is from a doublet with 3d,,,
line at 229.2 eV. The Mo(3d,,,) of MOO, has been reported at 228.3-229.8 eV [7,10- 151. The second doublet overlaps the first and is near the position reported for MOO,. Kim et al. postulated at least one more contribution from MO in an environment intermediate to MOO, and MOO, [15]. In view of the disorder induced by sputtering, it is reasonable that there is a distribution of MO environments contributing to the photoemission.
The most prominent feature of the He I and II UPS spectra of sputtered MOO, is the intense and broad emission extending from the top of the valence band to the Fermi level (fig. 10). Similar X-ray induced valence band spectra of ion bombarded MOO, were reported by Fleisch and Mains [13]. The emission is from Mo(4d) and Mo(5s) derived states populated because of the oxygen deficiency of the sputtered sample, analogous to similar Ti(3d) states induced in TiO, by sputtering [28,29]. Different from the TiO, case, the Fermi level emission from sputtered MOO, is much more intense, indicating much
greater reduction of MOO, by sputtering. Also in contrast to TiO,, the metal state emission from reduced MOO, commences at the top of the valence band rather than several eV above it. The lower energy of these states reflects the greater ease of reduction of MOO,, i.e., to raise an electron from the valence band to the metal d state.
Both the valence band and Fermi level photoemission from sputtered MOO, are broad and shapeless, as expected from a disordered material, and as seen in sputtered TiO, [28,29] and WO, [30].
The effects of sputtering are not significantly healed on annealing at temperatures below 770 K (see figs. 8-10). Above 770 K, annealing increases the 0 content of the surface region, sharpens the Mo(3d) XPS lines, and enhances the high binding energy doublet relative to the low binding energy one. The effect of annealing on the UPS is to sharpen and make less intense the emission above the valence band. After annealing at 850 K, this emission has become a characteristic double-peaked feature. The valence band structure in well-annealed oxygen deficient samples is indistinguishable from that of
stoichiometric MOO,. Annealing above 770 K also causes the reappearance of a LEED pattern, and it is the LEED pattern of MoO,(OlO).
At temperatures above 770 K, lattice rearrangement occurs on the experi- mental time scale. This temperature coincides with that where reoxidation of thermally reduced surfaces occurs. The only source of oxygen to replenish the surface is the bulk of the sample, so oxygen diffusion must be rapid at these temperatures. A sharp increase in the diffusion constant of oxygen in MOO, at 770 K has been observed during C”O, exchange experiments [31].
Annealing of ion bombarded TiO, occurs in this temperature regime also
170 L. 15. Fwment, A. Ferretti / Stoichiometric and oxygen deficient MoO_,(OlO)
[29]. In light of the much higher lattice energy of TiO, compared to MOO, this result is surprising, although activation energies for diffusion and not lattice energies should be compared.
4.4. Defect emission
The characteristic doublet emission at the Fermi energy of reduced and annealed MOO, is clearly of Mo(4d) and Mo(5s) orbital character because of its position above the valence band. Since the bandgap of MOO, is 2.8 +_ 0.1 eV [32] and the doublet features are only 0.9 and 2.0 eV above the valence band, the filled states responsible for the doublet emission are not part of the conduction band of MOO,. Rather, they must be the result of defects in the MOO, structure. This conclusion is consistent with the LEED pattern of the
reduced and annealed surface, which is that of the MoO,(OlO). The defects must be disordered so that they are undetected by LEED.
The form of the doublet emission implies the defect involves multiple MO atoms since the doublet spectral shape indicates two occupied states or bands. The two features of the doublet are observed only together and in a fixed ratio of intensities. The two states are then electronic levels of one type of point or extended defect and since both are occupied, more than two MO electrons are associated with each defect or each repeating unit of an extended defect. This number of electrons is most likely shared by several MO atoms at the defect.
Haber et al. studied the reduction of MOO, with hydrogen using XPS and UPS 191. Their UPS of reduced MOO, exhibited the same doublet emission reported here. On the basis of XPS results, they assigned the doublet emission to two features originating from isolated Mo(IV) sites and Mo(IV) in shear planes. The apparent constant ratio of intensities of the two features of the doublet, even in thermally reduced samples (figs. 7 and lo), argues against independent origin of the two emission features.
The exact nature of the defect or defect phase is not clear. It is detected at the sample surface and it may be surface related [33]. Henrich and coworkers extensively studied UPS emission at the Fermi level of TiO, [34] and SrTiO, [35] and cited Ti3’/surface oxygen vacancies as the source of the emission. Similar interpretations have been presented for similar features in the UPS of LiNbO, [36,37] and LiTaO, [37]. Henrich and Kurtz have expanded this view by discussing interactions between neighboring Ti ions across a surface oxygen vacancy [38]. In general, UPS features assigned to surface oxygen vacancies have been single, although often broad, features.
The high annealing temperatures needed to form the doublet emission may indicate that the defect or defect phase extends into the bulk. Beatham and Orchard measured the He I UPS of MOO, powder and found the same doublet features as that of reduced and annealed MOO, [39]. They used Goodenough’s ideas to assign the doublet features to the filled MO-MO u-bonding band and
L. E. Firment, A. Ferretti / Stoichiometric and oxygen deficient MoO_,(OlO) 111
partially filled MO-O rr* bands of bulk MOO,. The close similarity of the UPS
of reduced and annealed MOO, to that of MOO, suggests that inclusions of MOO, or Moo,-like structures exist at the surface of reduced MOO, crystals. Bertrand and Dufour studied the reduction of MOO, using X-ray and electron diffraction and concluded that reduction to MOO, begins at the surface and proceeds along [OlO] layer by layer with formation of no intermediate phases
[401. Despite the similarity to the published UPS of MOO,, the assignment of the
defect structure of MOO, layers or inclusions is not conclusive. The UPS
doublet may be characteristic of other phases than MOO,. MOO, was found to grow topotactically on MOO, with MoC&{20i) parallel to MoO,{OlO} and MoO,[OlO] parallel to MoO,[lOl] or [loll [40]. The oriented growth would give new LEED features characteristic of MOO,, but none were observed. Also, the ease of reduction and oxidation of MO oxides raises doubts that the surface
of an MOO, powder is really MOO, [39]. Electron microscopic observations of the reduction of thin MOOR crystals
suggest a third model for the oxygen deficient MOO, surface. Crystallographic shear planes, which have been characterized by X-ray crystallography of a
large variety of suboxides of MO [41], have been observed to form as a stage of the reduction of MOO, [22,42-441. These structures are oxygen deficient planes
in the crystal where normally corner sharing MOO, octahedra become edge sharing. Crystallographic shear planes may have formed in the surface region of reduced and annealed MOO,. Colpaert et al. observed electron beam reduction of V,O,(OlO) surfaces to V,O,,, a phase related to V,O, by the introduction of shear planes 1451. Lange11 and Bernasek discussed LEED evidence for an ordered shear plane phase at the (111) surface of a faceted WO, crystal [46]. Similarly, Bringans et al. attributed emission above the valence band in the UPS of ion bombarded and annealed WO, to oxygen deficient structures where normally corner sharing WO, octahedra became edge sharing [47].
XPS data were reported for several different MO oxides MOO, with 2.75 < x < 3.0 [48], but it is not distinctive enough to serve to identify the presence of shear planes or other bulk reduced structures. No valence band photoemission of these materials have been published [49].
Choosing between the three models for the oxygen deficient defect at the surface of reduced and annealed MOO, is difficult. Beatham and Orchard’s work on MOO, [39] and Bertrand and Dufour’s observations of the reduction of MOO, [40], suggest that the defects are MOO, inclusions. The electron microscopy work showed that reduction of MOO, proceeds through several stages, and that the oxide crystal disintegrates before reaching MOO, [43]. Because of the measured O/MO stoichiometry of nearly 3, it seems likely that ion bombarded and annealed MoO,(OlO) is at a much earlier stage of reduc- tion than at MOO,.
172 L. E. Firment, A. Ferretfi / Stoichiometric and oxygen deficient MoO_,(OlO)
Little seems to be known about the electronic structure at crystallographic shear planes. Broclawic et al. reported SCF-SW-Xa calculations for two MO atom clusters of corner-sharing and edge-sharing Mo(IV)O, octahedra [50]. In the corner-sharing case, the Mo(4d) electrons occupied a single degenerate
level 0.7 eV above the topmost non-bonding 0 levels. The Mo(4d) electrons of the edge-sharing octahedra occupied two levels, u and r MO-MO bonding orbitals, split by 1.0 eV and the u level 0.7 eV above the non-bonding 0 levels.
The UPS spectrum of reduced and annealed MOO, bears some resemblance to the calculation for edge-sharing MO octahedra in that both indicate 2 MO levels split by 1 eV and lying close above the oxygen valence band levels. The similarity of the cluster calculation to experiment supports the assignment of oxygen deficient defect at MOO, surfaces to shear planes, but MO-MO bonding across edge sharing octahedra is found in MOO, also. The defect has been recorded at the surface of reduced MOO,, however, so it is premature to exclude the possibility that the defect is of purely surface origin.
4.5. Mo(3d) XPS
The appearance of at least two Mo(3d) doublets in the XPS spectrum of sputtered and annealed MOO, has two alternative explanations, but both affirm that the MOO, surface is oxygen deficient.
The positions of the doublets, at binding energies empirically found for Mo(V1) and Mo(IV), imply that MO is present in these two environments.
Differences in the initial state energy of the electrons accounts for the two doublets. Photoelectron spectra of Na,WO, [51] and LiNbO, [36] have been interpreted in this way.
Wertheim has emphasized that final state effects can cause the appearance of two sets of doublets [52]. He discussed the W(4f) spectrum of Na,WO,. The sets correspond to relaxed and unrelaxed core hole final states, with the relaxed state at lower apparent binding energy. Since electrons at the Fermi level are necessary to occupy the metal d states pulled below the Fermi level by the formation of the core hole in the relaxed final state, the intensity of the low binding energy doublet scales with the extent of reduction of the oxide.
Since the excess electrons occupy defect and not conduction band states, the initial state interpretation of the Mo(3d) spectra is favored. The two interpreta- tions both lead to the conclusion that the sample is oxygen deficient in the surface region.
4.6. Thermal reduction
Thermal reduction of MOO, on heating in vacuum is a well known phenom- enon. The role of reducing impurities in the residual atmosphere during these observations has not been identified. Both XPS peak area ratios and the UPS
L. E. Firment, A. Ferretti / Stoichiomettic and oxygen deficient MoO,(OlO) 173
emission near the Fermi energy (figs. 4 and 5) show that heating MoO,(OlO) in
ultrahigh vacuum can reduce its surface. The clean conditions prove that no foreign reductant is involved. Evolution of oxygen into the gas phase would be the simplest mechanism for the thermal reduction of MOO,. The observed reoxidation of the surface at temperatures of 800 K is due to increased rates of
oxygen mobility which allow equilibration of the oxygen content of the sample between the bulk and surface region.
The characteristic doublet structure at the Fermi energy seen in ion bombarded and annealed MOO, is also evident in the UPS spectra of thermally treated MOO, (fig. 7). Similar reduced structures are produced then by either
procedures. WO, [46,53] and V,O, [45] were found to be stable on heating in UHV to
850 and 830 K, respectively. On the other hand, ZnO becomes oxygen deficient
on heating above 750 K in vacuum [54].
4.7. Reoxidation
Strenuous reoxidation conditions (lo2 Pa O,, 770 K) were found to be necessary to insure stoichiometry at the MoO,(OlO) surface (fig. 11). The activation of molecular oxygen must be rate limiting because thermodynamics favors stoichiometric MOO, at much lower pressures and temperatures. (Oxygen vapor pressure above MoO,/MoO, is IO-l5 Pa at 600 K [55].) MOO, powder was found to be reoxidized at measurable rates above 763 K at lo4 Pa 0, [56]. Isotopic exchange of MOO, with 1802 has been found to occur also above 770
K [31]. Additionally, hydrogen [57] and thermal [56] reduction of MOO, are accelerated above 770 K. As discussed above, diffusion of oxygen through the MOO, lattice becomes rapid above 770 K. Possibly, the rapid diffusion of oxygen (or oxygen vacancies) at 770 K permits formation of adsorption and reaction sites for molecular oxygen.
For comparison, in other single crystal studies LiNbO, was prepared by oxidation at 970 K [36] and WO, was reoxidized by exposure to atomic oxygen dissociated by a hot filament [47].
4.8. Conductivity and damage
The conductivity of the MOO, and oxygen deficient MOO, was observed through electron spectroscopy and LEED. It proved to be erratic and not strictly correlated with the electronic structure revealed through UPS. A working model that fits the observations to date is that the observed conductiv- ity-related behavior depends on the state of reduction of the bulk of the sample. Heavily reduced samples are conductive because of the metal-like electronic structure of the oxygen-deficient structures in the MOO, matrix. The electron spectra depend on the electronic structure at the surface, which may
174 L. E. Firment, A. Ferretti / Sfoichiometric and oxygen deficwnt MoO,(OlO)
not be equilibrated with the bulk. The rate at which oxygen enters or leaves the sample during bombardment or reoxidation may be faster or slower than the rate of oxygen or oxygen vacancy diffusion between the surface and bulk. Courths observed that reduction of BaTiO, by sputtering above did not render the sample conductive, but that annealing at greater than 870 K was necessary
[58]. Presumably the annealing allowed oxygen vacancy diffusion to reduce the bulk of the sample.
The charging phenomenon resulting from the low conductivity of MOO, presents a severe limitation on LEED and UPS studies. It has been shown that the stoichiometric MOO, surface can be prepared on a conductive sample
under selected conditions. Those conditions need to be better defined. Low kinetic energy electron flood guns neutralized the charging problem on single
crystals of perovskites [27,36,37] and may prove to be helpful on MOO,. Electron beam induced damage was observed with LEED. MOO, can be
reduced to MOO, by electron bombardment [16]. Electron beam irradiation of oxides generally results in oxygen desorption [29,36,37,45,46]. The rate of electron beam induced damage observed with LEED correlates with the conductivity behavior of the sample. Conductive samples are less prone to damage than insulating samples. This relation has some generality. V,O, is damaged by electron bombardment, but V,O,, is stable [45]. The relation can be understood in the context of the Knotek-Feibelman core-hole Auger decay mechanism for electron stimulated desorption [59]. Occupation of Mo(4d) and Mo(5s) states in reduced MOO, samples allows intra-atomic Auger decay to predominate over the inter-atomic decay mechanism which leads to oxygen desorption. Other damage mechanism may also be involved, however.
5. Conclusion
The geometry and electronic structure of the intrinsic MoO,(OlO) surface have been defined by LEED and UPS. The surface shows no great differences from the bulk, which is not totally unexpected in view of the layered bulk structure.
Oxygen deficient MoO,(OlO) surfaces have also been examined, and one feature of these surfaces which stands out is their lability. Heating in vacuum induces reduction, diffusion between the surface region and bulk occurs, and bombardment with electrons or ions alters the surface. This lability is a barrier to systematic study of MOO, surfaces. Careful attention to preparation meth- ods is necessary to ensure reproducible surfaces. But this lability is directly related to the importance of MOO, as a catalyst. Catalytic oxidation requires that the surface easily give up and regain its oxygen. UPS has given evidence for the presence of complex oxygen deficient structures, perhaps crystallo- graphic shear planes, in reduced MoO,(OlO) surfaces. Further measurement of
L.E. Firment, A. Ferretti / Stoichiometric and oxygen deficient MoO,(OIO) 175
the kinetics and mechanisms of reduction and reoxidation should aid our
understanding of the catalytic properties of MOO,.
Acknowledgements
We are grateful to E.P. Moore for obtaining Laue X-ray diffraction data and to K.D. Raffell for technical assistance.
References
[1] C.J. Machiels and A.W. Sleight, J. Catalysis 76 (1982) 238.
[2] J.M. Tatibouet and J.E. Germain, J. Catalysis 72 (1981) 375; J. Chem. Res. (M) (1981) 3070.
[3] N. Giordano, M. Meazza, A. Castellan, J.C.J. Bart and V. Ragaini, J. Catalysis 50 (1977) 342.
[4] G.K. Boreskov, B.I. Popov, V.N. Bibin and ES. Kozishnikova, Kinetics Catalysis (USSR)
(English Transl.) 9 (1968) 657.
[5] R. Pearce and W.R. Patterson, Eds., Catalysis and Chemical Processes (Wiley-Halsted, New
York, 1981).
[6] L. Kihlborg, Arkiv Kemi 21 (1963) 357. 17) R.J. Colton, A.M. Guzman and J.W. Rabalais, J. Appl. Phys. 49 (1978) 409.
[8] B. Grzybowska, J. Haber, W. Marczewski and L. Ungier, J. Catalysis 42 (1976) 327.
[9] J. Haber. W. Marczewski, J. Stoch and L. Ungier, Ber. Bunsenges. Physik. Chem. 79 (1975) 970.
[lo] R.A. Walton, J. Less-Common Metals 54 (1977) 71.
[ 11) C. Tenret-Noel, J. Verbist and Y. Gobillon, J. Microsc. Spectrosc. Electron. 1 (1976) 255.
[12] F. Lepage, P. Baillif and J. Bardolle, Vide 30A (1975) 100.
[ 131 T.H. Fleisch and G.J. Mains, J. Chem. Phys. 76 (1982) 780.
[ 141 A. Cimino and B.A. DeAngelis, J. Catalysis 36 (1975) 11. [15] K.S. Kim, W.E. Baitinger, J.W. Amy and N. Winograd, J. Electron Spectrosc. Related
Phenomena 5 (1974) 351.
[ 161 T.T.Lin and D. Lichtman, J. Vacuum Sci. Technol. I5 (1978) 1689.
1171 H.M. Naguib and R.Kelly, J. Phys. Chem. Solids 33 (1972) 1751.
[ 181 N.J. Shevchik, J. Electron Spectrosc. Related Phenomena 14 (1978) 411.
[ 191 C.D. Wagner, L.E. Davis, M.V. Zeller, J.A. Taylor, R.H. Raymond and L.H. Gale, Surface
Interface Analysis 3 (198 1) 2 I 1. (201 J.H. Scofield, J. Electron Spectrosc. Related Phenomena 8 (1976) 129. [21] L.E. Firment, Surface Sci. 116 (1982) 205.
[22] L.A. Bursill, W.C.T. Dowell, P. Goodman and N. Tate, Acta Cryst. A34 (1974) 296.
[23] L.E. Firment and E.B. Caruthers, to be published.
[24] R.E. Dietz, M. Campagna, J.N. Chazalviel and H.R. Shanks, Phys. Rev. B17 (1978) 3790.
[25] M.A. Lange11 and S.L. Bernasek, Phys. Rev. B23 (1981) 1584.
1261 J.J. Ritsko, H. Witzke and S.K. Deb, Solid State Commun. 22 (1977) 455.
[27] L. Kasper and S. Htifner, Phys. Letters 81A (1981) ,165; P. Steiner and H. Hiichst, 2. Physik B35 (1979) 51.
[28] V.E. Henrich, G. Dresselhaus and H.J. Zeiger, Phys. Rev. Letters 36 (1976) 1335.
[29] R.H. Tait and R.V. Kasowski, Phys. Rev. B20 (1979) 5178.
[30] R.D. Bringans, H. Hijchst and H.R. Shanks, Phys. Rev. B24 (1981) 3481.
1311 V.S. Muzykantov, K.Ts. Cheshkova and G.K. Boreskov, Kinetics Catalysis (USSR) (English
transl.) 14 (1973) 365.
176 L.E. Firmen~, A. Ferretti / Stolchiometric and oxygen deficient MoO_,(OlO)
[32] Z.M. Hanafi, M.A. Khilla and A. Abu-El Saud, Rev. Chim. Mineral. 18 (1981) 133.
[33] V.M. Bermudez, Progr. Surface Sci. 11 (1981) 1.
[34] V.E. Henrich, G. Dresselhaus and H.J. Zeiger, Phys. Rev. Letters 36 (1976) 1335.
[35] S. Ellialtoglu, T. Wolfram and V.E. Henrich, Solid State Commun. 27 (1978) 321.
[36] R. Courths, P. Steiner, H. Hochst and S. Htifner, Appl. Phys. 21 (1980) 345.
[37] V.H. Ritz and V.M. Bermudez, Phys. Rev. B24 (1981) 5559.
[38] V.E. Henrich and R.L. Kurtz, Phys. Rev. B23 (1981) 6280.
[39] N. Beatham and A.F. Orchard, J. Electron Spectrosc. Related Phenomena 16 (1979) 77.
[40] 0. Bertrand and L.C. Dufour, Phys. Status Solidi (a) 60 (1980) 507.
[41] L. Kihlborg, Arkiv Kemi 21 (1963) 471.
1421 L.A. Bursill, Proc. Roy. Sot. (London) A31 1 (1969) 267.
[43] P.L. Gai, Phil. Mag. A43 (1981) 841.
[44] W. Thiini and P.B. Hirsch, Phil. Mag. 33 (1976) 639;
W. Thoni, P.L. Gai and P.B. Hirsch, Phil. Mag. 35 (1977) 781.
[45] M.N. Colpaert, P. Clauws, L. Fiermans and J. Vennik, Surface Sci. 36 (1973) 513.
[46] M.A. Lange11 and S.L. Bernasek, J. Vacuum Sci. Technol. 17 (1980) 1296.
1471 R.D. Bringans, H. Hochst and H.R. Shanks, Phys. Rev. B24 (1981) 3481.
[48] F. Cariati, J.C.J. Bart and A. Sgamellotti, Inorg. Chim. Acta 48 (1981) 97.
[49] Unpublished work in our lab shows the He I UPS of Mo,O,, powder and a powder of the
composition “Mo,0z6” are both very similar to that of reduced and annealed MoO,(OlO).
[50] E. Broclawik, A.E. Foti and V.H. Smith, Jr., J. Catalysis 67 (1981) 103.
[51] B.A. de Angelis and M. Schiavello, Chem. Phys. Letters 58 (1979) 249.
[52] G.K. Wertheim, Chem. Phys. Letters 65 (1979) 377.
1531 H. Hijchst and R.D. Bringans, Appl. Surface Sci. 11/12 (1982) 768.
1541 W. Gopel, J. Vacuum Sci. Technol. 15 (1978) 1298.
[55] E.G. King, W.W. Weller and A.U. Christensen, Thermodynamics of Some Oxides of
Molybdenum and Tungsten, US Bureau of Mines Report of Investigations 5664 (1960). [56] V.D. Stytsenko, V.V. Ploshkin, V.P. Polyakov, Yu.A. Pavlov and A.Ya. Rozovskii, Kinetics
Catalysis (USSR) (English Transl.) 20 (1979) 56.
[57] M.J. Kennedy and S.C. Bevan, J. Less Common Metals 36 (1974) 23.
[58] R. Courths, Phys. Status Solidi (b) 100 (1980) 135.
1591 M.L. Knotek and P.J. Feibelman, Phys. Rev. Letters 40 (1978) 964.
Related Documents