Applied Catalysis A: General 190 (2000) 177–190 Interaction between Pt and MoO 3 dispersed over alumina Mônica Antunes Pereira da Silva a , Raphael A. MelloVieira b , Martin Schmal a,b,* a Escola de Qu´ ımica/UFRJ, C.P. 68502, 21945-970, Rio de Janeiro, Brazil b NUCAT/PEQ/COPPE/UFRJ, C.P. 68502, 21945-970, Rio de Janeiro, Brazil Received 14 July 1998; received in revised form 12 July 1999; accepted 15 July 1999 Abstract Pt–xMo/g-Al 2 O 3 catalysts of different molybdenum loading (2–20 wt.%) and with 1 wt.% of platinum were prepared by successive wet impregnation after intermediate calcination. The structure, morphology and surface were characterized by various methods. The DRS results indicate the presence of octahedral Mo 6+ and tetrahedral Mo 6+ phases. It also evidences the presence of polymeric MoO x species, responsible for the formation of a well dispersed surface sublayer and bulk MoO 3 crystalline phase. XPS results after reduction and passivation of the 1Pt and 1Pt2Mo revealed the presence of residual chlorine, in the form of surface species such as [Pt(OH) x Cl y ] s and [PtO x Cl y ] s favoring the formation of well dispersed platinum particles. The TPD and FTIR results are consistent with the existence of new active sites of Pt in the presence of molybdenum loading. For low Mo content there is a H 2 spillover effect. These results confirm the decoration model of Pt encapsulation by partially reduced Mo species as well as H 2 storage and backspillover due to the generation of a bronze compound. ©2000 Elsevier Science B.V. All rights reserved. Keywords: Platinum–molybdenum catalysts; Chemisorption H 2 and CO; Morphology; Characterization of Pt–Mo/g-Al 2 O 3 1. Introduction Automotive catalysts use rhodium, platinum and palladium, as active elements to eliminate pollutant gases, such as CO, NO x and hydrocarbons. Rhodium is effective in spite of presenting sensibility to sulfur poisoning. This is of great importance since signifi- cant amounts of sulfur are present in petroleum based fuels. However, rhodium is very expensive and scarce, motivating researchers to look for another metal for use in the three-way catalysts. Halasz et al. [1,2] and Gandhi et al. [3] proposed a new type for exhaust catalysts and have shown that the * Corresponding author. Fax: +55-21-290-6626 E-mail address: [email protected] (M. Schmal) association of molybdenum oxide with a noble metal (Pt or Pd) enhances the reduction of NO x with CO and hydrocarbons. The bimetallic systems Pt–Mo or Pt–W are of great interest in the converters since both catalytic and chemisorptive properties of noble metals may change after interaction between the metals. Study- ing Pt–Mo bimetallic structures after reduction at 773–823 K Liu et al. [4] observed the formation of bimetallic clusters in which part of the molybdenum was involved in the bimetallic particle at zero valence and part as dispersed molybdenum atoms in low va- lence states. Previously, DeVries et al. [5], based on XPS measurements, observed the reduction of Mo 6+ to Mo 5+ in the presence of PtO 2 in dispersed MoO 3 over Al 2 O 3 . The Mo–Pt interaction after reduction 0926-860X/00/$ – see front matter ©2000 Elsevier Science B.V. All rights reserved. PII:S0926-860X(99)00295-1

Welcome message from author
This document is posted to help you gain knowledge. Please leave a comment to let me know what you think about it! Share it to your friends and learn new things together.
Transcript

Applied Catalysis A: General 190 (2000) 177–190
Interaction between Pt and MoO3 dispersed over alumina
Mônica Antunes Pereira da Silvaa, Raphael A. MelloVieirab, Martin Schmala,b,∗a Escola de Quımica/UFRJ, C.P. 68502, 21945-970, Rio de Janeiro, Brazil
b NUCAT/PEQ/COPPE/UFRJ, C.P. 68502, 21945-970, Rio de Janeiro, Brazil
Received 14 July 1998; received in revised form 12 July 1999; accepted 15 July 1999
Abstract
Pt–xMo/g-Al2O3 catalysts of different molybdenum loading (2–20 wt.%) and with 1 wt.% of platinum were prepared bysuccessive wet impregnation after intermediate calcination. The structure, morphology and surface were characterized byvarious methods. The DRS results indicate the presence of octahedral Mo6+ and tetrahedral Mo6+ phases. It also evidencesthe presence of polymeric MoOx species, responsible for the formation of a well dispersed surface sublayer and bulk MoO3
crystalline phase. XPS results after reduction and passivation of the 1Pt and 1Pt2Mo revealed the presence of residual chlorine,in the form of surface species such as [Pt(OH)xCly]s and [PtOxCly]sfavoring the formation of well dispersed platinum particles.The TPD and FTIR results are consistent with the existence of new active sites of Pt in the presence of molybdenum loading.For low Mo content there is a H2 spillover effect. These results confirm the decoration model of Pt encapsulation by partiallyreduced Mo species as well as H2 storage and backspillover due to the generation of a bronze compound. ©2000 ElsevierScience B.V. All rights reserved.
Keywords:Platinum–molybdenum catalysts; Chemisorption H2 and CO; Morphology; Characterization of Pt–Mo/g-Al2O3
1. Introduction
Automotive catalysts use rhodium, platinum andpalladium, as active elements to eliminate pollutantgases, such as CO, NOx and hydrocarbons. Rhodiumis effective in spite of presenting sensibility to sulfurpoisoning. This is of great importance since signifi-cant amounts of sulfur are present in petroleum basedfuels. However, rhodium is very expensive and scarce,motivating researchers to look for another metal foruse in the three-way catalysts.
Halasz et al. [1,2] and Gandhi et al. [3] proposed anew type for exhaust catalysts and have shown that the
∗ Corresponding author. Fax: +55-21-290-6626E-mail address:[email protected] (M. Schmal)
association of molybdenum oxide with a noble metal(Pt or Pd) enhances the reduction of NOx with CO andhydrocarbons.
The bimetallic systems Pt–Mo or Pt–W are ofgreat interest in the converters since both catalyticand chemisorptive properties of noble metals maychange after interaction between the metals. Study-ing Pt–Mo bimetallic structures after reduction at773–823 K Liu et al. [4] observed the formation ofbimetallic clusters in which part of the molybdenumwas involved in the bimetallic particle at zero valenceand part as dispersed molybdenum atoms in low va-lence states. Previously, DeVries et al. [5], based onXPS measurements, observed the reduction of Mo6+to Mo5+ in the presence of PtO2 in dispersed MoO3over Al2O3. The Mo–Pt interaction after reduction
0926-860X/00/$ – see front matter ©2000 Elsevier Science B.V. All rights reserved.PII: S0926-860X(99)00295-1

178 M.A. Pereira da Silva et al. / Applied Catalysis A: General 190 (2000) 177–190
was observed in these cases for approximately 4%Mo and between 3.3 and 24% Pt content. However,most catalysts have very low Pt concentrations, whichimplies different behavior when the Mo concentra-tion increases towards the dispersed monolayer overthe alumina support. Similar studies were made byRegalbuto et al. [6,7] for Pt–WO3 catalysts, focusingthe fundamental aspects of interaction between Ptand WO3 sublayers at different concentrations, andusing SiO2 as support. They validated the decorationmodel, and showed that hydrogen tungsten bronzeswere obtained with high tungsten contents, whichexplains the interaction phenomena and the ligandeffects for the NO–CO reaction. Although the Pt–Moand Pd–Mo over silica and alumina supports wereintensively studied, the interaction effects and thesurface properties remain poorly understood.
The objective of this work was to study the interac-tion of platinum at low concentration with molybde-num oxide overg-Al2O3, varying the Mo concentra-tion from 2 to 20 wt.% and the surface reactions’ prop-erties. The Pt–MoO3 system after reduction was stud-ied using different techniques stressing on the charac-terization of the surface and structure of this bimetallicsystem.
The following techniques were used: X-raydiffraction, diffuse reflectance spectroscopy, tempe-rature-programmed reduction, XPS, H2 and COchemisorptions, infrared spectroscopy with CO asprobe-molecule and CO thermodesorption with pro-grammed temperature.
2. Experimental
2.1. Preparation of catalysts
The catalysts were prepared using wet impregnationat pH 5 [8]. The support wasg-Al2O3 (Al-3916 P)from Engelhard Corp. with 189 m2/g and 0.54 cm3/gpore volume. The support was impregnated with am-monium heptamolybdate ((NH4)6Mo7O24·4H2O) so-lution at desired concentrations. The samples weredried at 383 K for 20 h and then calcined in air flowat 773 K for 2 h. The metal loading varied between 2and 20 wt.% of molybdenum, while the H2PtCl6 wasadded to obtain an almost constant value of 1 wt.%.
Prepared catalysts will be referred to asxPtyMo, wherex (1%) andy (2–20%) represent the weight percentageof Pt and Mo, respectively.
2.2. Characterization
Molybdenum and platinum contents were deter-mined by atomic absorption spectrometry in a PerkinElmer, 1100 B model spectrometer.
Textural properties were obtained in a Micromerit-ics ASAP 2000 equipment after pretreatment at 573 K.
The X-ray diffraction analysis was performed in aPhilips diffractometer by using Cu Ka radiation atroom temperature. The samples were calcined at 773 Kand then reduced at 773 K, followed by passivationand analyzed at room temperature.
Diffuse reflectance spectra were performed in anUV–visible range spectrometer Varian, model Cary5, equipped with a diffuse reflectance accessory ‘Har-rick’ with ‘Mantis Prayning’ geometry. The samealumina support was used as reference. The DRSanalysis were obtained in air at room temperaturein the range between 200 and 800 nm wavelength.The DRS spectra were presented after using theSchulz–Kubelka–Munk’s equation (f(R)). The cal-cined samples were not pretreated.
Temperature-programmed reduction (TPR) was ob-tained by using an equipment described elsewhere [9].The following conditions were used: a flow rate of30 cm3/min of H2/Ar mixture containing 1.76% (mo-lar percentage) of H2, at a heating rate of 8 K/min upto 1223 K and then held constant for 30 min.
The XPS measurements were obtained in a PerkinElmer model 1257 spectrometer using Mg Ka radia-tion (1253.6 eV). The spectra were normalized usingthe binding energy of a small C 1s contamination(284.6 eV) and for Al 2p, C 1s, O 1s, Mo 3d, Cl2p and Pt 4d. The relative concentrations were cal-culated using a standard Gaussian peak-fitting routineand the intensities were corrected using sensitivity fac-tors. All samples were analyzed in the oxide form afterevacuation at 10−9 Torr and at 298 K. These sampleswere also analyzed after reduction at 773 K and fol-lowed by a controlled oxidation, from now on calledpassivation.
H2 and CO chemisorption analysis were made usingan ASAP 2000 equipment of Micromeritics. Before

M.A. Pereira da Silva et al. / Applied Catalysis A: General 190 (2000) 177–190 179
Table 1Metal loadings and surface area
Sample Real Pt wt.% Mo Nominal Pt wt.% Mo Surface area BET (m2/g)
1Pt 1.07 – 1.00 – 168.01Pt2Mo 1.06 1.92 1.00 2.00 163.51Pt8Mo 0.97 8.03 1.00 8.00 161.01Pt14Mo 0.74 14.28 1.00 14.00 130.31Pt20Mo 0.83 20.12 1.00 20.00 111.5g-Al2O3 – – – – 184.0
reduction, the sample was pretreated with Ar flux at423 K for 30 min, swept to pure H2 at 30 cm3/min,raising the temperature up to 773 K at 10 K/min andheld for 2 h at this temperature. Then, after evacua-tion and cooling down to room temperature (303 K),H2 chemisorption followed by evacuation for 1 h at773 K and CO chemisorption at 303 K. Molybdenumcatalyst did not chemisorb hydrogen and the plat-inum dispersions were calculated assuming that oneplatinum atom chemisorb a hydrogen atom or a COmolecule. The specific surface area was calculated as-suming 1.25× 10¹⁹ Pt atoms/m2 and an atomic crosssection of 0.08 nm2.
The infrared analysis was performed in a PerkinElmer System 2000 FTIR equipment. Samples wereanalyzed in a system described elsewhere [10], pre-treated by passing Ar at 423 K for 1 h (10 K/min), fol-lowed by reduction at 473 K (10 K/min) with pure H2flux (50 cm3/min) for 2 h and evacuation for 1 h. Aftercooling down to room temperature the IR spectrumwas obtained. Then, CO was admitted at 30 Torr for30 min at 303 K and after evacuation the IR spectrumwas taken. After evacuation at 473 K, this procedurewas repeated for a reduction temperature at 773 K.
The TPD of CO was obtained in a multitestequipment connected to a quadrupole mass spec-trometer (Ametek/Dycor, model MA100) equippedwith data acquisition system. First, the catalystwas dried at 423 K for 30 min (10 K/min), flowingHe at 30 cm3/min and then reduced with pure H2(180 cm3/min) at 773 K for 2 h (10 K/min). Afterpurging with He for 30 min at 773 K and coolingdown to room temperature, CO pulses were ad-mitted until saturation. Then, desorption profiles ofCO, H2 and CO2 were obtained by raising the tem-perature from 303 to 773 K at 20 K/min under Heflow.
3. Results
3.1. Concentration and surface area
BET surface areas and metal loadings for all cata-lysts are presented in Table 1. The maximum concen-tration for the formation of a sublayer beyond whichthe bulk MoO3 is formed, was estimated to be 8 atomMo/nm2, following the procedure presented by Leyeret al. [11] and Liu et al. [12]. For a surface area of189 m2/g of the support, it corresponds to a bulk load-ing of 14.6 wt.% of molybdenum. The surface area de-creases with increasing Mo loading [13,14]. However,the surface area changed little if at all with additionof Pt.
3.2. X-ray diffraction
Fig. 1 displays the diffraction patterns of the cal-cined catalysts. These diffraction patterns show twobands at 46 and 67◦, which correspond to theg-Al2O3support [15]. Only the 1Pt20Mo sample exhibitedcrystallites of Mo species between 20 and 30◦ which,according to the literature [15–17], correspond to thebulk MoO3 structure. Therefore, the XRD results didnot show molybdenum aluminate or bulk MoO3 crys-tals at lower Mo loading. However, the XRD resultsof the catalysts with higher Mo loading showed peaksaround 39.7 and 46.5◦, corresponding to platinumparticles soon after calcination [18,19].
Fig. 2 also shows the X-ray diffraction patterns ofthe passivated catalysts after reduction at 773 K. Char-acteristic reflections of metallic platinum were ob-served on the samples above 8 wt.% Mo concentration,as already described in the literature [6,15]. Our resultssuggest that after reduction at 773 K with pure H2 the

180 M.A. Pereira da Silva et al. / Applied Catalysis A: General 190 (2000) 177–190
Fig. 1. X-ray diffraction patterns for calcined catalysts. (1) 1 Pt; (2) 1Pt2Mo; (3) 1Pt8Mo; (4) 1Pt14Mo; (5) 1Pt20Mo.
Fig. 2. X-ray diffraction patterns for catalysts reduced at 773 K and passivated. (1) 1 Pt; (2) 1Pt2Mo; (3) 1Pt8Mo; (4) 1Pt14Mo; (5)1Pt20Mo; (6)g-Al2O3.
platinum particles were agglomerated. However, af-ter passivation no Mo crystalline phase was observed,suggesting the presence of only amorphous Mo, in ac-cordance to Hoang-Van [20]. The formation of molyb-denum bronze systems, like HxMoO3 around 2θ = 25◦
was not identified under this condition, agreeing withprevious work on bronze formation on Pt/MoO3 at areduction temperature up to 433 K. Above this tem-perature the solids were also amorphous with respectto XRD analysis. Regalbuto et al. [6,7] observed for-

M.A. Pereira da Silva et al. / Applied Catalysis A: General 190 (2000) 177–190 181
Fig. 3. DRS-UV–Vis spectra for calcined Pt–Mo/g-Al2O3 cata-lysts. (N) 1Pt; (h) 1Pt2Mo; (j) 1Pt8Mo; (d) 1 Pt14Mo; (s)1Pt20Mo.
Fig. 4. DRS-UV–Vis spectra for calcined Mo/g-Al2O3 catalysts.(h) 2Mo; (j) 8Mo; (d) 14Mo; (s) 20Mo.
mation of bronze in the Pt–WO3/SiO2 system at re-duction temperature around 698 K.
The diffraction patterns of 1Pt and 1Pt2Mo dis-play only reflections ofg-Al2O3. These results revealthat the Pt particles are very small and molybdenumspecies are below the detection limit.
3.3. Diffuse reflectance spectroscopy (DRS)
DRS-UV–Vis spectra of the calcined catalysts arepresented in Figs. 3 and 4. They exhibited an intenseand large band at 317 nm. For the platinum-containingcatalysts, the d–d transition band around 325 nm is
Fig. 5. TPR profiles for Mo/g-Al2O3 catalysts. (A) 2Mo; (B) 8Mo;(C) 14Mo; (D) 20Mo.
related to a well dispersed platinum generated from asurface complex (PtOxCly)s, which according to Lietzet al. [21,22], occurs after reduction with H2 at 773 K.It is important to mention that the DRS results were ob-tained by using the corresponding monometallic sam-ples as reference, otherwise these bands overlap.
3.4. Temperature-programmed reduction
The reduction profiles of all catalysts are shown inFigs. 5 and 6. The 1Pt catalyst shows a peak at 531 Kand a small shoulder at 640 K. Lieske et al. [22] ob-served the peak between 480 and 560 K, which wasattributed to the presence of surface species contain-ing oxygen and chlorine, such as [Pt(OH)xCly]s and[PtOxCly]s. The molybdenum samples with less than14 wt.% Mo presented two distinct reduction peaks, at773 K and around 1223 K. The 14Mo sample exhibiteda third peak at 909 K, while the 20Mo an additionalpeak at 884 K was present. According to Thomas etal. [14] and Regalbuto and Ha [23], the peak around900 K corresponds to the reduction of MoO3 to MoO2.At higher temperatures Mo4+ is not completely re-duced.
The 1Pt2Mo and 1Pt8Mo catalysts show two re-duction peaks, the first one at 508 K and the secondaround 1223 K. The 1Pt14Mo exhibits a third reduc-tion peak around 840 K, while the 1Pt20Mo catalystfour peaks at 523, 731, 873 and 1223 K.

182 M.A. Pereira da Silva et al. / Applied Catalysis A: General 190 (2000) 177–190
Fig. 6. TPR profiles for Pt–Mo/g-Al2O3catalysts. (1) 1Pt; (2) 1Pt2Mo; (3) 1Pt8Mo; (4) 1Pt14Mo; (5) 1Pt20Mo.
Table 2Catalysts’ compositions and H2 uptake measured by TPR
Catalyst Experimental uptakes (mmol H2/g cat) Theoretical uptakes (mmol H2/g cat) Hydrogen contenta
1Pt 88.9 109.7 –1Pt2Mo 533.1 709.1 0.491Pt8Mo 1572.7 2611.5 0.651Pt14Mo 3341.0 4541.2 0.871Pt20Mo 4414.6 6376.5 0.50
a x values (in bronze HxMoO3) determined volumetrically assuming Pt4+ to Pt0 and that hydrogen bronzes are the sole product.
The experimental and theoretical H2 uptakes arepresented in Table 2, assuming that Pt4+ → Pt0 andMo6+ → Mo0. The excess of H2 was calculated fromthe consumption up to 573 K, discounting the theoret-ical reduction of Pt4+ to Pt0. This value correspondsto the H content of an intermediate HxMoO3 bronzecompound, as listed in Table 2. One must be cautiouswith this procedure, since part of the H2 can diffuseas spillover, and as mentioned before a fraction of Ptis already in the metallic state after calcination.
3.5. X-ray photoelectron spectroscopy (XPS)
The XPS results for Pt and Mo of surface on cal-cined and passivated samples and bulk atomic ratiosare presented in Table 3. Besides XPS binding ener-gies of the calcined catalysts (Table 4) the sampleswere also analyzed after reduction at 773 K, followedby passivation for comparison (Table 5). In particular,
the 1Pt14Mo catalyst was also reduced for 30 min at473 K with pure H2 , then passivated and analyzed byXPS.
Note that the surface Pt/Al ratios on calcined sam-ples are significantly higher than the bulk ratios,evidencing a noteworthy presence of platinum at thesurface of alumina after calcination. The XPS resultsfor the catalysts containing Mo indicate a bindingenergy, as shown in Table 4, which corresponds toPt0. XRD results also evidenced Pt0 after calcina-tion, although, the electrons emitted by X-ray (XPS)excitement would be able to reduce partially the plat-inum oxide at the surface [24]. On the other hand, thePt/Mo surface ratios are lower than the bulk valuesfor catalysts containing less than 14 wt.% Mo; abovethis content the behavior is the opposite. Platinumsignals were not detected on the 1Pt20Mo catalystafter calcination. The Mo/Al surface ratios are allgreater than the bulk ratios.

M.A. Pereira da Silva et al. / Applied Catalysis A: General 190 (2000) 177–190 183
Table 3XPS intensity ratios
Catalyst XPS atomic ratio Bulk atomic ratio
Pt/Al Pt/Mo Mo/Al Cl/Pt Pt/Al Pt/Mo Mo/Al Cl/Pt t/Al Pt/Mo Mo/AlCalcined Passivated
1Pt 0.0046 – – 4.35 0.0068 – – 2.63 0.0028 – –1Pt2Mo 0.0045 0.241 0.019 3.85 0.0039 0.220 0.017 3.45 0.0029 0.272 0.0111Pt8Mo 0.0037 0.045 0.082 – 0.0033 0.048 0.069 – 0.0029 0.059 0.0491Pt14Moa 0.0035 0.032 0.106 – 0.0042 0.035 0.120 – 0.0025 0.025 0.0981Pt14Mo 0.0035 0.032 0.106 – – – 0.130 – 0.0025 0.025 0.0981Pt20Mo – – 0.227 – – – 0.230 – 0.0031 0.020 0.155
aCatalyst reduced (473 K) passivated.
Table 4XPS parameters for calcined catalysts
Catalyst Binding energy
O 1s Al 2p Cl 2p Pt 4d5/2 Pt 4d3/2 Mo 3d5/2 Mo 3d3/2
1Pt 531.0 74.09 198.7 316.2 – – –1Pt2Mo 531.0 74.09 198.8 315.5 332.6 232.3 235.41Pt8Mo 531.2 74.30 – 315.7 333.8 232.4 235.61Pt14Mo 531.2 74.02 – 315.1 – 232.3 235.41Pt20Mo 531.1 74.26 – – – 232.3 235.5
Table 5XPS parameters for catalysts reduced (773 K) passivated
Catalyst Binding energy (eV)
O 1s Al 2p Cl 2p Pt 4d5/2 Pt 4d3/2 Mo 3d5/2 Mo 3d3/2
1Pt 531.1 74.06 198.7 314.6 330.8 – –1Pt2Mo 530.8 74.25 198.7 315.2 332.0 232.3 235.61Pt8Mo 530.6 74.39 – 314.5 330.8 231.9 235.21Pt14Mo (473 K) 531.1 74.26 – 314.5 – 232.1 235.31Pt14Mo 531.2 74.34 – – – 232.4 –1Pt20Mo 531.1 74.42 – – – 232.0 235.2
Similarly, the Pt/Al surface atomic ratios on reducedand passivated catalysts are relatively higher than thebulk ratios. It also shows that a significant amount ofPt is present at the surface of the alumina support af-ter reduction and passivation. It is noteworthy in thiscase that the concentration of Pt atoms at the surfaceare higher than on calcined form, and the presence ofMo above 8 wt.%, did not change significantly. Noticethat the Pt/Al ratios decrease with increasing Mo con-tent after calcination and reduction followed by pas-sivation, indicating that the Pt particles are partiallycovered by MoOx. This is evidenced by the sample
reduced at 473 K, which exhibits a Pt/Al ratio evenhigher than in the oxidic form. On the other hand, thesurface Pt/Mo atomic ratios are very similar on bothcases. The Mo/Al ratio was not significantly modifiedafter reduction and passivation suggesting that Mo ishighly dispersed over alumina.
XPS measurements of Cl/Pt values after calcination,followed by reduction and passivation are presentedin Table 3. The results show decreasing Cl/Pt ratioafter passivation or with increasing Mo content. Forhigher Mo loading traces of chlorine were observed.It seems that adding Mo this ratio decreases on the

184 M.A. Pereira da Silva et al. / Applied Catalysis A: General 190 (2000) 177–190
Table 6Measured irreversible chemisorption of H2 and CO at 303 K
Catalyst mmol/g irr. H2 H/Pt mmol/g irr. CO CO/H
1Pt 21.1 0.77 36.3 1.721Pt2Mo 13.0 0.49 20.9 1.611Pt8Mo 1.54 0.06 8.4 5.451Pt14Mo 0.67 0.04 29.0 43.281Pt20Mo 0.96 0.05 45.2 47.08
Table 7Irreversibly adsorbed H2 and CO at 303 K for 1Pt14Mo catalyst
Reduction H2 at 473 K mmolirr ./g Dispersion (%) Reduction H2 at 773 K mmolirr ./g
H2 uptake 3.58 14.0 H2 uptake 1.02O2/H2 titration 15.81 20.5 CO uptake 48.29CO uptake 10.10 19.7 O2/H2 titration 9.77
CO uptake 5.55
calcined samples. However, this behavior is differentin the passivated form, indicating that chlorine waspartially eliminated after reduction and passivation butwas not affected in the presence of low Mo content.
3.6. Hydrogen and CO chemisorptions
Table 6 shows the results of H2 and CO chemisorp-tions at 303 K. Dispersions were calculated assum-ing that 1Pt : 1H or 1Pt : 1CO ratio. The adsorption on1Pt2Mo decreased by 40% compared to the 1Pt cata-lyst. It decreased drastically for higher Mo contents.
The monometallic molybdenum catalyst did notpresent significant H2 uptake, in agreement with theliterature [25,26]. The hydrogen uptake diminishes byincreasing the Mo concentration of the bimetallic sys-tems, lowering the dispersion, which can be explainedby the deposition of molybdenum oxide species overplatinum particles (geometric effect) and/or the for-mation of an alloying mixed compound identified asPtMoOx [3].
The CO chemisorption results indicate that bothmolybdenum and platinum particles adsorb CO un-der these conditions. A blank experiment ong-Al2O3indicates negligible adsorption of CO and H2 for thesame conditions.
The CO/H ratios for the platinum catalysts suggestthe presence of both linear and bridge CO adsorptionforms. On the other hand, the catalysts with more than8 wt.% Mo adsorb significant amounts of CO on par-
tially reduced Mo species. However, in order to assertthe actual metallic surface sites it is also recommendedto use the titration O2/H2 method.
This titration was performed at two different re-duction temperatures, for example in one sample1Pt14Mo. First, it was reduced at 473 K followedby H2 uptake and then evacuated before exposing toa O2/N2 flow and followed by titration with H2 at473 K. CO uptake was obtained at 303 K after evacua-tion. The sample was now reduced at 773 K with pureH2, following the same procedure described above.The results are summarized in Table 7.
Notice that for reduction of 473 K the dispersionsbased on O2/H2 titration and CO chemisorption werequite similar. However, at 773 K the hydrogen uptakedecreased, while the CO uptake increased in the sameorder, which confirms partial coverage of Pt metallicparticles by reduced Mo oxide patches, justifying theenhanced consumption of CO. On the other hand, afterpassivation, the titrated O2 by H2 and the CO uptakedropped drastically and below the levels of the cor-responding values at 473 K, demonstrating that theseMoOx patches were only partially destroyed, with re-maining Pt particles blocked. This explains the reduc-tion of the active platinum sites, as shown in Table 7.
3.7. Infrared spectroscopy
The IR spectra of the reduced samples (473 and773 K) are shown at Fig. 7. At both reduction tem-
M.A. Pereira da Silva et al. / Applied Catalysis A: General 190 (2000) 177–190 185
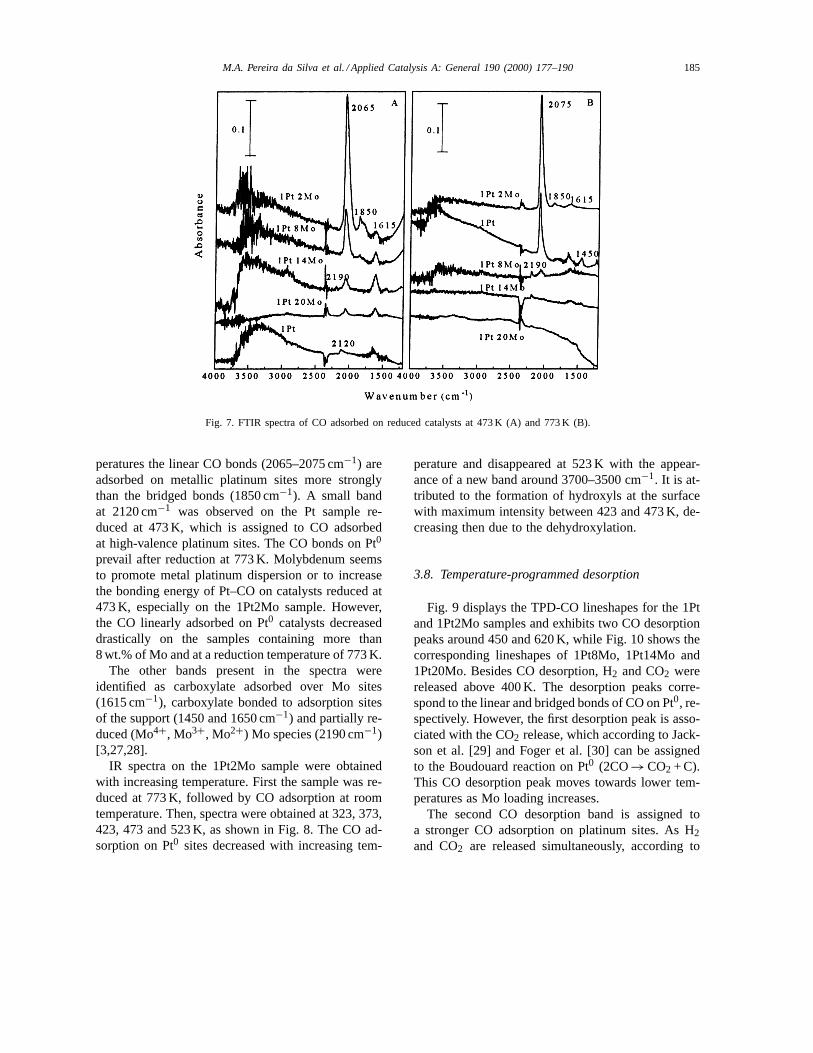
Fig. 7. FTIR spectra of CO adsorbed on reduced catalysts at 473 K (A) and 773 K (B).
peratures the linear CO bonds (2065–2075 cm−1) areadsorbed on metallic platinum sites more stronglythan the bridged bonds (1850 cm−1). A small bandat 2120 cm−1 was observed on the Pt sample re-duced at 473 K, which is assigned to CO adsorbedat high-valence platinum sites. The CO bonds on Pt0
prevail after reduction at 773 K. Molybdenum seemsto promote metal platinum dispersion or to increasethe bonding energy of Pt–CO on catalysts reduced at473 K, especially on the 1Pt2Mo sample. However,the CO linearly adsorbed on Pt0 catalysts decreaseddrastically on the samples containing more than8 wt.% of Mo and at a reduction temperature of 773 K.
The other bands present in the spectra wereidentified as carboxylate adsorbed over Mo sites(1615 cm−1), carboxylate bonded to adsorption sitesof the support (1450 and 1650 cm−1) and partially re-duced (Mo4+, Mo3+, Mo2+) Mo species (2190 cm−1)[3,27,28].
IR spectra on the 1Pt2Mo sample were obtainedwith increasing temperature. First the sample was re-duced at 773 K, followed by CO adsorption at roomtemperature. Then, spectra were obtained at 323, 373,423, 473 and 523 K, as shown in Fig. 8. The CO ad-sorption on Pt0 sites decreased with increasing tem-
perature and disappeared at 523 K with the appear-ance of a new band around 3700–3500 cm−1. It is at-tributed to the formation of hydroxyls at the surfacewith maximum intensity between 423 and 473 K, de-creasing then due to the dehydroxylation.
3.8. Temperature-programmed desorption
Fig. 9 displays the TPD-CO lineshapes for the 1Ptand 1Pt2Mo samples and exhibits two CO desorptionpeaks around 450 and 620 K, while Fig. 10 shows thecorresponding lineshapes of 1Pt8Mo, 1Pt14Mo and1Pt20Mo. Besides CO desorption, H2 and CO2 werereleased above 400 K. The desorption peaks corre-spond to the linear and bridged bonds of CO on Pt0, re-spectively. However, the first desorption peak is asso-ciated with the CO2 release, which according to Jack-son et al. [29] and Foger et al. [30] can be assignedto the Boudouard reaction on Pt0 (2CO→ CO2 + C).This CO desorption peak moves towards lower tem-peratures as Mo loading increases.
The second CO desorption band is assigned toa stronger CO adsorption on platinum sites. As H2and CO2 are released simultaneously, according to

186 M.A. Pereira da Silva et al. / Applied Catalysis A: General 190 (2000) 177–190
Fig. 8. FTIR spectra of CO adsorbed on 1Pt2Mo reduced at 773 K,after heating at different temperatures.
Jackson et al. [29] and Foger et al. [30] they cor-respond to the surface reaction between adsorbedcarbon monoxide and hydroxyls.
With increasing Mo loading, only one CO desorp-tion peak at a lower temperature was observed, denot-ing a weaker interaction between CO and the activesites (probably on Mo partially reduced). The CO2output was by far very small. However, a great H2output was observed as temperature increased withoutCO2 output.
4. Discussion
4.1. The molybdenum phase
The DRS results (Figs. 3 and 4) exhibit band shiftstowards higher wavelengths, with increasing Mo load-ing. The literature [16,31,32] indicate that Mo com-pounds, such as Na2MoO4·2H2O(Mo6+ in tetrahedralcoordination) and MoO3 (Mo6+ in octahedral coor-dination), present absorption bands at 290–330 nm,which are assigned to the octahedral Mo6+ phase,while the bands at 250–290 nm are attributed to thetetrahedral Mo6+ phase. These shifts are related to theincrease of the octahedral Mo6+ phase, which in turn
can be explained by the formation of polymeric MoOx
species responsible for a well dispersed surface sub-layer. The presence of a bulk MoO3 crystalline phasewas observed by XRD for 20Mo. These results agreedvery well with the Raman spectroscopy data of Vurr-man and Wachs [33], who suggested for MoO3/Al2O3asymmetric stretching of Mo–O–Mo bonds and, above20 wt.% MoO3, the presence of crystalline particles.
XPS results for the calcined catalysts show that thebinding energy of molybdenum is 232.3 eV for theMo 3d5/2 level, which denotes the presence of Mo6+species on all catalysts. These results are in goodagreement with the literature [5,19,34].
XRD results after calcination at 773 K are rathersignificant, indicating the presence of only an amor-phous molybdenum oxide phase but with increasingcontent around 20 wt.% Mo it exhibits bulk MoO3.However, after reduction at 773 K and passivation atroom temperature, bulk MoO3 disappears, accordingto Hoang-Van et al. [20], an amorphous phase.
Finally, Fig. 7 shows one large band around3700–3500 cm−1, which disappears with increasingMo loading, even after reduction at 473 and 773 K,evidencing that under this situation, a molybdenumoxide layer has been formed at the surface.
4.2. The platinum–molybdenum interaction
4.2.1. The bronze formationThe TPR profiles in Figs. 5 and 6 reveal that the
first peak at 533 K is assigned to the reduction of Pt4+to Pt0 [22] and partly by the formation of hydrogenbronze HxMoO3. The following peaks between 731and 873 K are attributed to the reduction of bulk Mo6+to Mo4+ and then to Moδ+ at 1223 K. Kim et al. [19]identified bronze formation on the Pt/MoO3, follow-ing the kinetics by TPR and ITR measurements fromthe initial state of reduction, identifying different in-termediate compositions as function of the tempera-ture of calcination.
The H content of the intermediate HxMoO3 bronzecompound was calculated from TPR data as shownin Table 2. The composition obtained following thisprocedure is not far from the value found by Jacksonet al [18] (x= 0.4–0.8), which is within experimentalerrors quite reasonable. With a different procedure,Kim et al. [19] obtained a higher value (x= 1.15) for

M.A. Pereira da Silva et al. / Applied Catalysis A: General 190 (2000) 177–190 187
Fig. 9. Desorption profiles, after CO adsorption on 1Pt (A) and 1Pt2Mo (B) catalysts reduced at 773 K.
Fig. 10. Desorption profiles, after CO adsorption on 1Pt8Mo (A), 1Pt14Mo (B) and 1Pt20Mo (C) catalysts reduced at 773 K.
the Pt/MoO3 catalyst calcined at 773 K after reductionat 448 K.
4.2.2. The effect of chlorineResults of 1Pt revealed the presence of residual
chlorine. The binding energy suggests Pt4+ with chlo-
rine bindings, which confirms the presence of surfacecomplexes such as [Pt(OH)xCly]s and [PtOxCly]s, al-ready shown by TPR. These complexes promote gooddispersion of platinum particles after reduction [22].
Indeed, the XRD (Fig. 1) and XPS (Table 4) resultsexhibited Pt0 particles just after calcination, which can

188 M.A. Pereira da Silva et al. / Applied Catalysis A: General 190 (2000) 177–190
be explained, according to Jackson et al. [18], as step-wise loss of HCl, H2O and O2 from the H2PtCl6·6H2Odecomposition with increasing Mo loading.
The XPS results after reduction and passivation ofthe 1Pt and 1Pt2Mo samples also revealed the pres-ence of residual chlorine, which also indicate sur-face species already observed on the calcined samples[21,22]. Table 3 shows clearly the decreasing Cl/Ptratio after reduction. One explanation is that chlorinemigrates easily on alumina towards neighboring plat-inum particles during the reduction favoring the for-mation of platinum complexes, redispersing Pt parti-cles with simultaneous reduction of residual chlorineon alumina. On the other hand, the presence of molyb-denum even at low content prevents this migration,avoiding the formation of surface complexes, whichretains chlorine on alumina (Table 3). With increas-ing Mo content chlorine decreased abruptly, which ex-plains the lower dispersion of Pt.
4.2.3. The molybdenum and platinum structuresThe binding energy around 232.4 eV for Mo 3d5/2
indicates the presence of Mo6+ species on all reducedand passivated samples. DeVries et al. [5] observedeasier reduction of Mo6+ to Mo4+ only for higher Ptcontents.
The Pt binding energies are shifted towards lowervalues in the reduced form, revealing the presence ofmetallic platinum. The difference1(Pt 4d5/2) = 1.6 eVon Pt/g-Al2O3 decreases with addition of Mo, indi-cating easier reduction of Pt, as observed compar-ing the binding energies of 1Pt14Mo in the reduced(473 K) and calcined form. In addition, XPS resultsalso showed decreasing Pt/Al ratio after calcination byincreasing the Mo loading, which suggest the decora-tion model, in accordance to Regalbuto et al [6]. Thisdecoration phenomena was also demonstrated throughEXAFS, according to Choi and Lee [35] due to ahighly mobile (MoO3) component added to a stablestructure during calcination or reduction.
4.2.4. The hydrogen and carbon monoxideadsorption effects
The hydrogen adsorption capacity of catalysts de-creased with increasing Mo content in the bimetallicsystems, lowering the dispersion, which also explainsa blocking effect of platinum particles (geometric
effect) and/or formation of an alloying mixed com-pound [3]. Since the CO chemisorbed on both molyb-denum and platinum particles depend on the reductiontemperature, the dispersions based on the H2 and COchemisorptions and the O2/H2 titration were quitesimilar for the reduction temperature of 473 K. How-ever, the hydrogen uptake decreased after reduction at773 K, while the CO uptake increased by a factor of5, what can be attributed to the adsorption on Pt andMoOx species. Nevertheless, the CO uptake decreaseddrastically after titration, reaching levels, which arecomparable or below those for 473 K. Comparingthese values it seems that after reduction at 773 Kfollowed by mild oxidation, the MoOx species weredestroyed and the surface active sites only partiallyrestored in the presence of oxygen, in agreement withthe decoration model [6,25].
The IR spectra of the reduced samples (473 and773 K) exhibit linear CO bonds (2065–2075 cm−1)and bridged bonds (1850 cm−1) on metallic platinumsites [3]. The band at 2120 cm−1 indicates CO ad-sorption on high-valence platinum sites. The linearCO adsorption band for the Pt catalysts containingmore than 8 wt.% of Mo and reduced at 773 K, de-creased drastically suggesting suppression of Pt parti-cles via interaction with reduced MoOx species. Thisinterface may favor the formation of new species atthe surface by an energy-favorable environment, sup-porting the decoration phenomenon already referred toabove.
Fig. 8 shows the IR spectra of CO desorption at 323,373, 423, 473 and 523 K on 1Pt2Mo. The amount ofCO on Pt0 sites decreased with increasing temperature.Hydroxyls were revealed around 3700–3500 cm−1,with maximum band intensity between 423 and 473 K.This may explain the interaction of a backspillovereffect of hydrogen with oxygen atoms of the lattice[36].
The TPD of CO lineshapes show relatively highintensities of CO2and H2 release, which according toJackson et al. [29] and Foger et al. [30] are caused bythe reaction between CO and neighboring hydroxylsof the support. However, the presence of molybdenumaffected the dehydroxylation process. The titrationresults support the partial restoring of the chemisorp-tion capacity. The release of CO2 during dehydrox-ylation is promoted by CO molecules, according tothe following reactions (Eq. (1) [29] and Eq. (2))

M.A. Pereira da Silva et al. / Applied Catalysis A: General 190 (2000) 177–190 189
CO+ OH ⇒ CO2 + H2 (1)
CO2 + MoOx ⇒ CO+ MoO3 (2)
The second reaction may occur at the Pt/MoOx inter-face, and is followed by the reaction between CO andhydroxyls. These hydroxyls are generated by the reac-tion between O2− with hydrogen backspillover at hightemperatures. With increasing Mo loading, only oneCO desorption peak at a lower temperature was ob-served, denoting a weaker interaction between CO andthe active sites (probably on Mo partially reduced).
In summary, these results suggest the existence oftwo surface phenomena. The first one is that the sur-face is completely covered by Mo species, since theBoudouard reaction occurs over Pt0 and the reactionof CO with surface hydroxyls did not occur. Thus, itreinforces the hypothesis of encapsulation process andexplains the H2 chemisorption and IR spectroscopicresults.
The second phenomenon suggests a H2 storagemechanism, since from FTIR results, H2 just desorbsat high temperatures and seems to be somehow storedon cooling, even after careful purge with inert gas for30 min at 773 K, which followed the reduction step.TPD results of higher Mo contents showed that CO2output was by far very small. However, a great H2output was observed as temperature increased withoutCO2 output. The H2 storage is probably generatedby the formation of HxMoO3 species by H2spillover[19,20] as discussed above. The Pt particles overMoOx sublayers are the preferred regions and sourcesof hydrogen spillover, which promote the formationof an HxMoO3 bronze compound.
5. Conclusions
A monolayer of MoOx species over alumina wasobtained with Mo content around 14 wt.%. For higherMo loading and after calcination the XRD results re-vealed predominantly amorphous Mo phase besidesMoO3 crystallites, prevailing the Mo6+ in octahedralcoordination, as well as Pt0. TPR results are consistentwith the existence of an interaction between platinumspecies and molybdenum oxide and the formation ofhydrogen bronze molybdenum compounds.
XPS results indicate the presence of Pt–Cl, whichis attributed to surface species, such as [Pt(OH)xCly]s
and [PtOxCly]s on the catalysts 1Pt and 1Pt2Mo. Theyalso show that the interaction of platinum precursorwith alumina is stronger than with molybdenum ox-ide. These results evidence the existence of Pt0 andmolybdenum oxide interaction.
The TPR, TPD and FTIR results show the presencePt–MoOx species, associated with the generation of abronze and the formation of new active sites due to theinteraction of Pt with molybdenum surface species,depending of the reduction temperature. For low Mocontent (1Pt and 1Pt2Mo) there is a H2 spillover, sincesimultaneous releasing of H2 and CO2 was observed.FTIR and chemisorption results confirm the decora-tion model of Pt encapsulation by partially reducedMo species, as well as the hydrogen storage and back-spillover.
Acknowledgements
Mônica Antunes Pereira da Silva acknowledges theCNPq for financial support. We acknowledge RuthLeibsohn Martins and Carlos André Peres for the help-ful discussion of FTIR and XPS data, respectively.
References
[1] I. Halasz, A. Brenner, M. Shelef, K.Y. Simon Ng., Appl.Catal. A 82 (1992) 51–63.
[2] I. Halasz, A. Brenner, M. Shelef, Appl. Catal. B 2 (1993)131–146.
[3] H.S. Gandhi, H.C. Rao, H.K. Stepirn, Catalysis under transi-tion conditions, ACS Symp. Ser. No. 178 (1982) 143–162.
[4] T. Liu, U.Y.Y. Iwasawa, Y. Matsui., J. Catal. 135 (1992) 367–385.
[5] J.E. DeVries, H.C. Yao, R.J. Baird, H.S. Gandhi, J. Catal. 84(1983) 8–14.
[6] J.R. Regalbuto, T.H. Fleisch, E.E. Wolf, J. Catal. 107 (1987)114–128.
[7] J.R. Regalbuto, C.W. Allen, E.E. Wolf, J. Catal. 108 (1987)304–322.
[8] M.A.S.Baldanza, G.S. Amorim, M.A.P. Silva, M. Schmal, 8Seminário Brasileiro de Catálise, Actas vol. 1, Nova Friburgo,1995, pp. 212–219.
[9] F.B. Noronha, M. Primet, R. Frety, M. Schmal, Appl. Catal.78 (1991) 125–139.
[10] D.A.G. Aranda, M. Schmal, J. Catal. 171 (1997) 398–405.[11] J. Leyer, M.I. Zaki, H. Knozinger, J. Phys. Chem. 90 (1986)
4775–4780.[12] H.C. Liu, S.W. Weller, J. Catal. 66 (1980) 65–72.[13] A. Castellan, J.C.J. Bart, A. Vaghi, N. Giordano, J. Catal. 42
(1976) 162–172.

190 M.A. Pereira da Silva et al. / Applied Catalysis A: General 190 (2000) 177–190
[14] R. Thomas, E.M. Van Oers, H.J. de Beer, J.A. Mouljin, J.Catal. 84 (1983) 275–287.
[15] Powder Diffraction File PDF-2 Data Base, NIST, 1994.[16] N. Giordano, J.C.J. Bart, A. Vaghi, A. Castellan, G.
Martinotti, J. Catal. 36 (1975) 81–92.[17] S. Imamura, H. Sasaki, M. Shono, H. Kanai, J. Catal. 177
(1998) 72–81.[18] S.D. Jackson, J. Willis, G.D. McLellan, G. Webb, M.B.T.
Keegan, R.B. Moyes, S. Simpson, P.B. Wells, R. Whyman,J. Catal. 139 (1993) 191–206.
[19] J.G. Kim, J.Z. Shyu, J.R. Regalbuto, J. Catal. 139 (1993)153–174.
[20] C. Hoang-Van, O. Zeggaoui, Appl. Catal. A 130 (1995) 89–103.
[21] G. Lietz, H. Lieske, H. Spindler, W. Hanke, J. Volter, J. Catal.81 (1983) 17–25.
[22] H. Lieske, G. Lietz, H. Spindler, J. Volter, J. Catal. 81 (1983)8–16.
[23] J.R. Regalbuto, J-W. Ha, Catal. Lett. 29 (1994) 189–207.[24] R.R. Araujo, L.G. Appel., M. Schmal, Anais do Simpósio
Iberoamericano de Catalisis, vol. III, Setembro, Cordoba,Argentina, 1996, pp. 1549–1554.
[25] G. Leclercq, A. El Gharbi, L. Gengembre, T. Romero, L.Leclercq, S. Pietrzyk, J. Catal. 148 (1994) 550–561.
[26] T.M. Tri, J.P. Candy, P. Gallezot, J. Massardier, M. Primet,J.C. Védrine, B. Imelik, J. Catal. 79 (1983) 396–409.
[27] J.B. Peri, J. Phys. Chem. 86 (1982) 1615–1622.[28] J.L. Brito, B. Griffe, Catal. Lett. 50 (1998) 169–172.[29] S.D. Jackson, B.M. Glanville, J. Willis, G.D. McLelllan, G.
Webb, R.B. Moyes, S. Simpson, P.B. Wells, R. Whyman, J.Catal. 139 (1993) 207–220.
[30] K. Foger, J.R. Anderson, Appl. Surf. Sci. 2 (1979) 335–351.[31] P. Gajardo, P. Grange, B. Delmon, J. Catal. 63 (1980) 201–
216.[32] H. Jeziorowski, H. Knoozinger, J. Phys. Chem. 83(9) (1979)
1166–1173.[33] M.A. Vuurman, I.E. Wachs, J. Phys. Chem. 96 (1992) 5008–
5016.[34] M. Yamada, J. Yasamuru, M. Houlla, D.M. Hercules, J. Phys.
Chem. 95 (1991) 7037–7042.[35] S.H. Choi, J.S. Lee, J. Catal. 167 (1997) 364–371.[36] D.M. Haaland, F.L. Williams, J. Catal. 76 (1982) 450–465.
Related Documents