RESEARCH ARTICLE Stereotypes Possess Heterogeneous Directionality: A Theoretical and Empirical Exploration of Stereotype Structure and Content William T. L. Cox*, Patricia G. Devine Department of Psychology, University of Wisconsin—Madison, Madison, Wisconsin, United States of America * [email protected] Abstract We advance a theory-driven approach to stereotype structure, informed by connectionist theories of cognition. Whereas traditional models define or tacitly assume that stereotypes possess inherently Group ! Attribute activation directionality (e.g., Black activates crimi- nal), our model predicts heterogeneous stereotype directionality. Alongside the classically studied Group ! Attribute stereotypes, some stereotypes should be bidirectional (i.e., Group ⇄ Attribute) and others should have Attribute ! Group unidirectionality (e.g., fash- ionable activates gay). We tested this prediction in several large-scale studies with human participants (N Combined = 4,817), assessing stereotypic inferences among various groups and attributes. Supporting predictions, we found heterogeneous directionality both among the stereotype links related to a given social group and also between the links of different social groups. These efforts yield rich datasets that map the networks of stereotype links re- lated to several social groups. We make these datasets publicly available, enabling other researchers to explore a number of questions related to stereotypes and stereotyping. Ste- reotype directionality is an understudied feature of stereotypes and stereotyping with wide- spread implications for the development, measurement, maintenance, expression, and change of stereotypes, stereotyping, prejudice, and discrimination. Introduction Research on stereotypes and stereotyping explores what comes to mind when a given social concept is activated (e.g., Black brings to mind criminal), and when, how, and why one social concept (e.g., Black) brings to mind another (e.g., criminal). Understanding the content, pro- cess, and structure of cognitions related to social groups is important because these cognitions form the building blocks of prejudice, discrimination, and oppression [1–6]. The interpretation of every finding in the stereotyping and prejudice literatures depends at least in part upon the researcher’s underlying theoretical model of stereotypes and stereotyping. Different models PLOS ONE | DOI:10.1371/journal.pone.0122292 March 26, 2015 1 / 27 a11111 OPEN ACCESS Citation: Cox WTL, Devine PG (2015) Stereotypes Possess Heterogeneous Directionality: A Theoretical and Empirical Exploration of Stereotype Structure and Content. PLoS ONE 10(3): e0122292. doi:10.1371/journal.pone.0122292 Academic Editor: Sam Gilbert, University College London, UNITED KINGDOM Received: October 3, 2014 Accepted: February 10, 2015 Published: March 26, 2015 Copyright: © 2015 Cox, Devine. This is an open access article distributed under the terms of the Creative Commons Attribution License, which permits unrestricted use, distribution, and reproduction in any medium, provided the original author and source are credited. Data Availability Statement: All relevant data are within the paper and its Supporting Information files. Funding: Over the course of this project, WTLC and PGD were supported by two grants from the National Institutes of Health: Grant R01 GM111002 and Grant R01 GM088477 (www.nih.gov). The funding agency had no role in study design, data collection and analysis, decision to publish, or preparation of the manuscript. Competing Interests: The authors have declared that no competing interests exist.

Welcome message from author
This document is posted to help you gain knowledge. Please leave a comment to let me know what you think about it! Share it to your friends and learn new things together.
Transcript
RESEARCH ARTICLE
Stereotypes Possess HeterogeneousDirectionality: A Theoretical and EmpiricalExploration of Stereotype Structure andContentWilliam T. L. Cox*, Patricia G. Devine
Department of Psychology, University of Wisconsin—Madison, Madison, Wisconsin, United States ofAmerica
AbstractWe advance a theory-driven approach to stereotype structure, informed by connectionisttheories of cognition. Whereas traditional models define or tacitly assume that stereotypespossess inherently Group! Attribute activation directionality (e.g., Black activates crimi-nal), our model predicts heterogeneous stereotype directionality. Alongside the classicallystudied Group! Attribute stereotypes, some stereotypes should be bidirectional (i.e.,Group⇄ Attribute) and others should have Attribute!Group unidirectionality (e.g., fash-ionable activates gay). We tested this prediction in several large-scale studies with humanparticipants (NCombined = 4,817), assessing stereotypic inferences among various groupsand attributes. Supporting predictions, we found heterogeneous directionality both amongthe stereotype links related to a given social group and also between the links of differentsocial groups. These efforts yield rich datasets that map the networks of stereotype links re-lated to several social groups. We make these datasets publicly available, enabling otherresearchers to explore a number of questions related to stereotypes and stereotyping. Ste-reotype directionality is an understudied feature of stereotypes and stereotyping with wide-spread implications for the development, measurement, maintenance, expression, andchange of stereotypes, stereotyping, prejudice, and discrimination.
IntroductionResearch on stereotypes and stereotyping explores what comes to mind when a given socialconcept is activated (e.g., Black brings to mind criminal), and when, how, and why one socialconcept (e.g., Black) brings to mind another (e.g., criminal). Understanding the content, pro-cess, and structure of cognitions related to social groups is important because these cognitionsform the building blocks of prejudice, discrimination, and oppression [1–6]. The interpretationof every finding in the stereotyping and prejudice literatures depends at least in part upon theresearcher’s underlying theoretical model of stereotypes and stereotyping. Different models
PLOSONE | DOI:10.1371/journal.pone.0122292 March 26, 2015 1 / 27
a11111
OPEN ACCESS
Citation: Cox WTL, Devine PG (2015) StereotypesPossess Heterogeneous Directionality: A Theoreticaland Empirical Exploration of Stereotype Structureand Content. PLoS ONE 10(3): e0122292.doi:10.1371/journal.pone.0122292
Academic Editor: Sam Gilbert, University CollegeLondon, UNITED KINGDOM
Received: October 3, 2014
Accepted: February 10, 2015
Published: March 26, 2015
Copyright: © 2015 Cox, Devine. This is an openaccess article distributed under the terms of theCreative Commons Attribution License, which permitsunrestricted use, distribution, and reproduction in anymedium, provided the original author and source arecredited.
Data Availability Statement: All relevant data arewithin the paper and its Supporting Information files.
Funding: Over the course of this project, WTLC andPGD were supported by two grants from the NationalInstitutes of Health: Grant R01 GM111002 and GrantR01 GM088477 (www.nih.gov). The funding agencyhad no role in study design, data collection andanalysis, decision to publish, or preparation of themanuscript.
Competing Interests: The authors have declaredthat no competing interests exist.
make different assumptions about, for instance, how stereotypes are structured in memory,how they are activated, and what is involved in changing them [7]. Clear scientific progress to-ward understanding stereotyping and prejudice, therefore, requires a clear understanding ofthe cognitive architecture that underlies stereotypes. As Hilton and von Hippel lamented, how-ever, many researchers’models and definitions of stereotypes and stereotyping are imprecise—or worse, unspecified—resulting in considerable ambiguity about the nature of stereotypes andstereotyping [7].
Because stereotypes are cognitive knowledge structures, many stereotype models have builton developments in cognitive psychology (see [7–8] for reviews). Social psychologists have ad-vanced models that conceptualize stereotypes as, for instance, prototypes, collections of exem-plars, or organizational schemas, each approach paralleling similar models of cognition putforth by cognitive psychologists [7]. Within the last 30 years, connectionist theories of cogni-tion, which are rooted in and constrained by assumptions about how the brain works, haverisen to prominence in cognitive psychology [9–13]. Though there are a few exceptions (e.g.,[14–18]), however, connectionism has gained little traction in social psychology generally or inthe study of stereotypes more specifically [9–10]. In cognitive psychology, connectionist ap-proaches are compelling to many because their conceptualization of cognition is closely tied tobrain biology and because they have provided a number of fruitful insights and advances in thecognitive literature [11–13]. We contend that connectionism can be similarly useful to thestudy of stereotypes.
In the present article, we use connectionism as a theoretical foundation to develop a frame-work for understanding stereotypes and stereotyping. This framework leads us to some specificpredictions about stereotype structure that do not follow as readily from traditional models. Totest these predictions, we explore and describe the structure of a variety of stereotypes relatedto different social groups (e.g., Black men, gay men) in several large-scale studies with humanparticipants. We employ traditional methods for assessing stereotype content and structure,but use them in a new way that reveals features of stereotype structure that have largely beenunexplored in prior work. These efforts yield a set of data matrices that map the groups’ stereo-type networks, which are valuable resources that can be used by other researchers to explore anumber of questions related to stereotypes and stereotyping. The present work provides a richtheoretical and empirical foundation from which to generate novel predictions and insightsconcerning core issues in the stereotype literature, including stereotype formation, activation,measurement, and change, and how stereotypes relate to prejudice and discrimination.
A Connectionist-Inspired Approach to Stereotype StructureAlthough connectionism is often perceived as a set of methods (e.g., computational modeling),it is more precisely a theoretical framework for how knowledge is learned, represented, and re-trieved [9–13, 19]. The central assumption of connectionist approaches is that cognition arisesfrom brain activity and thus should operate in a way that reflects the brain’s mechanics. Brainsare composed of vast networks of connected neurons, and it is the patterns of activation acrossthese neural connections that store knowledge and give rise to cognitive processes. Neurons inthe brain display fractal geometric properties: the features that characterize neural patterns atone scale (e.g., the relationship between two individual neurons) can also be seen in neural pat-terns at other scales (e.g., the relationship between two clusters of neurons) [20, 21]. Because ofthis fractal scaling, the basic mechanics of neurons and synapses are theorized to scale upwardsto cognitive knowledge structures. In other words, knowledge structures should behave in waysthat reflect the mechanical principles of their constituent neural strata. The core implication ofthis approach is that any theory of cognition should both reflect the principles of basic neural
Heterogeneous Stereotype Directionality
PLOS ONE | DOI:10.1371/journal.pone.0122292 March 26, 2015 2 / 27
anatomy and be constrained by those principles, with cognitions represented as and behavinglike distributed networks of undifferentiated, neuron-like units (for more comprehensive re-view, see [9–13, 19]).
From this perspective, then, what is a stereotype, and how would it differ from traditionalconceptualizations? Traditional models conceptualize the problem of stereotyping as linkingattributes (e.g., traits, characteristics) with social groups in memory. According to this ap-proach, then, a stereotype is a composite cognitive representation of a social group category(e.g., Black men) and the attributes (e.g., criminal, poor, athletic) commonly associated withmembers of that category [8]. When the social group category is activated, activation of the at-tributes follows and it is this pattern of activation that is considered to be stereotyping. In suchmodels, the social group takes on prominence and the attributes are subordinated in that theybecome relevant in so far as the social group category is activated.
Connectionist frameworks, in contrast, largely discard the notion of different types of cogni-tive units, especially the notion of categories [12]. What are referred to as “groups” versus “at-tributes” in traditional models, we argue, are distinguished by their social importance and theinterests of the researcher. Groups and attributes are social concepts and do not reflect distincttypes of cognitive units [2]. Groups, attributes, and their relationships are all stored as connec-tion weights among undifferentiated units. As such, the extent to which a concept label refersto a socially important group is only one feature that may characterize or influence cognitivestructure; it is not a feature that makes social group concepts a special type of cognitive unit. Inthe present work, therefore, we use the term “group”merely to specify the focal group of inter-est, and the term “attribute” refers to any and all other concepts (e.g., traits, behaviors, features,roles) that may be linked to that group of interest.
Removing what, from our perspective, is an artificial cognitive unit distinction sets ourmodel apart from both classic models [22–24] and some modern models [14, 25, 26] that givespecial status to “groups.” This seemingly small adjustment has major implications for a num-ber of key topics [2], and it yields our definition of a stereotype. A stereotype is a learned associ-ation, or link, between two social concepts (e.g., Black, criminal) that are not defining featuresfor one another (for greater detail, see [2]).
Note that placing “groups” and “attributes” on equal footing requires defining a stereotypeas an association between only two concepts (e.g., the Black–criminal stereotype is treated aspotentially distinct from the Black–poor stereotype). To assess stereotype structure, then, wemust independently assess each component stereotype link associated with our group of inter-est. At first glance, this seems an easy feat—since the earliest stereotyping work, researchershave assessed the probability that certain attributes are brought to mind by a given social groupconcept [22]. Treating groups and attributes as the same type of cognitive unit, however, re-quires an adjustment to this approach. We must assess not only the probability that the groupbrings to mind the attribute (Group! Attribute), as in traditional work, but also the probabili-ty that the attribute brings to mind the group (Attribute! Group). In some cases, these proba-bilities may be equivalent (e.g., A elicits B just as often as B elicits A), yielding a bidirectionalstereotype (A⇄ B). In other cases, however, these probabilities may differ, yielding a stereotypethat is more unidirectional, favoring in one direction (A! B) or the other (B! A). These dif-ferent possibilities illustrate heterogeneous stereotype directionality. We argue that directionali-ty is an understudied dimension of stereotype structure that is fundamental to understandingstereotypes and stereotyping.
Formalizing the reasoning above, the structure of any Group—Attribute stereotype musthave directionality that falls somewhere on a spectrum from positive unidirectionality (Group! Attribute) to bidirectionality (Group⇄ Attribute or Attribute⇄ Group) to negative unidir-ectionality (Attribute! Group), as displayed in Fig. 1. This formulation of heterogeneous
Heterogeneous Stereotype Directionality
PLOS ONE | DOI:10.1371/journal.pone.0122292 March 26, 2015 3 / 27
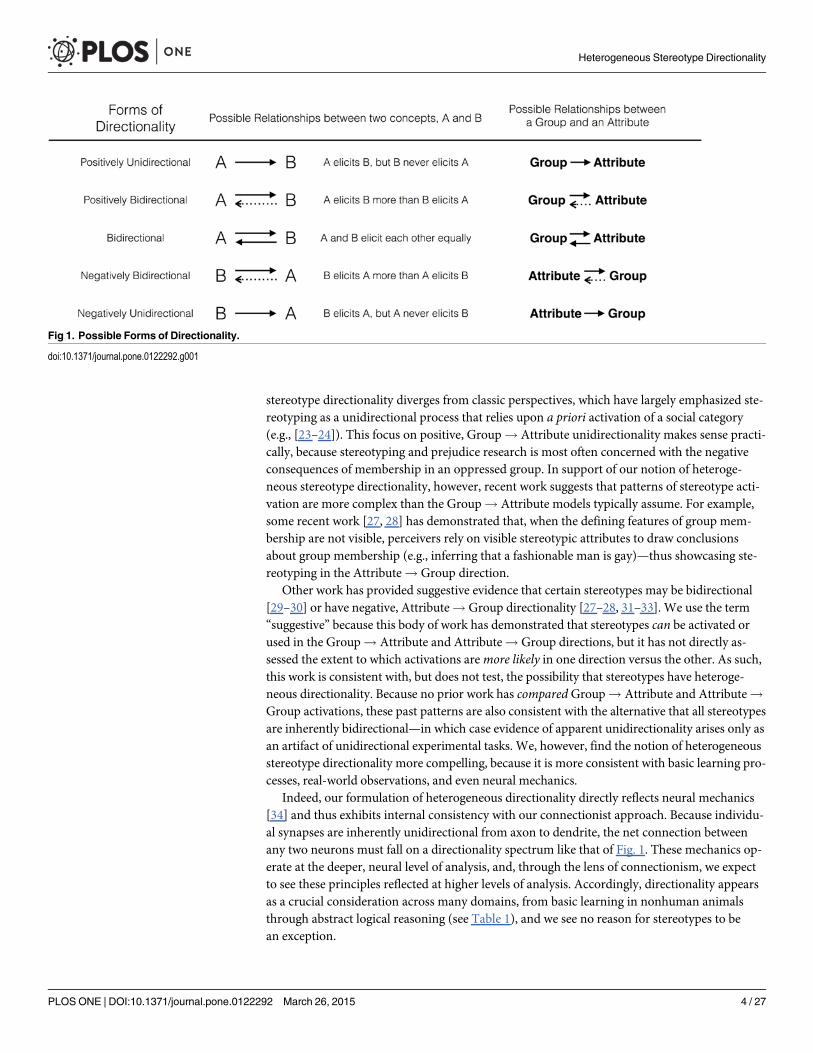
stereotype directionality diverges from classic perspectives, which have largely emphasized ste-reotyping as a unidirectional process that relies upon a priori activation of a social category(e.g., [23–24]). This focus on positive, Group! Attribute unidirectionality makes sense practi-cally, because stereotyping and prejudice research is most often concerned with the negativeconsequences of membership in an oppressed group. In support of our notion of heteroge-neous stereotype directionality, however, recent work suggests that patterns of stereotype acti-vation are more complex than the Group! Attribute models typically assume. For example,some recent work [27, 28] has demonstrated that, when the defining features of group mem-bership are not visible, perceivers rely on visible stereotypic attributes to draw conclusionsabout group membership (e.g., inferring that a fashionable man is gay)—thus showcasing ste-reotyping in the Attribute! Group direction.
Other work has provided suggestive evidence that certain stereotypes may be bidirectional[29–30] or have negative, Attribute! Group directionality [27–28, 31–33]. We use the term“suggestive” because this body of work has demonstrated that stereotypes can be activated orused in the Group! Attribute and Attribute! Group directions, but it has not directly as-sessed the extent to which activations aremore likely in one direction versus the other. As such,this work is consistent with, but does not test, the possibility that stereotypes have heteroge-neous directionality. Because no prior work has compared Group! Attribute and Attribute!Group activations, these past patterns are also consistent with the alternative that all stereotypesare inherently bidirectional—in which case evidence of apparent unidirectionality arises only asan artifact of unidirectional experimental tasks. We, however, find the notion of heterogeneousstereotype directionality more compelling, because it is more consistent with basic learning pro-cesses, real-world observations, and even neural mechanics.
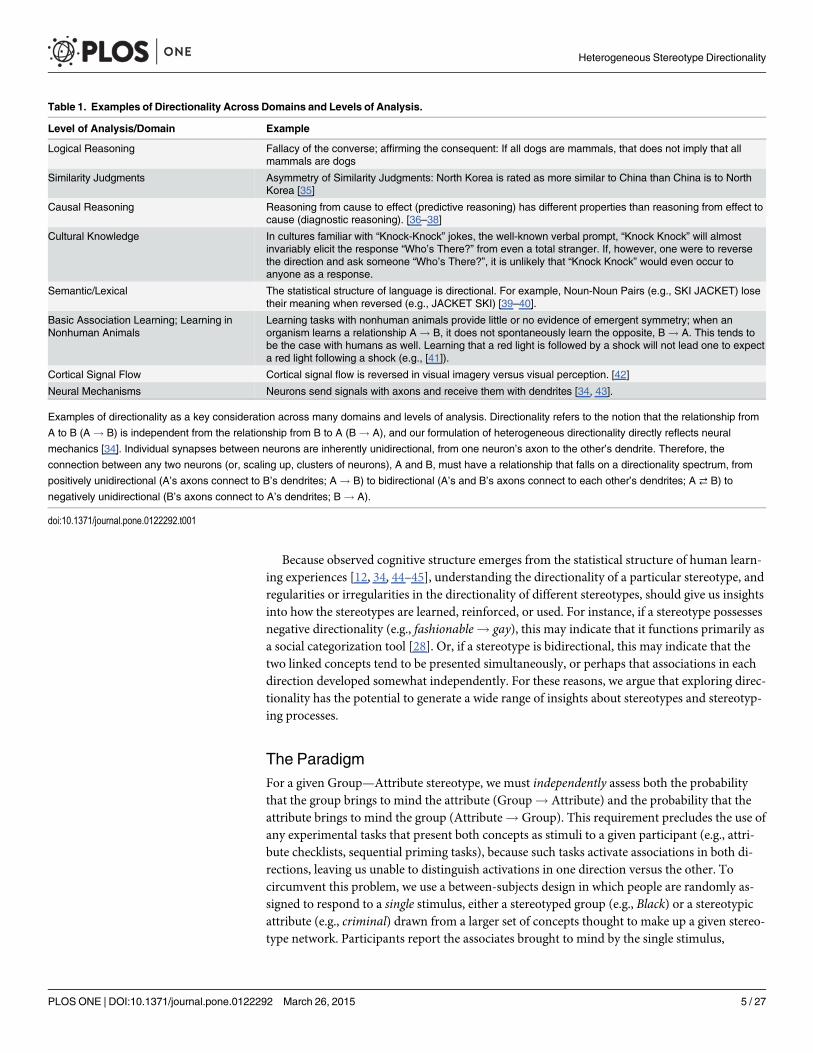
Indeed, our formulation of heterogeneous directionality directly reflects neural mechanics[34] and thus exhibits internal consistency with our connectionist approach. Because individu-al synapses are inherently unidirectional from axon to dendrite, the net connection betweenany two neurons must fall on a directionality spectrum like that of Fig. 1. These mechanics op-erate at the deeper, neural level of analysis, and, through the lens of connectionism, we expectto see these principles reflected at higher levels of analysis. Accordingly, directionality appearsas a crucial consideration across many domains, from basic learning in nonhuman animalsthrough abstract logical reasoning (see Table 1), and we see no reason for stereotypes to bean exception.
Fig 1. Possible Forms of Directionality.
doi:10.1371/journal.pone.0122292.g001
Heterogeneous Stereotype Directionality
PLOS ONE | DOI:10.1371/journal.pone.0122292 March 26, 2015 4 / 27
Because observed cognitive structure emerges from the statistical structure of human learn-ing experiences [12, 34, 44–45], understanding the directionality of a particular stereotype, andregularities or irregularities in the directionality of different stereotypes, should give us insightsinto how the stereotypes are learned, reinforced, or used. For instance, if a stereotype possessesnegative directionality (e.g., fashionable! gay), this may indicate that it functions primarily asa social categorization tool [28]. Or, if a stereotype is bidirectional, this may indicate that thetwo linked concepts tend to be presented simultaneously, or perhaps that associations in eachdirection developed somewhat independently. For these reasons, we argue that exploring direc-tionality has the potential to generate a wide range of insights about stereotypes and stereotyp-ing processes.
The ParadigmFor a given Group—Attribute stereotype, we must independently assess both the probabilitythat the group brings to mind the attribute (Group! Attribute) and the probability that theattribute brings to mind the group (Attribute! Group). This requirement precludes the use ofany experimental tasks that present both concepts as stimuli to a given participant (e.g., attri-bute checklists, sequential priming tasks), because such tasks activate associations in both di-rections, leaving us unable to distinguish activations in one direction versus the other. Tocircumvent this problem, we use a between-subjects design in which people are randomly as-signed to respond to a single stimulus, either a stereotyped group (e.g., Black) or a stereotypicattribute (e.g., criminal) drawn from a larger set of concepts thought to make up a given stereo-type network. Participants report the associates brought to mind by the single stimulus,
Table 1. Examples of Directionality Across Domains and Levels of Analysis.
Level of Analysis/Domain Example
Logical Reasoning Fallacy of the converse; affirming the consequent: If all dogs are mammals, that does not imply that allmammals are dogs
Similarity Judgments Asymmetry of Similarity Judgments: North Korea is rated as more similar to China than China is to NorthKorea [35]
Causal Reasoning Reasoning from cause to effect (predictive reasoning) has different properties than reasoning from effect tocause (diagnostic reasoning). [36–38]
Cultural Knowledge In cultures familiar with “Knock-Knock” jokes, the well-known verbal prompt, “Knock Knock” will almostinvariably elicit the response “Who’s There?” from even a total stranger. If, however, one were to reversethe direction and ask someone “Who’s There?”, it is unlikely that “Knock Knock” would even occur toanyone as a response.
Semantic/Lexical The statistical structure of language is directional. For example, Noun-Noun Pairs (e.g., SKI JACKET) losetheir meaning when reversed (e.g., JACKET SKI) [39–40].
Basic Association Learning; Learning inNonhuman Animals
Learning tasks with nonhuman animals provide little or no evidence of emergent symmetry; when anorganism learns a relationship A! B, it does not spontaneously learn the opposite, B! A. This tends tobe the case with humans as well. Learning that a red light is followed by a shock will not lead one to expecta red light following a shock (e.g., [41]).
Cortical Signal Flow Cortical signal flow is reversed in visual imagery versus visual perception. [42]
Neural Mechanisms Neurons send signals with axons and receive them with dendrites [34, 43].
Examples of directionality as a key consideration across many domains and levels of analysis. Directionality refers to the notion that the relationship fromA to B (A! B) is independent from the relationship from B to A (B! A), and our formulation of heterogeneous directionality directly reflects neuralmechanics [34]. Individual synapses between neurons are inherently unidirectional, from one neuron’s axon to the other’s dendrite. Therefore, theconnection between any two neurons (or, scaling up, clusters of neurons), A and B, must have a relationship that falls on a directionality spectrum, frompositively unidirectional (A’s axons connect to B’s dendrites; A! B) to bidirectional (A’s and B’s axons connect to each other’s dendrites; A ⇄ B) tonegatively unidirectional (B’s axons connect to A’s dendrites; B! A).
doi:10.1371/journal.pone.0122292.t001
Heterogeneous Stereotype Directionality
PLOS ONE | DOI:10.1371/journal.pone.0122292 March 26, 2015 5 / 27
allowing us to establish unidirectional association norms for each stimulus concept [3, 46–49].Using a pure production task and a completely between-subjects experimental design ensuresthat we are assessing unidirectional relationships within each condition.
The unit of analysis in the present work is the stereotype link, and each link’s directionalityis assessed via a two-condition, between-subjects experiment. To test the Black—athletic link,for example, participants are randomly assigned to either see the stimulus phrase “Aman whois Black,” or “Aman who is athletic.” The dependent variable is whether participants respondwith the concept they were not given as a stimulus (e.g., whether Black brought to mind athleticor athletic brought to mind Black). This design allows us to quantify the extent to which agiven stereotype link (e.g., Black–athletic) is bidirectional (Black⇄ athletic) or unidirectionalin either direction (Black! athletic or athletic! Black).
The Present WorkThe primary goal of the present work is to assess the extent to which stereotypes possess het-erogeneous directionality by documenting and describing the directional structure of variousstereotypes and stereotype networks of interest. To that end, in Study 1 we mapped the struc-ture of the stereotype networks related to two stigmatized groups historically of interest to so-cial psychologists. Studies 2 and 3 provided methodological validations of Study 1 and testedsome alternate explanations for its findings. Specifically, Study 2 examined whether social de-sirability concerns may have unduly influenced Study 1’s patterns, and Study 3 evaluatedwhether Study 1 may have improperly capitalized on random chance. Lastly, Study 4 tradesStudy 1’s depth within two groups’ stereotype networks for breadth across multiple groups,mapping the structure of a wide selection of other stereotypes.
A secondary goal of the present work was to use our data to create a publicly available re-source for other researchers interested in exploring stereotype structure. The data matricesarising from the present work map the structure of each stereotype network, quantifying the di-rectional structure of the individual relationships between the group concept of interest (e.g.,Black men) and each of its various stereotypic attributes (e.g., the Black–criminal link, theBlack–poor link), as well as the relationships, if any, among the various attributes themselves(e.g., the criminal–poor link). For each of our studies, we provide both the raw participant dataand the coded data matrices, which can be useful, flexible resources for future work, to directlytest hypothesis within the data sets, or merely as reference tools for generating novel researchquestions and hypotheses.
Study 1Study 1 explored stereotypes related to Black men and gay men. We chose these two groups inparticular for multiple reasons. Stereotypes about these groups have received extensive attentionby stereotyping and prejudice researchers, which 1) allows us to draw upon the theoretical andempirical foundations of past work, and 2) makes it more likely that the present explorationcan be useful to future work with these groups. Also, based on past work and our own theoriz-ing, stereotypes related to these two groups seem especially likely to reveal heterogeneous direc-tionality. Because the defining features of gay male group membership (i.e., same-sex attraction,gay identity) are not visible, people often rely on stereotypic cues (e.g., fashion) to infer thatmen are gay [27–28, 50–51]. Gay male stereotypes, therefore, are often used in the negative, At-tribute! Group direction, which suggests to us that they may be more likely to possess nega-tive directionality. Because race is a visible, salient group status, people probably do not oftenrely upon stereotypic cues to activate the concept Black, except perhaps in situations when raceis not as obvious (e.g., over the phone [52], cf. [25, 32]). Black male stereotypes may therefore
Heterogeneous Stereotype Directionality
PLOS ONE | DOI:10.1371/journal.pone.0122292 March 26, 2015 6 / 27
be likely to possess either positive directionality (Group! Attribute) or bidirectionality. Weanticipate, therefore, that stereotypes related to these two groups are likely to reveal heteroge-neous directionality, making them an ideal starting point for the present work. We later extendour exploration of directionality to stereotypes related to many other social groups in Study 4.
MethodDesign and participants. We examined many different attributes stereotypically associat-
ed with gay men and Black men, to provide as complete a picture as possible for these twogroups’ stereotype networks. Based on our anticipated sample size, we decided that Study 1would have 60 conditions total, with the groups and their various stereotypic attributes eachbeing a single between-subjects condition. In all, 2295 undergraduates participated. Before cod-ing any of the data, we excluded participants who reported being in the U.S. for fewer than 4years (to insure familiarity with U.S. stereotypes; n = 190) or who provided fewer than four ofthe five responses our task requested (i.e., less than 80% completion of the task/missing morethan a single data point, n = 41). The responses from these excluded participants were nevercoded. Lastly, one condition (n = 15) was included as part of another, unrelated project. Afterthese exclusions, therefore, each of 2049 undergraduates was randomly assigned to one of 59conditions, yielding a sufficient per-condition sample size (Mn = 34.7, sdn = 2.56). All the ex-periments in this article were approved by the Social and Behavioral Sciences Institutional Re-view Board at the University of Wisconsin—Madison. All materials and data from this articleare available publicly at www.sciencecox.com/pub/ds15.
Stimulus set. We generated an extensive list of stereotypic traits, behaviors, professions,and interests associated with Black men and gay men. We retrieved many from the past litera-ture [3, 22, 28, 53–54], which is biased toward examining stereotypes with positive directionali-ty, because the past literature relies on methods that provide a group label and ask forstereotypic attributes. Because of this bias, we also culled stereotypic traits from the media, lit-erature, and personal experiences, and we elicited stereotypes of different directionality fromundergraduates using discussion and free response questions (e.g., “How would you be able totell if a man was gay without being able to ask him?”). Using these sources yielded a list of over1200 candidate phrases that could be used as stimuli in the study.
A coder who was blind to the hypotheses of the study sorted the extensive list into categories(e.g., “steals things,” “is a criminal,” “kills people,” and “breaks into people’s houses” weregrouped into the category criminal). The coder then identified the item that was either themost prototypical of each category (e.g., “is a criminal” from the criminal category) or was aprominent exemplar of it (e.g., “is a Cher fan” from themusical artist fan category). Based onthe projected size of our sample, we asked this hypothesis-blind coder to select a total of 57stereotypic attributes.
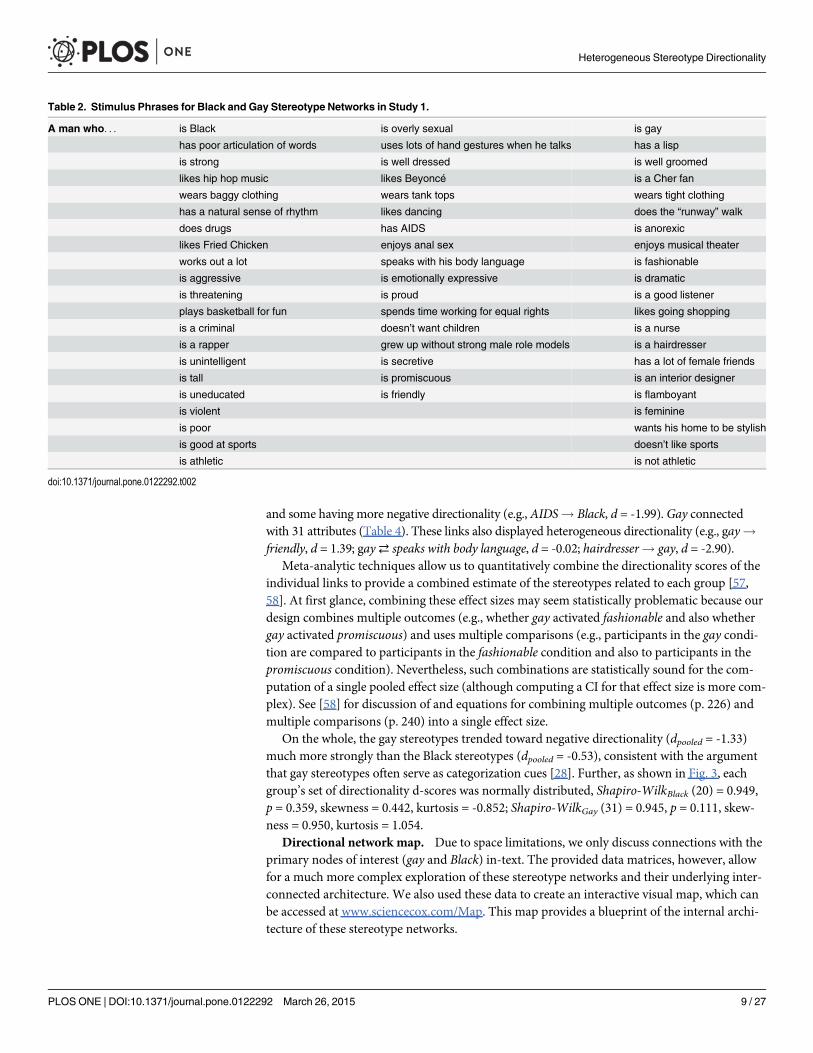
The concepts were all placed in phrases with the stem “Aman who ______”, which bound-ed the task to cognitions about a male person (e.g., “Aman who is Black.” “A man who is acriminal.”). Our full set of stimulus items included 20 stereotypic attributes related to Blackmen (e.g., “Aman who is a criminal”), 20 stereotypic attributes related to gay men (e.g., “Aman who is fashionable”), 17 stereotypic attributes that could apply to both groups (e.g., “Aman who is overly sexual”), and 2 phrases for the groups of interest (“Aman who is Black” and“Aman who is gay”). These stimulus phrases are displayed in Table 2, and include an assort-ment of stereotypic concepts, including professions (e.g., rapper, nurse), physical attributes(e.g., tall, well groomed), personality characteristics (e.g., friendly, dramatic), clothing (e.g.,baggy clothing, tight clothing), and interests/activities/preferences (e.g., plays basketball, likesshopping), among others.
Heterogeneous Stereotype Directionality
PLOS ONE | DOI:10.1371/journal.pone.0122292 March 26, 2015 7 / 27
Procedure. Each phrase was displayed on a half-sheet of paper as the only stimulus itemin the thought-listing task (see samples in S1 File). Explicit tasks such as this one often bring inthe concern that other psychological processes (e.g., censorship due to social desirability) maydisrupt or distort the measurement of concept activation. Prior work has demonstrated, how-ever, that these censorship concerns are mitigated by explicitly asking participants not to cen-sor themselves, telling them we want their uncensored responses, and assuring them of theiranonymity (e.g., 3, 27, 46–49). We employed these methods in the present work, and verifiedtheir effectiveness empirically in Study 2.
Written instructions directed participants to provide their gut responses and not to censorthemselves, and they assured participants that all responses were completely anonymous. Theinstructions then prompted, “List the first five things that come to your mind when you pic-ture:” followed by the stimulus phrase, in bold on the next line (e.g., “Aman who is gay.”). Un-derneath the phrase were five numbered lines for the participants’ responses. At the bottom ofthe sheet were two items asking for participants’ gender and whether they had lived in the U.S.for more or fewer than 4 years.
Our task appeared at the end of a longer survey administered in introductory psychologyclasses. None of the other survey items or measures were relevant to prejudice, stereotyping,Black men, or gay men—this is important because if a survey item mentioned, for instance,Black men, that concept would be activated in participants’minds, thus tainting our assess-ment of unidirectional associations. Each survey packet was identical in every way except forour thought-listing task, which contained only 1 stimulus item randomly selected from our listof items. Written consent was provided at the beginning of this survey, and an experimenterorally emphasized that we wanted uncensored responses and that the thought-listing taskwould be separated from the rest of the survey, thus reassuring anonymity.
Coding. Two pairs of independent coders who were blind to hypotheses coded every re-sponse in every condition. Each pair decided whether each response was one of the items inour study (e.g., gay) or a direct synonym of it (e.g., homosexual, homo, faggot). For example, if aparticipant’s responses were “homo,” “man-whore,” “HIV,” “stylish clothes,” and “effeminate,”we coded the participant’s responses as gay, promiscuous, AIDS, fashionable, and feminine, re-spectively. There was high interrater agreement (91.6%). Discrepancies between the pairs wereresolved by discussion with an independent coder who was blind to condition, based purely onwhether the response was a direct synonym of the concept in question. See S2 File for the rawparticipant responses and the results of the coding for Study 1.
ResultsData and analysis description. The coding yields a data matrix of association norms (S3
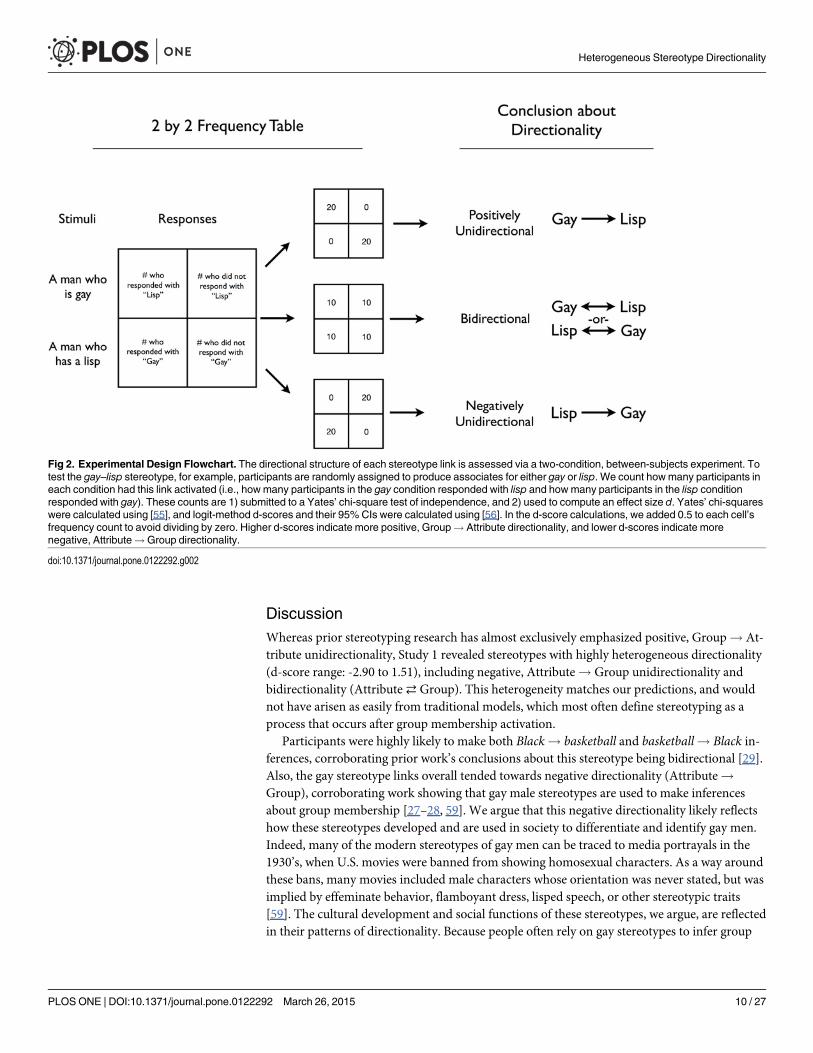
File), documenting how often each concept brought to mind each of the other concepts. For ex-ample, in the Black male condition, 20.5% of participants responded with criminal, 23.1% ofparticipants responded with athletic, and 17.9% of participants responded with poor. We usedthese inference percentages to test the directionality of each Group—Attribute link, in what isessentially a two-condition experiment. For each link, we 1) conduct a Yates’ chi-square test ofindependence and 2) compute an effect size d that serves as a directionality d-score. Higher d-scores corresponded to more positive, Group! Attribute directionality, lower d-scores corre-sponded to negative, Attribute! Group directionality, and d-scores closer to zero corre-sponded to more bidirectionality. See Fig. 2 for a guide.
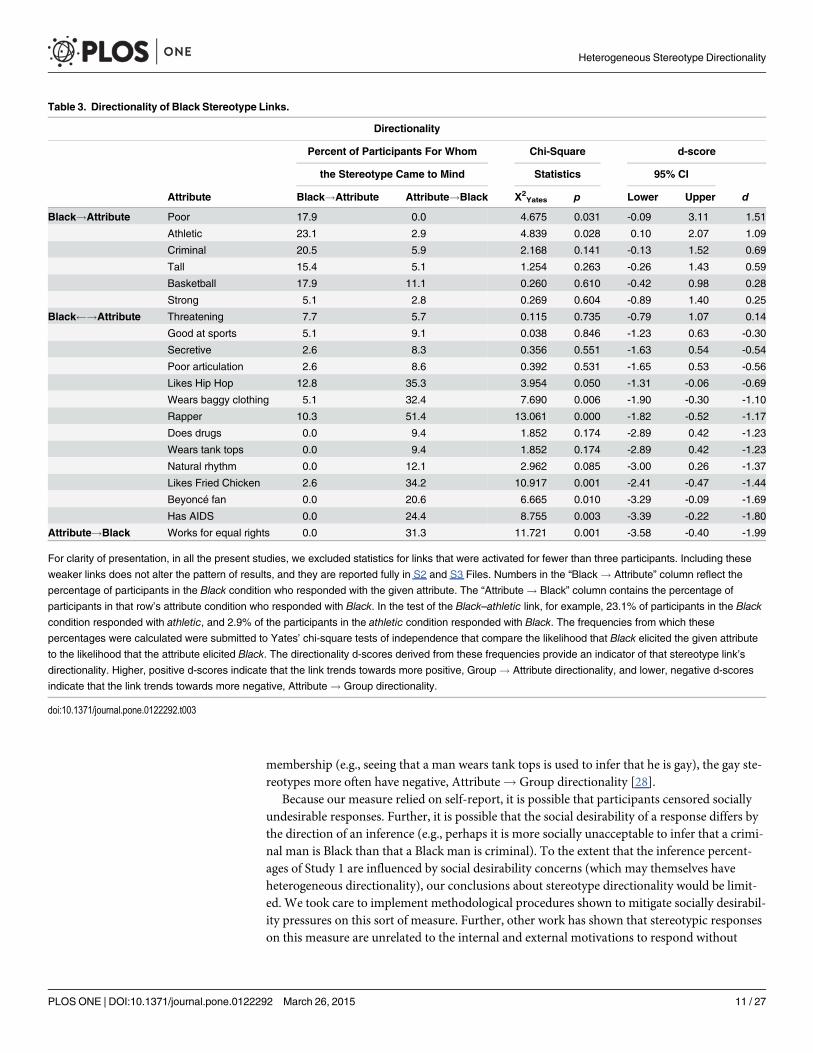
Stereotype directionality. As shown in Table 3, Black connected with 20 attributes. Theselinks displayed heterogeneous directionality, with some having more positive directionality (e.g.,Black! poor, d = 1.51), some being more evenly bidirectional (e.g., Black⇄ basketball, d = 0.28),
Heterogeneous Stereotype Directionality
PLOS ONE | DOI:10.1371/journal.pone.0122292 March 26, 2015 8 / 27
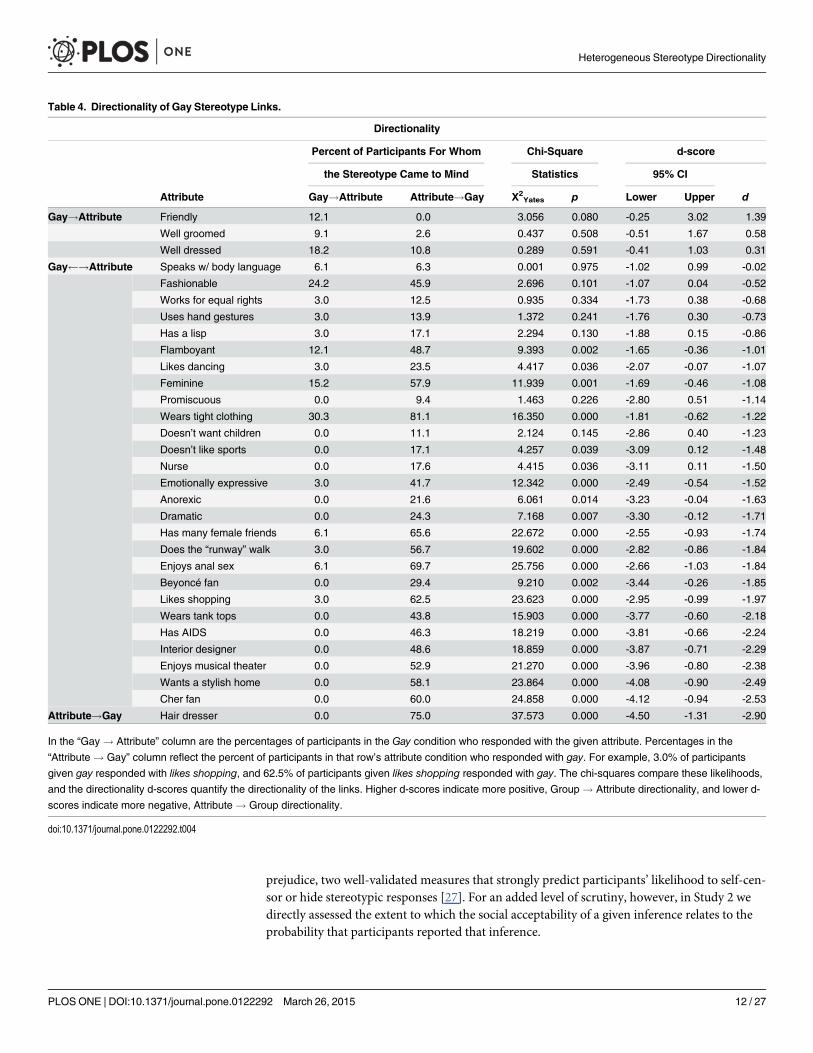
and some having more negative directionality (e.g., AIDS! Black, d = -1.99). Gay connectedwith 31 attributes (Table 4). These links also displayed heterogeneous directionality (e.g., gay!friendly, d = 1.39; gay⇄ speaks with body language, d = -0.02; hairdresser! gay, d = -2.90).
Meta-analytic techniques allow us to quantitatively combine the directionality scores of theindividual links to provide a combined estimate of the stereotypes related to each group [57,58]. At first glance, combining these effect sizes may seem statistically problematic because ourdesign combines multiple outcomes (e.g., whether gay activated fashionable and also whethergay activated promiscuous) and uses multiple comparisons (e.g., participants in the gay condi-tion are compared to participants in the fashionable condition and also to participants in thepromiscuous condition). Nevertheless, such combinations are statistically sound for the com-putation of a single pooled effect size (although computing a CI for that effect size is more com-plex). See [58] for discussion of and equations for combining multiple outcomes (p. 226) andmultiple comparisons (p. 240) into a single effect size.
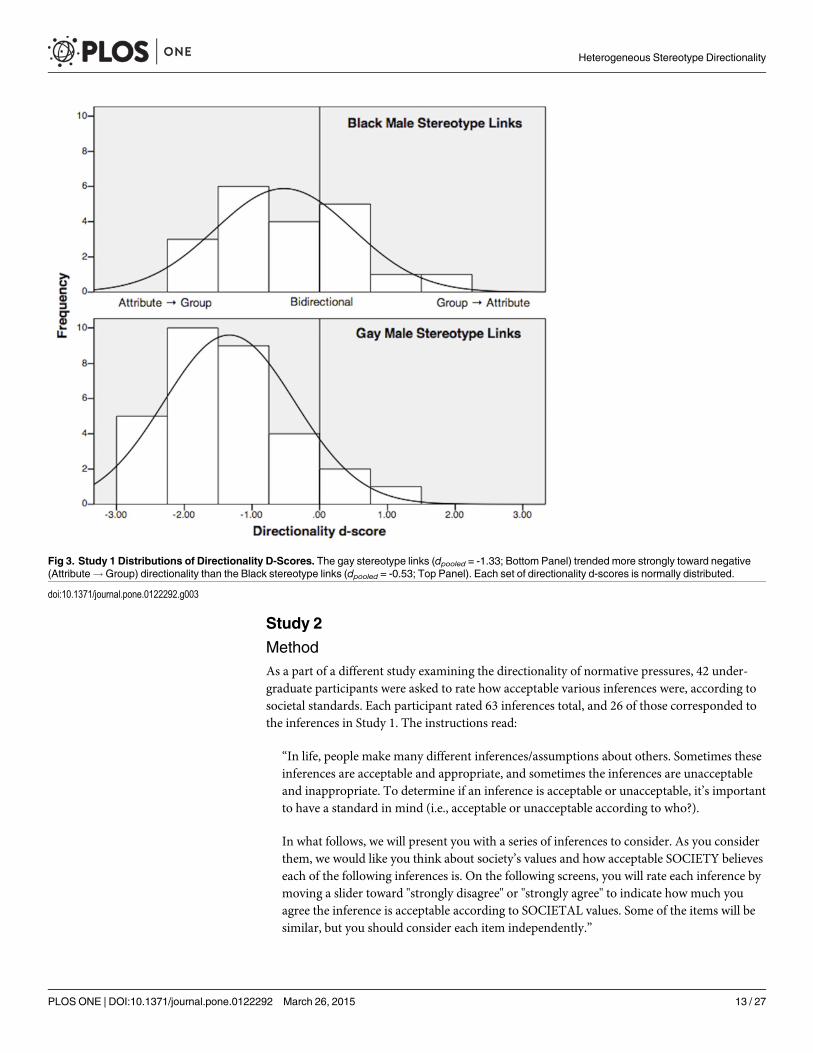
On the whole, the gay stereotypes trended toward negative directionality (dpooled = -1.33)much more strongly than the Black stereotypes (dpooled = -0.53), consistent with the argumentthat gay stereotypes often serve as categorization cues [28]. Further, as shown in Fig. 3, eachgroup’s set of directionality d-scores was normally distributed, Shapiro-WilkBlack (20) = 0.949,p = 0.359, skewness = 0.442, kurtosis = -0.852; Shapiro-WilkGay (31) = 0.945, p = 0.111, skew-ness = 0.950, kurtosis = 1.054.
Directional network map. Due to space limitations, we only discuss connections with theprimary nodes of interest (gay and Black) in-text. The provided data matrices, however, allowfor a much more complex exploration of these stereotype networks and their underlying inter-connected architecture. We also used these data to create an interactive visual map, which canbe accessed at www.sciencecox.com/Map. This map provides a blueprint of the internal archi-tecture of these stereotype networks.
Table 2. Stimulus Phrases for Black and Gay Stereotype Networks in Study 1.
A man who. . . is Black is overly sexual is gay
has poor articulation of words uses lots of hand gestures when he talks has a lisp
is strong is well dressed is well groomed
likes hip hop music likes Beyoncé is a Cher fan
wears baggy clothing wears tank tops wears tight clothing
has a natural sense of rhythm likes dancing does the “runway” walk
does drugs has AIDS is anorexic
likes Fried Chicken enjoys anal sex enjoys musical theater
works out a lot speaks with his body language is fashionable
is aggressive is emotionally expressive is dramatic
is threatening is proud is a good listener
plays basketball for fun spends time working for equal rights likes going shopping
is a criminal doesn’t want children is a nurse
is a rapper grew up without strong male role models is a hairdresser
is unintelligent is secretive has a lot of female friends
is tall is promiscuous is an interior designer
is uneducated is friendly is flamboyant
is violent is feminine
is poor wants his home to be stylish
is good at sports doesn’t like sports
is athletic is not athletic
doi:10.1371/journal.pone.0122292.t002
Heterogeneous Stereotype Directionality
PLOS ONE | DOI:10.1371/journal.pone.0122292 March 26, 2015 9 / 27
DiscussionWhereas prior stereotyping research has almost exclusively emphasized positive, Group! At-tribute unidirectionality, Study 1 revealed stereotypes with highly heterogeneous directionality(d-score range: -2.90 to 1.51), including negative, Attribute! Group unidirectionality andbidirectionality (Attribute⇄ Group). This heterogeneity matches our predictions, and wouldnot have arisen as easily from traditional models, which most often define stereotyping as aprocess that occurs after group membership activation.
Participants were highly likely to make both Black! basketball and basketball! Black in-ferences, corroborating prior work’s conclusions about this stereotype being bidirectional [29].Also, the gay stereotype links overall tended towards negative directionality (Attribute!Group), corroborating work showing that gay male stereotypes are used to make inferencesabout group membership [27–28, 59]. We argue that this negative directionality likely reflectshow these stereotypes developed and are used in society to differentiate and identify gay men.Indeed, many of the modern stereotypes of gay men can be traced to media portrayals in the1930’s, when U.S. movies were banned from showing homosexual characters. As a way aroundthese bans, many movies included male characters whose orientation was never stated, but wasimplied by effeminate behavior, flamboyant dress, lisped speech, or other stereotypic traits[59]. The cultural development and social functions of these stereotypes, we argue, are reflectedin their patterns of directionality. Because people often rely on gay stereotypes to infer group
Fig 2. Experimental Design Flowchart. The directional structure of each stereotype link is assessed via a two-condition, between-subjects experiment. Totest the gay–lisp stereotype, for example, participants are randomly assigned to produce associates for either gay or lisp. We count howmany participants ineach condition had this link activated (i.e., howmany participants in the gay condition responded with lisp and how many participants in the lisp conditionresponded with gay). These counts are 1) submitted to a Yates’ chi-square test of independence, and 2) used to compute an effect size d. Yates’ chi-squareswere calculated using [55], and logit-method d-scores and their 95% CIs were calculated using [56]. In the d-score calculations, we added 0.5 to each cell’sfrequency count to avoid dividing by zero. Higher d-scores indicate more positive, Group! Attribute directionality, and lower d-scores indicate morenegative, Attribute!Group directionality.
doi:10.1371/journal.pone.0122292.g002
Heterogeneous Stereotype Directionality
PLOS ONE | DOI:10.1371/journal.pone.0122292 March 26, 2015 10 / 27
membership (e.g., seeing that a man wears tank tops is used to infer that he is gay), the gay ste-reotypes more often have negative, Attribute! Group directionality [28].
Because our measure relied on self-report, it is possible that participants censored sociallyundesirable responses. Further, it is possible that the social desirability of a response differs bythe direction of an inference (e.g., perhaps it is more socially unacceptable to infer that a crimi-nal man is Black than that a Black man is criminal). To the extent that the inference percent-ages of Study 1 are influenced by social desirability concerns (which may themselves haveheterogeneous directionality), our conclusions about stereotype directionality would be limit-ed. We took care to implement methodological procedures shown to mitigate socially desirabil-ity pressures on this sort of measure. Further, other work has shown that stereotypic responseson this measure are unrelated to the internal and external motivations to respond without
Table 3. Directionality of Black Stereotype Links.
Directionality
Percent of Participants For Whom Chi-Square d-score
the Stereotype Came to Mind Statistics 95% CI
Attribute Black!Attribute Attribute!Black Χ2Yates p Lower Upper d
Black!Attribute Poor 17.9 0.0 4.675 0.031 -0.09 3.11 1.51
Athletic 23.1 2.9 4.839 0.028 0.10 2.07 1.09
Criminal 20.5 5.9 2.168 0.141 -0.13 1.52 0.69
Tall 15.4 5.1 1.254 0.263 -0.26 1.43 0.59
Basketball 17.9 11.1 0.260 0.610 -0.42 0.98 0.28
Strong 5.1 2.8 0.269 0.604 -0.89 1.40 0.25
Black !Attribute Threatening 7.7 5.7 0.115 0.735 -0.79 1.07 0.14
Good at sports 5.1 9.1 0.038 0.846 -1.23 0.63 -0.30
Secretive 2.6 8.3 0.356 0.551 -1.63 0.54 -0.54
Poor articulation 2.6 8.6 0.392 0.531 -1.65 0.53 -0.56
Likes Hip Hop 12.8 35.3 3.954 0.050 -1.31 -0.06 -0.69
Wears baggy clothing 5.1 32.4 7.690 0.006 -1.90 -0.30 -1.10
Rapper 10.3 51.4 13.061 0.000 -1.82 -0.52 -1.17
Does drugs 0.0 9.4 1.852 0.174 -2.89 0.42 -1.23
Wears tank tops 0.0 9.4 1.852 0.174 -2.89 0.42 -1.23
Natural rhythm 0.0 12.1 2.962 0.085 -3.00 0.26 -1.37
Likes Fried Chicken 2.6 34.2 10.917 0.001 -2.41 -0.47 -1.44
Beyoncé fan 0.0 20.6 6.665 0.010 -3.29 -0.09 -1.69
Has AIDS 0.0 24.4 8.755 0.003 -3.39 -0.22 -1.80
Attribute!Black Works for equal rights 0.0 31.3 11.721 0.001 -3.58 -0.40 -1.99
For clarity of presentation, in all the present studies, we excluded statistics for links that were activated for fewer than three participants. Including theseweaker links does not alter the pattern of results, and they are reported fully in S2 and S3 Files. Numbers in the “Black! Attribute” column reflect thepercentage of participants in the Black condition who responded with the given attribute. The “Attribute! Black” column contains the percentage ofparticipants in that row’s attribute condition who responded with Black. In the test of the Black–athletic link, for example, 23.1% of participants in the Blackcondition responded with athletic, and 2.9% of the participants in the athletic condition responded with Black. The frequencies from which thesepercentages were calculated were submitted to Yates’ chi-square tests of independence that compare the likelihood that Black elicited the given attributeto the likelihood that the attribute elicited Black. The directionality d-scores derived from these frequencies provide an indicator of that stereotype link’sdirectionality. Higher, positive d-scores indicate that the link trends towards more positive, Group! Attribute directionality, and lower, negative d-scoresindicate that the link trends towards more negative, Attribute! Group directionality.
doi:10.1371/journal.pone.0122292.t003
Heterogeneous Stereotype Directionality
PLOS ONE | DOI:10.1371/journal.pone.0122292 March 26, 2015 11 / 27
prejudice, two well-validated measures that strongly predict participants’ likelihood to self-cen-sor or hide stereotypic responses [27]. For an added level of scrutiny, however, in Study 2 wedirectly assessed the extent to which the social acceptability of a given inference relates to theprobability that participants reported that inference.
Table 4. Directionality of Gay Stereotype Links.
Directionality
Percent of Participants For Whom Chi-Square d-score
the Stereotype Came to Mind Statistics 95% CI
Attribute Gay!Attribute Attribute!Gay Χ2Yates p Lower Upper d
Gay!Attribute Friendly 12.1 0.0 3.056 0.080 -0.25 3.02 1.39
Well groomed 9.1 2.6 0.437 0.508 -0.51 1.67 0.58
Well dressed 18.2 10.8 0.289 0.591 -0.41 1.03 0.31
Gay !Attribute Speaks w/ body language 6.1 6.3 0.001 0.975 -1.02 0.99 -0.02
Fashionable 24.2 45.9 2.696 0.101 -1.07 0.04 -0.52
Works for equal rights 3.0 12.5 0.935 0.334 -1.73 0.38 -0.68
Uses hand gestures 3.0 13.9 1.372 0.241 -1.76 0.30 -0.73
Has a lisp 3.0 17.1 2.294 0.130 -1.88 0.15 -0.86
Flamboyant 12.1 48.7 9.393 0.002 -1.65 -0.36 -1.01
Likes dancing 3.0 23.5 4.417 0.036 -2.07 -0.07 -1.07
Feminine 15.2 57.9 11.939 0.001 -1.69 -0.46 -1.08
Promiscuous 0.0 9.4 1.463 0.226 -2.80 0.51 -1.14
Wears tight clothing 30.3 81.1 16.350 0.000 -1.81 -0.62 -1.22
Doesn’t want children 0.0 11.1 2.124 0.145 -2.86 0.40 -1.23
Doesn’t like sports 0.0 17.1 4.257 0.039 -3.09 0.12 -1.48
Nurse 0.0 17.6 4.415 0.036 -3.11 0.11 -1.50
Emotionally expressive 3.0 41.7 12.342 0.000 -2.49 -0.54 -1.52
Anorexic 0.0 21.6 6.061 0.014 -3.23 -0.04 -1.63
Dramatic 0.0 24.3 7.168 0.007 -3.30 -0.12 -1.71
Has many female friends 6.1 65.6 22.672 0.000 -2.55 -0.93 -1.74
Does the “runway” walk 3.0 56.7 19.602 0.000 -2.82 -0.86 -1.84
Enjoys anal sex 6.1 69.7 25.756 0.000 -2.66 -1.03 -1.84
Beyoncé fan 0.0 29.4 9.210 0.002 -3.44 -0.26 -1.85
Likes shopping 3.0 62.5 23.623 0.000 -2.95 -0.99 -1.97
Wears tank tops 0.0 43.8 15.903 0.000 -3.77 -0.60 -2.18
Has AIDS 0.0 46.3 18.219 0.000 -3.81 -0.66 -2.24
Interior designer 0.0 48.6 18.859 0.000 -3.87 -0.71 -2.29
Enjoys musical theater 0.0 52.9 21.270 0.000 -3.96 -0.80 -2.38
Wants a stylish home 0.0 58.1 23.864 0.000 -4.08 -0.90 -2.49
Cher fan 0.0 60.0 24.858 0.000 -4.12 -0.94 -2.53
Attribute!Gay Hair dresser 0.0 75.0 37.573 0.000 -4.50 -1.31 -2.90
In the “Gay! Attribute” column are the percentages of participants in the Gay condition who responded with the given attribute. Percentages in the“Attribute! Gay” column reflect the percent of participants in that row’s attribute condition who responded with gay. For example, 3.0% of participantsgiven gay responded with likes shopping, and 62.5% of participants given likes shopping responded with gay. The chi-squares compare these likelihoods,and the directionality d-scores quantify the directionality of the links. Higher d-scores indicate more positive, Group! Attribute directionality, and lower d-scores indicate more negative, Attribute! Group directionality.
doi:10.1371/journal.pone.0122292.t004
Heterogeneous Stereotype Directionality
PLOS ONE | DOI:10.1371/journal.pone.0122292 March 26, 2015 12 / 27
Study 2MethodAs a part of a different study examining the directionality of normative pressures, 42 under-graduate participants were asked to rate how acceptable various inferences were, according tosocietal standards. Each participant rated 63 inferences total, and 26 of those corresponded tothe inferences in Study 1. The instructions read:
“In life, people make many different inferences/assumptions about others. Sometimes theseinferences are acceptable and appropriate, and sometimes the inferences are unacceptableand inappropriate. To determine if an inference is acceptable or unacceptable, it’s importantto have a standard in mind (i.e., acceptable or unacceptable according to who?).
In what follows, we will present you with a series of inferences to consider. As you considerthem, we would like you think about society’s values and how acceptable SOCIETY believeseach of the following inferences is. On the following screens, you will rate each inference bymoving a slider toward "strongly disagree" or "strongly agree" to indicate how much youagree the inference is acceptable according to SOCIETAL values. Some of the items will besimilar, but you should consider each item independently.”
Fig 3. Study 1 Distributions of Directionality D-Scores. The gay stereotype links (dpooled = -1.33; Bottom Panel) trended more strongly toward negative(Attribute!Group) directionality than the Black stereotype links (dpooled = -0.53; Top Panel). Each set of directionality d-scores is normally distributed.
doi:10.1371/journal.pone.0122292.g003
Heterogeneous Stereotype Directionality
PLOS ONE | DOI:10.1371/journal.pone.0122292 March 26, 2015 13 / 27
At the top of each page of the online survey, the task prompted, “According to SOCIETALVALUES. . .” with three inferences underneath for participants to rate.
Participants were randomly assigned to one of two “lists” of inferences. Each list containeda mix of inferences related to Black men and gay men, and a mix of inferences in the Group!Attribute direction and the Attribute! Group direction. Each group—attribute pair appearedonly once in each list, and the inferences of the two lists were in the opposite direction of eachother. If, for instance, List 1 contained the item, “If I find out that a man is gay, it is acceptableto think that he probably is fashionable” (thus rating the acceptability of gay! fashionable),then List 2 would have the opposite, “If I find out that a man is fashionable, it is acceptable tothink that he probably is gay” (thus rating the acceptability of fashionable! gay). Participantsrated their agreement with these statements using a slider (0 = Strongly Disagree to 100 =Strongly Agree). We used the means of these ratings as social acceptability scores, which wecompare to the corresponding inference percentages of Study 1.
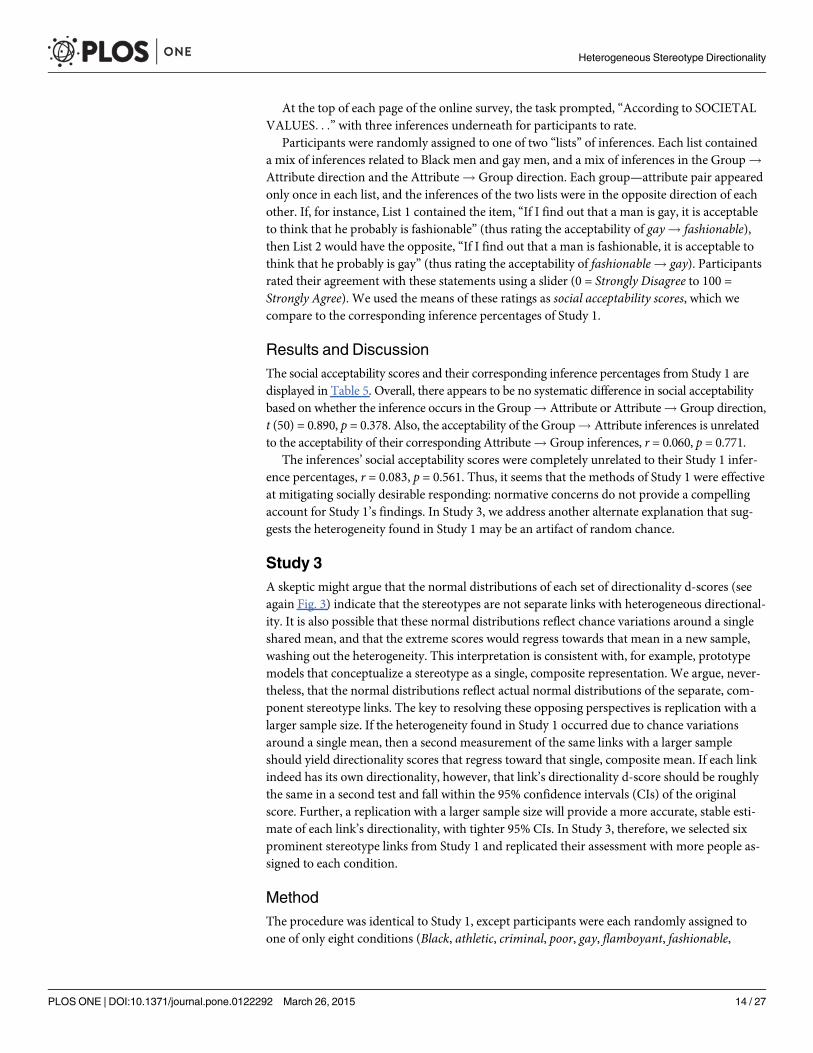
Results and DiscussionThe social acceptability scores and their corresponding inference percentages from Study 1 aredisplayed in Table 5. Overall, there appears to be no systematic difference in social acceptabilitybased on whether the inference occurs in the Group! Attribute or Attribute! Group direction,t (50) = 0.890, p = 0.378. Also, the acceptability of the Group! Attribute inferences is unrelatedto the acceptability of their corresponding Attribute! Group inferences, r = 0.060, p = 0.771.
The inferences’ social acceptability scores were completely unrelated to their Study 1 infer-ence percentages, r = 0.083, p = 0.561. Thus, it seems that the methods of Study 1 were effectiveat mitigating socially desirable responding: normative concerns do not provide a compellingaccount for Study 1’s findings. In Study 3, we address another alternate explanation that sug-gests the heterogeneity found in Study 1 may be an artifact of random chance.
Study 3A skeptic might argue that the normal distributions of each set of directionality d-scores (seeagain Fig. 3) indicate that the stereotypes are not separate links with heterogeneous directional-ity. It is also possible that these normal distributions reflect chance variations around a singleshared mean, and that the extreme scores would regress towards that mean in a new sample,washing out the heterogeneity. This interpretation is consistent with, for example, prototypemodels that conceptualize a stereotype as a single, composite representation. We argue, never-theless, that the normal distributions reflect actual normal distributions of the separate, com-ponent stereotype links. The key to resolving these opposing perspectives is replication with alarger sample size. If the heterogeneity found in Study 1 occurred due to chance variationsaround a single mean, then a second measurement of the same links with a larger sampleshould yield directionality scores that regress toward that single, composite mean. If each linkindeed has its own directionality, however, that link’s directionality d-score should be roughlythe same in a second test and fall within the 95% confidence intervals (CIs) of the originalscore. Further, a replication with a larger sample size will provide a more accurate, stable esti-mate of each link’s directionality, with tighter 95% CIs. In Study 3, therefore, we selected sixprominent stereotype links from Study 1 and replicated their assessment with more people as-signed to each condition.
MethodThe procedure was identical to Study 1, except participants were each randomly assigned toone of only eight conditions (Black, athletic, criminal, poor, gay, flamboyant, fashionable,
Heterogeneous Stereotype Directionality
PLOS ONE | DOI:10.1371/journal.pone.0122292 March 26, 2015 14 / 27
dramatic), which correspond to six stereotype links of interest (Black–athletic, Black–criminal,Black–poor, gay–flamboyant, gay–fashionable, gay–dramatic). After exclusions (Non-U.S. = 76;Missing more than 1 data point = 37), Study 3 had 1342 participants total, enabling us to assessthe directionality of each stereotype link with greater power (1-β = 0.99 for d = 0.3). Raw par-ticipant data and coding are provided in S4 File, and the resulting data matrix is in S3 File.
Results and DiscussionThe Study 3 analyses of each link and comparisons to their Study 1 counterparts are displayedin Table 6. Each Study 3 directionality d-score fits perfectly within the 95% CI of its Study 1counterpart, indicating that Study 1’s conclusions about heterogeneity did not merely capitalizeon random chance or smaller per-condition sample sizes. Study 3’s patterns give us greater
Table 5. Social Acceptability Ratings in Study 2.
Gay Male Stereotypes Black Male Stereotypes
Inference Study 1 InferencePercentage
Study 2 Acceptability Mean(SD)
Inference Study 1 InferencePercentage
Inference
AIDS!Gay 46.3 23.4 (23.44) Articulation!Black 8.6 46.6 (19.61)
Gay!AIDS 0.0 31.7 (17.70) Black!Articulation 2.6 30.3 (25.15)
FemFriends!Gay 65.6 54.1 (24.92) BaggyClothes!Black 32.4 40.9 (24.67)
Gay!FemFriends 6.1 41.0 (18.87) Black!BaggyClothes 5.1 34.8 (25.93)
Feminine!Gay 57.9 52.6 (32.09) Chicken!Black 34.2 49.7 (31.01)
Gay!Feminine 15.2 59.9 (19.89) Black!Chicken 2.6 31.0 (28.11)
Dancing!Gay 23.5 54.7 (25.45) Poor!Black 0.0 45.2 (18.94)
Gay!Dancing 3.0 30.1 (23.58) Black!Poor 18.0 32.0 (25.36)
Designer!Gay 48.6 38.5 (14.42) Strong!Black 2.8 54.0 (20.51)
Gay!Designer 0.0 48.1 (30.01) Black!Strong 5.1 24.7 (20.70)
Fashionable!Gay 46.0 60.8 (26.27) Tall!Black 5.1 49.8 (17.89)
Gay!Fashionable 24.2 42.7 (24.92) Black!Tall 15.4 25.5 (21.16)
Flamboyant!Gay 48.7 52.5 (22.36) Criminal!Black 5.9 30.1 (26.96)
Gay!Flamboyant 12.1 52.4 (29.83) Black!Criminal 20.5 46.8 (23.14)
Hairdresser!Gay 75.0 32.3 (19.35) Rapper!Black 51.4 33.6 (25.64)
Gay!Hairdresser 0.0 49.7 (30.72) Black!Rapper 10.3 69.2 (17.07)
NotLikeSports!Gay 17.1 43.8 (19.02) Sports!Black 9.1 53.0 (30.36)
Gay!NotLikeSports 0.0 34.7 (28.23) Black!Sports 5.1 56.9 (14.43)
Promiscuous!Gay 9.4 36.0 (26.41) Threatening!Black 5.7 37.6 (27.87)
Gay!Promiscuous 0.0 26.9 (23.05) Black!Threatening 7.7 46.5 (15.66)
StylishHome!Gay 58.1 38.6 (24.05)
Gay!StylishHome 0.0 47.0 (25.33)
NotWantChildren!Gay 11.1 24.7 (23.55)
Gay!NotWantChildren 0.0 25.4 (15.95)
Shopping!Gay 62.5 44.2 (28.90)
Gay!Shopping 3.0 50.1 (17.53)
WellDressed!Gay 10.8 51.6 (29.34)
Gay!WellDressed 18.2 43.4 (20.18)
Numbers in the “Study 1 Inference Percentage” column reflect the percent of participants who made that inference in Study 1. Study 2’s socialacceptability scores were obtained by participants rating their agreement with statements such as “According to societal standards . . . If I find out that aman is gay, it is acceptable to think that he probably is fashionable” using a slider (0 = Strongly Disagree to 100 = Strongly Agree).
doi:10.1371/journal.pone.0122292.t005
Heterogeneous Stereotype Directionality
PLOS ONE | DOI:10.1371/journal.pone.0122292 March 26, 2015 15 / 27
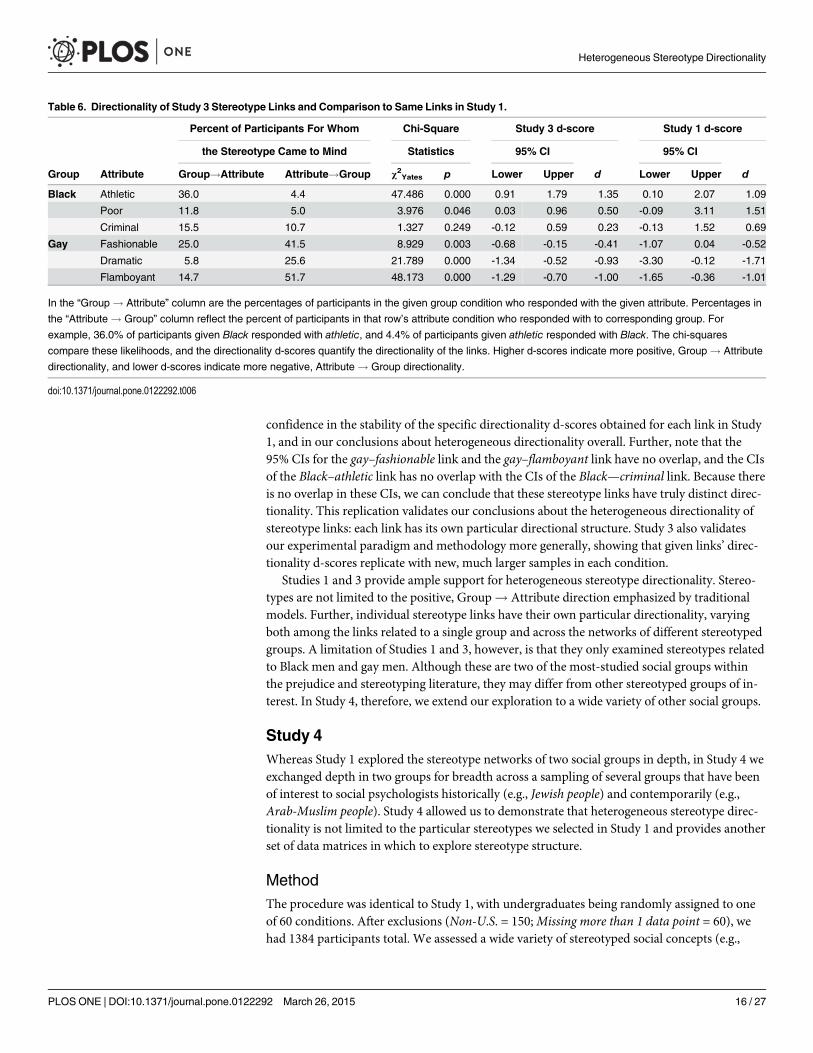
confidence in the stability of the specific directionality d-scores obtained for each link in Study1, and in our conclusions about heterogeneous directionality overall. Further, note that the95% CIs for the gay–fashionable link and the gay–flamboyant link have no overlap, and the CIsof the Black–athletic link has no overlap with the CIs of the Black—criminal link. Because thereis no overlap in these CIs, we can conclude that these stereotype links have truly distinct direc-tionality. This replication validates our conclusions about the heterogeneous directionality ofstereotype links: each link has its own particular directional structure. Study 3 also validatesour experimental paradigm and methodology more generally, showing that given links’ direc-tionality d-scores replicate with new, much larger samples in each condition.
Studies 1 and 3 provide ample support for heterogeneous stereotype directionality. Stereo-types are not limited to the positive, Group! Attribute direction emphasized by traditionalmodels. Further, individual stereotype links have their own particular directionality, varyingboth among the links related to a single group and across the networks of different stereotypedgroups. A limitation of Studies 1 and 3, however, is that they only examined stereotypes relatedto Black men and gay men. Although these are two of the most-studied social groups withinthe prejudice and stereotyping literature, they may differ from other stereotyped groups of in-terest. In Study 4, therefore, we extend our exploration to a wide variety of other social groups.
Study 4Whereas Study 1 explored the stereotype networks of two social groups in depth, in Study 4 weexchanged depth in two groups for breadth across a sampling of several groups that have beenof interest to social psychologists historically (e.g., Jewish people) and contemporarily (e.g.,Arab-Muslim people). Study 4 allowed us to demonstrate that heterogeneous stereotype direc-tionality is not limited to the particular stereotypes we selected in Study 1 and provides anotherset of data matrices in which to explore stereotype structure.
MethodThe procedure was identical to Study 1, with undergraduates being randomly assigned to oneof 60 conditions. After exclusions (Non-U.S. = 150;Missing more than 1 data point = 60), wehad 1384 participants total. We assessed a wide variety of stereotyped social concepts (e.g.,
Table 6. Directionality of Study 3 Stereotype Links and Comparison to Same Links in Study 1.
Percent of Participants For Whom Chi-Square Study 3 d-score Study 1 d-score
the Stereotype Came to Mind Statistics 95% CI 95% CI
Group Attribute Group!Attribute Attribute!Group χ2Yates p Lower Upper d Lower Upper d
Black Athletic 36.0 4.4 47.486 0.000 0.91 1.79 1.35 0.10 2.07 1.09
Poor 11.8 5.0 3.976 0.046 0.03 0.96 0.50 -0.09 3.11 1.51
Criminal 15.5 10.7 1.327 0.249 -0.12 0.59 0.23 -0.13 1.52 0.69
Gay Fashionable 25.0 41.5 8.929 0.003 -0.68 -0.15 -0.41 -1.07 0.04 -0.52
Dramatic 5.8 25.6 21.789 0.000 -1.34 -0.52 -0.93 -3.30 -0.12 -1.71
Flamboyant 14.7 51.7 48.173 0.000 -1.29 -0.70 -1.00 -1.65 -0.36 -1.01
In the “Group! Attribute” column are the percentages of participants in the given group condition who responded with the given attribute. Percentages inthe “Attribute! Group” column reflect the percent of participants in that row’s attribute condition who responded with to corresponding group. Forexample, 36.0% of participants given Black responded with athletic, and 4.4% of participants given athletic responded with Black. The chi-squarescompare these likelihoods, and the directionality d-scores quantify the directionality of the links. Higher d-scores indicate more positive, Group! Attributedirectionality, and lower d-scores indicate more negative, Attribute! Group directionality.
doi:10.1371/journal.pone.0122292.t006
Heterogeneous Stereotype Directionality
PLOS ONE | DOI:10.1371/journal.pone.0122292 March 26, 2015 16 / 27
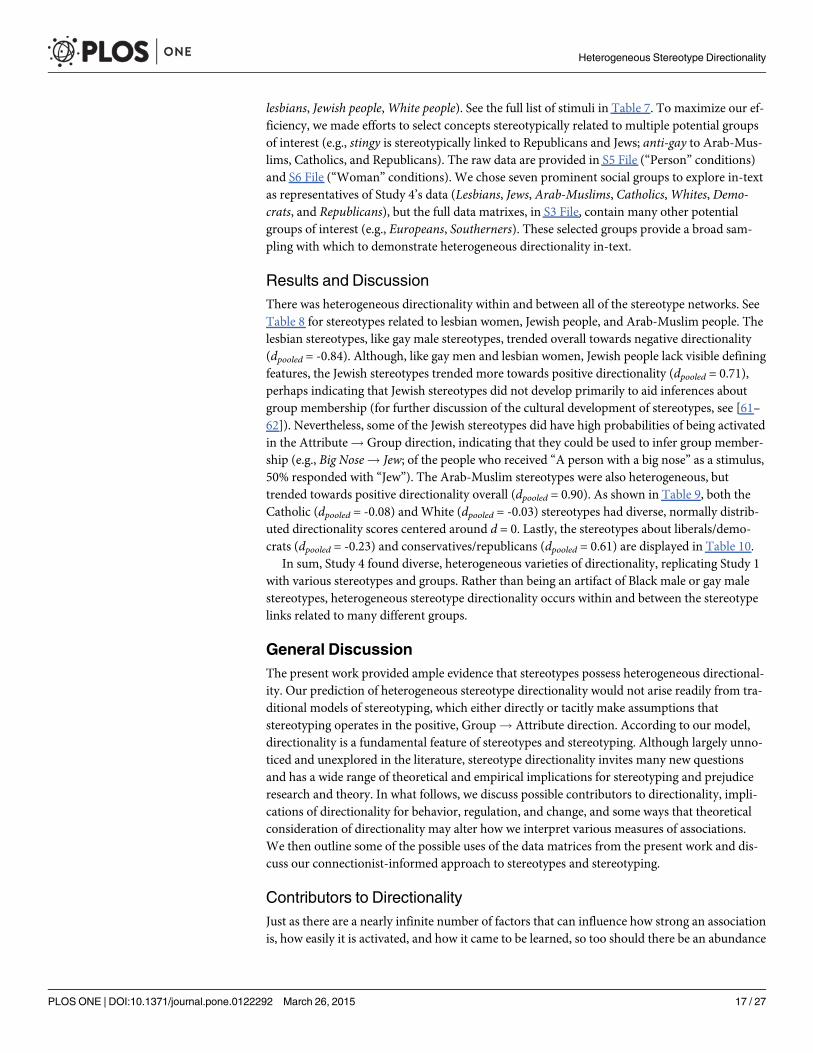
lesbians, Jewish people,White people). See the full list of stimuli in Table 7. To maximize our ef-ficiency, we made efforts to select concepts stereotypically related to multiple potential groupsof interest (e.g., stingy is stereotypically linked to Republicans and Jews; anti-gay to Arab-Mus-lims, Catholics, and Republicans). The raw data are provided in S5 File (“Person” conditions)and S6 File (“Woman” conditions). We chose seven prominent social groups to explore in-textas representatives of Study 4’s data (Lesbians, Jews, Arab-Muslims, Catholics,Whites, Demo-crats, and Republicans), but the full data matrixes, in S3 File, contain many other potentialgroups of interest (e.g., Europeans, Southerners). These selected groups provide a broad sam-pling with which to demonstrate heterogeneous directionality in-text.
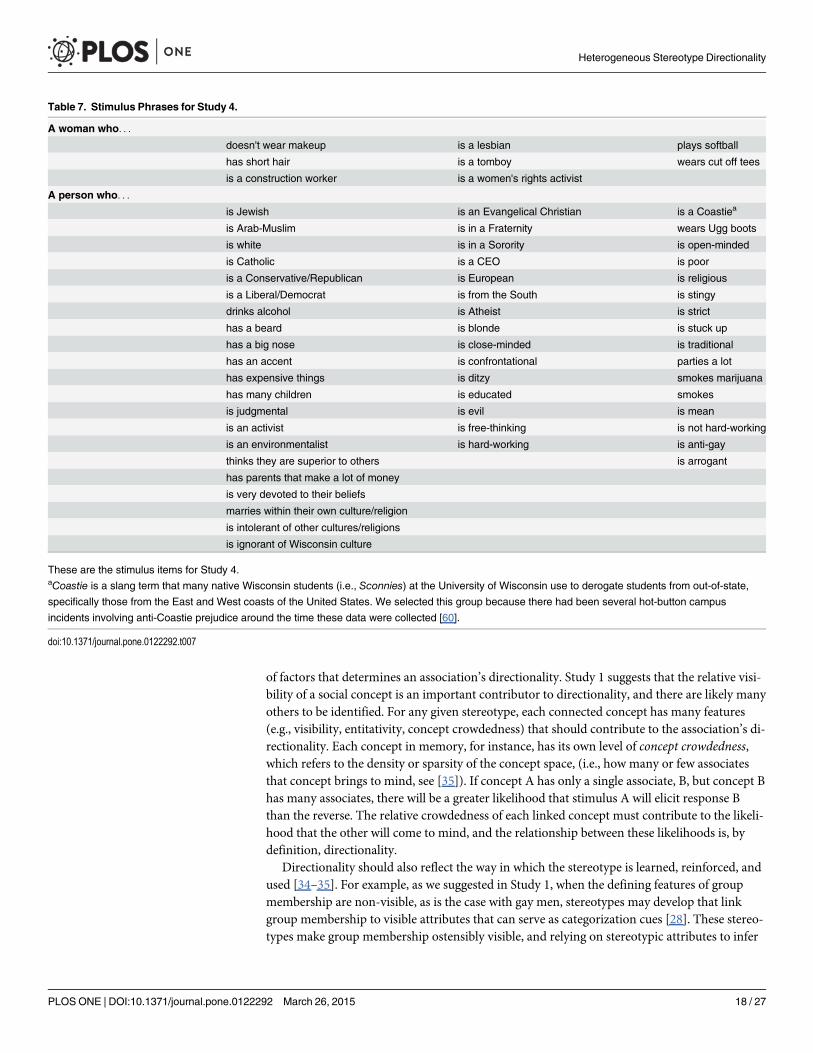
Results and DiscussionThere was heterogeneous directionality within and between all of the stereotype networks. SeeTable 8 for stereotypes related to lesbian women, Jewish people, and Arab-Muslim people. Thelesbian stereotypes, like gay male stereotypes, trended overall towards negative directionality(dpooled = -0.84). Although, like gay men and lesbian women, Jewish people lack visible definingfeatures, the Jewish stereotypes trended more towards positive directionality (dpooled = 0.71),perhaps indicating that Jewish stereotypes did not develop primarily to aid inferences aboutgroup membership (for further discussion of the cultural development of stereotypes, see [61–62]). Nevertheless, some of the Jewish stereotypes did have high probabilities of being activatedin the Attribute! Group direction, indicating that they could be used to infer group member-ship (e.g., Big Nose! Jew; of the people who received “A person with a big nose” as a stimulus,50% responded with “Jew”). The Arab-Muslim stereotypes were also heterogeneous, buttrended towards positive directionality overall (dpooled = 0.90). As shown in Table 9, both theCatholic (dpooled = -0.08) and White (dpooled = -0.03) stereotypes had diverse, normally distrib-uted directionality scores centered around d = 0. Lastly, the stereotypes about liberals/demo-crats (dpooled = -0.23) and conservatives/republicans (dpooled = 0.61) are displayed in Table 10.
In sum, Study 4 found diverse, heterogeneous varieties of directionality, replicating Study 1with various stereotypes and groups. Rather than being an artifact of Black male or gay malestereotypes, heterogeneous stereotype directionality occurs within and between the stereotypelinks related to many different groups.
General DiscussionThe present work provided ample evidence that stereotypes possess heterogeneous directional-ity. Our prediction of heterogeneous stereotype directionality would not arise readily from tra-ditional models of stereotyping, which either directly or tacitly make assumptions thatstereotyping operates in the positive, Group! Attribute direction. According to our model,directionality is a fundamental feature of stereotypes and stereotyping. Although largely unno-ticed and unexplored in the literature, stereotype directionality invites many new questionsand has a wide range of theoretical and empirical implications for stereotyping and prejudiceresearch and theory. In what follows, we discuss possible contributors to directionality, impli-cations of directionality for behavior, regulation, and change, and some ways that theoreticalconsideration of directionality may alter how we interpret various measures of associations.We then outline some of the possible uses of the data matrices from the present work and dis-cuss our connectionist-informed approach to stereotypes and stereotyping.
Contributors to DirectionalityJust as there are a nearly infinite number of factors that can influence how strong an associationis, how easily it is activated, and how it came to be learned, so too should there be an abundance
Heterogeneous Stereotype Directionality
PLOS ONE | DOI:10.1371/journal.pone.0122292 March 26, 2015 17 / 27
of factors that determines an association’s directionality. Study 1 suggests that the relative visi-bility of a social concept is an important contributor to directionality, and there are likely manyothers to be identified. For any given stereotype, each connected concept has many features(e.g., visibility, entitativity, concept crowdedness) that should contribute to the association’s di-rectionality. Each concept in memory, for instance, has its own level of concept crowdedness,which refers to the density or sparsity of the concept space, (i.e., how many or few associatesthat concept brings to mind, see [35]). If concept A has only a single associate, B, but concept Bhas many associates, there will be a greater likelihood that stimulus A will elicit response Bthan the reverse. The relative crowdedness of each linked concept must contribute to the likeli-hood that the other will come to mind, and the relationship between these likelihoods is, bydefinition, directionality.
Directionality should also reflect the way in which the stereotype is learned, reinforced, andused [34–35]. For example, as we suggested in Study 1, when the defining features of groupmembership are non-visible, as is the case with gay men, stereotypes may develop that linkgroup membership to visible attributes that can serve as categorization cues [28]. These stereo-types make group membership ostensibly visible, and relying on stereotypic attributes to infer
Table 7. Stimulus Phrases for Study 4.
A woman who. . .
doesn't wear makeup is a lesbian plays softball
has short hair is a tomboy wears cut off tees
is a construction worker is a women's rights activist
A person who. . .
is Jewish is an Evangelical Christian is a Coastiea
is Arab-Muslim is in a Fraternity wears Ugg boots
is white is in a Sorority is open-minded
is Catholic is a CEO is poor
is a Conservative/Republican is European is religious
is a Liberal/Democrat is from the South is stingy
drinks alcohol is Atheist is strict
has a beard is blonde is stuck up
has a big nose is close-minded is traditional
has an accent is confrontational parties a lot
has expensive things is ditzy smokes marijuana
has many children is educated smokes
is judgmental is evil is mean
is an activist is free-thinking is not hard-working
is an environmentalist is hard-working is anti-gay
thinks they are superior to others is arrogant
has parents that make a lot of money
is very devoted to their beliefs
marries within their own culture/religion
is intolerant of other cultures/religions
is ignorant of Wisconsin culture
These are the stimulus items for Study 4.aCoastie is a slang term that many native Wisconsin students (i.e., Sconnies) at the University of Wisconsin use to derogate students from out-of-state,specifically those from the East and West coasts of the United States. We selected this group because there had been several hot-button campusincidents involving anti-Coastie prejudice around the time these data were collected [60].
doi:10.1371/journal.pone.0122292.t007
Heterogeneous Stereotype Directionality
PLOS ONE | DOI:10.1371/journal.pone.0122292 March 26, 2015 18 / 27

group membership should build associations primarily from the attribute to the group, leadingto observed Attribute! Group directionality. Understanding a stereotype’s directionality,therefore, may give us insight into the social functions or origins of that stereotype. In this way,our exploration of directionality provides a foundation from which to generate hypotheses re-garding the multifarious contributors to directionality, and in so doing, we can better under-stand stereotypes and stereotyping.
Implications for Behavior, Regulation, and ChangeFor any examination of stereotypes and stereotyping, we strongly recommend considering thedirectionality of the specific stereotype under study. The heterogeneous directionality bothwithin and between the stereotype networks of different social groups suggests that phenomenademonstrated with one stereotype link (e.g., Black! athletic) or one stereotyped group (e.g.,Black men) may not generalize to other links (e.g., Black⇄ basketball) or groups (e.g., gay men)that have different patterns of directionality. And, indeed, stereotypes with different direction-ality bring in different sets of theoretical and practical concerns.
Table 8. Directionality of Lesbian, Jew, and Arab Stereotype Links.
Directionality
Percent of Participants For Whom Chi-Square d-score
the Stereotype Came to Mind Statistics 95% CI
Group Attribute Group!Attribute Attribute!Group Χ2Yates p Lower Upper d
Lesbians Tomboy 69.2 45.8 1.926 0.165 -0.11 1.14 0.52
Women’s rights activist 3.8 7.1 0.279 0.597 -1.42 0.90 -0.26
Has short hair 46.2 61.9 0.611 0.434 -0.97 0.29 -0.34
Plays softball 7.7 57.7 12.585 0.000 -2.25 -0.59 -1.42
Wears cutoff tees 0.0 29.6 6.909 0.009 -3.34 -0.13 -1.73
Construction Worker 0.0 31.6 6.938 0.008 -3.41 -0.16 -1.79
dPooled = -0.84
Jews Has wealthy parents 26.1 0.0 4.322 0.038 -0.10 3.15 1.53
White 17.4 0.0 2.602 0.107 -0.31 2.98 1.34
Religious 56.5 20.0 5.348 0.021 0.18 1.55 0.86
Has a beard 8.7 6.7 0.077 0.782 -0.86 1.17 0.16
Big nose 34.8 50.0 0.438 0.508 -1.01 0.35 -0.33
dPooled = 0.71
Arabs Confrontational 44.8 0.0 10.498 0.001 0.37 3.56 1.96
Mean 41.4 0.0 9.278 0.002 0.29 3.49 1.89
Religious 27.6 0.0 6.058 0.014 0.05 3.26 1.66
Evil 20.7 0.0 3.172 0.075 -0.25 2.98 1.37
Has a beard 17.2 3.3 1.785 0.182 -0.22 1.86 0.82
Accent 10.3 15.0 0.002 0.964 -1.11 0.65 -0.23
Activist 0.0 10.3 1.406 0.236 -2.79 0.53 -1.13
dPooled = 0.90
In the “Group! Attribute” column are the percentages of participants in the given group condition who responded with the given attribute. Percentages inthe “Attribute! Group” column reflect the percent of participants in that row’s attribute condition who responded with to corresponding group. The chi-squares compare these likelihoods, and the directionality d-scores quantify the directionality of the links. Higher d-scores indicate more positive, Group!Attribute directionality, and lower d-scores indicate more negative, Attribute! Group directionality.
doi:10.1371/journal.pone.0122292.t008
Heterogeneous Stereotype Directionality
PLOS ONE | DOI:10.1371/journal.pone.0122292 March 26, 2015 19 / 27
The consequences of Group! Attribute stereotyping are well-documented: The activation ofa stigmatized group concept brings to mind an assortment of stereotypic attributes that influencethe perceiver’s judgments, attention, affect, and behavior towards the group member, usually tothe target’s detriment (for a review, see [2]). Consider now the consequences of Attribute!Group stereotypes. First and foremost, once a stereotypic attribute activates the group status, thatactivation will spread through all the Group! Attribute connections as well, setting off thesame negative consequences that result from the typical case of Group! Attribute stereotyping.
Table 9. Directionality of Catholic andWhite Stereotype Links.
Directionality
Percent of Participants For Whom Chi-Square d-score
the Stereotype Came to Mind Statistics 95% CI
Group Attribute Group!Attribute Attribute!Group Χ2Yates p Lower Upper d
Catholics Strict 27.3 0.0 4.331 0.037 -0.09 3.16 1.53
White 18.2 0.0 2.764 0.096 -0.28 3.01 1.37
Close-minded 13.6 0.0 1.622 0.203 -0.47 2.87 1.20
Has many children 18.2 8.0 0.367 0.545 -0.46 1.37 0.46
Traditional 9.1 4.5 0.358 0.550 -0.86 1.47 0.31
Religious 31.8 36.0 0.091 0.763 -0.75 0.56 -0.10
Intolerant of other cultures 9.1 19.0 0.252 0.616 -1.33 0.51 -0.41
Conservative/Republican 4.5 14.8 0.500 0.480 -1.63 0.51 -0.56
Anti-Gay 0.0 14.3 1.751 0.186 -2.81 0.48 -1.16
Devoted to beliefs 0.0 33.3 6.484 0.011 -3.36 -0.12 -1.74
Marries within own culture 0.0 35.3 6.666 0.010 -3.42 -0.15 -1.78
dPooled = -0.08
Whites Stuck up 29.2 0.0 5.203 0.023 -0.01 3.22 1.61
Corporate 41.7 4.8 6.382 0.012 0.25 2.28 1.26
Close-minded 12.5 0.0 1.422 0.233 -0.52 2.81 1.14
Confrontational 12.5 0.0 1.162 0.281 -0.59 2.74 1.07
Hard-working 25.0 4.2 2.676 0.102 -0.09 1.98 0.94
Educated 37.5 9.5 3.352 0.067 0.01 1.71 0.86
Arrogant 20.8 4.8 1.306 0.253 -0.31 1.80 0.74
Has expensive things 25.0 8.0 1.495 0.221 -0.21 1.53 0.66
Blonde 8.3 9.1 0.008 0.927 -1.07 0.97 -0.05
Thinks they are superior 4.2 11.1 0.227 0.634 -1.49 0.63 -0.43
Intolerant of other cultures 4.2 19.0 1.230 0.267 -1.84 0.31 -0.77
Anti-Gay 0.0 10.7 1.114 0.291 -2.71 0.61 -1.05
Conservative/Republican 0.0 11.1 1.182 0.277 -2.74 0.59 -1.07
From the South of the U.S. 0.0 14.3 1.736 0.188 -2.90 0.44 -1.23
Jewish 0.0 17.4 2.602 0.107 -2.98 -3.28 -1.34
Catholic 0.0 18.2 2.764 0.096 -3.01 0.28 -1.37
Marries within own culture 0.0 23.5 3.870 0.049 -3.19 0.11 -1.54
dPooled = -0.03
In the “Group! Attribute” column are the percentages of participants in the given group condition who responded with the given attribute. Percentages inthe “Attribute! Group” column reflect the percent of participants in that row’s attribute condition who responded with to corresponding group. The chi-squares compare these likelihoods, and the directionality d-scores quantify the directionality of the links. Higher d-scores indicate more positive, Group!Attribute directionality, and lower d-scores indicate more negative, Attribute! Group directionality.
doi:10.1371/journal.pone.0122292.t009
Heterogeneous Stereotype Directionality
PLOS ONE | DOI:10.1371/journal.pone.0122292 March 26, 2015 20 / 27
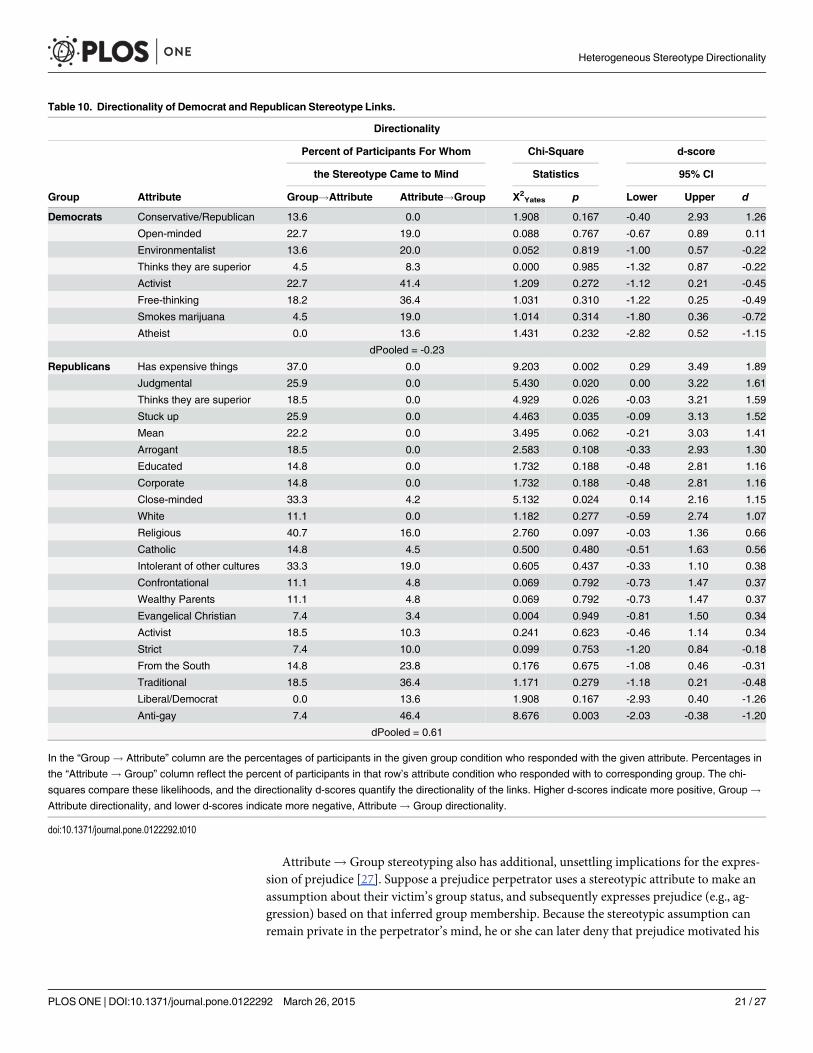
Attribute! Group stereotyping also has additional, unsettling implications for the expres-sion of prejudice [27]. Suppose a prejudice perpetrator uses a stereotypic attribute to make anassumption about their victim’s group status, and subsequently expresses prejudice (e.g., ag-gression) based on that inferred group membership. Because the stereotypic assumption canremain private in the perpetrator’s mind, he or she can later deny that prejudice motivated his
Table 10. Directionality of Democrat and Republican Stereotype Links.
Directionality
Percent of Participants For Whom Chi-Square d-score
the Stereotype Came to Mind Statistics 95% CI
Group Attribute Group!Attribute Attribute!Group Χ2Yates p Lower Upper d
Democrats Conservative/Republican 13.6 0.0 1.908 0.167 -0.40 2.93 1.26
Open-minded 22.7 19.0 0.088 0.767 -0.67 0.89 0.11
Environmentalist 13.6 20.0 0.052 0.819 -1.00 0.57 -0.22
Thinks they are superior 4.5 8.3 0.000 0.985 -1.32 0.87 -0.22
Activist 22.7 41.4 1.209 0.272 -1.12 0.21 -0.45
Free-thinking 18.2 36.4 1.031 0.310 -1.22 0.25 -0.49
Smokes marijuana 4.5 19.0 1.014 0.314 -1.80 0.36 -0.72
Atheist 0.0 13.6 1.431 0.232 -2.82 0.52 -1.15
dPooled = -0.23
Republicans Has expensive things 37.0 0.0 9.203 0.002 0.29 3.49 1.89
Judgmental 25.9 0.0 5.430 0.020 0.00 3.22 1.61
Thinks they are superior 18.5 0.0 4.929 0.026 -0.03 3.21 1.59
Stuck up 25.9 0.0 4.463 0.035 -0.09 3.13 1.52
Mean 22.2 0.0 3.495 0.062 -0.21 3.03 1.41
Arrogant 18.5 0.0 2.583 0.108 -0.33 2.93 1.30
Educated 14.8 0.0 1.732 0.188 -0.48 2.81 1.16
Corporate 14.8 0.0 1.732 0.188 -0.48 2.81 1.16
Close-minded 33.3 4.2 5.132 0.024 0.14 2.16 1.15
White 11.1 0.0 1.182 0.277 -0.59 2.74 1.07
Religious 40.7 16.0 2.760 0.097 -0.03 1.36 0.66
Catholic 14.8 4.5 0.500 0.480 -0.51 1.63 0.56
Intolerant of other cultures 33.3 19.0 0.605 0.437 -0.33 1.10 0.38
Confrontational 11.1 4.8 0.069 0.792 -0.73 1.47 0.37
Wealthy Parents 11.1 4.8 0.069 0.792 -0.73 1.47 0.37
Evangelical Christian 7.4 3.4 0.004 0.949 -0.81 1.50 0.34
Activist 18.5 10.3 0.241 0.623 -0.46 1.14 0.34
Strict 7.4 10.0 0.099 0.753 -1.20 0.84 -0.18
From the South 14.8 23.8 0.176 0.675 -1.08 0.46 -0.31
Traditional 18.5 36.4 1.171 0.279 -1.18 0.21 -0.48
Liberal/Democrat 0.0 13.6 1.908 0.167 -2.93 0.40 -1.26
Anti-gay 7.4 46.4 8.676 0.003 -2.03 -0.38 -1.20
dPooled = 0.61
In the “Group! Attribute” column are the percentages of participants in the given group condition who responded with the given attribute. Percentages inthe “Attribute! Group” column reflect the percent of participants in that row’s attribute condition who responded with to corresponding group. The chi-squares compare these likelihoods, and the directionality d-scores quantify the directionality of the links. Higher d-scores indicate more positive, Group!Attribute directionality, and lower d-scores indicate more negative, Attribute! Group directionality.
doi:10.1371/journal.pone.0122292.t010
Heterogeneous Stereotype Directionality
PLOS ONE | DOI:10.1371/journal.pone.0122292 March 26, 2015 21 / 27

or her actions. Thus, Attribute! Group stereotypes can grant prejudice perpetrators “plausi-ble deniability” for their prejudice, freeing them from concerns about appearing prejudiced toothers [27]. Bidirectional stereotypes, lastly, bring in all of the above concerns, because they in-volve both Group! Attribute and Attribute! Group inferences. These bidirectional stereo-types may also be especially easy to reinforce and hard to change because the activation ofeither concept will bring to mind the other. This reciprocal activation potentially doubles theopportunities for the stereotype to be activated and reinforced.
Directionality may be especially important to take into account for stereotype change efforts.Most existing stereotype change methods focus on Group! Attribute stereotyping, which maybe sufficient for stereotypes that are themselves primarily Group! Attribute unidirectional.For a bidirectional stereotype like Black⇄ criminal, however, further considerations come intoplay. If an intervention changes Black! criminal associations or teaches people to inhibit orotherwise regulate Black! criminal inferences, it likely leaves untouched the criminal! Blackassociations and inferences. Even if people reject the notion that most Black people are crimi-nals, they may still think most criminals are Black. These remaining criminal! Black associa-tions can have important consequences in contexts where criminal is activated on its own, as inpolice lineups, jury deliberations [63] or split-second shooting decisions [64–65]. To be fully ef-fective, an intervention against a bidirectional stereotype may need to target both nodes (see also[29, 66]). Likewise, purely Group! Attribute interventions may be ineffective against stereo-types that are primarily Attribute! Group. If people are motivated to refrain from assumingthat gay men are feminine, that does not necessarily stop them from stereotyping feminine menas gay—and they may not even recognize the latter as stereotyping [28]. Full consideration of di-rectionality will focus theorists and researchers more directly on the best avenues for under-standing stereotype development, reinforcement, and change processes.
Implications for Measure Interpretation and ValidityConsideration of directionality leads one to think differently about how we interpret variousmeasures. Consider implicit reaction time measures, which are popular for the study of stereo-type activation. A sequential priming task, for example, is most commonly interpreted as mea-suring the Group! Attribute association/activation strength, because it can be set up in a waythat seems unidirectional at the level of a single trial (e.g., participants see the prime “Black”and respond to the target “athletic”). Consideration of directionality, however, may call thismeasure’s interpretation into question. Reaction time measures require many trials to get stableestimates of response latencies [67]. Because the first trial activates both of the concepts, bothconcepts are active in memory before the onset of subsequent trials. After the first trial, there-fore, it is unclear whether shorter response latencies arise from associations in one directionversus the other. Thus, the task as a whole is inherently bidirectional, even if a single trialseems unidirectional. Unless we could rely on a single trial or assume that activation complete-ly fades between trials, it seems to us that reaction time measures cannot cleanly assessunidirectional structure.
Because traditional models disregard directionality, current measures of associationstrength sometimes reflect the bidirectional association strength (i.e., Group! Attribute + At-tribute! Group associations, as in most reaction time measures) and sometimes reflect thepositively unidirectional association strength (i.e., Group! Attribute associations, as inthought-listing tasks). Depending on one’s experimental design and specific research question,using a bidirectional measure may pose no problem, or it may highly distort one’s assessmentof the target constructs and processes. To illustrate, suppose that a researcher uses sequentialpriming tasks to assess the relative strength of three stereotypic associations, A–B, A–C, and
Heterogeneous Stereotype Directionality
PLOS ONE | DOI:10.1371/journal.pone.0122292 March 26, 2015 22 / 27
A–D. Suppose A–B is strongly bidirectional, with A! B and B! A each having a weight of 5.Association A–C, however, is positively unidirectional, with A! C having a weight of 10, andno association from C to A. Lastly, A–D is negatively unidirectional, with no association fromA to D, but with D! A having a weight of 10. For each of these associations, the (bidirection-al) association strength, as measured by the priming task, would be 10. Following traditionalstereotyping models that disregard directionality, the researcher concludes that the socialgroup concept, A, brings B, C, and D to mind equally, because they possess equally strong asso-ciations with A, as measured by the bidirectional task. Our hypothetical researcher, then, de-signs a study in which participants respond to a person from social group A, with theprediction that attributes B, C, and D will have equally strong influences on the participant’sbehavior. This prediction, however, would be incorrect. Following A’s presentation, D shouldnot be activated at all, and C will be activated twice as strongly as B. Failing to consider direc-tionality has led our researcher astray, leaving him or her puzzled, unclear about why the pre-dictions were not borne out. It seems to us that careful consideration of directionality isabsolutely necessary for understanding the validity of one’s design, measures, findings, andconclusions.
Some Uses of the Publicly Available Data MatricesThe present work yielded several rich, versatile datasets exploring these stereotype networks.They can be used to create visual maps of the stereotype networks (as we did in this article’sstriking image, using [68]). In addition to exploring further intricacies of stereotype direction-ality, these data matrices can be used to assess many other research questions. Using our rawdata files, for example, one could assess whether our stimuli brought to mind other conceptswe did not include in our coding. By looking at the order of generated responses, one couldalso test more fine-grained hypotheses about spreading activation—perhaps, for example, par-ticipants in the gay condition only generate “fashionable” as a response after they generate“feminine,” implying that the path of activation may be gay! feminine! fashionable. Onecould also assess test similar conceptual mediation pathways across conditions—knowing, forinstance, how often participants in the Black condition responded with “poor” and how oftenparticipants in the poor condition responded with “criminal” gives one some indication of howBlackmay be indirectly connected to criminal through poor. Cluster and factor analyses of ourdata could reveal sets of attributes that tend to cluster within the stereotype network of a givengroup, giving one insights into different subtypes or partitions in the image of that group. Lastbut not least, our data matrices could be used to build actual connectionist neural networks formodeling many different stereotyping processes. We hope that these datasets will prove to beuseful resources for future research.
Our Connectionist-Informed ApproachMore precise commitments and attention to theoretical models of stereotypes and stereotypingwill fuel progress on many core issues of interest, including how stereotypes are activated, howthey function, how they can be changed, and how they relate to prejudice and discrimination[7]. Although social psychologists have given limited attention to connectionism [10], adoptingconnectionism as a theoretical foundation in the present work led to novel and important in-sights. The lack of attention to connectionism within social psychology likely arises from mis-takenly conflating common connectionistmethods with connectionist theories [10, 19]. Wesurmise that the computer simulation methods often used by connectionists seem distant fromthe social behavior typically of interest to social psychologists. Computer models, however, aremerely a method useful for testing connectionist theories of cognition [10, 19]. In our view, it is
Heterogeneous Stereotype Directionality
PLOS ONE | DOI:10.1371/journal.pone.0122292 March 26, 2015 23 / 27
not the methods of connectionism that must transfer to social psychological science—it is thetheoretical principles underlying connectionist approaches [15].
ConclusionJust as an engineer must learn about the underlying architecture of a bridge if he or she wantsto understand how it was built, how it works, and how to tear it down, so must a psychologistlearn about the underlying architecture of a stereotype if he or she wants to understand how itwas learned, how it is activated, and how to change it. Adopting a theory-driven approach tounderstanding stereotype structure led us to predict and subsequently find evidence for hetero-geneous stereotype directionality. We believe that consideration of stereotype directionality,and the cognitive mechanisms and structure of stereotypes more generally, will enable re-searchers and theorists to reap the benefits of greater theoretical clarity and make new scientificadvancements and discoveries in the study of stereotypes, stereotyping, and other intergroupphenomena.
Supporting InformationS1 File. Study Materials. This contains sample experimental materials for Studies 1, 3, and 4.(PDF)
S2 File. Study 1 Raw Participant Data and Coding. This SPSS file contains the raw partici-pant data from Study 1 and the coding for each participant’s responses.(SAV)
S3 File. All Data Matrices. This Excel file contains the compiled data matrices from Studies 1,3, and 4, showing all connections among all the concepts within each study.(XLSX)
S4 File. Study 3 Raw Participant Data and Coding. This SPSS file contains the raw partici-pant data from Study 3 and the coding for each participant’s responses.(SAV)
S5 File. Study 4 Raw Participant Data—Person Conditions. This Excel file contains the rawparticipant data from the “Person” conditions of Study 4.(XLSX)
S6 File. Study 4 Raw Participant Data—Woman Conditions. This Excel file contains the rawparticipant data from the “Woman” conditions of Study 4.(XLSX)
AcknowledgmentsWe thank Lyn Abramson, Janet Hyde, Paula Niedenthal, Mark Seidenberg, and Tim Rogersfor discussing this article and its ideas with us, as well as Carlie Allison, Chris Cox, Patrick For-scher, Kristina Kellett, Jessica Montag, and Magdalena Rychlowska. We also thank Mat Baker,Adam Beaupre, Andy Best, Matt Huston, Danielle Kindle, Kristen Merkitch, Daniel Mulligan,Megan Nelli, Matt Phillippi, Mark Resnick, Rebecca Segal, Claudia Seidenberg, and ShannonSmith for their contributions to data collection, coding, and the preparation of this paper.
Heterogeneous Stereotype Directionality
PLOS ONE | DOI:10.1371/journal.pone.0122292 March 26, 2015 24 / 27
Author ContributionsConceived and designed the experiments: WTLC. Performed the experiments: WTLC. Ana-lyzed the data: WTLC. Contributed reagents/materials/analysis tools: PGD. Wrote the paper:WTLC PGD. Discussed and developed theoretical rationale: WTLC PGD.
References1. Allport GW. The nature of prejudice. Reading, MA: Addison-Wesley; 1954
2. CoxWTL, Abramson LY, Devine PG, Hollon SD. Stereotypes, prejudice, and depression: The integrat-ed perspective. Perspect Psychol Sci, 2012; 7: 427–449.
3. Devine PG. Stereotypes and prejudice: Their automatic and controlled components. J Pers Soc Psy-chol, 1989; 56: 5–18.
4. Fiske ST. Stereotyping, prejudice, and discrimination. In: Gilbert T, and Fiske ST, editors. Handbook ofSocial Psychology 4th ed, Boston, MA: McGraw-Hill 1998; 2: 357–411.
5. Pratto F, Sidanius J, Stallworth LM, Malle BF. Social dominance orientation: A personality variable pre-dicting social and political attitudes. J Pers Soc Psychol, 1994; 67: 741–763.
6. Sue DW, Capodilupo CM, Torino GC, Bucceri JM, Holder AMB, Nadal KL, et al. Racial microaggres-sions in everyday life: Implications for clinical practice. Am Psychol, 2007; 62: 271–286. PMID:17516773
7. Hilton JL, von Hippel W. Stereotypes. Annu Rev Psychol, 1996; 47: 237–271. PMID: 15012482
8. Hamilton DL, Sherman JW. Stereotypes. In RSWyer, TK Srull, (Eds.) Handbook of social cognition.Hillsdale, NJ England: Lawrence Erlbaum Associates, Inc. 1994: 1–68.
9. Smith ER. What do connectionism and social psychology offer each other? J Pers Soc Psychol, 1996;70: 893–912. PMID: 8656338
10. Smith ER. Distributed connectionist models in social psychology. Soc Personal Psychol Compass,2009; 3: 64–76.
11. McClelland JL, Rogers TT. The parallel distributed processing approach to semantic cognition. Nat RevNeurosci, 2003; 4: 310–322. PMID: 12671647
12. McClelland JL, Botvinick MM, Noelle DC, Plaut DC, Rogers TT, Seidenberg MS, et al. Letting structureemerge: connectionist and dynamical systems approaches to cognition. Trends Cogn Sci, 2010; 14:348–356. doi: 10.1016/j.tics.2010.06.002 PMID: 20598626
13. Rogers TT, McClelland JL. Parallel distributed processing at 25: Further explorations in the microstruc-ture of cognition. Cogn Sci, 2014; 38: 1024–1077. doi: 10.1111/cogs.12148 PMID: 25087578
14. Freeman JB, Ambady N. A dynamic interactive theory of person construal. Psychol Rev, 2011;118.
15. Garcia-Marques L, Santos AC, Mackie DM. Stereotypes: Static abstractions or dynamic knowledgestructures? J Pers Soc Psychol, 2006; 91: 814–831. PMID: 17059303
16. Smith ER, DeCoster J. Knowledge acquisition, accessibility, and use in person perception and stereo-typing: Simulation with a recurrent connectionist network. J Pers Soc Psychol, 1998; 74: 21–35. PMID:9457773
17. Van Overwalle F. Social Connectionism. New York, NY: Psychology Press. 2007.
18. Van Rooy D, Van Overwalle F, Vanhoomissen T, Labiouse C, French R. A recurrent connectionistmodel of group biases. Psychol Rev, 2003; 110: 536–563. PMID: 12885114
19. Seidenberg MS. Connectionist models and cognitive theory. Psychol Sci, 1993; 4: 228–235.
20. Mandelbrot BB. The fractal geometry of nature. Vol. 173. Macmillan. 1983.
21. Mac Cormac E, Stamenov MI, Fractals of brain, fractals of mind: in search of a symmetry bond. Vol. 7.John Benjamins Publishing, 1996.
22. Katz D, Braly K. Racial stereotypes of one hundred college students. J Abnorm Soc Psychol, 1993; 28:280–290.
23. Brewer M. A dual-process model of impression formation. In: Srull T &Wyer R, editors. Advances in so-cial cognition. Hillsdale N.J.: Erlbaum Associates. 1988: 1–36.
24. Fiske ST, Neuberg SL. A continuum of impression formation, from category-based to individuating pro-cesses: Influences of information and motivation on attention and interpretation. In: Zanna MP, editor.Advances in Experimental Social Psychology, Volume 23. San Diego, CA: Academic Press. 1990:1–74.
25. Blair IV, Judd CM, Sadler MS, Jenkins C. The role of Afrocentric features in person perception: Judgingby features and categories. J Pers Soc Psychol, 2002; 83: 5–25. PMID: 12088132
Heterogeneous Stereotype Directionality
PLOS ONE | DOI:10.1371/journal.pone.0122292 March 26, 2015 25 / 27
26. Bodenhausen GV, Macrae CN. Stereotype activation and inhibition. In: Wyer RS &Wyer RS, editors.Stereotype activation and inhibition: Advances in social cognition. Vol. 11. Psychology Press, 2013.
27. CoxWTL, Devine PG. Stereotyping to infer group membership creates plausible deniability for preju-dice-based aggression. Psychol Sci, 2014; 25: 340–348. doi: 10.1177/0956797613501171 PMID:24335602
28. CoxWTL, Devine PG, Bischmann AA, Hyde JS. Inferences about sexual orientation: The role of stereo-types, faces, and the gaydar myth. J Sex Res, 2015: in press.
29. Eberhardt JL, Goff PA, Purdie-Vaughns VJ, Davies PG. Seeing black: Race, crime, and visual process-ing. J Pers Soc Psychol, 2004; 87: 876–893. PMID: 15598112
30. Kawakami K, Dovidio J, Moll J, Hermsen S, Russin A. Just say no (to stereotyping): Effects of trainingin the negation of stereotypic associations on stereotype activation. J Pers Soc Psychol, 2000; 78:871–888. PMID: 10821195
31. Dotsch R, Wigboldus DHJ, van Knippenberg A. Biased allocation of faces to social categories. J PersSoc Psychol, 2011; 100: 999–1014. doi: 10.1037/a0023026 PMID: 21443368
32. Hugenberg K, Bodenhausen GV. Ambiguity in social categorization: the role of prejudice and facial af-fect in race categorization. Psychol Sci, 2004; 15: 342–345. PMID: 15102145
33. Johnson KL, Gill S, Reichman V, Tassinary LG. Swagger, sway, and sexuality: Judging sexual orienta-tion from body motion and morphology. J Pers Soc Psychol, 2007; 93: 321–334. PMID: 17723051
34. Hebb DO. The organization of behavior: A neuropsychological approach. New York: Wiley. 1949.
35. Tversky A. Features of similarity. Psychol Rev, 1977; 84: 327–352.
36. Cobos PL, López FJ, Caño A, Almaraz J, Shanks DR. Mechanisms of predictive and diagnostic causalinduction. J Exp Psychol Anim Behav Process, 2002; 28: 331–346. PMID: 12395491
37. Fernbach PM, Darlow A, Sloman SA. Asymmetries in Predictive and Diagnostic Reasoning. J Exp Psy-chol Gen, 2011; 140: 168–185. doi: 10.1037/a0022100 PMID: 21219081
38. Waldmann MR, Holyoak KJ. Predictive and Diagnostic LearningWithin Causal Models: Asymmetriesin Cue Competition. J Exp Psychol Gen, 1992; 121: 222–236. PMID: 1534834
39. GravesWW, Binder JR, Seidenberg MS. Noun-noun combination: Meaningfulness ratings and lexicalstatistics for 2160 word pairs. Behav Res Methods, 2013; 45: 463–469. doi: 10.3758/s13428-012-0256-3 PMID: 23055162
40. Seidenberg MS, MacDonald MC, Saffran JR. Does grammar start where statistics stop? Science,2002; 298: 553–554. PMID: 12386323
41. Lionello-DeNolf KM. The search for symmetry: 25 years in review. Learn Behav, 2009; 37: 188–203.doi: 10.3758/LB.37.2.188 PMID: 19380896
42. Dentico D, Cheung BL, Chang JY, Guokas J, Boly M, Tononi G, et al. Reversal of cortical informationflow during visual imagery as compared to visual perception. Neuroimage; 2014.
43. Bi GQ, Poo MM. Synaptic modification by correlated activity: Hebb's postulate revisited. Annu Rev Neu-rosci, 2001; 24: 139–166. PMID: 11283308
44. Hinton GE, Salakhutdinov RR. Reducing the dimensionality of data with neural networks. Science,2006; 313(5786): 504–507. PMID: 16873662
45. Movellan JR, McClelland JL. Learning continuous probability distributions with symmetric diffusion net-works. Cogn Sci, 1993; 17: 463–496.
46. Cacioppo JT, von Hippel W, Ernst JM. Mapping cognitive structures and processes through verbal con-tent: The thought-listing technique. J Consult Clin Psychol, 1997; 65: 928–940. PMID: 9420354
47. Jack AI, Roepstorff A. Introspection and cognitive brain mapping: from stimulus—response to script—report. Trends Cogn Sci, 2002; 6: 333–339. PMID: 12140083
48. McRae K, Cree GS, Seidenberg MS, McNorgan C. Semantic feature production norms for a large set ofliving and nonliving things. Behav Res Methods, 2005; 37: 547–559. PMID: 16629288
49. Preece PE. Mapping cognitive structure: A comparison of methods. J Educ Psychol, 1976; 68: 1–8.
50. Matthews C, Hill C. Gay until proven straight: Perceptions of male interior designers frommale practi-tioner and student perspectives. J Interior Design, 2011; 36: 15–34.
51. Shelp SG. Gaydar: Visual detection of sexual orientation among gay and straight men. J Homosex,2002; 44: 1–14. PMID: 12971596
52. Gaertner SL, Dovidio JF. The aversive form of racism. In: Dovidio JF & Gaertner SLm editors. Preju-dice, discrimination, and racism. Orlando, FL: Academic Press. 1986: 61–89.
53. Devine PG, Elliot AJ. Are racial stereotypes really fading? The Princeton trilogy revisited. Pers Soc Psy-chol Bull, 1995; 21: 1139–1150.
Heterogeneous Stereotype Directionality
PLOS ONE | DOI:10.1371/journal.pone.0122292 March 26, 2015 26 / 27
54. Kite ME, Deaux K. Gender belief systems: Homosexuality and the implicit inversion theory. PsycholWomen Q, 1987; 11: 83–96.
55. GraphPad QuickCalcs. Available: http://graphpad.com/quickcalcs/contingency1.cfm. Accessed 2014Dec 13.
56. Wilson DB. Practical meta-analysis effect size calculator. 2001. Available: http://www.campbellcollaboration.org/resources/effect_size_input.php. Accessed 2014 Dec 13.
57. Lipsey MW,Wilson DB. Practical meta-analysis. Vol. 49. Thousand Oaks, CA: Sage publications,2001.
58. Borenstein M, Hedges LV, Higgins JPT, Rothstein HR. Introduction to Meta-Analysis. JohnWiley &Sons, Ltd, Chichester, UK. 2009.
59. Russo V. The celluloid closet: Homosexuality in the movies. New York: Arbor House Publishing. 1987.
60. Johnson A. 'Coastie' song, video spark debate at UW. Journal Sentinel. 2009, December 19.
61. Devine PG, Sherman S. Intuitive Versus Rational Judgment and the Role of Stereotyping in the HumanCondition: Kirk or Spock? Psychol Inq, 1992.
62. Rothbart M, Taylor M. Category labels and social reality: Do we view social categories as naturalkinds? In: Semin GR & Fiedler K, editors. Language, interaction and social cognition. Thousand Oaks:Sage Publications, Inc. 1992: 11–36.
63. Bodenhausen GV. Stereotypic biases in social decision making and memory: Testing process modelsof stereotype use. J Pers Soc Psychol, 1988; 55: 726–737. PMID: 3210142
64. CoxWTL, Devine PG, Plant EA, Schwartz LL. Toward a comprehensive understanding of officers’shooting decisions: No simple answers to this complex problem. Basic Appl Soc Psych, 2014; 36:356–364.
65. Plant E, Peruche B, Butz DA. Eliminating automatic racial bias: Making race non-diagnostic for re-sponses to criminal suspects. J Exp Soc Psychol, 2005; 41: 141–156.
66. Eagly AH, Karau SJ. Role congruity theory of prejudice toward female leaders. Psychol Rev, 2002;109: 573–598. PMID: 12088246
67. Bargh JA, Chartrand TL. The mind in the middle. Handbook of research methods in social and person-ality psychology, 2000: 253–285.
68. Smith M, Milic-Frayling N, Shneiderman B, Mendes Rodrigues E, Leskovec J, Dunne C. NodeXL: afree and open network overview, discovery and exploration add-in for Excel 2007/2010. http://nodexl.codeplex.com/ from the Social Media Research Foundation. Available: http://www.smrfoundation.org.2010. Accessed 2014 Dec 13.
Heterogeneous Stereotype Directionality
PLOS ONE | DOI:10.1371/journal.pone.0122292 March 26, 2015 27 / 27
Related Documents