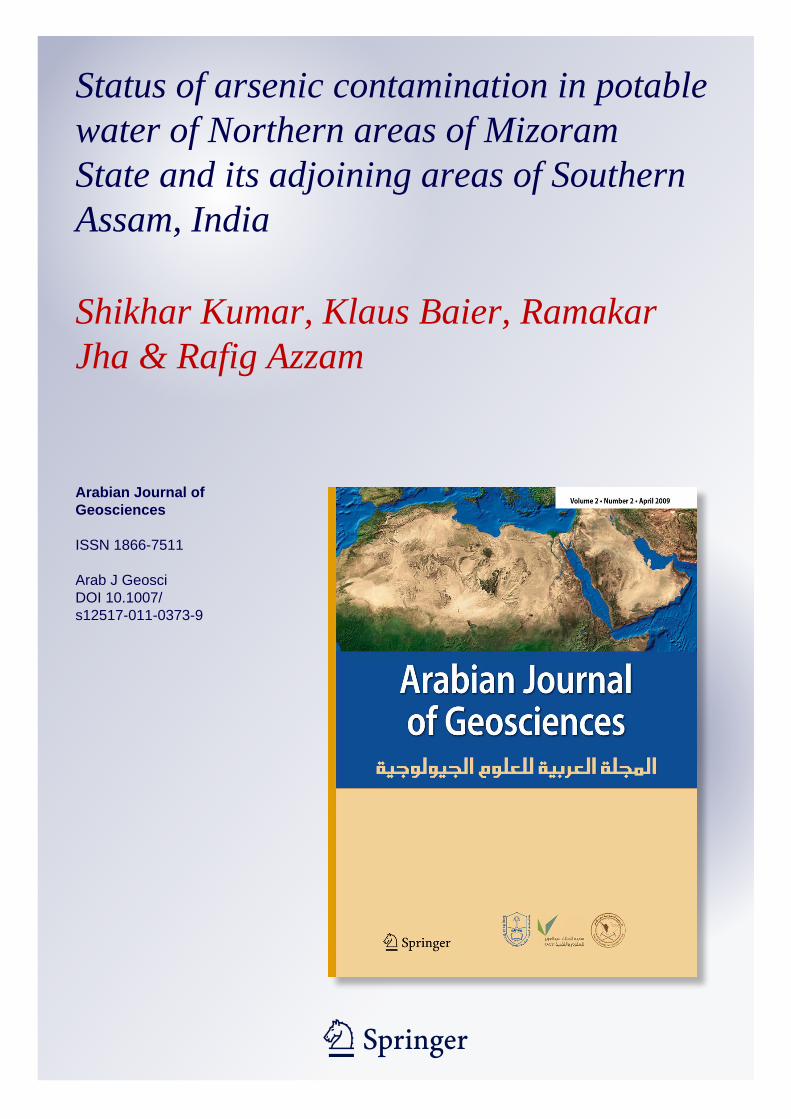
1 23 Arabian Journal of Geosciences ISSN 1866-7511 Arab J Geosci DOI 10.1007/ s12517-011-0373-9 Status of arsenic contamination in potable water of Northern areas of Mizoram State and its adjoining areas of Southern Assam, India Shikhar Kumar, Klaus Baier, Ramakar Jha & Rafig Azzam

Welcome message from author
This document is posted to help you gain knowledge. Please leave a comment to let me know what you think about it! Share it to your friends and learn new things together.
Transcript
1 23
Arabian Journal ofGeosciences ISSN 1866-7511 Arab J GeosciDOI 10.1007/s12517-011-0373-9
Status of arsenic contamination in potablewater of Northern areas of MizoramState and its adjoining areas of SouthernAssam, India
Shikhar Kumar, Klaus Baier, RamakarJha & Rafig Azzam

1 23
Your article is protected by copyright and all
rights are held exclusively by Saudi Society
for Geosciences. This e-offprint is for personal
use only and shall not be self-archived in
electronic repositories. If you wish to self-
archive your work, please use the accepted
author’s version for posting to your own
website or your institution’s repository. You
may further deposit the accepted author’s
version on a funder’s repository at a funder’s
request, provided it is not made publicly
available until 12 months after publication.
ORIGINAL PAPER
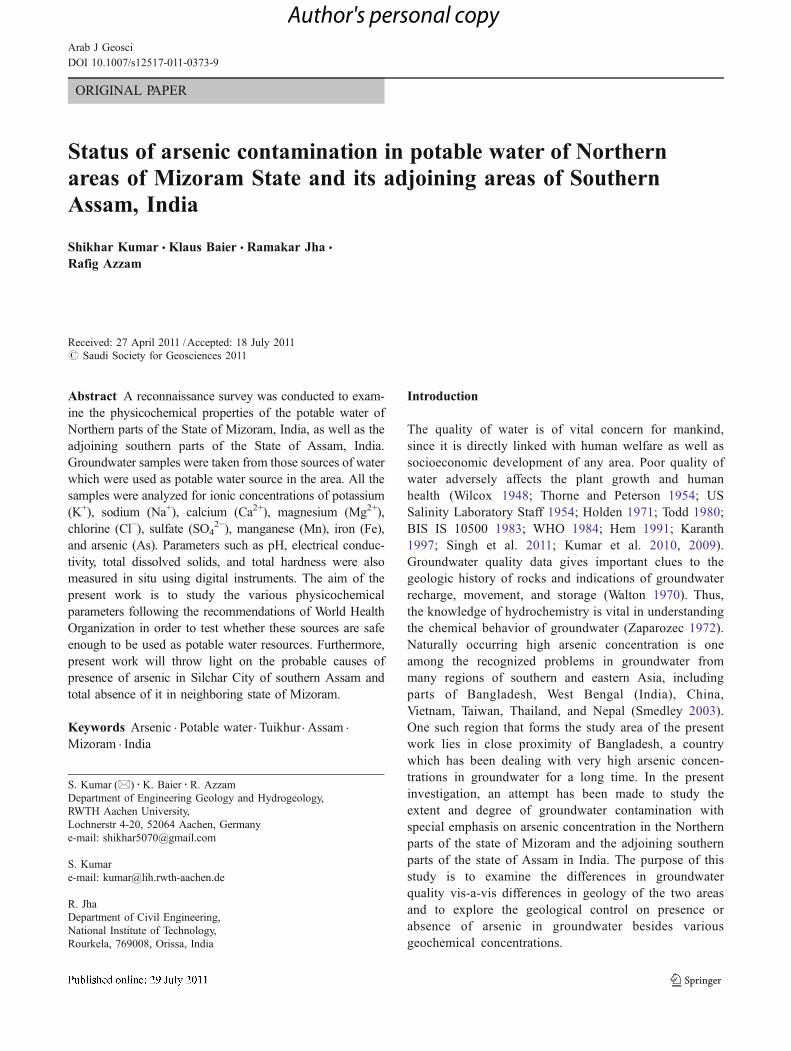
Status of arsenic contamination in potable water of Northernareas of Mizoram State and its adjoining areas of SouthernAssam, India
Shikhar Kumar & Klaus Baier & Ramakar Jha &
Rafig Azzam
Received: 27 April 2011 /Accepted: 18 July 2011# Saudi Society for Geosciences 2011
Abstract A reconnaissance survey was conducted to exam-ine the physicochemical properties of the potable water ofNorthern parts of the State of Mizoram, India, as well as theadjoining southern parts of the State of Assam, India.Groundwater samples were taken from those sources of waterwhich were used as potable water source in the area. All thesamples were analyzed for ionic concentrations of potassium(K+), sodium (Na+), calcium (Ca2+), magnesium (Mg2+),chlorine (Cl−), sulfate (SO4
2−), manganese (Mn), iron (Fe),and arsenic (As). Parameters such as pH, electrical conduc-tivity, total dissolved solids, and total hardness were alsomeasured in situ using digital instruments. The aim of thepresent work is to study the various physicochemicalparameters following the recommendations of World HealthOrganization in order to test whether these sources are safeenough to be used as potable water resources. Furthermore,present work will throw light on the probable causes ofpresence of arsenic in Silchar City of southern Assam andtotal absence of it in neighboring state of Mizoram.
Keywords Arsenic . Potable water. Tuikhur. Assam .
Mizoram . India
Introduction
The quality of water is of vital concern for mankind,since it is directly linked with human welfare as well associoeconomic development of any area. Poor quality ofwater adversely affects the plant growth and humanhealth (Wilcox 1948; Thorne and Peterson 1954; USSalinity Laboratory Staff 1954; Holden 1971; Todd 1980;BIS IS 10500 1983; WHO 1984; Hem 1991; Karanth1997; Singh et al. 2011; Kumar et al. 2010, 2009).Groundwater quality data gives important clues to thegeologic history of rocks and indications of groundwaterrecharge, movement, and storage (Walton 1970). Thus,the knowledge of hydrochemistry is vital in understandingthe chemical behavior of groundwater (Zaparozec 1972).Naturally occurring high arsenic concentration is oneamong the recognized problems in groundwater frommany regions of southern and eastern Asia, includingparts of Bangladesh, West Bengal (India), China,Vietnam, Taiwan, Thailand, and Nepal (Smedley 2003).One such region that forms the study area of the presentwork lies in close proximity of Bangladesh, a countrywhich has been dealing with very high arsenic concen-trations in groundwater for a long time. In the presentinvestigation, an attempt has been made to study theextent and degree of groundwater contamination withspecial emphasis on arsenic concentration in the Northernparts of the state of Mizoram and the adjoining southernparts of the state of Assam in India. The purpose of thisstudy is to examine the differences in groundwaterquality vis-a-vis differences in geology of the two areasand to explore the geological control on presence orabsence of arsenic in groundwater besides variousgeochemical concentrations.
S. Kumar (*) :K. Baier : R. AzzamDepartment of Engineering Geology and Hydrogeology,RWTH Aachen University,Lochnerstr 4-20, 52064 Aachen, Germanye-mail: [email protected]
S. Kumare-mail: [email protected]
R. JhaDepartment of Civil Engineering,National Institute of Technology,Rourkela, 769008( Orissa, India
Arab J GeosciDOI 10.1007/s12517-011-0373-9
Author's personal copy
Study area
The state of Mizoram is one among the seven sister statesof Northeastern India. It is bounded on the north by thestates of Assam and Manipur, on the east and south by ChinHills of Myanmar, and on the west by Chittagong HillTracts of Bangladesh and the state of Tripura. It covers anarea of 21,087 km2. It is situated on a hilly terrain andlocated between latitudes 21°57′ N and 24°32′ N andlongitudes 92°16′ E and 93°25′ E. Mizoram is quiteurbanized state with 49.50% of population living in urbanareas, in contrast to the state of Assam, with a value of12.72% of urban population (2001 census). Mizoram comesunder the influence of monsoon, and the maximum rain isexperienced between May and September. It has annualrainfall of 217.5 cm.
The general geology represented by a repetitive succes-sion of Neogene arenaceous and argillaceous sedimentswhich were later thrown into a series of approximately N–Strending longitudinal plunging anticlines and synclinesimpart a characteristic topographic expression to the studyarea. The arenaceous and argillaceous groups of rocksoccur in relatively higher and lower grounds, respectively.
Assam is the largest state in Northeast India covering anarea of 78,523 km2. Located at the gateway of NortheastIndia, Assam is separated by Bangladesh from mainstreamIndia. The state is bounded in the north by ArunachalPradesh and Bhutan, in the east by Nagaland, Manipur, andBurma, in the south by Bangladesh, Tripura, and Mizoram,and in the west by West Bengal. The present work has beenperformed only in the southern most districts of Assam viz.Cachar, Hailakandi, and Karimganj, which are just adjacentto Mizoram state.
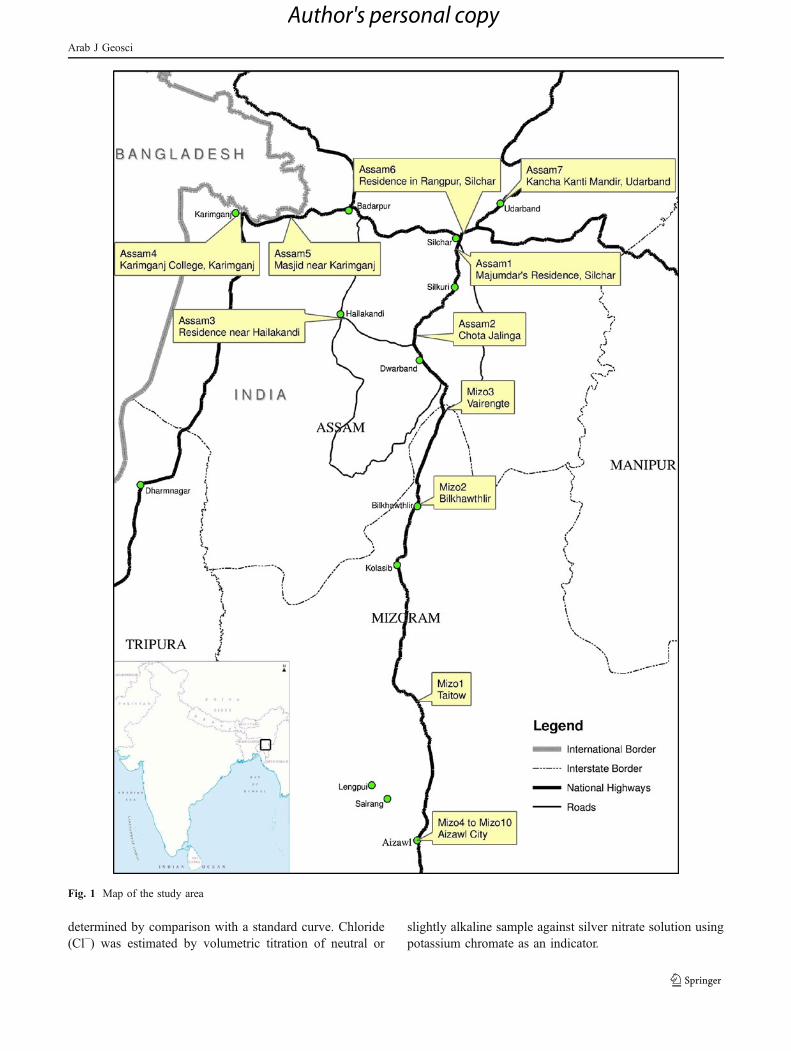
Lying to the north of the Tropic of Cancer and boundedby high hill ranges in the north, east, and south, Assamexperiences the predominant influence of the southwesttropical monsoon which reigns from April to October withoccasional winter showers. The annual average rainfall ofthe state varies with extraordinary rapidity between 160 and430 cm from place to place; the average for the state as awhole is about 290 cm with the maximum precipitationduring June and July. Map of the study area and thelocations of the various stations is shown in Fig. 1.
Geology of area under study comprises of Upper Bhubanformation in Mizoram and of Tipam and Bokabil forma-tions in studied districts of Assam. In Upper Bhuban unit ofBhuban formation, arenaceous rocks predominate withsandstone, shale, and siltstone. The contacts remaingradational type as in case of lower and middle Bhubanunits (Ganju 1975). In the northern part of Mizoram wherethe potable water was analyzed, the sandstones–shaleintercalations dominate viz. Taitow, Bilkhawthlir, Vairengte.On the other hand, Bokabil formation rocks are forming the
aquifer at Dwarband village in Hailakandi district. Itborders northwestern boundary of Mizoram. Hailakandi,Karimganj, and Silchar form a part of Surma Valley ofCachar in Southern Assam.
Materials and methods
Field work
A survey was carried out in February 2010, and ground-water samples were collected. Water samples were collectedin clean polythene bottles, washed with distilled water, andagain rinsed with representative water samples. Two bottlesof 250 ml for each location, one acidified with 2 ml HNO3,and one non-acidified were collected.
Laboratory work
The physical parameters of the water sources like pH, totaldissolved solids (TDS) and electroconductivity (EC) weremeasured in the field. Digital instruments made by “EutechInstruments” (www.eutechinst.com) were used to test the insitu values of pH, TDS, and EC. Total hardness (TH) wasmeasured using the water testing kit made by “TranschemAgritech Limited” (www.transchemagritech.com). Using anArsenic Test Kit made by “Merckoquant Chemicals,Germany” (www.merck-chemicals.com), a qualitative anal-ysis of the water samples was done in the field to determinethe presence or absence of Arsenic. When Zinc powder, asolid acid, and—for the elimination of interfering sulfideions—an oxidizing agent are added to compounds ofarsenic (III) and arsenic (V), arsenic hydride is liberated,which in turn react with mercury (II) bromide contained in thereaction zone of the test strip to form yellow-brown mixedarsenic–mercury halogenides. The concentration of arsenic(III) and arsenic (V) are measured semi-quantitatively byvisual comparison of the reaction zone of the test strip with thefields of a color scale. Measuring range of the kit or the color-scale graduation is given below:
0:005� 0:01� 0:025� 0:05� 0:1� 0:25� 0:5mg=l As
The hardness of the samples and the calcium ion (Ca2+)concentration was measured by the EDTA titrimetricmethod. Magnesium ions (Mg2+) were calculated from theTH obtained by the EDTA titrimetric method and thecalcium ions estimated by the EDTA titration. Estimation ofsulfate ions (SO4
2−) was done by turbidimetric method.Sulfate ions are precipitated in a hydrochloric acid mediumwith barium chloride in such a manner so as to form bariumsulfate. The absorbance of sulfate suspension is measuredby spectrophotometer, and sulfate ion concentration is
Arab J Geosci
Author's personal copy
determined by comparison with a standard curve. Chloride(Cl−) was estimated by volumetric titration of neutral or
slightly alkaline sample against silver nitrate solution usingpotassium chromate as an indicator.
Fig. 1 Map of the study area
Arab J Geosci
Author's personal copy
All the metals and heavy metals were measured onICP-AES. In principle, the method is capable ofmeasuring most elements in the periodic table with lowdetection limits and good precision over several orders ofmagnitude. Elements are measured simultaneously and acomplete analysis can be made in the space of about2 min, making it an extremely rapid analytical method.The time lag between the collection of the water sampleand analysis was 10 days.
Results
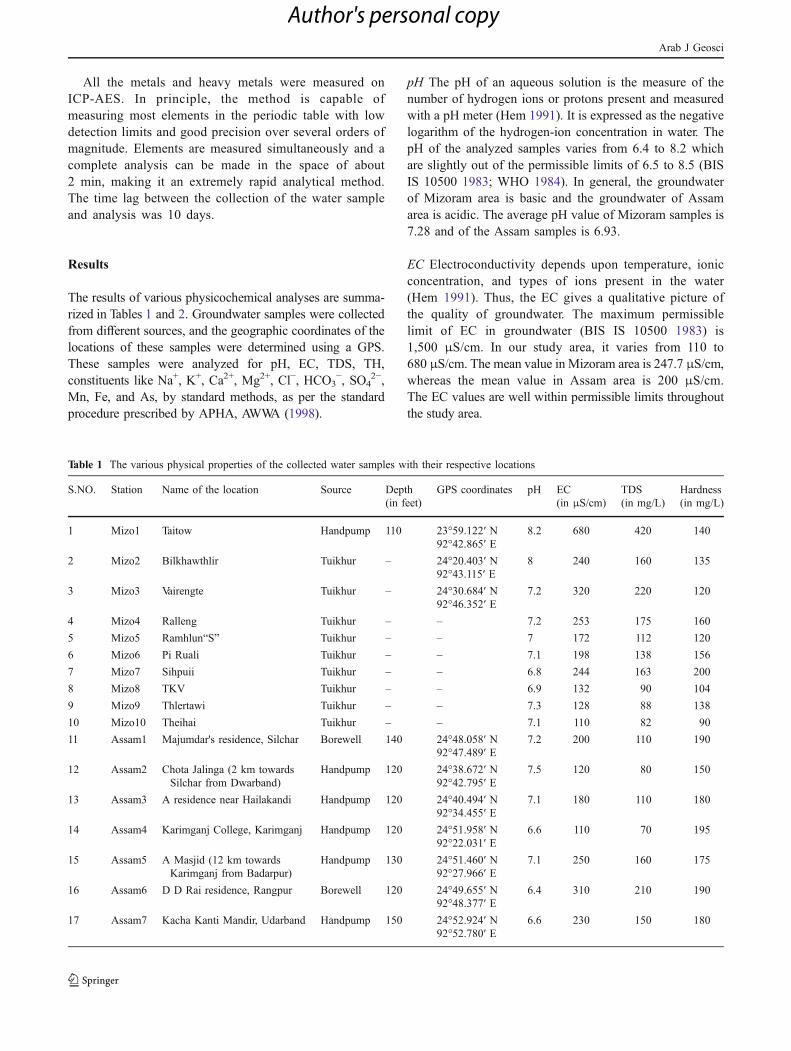
The results of various physicochemical analyses are summa-rized in Tables 1 and 2. Groundwater samples were collectedfrom different sources, and the geographic coordinates of thelocations of these samples were determined using a GPS.These samples were analyzed for pH, EC, TDS, TH,constituents like Na+, K+, Ca2+, Mg2+, Cl−, HCO3
−, SO42−,
Mn, Fe, and As, by standard methods, as per the standardprocedure prescribed by APHA, AWWA (1998).
pH The pH of an aqueous solution is the measure of thenumber of hydrogen ions or protons present and measuredwith a pH meter (Hem 1991). It is expressed as the negativelogarithm of the hydrogen-ion concentration in water. ThepH of the analyzed samples varies from 6.4 to 8.2 whichare slightly out of the permissible limits of 6.5 to 8.5 (BISIS 10500 1983; WHO 1984). In general, the groundwaterof Mizoram area is basic and the groundwater of Assamarea is acidic. The average pH value of Mizoram samples is7.28 and of the Assam samples is 6.93.
EC Electroconductivity depends upon temperature, ionicconcentration, and types of ions present in the water(Hem 1991). Thus, the EC gives a qualitative picture ofthe quality of groundwater. The maximum permissiblelimit of EC in groundwater (BIS IS 10500 1983) is1,500 μS/cm. In our study area, it varies from 110 to680 μS/cm. The mean value in Mizoram area is 247.7 μS/cm,whereas the mean value in Assam area is 200 μS/cm.The EC values are well within permissible limits throughoutthe study area.
Table 1 The various physical properties of the collected water samples with their respective locations
S.NO. Station Name of the location Source Depth(in feet)
GPS coordinates pH EC(in μS/cm)
TDS(in mg/L)
Hardness(in mg/L)
1 Mizo1 Taitow Handpump 110 23°59.122′ N 8.2 680 420 14092°42.865′ E
2 Mizo2 Bilkhawthlir Tuikhur – 24°20.403′ N 8 240 160 13592°43.115′ E
3 Mizo3 Vairengte Tuikhur – 24°30.684′ N 7.2 320 220 12092°46.352′ E
4 Mizo4 Ralleng Tuikhur – – 7.2 253 175 160
5 Mizo5 Ramhlun“S” Tuikhur – – 7 172 112 120
6 Mizo6 Pi Ruali Tuikhur – – 7.1 198 138 156
7 Mizo7 Sihpuii Tuikhur – – 6.8 244 163 200
8 Mizo8 TKV Tuikhur – – 6.9 132 90 104
9 Mizo9 Thlertawi Tuikhur – – 7.3 128 88 138
10 Mizo10 Theihai Tuikhur – – 7.1 110 82 90
11 Assam1 Majumdar's residence, Silchar Borewell 140 24°48.058′ N 7.2 200 110 19092°47.489′ E
12 Assam2 Chota Jalinga (2 km towardsSilchar from Dwarband)
Handpump 120 24°38.672′ N 7.5 120 80 15092°42.795′ E
13 Assam3 A residence near Hailakandi Handpump 120 24°40.494′ N 7.1 180 110 18092°34.455′ E
14 Assam4 Karimganj College, Karimganj Handpump 120 24°51.958′ N 6.6 110 70 19592°22.031′ E
15 Assam5 A Masjid (12 km towardsKarimganj from Badarpur)
Handpump 130 24°51.460′ N 7.1 250 160 17592°27.966′ E
16 Assam6 D D Rai residence, Rangpur Borewell 120 24°49.655′ N 6.4 310 210 19092°48.377′ E
17 Assam7 Kacha Kanti Mandir, Udarband Handpump 150 24°52.924′ N 6.6 230 150 18092°52.780′ E
Arab J Geosci
Author's personal copy
TDS The weight of the residue consisting of pollutants(dissolved ions) left behind after all the water from a watersample is evaporated is a measure of the TDS and reflects thegeneral nature of the groundwater quality and extent ofcontamination (Annon 1946; Robinnove et al. 1958; Davisand de Wiest 1966; AWWA 1971). The BIS permissible limit(BIS IS 10500 1983) for TDS is about 500 mg/l, whereas theWHO permissible limit (WHO 1984) is 1,000 mg/l. Ingeneral, TDS values of <1,000 mg/l are considered asfreshwater and values of >1,000 mg/l are considered brackish.The TDS values in our study vary from 82 to 420 mg/l. Themean value in Mizoram area comes to 164.8 mg/l, whereas inAssam area, it comes to 127.14 mg/l. All the samples werewithin permissible limits of TDS values.
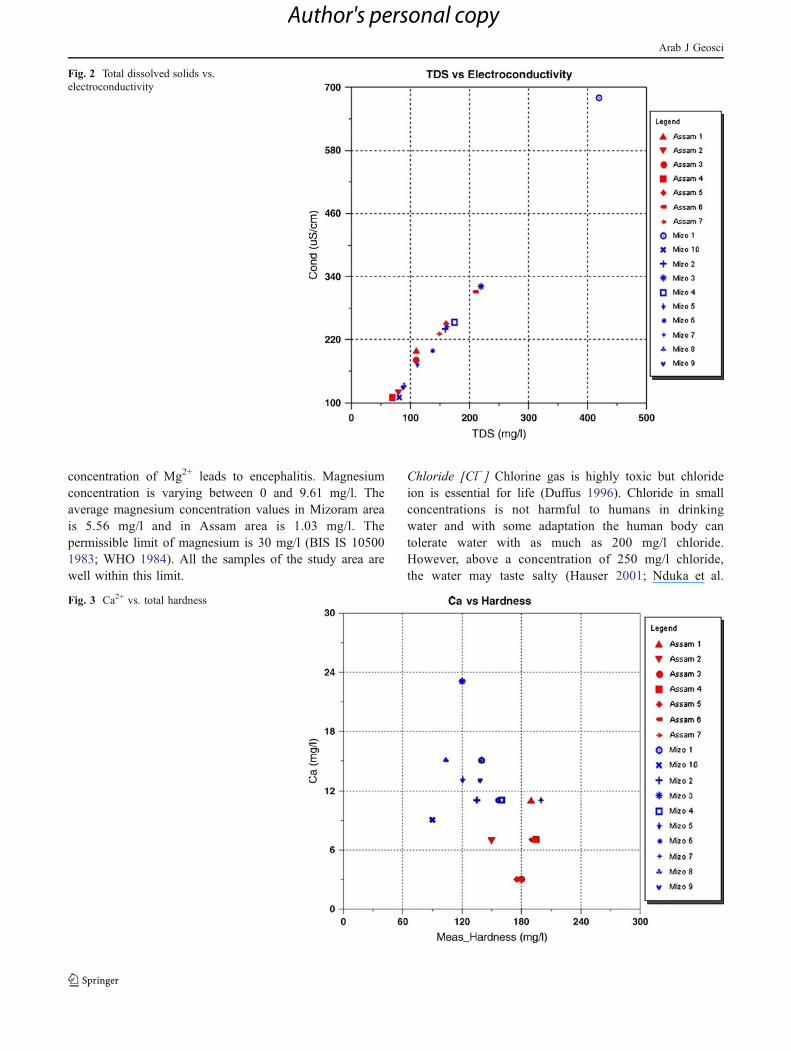
Hardness TH, an important property indicating the quality ofgroundwater is mainly caused by calcium and magnesiumcations and is defined as the sum of their concentrationsexpressed in milligrams per liter. Basically, it is the soap-consuming property of water (Fletcher 1986). The desirablelimit for TH is up to 200 mg/l, but it is acceptable up to600 mg/l (BIS IS 10500 1983). The actual values observed inthe samples of the study area were found to vary from 90 to200 mg/l. The mean value in Mizoram area was found to be136.3 mg/l, and in Assam area, it was found to be 180 mg/l.All the samples were well within the acceptable limits.
Sodium [Na+] The primary source of sodium in naturalwater is the soluble products released during the weathering
of plagioclase feldspars. The sodium concentration of thestudy area varies from 1.14 to 14.55 mg/l. All the valueswere well below the WHO limit of 200 mg/l for domesticuse (WHO 1984).
Potassium [K+] Ionic potassium occurs at fairly lowconcentrations in groundwater (Sravanthi and Sudarshan1998) and is derived from weathering of the mostly stableorthoclase, microcline feldspars, and biotite mineralspresent in the granites (Satish Kumar et al. 2007). However,excessive fertilizer usage can increase its concentration insurface as well as groundwater. The potassium concen-trations of the study area are varying from 1.14 to157.61 mg/l. The potassium concentrations are low for allthe samples except for oneMizoram sample (Mizo1). Averagepotassium values for Assam samples is 16.8 mg/l and forMizoram samples is 19.8 mg/l.
Calcium [Ca2+] The calcium concentration of the area isvarying from 7.94 to 23.81 mg/l. The Mizoram averagevalue is 13.91 mg/l and Assam average value is 6.8 mg/l.While the permissible limit of calcium concentration isabout 75 mg/l (BIS IS 10500 1983; WHO 1984), concen-trations of over 200 mg/l are considered excessive. In thestudy area, all samples have calcium concentrations wellbelow the permissible limit.
Magnesium [Mg2+] Magnesium also is one of the abundantelements in rocks. It causes hardness in water. High
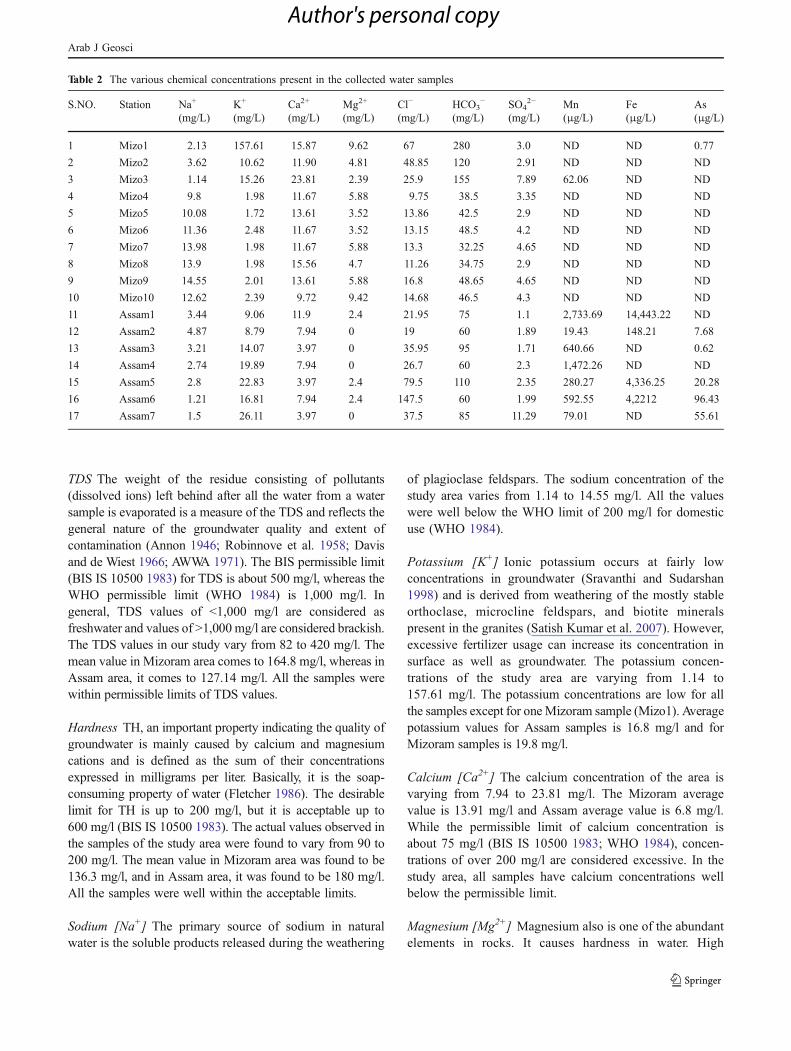
Table 2 The various chemical concentrations present in the collected water samples
S.NO. Station Na+
(mg/L)K+
(mg/L)Ca2+
(mg/L)Mg2+
(mg/L)Cl−
(mg/L)HCO3
−
(mg/L)SO4
2−
(mg/L)Mn(μg/L)
Fe(μg/L)
As(μg/L)
1 Mizo1 2.13 157.61 15.87 9.62 67 280 3.0 ND ND 0.77
2 Mizo2 3.62 10.62 11.90 4.81 48.85 120 2.91 ND ND ND
3 Mizo3 1.14 15.26 23.81 2.39 25.9 155 7.89 62.06 ND ND
4 Mizo4 9.8 1.98 11.67 5.88 9.75 38.5 3.35 ND ND ND
5 Mizo5 10.08 1.72 13.61 3.52 13.86 42.5 2.9 ND ND ND
6 Mizo6 11.36 2.48 11.67 3.52 13.15 48.5 4.2 ND ND ND
7 Mizo7 13.98 1.98 11.67 5.88 13.3 32.25 4.65 ND ND ND
8 Mizo8 13.9 1.98 15.56 4.7 11.26 34.75 2.9 ND ND ND
9 Mizo9 14.55 2.01 13.61 5.88 16.8 48.65 4.65 ND ND ND
10 Mizo10 12.62 2.39 9.72 9.42 14.68 46.5 4.3 ND ND ND
11 Assam1 3.44 9.06 11.9 2.4 21.95 75 1.1 2,733.69 14,443.22 ND
12 Assam2 4.87 8.79 7.94 0 19 60 1.89 19.43 148.21 7.68
13 Assam3 3.21 14.07 3.97 0 35.95 95 1.71 640.66 ND 0.62
14 Assam4 2.74 19.89 7.94 0 26.7 60 2.3 1,472.26 ND ND
15 Assam5 2.8 22.83 3.97 2.4 79.5 110 2.35 280.27 4,336.25 20.28
16 Assam6 1.21 16.81 7.94 2.4 147.5 60 1.99 592.55 4,2212 96.43
17 Assam7 1.5 26.11 3.97 0 37.5 85 11.29 79.01 ND 55.61
Arab J Geosci
Author's personal copy
concentration of Mg2+ leads to encephalitis. Magnesiumconcentration is varying between 0 and 9.61 mg/l. Theaverage magnesium concentration values in Mizoram areais 5.56 mg/l and in Assam area is 1.03 mg/l. Thepermissible limit of magnesium is 30 mg/l (BIS IS 105001983; WHO 1984). All the samples of the study area arewell within this limit.
Chloride [Cl−] Chlorine gas is highly toxic but chlorideion is essential for life (Duffus 1996). Chloride in smallconcentrations is not harmful to humans in drinkingwater and with some adaptation the human body cantolerate water with as much as 200 mg/l chloride.However, above a concentration of 250 mg/l chloride,the water may taste salty (Hauser 2001; Nduka et al.
Fig. 2 Total dissolved solids vs.electroconductivity
Fig. 3 Ca2+ vs. total hardness
Arab J Geosci
Author's personal copy
2008). Chloride concentrations of the groundwater sam-ples in the study area are varying from 9.75 to 147.5 mg/l.The Mizoram average for chloride concentration is23.46 mg/l and of Assam area is 52.59 mg/l. The WHOlimit for chloride in groundwater is 250 mg/l (WHO1984). BIS has desirable limit of 250 mg/l, but themaximum permissible limit in the absence of alternatesource is 1,000 mg/l (BIS IS 10500 1983). All our samplesare well under these limits.
Bicarbonate [HCO3−] The bicarbonate concentration val-ues in the study area vary from 32.25 to 280 mg/l. Theaverage value in Mizoram area is 84.67 mg/l and in Assamarea is 77.86 mg/l. Bicarbonates, carbonates, and hydrox-ides cause alkalinity in natural water. Alkalinity of a watersample is a measure of its capacity to neutralize acids. TheWHO limit for alkalinity in water is 120 to 250 mg/l (WHO1984). The BIS limit is 200 mg/l (BIS IS 10500 1983). Inthe study area, there is one sample (Mizo1) which has
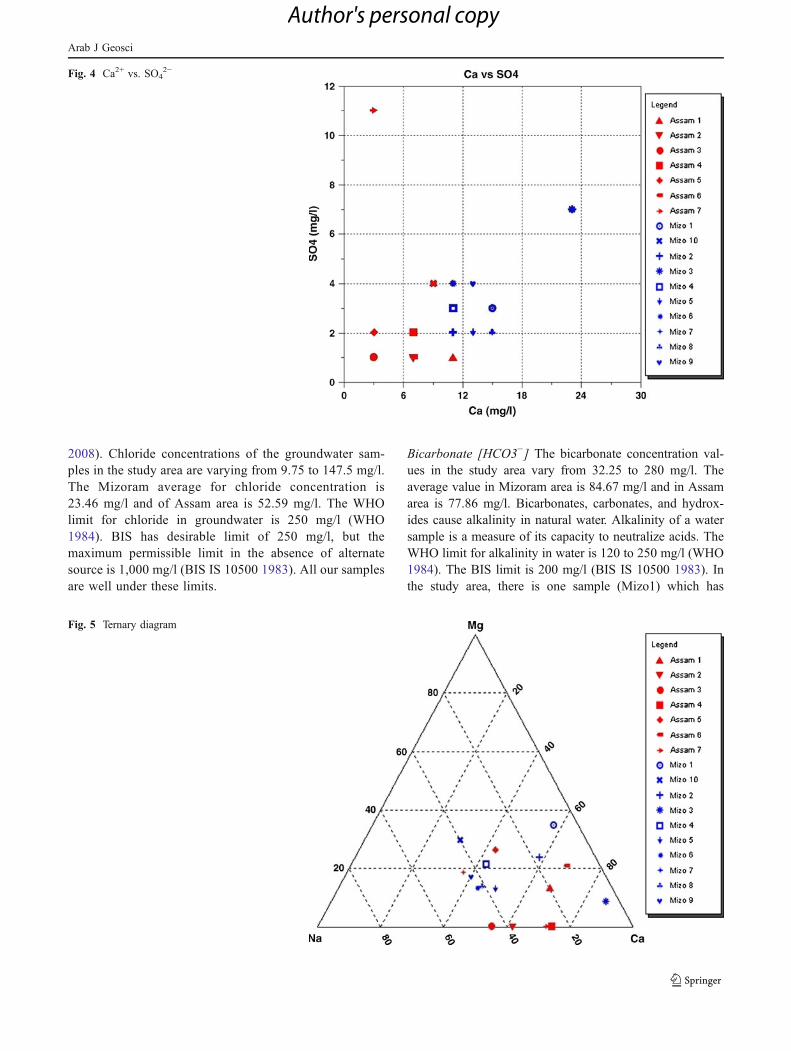
Fig. 4 Ca2+ vs. SO42−
Fig. 5 Ternary diagram
Arab J Geosci
Author's personal copy
bicarbonate concentration of 280 mg/l. So, its alkalinityvalue is definitely above the WHO and BIS limits. Thesource of alkalinity in the water is generally from sewageand various human activities. Water with high concentrationof alkalinity, when used in irrigation may be responsible tocause for white deposits on the various fruits and leaves andthus result to health hazard.
Sulfate [SO42−] Rock weathering and pollution are the
most significant sources of sulfate (Saini et al. 2006).Dissolved sulfate has its origin from dissolution of gypsum,oxidation of pyrites, and contaminated sulfate from indus-trial discharge. Sulfate concentrations in our water samplesvary from 1.1 to 11.29 mg/l. The average value in Mizoramis 4.08 mg/l and in Assam is 3.23 mg/l. The WHO limit forsulfate concentration is 150 mg/l (WHO 1984). Thedesirable limit for BIS is 200 mg/l and water sourcecontaining 400 mg/l is acceptable if no other source is
available (BIS IS 10500 1983). So, our samples are wellwithin the permissible limit.
Manganese [Mn2+] Manganese is an essential elementfor humans and other animals. Adverse effects canresult from both deficiency and overexposure (WHO2006). The concentrations of manganese vary from 0 to2,733.69 μg/l. Only one of the Mizoram samples (Mizo3)has shown presence of manganese with a concentration of62.06 μg/l. There is no detectable presence of manganesein other Mizoram samples. All the samples in Assam showpresence of manganese with an average concentration of831.12 μg/l. The WHO limit for manganese concentrationis 100 μg/l (WHO 1984); however, the limit has beenchanged to 400 μg/l in the 2006 standard published byWHO (2006). The BIS maximum acceptable limit in theabsence of another source is 300 μg/l, and the desirablelimit is 100 μg/l (BIS IS 10500 1983). Clearly, most of the
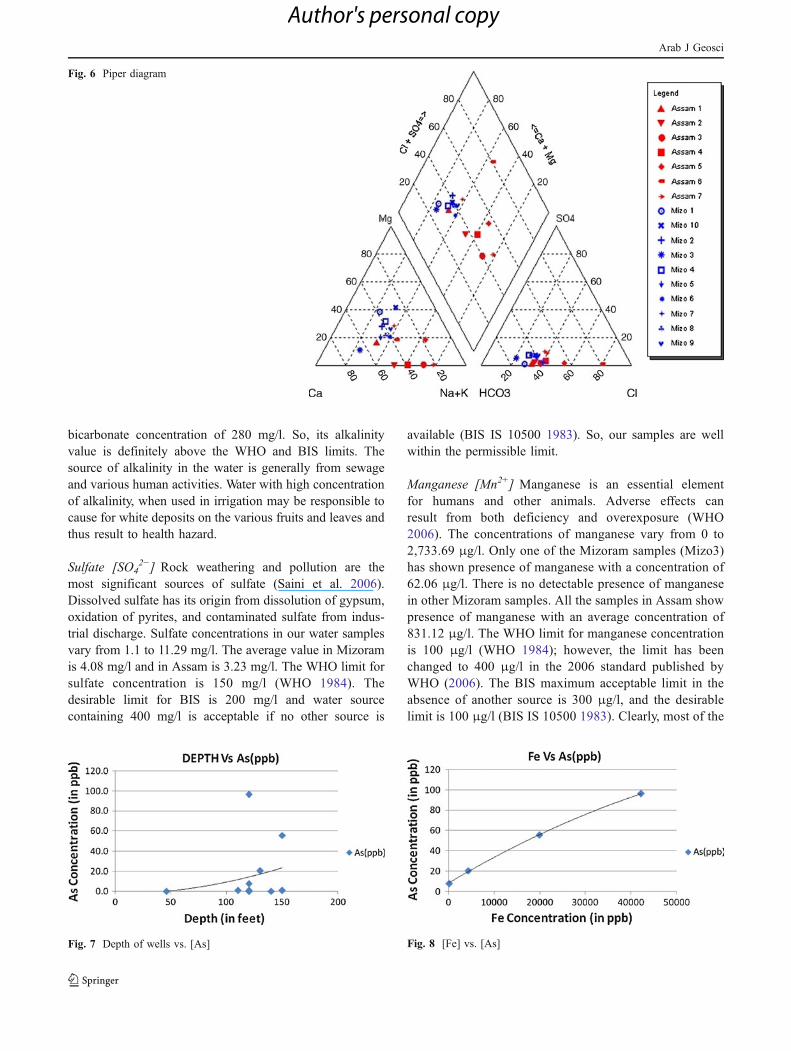
Fig. 6 Piper diagram
Fig. 7 Depth of wells vs. [As] Fig. 8 [Fe] vs. [As]
Arab J Geosci
Author's personal copy
Assam samples are having Mn concentration much higherthan the prescribed limits.
Iron [Fe] Iron is one of the most abundant metals in theEarth's crust. Iron is an essential element in humannutrition. Estimates of the minimum daily requirementfor iron depend on age, sex, physiological status, and ironbioavailability and range from about 10 to 50 mg/day. Avalue of about 2,000 μg/l does not present a hazard tohealth. The taste and appearance of drinking water willusually be affected below this level (WHO 2006). In1984, a guideline value of 300 μg/l was established bythe WHO. In 2004, however, no guideline value for ironin drinking water is proposed. BIS desirable limit is300 μg/l but in the absence of another source of water,1,000 μg/l is the maximum acceptable limit for ironconcentration (BIS IS 10500 1983). The presence ofiron ranges from 0 to 42,212 μg/l. There is nodetectable presence of iron in the Mizoram samples. InAssam, the iron concentration gives an average value of8,734.24 μg/l.
Arsenic [As] Arsenic is generally present as arsenate [As(V)] or arsenite [As(III)] for Eh conditions prevalent inmost groundwater. Arsenic metal rarely occurs, and the −3oxidation state is found only in very reducing environ-ments. As(III) has been considered to be the more toxicoxidation state; however, more recent studies have shownthat most ingested As(V) can be reduced to As(III). Thus,exposure to both forms of arsenic may result in similartoxicological effects. The presence of arsenic in Mizoramsamples is zero, whereas in Assam, four out of the sevensamples showed significant amount of arsenic present in thegroundwater. Three of the samples viz. Assam5, Assam6,Assam7, had concentration above the permissible WHOlimit of 10 μg/l (WHO 1984). The BIS maximumpermissible limit is 50 μg/l (BIS 1983), so the sampleAssam5 is safe according to BIS standard.
Interpretation
Except for station “Mizo1”, all other Mizoram watersamples showed more or less similar characteristics. Mizo1sample was taken from Taitow village, which is not very farfrom the city of Aizawl. The high values of EC and TDSand the high concentration of K+, Cl−, HCO3
−, and veryless but detectable amount of arsenic in that sample can beattributed to the presence of some locally spread contam-ination which was present only in that source of water (inthis case, a handpump). The reason for this interpretation iswhen the collection of the water sample was done, somewhite paint-like substance was seen coming out of the
handpump with water. A solid conclusion cannot be madebecause detailed investigation about the white substancewas not done.
Except the sample Mizo1, all other samples inMizoram behaved in a similar way. The range of valuesof pH, EC, TDS, and TH were all very close to eachother. The cationic and anionic concentrations of theMizoram samples were also very close to each other.This is expected since the geology of the area ofMizoram from where the samples were collected is verysimilar.
Almost all the water samples taken in Mizoram area showsimilar results as shown by Kumar et al. (2010) in Kolasibtown, which has very similar geology in comparison with theMizoram area of this study. In Table 2, it can be clearly seenthat Mg2+ concentration in Mizoram samples is higher thanthe samples from Assam. Many of the Assam samples haveno detectable Mg2+ concentration. This clearly suggests thepresence of shale dominant rocks in Mizoram area andrelatively less dominance in the state of Assam. The rockspresent in the area of Mizoram state are belonging to theBhuban formation which consists of sandstone–shale inter-calations having gradational contacts. Similarly, Ca2+ exhibitsslightly higher concentration at stations within Mizoram thanthe remaining stations in Assam.
In order to study the mutual relationships among variousphysicochemical parameters of the water samples, some
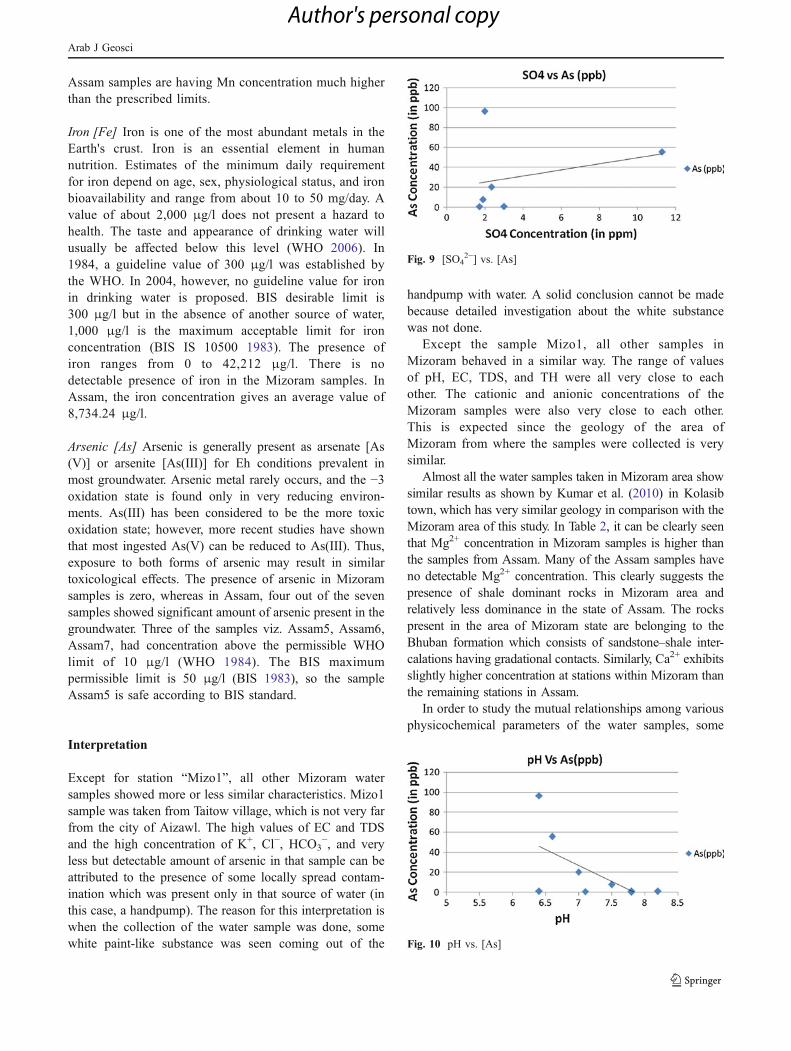
Fig. 10 pH vs. [As]
Fig. 9 [SO42−] vs. [As]
Arab J Geosci
Author's personal copy
bivariate plots (Figs. 2, 3, 4) were also prepared andstudied. Electrical conductivity and total dissolved solidsare proportional to each other, i.e., with an increase in thevalue of electrical conductivity; the value of total dissolvedsolids also increases (Fig. 2). Also, the samples from boththe states show similar EC and TDS values except forsample from station Mizo1.
The very low ratio of SO42−/Ca2+ (Fig. 4) indicates that
gypsum dissolution is not a primary source of SO42− in these
waters. SO42− is a major constituent in the aerosols where
burning of forests or forest fires are frequent (Saini et al.2006; Balasubramanian et al. 1999). The higher concentra-tion of sulfate ion in supply water may be attributed toburning of forests as the area under study experiencesfrequent burning of forests in the summer season for Jhumcultivation which is still prevalent in Mizoram.
To identify trend and relationship between groups ofsamples, a Ternary diagram incorporating Mg2+, Na+,and Ca2+ as shown in Fig. 5 was also prepared. It reflectssamples from all the stations are deficient in Mg2+. Someof the Assam samples do not show any sign of Mg2+ at alland are thus lying on the line joining Na+ and Ca2+. Theoverall indication is that samples contain more Ca2+ thanNa+ and Mg2+. Piper (1944) developed a form of trilineardiagram which is an effective tool in segregating analysisdata with respect to sources of the dissolved constituentsin potable water, modifications in the character of water asit passes through an area, and related geochemicalproblems. A Piper diagram was also prepared and shownin Fig. 6. Here, the water samples from Mizoram andthose from Assam are grouped together in the trianglesMg2+–Ca2+–(Na++K+) and SO4
2−–HCO3−–Cl−. All the
results are exhibiting a deficiency in SO42− and richness
in HCO3− than Cl−. In the section where Cl− and S04
2−
ions are checked against Ca2+ and Mg2+, a distinctgrouping among the stations of Mizoram and Assam isbeing exhibited. The water samples from Assam are richin cations (Cl−, SO4
2−), while the water samples fromMizoram are rich in anions (Ca2+, Mg2+).
The general trend of presence of Arsenic and depth ofwater is sympathetic in nature. This is shown in Fig. 7.Further concentration of iron and/or sulfate ions relate tomore arsenic in the water (Figs. 8 and 9). Also, it can beseen that higher arsenic concentrations are found in acidicwater, i.e., the lower the pH value, the more is the tendencyof arsenic concentration (Fig. 10).
The absence of arsenic at the stations within Mizoramand also its immediate bordering areas in Assam, as well aspresence of arsenic at remaining stations in Assam, may beattributed to the phenomenon of adsorbance by the clayminerals Kaolinite, Illite, and Montmorillonite (Welch andStollenwerk 2003) present in the shale horizons of theUpper Bhuban unit of Bhuban formation. The liberation of
arsenic is interfered by the phenomenon of adsorbance atdifferential degrees within the state of Mizoram and thestate of Assam. While in the state of Assam, the rock unitscomprising sandstone and shale having a finite thicknesswith sharp contact, the intercalation and gradational con-tacts within sandstone and shale in Upper Bhuban unit ofBhuban formation in Mizoram permits water to be purifiedwith respect to arsenic by the process of adsorbance asmore surface area of contacts are available. On the contrary,the upper Bhuban rocks are present at greater depths withinthe state of Assam, where arsenic was found in consider-able amount in groundwater.
Conclusion
Though the groundwater of the study area in general is safe forpotable use as perWHO and BIS standards, yet three locationsin Assam are marked with higher As content than thepermissible limit of WHO. The presence of arsenic in Assamand absence in Mizoram can be attributed to the geology ofthe areas. The aquifers in Mizoram area are upper Bhubanformation rocks dominated by shale and intercalatedsandstone–siltstone lithology. On the contrary, in the areaaround Silchar City, Assam, there are alluvial sediments ofyounger age overlying the Surma and Tipam group of rocks.These younger rocks consist of semi-consolidated sedimentsforming hillocks, the dominant lithology being sandstone,ferruginous sandstone, mottled clay, pebble bed, and boulderbeds, etc. without dominance of shale. As a result, the processof adsorption of heavy and toxic metals including arsenic onthe surface is minimized leading to concentration of arsenicand other toxic metals in the water of neighboring Silchar Cityof Southern Assam. Because of the little occurrence ofintercalated sandstone and shale, the surface area of clayminerals available for rock–water interaction in the Assam ismuch lower than that of Mizoram area. The water in threelocations viz. Assam5, Assam6, and Assam7 is not safe forpotable use. The present quantitative assessment of arsenicnow opens the avenue for further investigation in the southernAssam areas bordering Mizoram.
Acknowledgments One of the authors would like to acknowledgethe able guidance and support extended by Dr. R. P. Tiwari, Professor,Department of Geology, Mizoram University, Aizawl, Mizoram, India.
References
Annon (1946) Drinking water standards. J Am Water Works Assoc938:361–370
APHA, AWWA (1998) Standard methods for the examination of waterand waste water analysis. American Public Health Association,Washington DC
Arab J Geosci
Author's personal copy
AWWA (1971) Water quality and treatment. McGraw-Hill, NYBalasubramanian R, Victor T, Begum R (1999) Impact of biomass
burning on rain water acidity and composition in Singapore. JGeophys Res 104(D21):26881–26890
BIS IS 10500 (1983) Bureau of Indian Standards, Indian standardsspecification for drinking water
Davis SN, De Wiest RJM (1966) Hydrogeology. John Wiley and SonsInc., NY
Duffus J (1996) Comments to Editor, Chemistry International, NewsMagazine of International Union of Pure and applied Chemistry(IUPAC). 18(6): 252–253
Fletcher GD (1986) Groundwater and wells, 2nd edn. JohnsonDivision Publ, Sr. Paul Mimnesala
Ganju JL (1975) Geology of Mizoram. Bull Geol Min Met Soc India48:17–26
Hauser BA (2001) Drinking water chemistry, a laboratory manual.Turbidity herp II, 2001. Lewis publishers, A CRC PressCompany Florida, USA, p 71
Hem JD (1991) Study and interpretation of the chemical characteristics ofnatural waters, Book 2254, 3rd edn. Scientific Publishers, Jodhpur
Holden WS (1971) Water treatment and examination. Churchill, LondonKaranth KR (1997) Groundwater assessment development and
management. Tata McGraw-Hill, New DelhiKumar S, Bharati VK, Singh KB, Singh TN (2010) Quality
assessment of potable water of Kolasib, Mizoram (India). JEnviron Earth Sci 61(1):115–121
Kumar S, Singh KB, Bharati VK (2009) Assessment of spring waterquality in Aizawl City, Mizoram. JAH XXII:3–4
Nduka JK, Orisakwe OE, Ezenweke LO (2008) Some physicochem-ical parameters of potable water supply in Warri, Niger Delta areaof Nigeria. Sci Res Essay 3(11):547–551
Piper AM (1944) A graphic procedure in the geochemical interpre-tation of water analysis. AGU Trans 25
Robinnove CJ, Hangbird RH, Brook Hant JW (1958) Saline waterresources of North Dakota. US Geol SurvWater Supply Pap 1428:72
Saini RK, Chakrapani GJ, Sen AK (2006) Geochemical studies of groundwater in Saharanpur, Uttar Pradesh. J Geol Soc India 68:50–58
Satish Kumar T, Sudarshan V, Kalpana G (2007) Geochemicalcharacterization of groundwater, banks of Musi river Hyderabadcity A.P. India Poll Res 26(4):795–800
Singh KB, Bharati VK and Kumar S (2011) Physicochemical andbacteriological investigation of Tuikhur Water, Saiha Town,Mizoram, India. Sci Vis 11(1), 27–30 (www.sciencevision.info).
Smedley PL (2003) Arsenic in groundwater—south and east Asia.Arsenic in groundwater. Kluwer Academic Publishers, NY
Sravanthi K, Sudarshan V (1998) Geochemistry of groundwater,Nacharam Industrial area, Rangareddy district, A.P., India. J EnvGeochem 1(2):81–88
Thorne DW, Peterson HB (1954) Irrigated soils. Constable andCompany, London
Todd DK (1980) Groundwater hydrology. Wiley, New YorkUS Salinity Laboratory Staff (1954) Diagnosis and improvement of
saline and alkali soils, US Department of Agricultural soils. USDepartment of Agricultural Hand Book 60, Washington
Walton WC (1970) Groundwater resources evaluation. McGraw-Hill,New York
Welch AH, Stollenwerk KG (2003) Arsenic in groundwater. KluwerAcademic Publishers, Dordrecht
WHO (1984) Guidelines for drinking water quality. World HealthOrganization, Geneva
WHO (2006) Guidelines for drinking water quality. World HealthOrganization, Geneva
Wilcox LV (1948) The quality of water for irrigation use. USDepartment of Agricultural Technical Bulletin 1962, Washington
Zaparozec A (1972) Graphical Interpretation of water quality data.Groundwater 10(2):32–43
Arab J Geosci
Author's personal copy
Related Documents


![TAXATION DEPARTMENT MIZORAM - zotax.nic.in Schedules wef 1.1.2012.pdfTAXATION DEPARTMENT MIZORAM MIZORAM VALUE ADDED TAX VAT SCHEDULES ... Bakery products including biscuits [unbranded]](https://static.cupdf.com/doc/110x72/5ab78cf57f8b9aa6018b93d5/taxation-department-mizoram-zotaxnicin-schedules-wef-112012pdftaxation-department.jpg)