SCRS/2013/163 Collect. Vol. Sci. Pap. ICCAT, 70(6): 2669-2692 (2014) STATISTICS OF THE FRENCH PURSE SEINE FISHING FLEET TARGETING TROPICAL TUNAS IN THE ATLANTIC OCEAN (1991-2012) Laurent Floch 1 , Alain Damiano 2 , Athanase Tamegnon 3 , Pascal Cauquil 1 , Pierre Chavance 1 , Isabelle Terrier 1 , Emmanuel Chassot 2 SUMMARY In 2012, the French purse seine fishing fleet of the Atlantic was composed of 9 vessels of individual carrying capacity >600 t, which all represented a total carrying capacity of 9,000 t. The total cumulated nominal effort was about 2,500 and 2,000 fishing and searching days, respectively. The total number of fishing sets was about 1,900, with nearly 50% realised on schools associated with fish aggregating devices (FAD). Between 2011 and 2012, the capacity and nominal effort of the fleet increased by more than 10% while the total catches decreased by 8%. The decline in catch might be explained by the non access of the fleet to the coastal fishing grounds of Gabon which represented 25% of the fleet catch during 2010-2011 (i.e. 8,000- 10,000 t). Overall, the year 2012 was characterized by a decrease in fishing sets and resulting catch on free-swimming schools (FSC) which was partly balanced by increased catches on FADs. Hence, the total catch of skipjack and bigeye remained stable during 2010-2012, i.e. about 12,600 t and 3,300 t, respectively, while the catch of yellowfin decreased by 15% between 2011 and 2012 to reach about 18,000 t. The decrease in yellowfin catch was due to a decrease in the number of sets per searching day on FSC while the catch per positive set remained constant for both fishing modes in 2012, i.e. 20.8 t set -1 and 3.4 t set -1 for FSC and FAD, respectively. For skipjack, catch per positive set in the FAD fishery decreased by 13.5% between 2011 and 2012 but remained at a level of 14 t set -1 , similar to the average observed during 2009-2011. By contrast, catch per positive set of skipjack on FSC steadily decreased during 1991-2012 to reach a minimum of 0.56 t set -1 in 2012, in relation with the absence of fishing in the Cap Lopez area where large skipjack are generally caught. RÉSUMÉ En 2012, la flottille de senneurs français opérant dans l'Atlantique se composait de neuf navires, chacun ayant une capacité de transport > 600 t, représentant dans leur totalité une capacité de transport de 9.000 t. L'effort nominal cumulé total s'élevait à environ 2.500 et à 2.000 jours de pêche et de recherche, respectivement. Le nombre total d'opérations de pêche s'élevait à environ 1.900, à peu près la moitié étant réalisée sur des bancs associés à des dispositifs de concentration des poissons (DCP). Entre 2011 et 2012, la capacité et l'effort nominal de la flottille ont augmenté de plus de 10%, tandis que les prises totales ont diminué de 8%. La chute des captures pourrait s'expliquer par le fait que la flottille n'avait pas accès aux zones de pêche côtières du Gabon, qui représentaient 25% de la capture de la flottille entre 2010 et 2011 (c.-à-d. 8.000-10.000 t). En règle générale, l'année 2012 a été caractérisée par une diminution des opérations de pêche et des prises résultantes sur bancs libres, ce qui a été en partie compensé par l'augmentation des prises sous DCP. Par conséquent, la prise totale de listao et de thon obèse est demeurée stable entre 2010 et 2012, c.-à-d. à environ 12.600 t et 3.300 t, respectivement, tandis que la prise d'albacore a baissé de 15% entre 2011 et 2012 pour atteindre environ 18.000 t. La baisse des prises d'albacore était due à la diminution du nombre d'opérations par jour de recherche sur bancs libres tandis que la capture par opération positive est demeurée inchangée pour les deux modes de pêche en 2012, c.-à-d. 20,8 t opération -1 pour la pêche en bancs libres et 3,4 t opération -1 pour la pêche sous DCP. Pour le listao, la prise par opération positive dans la pêcherie opérant sous DCP a chuté de 13,5% entre 2011 et 2012, mais elle est demeurée à un niveau de 14 t opération -1 similaire à la moyenne observée entre 2009 et 2011. En revanche, les captures de listao par opération positive en bancs libres ont diminué progressivement entre 1991 et 2012, pour atteindre un minimum de 0,56 t opération -1 1 Institut de Recherche pour le Développement, CRH, Avenue Jean Monnet, BP171, 34203 Sète cedex, FRANCE 2 Institut de Recherche pour le Développement, Seychelles Fishing Authority, Fishing Port, BP570, Victoria, SEYCHELLES 3 Centre de Recherches Océanologiques, BPV18, Abidjan, COTE D’IVOIRE 2669

Welcome message from author
This document is posted to help you gain knowledge. Please leave a comment to let me know what you think about it! Share it to your friends and learn new things together.
Transcript

SCRS/2013/163 Collect. Vol. Sci. Pap. ICCAT, 70(6): 2669-2692 (2014)
STATISTICS OF THE FRENCH PURSE SEINE FISHING FLEET
TARGETING TROPICAL TUNAS IN THE ATLANTIC OCEAN (1991-2012)
Laurent Floch1, Alain Damiano2, Athanase Tamegnon3, Pascal Cauquil1,
Pierre Chavance1, Isabelle Terrier1, Emmanuel Chassot2
SUMMARY
In 2012, the French purse seine fishing fleet of the Atlantic was composed of 9 vessels of
individual carrying capacity >600 t, which all represented a total carrying capacity of 9,000 t.
The total cumulated nominal effort was about 2,500 and 2,000 fishing and searching days,
respectively. The total number of fishing sets was about 1,900, with nearly 50% realised on
schools associated with fish aggregating devices (FAD). Between 2011 and 2012, the capacity
and nominal effort of the fleet increased by more than 10% while the total catches decreased by
8%. The decline in catch might be explained by the non access of the fleet to the coastal fishing
grounds of Gabon which represented 25% of the fleet catch during 2010-2011 (i.e. 8,000-
10,000 t). Overall, the year 2012 was characterized by a decrease in fishing sets and resulting
catch on free-swimming schools (FSC) which was partly balanced by increased catches on
FADs. Hence, the total catch of skipjack and bigeye remained stable during 2010-2012, i.e.
about 12,600 t and 3,300 t, respectively, while the catch of yellowfin decreased by 15% between
2011 and 2012 to reach about 18,000 t. The decrease in yellowfin catch was due to a decrease
in the number of sets per searching day on FSC while the catch per positive set remained
constant for both fishing modes in 2012, i.e. 20.8 t set-1 and 3.4 t set-1 for FSC and FAD,
respectively. For skipjack, catch per positive set in the FAD fishery decreased by 13.5%
between 2011 and 2012 but remained at a level of 14 t set-1, similar to the average observed
during 2009-2011. By contrast, catch per positive set of skipjack on FSC steadily decreased
during 1991-2012 to reach a minimum of 0.56 t set-1 in 2012, in relation with the absence of
fishing in the Cap Lopez area where large skipjack are generally caught.
RÉSUMÉ
En 2012, la flottille de senneurs français opérant dans l'Atlantique se composait de neuf
navires, chacun ayant une capacité de transport > 600 t, représentant dans leur totalité une
capacité de transport de 9.000 t. L'effort nominal cumulé total s'élevait à environ 2.500 et à
2.000 jours de pêche et de recherche, respectivement. Le nombre total d'opérations de pêche
s'élevait à environ 1.900, à peu près la moitié étant réalisée sur des bancs associés à des
dispositifs de concentration des poissons (DCP). Entre 2011 et 2012, la capacité et l'effort
nominal de la flottille ont augmenté de plus de 10%, tandis que les prises totales ont diminué de
8%. La chute des captures pourrait s'expliquer par le fait que la flottille n'avait pas accès aux
zones de pêche côtières du Gabon, qui représentaient 25% de la capture de la flottille entre
2010 et 2011 (c.-à-d. 8.000-10.000 t). En règle générale, l'année 2012 a été caractérisée par
une diminution des opérations de pêche et des prises résultantes sur bancs libres, ce qui a été
en partie compensé par l'augmentation des prises sous DCP. Par conséquent, la prise totale de
listao et de thon obèse est demeurée stable entre 2010 et 2012, c.-à-d. à environ 12.600 t et
3.300 t, respectivement, tandis que la prise d'albacore a baissé de 15% entre 2011 et 2012 pour
atteindre environ 18.000 t. La baisse des prises d'albacore était due à la diminution du nombre
d'opérations par jour de recherche sur bancs libres tandis que la capture par opération positive
est demeurée inchangée pour les deux modes de pêche en 2012, c.-à-d. 20,8 t opération -1 pour
la pêche en bancs libres et 3,4 t opération-1 pour la pêche sous DCP. Pour le listao, la prise par
opération positive dans la pêcherie opérant sous DCP a chuté de 13,5% entre 2011 et 2012,
mais elle est demeurée à un niveau de 14 t opération -1 similaire à la moyenne observée entre
2009 et 2011. En revanche, les captures de listao par opération positive en bancs libres ont
diminué progressivement entre 1991 et 2012, pour atteindre un minimum de 0,56 t opération-1
1 Institut de Recherche pour le Développement, CRH, Avenue Jean Monnet, BP171, 34203 Sète cedex, FRANCE 2 Institut de Recherche pour le Développement, Seychelles Fishing Authority, Fishing Port, BP570, Victoria, SEYCHELLES 3 Centre de Recherches Océanologiques, BPV18, Abidjan, COTE D’IVOIRE
2669

en 2012 en rapport avec l'absence de la pêche dans la zone de Cap Lopez où les gros listaos
sont généralement capturés.
RESUMEN
En 2012, la flota de cerco francesa del océano Atlántico estaba compuesta por nueve buques
con una capacidad de transporte individual de más de >600 t, lo que supone una capacidad de
transporte total de 9.000 t. El esfuerzo nominal total acumulado fue de aproximadamente 2.500
y 2.000 días de pesca y búsqueda, respectivamente. El número total de lances fue de
aproximadamente 1.900, y casi el 50% se realizó sobre bancos asociados con dispositivos de
concentración de peces (DCP). Entre 2011 y 2012, la capacidad y el esfuerzo nominal de la
flota se incrementaron en más de un 10%, mientras que las capturas totales experimentaron un
descenso del 8%. El descenso en la captura podría explicarse porque la flota no accedió a los
caladeros de la costa de Gabón, donde obtuvo el 25% de su captura en el periodo 2010-2011 (a
saber, 8.000-10.000 t) En general, el año 2012 se caracterizó por un descenso de las
operaciones de pesca y de la captura resultante en bancos libres (FSC), que se vio equilibrada
en parte por un incremento de las capturas en DCP. Por tanto, la captura de listado y patudo
se mantuvo estable durante 2010-2012, a saber, aproximadamente 12.600 t y 3.300 t,
respectivamente, mientras que la captura de rabil descendió un 15% entre 2011 y 2011,
situándose en aproximadamente 18.000 t. El descenso en la captura de rabil se debió a un
descenso en el número de lances por día de búsqueda en bancos libres, mientras que la captura
por lance positivo se mantuvo constante para los dos tipos de pesca en 2012, a saber, 20,8 t
lance-1 y 3,4 t lance-1 para bancos libres y DCP, respectivamente. Para el listado, la captura
por lance positivo en la pesquería con DCP experimentó un descenso del 13,5% entre 2011 y
2012, pero se mantuvo en un nivel de 14 t lance-1, similar al promedio observado durante el
periodo 2009-2011. Por el contrario, la captura de listado por lance positivo en bancos libres
experimentó un marcado descenso en el periodo 1991-2012 llegando a un mínimo de 0,56 t por
lance-1 en 2012, relacionado con la ausencia de pesca en la zona de Cabo López, donde se
suelen capturar grandes listados.
KEYWORDS
Catch statistics, FAD, Free-swimming school, High seas fisheries, Purse seining
1 Introduction
French purse seiners operating in the Atlantic Ocean target yellowfin (Thunnus albacares), skipjack
(Katsuwonus pelamis), and bigeye tuna (Thunnus obesus) through two major fishing modes that result in
different species and size composition of the catch: fish aggregating device-associated (FAD) and free-
swimming schools (FSC). Statistical data for the French purse seine fishing fleet have been collected by the
``Institut de Recherche pour le Développement'' (IRD) in collaboration with the Centre de Recherches
Océanologiques (CRO) in Ivory Coast, and the Centre de Recherches Océanographiques de Dakar-Thiaroye
(CRODT), Sénégal since the early 1980s. The fleet activities are described through a suite of fisheries indicators
that provide information on fishing capacity, effort, catch, and catch rates for the principal market tropical tunas,
with a particular focus on the year 2012.
2 Fishing capacity and effort
In 2012, a total of 9 French purse seiners operated in the eastern Atlantic Ocean (Figure 1). The fleet was
composed of 2 vessels of carrying capacity (CC) of 600-800 t, 5 vessels of CC 800-1200 t, and 2 vessels of CC
>1,200 t (Table 1). The total capacity, weighted by the months of activity for each vessel, increased by 13%
between 2011 and 2012 and reached about 13,000 m3, corresponding to 9,000 t of fish hold volume. The
increase in CC was due to the arrival of 2 purse seiners from the Indian Ocean while 2 smaller and older vessels
(i.e. >30 years) left the fleet in 2011.
2670

The total nominal effort in 2012 was about 2,500 and 2,000 fishing and searching days, respectively (Figure 2
and Table 2). The effort increased by more than 12% between 2011 and 2012 in relation with the increase in
fishing capacity. The effort was mainly concentrated between the equator and 10°N, particularly between 10°W-
20°W and off the coasts of Ivory Coast (Figure 3). Compared to previous years, no fishing occurred in 2012
during the months of May-September in the Cap Lopez area, i.e. within the exclusive economic zone of Gabon,
due to the absence of EU Fisheries Partnership Agreement. To face up with the reduction in fishing grounds, the
fleet allocated some effort south of 5°S, along the coasts of Angola. Despite the overall increased effort between
2011 and 2012 and fishing activities off Angola, the fleet appeared more concentrated in space in 2012, i.e. a
total of 239 1°x1° squares with some effort in 2012 vs. 257 in 2011 (Table 3).
While the effort increased by more than 10% between 2011 and 2012, the total number of fishing sets was very
similar, i.e. about 2,000 (Figure 5). There was however a strong change in the underlying fishing characteristics
since the number of FAD sets increased by 40% while the FSC sets decreased by 25% between 2011 and 2012.
The reduction in FSC sets might be partly explained by the non access to the Cap Lopez area where fishing on
free-swimming schools represented more than 45% of the sets during 2010-2011. The overall increase in FAD
sets might also result from an effect of the arrival of the 2 large purse seiners from the Indian Ocean better
equipped for FAD-fishing as well as from a more general fishing strategy more oriented toward FAD-fishing in
relation with the high sale price for skipjack in 2012. Consequently, the percentage of sets on FAD-associated
schools reached nearly 50% in 2012, corresponding to the maximum value observed over the last 2 decades
(Table 4).
3 Fishery production
In 2012, the total catch of the French component of the EU purse seine fleet of the Atlantic Ocean was 34,000 t,
being composed of 54%, 34%, and 10% of yellowfin, skipjack, and bigeye, respectively (Table 5). Despite the
increase in capacity and effort between 2011 and 2012, the total catch decreased by about 8% (Figure 6). The
decrease was mainly due to the decrease in catch on FSC by 25% while the catch on FADs increased by 25% in
the mean time (Figure 7). Overall, the total catch of skipjack and bigeye remained stable during 2010-2012, i.e.
about 12,600 t and 3,300 t, respectively, while the catch of yellowfin decreased by 15% between 2011 and 2012
to reach about 18,000 t. The decrease in yellowfin catch was due to a decrease in the number of sets per
searching day on FSC in 2012 (Figure 11b) while the catch per positive set remained constant for both fishing
modes, i.e. 20.8 t set-1 and 3.4 t set-1 for FSC and FAD, respectively (Figure 11c-d). The mean catch of
yellowfin in the FSC catch increased from about 30 kg in 2010-2012 to nearly 50 kg in 2012 due to the major
decrease in the number of small yellowfin caught on free-swimming schools in 2012 (Figure 15a).
For skipjack, catch per positive set in the FAD fishery decreased by 13.5% between 2011 and 2012 but remained
at a level of 14 t set-1, similar to the average observed during 2009-2011 (Figure 11c). By contrast, catch per
positive set of skipjack on FSC steadily decreased during 1991-2012 to reach a minimum of 0.56 t set-1 in 2012,
in relation with the absence of fishing in the Cap Lopez area where free-swimming skipjack are generally caught
(Figure 11d). Indeed, the mean weight of skipjack in the catch decreased from 2.5 kg in 2011 to 2.1 kg in 2012
(Figure 15b).
While yellowfin were mainly caught on FSC (85% of the catch) and skipjack on FADs (>95%) in 2012, the
catch of bigeye in the purse seine fleet resulted from both fishing modes, i.e. 60% and 40% from FAD and FSC,
respectively (Tables 6-7 and Figure 14). The decrease in the number of small bigeye on FSC in 2012 resulted in
an increase in the mean weight of bigeye in the catch which increased to 31 kg in 2012 (Figure 15c).
Meanwhile, bigeye caught in association with FADs increased from 3.7 kg to 4.2 kg in 2012 in relation with
some medium-sized individuals (about 100 cm fork length) caught on FADs, a feature rarely observed in the
purse seine fishery.
Acknowledgments
We thank ORTHONGEL and all past and current personnel for helpful assistance in data collection and
management. We are particularly grateful to Renaud Pianet, Viveca Nordstrom and Alain Fonteneau for their
dedication to the monitoring of tropical tuna fisheries and their support to the Observatoire Thonier. Sampling
operations were conducted by the CRO team led by AT and Dominique Bi Yala Irié. Muchas gracias to Alicia
Delgado de Molina and Javier Ariz for the long-standing collaboration between IRD and the Instituto Espanol de
Oceanografia (IEO) which is instrumental in processing the purse seine fishing data. This work was financed by
the European Data Collection Framework (DCF, Reg 199/2008 and 665/2008) and supported by the French
"Direction des Pêches Maritimes et de l'Aquaculture" (DPMA).
2671

Table 1. Annual number of purse seiners by size category and total carrying capacity of the European tropical
tuna purse seine fishing fleet of the Atlantic Ocean during 1991-2012. Total carrying capacity (CC) was
weighted by the proportion of the year at sea (in months).
Year 50-
400
401-
600
601-
800
801-
1200
1201-
2000
>2000 Total CC
1991 2 9 6 6 0 0 23 11850
1992 1 8 2 6 0 0 17 11457
1993 1 8 3 6 0 0 18 11870
1994 1 8 3 6 0 0 18 12121
1995 0 10 2 5 0 0 17 10863
1996 0 9 2 5 0 0 16 11243
1997 0 10 2 5 2 0 19 11331
1998 0 7 2 6 0 0 15 11071
1999 0 8 2 5 0 0 15 10538
2000 0 7 2 5 0 0 14 10248
2001 0 7 2 7 1 0 17 11314
2002 0 8 3 5 1 0 17 9601
2003 0 8 1 5 0 0 14 9610
2004 0 6 1 5 0 0 12 8345
2005 0 4 0 5 0 0 9 6980
2006 0 4 0 3 0 0 7 4040
2007 0 3 0 2 0 0 5 3581
2008 0 3 2 2 0 0 7 3678
2009 0 1 2 4 3 0 10 6876
2010 0 1 2 4 3 0 10 8846
2011 0 1 2 4 2 0 9 7945
2012 0 0 2 5 2 0 9 8986
2672
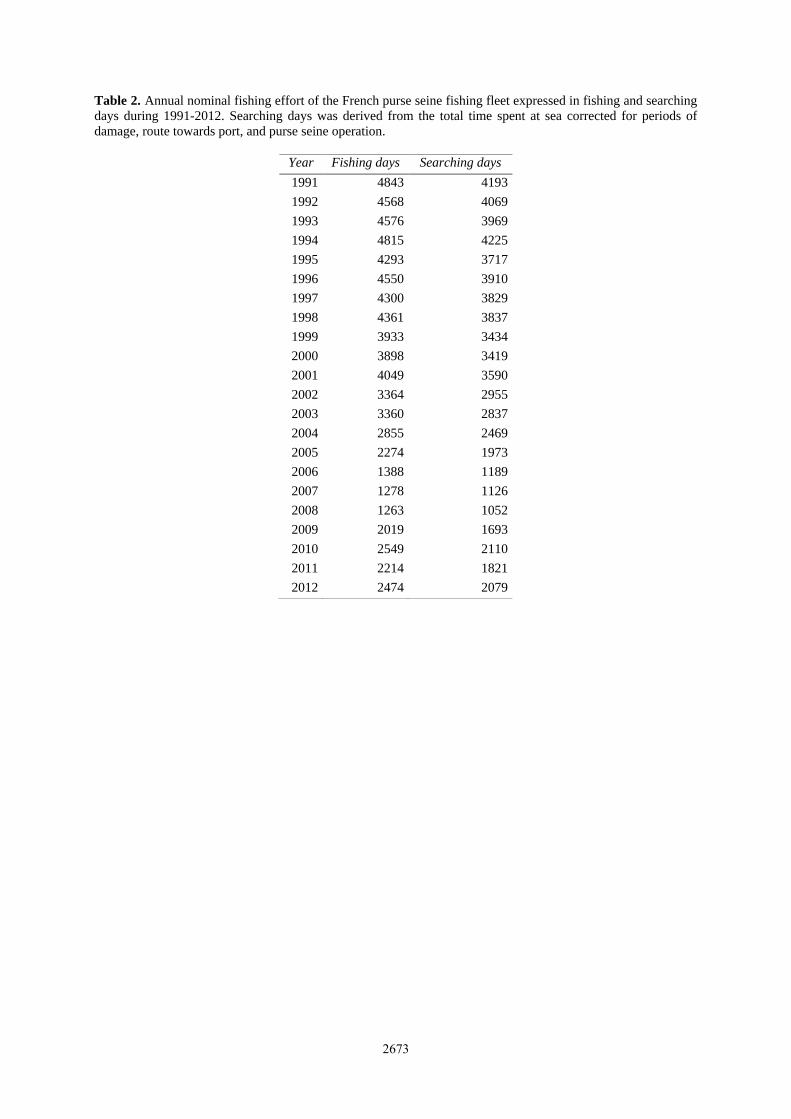
Table 2. Annual nominal fishing effort of the French purse seine fishing fleet expressed in fishing and searching
days during 1991-2012. Searching days was derived from the total time spent at sea corrected for periods of
damage, route towards port, and purse seine operation.
Year Fishing days Searching days
1991 4843 4193
1992 4568 4069
1993 4576 3969
1994 4815 4225
1995 4293 3717
1996 4550 3910
1997 4300 3829
1998 4361 3837
1999 3933 3434
2000 3898 3419
2001 4049 3590
2002 3364 2955
2003 3360 2837
2004 2855 2469
2005 2274 1973
2006 1388 1189
2007 1278 1126
2008 1263 1052
2009 2019 1693
2010 2549 2110
2011 2214 1821
2012 2474 2079
2673

Table 3. Annual number of 1-degree squares explored by the French purse seine fishing fleet during 1991-2012.
#sets indicates squares where a least 1 fishing set was made.
Year TOTAL #sets Catch >0 Effort > 1 d Effort > 5 d
1991 389 292 272 313 213
1992 423 293 287 339 215
1993 374 270 260 296 192
1994 420 337 334 358 256
1995 405 307 299 329 200
1996 391 302 291 325 209
1997 464 334 295 373 220
1998 466 355 332 369 214
1999 365 272 260 290 184
2000 368 289 274 299 184
2001 412 283 272 322 195
2002 360 262 249 291 185
2003 358 247 240 267 163
2004 343 254 240 259 149
2005 350 232 216 257 137
2006 264 167 161 182 85
2007 272 166 153 194 84
2008 258 156 146 161 80
2009 332 221 206 228 121
2010 325 256 241 262 142
2011 364 248 235 257 128
2012 345 245 232 239 126
2674

Table 4. Number of positive and null sets by fishing mode made by the French purse seine fishing fleet in the
Atlantic ocean during 1991-2012. FAD = Fish Aggregating Device ; FSC = Free-Swimming School.
Year ALL-
Total
ALL-
Positive
ALL
-
Null
FAD-
Total
FAD-
Positive
FAD-
Null
FSC-
Total
FSC-
Positive
FSC-
Null
% Log
1991 3247 2521 726 853 772 81 2394 1749 645 26
1992 2685 2140 545 955 857 98 1730 1283 447 36
1993 3232 2650 582 1172 1116 56 2060 1534 526 36
1994 3135 2581 554 1377 1296 81 1758 1285 473 44
1995 3126 2508 618 1394 1294 100 1732 1214 518 45
1996 3519 2670 849 1347 1212 135 2172 1458 714 38
1997 2598 1908 690 816 725 91 1782 1183 599 31
1998 2889 2162 727 988 913 75 1901 1249 652 34
1999 2745 1995 750 720 653 67 2025 1342 683 26
2000 2616 1971 645 683 622 61 1933 1349 584 26
2001 2500 1904 596 630 560 70 1870 1344 526 25
2002 2209 1678 531 577 545 32 1632 1133 499 26
2003 2838 2263 575 701 662 39 2137 1601 536 25
2004 2075 1657 418 712 669 43 1363 988 375 34
2005 1613 1297 316 459 439 20 1154 858 296 28
2006 1059 828 231 221 214 7 838 614 224 21
2007 819 635 184 171 156 15 648 479 169 21
2008 1018 770 248 188 177 11 830 593 237 18
2009 1595 1253 342 451 400 51 1144 853 291 28
2010 2133 1725 408 872 826 46 1261 899 362 41
2011 1908 1503 405 645 586 59 1263 917 346 34
2012 1913 1556 357 900 813 87 1013 743 270 47
2675

Table 5. Catch by species for the French purse seine fishing fleet of the Atlantic Ocean during 1991-2012.
Year YFT SKJ BET ALB OTH TOTAL
1991 30172 31814 3327 50 554 65917
1992 30778 20383 4985 451 930 57526
1993 33590 31537 10629 565 500 76821
1994 32381 30251 10075 130 1118 73955
1995 27850 22542 6262 83 1099 57836
1996 32179 21370 6778 191 725 61243
1997 29065 13335 4209 39 503 47150
1998 30468 14144 3641 40 927 49221
1999 28833 19457 3383 13 507 52194
2000 29506 16642 3936 23 434 50540
2001 31183 13774 3943 11 275 49186
2002 32982 13806 3597 18 211 50614
2003 32268 17318 3289 63 616 53554
2004 23413 19982 2417 19 264 46094
2005 22073 12606 1913 478 47 37117
2006 18353 5423 2402 347 12 26536
2007 12775 4012 1485 12 98 18382
2008 15929 3661 989 50 37 20666
2009 18545 6602 2043 60 24 27274
2010 19974 13983 3199 109 99 37365
2011 21427 12088 3268 53 152 36990
2012 18243 11749 3574 161 351 34077
2676

Table 6. Catch by species made on FAD-associated schools for the French purse seine fishing fleet of the
Atlantic Ocean during 1991-2012.
Year YFT SKJ BET ALB OTH TOTAL
1991 4476 16465 2501 0 136 23578
1992 6116 16370 3619 0 509 26614
1993 6723 23884 6853 0 432 37892
1994 9124 22273 8372 0 721 40489
1995 5549 18155 5274 4 933 29915
1996 5750 16736 4941 0 559 27985
1997 4371 9076 2945 0 457 16850
1998 4669 8725 2712 0 787 16893
1999 5795 11478 2316 0 289 19877
2000 4335 11207 2696 0 405 18643
2001 3090 8792 2335 0 243 14459
2002 4198 9308 2287 0 164 15957
2003 4332 10937 1833 0 372 17473
2004 3742 14602 1901 0 191 20435
2005 2547 9805 1165 5 47 13569
2006 626 3925 541 0 12 5104
2007 850 3112 489 0 98 4549
2008 557 2103 391 0 37 3088
2009 1089 5531 939 0 24 7583
2010 3001 11297 1530 13 92 15932
2011 1978 9443 1776 12 96 13305
2012 2756 11335 2321 15 312 16739
2677

Table 7. Catch by species made on free-swimming schools for the French purse seine fishing fleet of the
Atlantic Ocean during 1991-2012.
Year YFT SKJ BET ALB OTH TOTAL
1991 25696 15349 826 50 417 42339
1992 24662 4013 1366 451 421 30913
1993 26867 7653 3776 565 68 38929
1994 23257 7979 1703 130 397 33466
1995 22301 4387 988 79 166 27921
1996 26430 4634 1837 191 167 33258
1997 24694 4259 1264 39 46 30301
1998 25799 5419 930 40 140 32328
1999 23038 7980 1067 13 218 32316
2000 25170 5435 1240 23 30 31897
2001 28094 4982 1608 11 33 34727
2002 28784 4498 1310 18 46 34657
2003 27936 6382 1456 63 244 36081
2004 19671 5380 516 19 73 25660
2005 19527 2801 749 472 0 23548
2006 17727 1498 1861 347 0 21433
2007 11925 900 996 12 0 13834
2008 15372 1558 598 50 0 17578
2009 17456 1071 1104 60 0 19691
2010 16973 2687 1668 97 8 21433
2011 19449 2646 1493 41 56 23685
2012 15486 414 1253 146 39 17339
2678

Table 8. Number of sets per searching on FAD-associated (FAD) and free-swimming schools (FSC) for the
French purse seine fishing fleet of the Atlantic Ocean during 1991-2012.
Year ALL FAD FSC
1991 0.77 0.2 0.57
1992 0.66 0.23 0.43
1993 0.81 0.3 0.52
1994 0.74 0.33 0.42
1995 0.84 0.38 0.47
1996 0.9 0.34 0.56
1997 0.68 0.21 0.47
1998 0.75 0.26 0.5
1999 0.8 0.21 0.59
2000 0.77 0.2 0.57
2001 0.7 0.18 0.52
2002 0.75 0.2 0.55
2003 1 0.25 0.75
2004 0.84 0.29 0.55
2005 0.82 0.23 0.59
2006 0.89 0.19 0.7
2007 0.73 0.15 0.58
2008 0.97 0.18 0.79
2009 0.94 0.27 0.68
2010 1.01 0.41 0.6
2011 1.05 0.35 0.69
2012 0.92 0.43 0.49
2679

Table 9. Catch per unit of effort (in t per positive set) on FAD-associated schools for the French purse seine
fishing fleet of the Atlantic Ocean during 1991-2012.
Year YFT SKJ BET ALB OTH TOTAL
1991 5.8 21.33 3.24 0 0.18 30.54
1992 7.14 19.1 4.22 0 0.59 31.05
1993 6.02 21.4 6.14 0 0.39 33.95
1994 7.04 17.19 6.46 0 0.56 31.24
1995 4.29 14.03 4.08 0 0.72 23.12
1996 4.74 13.81 4.08 0 0.46 23.09
1997 6.03 12.52 4.06 0 0.63 23.24
1998 5.11 9.56 2.97 0 0.86 18.5
1999 8.87 17.58 3.55 0 0.44 30.44
2000 6.97 18.02 4.33 0 0.65 29.97
2001 5.52 15.7 4.17 0 0.43 25.82
2002 7.7 17.08 4.2 0 0.3 29.28
2003 6.54 16.52 2.77 0 0.56 26.39
2004 5.59 21.83 2.84 0 0.29 30.55
2005 5.8 22.33 2.65 0.01 0.11 30.91
2006 2.93 18.34 2.53 0 0.06 23.85
2007 5.45 19.95 3.13 0 0.63 29.16
2008 3.15 11.88 2.21 0 0.21 17.45
2009 2.72 13.83 2.35 0 0.06 18.96
2010 3.63 13.68 1.85 0.02 0.11 19.29
2011 3.38 16.11 3.03 0.02 0.16 22.7
2012 3.39 13.94 2.85 0.02 0.38 20.59
2680

Table 10. Catch per unit of effort (in t per positive set) on free-swimming schools for the French purse seine
fishing fleet of the Atlantic Ocean during 1991-2012.
Year YFT SKJ BET ALB OTH TOTAL
1991 14.69 8.78 0.47 0.03 0.24 24.21
1992 19.22 3.13 1.06 0.35 0.33 24.09
1993 17.51 4.99 2.46 0.37 0.04 25.38
1994 18.1 6.21 1.33 0.1 0.31 26.04
1995 18.37 3.61 0.81 0.07 0.14 23
1996 18.13 3.18 1.26 0.13 0.11 22.81
1997 20.87 3.6 1.07 0.03 0.04 25.61
1998 20.66 4.34 0.74 0.03 0.11 25.88
1999 17.17 5.95 0.8 0.01 0.16 24.08
2000 18.66 4.03 0.92 0.02 0.02 23.65
2001 20.9 3.71 1.2 0.01 0.02 25.84
2002 25.41 3.97 1.16 0.02 0.04 30.59
2003 17.45 3.99 0.91 0.04 0.15 22.54
2004 19.91 5.45 0.52 0.02 0.07 25.97
2005 22.76 3.26 0.87 0.55 0 27.45
2006 28.87 2.44 3.03 0.57 0 34.91
2007 24.9 1.88 2.08 0.03 0 28.88
2008 25.92 2.63 1.01 0.08 0 29.64
2009 20.46 1.26 1.29 0.07 0 23.08
2010 18.88 2.99 1.86 0.11 0.01 23.84
2011 21.21 2.89 1.63 0.04 0.06 25.83
2012 20.84 0.56 1.69 0.2 0.05 23.34
2681

Table 11. Catch per unit of effort (in t per searching day) on FAD-associated schools for the French purse seine
fishery of the Atlantic Ocean during 1991-2012.
Year YFT SKJ BET ALB OTH TOTAL
1991 1.07 3.93 0.6 0 0.03 5.62
1992 1.5 4.02 0.89 0 0.13 6.54
1993 1.69 6.02 1.73 0 0.11 9.55
1994 2.16 5.27 1.98 0 0.17 9.58
1995 1.49 4.88 1.42 0 0.25 8.05
1996 1.47 4.28 1.26 0 0.14 7.16
1997 1.14 2.37 0.77 0 0.12 4.4
1998 1.22 2.27 0.71 0 0.21 4.4
1999 1.69 3.34 0.67 0 0.08 5.79
2000 1.27 3.28 0.79 0 0.12 5.45
2001 0.86 2.45 0.65 0 0.07 4.03
2002 1.42 3.15 0.77 0 0.06 5.4
2003 1.53 3.86 0.65 0 0.13 6.16
2004 1.52 5.91 0.77 0 0.08 8.28
2005 1.29 4.97 0.59 0 0.02 6.88
2006 0.53 3.3 0.45 0 0.01 4.29
2007 0.75 2.76 0.43 0 0.09 4.04
2008 0.53 2 0.37 0 0.04 2.94
2009 0.64 3.27 0.55 0 0.01 4.48
2010 1.42 5.35 0.73 0.01 0.04 7.55
2011 1.09 5.19 0.98 0.01 0.05 7.31
2012 1.33 5.45 1.12 0.01 0.15 8.05
2682

Table 12. Catch per unit of effort (in t per searching day) on free swimming schools for the French purse seine
fishery of the Atlantic Ocean during 1991-2012.
Year YFT SKJ BET ALB OTH TOTAL
1991 6.13 3.66 0.2 0.01 0.1 10.1
1992 6.06 0.99 0.34 0.11 0.1 7.6
1993 6.77 1.93 0.95 0.14 0.02 9.81
1994 5.5 1.89 0.4 0.03 0.09 7.92
1995 6 1.18 0.27 0.02 0.04 7.51
1996 6.76 1.19 0.47 0.05 0.04 8.51
1997 6.45 1.11 0.33 0.01 0.01 7.91
1998 6.72 1.41 0.24 0.01 0.04 8.42
1999 6.71 2.32 0.31 0 0.06 9.41
2000 7.36 1.59 0.36 0.01 0.01 9.33
2001 7.82 1.39 0.45 0 0.01 9.67
2002 9.74 1.52 0.44 0.01 0.02 11.73
2003 9.85 2.25 0.51 0.02 0.09 12.72
2004 7.97 2.18 0.21 0.01 0.03 10.39
2005 9.9 1.42 0.38 0.24 0 11.94
2006 14.91 1.26 1.57 0.29 0 18.02
2007 10.59 0.8 0.88 0.01 0 12.28
2008 14.62 1.48 0.57 0.05 0 16.72
2009 10.31 0.63 0.65 0.04 0 11.63
2010 8.04 1.27 0.79 0.05 0 10.16
2011 10.68 1.45 0.82 0.02 0.03 13.01
2012 7.45 0.2 0.6 0.07 0.02 8.34
2683

Figure 1. Fishing capacity of the French purse seine fishing fleet in the Atlantic Ocean. Annual changes in the
number of purse seiners by size category (barplots) and total carrying capacity (solid line with circles) during
1991-2012. Capacity was weighted by the vessel-specific proportion of the year at sea (in months). The vessel
size category (t) was computed as 0.7 times the capacity expressed in m3.
Figure 2. Changes in nominal effort over time. Annual total number of fishing and searching days for the French
purse seine fishing fleet in the Atlantic Ocean during 1991-2012.
2684

Figure 3. Fishing grounds. Spatial distribution of fishing effort (in searching days) of the French purse seine
fishing fleet in 2012.
Figure 4. Changes in spatial extent of the fishery over time. Mean annual number of 1-degree squares explored
by each vessel of the French purse seine fishing fleet during 1991-2012. Solid line indicates standard deviation.
Only vessels in activity during 12 months were selected. A loess function was fitted to the data to illustrate the
trend.
2685

Figure 5. Fishing operations. Annual number of fishing sets in the French purse seine fishery on FAD-associated
and free-swimming schools during 1991-2012. Line with solid circles indicates the percentage of sets made on
FAD-associated schools over free-swimming schools. Grey solid line indicates the 50% value.
Figure 6. Total fishery production. Catch by species of the French purse seine fishing fleet during 1991-2012.
2686

Figure 7. Fishery production by major fishing mode. Catch by species of the French purse seine fishing fleet on
(a) FAD-associated and (b) free-swimming schools during 1991-2012.
Figure 8. Spatial distribution of tuna catches of the French purse seine fishing fleet in 2012.
2687

Figure 9. Spatial distribution of tuna catches of the French purse seine fishing fleet made on FAD-associated
schools in 2012.
Figure 10. Spatial distribution of tuna catches of the French purse seine fishing fleet made on FSC-associated
schools in 2012.
2688

Figure 11. (a-b) Annual number of sets per searching day and (c-d) catch per positive set on (left panel) FAD-
associated and (right panel) free-swimming schools for the French purse seine fishing fleet in the Atlantic Ocean
during 1991-2012 .
Figure 12. Annual catch rates (in t per searching day) of the French purse seine fishing fleet on (a) FAD-
associated and (b) free-swimming schools in the Atlantic Ocean during 1991-2012.
2689

Figure 13. Size distribution of the catch (in numbers) for the French purse seine fleet in 2012 (red line) and for
an average year representing the period 2007-2011 (black line).
2690

Figure 14. Size distribution (in weight) of the catch for the French purse seine fleet in 2012 (red line) and for an
average year representing the period 2007-2011 (black line).
2691

Figure 15. Annual time series of mean weight (kg) for (a) yellowfin, (b) skipjack, and (c) bigeye tuna for each
fishing mode during 1991-2012.
2692
Related Documents