Inf Syst Front (2006) 8: 9–20 DOI 10.1007/s10796-005-6099-z Statistical methods for meta-analysis of microarray data: A comparative study Pingzhao Hu · Celia M. T. Greenwood · Joseph Beyene C Springer Science + Business Media, Inc. 2006 Abstract Systematic integration of microarrays from dif- ferent sources increases statistical power of detecting differ- entially expressed genes and allows assessment of hetero- geneity. The challenge, however, is in designing and imple- menting efficient analytic methodologies for combining data generated by different research groups and platforms. The widely used strategy mainly focuses on integrating prepro- cessed data without having access to the original raw data that yielded the initial results. A main disadvantage of this strategy is that the quality of different data sets may be highly variable, but this information is neglected during the integra- tion. We have recently proposed a quality-weighting strategy to integrate Affymetrix microarrays. The quality measure is a function of the detection p-values, which indicate whether a transcript is reliably detected or not on Affymetrix gene chip. In this study, we compare the proposed quality-weighted P. Hu Program in Genetics and Genomic Biology, The Hospital for Sick Children Research Institute, 555 University Ave., Toronto, ON, M5G 1X8, Canada e-mail: [email protected] C. M. T. Greenwood Department of Public Health Sciences, University of Toronto, Program in Genetics and Genomic Biology, The Hospital for Sick Children Research Institute, 555 University Ave., Toronto, ON, M5G 1X8, Canada e-mail: [email protected] J. Beyene () Department of Public Health Sciences, University of Toronto, Program in Population Heath Sciences, The Hospital for Sick Children Research Institute, 555 University Ave., Toronto, ON, M5G 1X8, Canada e-mail: [email protected] strategy with the traditional quality-unweighted strategy, and examine how the quality weights influence two commonly used meta-analysis methods: combining p-values and com- bining effect size estimates. The methods are compared on a real data set for identifying biomarkers for lung cancer. Our results show that the proposed quality-weighted strategy can lead to larger statistical power for identifying differentially expressed genes when integrating data from Affymetrix microarrays. Keywords Meta-analysis · Quality weight · Microarray Introduction Different research groups may perform gene expression mi- croarray experiments designed to answer similar biological questions. Intuitively, it seems straightforward to combine results from these studies in order to obtain more power to detect differences and improved ability to distinguish be- tween true and false positive results. The challenge is how to compare and integrate these data sets in order to make robust conclusions. Meta-analysis is a classical statistical method- ology for combining results from different studies addressing the same scientific questions, and it is becoming particularly popular in the area of medical and epidemiological research (Olkin, 1992). Meta-analytic methods have recently been ap- plied to analyze microarray data (Rhodes et al., 2002; Choi et al., 2003; Moreau et al., 2003; Stevens and Doerge, 2005; Hu, Greenwood, and Beyene, 2005). Prior applications of the meta-analysis approaches to microarray data have either sought to combine p-values (Rhodes et al., 2002) or combine effect sizes (Choi et al., 2003; Stevens and Doerge, 2005; Hu, Celia, and Beyene, 2005) from different studies. Springer

Welcome message from author
This document is posted to help you gain knowledge. Please leave a comment to let me know what you think about it! Share it to your friends and learn new things together.
Transcript
Inf Syst Front (2006) 8: 9–20
DOI 10.1007/s10796-005-6099-z
Statistical methods for meta-analysis of microarray data:A comparative studyPingzhao Hu · Celia M. T. Greenwood · Joseph Beyene
C© Springer Science + Business Media, Inc. 2006
Abstract Systematic integration of microarrays from dif-
ferent sources increases statistical power of detecting differ-
entially expressed genes and allows assessment of hetero-
geneity. The challenge, however, is in designing and imple-
menting efficient analytic methodologies for combining data
generated by different research groups and platforms. The
widely used strategy mainly focuses on integrating prepro-
cessed data without having access to the original raw data
that yielded the initial results. A main disadvantage of this
strategy is that the quality of different data sets may be highly
variable, but this information is neglected during the integra-
tion.
We have recently proposed a quality-weighting strategy to
integrate Affymetrix microarrays. The quality measure is a
function of the detection p-values, which indicate whether a
transcript is reliably detected or not on Affymetrix gene chip.
In this study, we compare the proposed quality-weighted
P. HuProgram in Genetics and Genomic Biology, The Hospital for SickChildren Research Institute, 555 University Ave., Toronto, ON,M5G 1X8, Canadae-mail: [email protected]
C. M. T. GreenwoodDepartment of Public Health Sciences, University of Toronto,Program in Genetics and Genomic Biology, The Hospital for SickChildren Research Institute, 555 University Ave., Toronto, ON,M5G 1X8, Canadae-mail: [email protected]
J. Beyene (�)Department of Public Health Sciences, University of Toronto,Program in Population Heath Sciences, The Hospital for SickChildren Research Institute, 555 University Ave., Toronto, ON,M5G 1X8, Canadae-mail: [email protected]
strategy with the traditional quality-unweighted strategy, and
examine how the quality weights influence two commonly
used meta-analysis methods: combining p-values and com-
bining effect size estimates. The methods are compared on a
real data set for identifying biomarkers for lung cancer.
Our results show that the proposed quality-weighted
strategy can lead to larger statistical power for identifying
differentially expressed genes when integrating data from
Affymetrix microarrays.
Keywords Meta-analysis · Quality weight · Microarray
Introduction
Different research groups may perform gene expression mi-
croarray experiments designed to answer similar biological
questions. Intuitively, it seems straightforward to combine
results from these studies in order to obtain more power to
detect differences and improved ability to distinguish be-
tween true and false positive results. The challenge is how to
compare and integrate these data sets in order to make robust
conclusions. Meta-analysis is a classical statistical method-
ology for combining results from different studies addressing
the same scientific questions, and it is becoming particularly
popular in the area of medical and epidemiological research
(Olkin, 1992). Meta-analytic methods have recently been ap-
plied to analyze microarray data (Rhodes et al., 2002; Choi
et al., 2003; Moreau et al., 2003; Stevens and Doerge, 2005;
Hu, Greenwood, and Beyene, 2005). Prior applications of
the meta-analysis approaches to microarray data have either
sought to combine p-values (Rhodes et al., 2002) or combine
effect sizes (Choi et al., 2003; Stevens and Doerge, 2005; Hu,
Celia, and Beyene, 2005) from different studies.
Springer
10 Inf Syst Front (2006) 8: 9–20
For example, Rhodes et al. (2002) combined results from
four prostate cancer microarray datasets analyzed on differ-
ent platforms. Differential expression was first assessed in-
dependently for each gene in each dataset based on a p-value.
Then the individual study p-values were combined using the
result that −2 log(p-value) has a chi-squared distribution un-
der the null hypothesis of no differential expression (Hedges
and Olkin, 1995). The analysis revealed that stronger signifi-
cance was obtained from the combined analysis than from the
individual studies. Combining p-values is useful in obtaining
more precise estimates of significance, but this method does
not indicate the direction of significance (e.g., up- or down-
regulation) nor does it provide the magnitude of the effect.
A small p-value may not necessarily correspond with a clin-
ically and biologically important effect size. Nevertheless,
integration of p-values does not require that different studies
use the same measurement scales; it is possible to combine
results from studies using completely different technologies.
Choi et al. (2003) focused on integrating effect size esti-
mates to obtain an overall estimate of the average effect size.
The effect size is normally used to measure the magnitude
of treatment effect in a given study. Using the same datasets
as those used by Rhodes et al. (2002), they demonstrated
that their method, taking into account inter-study variation,
can lead to the discovery of small but consistent expression
changes with increased sensitivity and reliability among the
datasets. In order to combine effect size estimates, it is better
for each study to measure gene expression in a similar way,
that is, on the same scale, although Choi et al. (2003) used
the method to integrate cDNA spotted data with Affymetrix
GeneChip data; these two platforms measure gene expression
on different scales.
It may be possible to use transformations so that gene ex-
pression estimates from different technologies can be com-
pared using the same scale. Previous studies (Rhodes et al.,
2002; Choi et al., 2003) have demonstrated the utility of in-
tegrating cDNA and Affymetrix microarray data; however,
many studies (Kuo et al., 2002; Jarvinen et al., 2004) have
argued that combining results from cDNA and Affymetrix
microarrays is problematic from a biological viewpoint since
the measurements represent different physical quantities.
For example, Jarvinen et al. (2004) determined the level
of concordance between microarray platforms by analyz-
ing breast cancer cell lines with in situ synthesized oligonu-
cleotide arrays, commercial cDNA microarrays and custom-
made cDNA microarrays. Their results demonstrated that
data from different microarray platforms are variable to the
extent that direct integration of data from different platforms
may be complicated and unreliable. Therefore, we focus here
solely on the Affymetrix technology platform, which has
been shown to outperform both the two-colour cDNA mi-
croarrays and two-colour Oligos, and to be less sensitive to
systematic lab effects (Irizarry et al., 2005).
In classical meta-analysis, quality measures have been
used when combining results across studies. It has been ar-
gued that studies of a higher quality will give more accu-
rate estimates of the true parameter of interest, and therefore
studies of high quality should receive a higher weight in
the analysis summarizing across studies (Tritchler, 1999). In
gene expression microarrays, many genes may be “off” or
not detectable in a particular adult tissue, and in addition,
some genes may be poorly measured due to probes that are
not sufficiently sensitive or specific. Therefore, the signal
strength and clarity will vary across the genes, suggesting
that a quality measurement could highlight strong clear sig-
nals. It is still an open question how to best measure the
quality of a gene expression measurement, and how best to
use such a quality measure. In a recent study (Hu, Celia,
and Beyene, 2005), we proposed a quality measure based on
the detection p-values estimated from Affymetrix microar-
ray raw data (Affymetrix, 2001). Using an effect-size model,
we demonstrated that the incorporation of quality weights
into the study-specific test statistics, within a meta-analysis
of two Affymetrix microarray studies, produced more bio-
logical meaningful results than the unweighted analysis.
Our ability to develop powerful statistical methods for ef-
ficiently integrating related genomic experiments is critical
to the success of the massive investment made on genomic
studies. Therefore, it is very important to evaluate the advan-
tages and disadvantages of different integrating strategies and
methods. Here, we compare two data-integration techniques,
the effect-size model and Fisher’s method of combining p-
values, and we evaluate the performance of quality-weighted
and unweighted versions of these two approaches when inte-
grating results from Affymetrix gene expression microarray
experiments.
Methods
Data source and preprocessing
We selected two Affymetrix microarray data sets (Beer et al.,
2002; Bhattacharjee et al., 2001), which were collected using
different versions of the Affymetrix oligonucleotide microar-
rays and were conducted by two research groups, one from
Harvard and the other from Michigan. The Michigan study
used the HuGeneFL Affymetrix chip, containing 7,129 probe
sets, each with 20 probe pairs. This study included 86 lung
adenocarcinoma patient samples and 10 normal samples. The
Harvard study used the HG U95Av2 chip with 12,625 probe
sets, each with 16 probe pairs. This study included 17 nor-
mal and 127 lung adenocarcinoma patient samples. Our main
objective is to identify differentially expressed genes related
to lung adenocarcinoma. We normalized and summarized
probe level data using the robust multi-array average (RMA)
Springer
Inf Syst Front (2006) 8: 9–20 11
algorithm (Irizarry et al., 2003). There are 6124 common
probe sets in these two studies considered for integration
across studies. These 6124 probe sets were selected by using
a sequence-based probe matching method, which has been
shown to identify consistent signals when comparing datasets
produced by different microarray platforms (Brigham et al.,
2004). Details on the probe selection method are found in the
Data processing Section of (Jiang et al., 2004).
Quality measures for Affymetrix GeneChip data
Recently, we have developed a quality measure based on the
detection algorithm proposed by Affymetrix (2001) to de-
fine the quality of measurement of a particular transcript in
a study (Hu, Celia, and Beyene, 2005). The detection algo-
rithm compares the Perfect Match (PM) and Mismatch (MM)
intensities to evaluate whether PM is primarily greater than
MM, and whether both numbers are greater than a detection
limit, and this algorithm generates a detection p-value. A
low detection p-value is an indicator that the perfect match
expression signals are consistently larger than the mismatch
signals, and hence that the mRNA level is consistently mea-
sured. Using these detection p-values, we defined a measure
of quality qg that applies to gene g in each study (for all arrays
in that study), built on the assumption that the detection p-
values follow an exponential distribution with one-parameter
λw within experimental group w(w = 1, 2, . . . , W ) in each
study. The parameters λw for each gene, study and group w
can be estimated by maximum likelihood estimation (MLE).
It is well-known that MLEs have several asymptotically op-
timal properties (Knight, 2000). Therefore, we can define the
quality measure across the groups, for gene g in each study
as:
qg = maxw∈{1,2,...,W }
[exp(λ̂w log s)],
The quantity s is a sensitivity parameter that can be varied to
alter the tolerance of the quality weight to the detection p-
value significance levels (see Hu, Celia, and Beyene (2005)
and Supplemental Materials for details). Alternatively, we
can also treat the detection p-value pagj as a quality measure-
ment for gene g and array j (unpublished manuscript).
Meta-analysis of Affymetrix microarrays in a
quality-weighted framework
Traditionally, meta-analysis approaches, such as combining
p-values (Rhodes et al., 2002) or combining effect sizes
(Choi et al., 2003) to integrate microarrays, are carried out
within a quality-unweighted framework (Rhodes et al., 2002;
Choi et al., 2003; Moreau et al., 2003; Kuo et al., 2002;
Stevens and Doerge, 2005). Different strategies can be con-
sidered for incorporating quality weights into meta-analysis.
For example, we can define a quality threshold and only in-
clude genes that are above this threshold in the meta-analysis.
However, the choice of threshold will be arbitrary. A more
interesting strategy that we consider here is to use quality
scores as weights in the same way as the statistical weights
are currently used in modelling.
We have previously used our quality weights in a meta-
analysis of two datasets using an effect size model based
on the mean difference in expression levels (Hu, Celia, and
Beyene, 2005). Here, we compare this approach to a data-
integration method based on the p-value. Quality-weighted
results are compared to unweighted results. The methods
described here could also be applied to combine data from
other microarray technologies, such as cDNA microarrays,
if suitable quality measures for those types of microarrays
can be defined. In the following, we describe how weights
are used when combining p-values as well as effect sizes
from different studies. The two quality-unweighted methods
are special cases of the quality-weighted approaches corre-
sponding to assigning a quality-weight of 1 for each gene
in each study. Therefore, the methods described in the fol-
lowing sections are presented within the quality-weighted
framework.
Suppose we are interested in comparing two groups of
microarrays, such as treatment (t) and control (c) groups, in
study i = 1, 2, . . . , I , which means that W = 2. For each
study, let nt and nc denote the number of arrays (samples) in
the treatment group and control group, respectively.
A. Fisher’s method for combining p-values with
quality-adjusted weights
In an individual microarray study, one of the commonly
asked questions is: which genes are differentially expressed
between two groups? A number of statistical tests, such as
the standard t-statistics (Radmacher, McShane, and Simon,
2002), SAM (Tusher, Tibshirani, and Chu, 2001), regular-
ized t-statistics (Jain et al., 2003) and penalized t-statistics
(Smyth, 2004), have been proposed and applied to detect
differentially expressed genes between the two groups. Each
method reports a p-value expressing the probability that the
observed level of differential expression could have occurred
by chance. Since the focus of this paper is not to evalu-
ate which test statistic is the best, we follow previous stud-
ies on meta-analysis of microarrays (Rhodes et al., 2002;
Moreau et al., 2003), which tested for differentially expressed
genes using the standard t-statistics. We use the standard t-statistic formula for quality weighting the expression inten-
sities within the test statistic, assuming unequal variances.
Springer
12 Inf Syst Front (2006) 8: 9–20
For gene g and study i , we calculate a weighted t-statistic
twegi = x̄qgt − x̄qgc√
s2qgt
/nt + s2
qgc
/nc
where
x̄qgw =∑j∈w
q∗g j ∗ xgj
/ ∑j∈w
q∗g j
is the quality weighted mean in group w = t, c and the qual-
ity weighted variance S2qgw are defined similarly (see Supple-
mental Materials and SAS, 2003). xgj is the gene expression
value for gene g and array j , q∗g j is the quality for gene g and
array j and equal to 1 − pagj . We then convert this statistic
to a p-value,pwegi , by reference to the t-distribution with the
degree of freedom determined by the Satterthwaite’s approx-
imation (Satterthwaite, 1946). Further details are provided in
the Supplemental Materials. For an unweighted analysis, the
weights are set to 1.0.
After computing the gene specific weighted p-values
(pwegi ) for all the studies separately, we then combine these
p-values, by using the Fisher statistic (Hedges and Olkin,
1995). The Fisher statistic for gene g is given by
Sweg = −2 log(pg1) − · · · − 2 log(pgI )
where pgi is the gene-specific p-value (pwegi ) for the ith study.
To evaluate the significance of the Fisher statistics Sweg for
gene g, we compute a meta-analysis p-value (pSg ) for the
summary statistic. The theoretical distribution of the sum-
mary statistic Sweg under the null-hypothesis is pS
g ∼ χ22I .
B. The effect size method for meta-analysis with
weights
In a microarray experiment with two groups, the effect size
refers to the magnitude of difference between the two groups’
means. In meta-analysis, the basic principle is to calculate
the effect sizes for each gene in individual studies, convert
them to a common metric, and then combine them to obtain
an average effect size. Once the mean effect size has been
calculated it can be expressed in terms of standard normal
deviates (Z score) by dividing the mean difference by its
standard error. A significance p-value of obtaining the Zscore of such magnitude by chance can them be computed.
B1. Measuring effect size
There are many ways to measure effect size yg for gene
g in any individual study (Cooper and Hedges, 1994). A
commonly used method is the standardized mean difference,
which is given by
yg = (x̄gt − x̄gc)
Spoolg
,
where x̄gt and x̄gc are the sample means of gene expression
values for gene g in treatment group (t) and control group
(c) of a given study, respectively. Spoolg is the pooled standard
deviation. The estimated variance s2g of the unbiased effect
size yg is given by
s2g = (1/nt + 1/nc) + y2
g(2(nt + nc))−1
For a study with n = nt + nc samples, an approximately un-
biased estimate of yg is given by y∗g = yg − 3yg/(4n − 9)
(Hedges and Olkin, 1995). Hu, Celia, and Beyene (2005)
and the Supplemental Materials give details of how this ef-
fect size model can be modelled.
B2. Fixed versus random effects models with
quality-adjusted weights
We follow Hu, Celia, and Beyene (2005) to place the esti-
mated effect yg into a hierarchical model:
{yg = θg + εg, εg ∼ N
(0, σ 2
g
)θg = μg + δg, δg ∼ N
(0, τ 2
g
),
where σ 2g and τ 2
g are the within-study and between-study
variability of gene g, respectively. When τg = 0, we use
fixed-effects model (FEM) to combine the effect sizes from
individual studies. Otherwise, we use random-effects model
(REM). Here, τ 2g and μg are gene-specific while σ 2
g and yg are
gene and study-specific. μg measures the average expression
across the studies for gene g.
To assess whether FEM or REM is most appropriate, we
tested the hypothesis τg = 0 to examine the adjusted and
unadjusted quantile–quantile (Q–Q) plots of the observed
versus expected inter-study heterogeneity, as measured by
the statistic Q (see Supplemental Materials). If the null hy-
pothesis of τg = 0 is rejected, we estimate τg based on the
method developed by DerSimonian and Laird (1986).
We then defined the meta-analysis p-value (pZg ) as the
measure of significance combined across studies using the
effect size models. The theoretical distribution of the sum-
mary statistic Z2g under the null-hypothesis is Z2
g ∼ χ21 (see
Supplemental Materials).
Springer
Inf Syst Front (2006) 8: 9–20 13
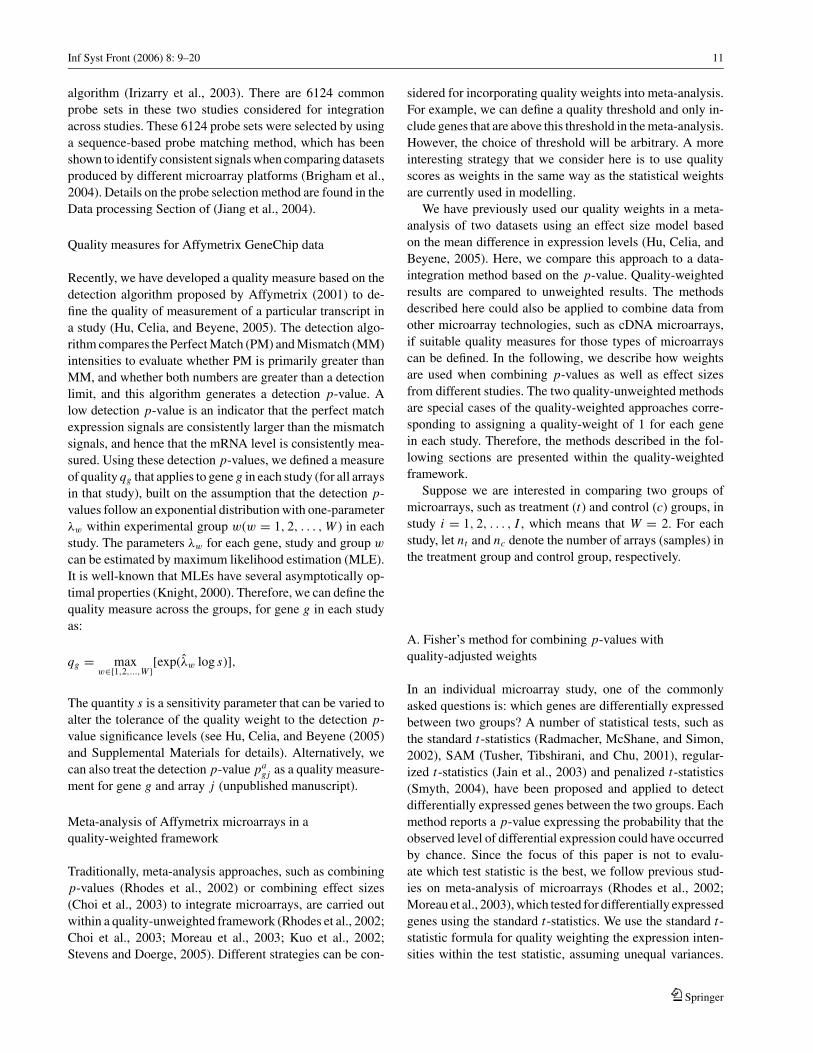
Fig. 1 Quantile-quantile plotsof the observed versus theexpected Q statistics
Results
As we can see in Fig. 1, the quantiles of the observed Q values
are far from the expected quantiles of a χ21 distribution in both
the quality-adjusted as well as unadjusted cases, suggesting
that these two data sets generated heterogeneous results be-
yond random sampling errors. Therefore, the random effect
model was applied to these data sets. The quality-adjusted
quantiles (squares) of the observed Q statistic were closer to
the quantiles of the expected chi-square distribution than the
unadjusted quantiles (diamonds). This result suggests that
incorporation of the adjusted quality measure into effect size
estimation can decrease apparent evidence for heterogeneity
between these two datasets.
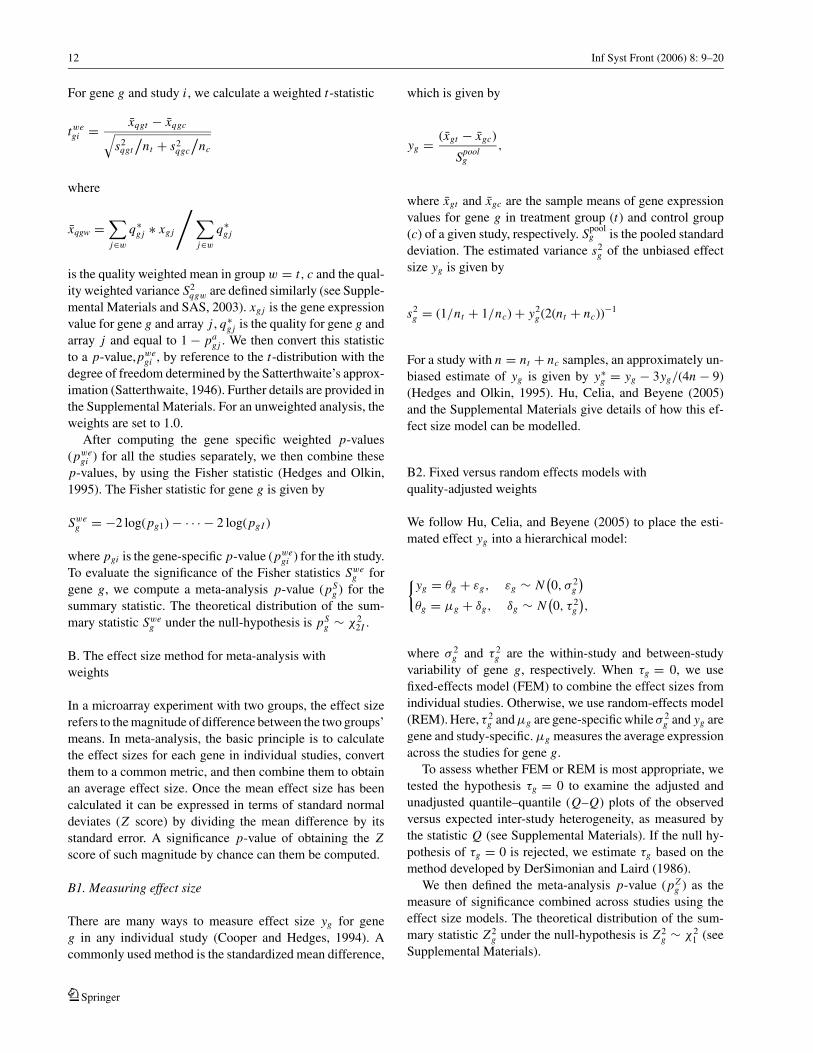
We then explored the relationship between the z statis-
tics (based on the effect size model with random effects) and
the Fisher statistics, under quality-weighted and unweighted
frameworks. The Pearson correlations between the weighted
and unweighted z statistics, and the weighted and unweighted
Fisher statistics are very similar, at 0.96 and 0.94, respec-
tively. Figure 2 shows the weighted and unweighted statistics.
As we can see from Fig. 2(a), for strongly down-regulated
genes (genes with negative z statistic values), especially the
genes with z statistic smaller than −5 (p-value = 5.73 ∗10−7), the weighted z statistic values are often even smaller
than the unweighted z statistic values, implying larger treat-
ment differences. The converse is seen for the Fisher statistics
(Fig. 2(b)). For example, for genes with Fisher statistic larger
than 60 (p-value = 2.9 ∗ 10−12), the weighted Fisher statis-
tic values are usually smaller than their unweighted counter-
part. Therefore, the weighting strategy may boost the effect
sizes for some genes in the random effect size model, yet
may increase the p-values for some extremely differentially
expressed genes in the Fisher test method. We will further
discuss this issue later in this section.
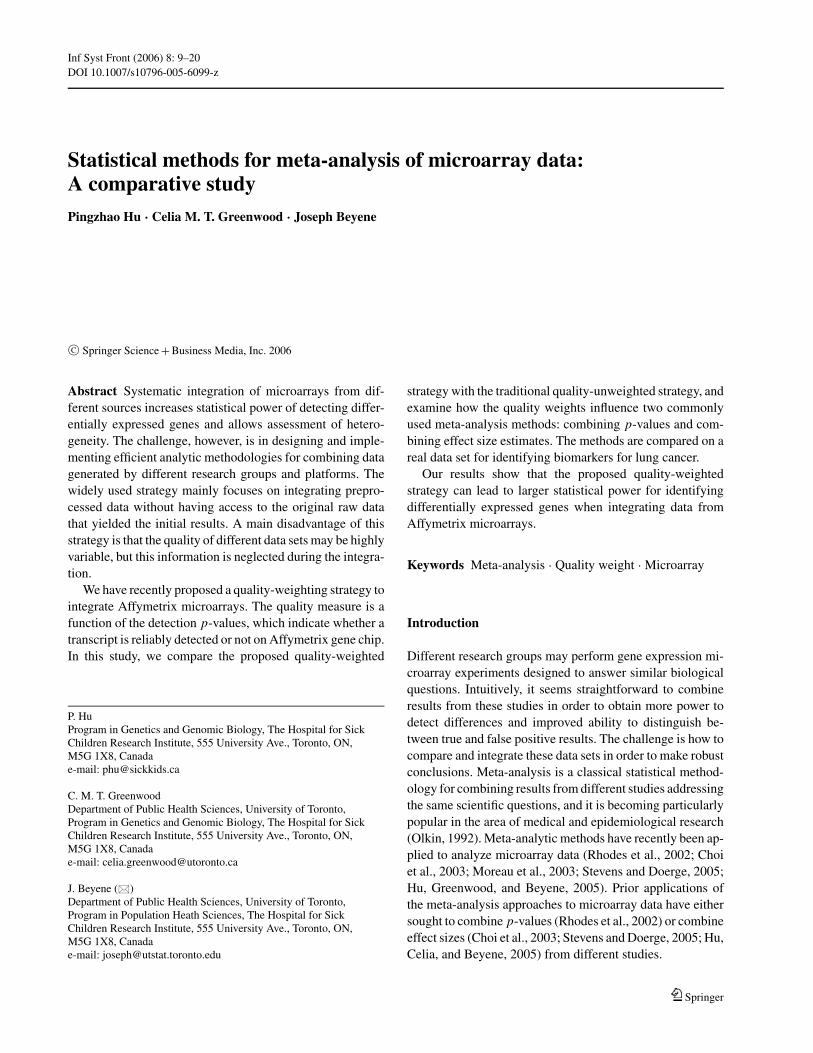
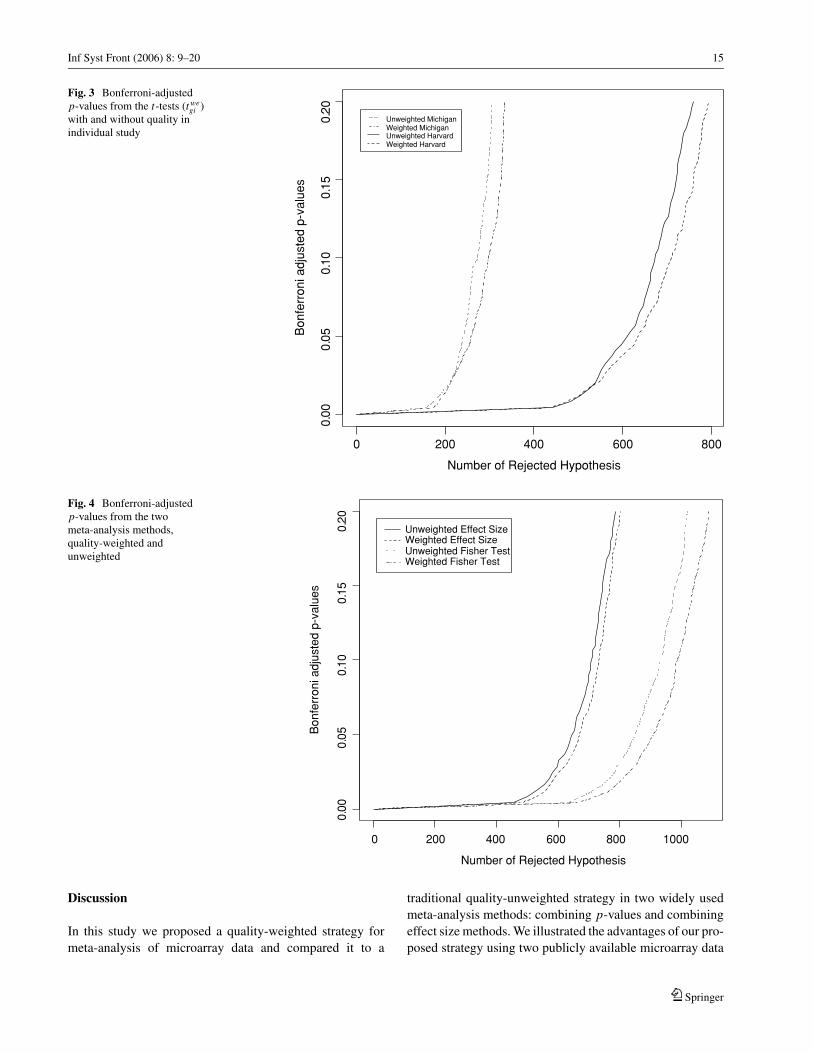
Before performing integrative analysis of the two data sets,
we examined the results of the Harvard and Michigan studies
individually using standard t statistics, with either weighted
or unweighted strategies. The raw p-values were adjusted
for multiple testing using the Bonferroni method. Figure 3
depicts plots of Bonferroni adjusted p-values for the two
studies using weighted and unweighted methods. As we see
in this figure, the quality-weighted t-statistics (dotted-dashed
line for Michigan study and dashed line for Harvard study)
detect more significant genes than the quality-unweighted t-statistics (dotted for Michigan study and solid for Harvard
study) for most fixed type I error levels. For an adjusted
p-value cutoff of 0.05, we identified 637 and 614 differen-
tially expressed genes in the Harvard study using weighted
and unweighted t-statistics, respectively, and 260 (weighted)
and 240 (unweighted) differentially expressed genes in the
Michigan study. There are many more genes showing differ-
ential expression in the Harvard study than in the Michigan
study, possibly because the Michigan study used an older
Affymetrix chip type , than the one used in the Harvard
study.
Springer
14 Inf Syst Front (2006) 8: 9–20
Fig. 2 Quality-weighted versus unweighted statistics: (a) the effect sizemodel and (b) Fisher statistics
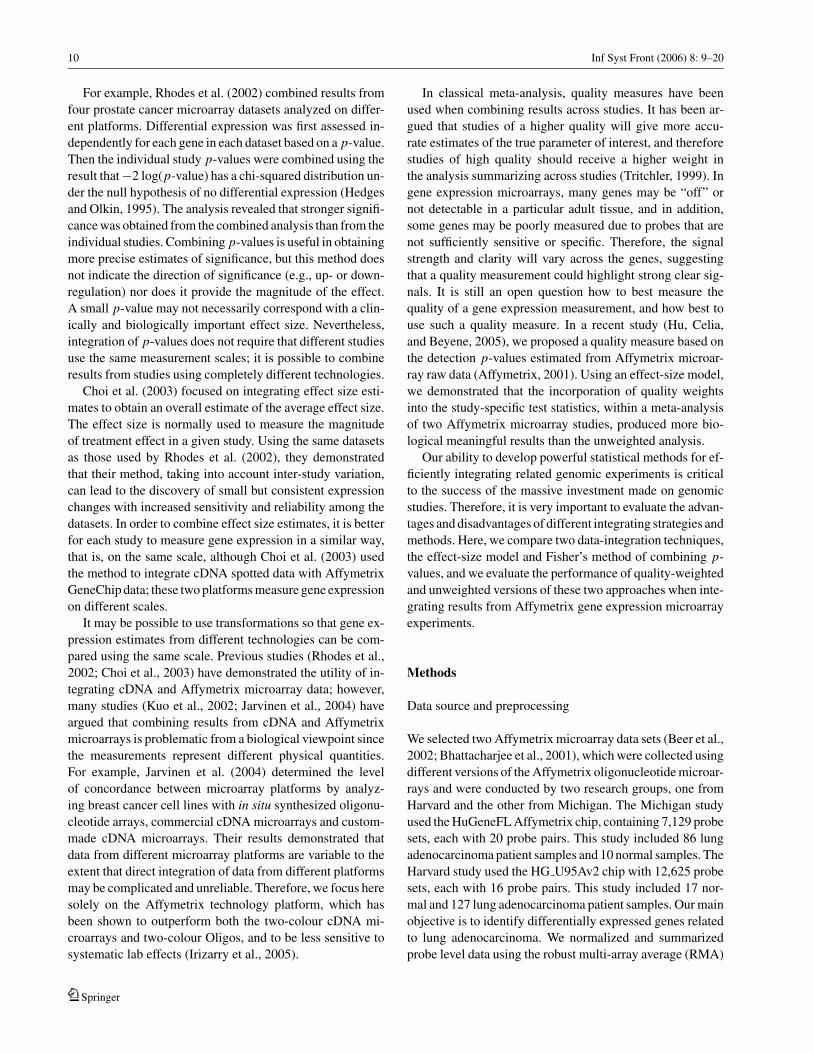
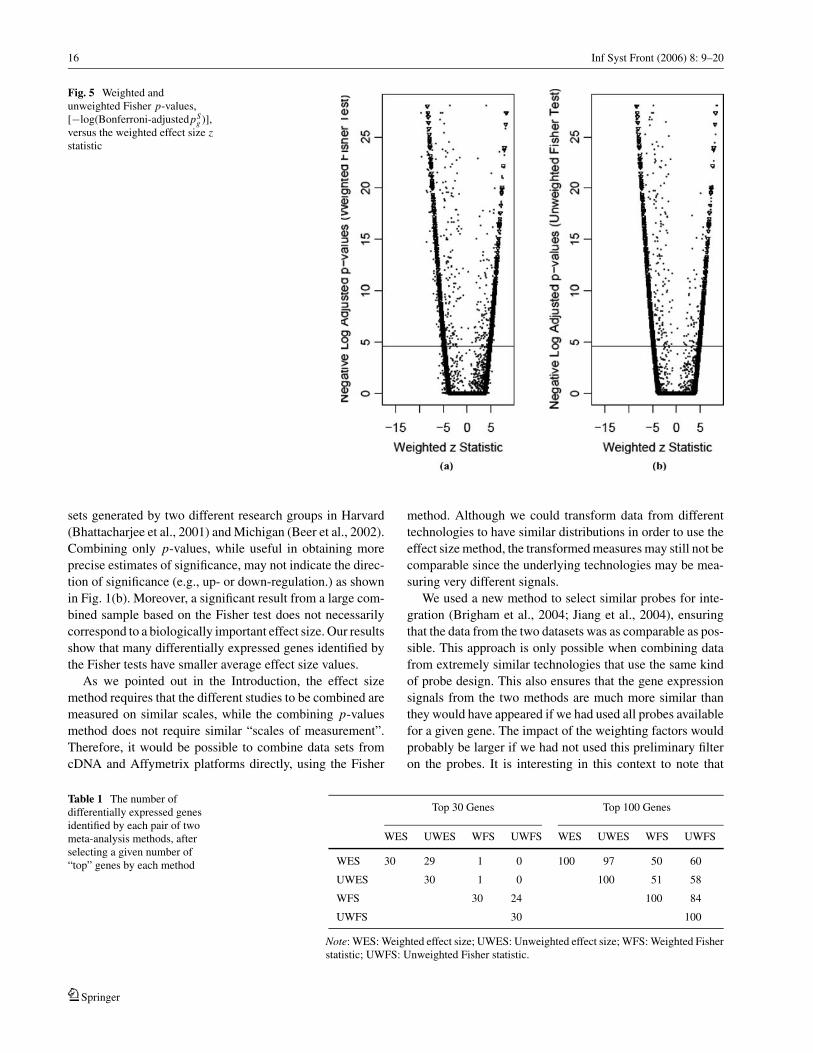
We then calculated our meta-analysis statistics for these
two data sets using weighted and unweighted Fisher statis-
tics and the random effect size models, respectively. Figure
4 depicts Bonferroni adjusted p-value plots of the two meta-
analysis methods with and without quality weighting. Simi-
lar to Fig. 3, we observed that the quality-weighted strategy
(dashed for random effect size model and dotted dash for
Fisher test) leads to the identification of many more differen-
tially expressed genes than the quality-unweighted strategy
(solid for random effect model and dotted for Fisher test) at
any fixed level of adjusted p-values. With again an adjusted
type I error of 0.05, we identified 910 and 850 differentially
expressed genes using the weighted and unweighted Fisher
tests, and 671 and 645 differentially expressed genes using
weighted and unweighted random effect size models, respec-
tively. It is also obvious that the meta-analysis of the two data
sets identifies many more differentially expressed genes than
individual analysis of either of the two data sets.
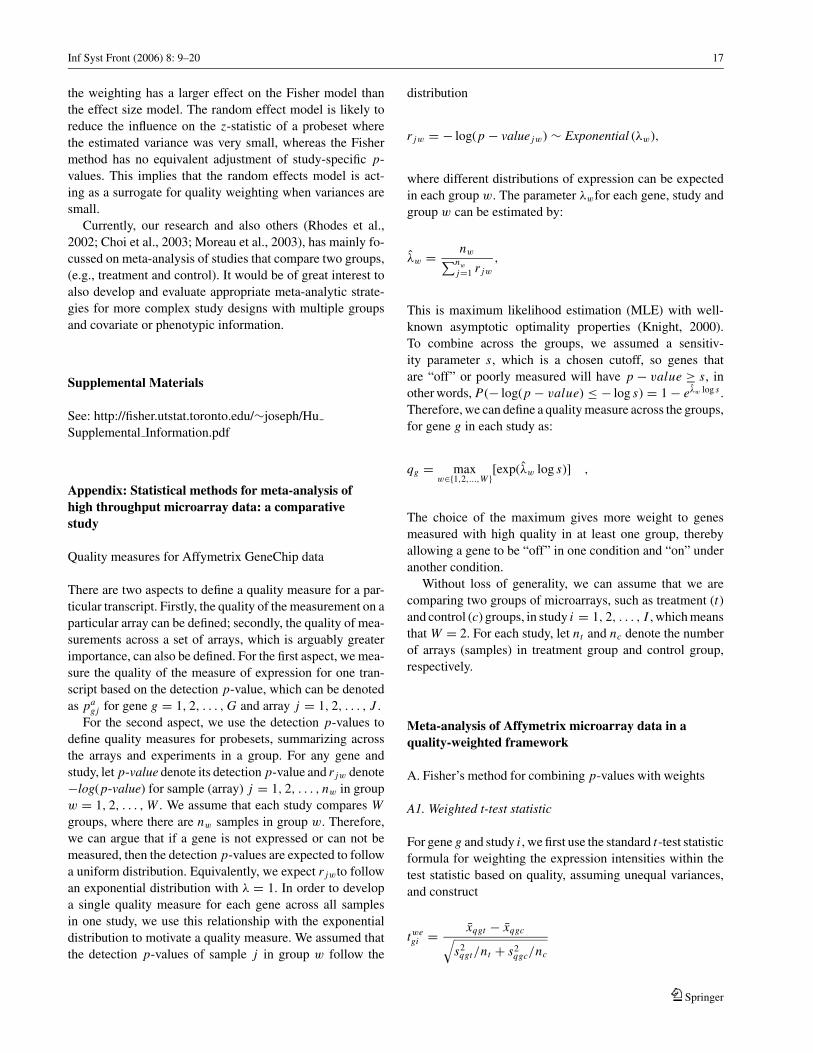
Figure 4 shows that the Fisher test identifies more differen-
tially expressed genes than the random effect size models in
both the weighted and unweighted frameworks. Therefore,
we further investigated the relationship between these two
methods for meta-analysis in the scatter plots shown in Fig. 5.
The –log(Bonferroni-adjusted p-values) for the weighted and
unweighted Fisher method are shown in Figs. 5(a) and 5(b)
respectively, and are plotted against the weighted z-statistic
values from the random effect size models (For comparison,
we also put the −log(Bonferroni-adjusted p-values) (inverse
triangle) for the weighted z-statistic in the plot). It can be seen
that for many genes, the estimated effect size is closer to zero
than might be anticipated from the Fisher-method p-value.
Such cases may correspond to genes that were up-regulated
in one study and down-regulated in the other, or to genes
where the treatment difference was much smaller in one study
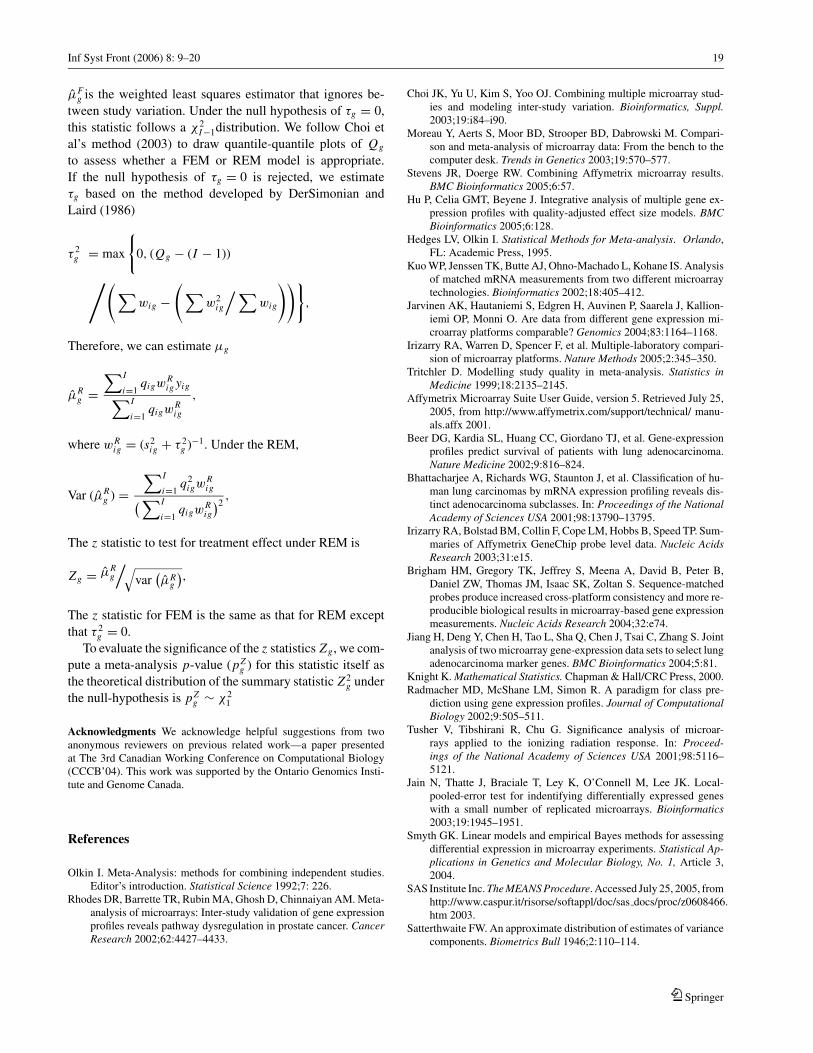
than the other. For each of the four meta-analysis methods
(weighted and unweighted random effect size models and
Fisher tests), we selected the top 30 and 100 genes, respec-
tively, by ranking the absolute value of the appropriate statis-
tics. We then counted the common differentially expressed
genes identified in each pair of meta-analysis methods. As we
can see in Table 1, there are almost no genes that were iden-
tified by both methods among the top 30 genes, although the
overlap improves when the top 100 genes are examined. Note
also that the agreement between weighted and unweighted
analyses is greater for the effect size method than the Fisher
method.
Our previous work (Hu, Celia, and Beyene, 2005) and
also other studies (Beer et al., 2002; Bhattacharjee et al.,
2001; Jiang et al., 2004) showed that most of the top 30
genes identified by the random effect size methods are bi-
ologically relevant to lung adenocarcinoma and were iden-
tified by other studies (Beer et al., 2002; Bhattacharjee et
al., 2001; Jiang et al., 2004), but the Fisher test method
did not detect these genes. However, only few of the top
30 genes detected by the Fisher test were also identified
in the above studies. Therefore, it may be that although
the Fisher tests can identify many more differentially ex-
pressed genes than the random effect size models, the top
genes identified by the Fisher test may be less biologi-
cally relevant than those detected by the random effect size
models.
Springer
Inf Syst Front (2006) 8: 9–20 15
0 200 400 600 800
0.0
00.0
50.1
00.1
50.2
0
Number of Rejected Hypothesis
Bo
nfe
rro
ni a
dju
ste
d p
-va
lue
s
Unweighted MichiganWeighted MichiganUnweighted HarvardWeighted Harvard
Fig. 3 Bonferroni-adjustedp-values from the t-tests (twe
gi )with and without quality inindividual study
0 200 400 600 800 1000
0.0
00.0
50.1
00.1
50.2
0
Number of Rejected Hypothesis
Bo
nfe
rro
ni a
dju
ste
d p
-va
lue
s
Unweighted Effect SizeWeighted Effect SizeUnweighted Fisher TestWeighted Fisher Test
Fig. 4 Bonferroni-adjustedp-values from the twometa-analysis methods,quality-weighted andunweighted
Discussion
In this study we proposed a quality-weighted strategy for
meta-analysis of microarray data and compared it to a
traditional quality-unweighted strategy in two widely used
meta-analysis methods: combining p-values and combining
effect size methods. We illustrated the advantages of our pro-
posed strategy using two publicly available microarray data
Springer
16 Inf Syst Front (2006) 8: 9–20
Fig. 5 Weighted andunweighted Fisher p-values,[−log(Bonferroni-adjustedpS
g )],versus the weighted effect size zstatistic
sets generated by two different research groups in Harvard
(Bhattacharjee et al., 2001) and Michigan (Beer et al., 2002).
Combining only p-values, while useful in obtaining more
precise estimates of significance, may not indicate the direc-
tion of significance (e.g., up- or down-regulation.) as shown
in Fig. 1(b). Moreover, a significant result from a large com-
bined sample based on the Fisher test does not necessarily
correspond to a biologically important effect size. Our results
show that many differentially expressed genes identified by
the Fisher tests have smaller average effect size values.
As we pointed out in the Introduction, the effect size
method requires that the different studies to be combined are
measured on similar scales, while the combining p-values
method does not require similar “scales of measurement”.
Therefore, it would be possible to combine data sets from
cDNA and Affymetrix platforms directly, using the Fisher
method. Although we could transform data from different
technologies to have similar distributions in order to use the
effect size method, the transformed measures may still not be
comparable since the underlying technologies may be mea-
suring very different signals.
We used a new method to select similar probes for inte-
gration (Brigham et al., 2004; Jiang et al., 2004), ensuring
that the data from the two datasets was as comparable as pos-
sible. This approach is only possible when combining data
from extremely similar technologies that use the same kind
of probe design. This also ensures that the gene expression
signals from the two methods are much more similar than
they would have appeared if we had used all probes available
for a given gene. The impact of the weighting factors would
probably be larger if we had not used this preliminary filter
on the probes. It is interesting in this context to note that
Table 1 The number ofdifferentially expressed genesidentified by each pair of twometa-analysis methods, afterselecting a given number of“top” genes by each method
Top 30 Genes Top 100 Genes
WES UWES WFS UWFS WES UWES WFS UWFS
WES 30 29 1 0 100 97 50 60
UWES 30 1 0 100 51 58
WFS 30 24 100 84
UWFS 30 100
Note: WES: Weighted effect size; UWES: Unweighted effect size; WFS: Weighted Fisherstatistic; UWFS: Unweighted Fisher statistic.
Springer
Inf Syst Front (2006) 8: 9–20 17
the weighting has a larger effect on the Fisher model than
the effect size model. The random effect model is likely to
reduce the influence on the z-statistic of a probeset where
the estimated variance was very small, whereas the Fisher
method has no equivalent adjustment of study-specific p-
values. This implies that the random effects model is act-
ing as a surrogate for quality weighting when variances are
small.
Currently, our research and also others (Rhodes et al.,
2002; Choi et al., 2003; Moreau et al., 2003), has mainly fo-
cussed on meta-analysis of studies that compare two groups,
(e.g., treatment and control). It would be of great interest to
also develop and evaluate appropriate meta-analytic strate-
gies for more complex study designs with multiple groups
and covariate or phenotypic information.
Supplemental Materials
See: http://fisher.utstat.toronto.edu/∼joseph/Hu
Supplemental Information.pdf
Appendix: Statistical methods for meta-analysis ofhigh throughput microarray data: a comparativestudy
Quality measures for Affymetrix GeneChip data
There are two aspects to define a quality measure for a par-
ticular transcript. Firstly, the quality of the measurement on a
particular array can be defined; secondly, the quality of mea-
surements across a set of arrays, which is arguably greater
importance, can also be defined. For the first aspect, we mea-
sure the quality of the measure of expression for one tran-
script based on the detection p-value, which can be denoted
as pagj for gene g = 1, 2, . . . , G and array j = 1, 2, . . . , J .
For the second aspect, we use the detection p-values to
define quality measures for probesets, summarizing across
the arrays and experiments in a group. For any gene and
study, let p-value denote its detection p-value and r jw denote
−log(p-value) for sample (array) j = 1, 2, . . . , nw in group
w = 1, 2, . . . , W . We assume that each study compares Wgroups, where there are nw samples in group w. Therefore,
we can argue that if a gene is not expressed or can not be
measured, then the detection p-values are expected to follow
a uniform distribution. Equivalently, we expect r jwto follow
an exponential distribution with λ = 1. In order to develop
a single quality measure for each gene across all samples
in one study, we use this relationship with the exponential
distribution to motivate a quality measure. We assumed that
the detection p-values of sample j in group w follow the
distribution
r jw = − log(p − value jw) ∼ Exponential (λw),
where different distributions of expression can be expected
in each group w. The parameter λwfor each gene, study and
group w can be estimated by:
λ̂w = nw∑nw
j=1 r jw,
This is maximum likelihood estimation (MLE) with well-
known asymptotic optimality properties (Knight, 2000).
To combine across the groups, we assumed a sensitiv-
ity parameter s, which is a chosen cutoff, so genes that
are “off” or poorly measured will have p − value ≥ s, in
other words, P(− log(p − value) ≤ − log s) = 1 − eλ̂w log s .
Therefore, we can define a quality measure across the groups,
for gene g in each study as:
qg = maxw∈{1,2,...,W }
[exp(λ̂w log s)] ,
The choice of the maximum gives more weight to genes
measured with high quality in at least one group, thereby
allowing a gene to be “off” in one condition and “on” under
another condition.
Without loss of generality, we can assume that we are
comparing two groups of microarrays, such as treatment (t)and control (c) groups, in study i = 1, 2, . . . , I , which means
that W = 2. For each study, let nt and nc denote the number
of arrays (samples) in treatment group and control group,
respectively.
Meta-analysis of Affymetrix microarray data in aquality-weighted framework
A. Fisher’s method for combining p-values with weights
A1. Weighted t-test statistic
For gene g and study i , we first use the standard t-test statistic
formula for weighting the expression intensities within the
test statistic based on quality, assuming unequal variances,
and construct
twegi = x̄qgt − x̄qgc√
s2qgt/nt + s2
qgc/nc
Springer

18 Inf Syst Front (2006) 8: 9–20
where
x̄qgw =∑j∈w
q∗g j ∗ xgj
/ ∑j∈w
q∗g j ,
S2qgw =
∑j∈w
q∗g j∗ (xgj − x̄qgw)2
/((1 − 1/N ′
w) ∗∑j∈w
q∗g j
),
w = t, c, xgj is the gene expression value for gene gand array j and N ′
w is the number of non-zero qualities
in group w (SAS, 2003), q∗g j is the quality for gene g
and array j and equal to 1 − pagj . q∗
g j = 1.0 for an un-
weighted analysis. Therefore, we can convert the test statistic
with weighting the expression intensities (twegi ) to p-value
(pwegi ) by reference to a standard t-distribution with N =
(s2qgt/nt + s2
qgc/nc)2
1/(nt − 1)∗(s2qgt /nt )2+1
/(nc − 1)∗(s2qgc/nc)2
degree of freedom
as
pwegi = 2 ∗ (
1 − pt(∣∣twe
gi
∣∣, d f = N))
A2. Combining study-specific p-values pwegi
The study-specific p-values (pwegi ) can be combined based on
the Fisher statistic (Hedges and Olkin, 1995) as follow
Sweg = −2 log(pg1) − · · · − 2 log(pgI )
where pgi is the study and gene-specific p-values (pwegi ).
The significance of the Fisher statistics Sweg can be evalu-
ated by computing a meta-analysis p-value (pSg ). The the-
oretical distribution of the summary statistic Sweg under the
null-hypothesis ispSg ∼ χ2
2I .
B. The effect size method for meta-analysis with
weights
B1. Measuring effect size
The standardized mean difference of gene g in each study is
given by
yg = (x̄gt − x̄gc)/S poolg
.
The estimated variance s2g of the unbiased effect size yg is
given by
s2g = (1/nt + 1/nc) + y2
g(2(nt + nc))−1
For a study with n samples, an approximately unbiased esti-
mate of yg is given by y∗g = yg − 3yg/(4n − 9) (Hedges and
Olkin, 1995).
B2. Fixed versus random effects models with
quality-adjusted weights
For gene g, let μgdenote its overall mean effect size in all
studies, a measure of the average differential expression for
that gene. We then redefine the observed effect size yg for
gene g in each study as a hierarchical model:
{yg = θg + εg, εg ∼ N
(0, s2
g
)θg = μg + δg, δg ∼ N
(0, τ 2
g
),
where τ 2g is the between-study variability of gene g. Here,
τ 2g and μg are gene-specific while s2
g and yg are gene and
study-specific.
There are two ways to combine the effect sizes from in-
dividual studies: fixed effects and random effects models.
In essence, in the fixed effects model, the effect size in
the population are fixed but unknown constants. As such,
the effect size in the population is assumed to be the same
for all studies included in a meta-analysis. The alterna-
tive possibility is that the population effect sizes vary ran-
domly from study to study. In this case each study in a
meta-analysis comes from a population that is likely to
have a different effect size to any other study in the meta-
analysis.
In statistical terms the main difference between these two
models is in the calculation of standard errors associated with
the combined effect size. In a fixed-effects model (FEM), the
within-study variability s2g in their error term on the observed
effect sizes is fully assigned to sampling error only, ignoring
the between study variance, so τ 2g = 0 and yg ∼ N (μg, s2
g).
On the other hand, a random-effects model (REM) consid-
ers that each study estimates a different treatment effect
θg . These parameters are drawn from a normal distribution
θg ∼ N (μg, τ2g ).
To assess whether FEM or REM is most appropriate, we
tested the hypothesis τg = 0 using the following test statistic,
which is a modification of Cochran’s test statistic (1954) by
incorporating our quality measure qig for study iand gene
g
Qg = Ii qigwig(yig − μ̂g)2,
where wig = s−2ig and
μ̂Fg =
∑I
i=1qigwig yig∑I
i=1qigwig
,
Springer
Inf Syst Front (2006) 8: 9–20 19
μ̂Fg is the weighted least squares estimator that ignores be-
tween study variation. Under the null hypothesis of τg = 0,
this statistic follows a χ2I−1distribution. We follow Choi et
al’s method (2003) to draw quantile-quantile plots of Qg
to assess whether a FEM or REM model is appropriate.
If the null hypothesis of τg = 0 is rejected, we estimate
τg based on the method developed by DerSimonian and
Laird (1986)
τ 2g = max
{0, (Qg − (I − 1))
/( ∑wig −
( ∑w2
ig
/ ∑wig
))},
Therefore, we can estimate μg
μ̂Rg =
∑I
i=1qigw
Rig yig∑I
i=1qigw
Rig
,
where wRig = (s2
ig + τ 2g )−1. Under the REM,
Var (μ̂Rg ) =
∑I
i=1q2
igwRig( ∑I
i=1qigw
Rig
)2,
The z statistic to test for treatment effect under REM is
Zg = μ̂Rg
/√var
(μ̂R
g
),
The z statistic for FEM is the same as that for REM except
that τ 2g = 0.
To evaluate the significance of the z statistics Zg , we com-
pute a meta-analysis p-value (pZg ) for this statistic itself as
the theoretical distribution of the summary statistic Z2g under
the null-hypothesis is pZg ∼ χ2
1
Acknowledgments We acknowledge helpful suggestions from twoanonymous reviewers on previous related work—a paper presentedat The 3rd Canadian Working Conference on Computational Biology(CCCB’04). This work was supported by the Ontario Genomics Insti-tute and Genome Canada.
References
Olkin I. Meta-Analysis: methods for combining independent studies.Editor’s introduction. Statistical Science 1992;7: 226.
Rhodes DR, Barrette TR, Rubin MA, Ghosh D, Chinnaiyan AM. Meta-analysis of microarrays: Inter-study validation of gene expressionprofiles reveals pathway dysregulation in prostate cancer. CancerResearch 2002;62:4427–4433.
Choi JK, Yu U, Kim S, Yoo OJ. Combining multiple microarray stud-ies and modeling inter-study variation. Bioinformatics, Suppl.2003;19:i84–i90.
Moreau Y, Aerts S, Moor BD, Strooper BD, Dabrowski M. Compari-son and meta-analysis of microarray data: From the bench to thecomputer desk. Trends in Genetics 2003;19:570–577.
Stevens JR, Doerge RW. Combining Affymetrix microarray results.BMC Bioinformatics 2005;6:57.
Hu P, Celia GMT, Beyene J. Integrative analysis of multiple gene ex-pression profiles with quality-adjusted effect size models. BMCBioinformatics 2005;6:128.
Hedges LV, Olkin I. Statistical Methods for Meta-analysis. Orlando,FL: Academic Press, 1995.
Kuo WP, Jenssen TK, Butte AJ, Ohno-Machado L, Kohane IS. Analysisof matched mRNA measurements from two different microarraytechnologies. Bioinformatics 2002;18:405–412.
Jarvinen AK, Hautaniemi S, Edgren H, Auvinen P, Saarela J, Kallion-iemi OP, Monni O. Are data from different gene expression mi-croarray platforms comparable? Genomics 2004;83:1164–1168.
Irizarry RA, Warren D, Spencer F, et al. Multiple-laboratory compari-sion of microarray platforms. Nature Methods 2005;2:345–350.
Tritchler D. Modelling study quality in meta-analysis. Statistics inMedicine 1999;18:2135–2145.
Affymetrix Microarray Suite User Guide, version 5. Retrieved July 25,2005, from http://www.affymetrix.com/support/technical/ manu-als.affx 2001.
Beer DG, Kardia SL, Huang CC, Giordano TJ, et al. Gene-expressionprofiles predict survival of patients with lung adenocarcinoma.Nature Medicine 2002;9:816–824.
Bhattacharjee A, Richards WG, Staunton J, et al. Classification of hu-man lung carcinomas by mRNA expression profiling reveals dis-tinct adenocarcinoma subclasses. In: Proceedings of the NationalAcademy of Sciences USA 2001;98:13790–13795.
Irizarry RA, Bolstad BM, Collin F, Cope LM, Hobbs B, Speed TP. Sum-maries of Affymetrix GeneChip probe level data. Nucleic AcidsResearch 2003;31:e15.
Brigham HM, Gregory TK, Jeffrey S, Meena A, David B, Peter B,Daniel ZW, Thomas JM, Isaac SK, Zoltan S. Sequence-matchedprobes produce increased cross-platform consistency and more re-producible biological results in microarray-based gene expressionmeasurements. Nucleic Acids Research 2004;32:e74.
Jiang H, Deng Y, Chen H, Tao L, Sha Q, Chen J, Tsai C, Zhang S. Jointanalysis of two microarray gene-expression data sets to select lungadenocarcinoma marker genes. BMC Bioinformatics 2004;5:81.
Knight K. Mathematical Statistics. Chapman & Hall/CRC Press, 2000.Radmacher MD, McShane LM, Simon R. A paradigm for class pre-
diction using gene expression profiles. Journal of ComputationalBiology 2002;9:505–511.
Tusher V, Tibshirani R, Chu G. Significance analysis of microar-rays applied to the ionizing radiation response. In: Proceed-ings of the National Academy of Sciences USA 2001;98:5116–5121.
Jain N, Thatte J, Braciale T, Ley K, O’Connell M, Lee JK. Local-pooled-error test for indentifying differentially expressed geneswith a small number of replicated microarrays. Bioinformatics2003;19:1945–1951.
Smyth GK. Linear models and empirical Bayes methods for assessingdifferential expression in microarray experiments. Statistical Ap-plications in Genetics and Molecular Biology, No. 1, Article 3,2004.
SAS Institute Inc. The MEANS Procedure. Accessed July 25, 2005, fromhttp://www.caspur.it/risorse/softappl/doc/sas docs/proc/z0608466.htm 2003.
Satterthwaite FW. An approximate distribution of estimates of variancecomponents. Biometrics Bull 1946;2:110–114.
Springer
20 Inf Syst Front (2006) 8: 9–20
Cooper H, Hedges LV. The Handbook of Research Aynthesis. New York:Russell Sage 1994.
DerSimonian R, Laird NM. Meta-analysis in clinical trials. ControlledClinical Trials 1986;7:177–188.
Cochran BG. The combination of estimates from different experiments.Biometrics 1954, 10:101–129.
Pingzhao Hu has a postgraduate diploma in applied statis-
tics from Centre de Geostatistics at Ecole des Mines de Paris
in France and a master degree in computer science from
Dalhousie University in Canada. He is currently a biostatis-
tician in the Program in Genetic and Genomic Biology at
the Hospital for Sick Children Research Institute. His main
interests are in developing and applying statistical methods
and machine learning algorithms for biological data analysis.
Celia Greenwood has a Doctorate from the University of
Toronto in the field of Biostatistics, and held a postdoctoral
fellowship in Human Genetics at McGill University. She is
currently Project Director in the Program in Genetics and
Genomic Biology at the Hospital for Sick Children, Toronto,
and Assistant Professor in the Department of Public Health
Sciences at the University of Toronto. Her research interests
are in statistical genetics and gene expression microarray
analysis.
Joseph Beyene is a biostatistician and research methodol-
ogist and currently holds the positions of Scientist at the
Hospital for Sick Children Research Institute, Toronto, and
Assistant Professor in the Department of Public Health Sci-
ences and Department of Health Policy, Management & Eval-
uation at the University of Toronto. Dr Beyene is interested
in the development and application of statistical methods in
the area of health research. His specific areas of statistical
research interests include generalized linear models, meta-
analysis, statistical genomics, clinical trials, and methods for
data mining.
Springer
Related Documents