Contents • Statistics • Statistical literacy

Statistical literacy by Debbie Becker. Contents Statistics Statistical literacy.
Dec 25, 2015
Welcome message from author
This document is posted to help you gain knowledge. Please leave a comment to let me know what you think about it! Share it to your friends and learn new things together.
Transcript
Contents
• Statistics• Statistical literacy
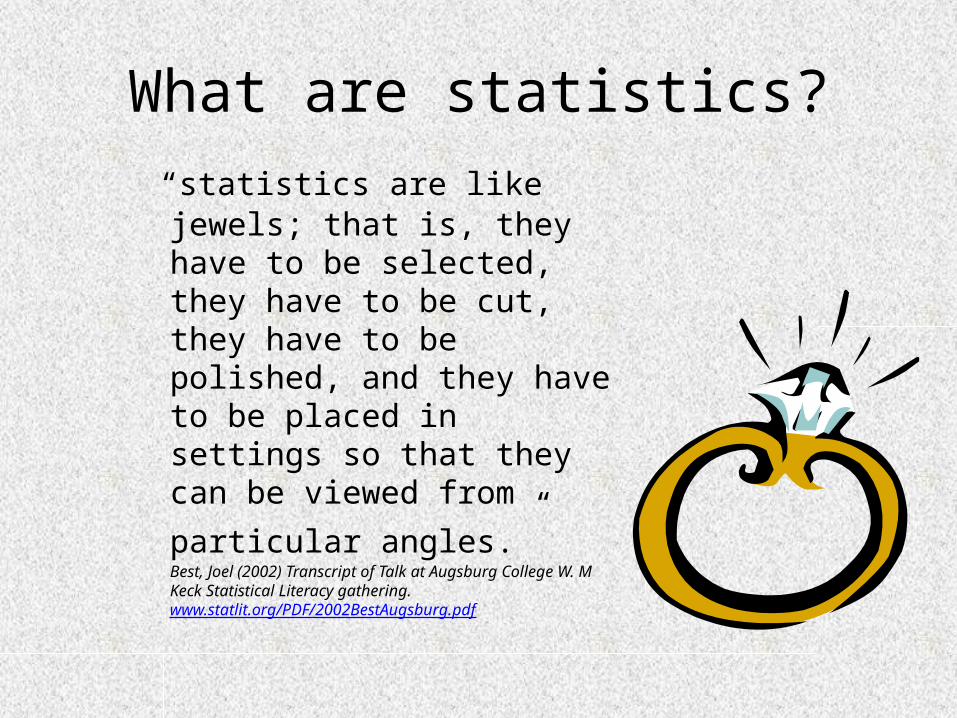
What are statistics? “statistics are like jewels; that is,
they have to be selected, they have to be cut, they have to be polished, and they have to be placed in settings so that they can be viewed from particular
angles.” Best, Joel (2002) Transcript of Talk at Augsburg College W. M Keck Statistical Literacy gathering.www.statlit.org/PDF/2002BestAugsburg.pdf

Video
http://www.youtube.com/watch?v=BE54mDs6St4&feature=related

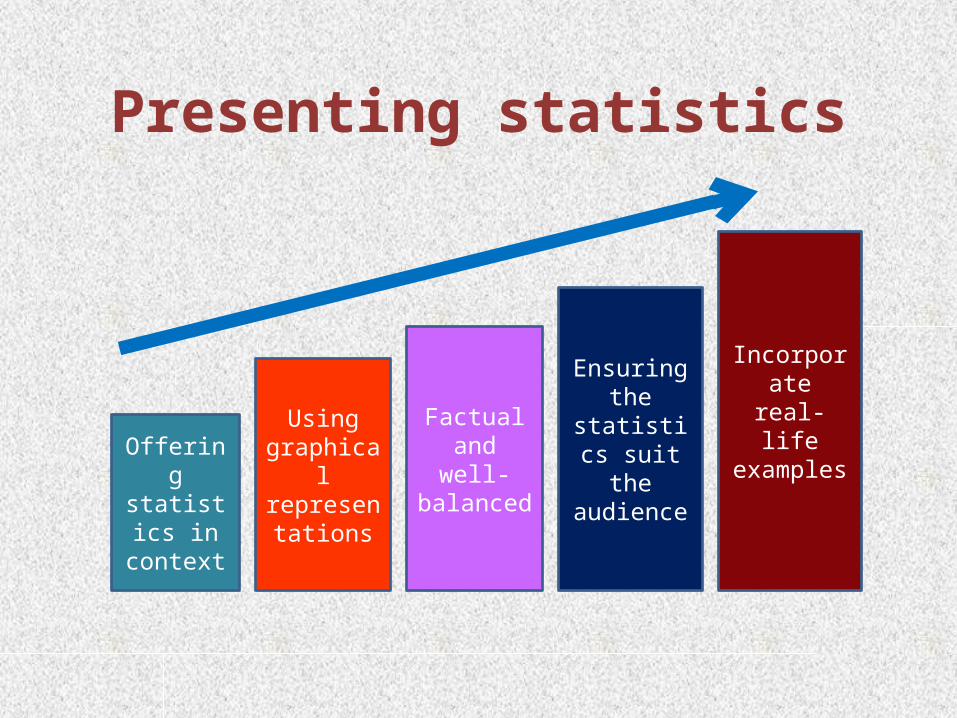
Presenting statistics
Offering statistics in context
Using graphical
representations
Ensuring the
statistics suit the
audience
Incorporate real-life
examplesFactual and well-balanced

Presenting statistics
Tables Graphs

Misuse of statisticsArticle Fact
• Asked to estimate the proportion of foreign-born people living in the UK, the average guess is 29.4%. The true figure according to OECD data is 10.8%, lower than Germany, Spain, the Netherlands, Canada and the USA.
http://splithorizons.blogspot.com/2011/07/tabloid-misinformation-makes-our.html

Statistical literacy
Statistical literacy is the ability to understand and use statistics to present clear and convincing
reasoning and informed decision-making
Statistical literacy
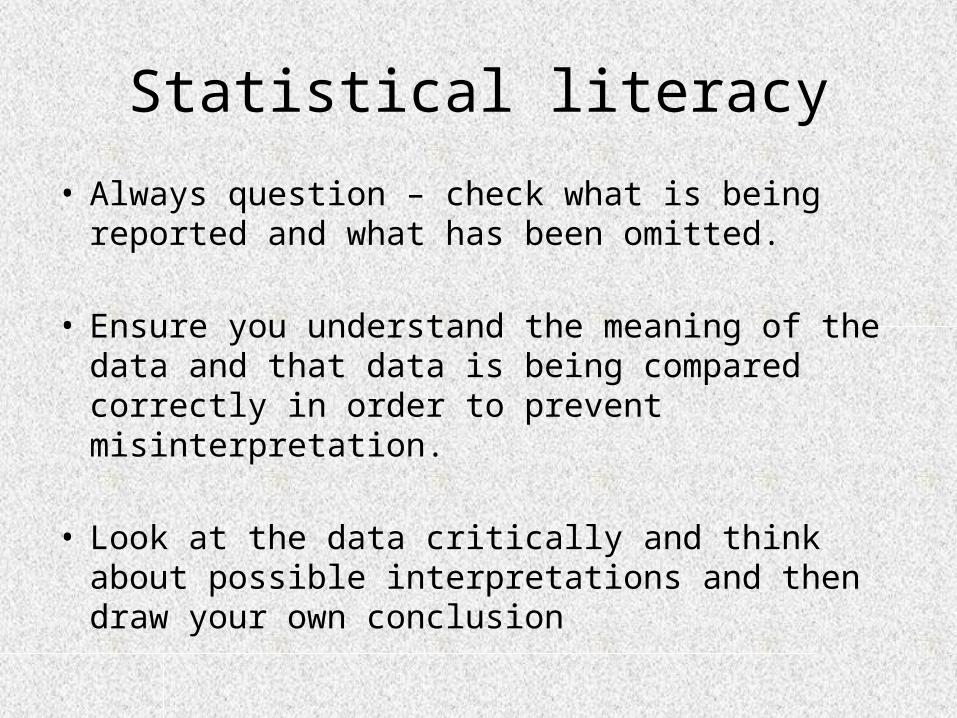
• Always question – check what is being reported and what has been omitted.
• Ensure you understand the meaning of the data and that data is being compared correctly in order to prevent misinterpretation.
• Look at the data critically and think about possible interpretations and then draw your own conclusion

Plains of Gheisra
Random – by chanceOmen – showing a pattern

Which of the following are random?
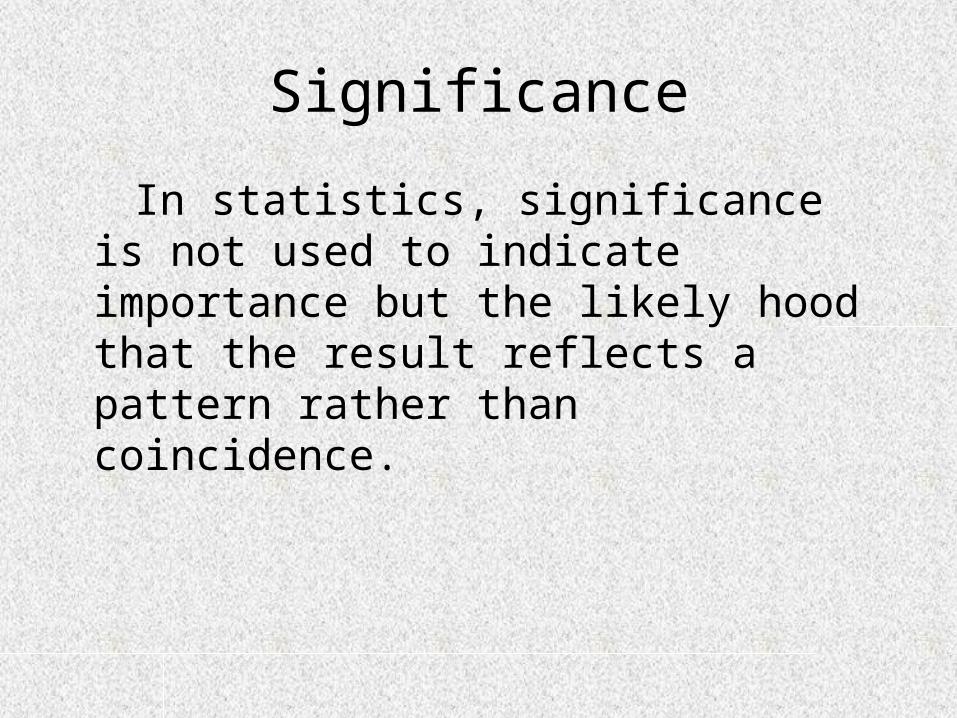
Significance
In statistics, significance is not used to indicate importance but the likely hood that the result reflects a pattern rather than coincidence.

Train 1 Train 2 Train 3 Train 4
9 hours 4 hours 6 hours 2 hours
11 hours 3 hours 8 hours 1 hour
10 hours 4 hours 7 hours 3 hours
8 hours 5 hours 7 hours 5 hours
12 hours 2 hours 6 hours 6 hours
1 2 3 4
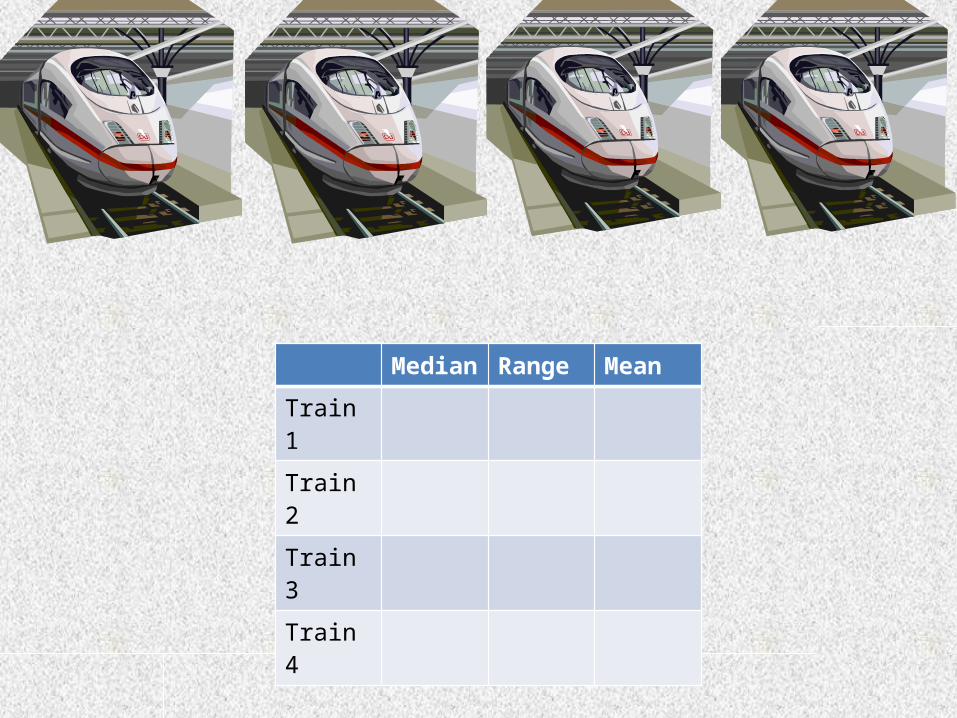
Median Range MeanTrain 1Train 2Train 3Train 4
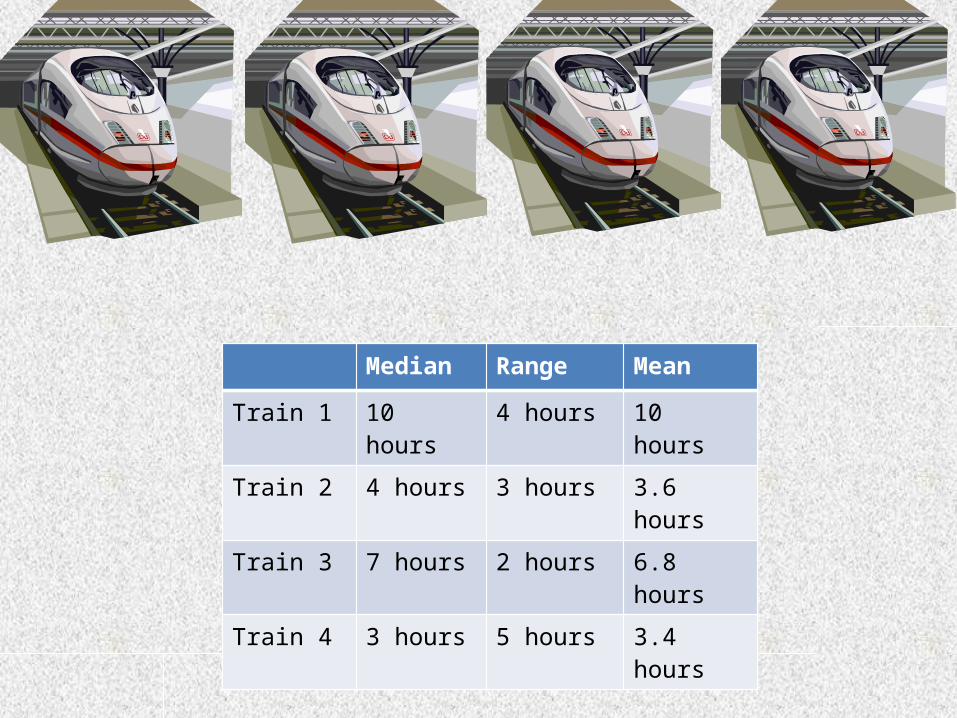
Median Range Mean
Train 1 10 hours 4 hours 10 hours
Train 2 4 hours 3 hours 3.6 hours
Train 3 7 hours 2 hours 6.8 hours
Train 4 3 hours 5 hours 3.4 hours

Clickers

Bias
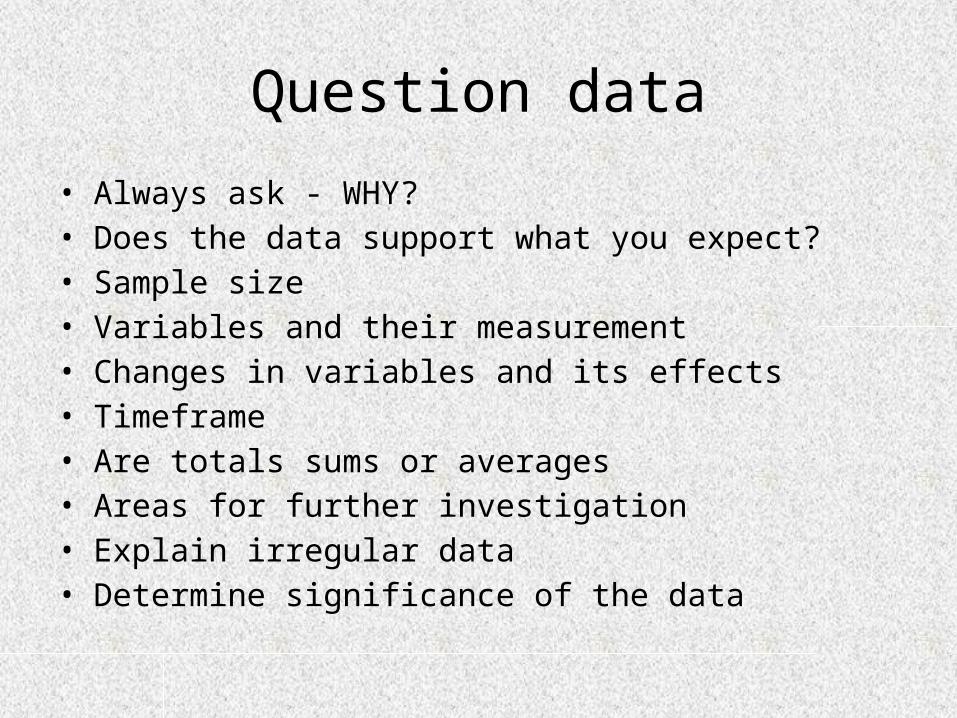
Question data
• Always ask - WHY?• Does the data support what you expect?• Sample size• Variables and their measurement• Changes in variables and its effects• Timeframe• Are totals sums or averages• Areas for further investigation• Explain irregular data• Determine significance of the data
Online training
http://library.cput.ac.za/stats_literacy/Welcome.html
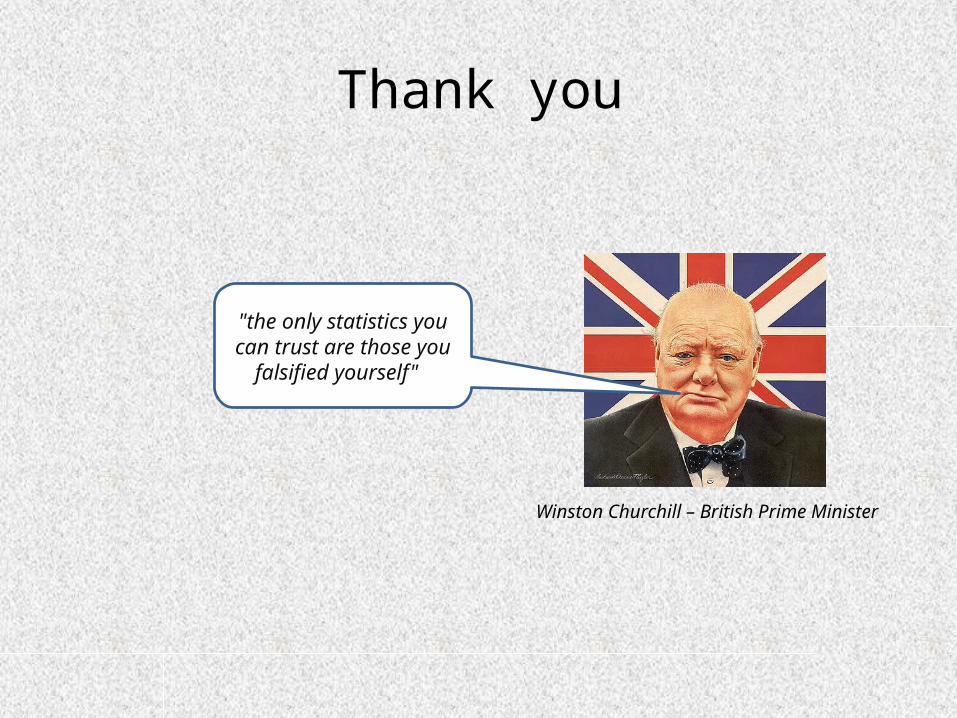
"the only statistics you can trust are those you
falsified yourself"
Thank you
Winston Churchill – British Prime Minister
Related Documents


