2009 StatLit Text Chapter Summaries 1 Statistical Literacy 2009 Chapter Summaries by Milo Schield www.StatLit.org/pdf/... 2009StatLitTextHandoutCh4.ppt 2009StatLitTextHandoutCh4.pdf Chapter 4: Overview

Welcome message from author
This document is posted to help you gain knowledge. Please leave a comment to let me know what you think about it! Share it to your friends and learn new things together.
Transcript
2009 StatLit Text Chapter Summaries 1
Statistical Literacy 2009Chapter Summaries
byMilo Schield
www.StatLit.org/pdf/...2009StatLitTextHandoutCh4.ppt2009StatLitTextHandoutCh4.pdf
Chapter 4: Overview
2
Ch 1. Review
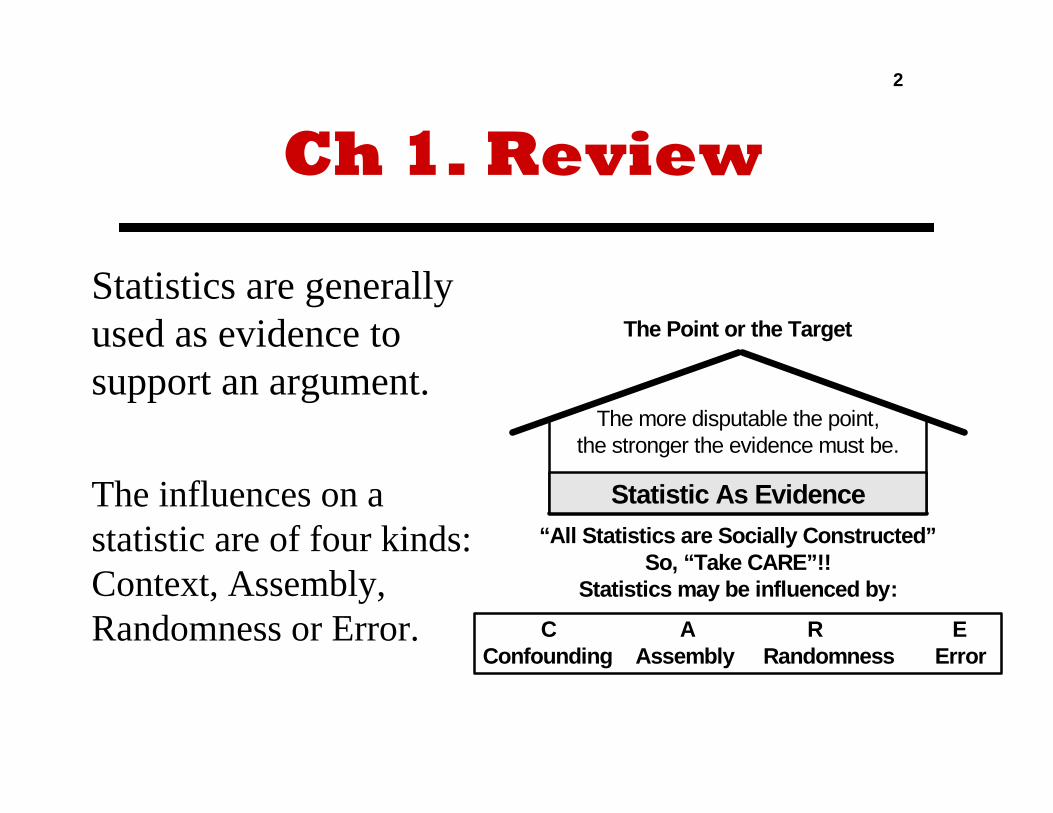
Statistics are generally used as evidence to support an argument.
The influences on a statistic are of four kinds: Context, Assembly, Randomness or Error.
The Point or the Target
The more disputable the point, the stronger the evidence must be.
“All Statistics are Socially Constructed”So, “Take CARE”!!
Statistics may be influenced by:
C A R EConfounding Assembly Randomness Error
Statistic As Evidence

3
Context and Ratios
Context: Related factors taken into account; theconfounders not taken into account.
An easy way to take into account a related factor is to form a ratio.
One of the most basic ratios is the part-whole ratio.
This ratio is typically expressed as a percentage.
The English grammar involved gets complex.
4
Percents: Two Kinds
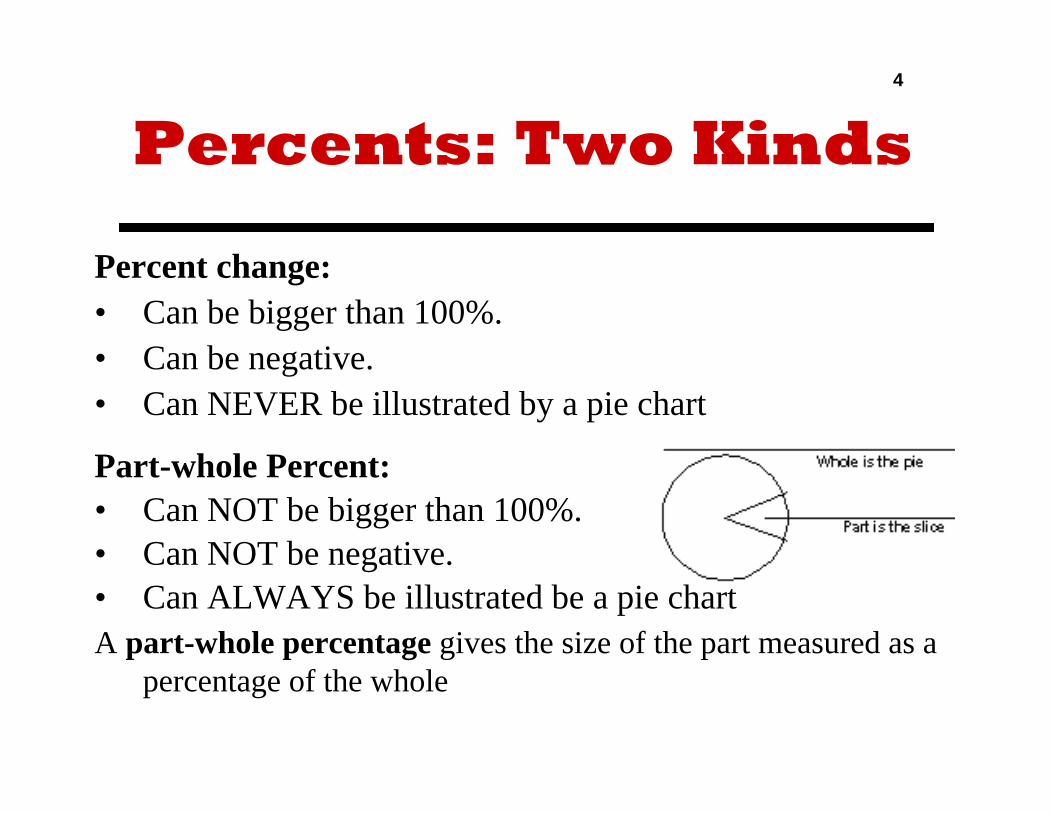
Percent change:• Can be bigger than 100%.• Can be negative.• Can NEVER be illustrated by a pie chart
Part-whole Percent:• Can NOT be bigger than 100%.• Can NOT be negative.• Can ALWAYS be illustrated be a pie chartA part-whole percentage gives the size of the part measured as a
percentage of the whole
5
Part-whole Grammars:Two Kinds
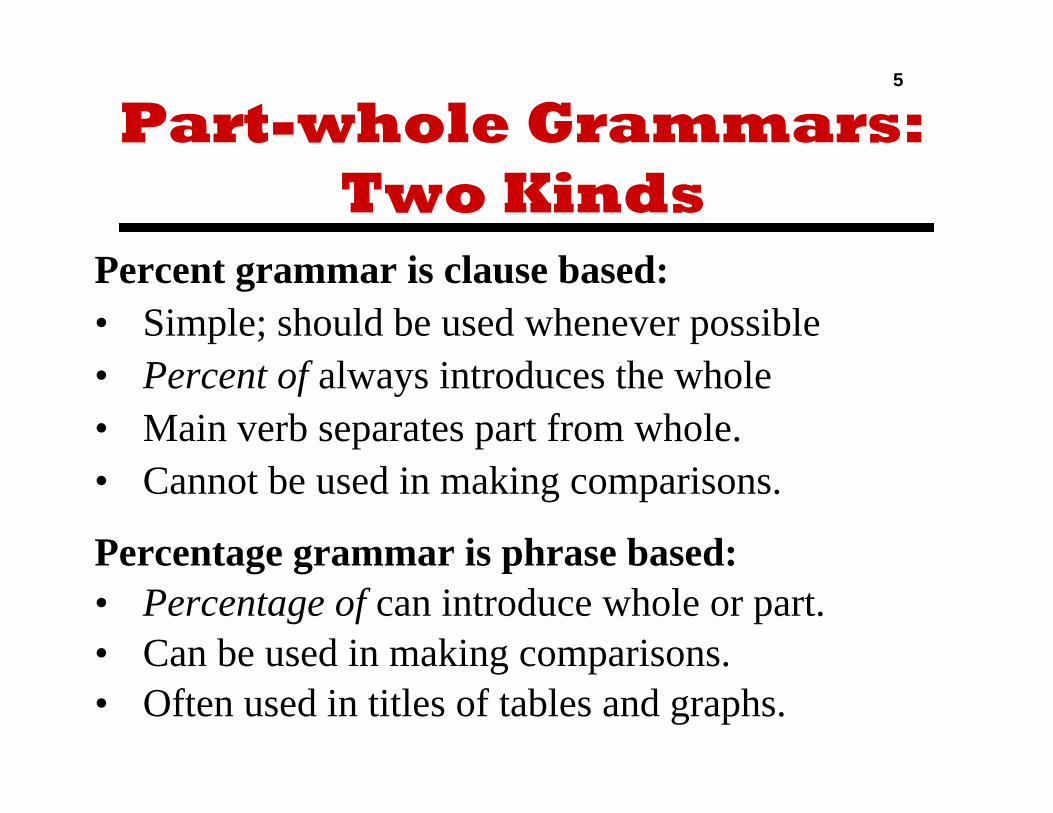
Percent grammar is clause based:• Simple; should be used whenever possible • Percent of always introduces the whole• Main verb separates part from whole.• Cannot be used in making comparisons.
Percentage grammar is phrase based:• Percentage of can introduce whole or part.• Can be used in making comparisons. • Often used in titles of tables and graphs.

6
(1) Percent Grammar:Statements
Four components:• Leading prepositional phrase. Whole or whole delimiter.• “Among” prepositional phrase: always whole.• % of _______: always whole• Verb or opposite side of verb from % of: always part.
Examples: Part is underlined• 20% of men are smokers.• Among men, 20% are smokers.• Smokers are 20% of men• 20% are smokers among men.
7
Determiners
Determiners are conditions that determine or delimit the size of the whole or part. Determiners might include date, place, race or sex. Here are two rules:
1. Leading prepositions such as in and for modify the entire statement and are components of the whole.
2. Modifiers take on the part-whole status of whatever they modify. Modifiers may be leading (adjectives) or trailing (relative clauses using who or what).
8
Percent Grammar:Examples
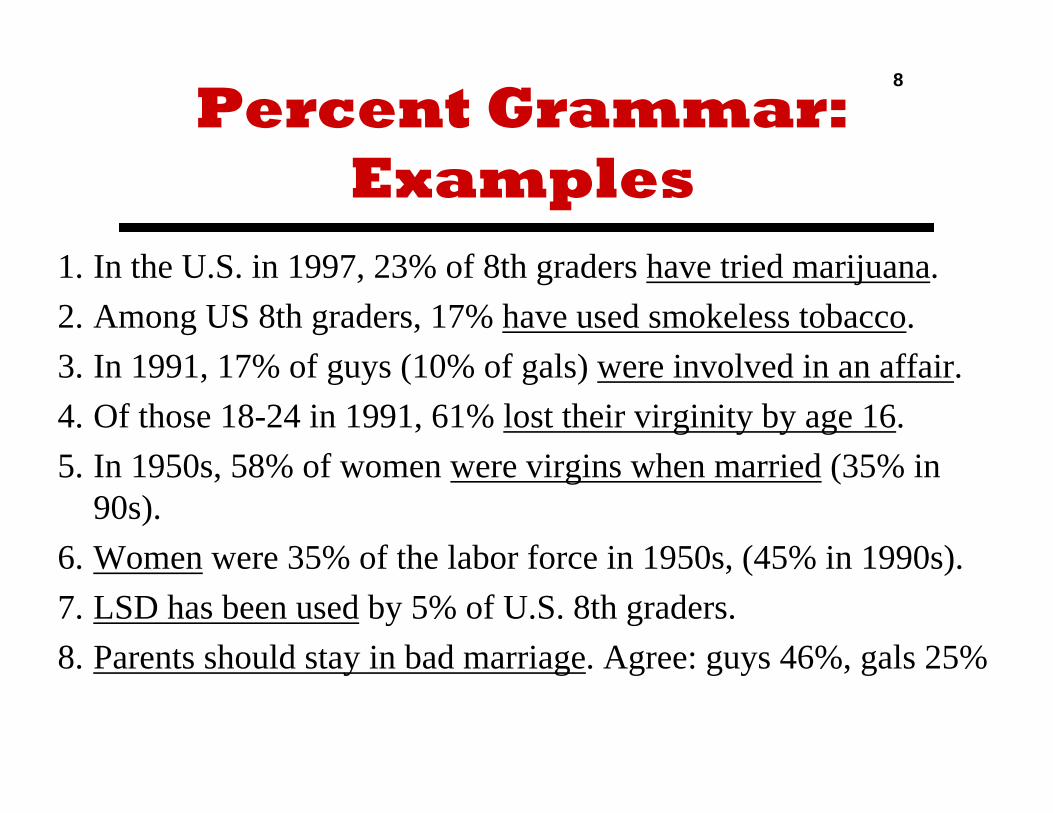
1. In the U.S. in 1997, 23% of 8th graders have tried marijuana.2. Among US 8th graders, 17% have used smokeless tobacco.3. In 1991, 17% of guys (10% of gals) were involved in an affair. 4. Of those 18-24 in 1991, 61% lost their virginity by age 16.5. In 1950s, 58% of women were virgins when married (35% in
90s).6. Women were 35% of the labor force in 1950s, (45% in 1990s).7. LSD has been used by 5% of U.S. 8th graders.8. Parents should stay in bad marriage. Agree: guys 46%, gals 25%

9
Forming Percents from Table of Counts
1. Decode the question; identify the whole and part.2. In the table, identify the appropriate whole (draw a circle).3. Identify the part of interest from within that whole.4. Calculate the percent: (part/whole) times 100%.
10
Describing a Percent in a 100% Table
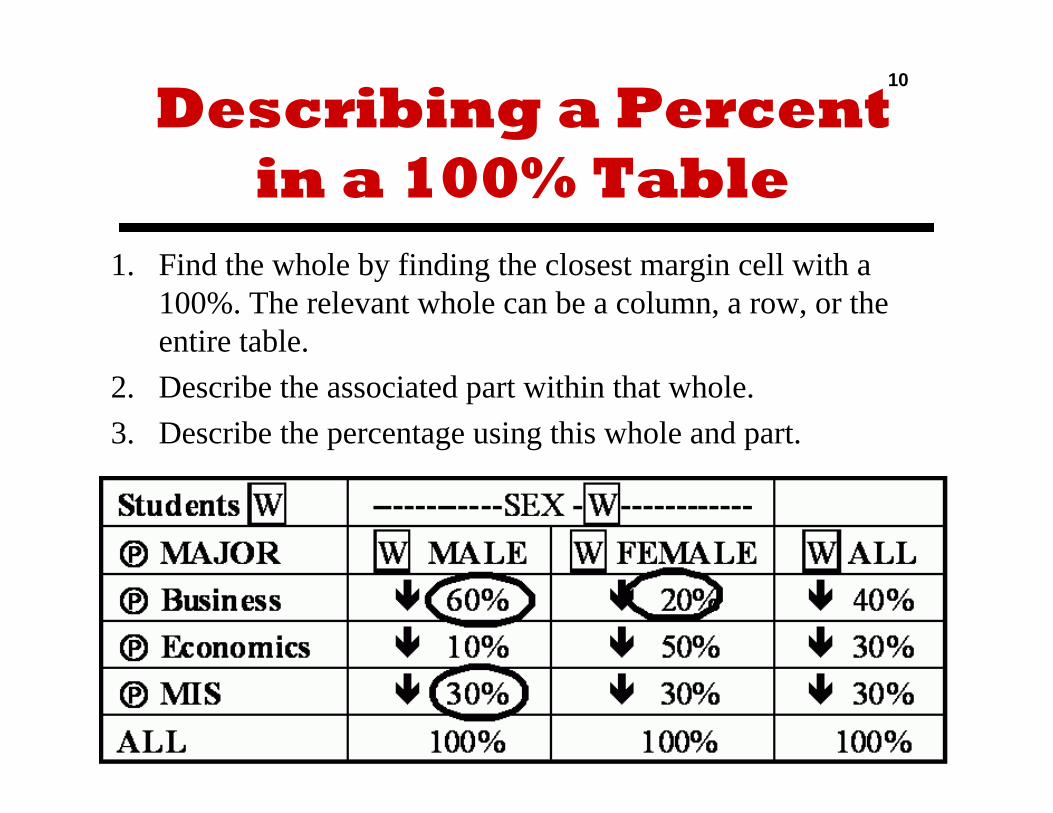
1. Find the whole by finding the closest margin cell with a 100%. The relevant whole can be a column, a row, or the entire table.
2. Describe the associated part within that whole.3. Describe the percentage using this whole and part.

11
Percents & Percentages
Percents and percentages are often confused.Percent should only be used when it follows a
number, as in 38%. Otherwise use percentage. Percent is a unit of measure (20%);
percentage is what is being measured. Percents are units like inches or volts;
percentages are properties like height or voltage.
12
(2) Percentage GrammarIntroduction
Percentage grammar involves keywords: percentage, fraction or proportion. The rules are the same.
Percentage grammar is commonly used in the titles for tables and graphs, and in comparisons of percentages.
Percentage grammar is different from percent grammar. • The word “percentage” never follows a number.
E.g., “The percentage” or “The highest percentage”. • The rules and clues for identifying part and whole in
percentage grammar are more complex.
13
Percentage GrammarRules
In sentences with percentage, the word of can introduce either a whole or a part.
If percentage is followed by a relative clause (who are, that are), the phrase is part and of introduces a whole.
E.g., The percentage of men who smoke is 20%.
If percentage is not followed by a relative clause, then percentage of introduces a part.
E.g., the percentage of smokers is 20% among men.
14
Percentage Grammar:Statements
1. Among U.S. college freshman in 2006, the percentage who thought abortion should be legalized was 57%.
2. In 2005, the percentage of U.S. male college students who were employed part time was 23%.
3. In 2005 among U.S. college students who are black, the percentage who were employed full time was 19%.
4. In 2005 among U.S. college students who attended a two-year college, the percentage of blacks was 16 %.
5. In 2006, the percentage of U.S. college students who arewhites who attended four year colleges was 44%.

15
Percentage Questions
There are two kinds of percentage questions:Percentage grammar:• What is the percentage of <whole> who are <part>?
Percent grammar: What percentage …• of <whole> are <part>?• of <whole> who are <whole> are <part>?
Bad form: What percent of <whole> are <part>?

16
Percent to Percentage Grammar
Converting from percent to percentage grammar is hard if there is a relative clause following “% of.”
Compare “10% of students who are blacks play sports”with “The percentage of students who are blacks who play sports is 10%.” This conversion is wrong. It makes blacks part when blacks was originally whole.
One way to avoid this problem is to convert the trailing relative clause to a leading adjective (black students) which gives “the percentage of black students who play sports is 10%.”
17
Sports Grammar
Sports grammar is common:• percentage of completed passes, passes completed,
subscriber renewals, loans denied, defective cans; tire failures, student dropouts, or overturned verdicts.
In each of these cases, there is a natural whole.
Without a natural whole, sports grammar is ambiguous. • percentage of female smokers; working males, infant
deaths, or single mothers. Moral: Avoid sports grammar in your writing.

18
Half Tables
Half tables are common:• Plus: save space, focus on essentials.• Minus: harder to read.
19
Margin Value Rules
Margin values are Total values at the edge of a table.
Margin values are always sums or averages.• Sums if bigger than biggest value.• Averages if smaller than the biggest value.
Margin Value Rules: If margin value of a group, …• is average then group is part and members are wholes.• is a sum, then group is whole and members are parts.
20
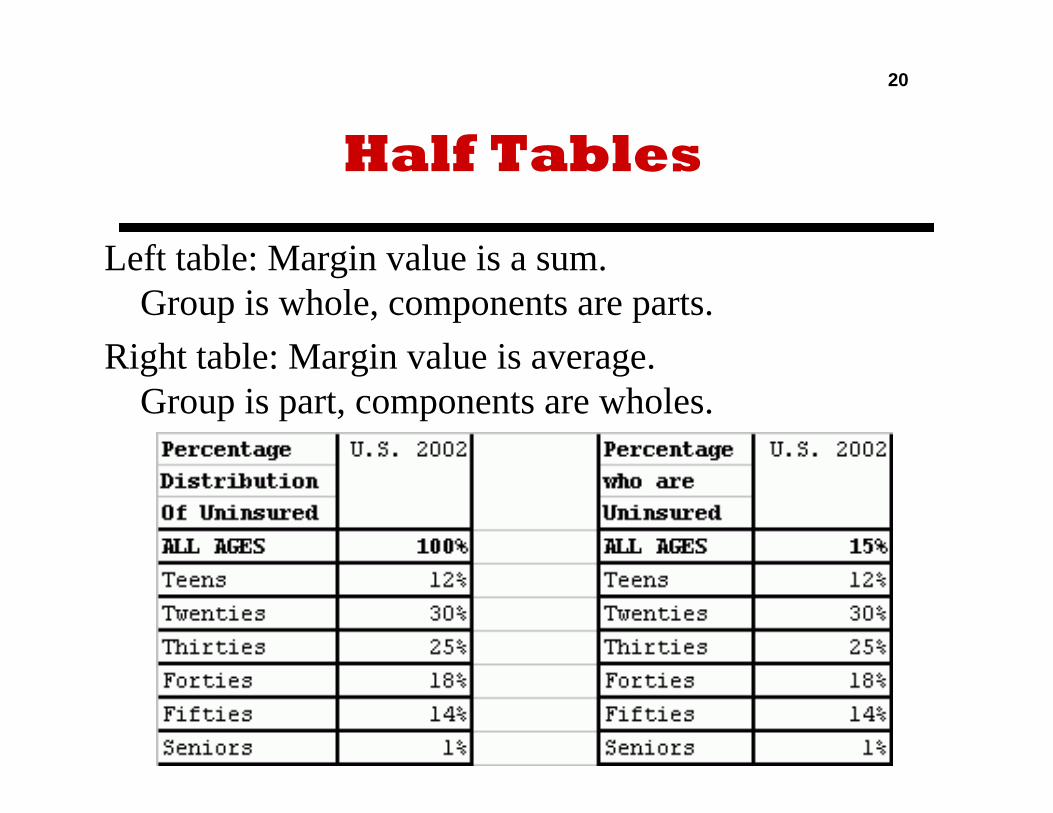
Half Tables
Left table: Margin value is a sum. Group is whole, components are parts.
Right table: Margin value is average. Group is part, components are wholes.
21
Summary
Context involves what is (not) taken into account.
What is taken into account can influence• Counts or totals (by forming ratios)• Averages (by selection or standardizing)
Part-whole ratios are one of the most common ways of taking into account a related factor. In this case, the size of the group. Part-whole ratios standardize groups of different sizes.
Related Documents